Embed Size (px)
Citation preview
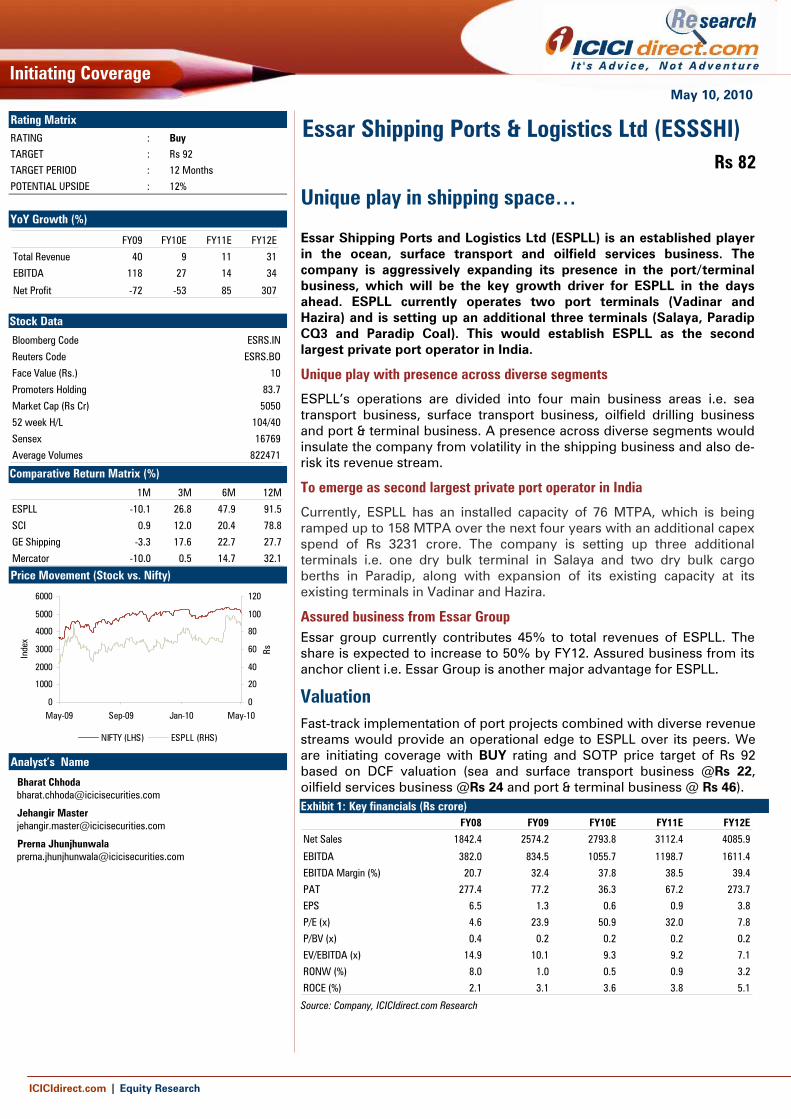
May 10, 2010
ICICIdirect.com | Equity Research
Initiating Coverage
Unique play in shipping space… Essar Shipping Ports and Logistics Ltd (ESPLL) is an established player in the ocean, surface transport and oilfield services business. The company is aggressively expanding its presence in the port/terminal business, which will be the key growth driver for ESPLL in the days ahead. ESPLL currently operates two port terminals (Vadinar and Hazira) and is setting up an additional three terminals (Salaya, Paradip CQ3 and Paradip Coal). This would establish ESPLL as the second largest private port operator in India.
Unique play with presence across diverse segments
ESPLL’s operations are divided into four main business areas i.e. sea transport business, surface transport business, oilfield drilling business and port & terminal business. A presence across diverse segments would insulate the company from volatility in the shipping business and also de-risk its revenue stream.
To emerge as second largest private port operator in India
Currently, ESPLL has an installed capacity of 76 MTPA, which is being ramped up to 158 MTPA over the next four years with an additional capex spend of Rs 3231 crore. The company is setting up three additional terminals i.e. one dry bulk terminal in Salaya and two dry bulk cargo berths in Paradip, along with expansion of its existing capacity at its existing terminals in Vadinar and Hazira.
Assured business from Essar Group Essar group currently contributes 45% to total revenues of ESPLL. The share is expected to increase to 50% by FY12. Assured business from its anchor client i.e. Essar Group is another major advantage for ESPLL.
Valuation Fast-track implementation of port projects combined with diverse revenue streams would provide an operational edge to ESPLL over its peers. We are initiating coverage with BUY rating and SOTP price target of Rs 92 based on DCF valuation (sea and surface transport business @Rs 22, oilfield services business @Rs 24 and port & terminal business @ Rs 46). Exhibit 1: Key financials (Rs crore)
FY08 FY09 FY10E FY11E FY12E
Net Sales 1842.4 2574.2 2793.8 3112.4 4085.9
EBITDA 382.0 834.5 1055.7 1198.7 1611.4
EBITDA Margin (%) 20.7 32.4 37.8 38.5 39.4
PAT 277.4 77.2 36.3 67.2 273.7
EPS 6.5 1.3 0.6 0.9 3.8
P/E (x) 4.6 23.9 50.9 32.0 7.8
P/BV (x) 0.4 0.2 0.2 0.2 0.2
EV/EBITDA (x) 14.9 10.1 9.3 9.2 7.1
RONW (%) 8.0 1.0 0.5 0.9 3.2
ROCE (%) 2.1 3.1 3.6 3.8 5.1 Source: Company, ICICIdirect.com Research
Essar Shipping Ports & Logistics Ltd (ESSSHI) Rs 82
Rating Matrix RATING : Buy
TARGET : Rs 92
TARGET PERIOD : 12 Months
POTENTIAL UPSIDE : 12%
YoY Growth (%)
FY09 FY10E FY11E FY12E
Total Revenue 40 9 11 31
EBITDA 118 27 14 34
Net Profit -72 -53 85 307
Stock Data
Bloomberg Code ESRS.IN
Reuters Code ESRS.BO
Face Value (Rs.) 10
Promoters Holding 83.7
Market Cap (Rs Cr) 5050
52 week H/L 104/40
Sensex 16769
Average Volumes 822471
Comparative Return Matrix (%)
1M 3M 6M 12M
ESPLL -10.1 26.8 47.9 91.5
SCI 0.9 12.0 20.4 78.8
GE Shipping -3.3 17.6 22.7 27.7
Mercator -10.0 0.5 14.7 32.1 Price Movement (Stock vs. Nifty)
0
1000
2000
3000
4000
5000
6000
May-09 Sep-09 Jan-10 May-10
Inde
x
0
20
40
60
80
100
120
Rs
NIFTY (LHS) ESPLL (RHS)
Analyst’s Name
Bharat Chhoda [email protected]
Jehangir Master [email protected]
Prerna Jhunjhunwala [email protected]
Essar Shipping (ESSSHI)
ICICIdirect.com | Equity Research Page 2
Company Background
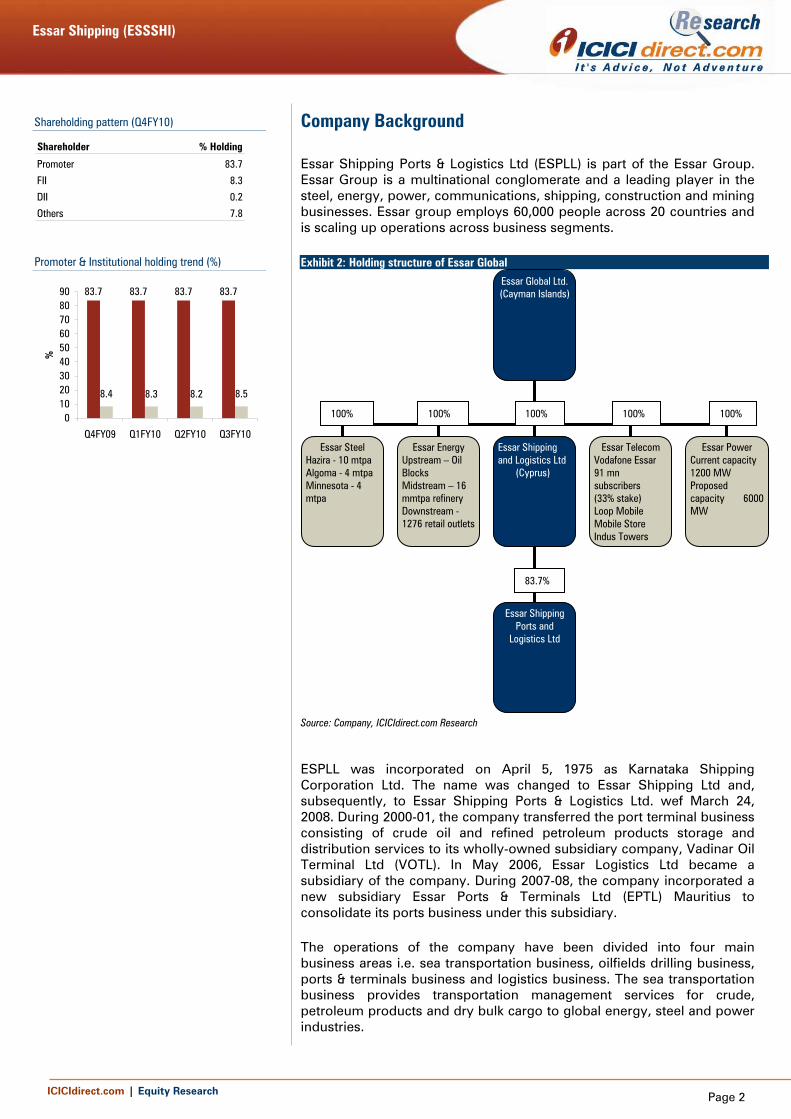
Essar Shipping Ports & Logistics Ltd (ESPLL) is part of the Essar Group. Essar Group is a multinational conglomerate and a leading player in the steel, energy, power, communications, shipping, construction and mining businesses. Essar group employs 60,000 people across 20 countries and is scaling up operations across business segments.
Exhibit 2: Holding structure of Essar Global
Source: Company, ICICIdirect.com Research
ESPLL was incorporated on April 5, 1975 as Karnataka Shipping Corporation Ltd. The name was changed to Essar Shipping Ltd and, subsequently, to Essar Shipping Ports & Logistics Ltd. wef March 24, 2008. During 2000-01, the company transferred the port terminal business consisting of crude oil and refined petroleum products storage and distribution services to its wholly-owned subsidiary company, Vadinar Oil Terminal Ltd (VOTL). In May 2006, Essar Logistics Ltd became a subsidiary of the company. During 2007-08, the company incorporated a new subsidiary Essar Ports & Terminals Ltd (EPTL) Mauritius to consolidate its ports business under this subsidiary.
The operations of the company have been divided into four main business areas i.e. sea transportation business, oilfields drilling business, ports & terminals business and logistics business. The sea transportation business provides transportation management services for crude, petroleum products and dry bulk cargo to global energy, steel and power industries.
Essar Global Ltd. (Cayman Islands)
Essar Steel Hazira - 10 mtpa Algoma - 4 mtpa Minnesota - 4 mtpa
Essar Shipping and Logistics Ltd (Cyprus)
Essar Telecom Vodafone Essar 91 mn subscribers (33% stake) Loop Mobile Mobile Store Indus Towers
Essar Power Current capacity 1200 MW Proposed capacity 6000MW
Essar Shipping Ports and
Logistics Ltd
Essar Energy Upstream – Oil Blocks Midstream – 16 mmtpa refinery Downstream - 1276 retail outlets
83.7%
100% 100% 100% 100% 100%
Shareholding pattern (Q4FY10)
Shareholder % Holding
Promoter 83.7
FII 8.3
DII 0.2
Others 7.8
Promoter & Institutional holding trend (%)
83.7 83.7 83.7 83.7
8.4 8.3 8.2 8.5
0102030405060708090
Q4FY09 Q1FY10 Q2FY10 Q3FY10
%
Essar Shipping (ESSSHI)
ICICIdirect.com | Equity Research Page 3
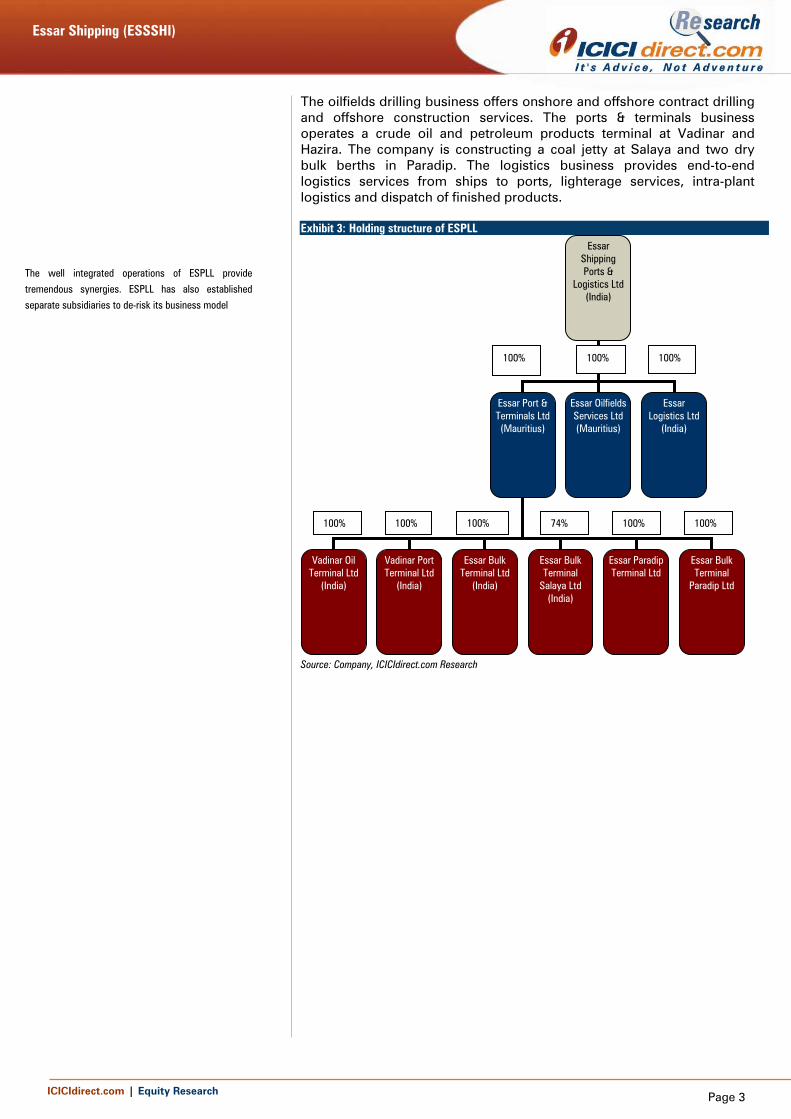
The oilfields drilling business offers onshore and offshore contract drilling and offshore construction services. The ports & terminals business operates a crude oil and petroleum products terminal at Vadinar and Hazira. The company is constructing a coal jetty at Salaya and two dry bulk berths in Paradip. The logistics business provides end-to-end logistics services from ships to ports, lighterage services, intra-plant logistics and dispatch of finished products. Exhibit 3: Holding structure of ESPLL
Source: Company, ICICIdirect.com Research
The well integrated operations of ESPLL provide
tremendous synergies. ESPLL has also established
separate subsidiaries to de-risk its business model
Essar Shipping Ports &
Logistics Ltd (India)
Essar Port & Terminals Ltd (Mauritius)
Essar OilfieldsServices Ltd (Mauritius)
Essar Logistics Ltd
(India)
Vadinar Oil Terminal Ltd
(India)
Vadinar Port Terminal Ltd
(India)
Essar Bulk Terminal Ltd
(India)
100%
100%
100%
100%
100% 100% 74% 100% 100%
Essar Bulk Terminal
Salaya Ltd (India)
Essar Paradip Terminal Ltd
Essar Bulk Terminal
Paradip Ltd
Essar Shipping (ESSSHI)
ICICIdirect.com | Equity Research Page 4
Investment Rationale Essar Shipping Ports and Logistics Ltd (ESPLL) is an established ocean and surface transport company in India with a long and successful operating history. The ocean and surface transport business of the company consists of two VLCC carriers and 18 dry bulk carriers. It has also placed orders for 12 new dry bulk carriers that would be delivered over the next two years. ESPLL has also increased its focus towards the oilfield services business and placed orders for two 350 feet jack-up rigs that would also be delivered by FY12. This will be in addition to its existing fleet of one semisub rig and 12 onshore rigs. The other major focus area for the company is its port/terminal business that would be the real game changer for the company. ESPLL currently operates two port terminals (Vadinar and Hazira) and is setting up an additional three terminals (Salaya, Paradip CQ3 and Paradip Coal). This would establish ESPLL as the second largest private port operator in India after Mundra Port. ESPLL also has an added advantage in terms of assured business from Essar group companies, thereby insulating the company from volatility in shipping freight rates.
Unique play in shipping space with presence across segments
ESPLL’s operations are divided into four business segments i.e. sea transportation, oilfields drilling, surface transport and ports & terminals. ESPLL is the only Indian shipping company with such a wide scope of operations that also provides the company an edge over its competitors in terms of operating synergies. Due to its presence in the entire value chain it has the capability to offer complete logistics solution to its clients in the power, steel, oil and gas and other related industries.
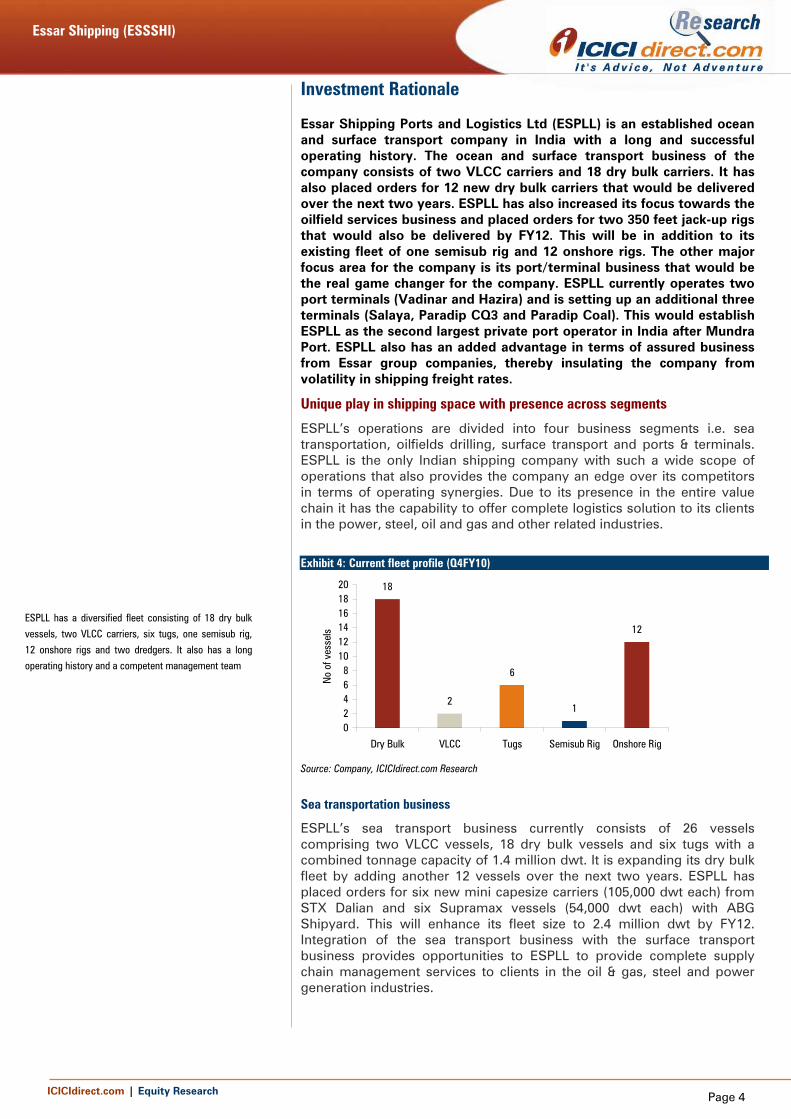
Exhibit 4: Current fleet profile (Q4FY10)
18
2
6
1
12
02468
101214161820
Dry Bulk VLCC Tugs Semisub Rig Onshore Rig
No
of v
esse
ls
Source: Company, ICICIdirect.com Research
Sea transportation business
ESPLL’s sea transport business currently consists of 26 vessels comprising two VLCC vessels, 18 dry bulk vessels and six tugs with a combined tonnage capacity of 1.4 million dwt. It is expanding its dry bulk fleet by adding another 12 vessels over the next two years. ESPLL has placed orders for six new mini capesize carriers (105,000 dwt each) from STX Dalian and six Supramax vessels (54,000 dwt each) with ABG Shipyard. This will enhance its fleet size to 2.4 million dwt by FY12. Integration of the sea transport business with the surface transport business provides opportunities to ESPLL to provide complete supply chain management services to clients in the oil & gas, steel and power generation industries.
ESPLL has a diversified fleet consisting of 18 dry bulk
vessels, two VLCC carriers, six tugs, one semisub rig,
12 onshore rigs and two dredgers. It also has a long
operating history and a competent management team
Essar Shipping (ESSSHI)
ICICIdirect.com | Equity Research Page 5
Oilfield services business
The oilfields business offers onshore and offshore contract drilling and offshore construction services. Its fleet consists of 12 onshore rigs and one super-specialty semi-submersible rig. The company has placed orders for two new 350 feet jack-up rigs with ABG Shipyard that will be delivered over the next one and a half years.
Surface transport business
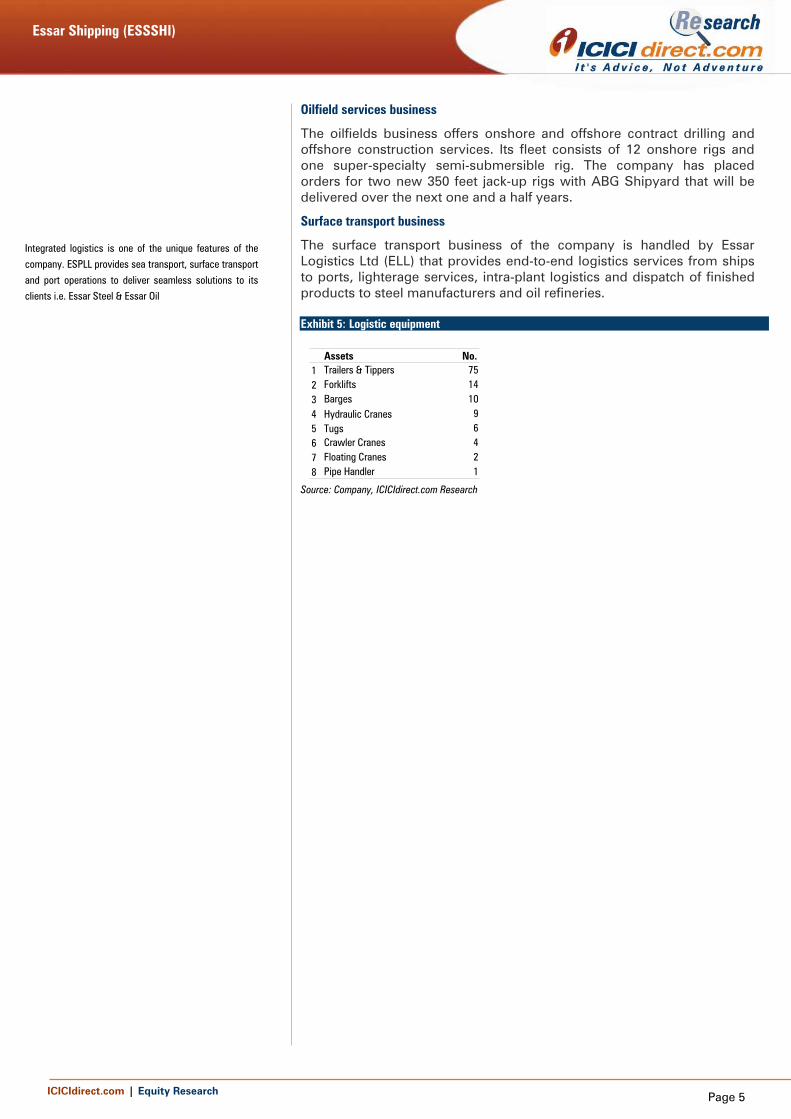
The surface transport business of the company is handled by Essar Logistics Ltd (ELL) that provides end-to-end logistics services from ships to ports, lighterage services, intra-plant logistics and dispatch of finished products to steel manufacturers and oil refineries. Exhibit 5: Logistic equipment
Assets No.1 Trailers & Tippers 752 Forklifts 143 Barges 104 Hydraulic Cranes 95 Tugs 66 Crawler Cranes 47 Floating Cranes 28 Pipe Handler 1
Source: Company, ICICIdirect.com Research
Integrated logistics is one of the unique features of the
company. ESPLL provides sea transport, surface transport
and port operations to deliver seamless solutions to its clients i.e. Essar Steel & Essar Oil
Essar Shipping (ESSSHI)
ICICIdirect.com | Equity Research Page 6
To emerge as second largest private port operator in India
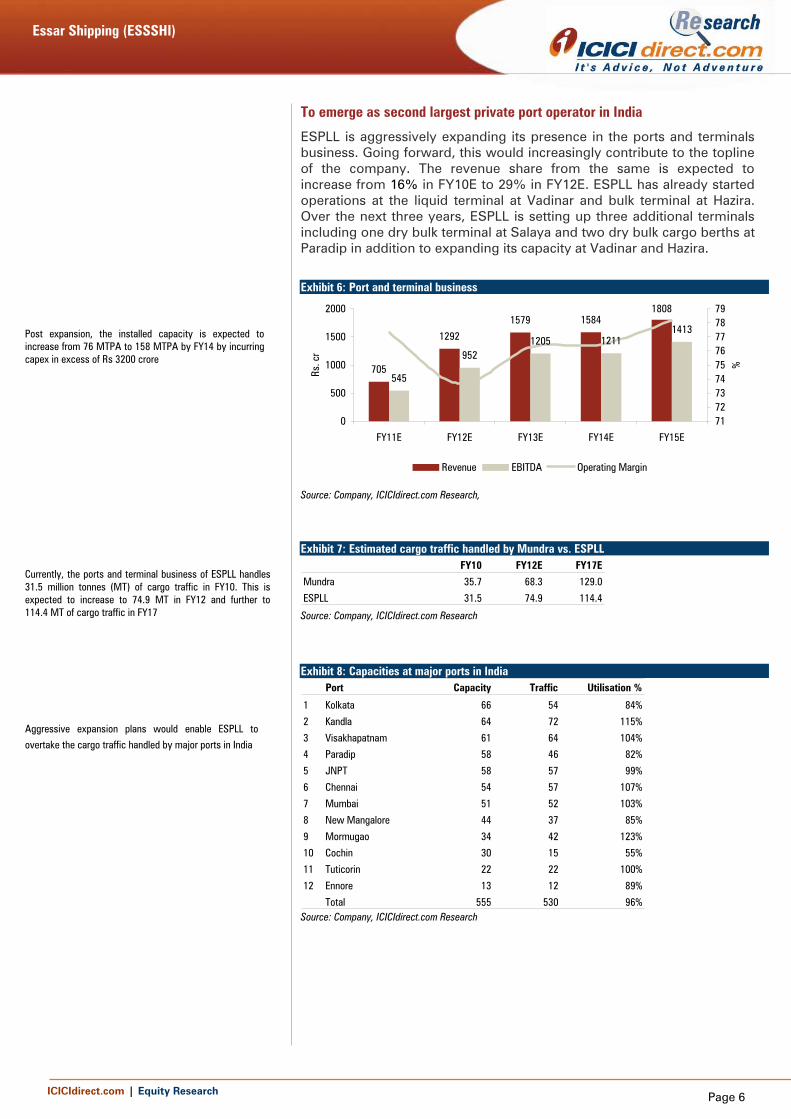
ESPLL is aggressively expanding its presence in the ports and terminals business. Going forward, this would increasingly contribute to the topline of the company. The revenue share from the same is expected to increase from 16% in FY10E to 29% in FY12E. ESPLL has already started operations at the liquid terminal at Vadinar and bulk terminal at Hazira. Over the next three years, ESPLL is setting up three additional terminals including one dry bulk terminal at Salaya and two dry bulk cargo berths at Paradip in addition to expanding its capacity at Vadinar and Hazira.
Exhibit 6: Port and terminal business
705
1292
1579 15841808
545
9521205 1211
1413
0
500
1000
1500
2000
FY11E FY12E FY13E FY14E FY15E
Rs. c
r
717273747576777879
%
Revenue EBITDA Operating Margin
Source: Company, ICICIdirect.com Research,
Exhibit 7: Estimated cargo traffic handled by Mundra vs. ESPLL FY10 FY12E FY17E
Mundra 35.7 68.3 129.0
ESPLL 31.5 74.9 114.4 Source: Company, ICICIdirect.com Research
Exhibit 8: Capacities at major ports in India
Port Capacity Traffic Utilisation %
1 Kolkata 66 54 84%
2 Kandla 64 72 115%
3 Visakhapatnam 61 64 104%
4 Paradip 58 46 82%
5 JNPT 58 57 99%
6 Chennai 54 57 107%
7 Mumbai 51 52 103%
8 New Mangalore 44 37 85%
9 Mormugao 34 42 123%
10 Cochin 30 15 55%
11 Tuticorin 22 22 100%
12 Ennore 13 12 89%
Total 555 530 96% Source: Company, ICICIdirect.com Research
Post expansion, the installed capacity is expected to increase from 76 MTPA to 158 MTPA by FY14 by incurring capex in excess of Rs 3200 crore
Currently, the ports and terminal business of ESPLL handles 31.5 million tonnes (MT) of cargo traffic in FY10. This is expected to increase to 74.9 MT in FY12 and further to 114.4 MT of cargo traffic in FY17
Aggressive expansion plans would enable ESPLL to
overtake the cargo traffic handled by major ports in India
Essar Shipping (ESSSHI)
ICICIdirect.com | Equity Research Page 7
Vadinar terminal
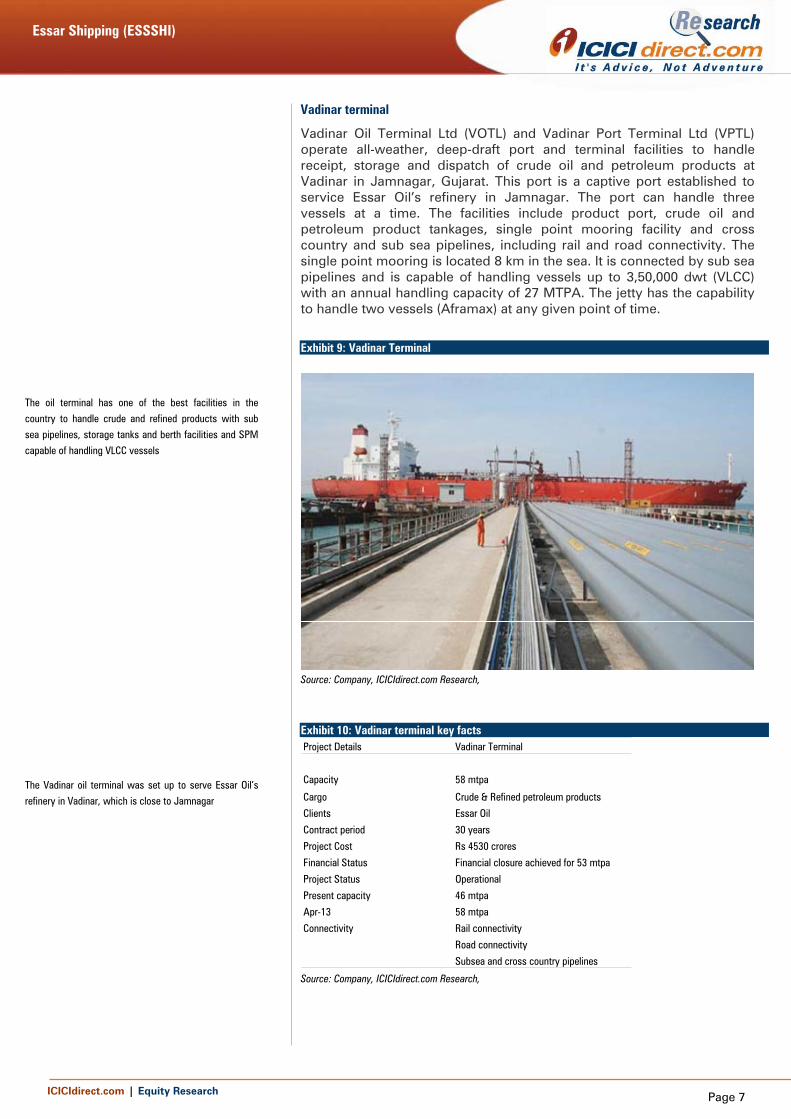
Vadinar Oil Terminal Ltd (VOTL) and Vadinar Port Terminal Ltd (VPTL) operate all-weather, deep-draft port and terminal facilities to handle receipt, storage and dispatch of crude oil and petroleum products at Vadinar in Jamnagar, Gujarat. This port is a captive port established to service Essar Oil’s refinery in Jamnagar. The port can handle three vessels at a time. The facilities include product port, crude oil and petroleum product tankages, single point mooring facility and cross country and sub sea pipelines, including rail and road connectivity. The single point mooring is located 8 km in the sea. It is connected by sub sea pipelines and is capable of handling vessels up to 3,50,000 dwt (VLCC) with an annual handling capacity of 27 MTPA. The jetty has the capability to handle two vessels (Aframax) at any given point of time.
Exhibit 9: Vadinar Terminal
Source: Company, ICICIdirect.com Research,
Exhibit 10: Vadinar terminal key facts Project Details Vadinar Terminal
Capacity 58 mtpa
Cargo Crude & Refined petroleum products
Clients Essar Oil
Contract period 30 years
Project Cost Rs 4530 crores
Financial Status Financial closure achieved for 53 mtpa
Project Status Operational
Present capacity 46 mtpa
Apr-13 58 mtpa
Connectivity Rail connectivity
Road connectivity
Subsea and cross country pipelines Source: Company, ICICIdirect.com Research,
The oil terminal has one of the best facilities in the
country to handle crude and refined products with sub
sea pipelines, storage tanks and berth facilities and SPM
capable of handling VLCC vessels
The Vadinar oil terminal was set up to serve Essar Oil’s
refinery in Vadinar, which is close to Jamnagar
Essar Shipping (ESSSHI)
ICICIdirect.com | Equity Research Page 8
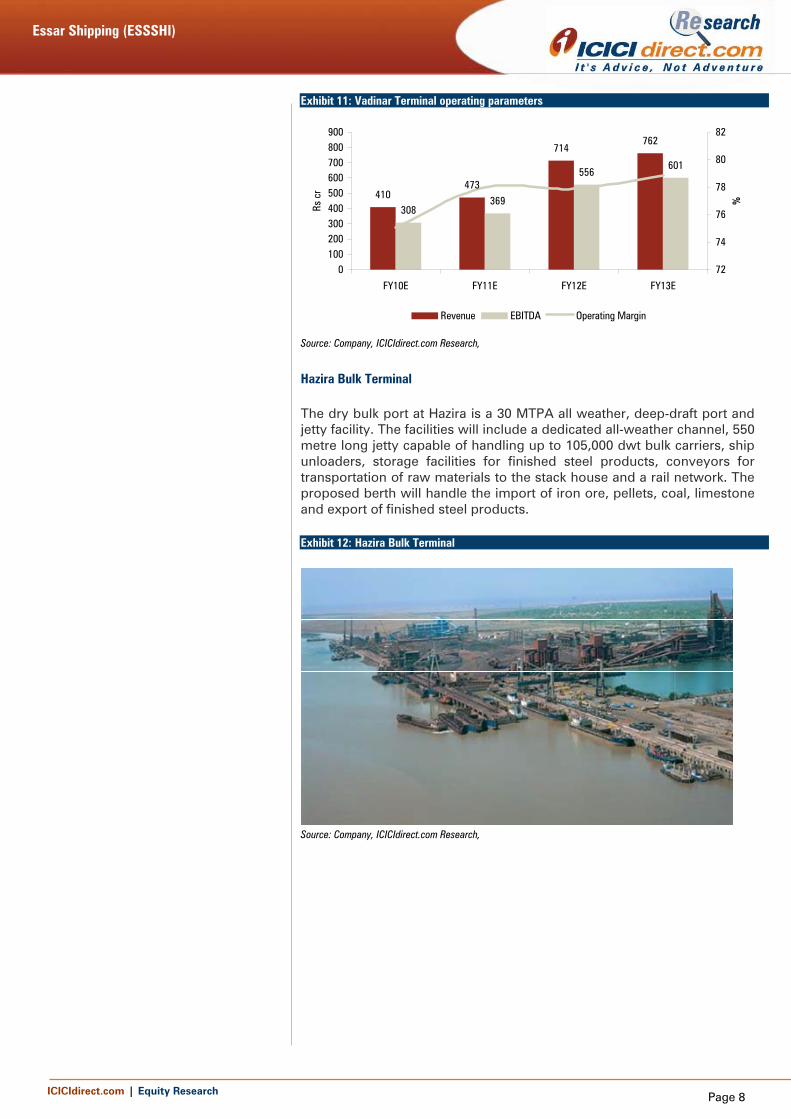
Exhibit 11: Vadinar Terminal operating parameters
410473
714762
308369
556601
0100200300400500600700800900
FY10E FY11E FY12E FY13E
Rs c
r
72
74
76
78
80
82
%
Revenue EBITDA Operating Margin
Source: Company, ICICIdirect.com Research,
Hazira Bulk Terminal
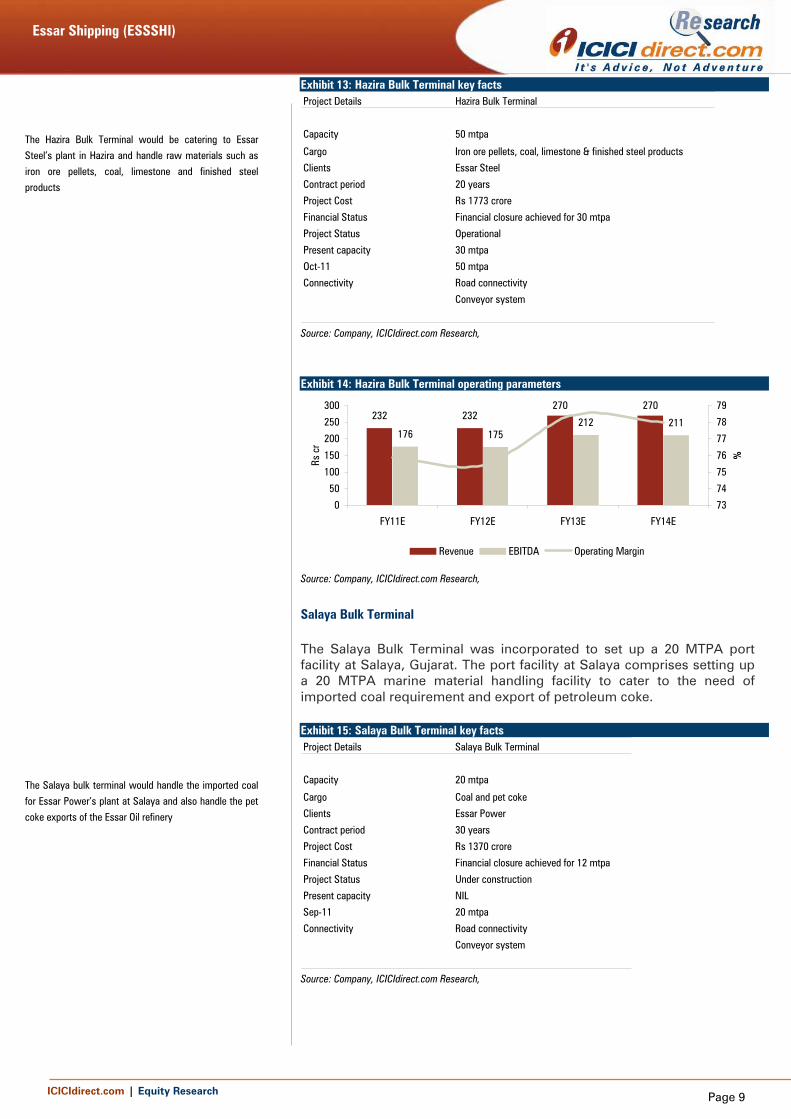
The dry bulk port at Hazira is a 30 MTPA all weather, deep-draft port and jetty facility. The facilities will include a dedicated all-weather channel, 550 metre long jetty capable of handling up to 105,000 dwt bulk carriers, ship unloaders, storage facilities for finished steel products, conveyors for transportation of raw materials to the stack house and a rail network. The proposed berth will handle the import of iron ore, pellets, coal, limestone and export of finished steel products.
Exhibit 12: Hazira Bulk Terminal
Source: Company, ICICIdirect.com Research,
Essar Shipping (ESSSHI)
ICICIdirect.com | Equity Research Page 9
Exhibit 13: Hazira Bulk Terminal key facts Project Details Hazira Bulk Terminal
Capacity 50 mtpa
Cargo Iron ore pellets, coal, limestone & finished steel products
Clients Essar Steel
Contract period 20 years
Project Cost Rs 1773 crore
Financial Status Financial closure achieved for 30 mtpa
Project Status Operational
Present capacity 30 mtpa
Oct-11 50 mtpa
Connectivity Road connectivity
Conveyor system
Source: Company, ICICIdirect.com Research,
Exhibit 14: Hazira Bulk Terminal operating parameters
232 232270 270
176 175212 211
0
50
100
150
200
250
300
FY11E FY12E FY13E FY14E
Rs c
r
73
74
75
76
77
78
79
%
Revenue EBITDA Operating Margin
Source: Company, ICICIdirect.com Research,
Salaya Bulk Terminal
The Salaya Bulk Terminal was incorporated to set up a 20 MTPA port facility at Salaya, Gujarat. The port facility at Salaya comprises setting up a 20 MTPA marine material handling facility to cater to the need of imported coal requirement and export of petroleum coke.
Exhibit 15: Salaya Bulk Terminal key facts Project Details Salaya Bulk Terminal
Capacity 20 mtpa
Cargo Coal and pet coke
Clients Essar Power
Contract period 30 years
Project Cost Rs 1370 crore
Financial Status Financial closure achieved for 12 mtpa
Project Status Under construction
Present capacity NIL
Sep-11 20 mtpa
Connectivity Road connectivity
Conveyor system
Source: Company, ICICIdirect.com Research,
The Hazira Bulk Terminal would be catering to Essar
Steel’s plant in Hazira and handle raw materials such as
iron ore pellets, coal, limestone and finished steel
products
The Salaya bulk terminal would handle the imported coal
for Essar Power’s plant at Salaya and also handle the pet
coke exports of the Essar Oil refinery
Essar Shipping (ESSSHI)
ICICIdirect.com | Equity Research Page 10
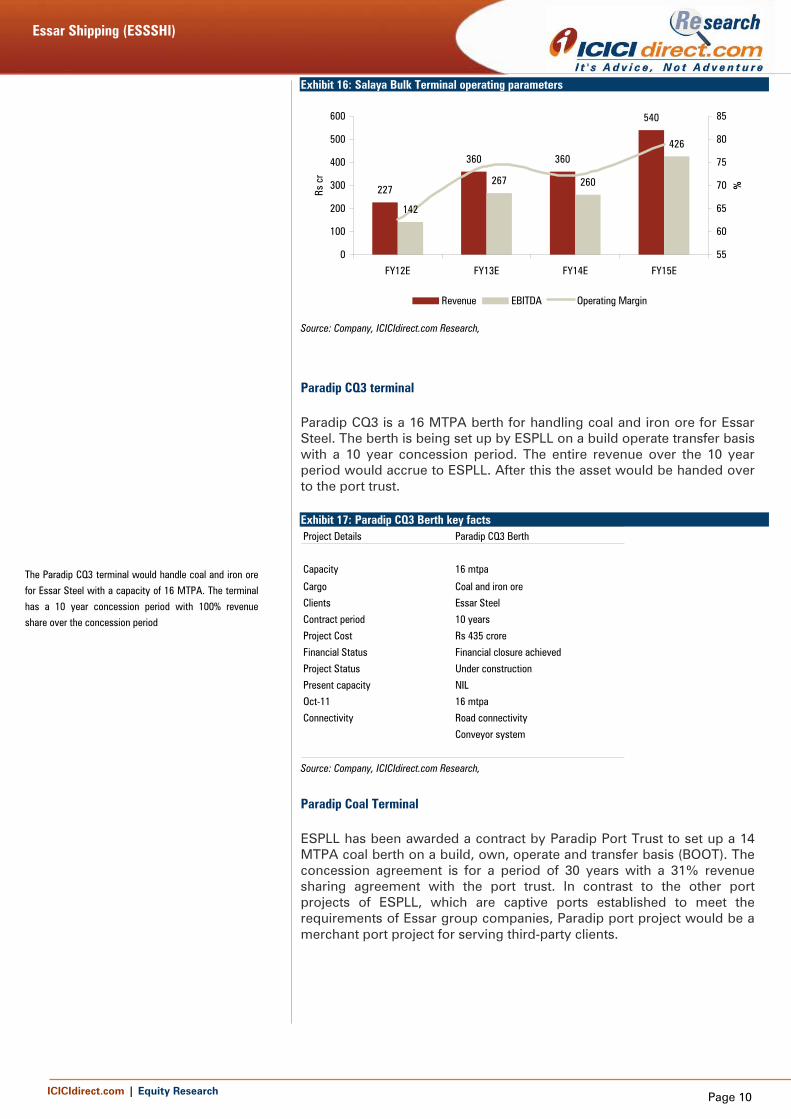
Exhibit 16: Salaya Bulk Terminal operating parameters
227
360 360
540
142
267 260
426
0
100
200
300
400
500
600
FY12E FY13E FY14E FY15E
Rs c
r
55
60
65
70
75
80
85
%
Revenue EBITDA Operating Margin
Source: Company, ICICIdirect.com Research,
Paradip CQ3 terminal
Paradip CQ3 is a 16 MTPA berth for handling coal and iron ore for Essar Steel. The berth is being set up by ESPLL on a build operate transfer basis with a 10 year concession period. The entire revenue over the 10 year period would accrue to ESPLL. After this the asset would be handed over to the port trust.
Exhibit 17: Paradip CQ3 Berth key facts Project Details Paradip CQ3 Berth
Capacity 16 mtpa
Cargo Coal and iron ore
Clients Essar Steel
Contract period 10 years
Project Cost Rs 435 crore
Financial Status Financial closure achieved
Project Status Under construction
Present capacity NIL
Oct-11 16 mtpa
Connectivity Road connectivity
Conveyor system
Source: Company, ICICIdirect.com Research,
Paradip Coal Terminal
ESPLL has been awarded a contract by Paradip Port Trust to set up a 14 MTPA coal berth on a build, own, operate and transfer basis (BOOT). The concession agreement is for a period of 30 years with a 31% revenue sharing agreement with the port trust. In contrast to the other port projects of ESPLL, which are captive ports established to meet the requirements of Essar group companies, Paradip port project would be a merchant port project for serving third-party clients.
The Paradip CQ3 terminal would handle coal and iron ore
for Essar Steel with a capacity of 16 MTPA. The terminal
has a 10 year concession period with 100% revenue
share over the concession period
Essar Shipping (ESSSHI)
ICICIdirect.com | Equity Research Page 11
Exhibit 18: Paradip Coal Berth key facts Project Details Paradip Coal Berth
Capacity 14 mtpa
Cargo Coal
Clients Merchant Port
Concession agreement period 30 years
Project Cost Rs 550 crores
Financial Status Financial closure achieved
Project Status Under Construction
Present capacity NIL
Oct-12 14 mtpa
Connectivity Road connectivity
Conveyor system
Source: Company, ICICIdirect.com Research,
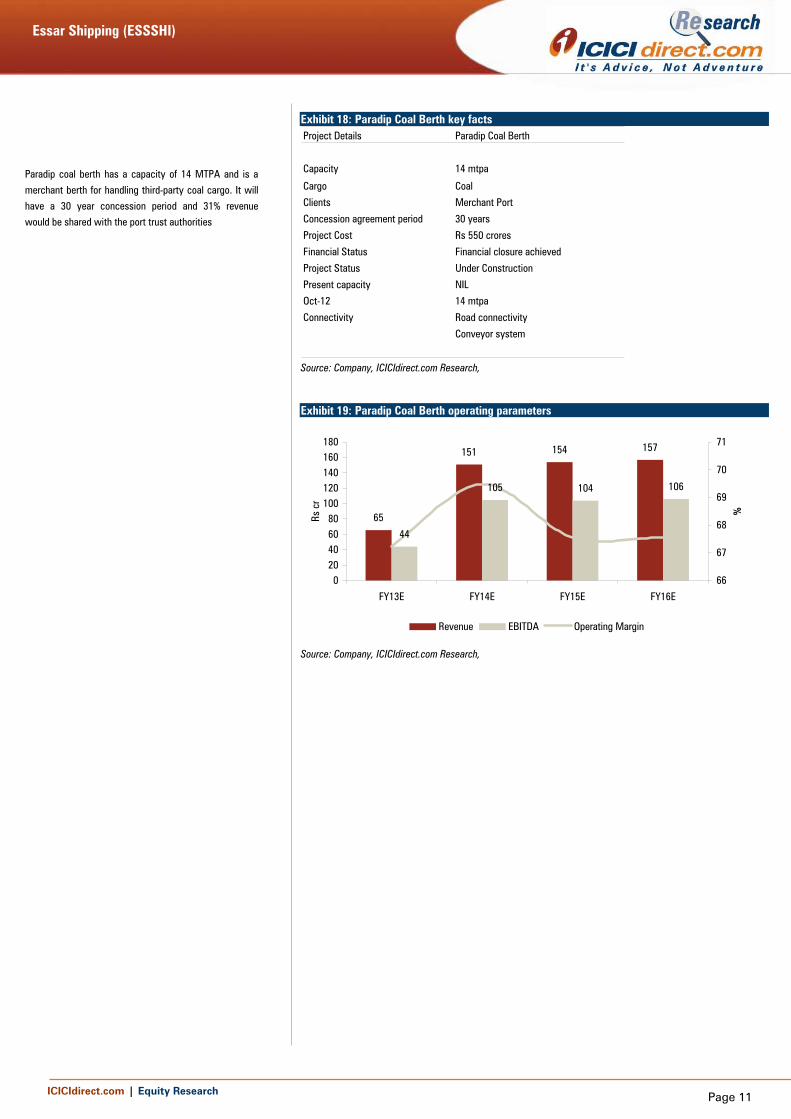
Exhibit 19: Paradip Coal Berth operating parameters
65
151 154 157
44
105 104 106
020406080
100120140160180
FY13E FY14E FY15E FY16E
Rs c
r
66
67
68
69
70
71
%
Revenue EBITDA Operating Margin
Source: Company, ICICIdirect.com Research,
Paradip coal berth has a capacity of 14 MTPA and is a
merchant berth for handling third-party coal cargo. It will
have a 30 year concession period and 31% revenue
would be shared with the port trust authorities
Essar Shipping (ESSSHI)
ICICIdirect.com | Equity Research Page 12
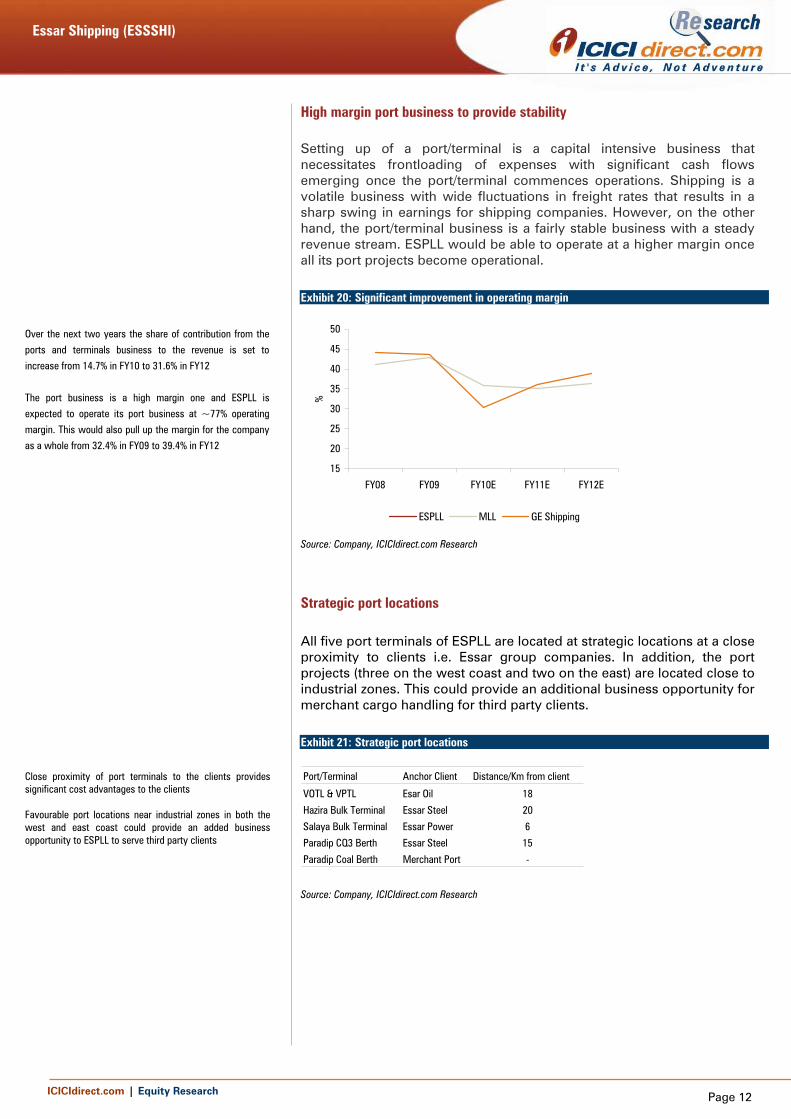
High margin port business to provide stability Setting up of a port/terminal is a capital intensive business that necessitates frontloading of expenses with significant cash flows emerging once the port/terminal commences operations. Shipping is a volatile business with wide fluctuations in freight rates that results in a sharp swing in earnings for shipping companies. However, on the other hand, the port/terminal business is a fairly stable business with a steady revenue stream. ESPLL would be able to operate at a higher margin once all its port projects become operational.
Exhibit 20: Significant improvement in operating margin
15
20
25
30
35
40
45
50
FY08 FY09 FY10E FY11E FY12E
%
ESPLL MLL GE Shipping
Source: Company, ICICIdirect.com Research
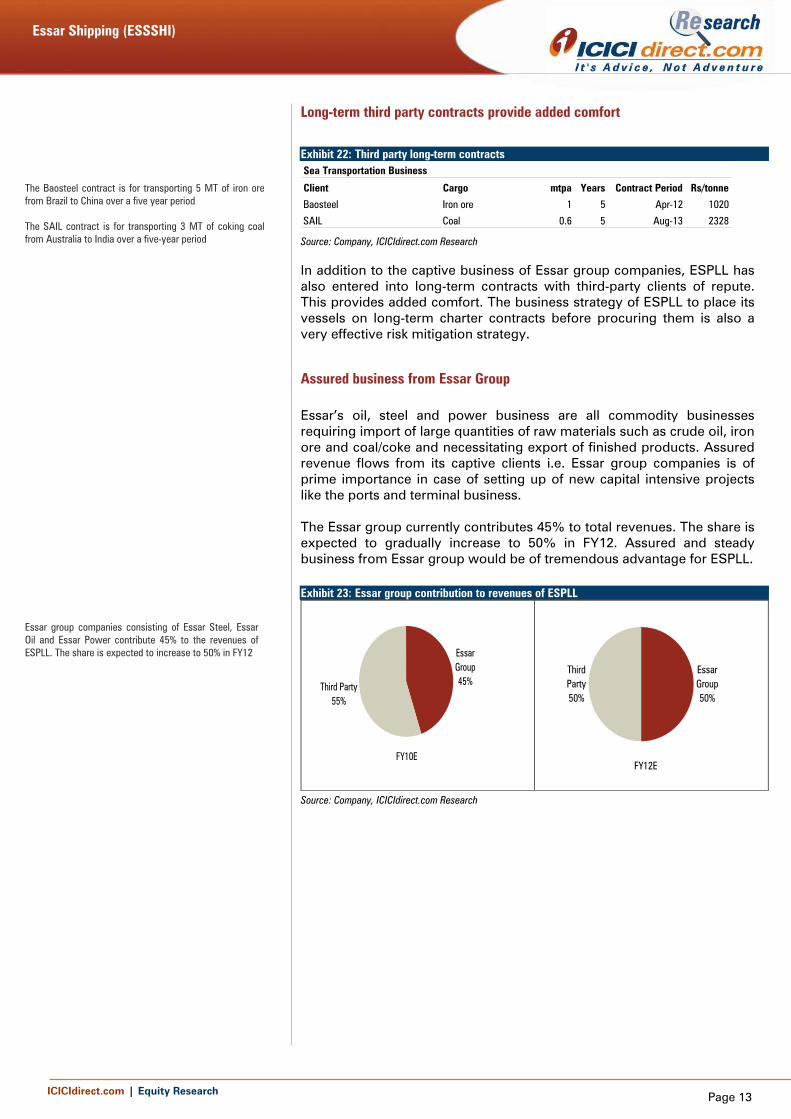
Strategic port locations
All five port terminals of ESPLL are located at strategic locations at a close proximity to clients i.e. Essar group companies. In addition, the port projects (three on the west coast and two on the east) are located close to industrial zones. This could provide an additional business opportunity for merchant cargo handling for third party clients.
Exhibit 21: Strategic port locations Port/Terminal Anchor Client Distance/Km from client
VOTL & VPTL Esar Oil 18
Hazira Bulk Terminal Essar Steel 20
Salaya Bulk Terminal Essar Power 6
Paradip CQ3 Berth Essar Steel 15
Paradip Coal Berth Merchant Port - Source: Company, ICICIdirect.com Research
Over the next two years the share of contribution from the
ports and terminals business to the revenue is set to
increase from 14.7% in FY10 to 31.6% in FY12
The port business is a high margin one and ESPLL is
expected to operate its port business at ~77% operating
margin. This would also pull up the margin for the company
as a whole from 32.4% in FY09 to 39.4% in FY12
Close proximity of port terminals to the clients provides significant cost advantages to the clients Favourable port locations near industrial zones in both the west and east coast could provide an added business opportunity to ESPLL to serve third party clients
Essar Shipping (ESSSHI)
ICICIdirect.com | Equity Research Page 13
Long-term third party contracts provide added comfort
Exhibit 22: Third party long-term contracts Sea Transportation Business
Client Cargo mtpa Years Contract Period Rs/tonne
Baosteel Iron ore 1 5 Apr-12 1020
SAIL Coal 0.6 5 Aug-13 2328
Source: Company, ICICIdirect.com Research
In addition to the captive business of Essar group companies, ESPLL has also entered into long-term contracts with third-party clients of repute. This provides added comfort. The business strategy of ESPLL to place its vessels on long-term charter contracts before procuring them is also a very effective risk mitigation strategy.
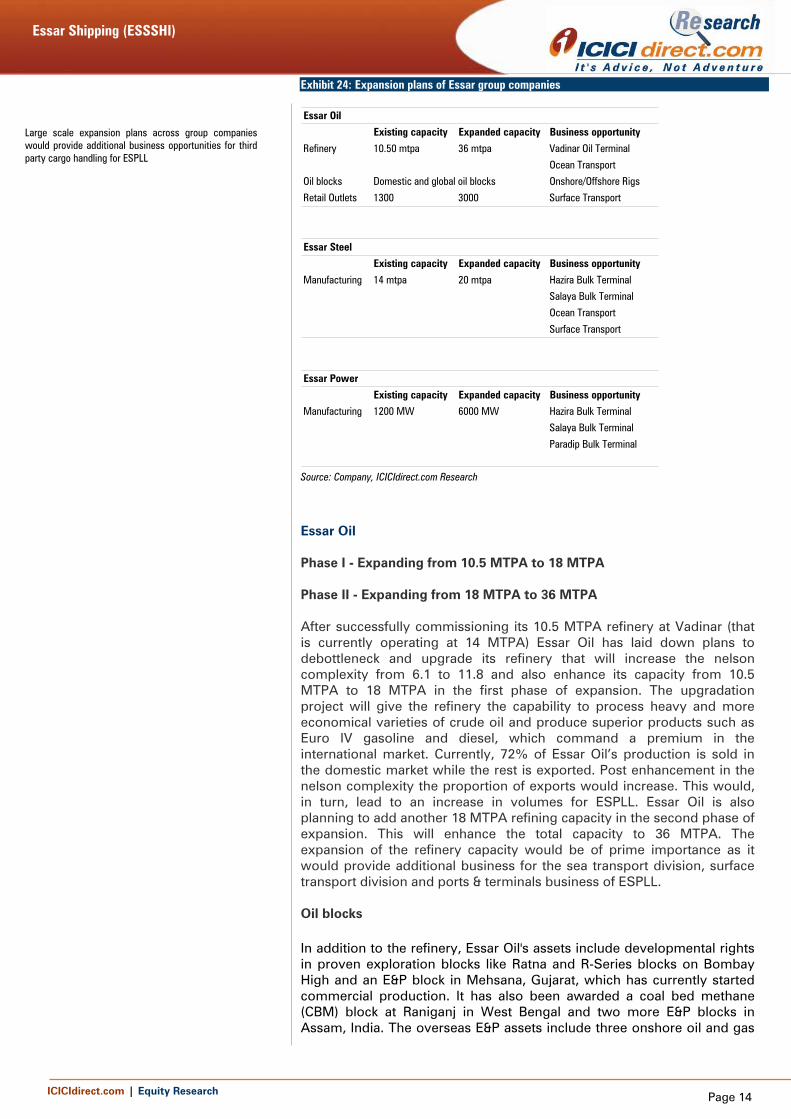
Assured business from Essar Group
Essar’s oil, steel and power business are all commodity businesses requiring import of large quantities of raw materials such as crude oil, iron ore and coal/coke and necessitating export of finished products. Assured revenue flows from its captive clients i.e. Essar group companies is of prime importance in case of setting up of new capital intensive projects like the ports and terminal business. The Essar group currently contributes 45% to total revenues. The share is expected to gradually increase to 50% in FY12. Assured and steady business from Essar group would be of tremendous advantage for ESPLL.
Exhibit 23: Essar group contribution to revenues of ESPLL
FY10E
Third Party55%
Essar Group45%
FY12E
Essar Group50%
Third Party50%
Source: Company, ICICIdirect.com Research
The Baosteel contract is for transporting 5 MT of iron ore from Brazil to China over a five year period The SAIL contract is for transporting 3 MT of coking coal from Australia to India over a five-year period
Essar group companies consisting of Essar Steel, Essar Oil and Essar Power contribute 45% to the revenues of ESPLL. The share is expected to increase to 50% in FY12
Essar Shipping (ESSSHI)
ICICIdirect.com | Equity Research Page 14
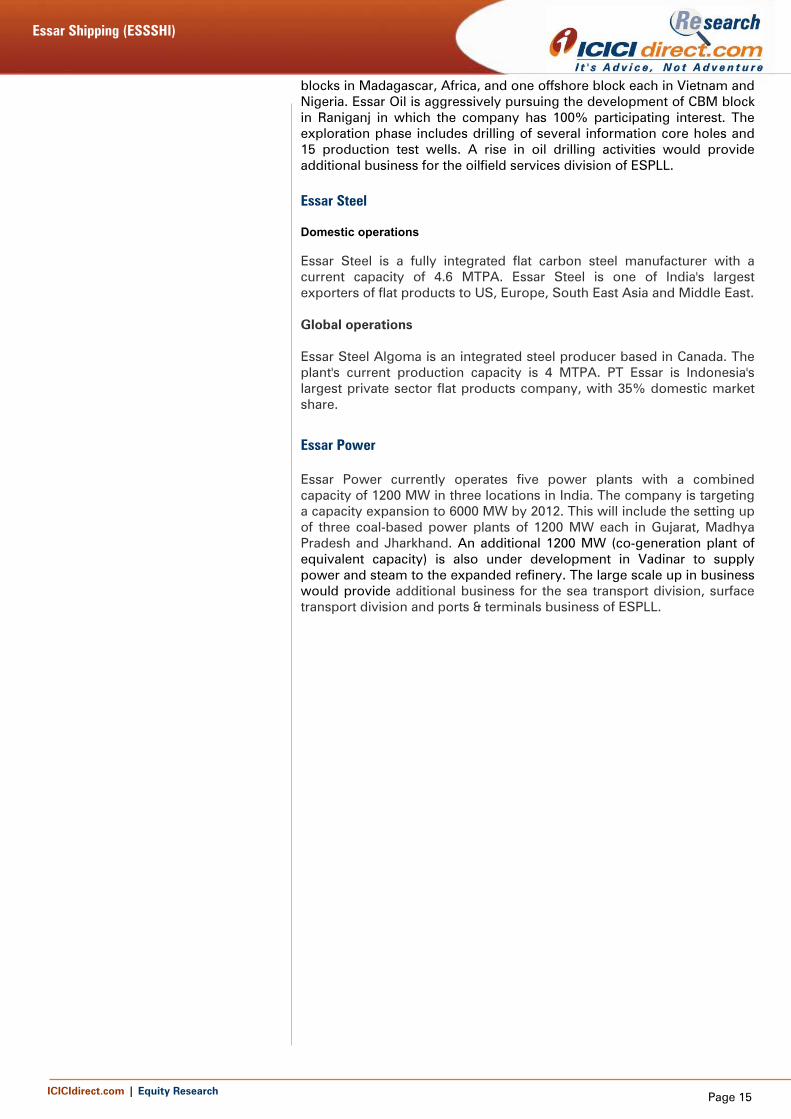
Exhibit 24: Expansion plans of Essar group companies
Existing capacity Expanded capacity Business opportunity
Vadinar Oil Terminal
Ocean Transport
Oil blocks Onshore/Offshore Rigs
Retail Outlets 1300 3000 Surface Transport
Existing capacity Expanded capacity Business opportunity
Hazira Bulk Terminal
Salaya Bulk Terminal
Ocean Transport
Surface Transport
Existing capacity Expanded capacity Business opportunity
Hazira Bulk Terminal
Salaya Bulk Terminal
Paradip Bulk Terminal
Essar Power
Manufacturing 1200 MW 6000 MW
Domestic and global oil blocks
Essar Steel
Manufacturing 14 mtpa 20 mtpa
Essar Oil
Refinery 10.50 mtpa 36 mtpa
Source: Company, ICICIdirect.com Research
Essar Oil Phase I - Expanding from 10.5 MTPA to 18 MTPA Phase II - Expanding from 18 MTPA to 36 MTPA After successfully commissioning its 10.5 MTPA refinery at Vadinar (that is currently operating at 14 MTPA) Essar Oil has laid down plans to debottleneck and upgrade its refinery that will increase the nelson complexity from 6.1 to 11.8 and also enhance its capacity from 10.5 MTPA to 18 MTPA in the first phase of expansion. The upgradation project will give the refinery the capability to process heavy and more economical varieties of crude oil and produce superior products such as Euro IV gasoline and diesel, which command a premium in the international market. Currently, 72% of Essar Oil’s production is sold in the domestic market while the rest is exported. Post enhancement in the nelson complexity the proportion of exports would increase. This would, in turn, lead to an increase in volumes for ESPLL. Essar Oil is also planning to add another 18 MTPA refining capacity in the second phase of expansion. This will enhance the total capacity to 36 MTPA. The expansion of the refinery capacity would be of prime importance as it would provide additional business for the sea transport division, surface transport division and ports & terminals business of ESPLL. Oil blocks
In addition to the refinery, Essar Oil's assets include developmental rights in proven exploration blocks like Ratna and R-Series blocks on Bombay High and an E&P block in Mehsana, Gujarat, which has currently started commercial production. It has also been awarded a coal bed methane (CBM) block at Raniganj in West Bengal and two more E&P blocks in Assam, India. The overseas E&P assets include three onshore oil and gas
Large scale expansion plans across group companieswould provide additional business opportunities for thirdparty cargo handling for ESPLL
Essar Shipping (ESSSHI)
ICICIdirect.com | Equity Research Page 15
blocks in Madagascar, Africa, and one offshore block each in Vietnam and Nigeria. Essar Oil is aggressively pursuing the development of CBM block in Raniganj in which the company has 100% participating interest. The exploration phase includes drilling of several information core holes and 15 production test wells. A rise in oil drilling activities would provide additional business for the oilfield services division of ESPLL.
Essar Steel Domestic operations Essar Steel is a fully integrated flat carbon steel manufacturer with a current capacity of 4.6 MTPA. Essar Steel is one of India's largest exporters of flat products to US, Europe, South East Asia and Middle East. Global operations Essar Steel Algoma is an integrated steel producer based in Canada. The plant's current production capacity is 4 MTPA. PT Essar is Indonesia's largest private sector flat products company, with 35% domestic market share.
Essar Power Essar Power currently operates five power plants with a combined capacity of 1200 MW in three locations in India. The company is targeting a capacity expansion to 6000 MW by 2012. This will include the setting up of three coal-based power plants of 1200 MW each in Gujarat, Madhya Pradesh and Jharkhand. An additional 1200 MW (co-generation plant of equivalent capacity) is also under development in Vadinar to supply power and steam to the expanded refinery. The large scale up in business would provide additional business for the sea transport division, surface transport division and ports & terminals business of ESPLL.
Essar Shipping (ESSSHI)
ICICIdirect.com | Equity Research Page 16
Industry outlook
Sea transportation business
Large supply of new build vessels to cap upside in freight rates Total 410 tankers and 622 dry bulk vessels joined the global shipping fleet in 2009 while another 1069 tankers and 2607 dry bulk vessels are expected to join the fleet over the next three years. Exceptionally high freight rates in 2007 and 2008 encouraged most shipping companies to expand their capacities. As order execution needed three to four years on account of overbooked shipyards, most deliveries would arrive in the market only from 2009 onwards. Such a large fleet addition would cap any significant upsides in freight rates. Exhibit 25: New vessel deliveries to cap upside in freight rates
Asset Class 2010 2011 2012 2013 Total Order BookTankersVLCC/ULCC 71 88 13 0 172SUEZMAX 44 57 9 1 111AFRAMAX 83 49 7 3 142PANAMAX 29 36 2 2 69MR TANKERS 192 114 17 2 3250-35K DWT 183 62 13 1 259Total(a) 602 406 61 9 1078Bulk
CAPESIZE 328 217 103 36 684
80-100k WT 192 187 62 23 464PANAMAX 84 65 35 9 193SUPRAMAX 363 245 73 7 688HANDYMAX 301 249 103 9 662Total(b) 1268 963 376 84 2691Total Vessel(a+b) 1870 1369 437 93 3769
Source: Company, ICICIdirect.com Research
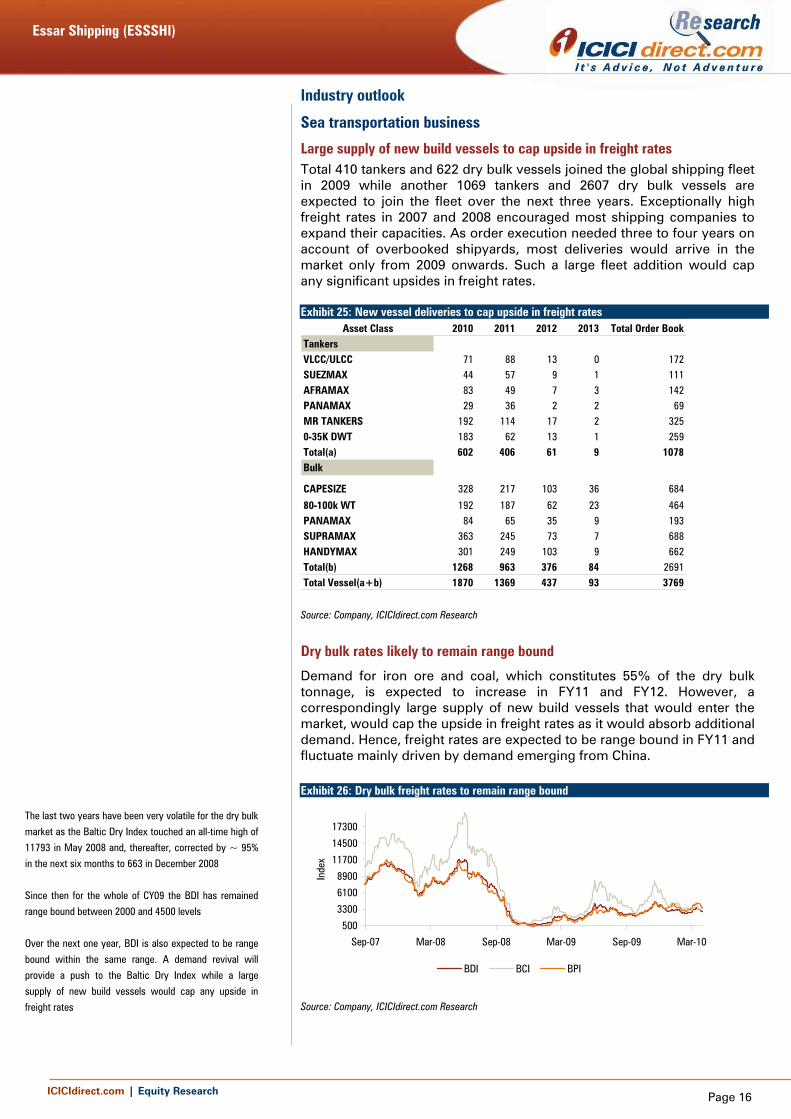
Dry bulk rates likely to remain range bound
Demand for iron ore and coal, which constitutes 55% of the dry bulk tonnage, is expected to increase in FY11 and FY12. However, a correspondingly large supply of new build vessels that would enter the market, would cap the upside in freight rates as it would absorb additional demand. Hence, freight rates are expected to be range bound in FY11 and fluctuate mainly driven by demand emerging from China. Exhibit 26: Dry bulk freight rates to remain range bound
500
3300
6100
8900
11700
14500
17300
Sep-07 Mar-08 Sep-08 Mar-09 Sep-09 Mar-10
Inde
x
BDI BCI BPI
Source: Company, ICICIdirect.com Research
The last two years have been very volatile for the dry bulk
market as the Baltic Dry Index touched an all-time high of
11793 in May 2008 and, thereafter, corrected by ~ 95%
in the next six months to 663 in December 2008
Since then for the whole of CY09 the BDI has remained
range bound between 2000 and 4500 levels
Over the next one year, BDI is also expected to be range
bound within the same range. A demand revival will
provide a push to the Baltic Dry Index while a large
supply of new build vessels would cap any upside in
freight rates
Essar Shipping (ESSSHI)
ICICIdirect.com | Equity Research Page 17
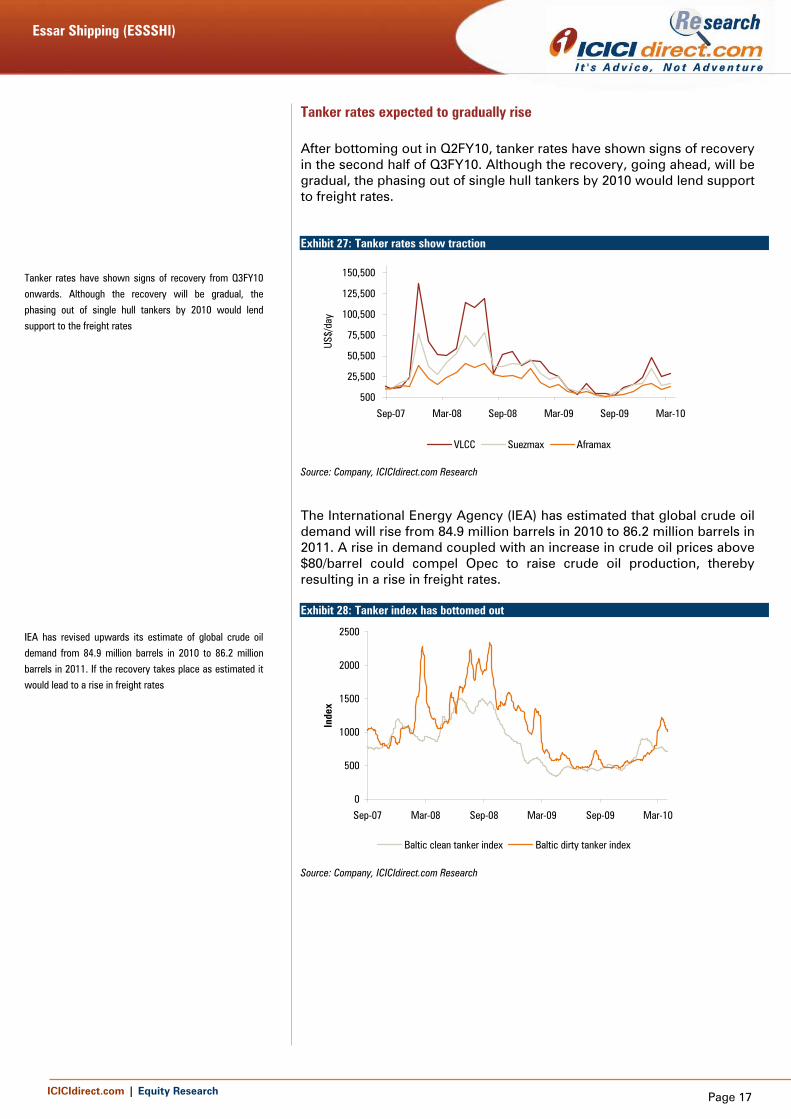
Tanker rates expected to gradually rise
After bottoming out in Q2FY10, tanker rates have shown signs of recovery in the second half of Q3FY10. Although the recovery, going ahead, will be gradual, the phasing out of single hull tankers by 2010 would lend support to freight rates. Exhibit 27: Tanker rates show traction
500
25,500
50,500
75,500
100,500
125,500
150,500
Sep-07 Mar-08 Sep-08 Mar-09 Sep-09 Mar-10
US$/
day
VLCC Suezmax Aframax
Source: Company, ICICIdirect.com Research
The International Energy Agency (IEA) has estimated that global crude oil demand will rise from 84.9 million barrels in 2010 to 86.2 million barrels in 2011. A rise in demand coupled with an increase in crude oil prices above $80/barrel could compel Opec to raise crude oil production, thereby resulting in a rise in freight rates. Exhibit 28: Tanker index has bottomed out
0
500
1000
1500
2000
2500
Sep-07 Mar-08 Sep-08 Mar-09 Sep-09 Mar-10
Inde
x
Baltic clean tanker index Baltic dirty tanker index
Source: Company, ICICIdirect.com Research
Tanker rates have shown signs of recovery from Q3FY10 onwards. Although the recovery will be gradual, the phasing out of single hull tankers by 2010 would lend support to the freight rates
IEA has revised upwards its estimate of global crude oil demand from 84.9 million barrels in 2010 to 86.2 million barrels in 2011. If the recovery takes place as estimated it would lead to a rise in freight rates
Essar Shipping (ESSSHI)
ICICIdirect.com | Equity Research Page 18
Oilfield services business
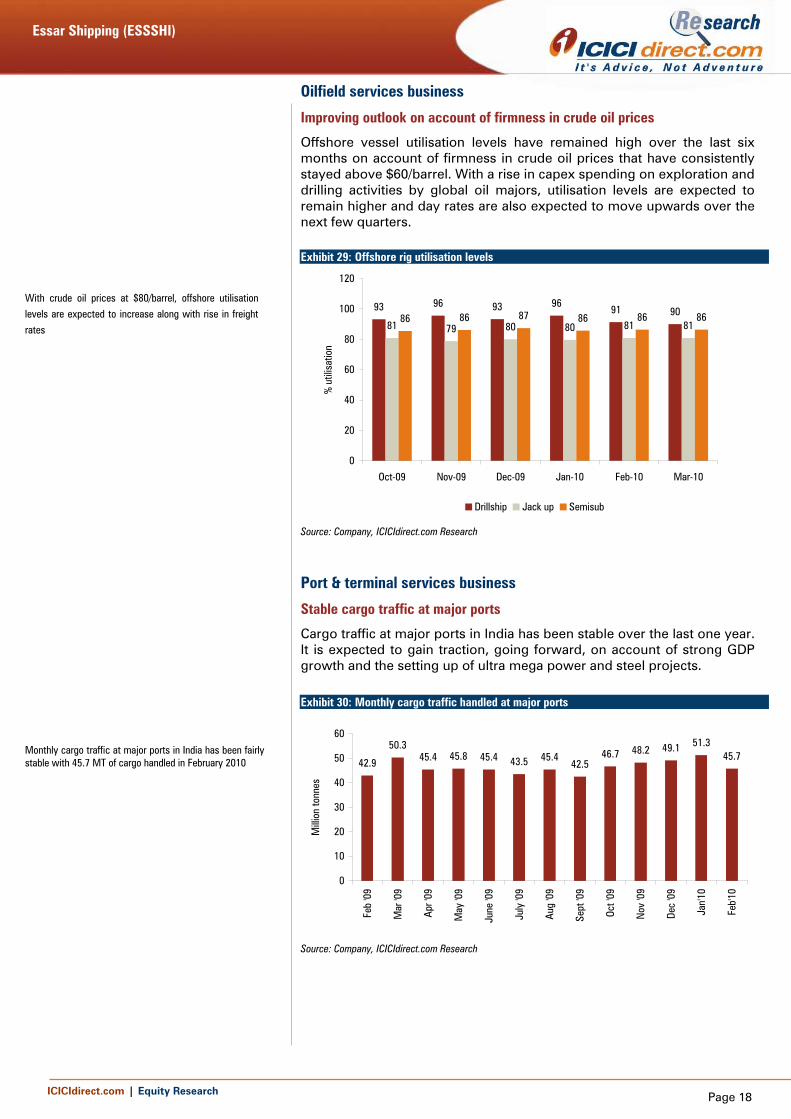
Improving outlook on account of firmness in crude oil prices
Offshore vessel utilisation levels have remained high over the last six months on account of firmness in crude oil prices that have consistently stayed above $60/barrel. With a rise in capex spending on exploration and drilling activities by global oil majors, utilisation levels are expected to remain higher and day rates are also expected to move upwards over the next few quarters. Exhibit 29: Offshore rig utilisation levels
93 96 93 9691 90
81 79 80 80 81 8186 86 87 86 86 86
0
20
40
60
80
100
120
Oct-09 Nov-09 Dec-09 Jan-10 Feb-10 Mar-10
% u
tilis
atio
n
Drillship Jack up Semisub
Source: Company, ICICIdirect.com Research
Port & terminal services business
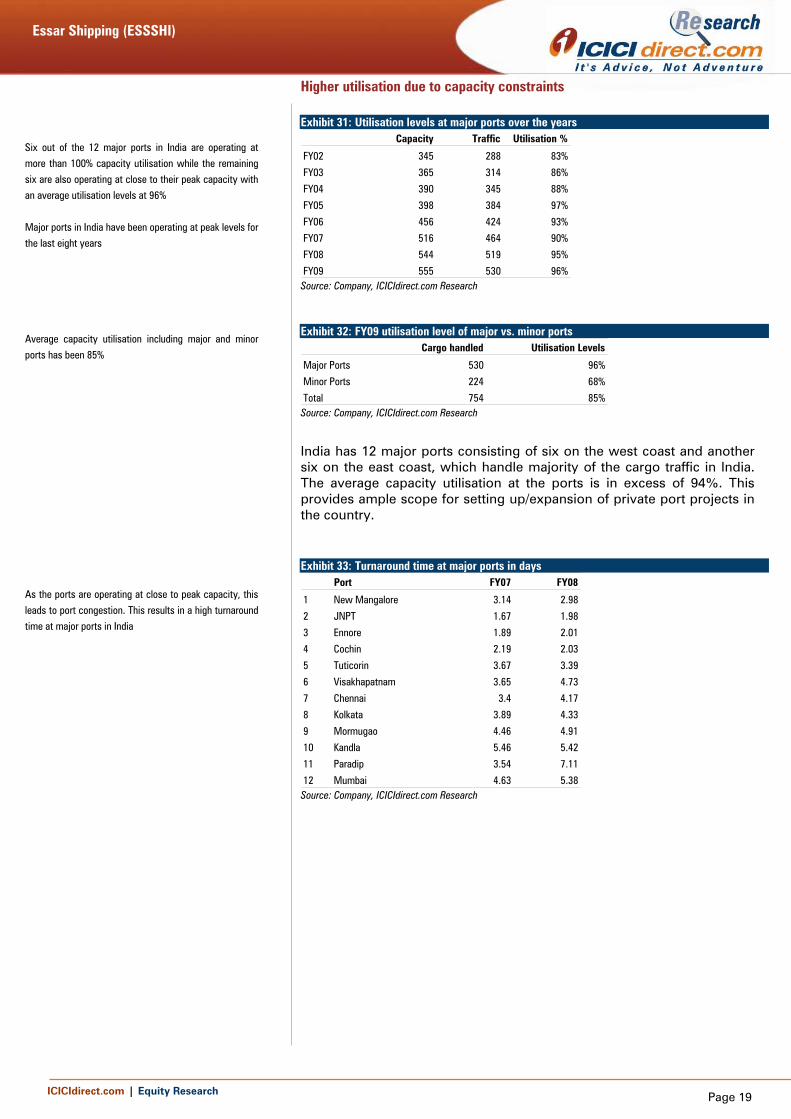
Stable cargo traffic at major ports
Cargo traffic at major ports in India has been stable over the last one year. It is expected to gain traction, going forward, on account of strong GDP growth and the setting up of ultra mega power and steel projects.
Exhibit 30: Monthly cargo traffic handled at major ports
42.9
50.345.4 45.8 45.4 43.5 45.4
42.546.7 48.2 49.1 51.3
45.7
0
10
20
30
40
50
60
Feb
'09
Mar
'09
Apr '
09
May
'09
June
'09
July
'09
Aug
'09
Sept
'09
Oct '
09
Nov
'09
Dec
'09
Jan'
10
Feb'
10
Milli
on to
nnes
Source: Company, ICICIdirect.com Research
With crude oil prices at $80/barrel, offshore utilisation levels are expected to increase along with rise in freight rates
Monthly cargo traffic at major ports in India has been fairlystable with 45.7 MT of cargo handled in February 2010
Essar Shipping (ESSSHI)
ICICIdirect.com | Equity Research Page 19
Higher utilisation due to capacity constraints Exhibit 31: Utilisation levels at major ports over the years
Capacity Traffic Utilisation %
FY02 345 288 83%
FY03 365 314 86%
FY04 390 345 88%
FY05 398 384 97%
FY06 456 424 93%
FY07 516 464 90%
FY08 544 519 95%
FY09 555 530 96% Source: Company, ICICIdirect.com Research Exhibit 32: FY09 utilisation level of major vs. minor ports
Cargo handled Utilisation Levels
Major Ports 530 96%
Minor Ports 224 68%
Total 754 85% Source: Company, ICICIdirect.com Research
India has 12 major ports consisting of six on the west coast and another six on the east coast, which handle majority of the cargo traffic in India. The average capacity utilisation at the ports is in excess of 94%. This provides ample scope for setting up/expansion of private port projects in the country. Exhibit 33: Turnaround time at major ports in days
Port FY07 FY08
1 New Mangalore 3.14 2.98
2 JNPT 1.67 1.98
3 Ennore 1.89 2.01
4 Cochin 2.19 2.03
5 Tuticorin 3.67 3.39
6 Visakhapatnam 3.65 4.73
7 Chennai 3.4 4.17
8 Kolkata 3.89 4.33
9 Mormugao 4.46 4.91
10 Kandla 5.46 5.42
11 Paradip 3.54 7.11
12 Mumbai 4.63 5.38 Source: Company, ICICIdirect.com Research
Six out of the 12 major ports in India are operating at more than 100% capacity utilisation while the remaining six are also operating at close to their peak capacity with an average utilisation levels at 96% Major ports in India have been operating at peak levels for the last eight years Average capacity utilisation including major and minor ports has been 85% As the ports are operating at close to peak capacity, this leads to port congestion. This results in a high turnaround time at major ports in India
Essar Shipping (ESSSHI)
ICICIdirect.com | Equity Research Page 20
Risks and concerns
Staggered global recovery in 2010 The global economy, especially of developed countries, has managed to wriggle out of the recession on account of some extraordinary measures initiated by the respective countries to kick start demand. The International Monetary Fund (IMF) has revised upward the global growth prospect to ~ 3% growth forecast in 2010 following a contraction of ~1% in 2009. China’s GDP is expected to grow at 9% in 2010 and has a major bearing on global commodity demand. If, on the other hand, the recovery gets delayed it could lead to a drop in demand for shipping vessels across segments.
Weakness in freight rates Freight rates for dry bulk vessels remained range bound and volatile for the major part of CY09. A similar trend is expected to continue in CY10 as demand for dry bulk vessels is likely to increase gradually. However, a constant supply of new vessels entering the market would cap any rise in freight rates. Still, dry bulk freight rates could drop if there is a fall in demand for commodities such as iron ore and coal from China.
After plunging steeply in H1FY10, tanker rates started to recover only towards the end of 2009. Tanker rates are also expected to gradually rise as the scrapping of single hull tankers gathers pace in 2010. However, tanker rates could remain under pressure if Opec fails to increase its crude production in 2010. However, ESPLL has long-term contracts with reputed global majors along with assured business flow from its group companies, which provides good earnings visibility.
Drop in vessel scrapping and reduction in slippages Scrapping of vessels continued unabated throughout 2009 as depressed freight rates and high scrap metal prices forced many ship owners to scrap their vessels before the end of their useful life. However, if scrapping activity slows down it could put pressure on freight rates. As many shipping companies faced a liquidity squeeze, shipbuilding work slowed down and there were significant slippages in new deliveries in 2009. With an improvement in liquidity, the amount of slippages is expected to reduce, going forward. This could lead to pressure on freight rates as additional vessels join the global fleet.
Delay in expansion projects of Essar Oil, Essar Steel & Essar Power Out of the five port projects of ESPLL, except one merchant port terminal i.e. Paradip coal terminal the rest four are captive port terminals that cater exclusively to Essar group companies i.e. Essar Steel, Essar Oil & Essar Power. Although going ahead, ports/terminals would cater to third party clients, at present the major client is Essar group companies. Hence, if there is a delay in expansion projects of any of the group companies it could also lead to reduced earnings visibility for ESPLL.
The global recovery is expected to gather pace in FY11 with India and China leading the pack. However, if there is a delay in global recovery then it could lead to a drop in shipping volumes adversely affecting the prospects of shipping companies
The strength of freight rates would largely depend on the demand for commodities especially from China, which is the main driver of iron ore and coal demand. If there is a softening of freight rates it would not only directly affect the revenues of shipping companies but would also act as a dampener of sentiment for shipping companies
Any decline in scrapping of vessels would delay the exit of older vessels. This would lead to excess supply of vessels in the market leading to softening of freight rates Despite the vast order book prevailing with major shipyards, there was a considerable slippage in deliveries, which managed to keep the supply of vessels under check. If the slippages continue in FY11 as well it would lend support to freight rates. Conversely, a reduction in slippages could exert pressure on freight rates A substantial portion of revenues of ESPLL is derived from the group companies of Essar. Hence, if there is a delay in expansion of any of the projects it could lead to reduced earnings visibility for ESPLL especially in the ports business
Essar Shipping (ESSSHI)
ICICIdirect.com | Equity Research Page 21
Delay in implementation of port projects and delivery of jack-up rigs The major up-tick in revenues for ESPLL is expected to be derived from the port operations of the company. The share in revenues of port operations is expected to move up from the current 16% to 29% in FY12. However, except Vadinar and Hazira that are operational, the rest of the port projects are in the implementation stage. A delay in commissioning could adversely impact the earnings. ESPLL has also placed orders for two jack-up rigs with ABG Shipyard that are expected to join the fleet in FY12. A delay in delivery of rigs could lead to reduced earnings for ESPLL.
Long-term contracts have capped earnings from port terminal business Ports/terminals are capital intensive businesses that require substantial capex spend initially with frontloading of expenses. However, it is offset by higher margins once the port becomes operational as it incurs marginal operating expenses. India is expected to post higher single digit GDP growth over the next decade. In addition, the implementation of mega power, steel and refinery projects would lead to a significant rise in imports of coal and crude oil and export of refined products. Since India lacks adequate port infrastructure, it could lead to higher cargo handling charges for port operators. However, in case of ESPLL only one out of the five port projects is a merchant port while the rest of the ports are captive ports that cater to Essar group companies with long-term revenue contracts. Although this arrangement provides assured and stable revenues, it also means that the earnings are capped as the company would be unable to increase its cargo handling charges with upsides emerging only from additional volume handled by the port.
A delay in implementation of port projects could lead to reduced earnings visibility A similar delay in delivery of jack-up rigs could impact the earnings of the company
Four out of the five port projects cater exclusively to Essar group companies with firm contracts in place Although it provides stable revenues it also reduces the potential of any extraordinary gains as revenues are capped
Essar Shipping (ESSSHI)
ICICIdirect.com | Equity Research Page 22
Financials
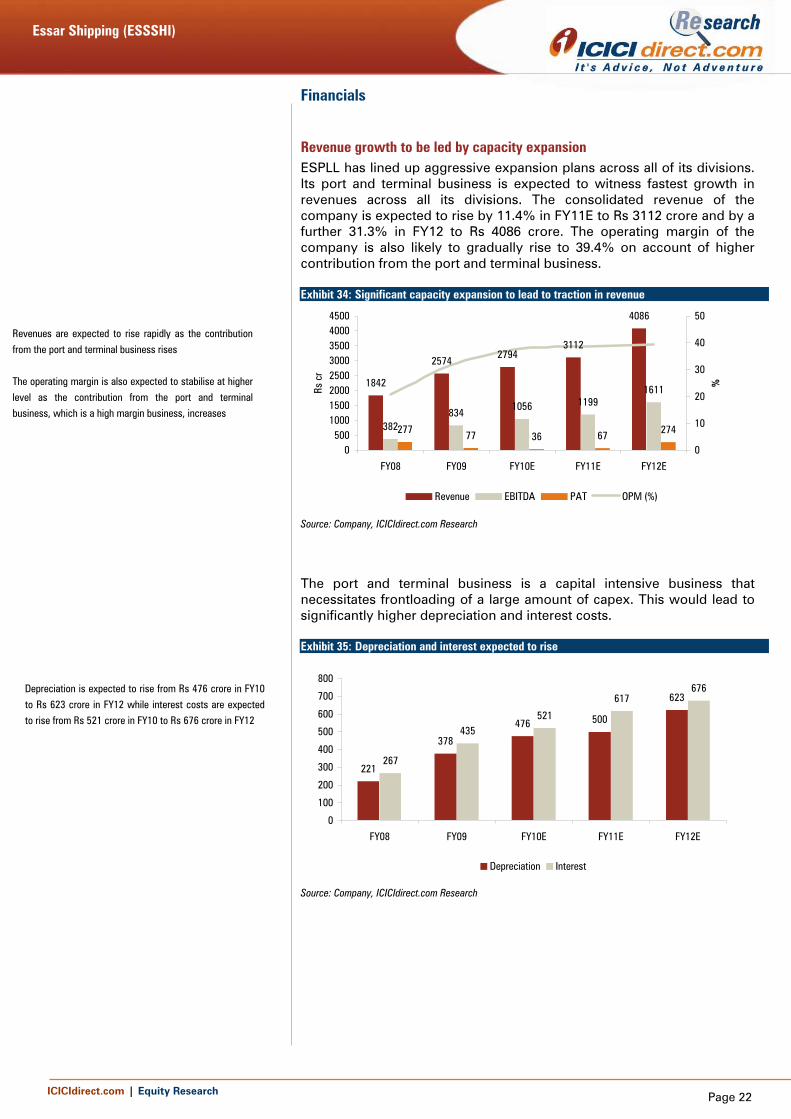
Revenue growth to be led by capacity expansion ESPLL has lined up aggressive expansion plans across all of its divisions. Its port and terminal business is expected to witness fastest growth in revenues across all its divisions. The consolidated revenue of the company is expected to rise by 11.4% in FY11E to Rs 3112 crore and by a further 31.3% in FY12 to Rs 4086 crore. The operating margin of the company is also likely to gradually rise to 39.4% on account of higher contribution from the port and terminal business. Exhibit 34: Significant capacity expansion to lead to traction in revenue
1842
25742794
3112
4086
382834
1056 11991611
277 77 36 67 274
0500
10001500200025003000350040004500
FY08 FY09 FY10E FY11E FY12E
Rs c
r
0
10
20
30
40
50
%
Revenue EBITDA PAT OPM (%)
Source: Company, ICICIdirect.com Research
The port and terminal business is a capital intensive business that necessitates frontloading of a large amount of capex. This would lead to significantly higher depreciation and interest costs. Exhibit 35: Depreciation and interest expected to rise
221
378
476 500
623
267
435521
617676
0
100
200
300
400
500
600
700
800
FY08 FY09 FY10E FY11E FY12E
Depreciation Interest
Source: Company, ICICIdirect.com Research
Revenues are expected to rise rapidly as the contribution from the port and terminal business rises The operating margin is also expected to stabilise at higher level as the contribution from the port and terminal business, which is a high margin business, increases
Depreciation is expected to rise from Rs 476 crore in FY10 to Rs 623 crore in FY12 while interest costs are expected to rise from Rs 521 crore in FY10 to Rs 676 crore in FY12
Essar Shipping (ESSSHI)
ICICIdirect.com | Equity Research Page 23
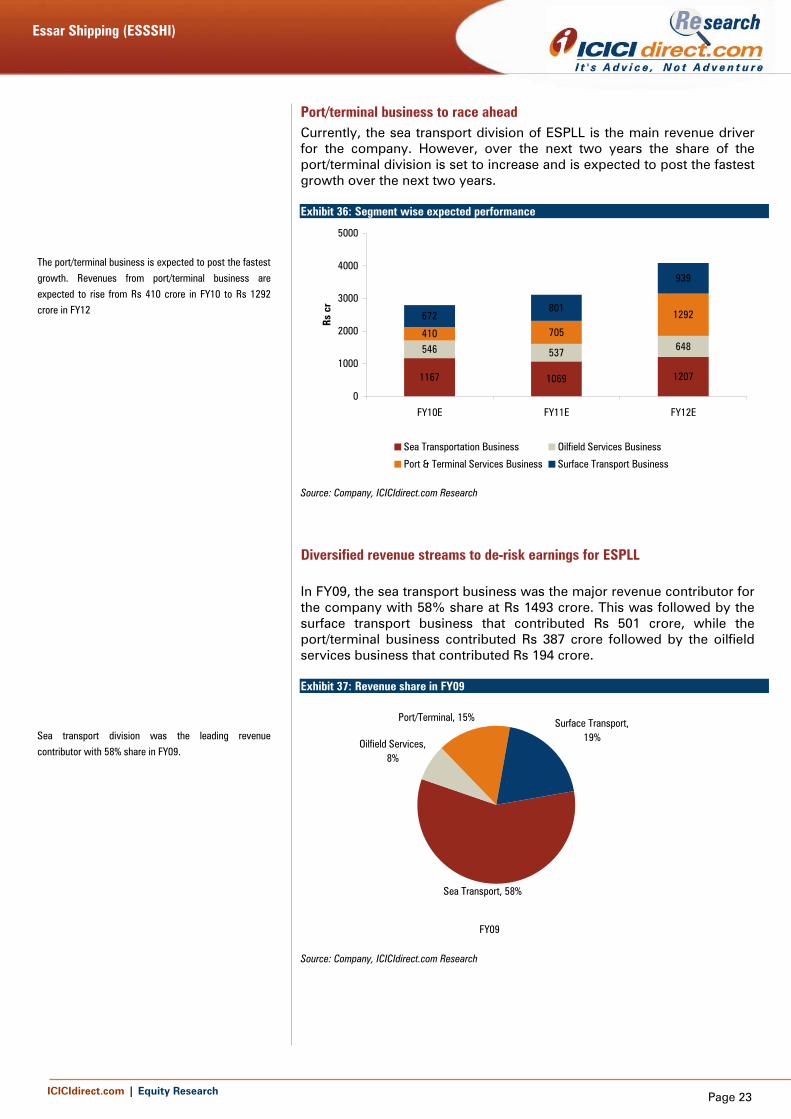
Port/terminal business to race ahead Currently, the sea transport division of ESPLL is the main revenue driver for the company. However, over the next two years the share of the port/terminal division is set to increase and is expected to post the fastest growth over the next two years. Exhibit 36: Segment wise expected performance
1167 1069 1207
546 537 648410 705
1292672801
939
0
1000
2000
3000
4000
5000
FY10E FY11E FY12E
Rs c
r
Sea Transportation Business Oilfield Services Business
Port & Terminal Services Business Surface Transport Business
Source: Company, ICICIdirect.com Research
Diversified revenue streams to de-risk earnings for ESPLL In FY09, the sea transport business was the major revenue contributor for the company with 58% share at Rs 1493 crore. This was followed by the surface transport business that contributed Rs 501 crore, while the port/terminal business contributed Rs 387 crore followed by the oilfield services business that contributed Rs 194 crore. Exhibit 37: Revenue share in FY09
FY09
Port/Terminal, 15% Surface Transport, 19%
Oilfield Services, 8%
Sea Transport, 58%
Source: Company, ICICIdirect.com Research
The port/terminal business is expected to post the fastest growth. Revenues from port/terminal business are expected to rise from Rs 410 crore in FY10 to Rs 1292 crore in FY12
Sea transport division was the leading revenue contributor with 58% share in FY09.
Essar Shipping (ESSSHI)
ICICIdirect.com | Equity Research Page 24
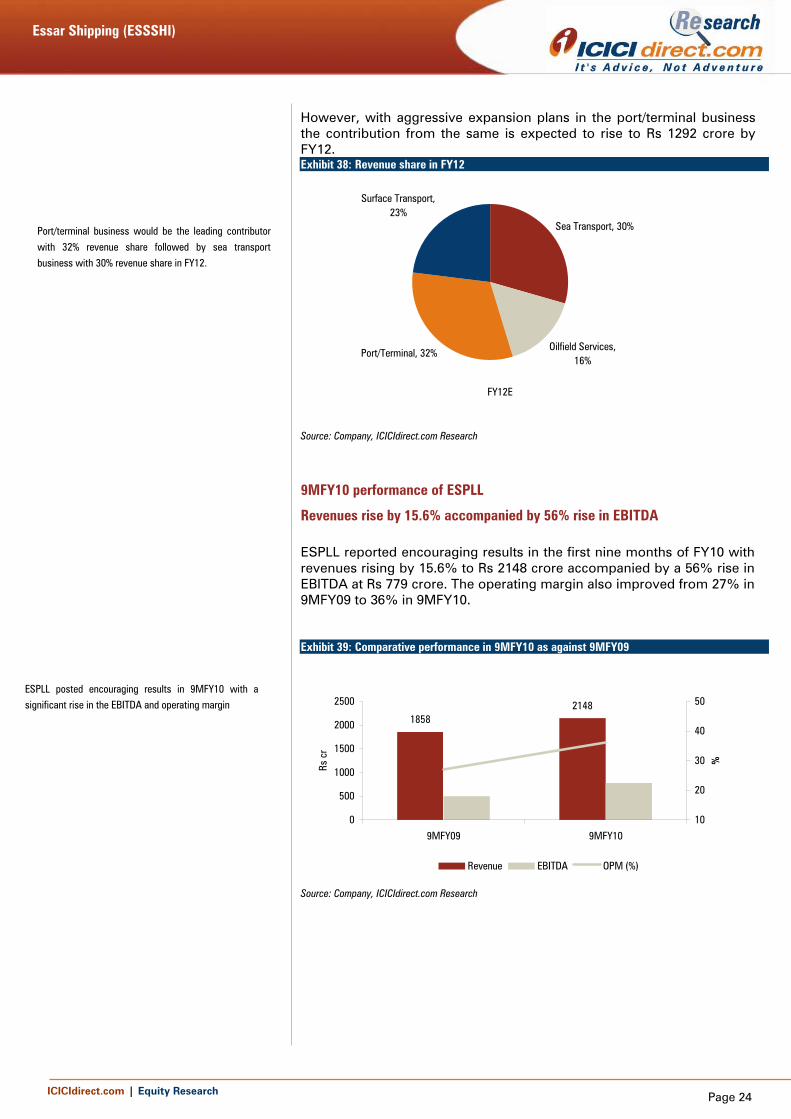
However, with aggressive expansion plans in the port/terminal business the contribution from the same is expected to rise to Rs 1292 crore by FY12. Exhibit 38: Revenue share in FY12
FY12E
Port/Terminal, 32%
Surface Transport, 23%
Oilfield Services, 16%
Sea Transport, 30%
Source: Company, ICICIdirect.com Research
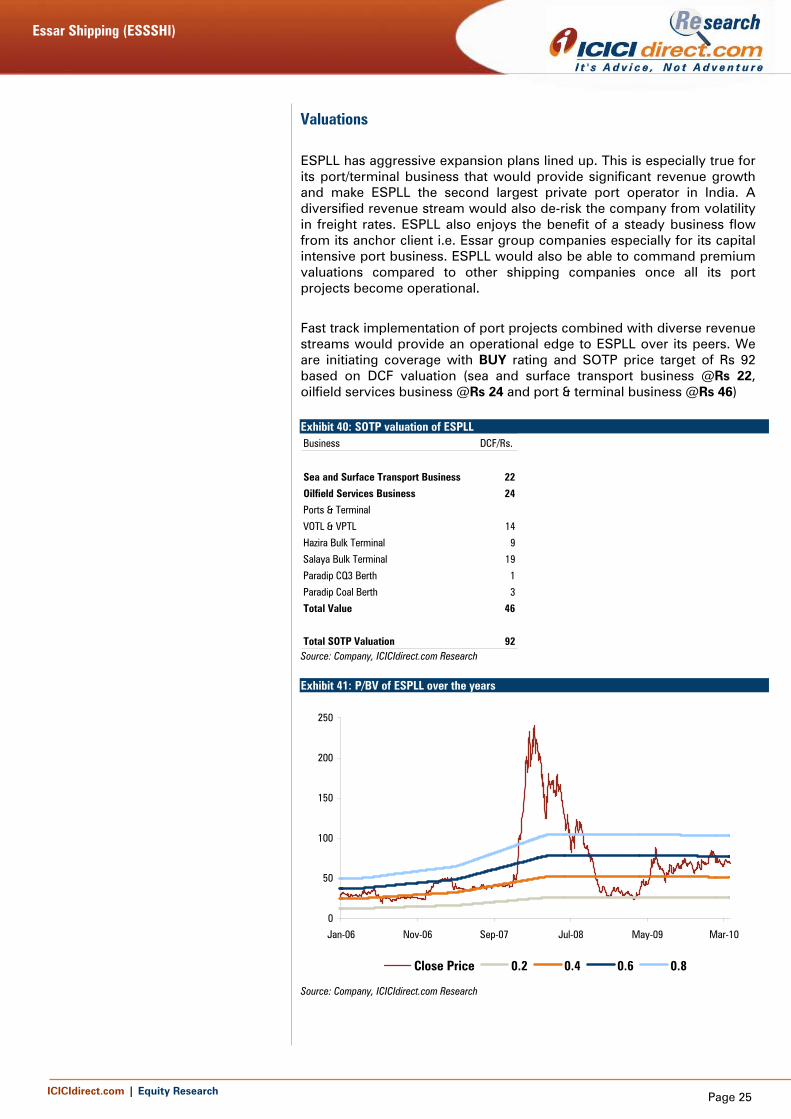
9MFY10 performance of ESPLL
Revenues rise by 15.6% accompanied by 56% rise in EBITDA ESPLL reported encouraging results in the first nine months of FY10 with revenues rising by 15.6% to Rs 2148 crore accompanied by a 56% rise in EBITDA at Rs 779 crore. The operating margin also improved from 27% in 9MFY09 to 36% in 9MFY10. Exhibit 39: Comparative performance in 9MFY10 as against 9MFY09
18582148
0
500
1000
1500
2000
2500
9MFY09 9MFY10
Rs c
r
10
20
30
40
50%
Revenue EBITDA OPM (%)
Source: Company, ICICIdirect.com Research
Port/terminal business would be the leading contributor with 32% revenue share followed by sea transport business with 30% revenue share in FY12.
ESPLL posted encouraging results in 9MFY10 with a significant rise in the EBITDA and operating margin
Essar Shipping (ESSSHI)
ICICIdirect.com | Equity Research Page 25
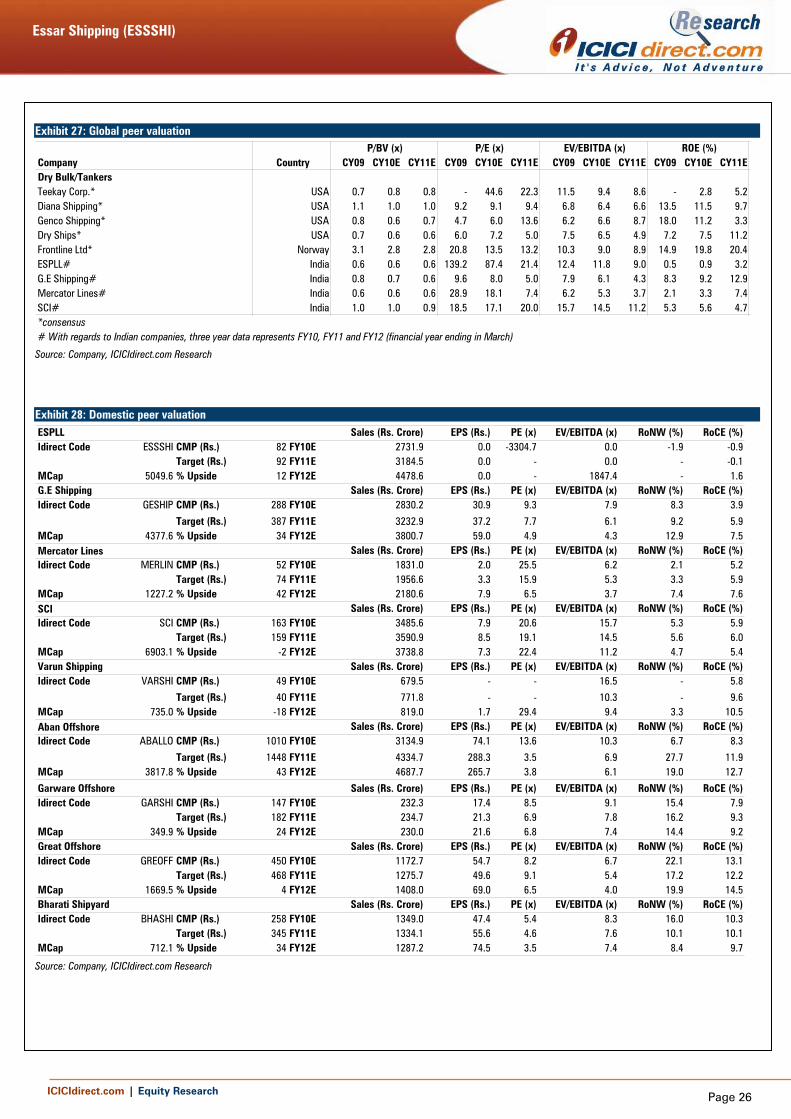
Valuations
ESPLL has aggressive expansion plans lined up. This is especially true for its port/terminal business that would provide significant revenue growth and make ESPLL the second largest private port operator in India. A diversified revenue stream would also de-risk the company from volatility in freight rates. ESPLL also enjoys the benefit of a steady business flow from its anchor client i.e. Essar group companies especially for its capital intensive port business. ESPLL would also be able to command premium valuations compared to other shipping companies once all its port projects become operational.
Fast track implementation of port projects combined with diverse revenue streams would provide an operational edge to ESPLL over its peers. We are initiating coverage with BUY rating and SOTP price target of Rs 92 based on DCF valuation (sea and surface transport business @Rs 22, oilfield services business @Rs 24 and port & terminal business @Rs 46) Exhibit 40: SOTP valuation of ESPLL Business DCF/Rs.
Sea and Surface Transport Business 22
Oilfield Services Business 24
Ports & Terminal
VOTL & VPTL 14
Hazira Bulk Terminal 9
Salaya Bulk Terminal 19
Paradip CQ3 Berth 1
Paradip Coal Berth 3
Total Value 46
Total SOTP Valuation 92 Source: Company, ICICIdirect.com Research Exhibit 41: P/BV of ESPLL over the years
0
50
100
150
200
250
Jan-06 Nov-06 Sep-07 Jul-08 May-09 Mar-10
Close Price 0.2 0.4 0.6 0.8
Source: Company, ICICIdirect.com Research
Essar Shipping (ESSSHI)
ICICIdirect.com | Equity Research Page 26
Exhibit 27: Global peer valuation
CY09 CY10E CY11E CY09 CY10E CY11E CY09 CY10E CY11E CY09 CY10E CY11EDry Bulk/TankersTeekay Corp.* USA 0.7 0.8 0.8 - 44.6 22.3 11.5 9.4 8.6 - 2.8 5.2Diana Shipping* USA 1.1 1.0 1.0 9.2 9.1 9.4 6.8 6.4 6.6 13.5 11.5 9.7Genco Shipping* USA 0.8 0.6 0.7 4.7 6.0 13.6 6.2 6.6 8.7 18.0 11.2 3.3Dry Ships* USA 0.7 0.6 0.6 6.0 7.2 5.0 7.5 6.5 4.9 7.2 7.5 11.2Frontline Ltd* Norway 3.1 2.8 2.8 20.8 13.5 13.2 10.3 9.0 8.9 14.9 19.8 20.4ESPLL# India 0.6 0.6 0.6 139.2 87.4 21.4 12.4 11.8 9.0 0.5 0.9 3.2G.E Shipping# India 0.8 0.7 0.6 9.6 8.0 5.0 7.9 6.1 4.3 8.3 9.2 12.9Mercator Lines# India 0.6 0.6 0.6 28.9 18.1 7.4 6.2 5.3 3.7 2.1 3.3 7.4SCI# India 1.0 1.0 0.9 18.5 17.1 20.0 15.7 14.5 11.2 5.3 5.6 4.7*consensus# With regards to Indian companies, three year data represents FY10, FY11 and FY12 (financial year ending in March)
Company CountryP/BV (x) P/E (x) EV/EBITDA (x) ROE (%)
Source: Company, ICICIdirect.com Research
Exhibit 28: Domestic peer valuation ESPLL Sales (Rs. Crore) EPS (Rs.) PE (x) EV/EBITDA (x) RoNW (%) RoCE (%)Idirect Code ESSSHI CMP (Rs.) 82 FY10E 2731.9 0.0 -3304.7 0.0 -1.9 -0.9
Target (Rs.) 92 FY11E 3184.5 0.0 - 0.0 - -0.1MCap 5049.6 % Upside 12 FY12E 4478.6 0.0 - 1847.4 - 1.6G.E Shipping Sales (Rs. Crore) EPS (Rs.) PE (x) EV/EBITDA (x) RoNW (%) RoCE (%)Idirect Code GESHIP CMP (Rs.) 288 FY10E 2830.2 30.9 9.3 7.9 8.3 3.9
Target (Rs.) 387 FY11E 3232.9 37.2 7.7 6.1 9.2 5.9MCap 4377.6 % Upside 34 FY12E 3800.7 59.0 4.9 4.3 12.9 7.5Mercator Lines Sales (Rs. Crore) EPS (Rs.) PE (x) EV/EBITDA (x) RoNW (%) RoCE (%)Idirect Code MERLIN CMP (Rs.) 52 FY10E 1831.0 2.0 25.5 6.2 2.1 5.2
Target (Rs.) 74 FY11E 1956.6 3.3 15.9 5.3 3.3 5.9MCap 1227.2 % Upside 42 FY12E 2180.6 7.9 6.5 3.7 7.4 7.6SCI Sales (Rs. Crore) EPS (Rs.) PE (x) EV/EBITDA (x) RoNW (%) RoCE (%)Idirect Code SCI CMP (Rs.) 163 FY10E 3485.6 7.9 20.6 15.7 5.3 5.9
Target (Rs.) 159 FY11E 3590.9 8.5 19.1 14.5 5.6 6.0MCap 6903.1 % Upside -2 FY12E 3738.8 7.3 22.4 11.2 4.7 5.4Varun Shipping Sales (Rs. Crore) EPS (Rs.) PE (x) EV/EBITDA (x) RoNW (%) RoCE (%)Idirect Code VARSHI CMP (Rs.) 49 FY10E 679.5 - - 16.5 - 5.8
Target (Rs.) 40 FY11E 771.8 - - 10.3 - 9.6MCap 735.0 % Upside -18 FY12E 819.0 1.7 29.4 9.4 3.3 10.5Aban Offshore Sales (Rs. Crore) EPS (Rs.) PE (x) EV/EBITDA (x) RoNW (%) RoCE (%)Idirect Code ABALLO CMP (Rs.) 1010 FY10E 3134.9 74.1 13.6 10.3 6.7 8.3
Target (Rs.) 1448 FY11E 4334.7 288.3 3.5 6.9 27.7 11.9MCap 3817.8 % Upside 43 FY12E 4687.7 265.7 3.8 6.1 19.0 12.7
Garware Offshore Sales (Rs. Crore) EPS (Rs.) PE (x) EV/EBITDA (x) RoNW (%) RoCE (%)Idirect Code GARSHI CMP (Rs.) 147 FY10E 232.3 17.4 8.5 9.1 15.4 7.9
Target (Rs.) 182 FY11E 234.7 21.3 6.9 7.8 16.2 9.3MCap 349.9 % Upside 24 FY12E 230.0 21.6 6.8 7.4 14.4 9.2Great Offshore Sales (Rs. Crore) EPS (Rs.) PE (x) EV/EBITDA (x) RoNW (%) RoCE (%)Idirect Code GREOFF CMP (Rs.) 450 FY10E 1172.7 54.7 8.2 6.7 22.1 13.1
Target (Rs.) 468 FY11E 1275.7 49.6 9.1 5.4 17.2 12.2MCap 1669.5 % Upside 4 FY12E 1408.0 69.0 6.5 4.0 19.9 14.5Bharati Shipyard Sales (Rs. Crore) EPS (Rs.) PE (x) EV/EBITDA (x) RoNW (%) RoCE (%)Idirect Code BHASHI CMP (Rs.) 258 FY10E 1349.0 47.4 5.4 8.3 16.0 10.3
Target (Rs.) 345 FY11E 1334.1 55.6 4.6 7.6 10.1 10.1MCap 712.1 % Upside 34 FY12E 1287.2 74.5 3.5 7.4 8.4 9.7
Source: Company, ICICIdirect.com Research
Essar Shipping (ESSSHI)
ICICIdirect.com | Equity Research Page 27
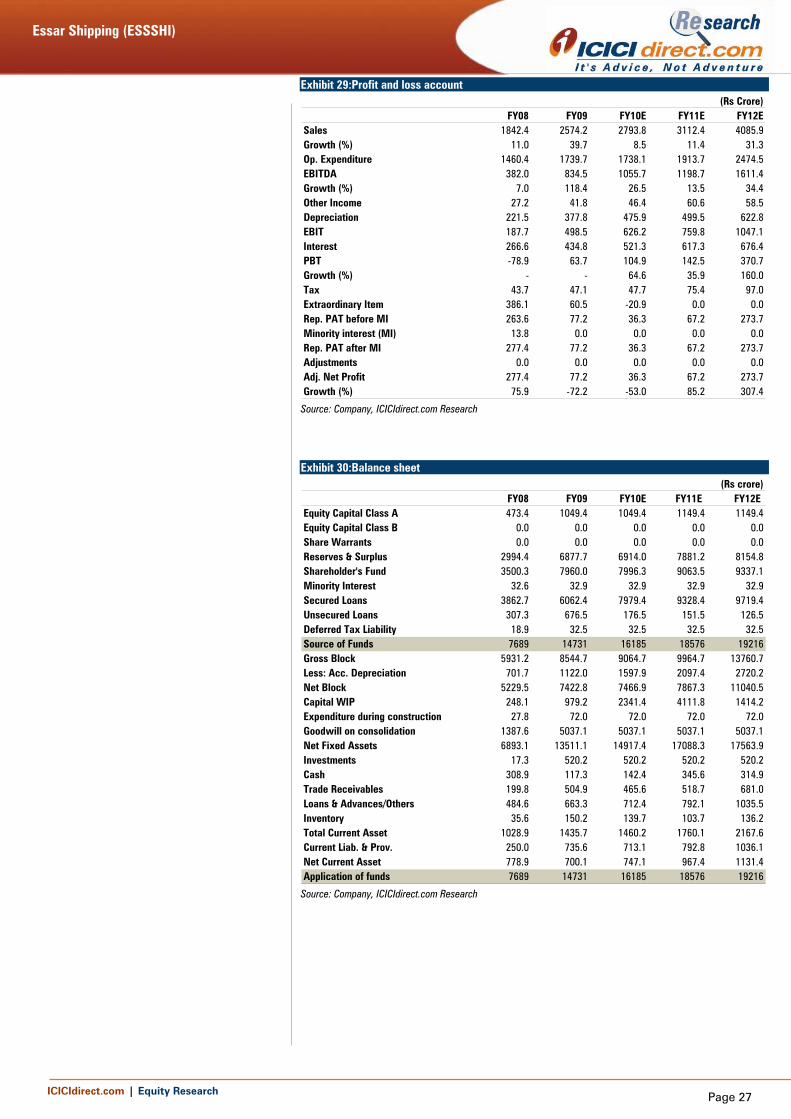
Exhibit 29:Profit and loss account
FY08 FY09 FY10E FY11E FY12ESales 1842.4 2574.2 2793.8 3112.4 4085.9Growth (%) 11.0 39.7 8.5 11.4 31.3Op. Expenditure 1460.4 1739.7 1738.1 1913.7 2474.5EBITDA 382.0 834.5 1055.7 1198.7 1611.4Growth (%) 7.0 118.4 26.5 13.5 34.4Other Income 27.2 41.8 46.4 60.6 58.5Depreciation 221.5 377.8 475.9 499.5 622.8EBIT 187.7 498.5 626.2 759.8 1047.1Interest 266.6 434.8 521.3 617.3 676.4PBT -78.9 63.7 104.9 142.5 370.7Growth (%) - - 64.6 35.9 160.0Tax 43.7 47.1 47.7 75.4 97.0Extraordinary Item 386.1 60.5 -20.9 0.0 0.0Rep. PAT before MI 263.6 77.2 36.3 67.2 273.7Minority interest (MI) 13.8 0.0 0.0 0.0 0.0Rep. PAT after MI 277.4 77.2 36.3 67.2 273.7Adjustments 0.0 0.0 0.0 0.0 0.0Adj. Net Profit 277.4 77.2 36.3 67.2 273.7Growth (%) 75.9 -72.2 -53.0 85.2 307.4
(Rs Crore)
Source: Company, ICICIdirect.com Research
Exhibit 30:Balance sheet
FY08 FY09 FY10E FY11E FY12E Equity Capital Class A 473.4 1049.4 1049.4 1149.4 1149.4Equity Capital Class B 0.0 0.0 0.0 0.0 0.0Share Warrants 0.0 0.0 0.0 0.0 0.0Reserves & Surplus 2994.4 6877.7 6914.0 7881.2 8154.8Shareholder's Fund 3500.3 7960.0 7996.3 9063.5 9337.1Minority Interest 32.6 32.9 32.9 32.9 32.9Secured Loans 3862.7 6062.4 7979.4 9328.4 9719.4Unsecured Loans 307.3 676.5 176.5 151.5 126.5Deferred Tax Liability 18.9 32.5 32.5 32.5 32.5Source of Funds 7689 14731 16185 18576 19216Gross Block 5931.2 8544.7 9064.7 9964.7 13760.7Less: Acc. Depreciation 701.7 1122.0 1597.9 2097.4 2720.2Net Block 5229.5 7422.8 7466.9 7867.3 11040.5Capital WIP 248.1 979.2 2341.4 4111.8 1414.2Expenditure during construction 27.8 72.0 72.0 72.0 72.0Goodwill on consolidation 1387.6 5037.1 5037.1 5037.1 5037.1Net Fixed Assets 6893.1 13511.1 14917.4 17088.3 17563.9Investments 17.3 520.2 520.2 520.2 520.2Cash 308.9 117.3 142.4 345.6 314.9Trade Receivables 199.8 504.9 465.6 518.7 681.0Loans & Advances/Others 484.6 663.3 712.4 792.1 1035.5Inventory 35.6 150.2 139.7 103.7 136.2Total Current Asset 1028.9 1435.7 1460.2 1760.1 2167.6Current Liab. & Prov. 250.0 735.6 713.1 792.8 1036.1Net Current Asset 778.9 700.1 747.1 967.4 1131.4Application of funds 7689 14731 16185 18576 19216
(Rs crore)
Source: Company, ICICIdirect.com Research
Essar Shipping (ESSSHI)
ICICIdirect.com | Equity Research Page 28
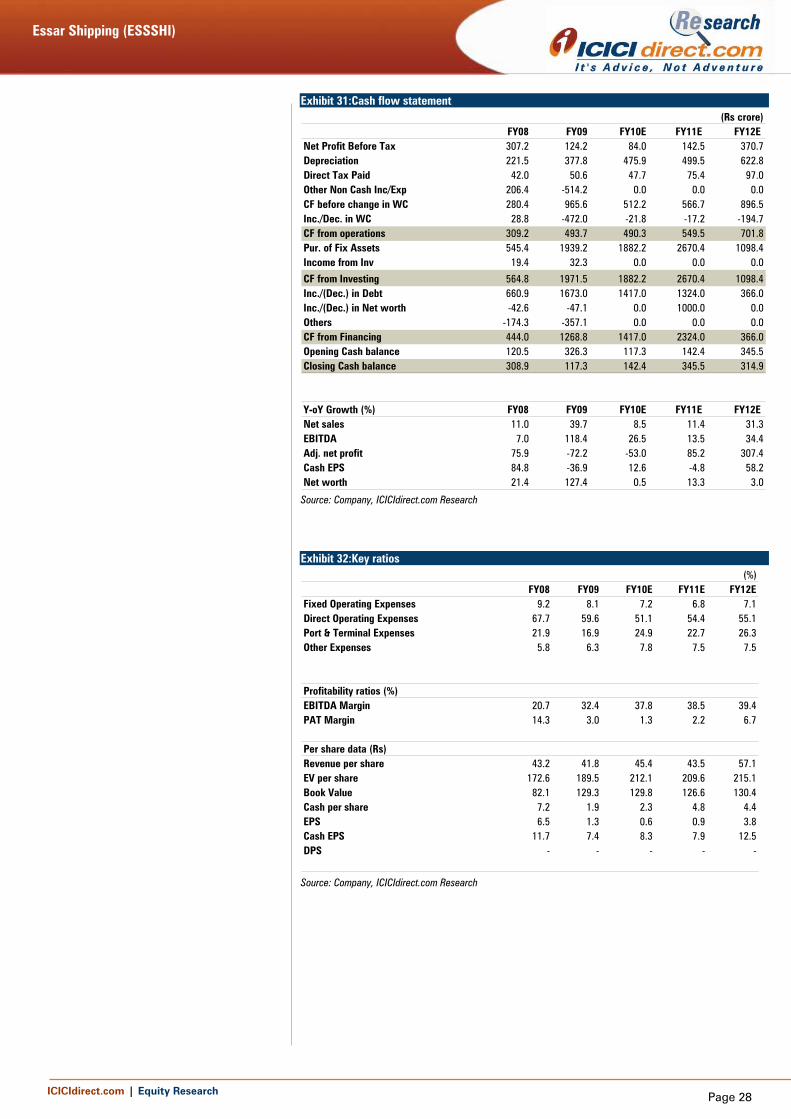
Exhibit 31:Cash flow statement
FY08 FY09 FY10E FY11E FY12E Net Profit Before Tax 307.2 124.2 84.0 142.5 370.7Depreciation 221.5 377.8 475.9 499.5 622.8Direct Tax Paid 42.0 50.6 47.7 75.4 97.0Other Non Cash Inc/Exp 206.4 -514.2 0.0 0.0 0.0CF before change in WC 280.4 965.6 512.2 566.7 896.5Inc./Dec. in WC 28.8 -472.0 -21.8 -17.2 -194.7CF from operations 309.2 493.7 490.3 549.5 701.8Pur. of Fix Assets 545.4 1939.2 1882.2 2670.4 1098.4Income from Inv 19.4 32.3 0.0 0.0 0.0
CF from Investing 564.8 1971.5 1882.2 2670.4 1098.4Inc./(Dec.) in Debt 660.9 1673.0 1417.0 1324.0 366.0Inc./(Dec.) in Net worth -42.6 -47.1 0.0 1000.0 0.0Others -174.3 -357.1 0.0 0.0 0.0CF from Financing 444.0 1268.8 1417.0 2324.0 366.0Opening Cash balance 120.5 326.3 117.3 142.4 345.5Closing Cash balance 308.9 117.3 142.4 345.5 314.9
Y-oY Growth (%) FY08 FY09 FY10E FY11E FY12E Net sales 11.0 39.7 8.5 11.4 31.3EBITDA 7.0 118.4 26.5 13.5 34.4Adj. net profit 75.9 -72.2 -53.0 85.2 307.4Cash EPS 84.8 -36.9 12.6 -4.8 58.2Net worth 21.4 127.4 0.5 13.3 3.0
(Rs crore)
Source: Company, ICICIdirect.com Research
Exhibit 32:Key ratios
(%)FY08 FY09 FY10E FY11E FY12E
Fixed Operating Expenses 9.2 8.1 7.2 6.8 7.1Direct Operating Expenses 67.7 59.6 51.1 54.4 55.1Port & Terminal Expenses 21.9 16.9 24.9 22.7 26.3Other Expenses 5.8 6.3 7.8 7.5 7.5
Profitability ratios (%)EBITDA Margin 20.7 32.4 37.8 38.5 39.4PAT Margin 14.3 3.0 1.3 2.2 6.7
Per share data (Rs)Revenue per share 43.2 41.8 45.4 43.5 57.1EV per share 172.6 189.5 212.1 209.6 215.1Book Value 82.1 129.3 129.8 126.6 130.4Cash per share 7.2 1.9 2.3 4.8 4.4EPS 6.5 1.3 0.6 0.9 3.8Cash EPS 11.7 7.4 8.3 7.9 12.5DPS - - - - -
Source: Company, ICICIdirect.com Research
Essar Shipping (ESSSHI)
ICICIdirect.com | Equity Research Page 29
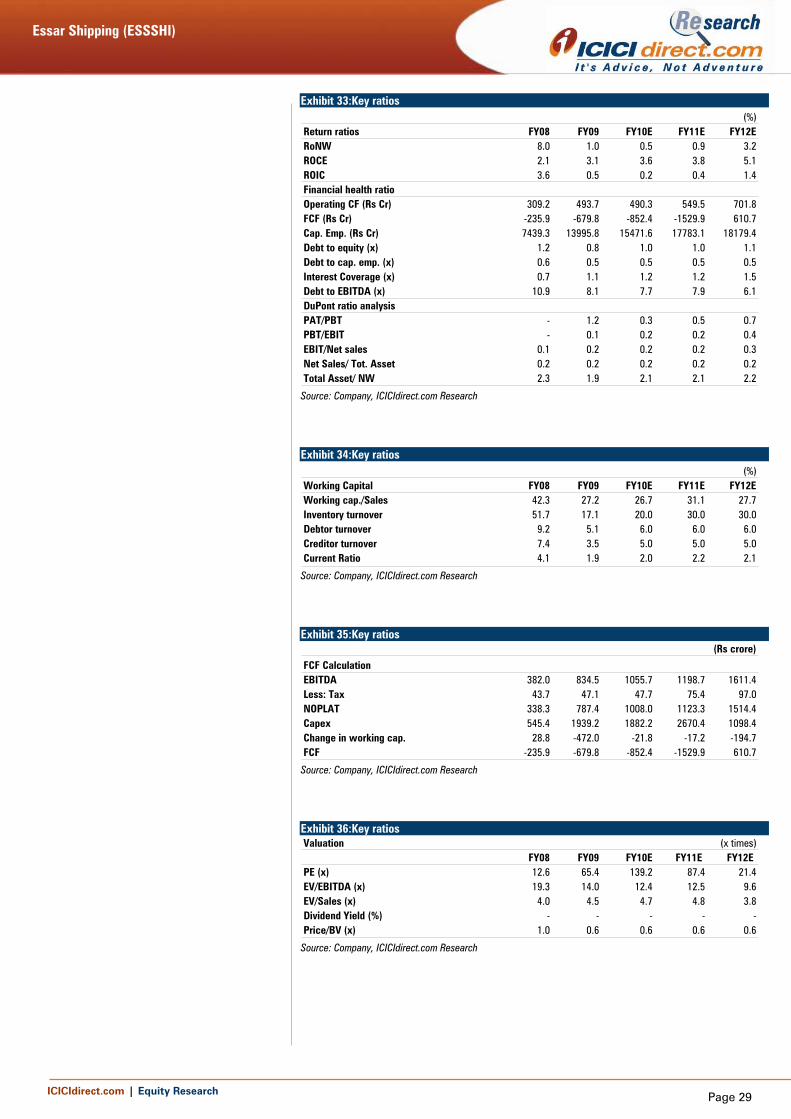
Exhibit 33:Key ratios
(%)Return ratios FY08 FY09 FY10E FY11E FY12ERoNW 8.0 1.0 0.5 0.9 3.2ROCE 2.1 3.1 3.6 3.8 5.1ROIC 3.6 0.5 0.2 0.4 1.4Financial health ratioOperating CF (Rs Cr) 309.2 493.7 490.3 549.5 701.8FCF (Rs Cr) -235.9 -679.8 -852.4 -1529.9 610.7Cap. Emp. (Rs Cr) 7439.3 13995.8 15471.6 17783.1 18179.4Debt to equity (x) 1.2 0.8 1.0 1.0 1.1Debt to cap. emp. (x) 0.6 0.5 0.5 0.5 0.5Interest Coverage (x) 0.7 1.1 1.2 1.2 1.5Debt to EBITDA (x) 10.9 8.1 7.7 7.9 6.1DuPont ratio analysisPAT/PBT - 1.2 0.3 0.5 0.7PBT/EBIT - 0.1 0.2 0.2 0.4EBIT/Net sales 0.1 0.2 0.2 0.2 0.3Net Sales/ Tot. Asset 0.2 0.2 0.2 0.2 0.2Total Asset/ NW 2.3 1.9 2.1 2.1 2.2
Source: Company, ICICIdirect.com Research
Exhibit 34:Key ratios
(%)Working Capital FY08 FY09 FY10E FY11E FY12EWorking cap./Sales 42.3 27.2 26.7 31.1 27.7Inventory turnover 51.7 17.1 20.0 30.0 30.0Debtor turnover 9.2 5.1 6.0 6.0 6.0Creditor turnover 7.4 3.5 5.0 5.0 5.0Current Ratio 4.1 1.9 2.0 2.2 2.1
Source: Company, ICICIdirect.com Research
Exhibit 35:Key ratios
(Rs crore)
FCF CalculationEBITDA 382.0 834.5 1055.7 1198.7 1611.4Less: Tax 43.7 47.1 47.7 75.4 97.0NOPLAT 338.3 787.4 1008.0 1123.3 1514.4Capex 545.4 1939.2 1882.2 2670.4 1098.4Change in working cap. 28.8 -472.0 -21.8 -17.2 -194.7FCF -235.9 -679.8 -852.4 -1529.9 610.7
Source: Company, ICICIdirect.com Research
Exhibit 36:Key ratios Valuation (x times)
FY08 FY09 FY10E FY11E FY12E PE (x) 12.6 65.4 139.2 87.4 21.4EV/EBITDA (x) 19.3 14.0 12.4 12.5 9.6EV/Sales (x) 4.0 4.5 4.7 4.8 3.8Dividend Yield (%) - - - - -Price/BV (x) 1.0 0.6 0.6 0.6 0.6
Source: Company, ICICIdirect.com Research
Essar Shipping (ESSSHI)
ICICIdirect.com | Equity Research Page 30
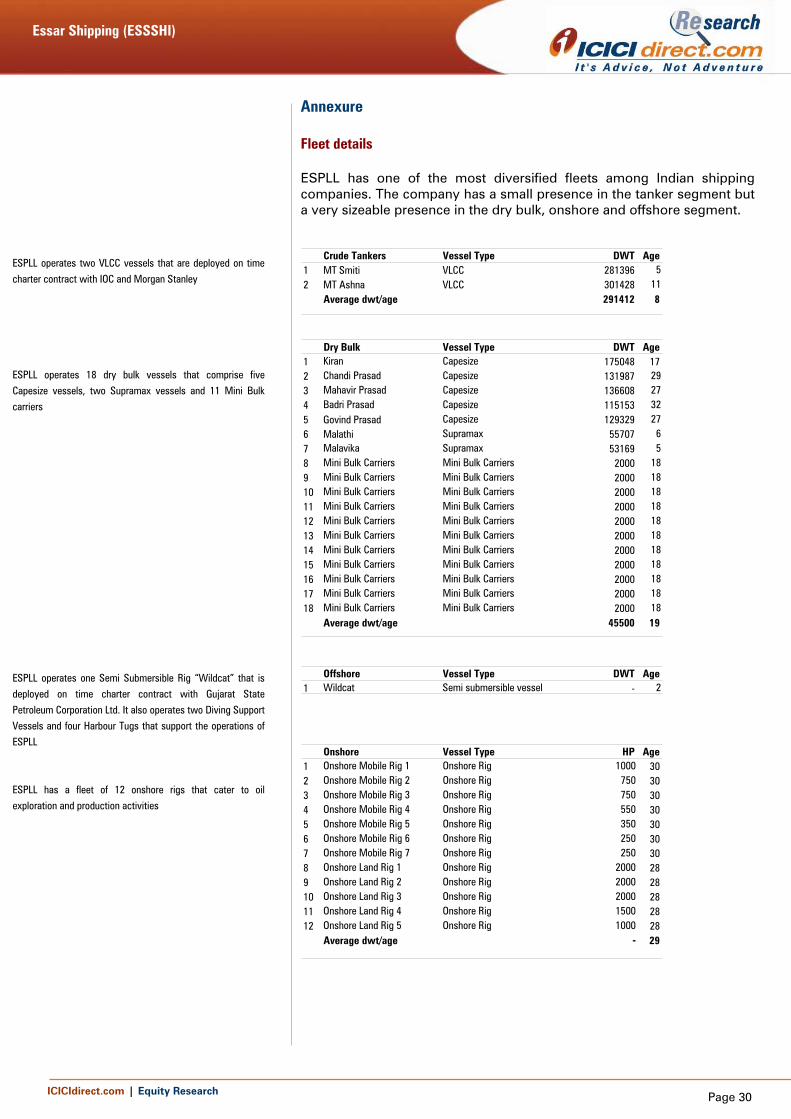
Annexure Fleet details ESPLL has one of the most diversified fleets among Indian shipping companies. The company has a small presence in the tanker segment but a very sizeable presence in the dry bulk, onshore and offshore segment.
Crude Tankers Vessel Type DWT Age1 MT Smiti VLCC 281396 52 MT Ashna VLCC 301428 11
Average dwt/age 291412 8
Dry Bulk Vessel Type DWT Age1 Kiran Capesize 175048 172 Chandi Prasad Capesize 131987 293 Mahavir Prasad Capesize 136608 274 Badri Prasad Capesize 115153 325 Govind Prasad Capesize 129329 276 Malathi Supramax 55707 67 Malavika Supramax 53169 58 Mini Bulk Carriers Mini Bulk Carriers 2000 189 Mini Bulk Carriers Mini Bulk Carriers 2000 1810 Mini Bulk Carriers Mini Bulk Carriers 2000 1811 Mini Bulk Carriers Mini Bulk Carriers 2000 1812 Mini Bulk Carriers Mini Bulk Carriers 2000 1813 Mini Bulk Carriers Mini Bulk Carriers 2000 1814 Mini Bulk Carriers Mini Bulk Carriers 2000 1815 Mini Bulk Carriers Mini Bulk Carriers 2000 1816 Mini Bulk Carriers Mini Bulk Carriers 2000 1817 Mini Bulk Carriers Mini Bulk Carriers 2000 1818 Mini Bulk Carriers Mini Bulk Carriers 2000 18
Average dwt/age 45500 19
Offshore Vessel Type DWT Age1 Wildcat Semi submersible vessel - 2
Onshore Vessel Type HP Age1 Onshore Mobile Rig 1 Onshore Rig 1000 302 Onshore Mobile Rig 2 Onshore Rig 750 303 Onshore Mobile Rig 3 Onshore Rig 750 304 Onshore Mobile Rig 4 Onshore Rig 550 305 Onshore Mobile Rig 5 Onshore Rig 350 306 Onshore Mobile Rig 6 Onshore Rig 250 307 Onshore Mobile Rig 7 Onshore Rig 250 308 Onshore Land Rig 1 Onshore Rig 2000 289 Onshore Land Rig 2 Onshore Rig 2000 2810 Onshore Land Rig 3 Onshore Rig 2000 2811 Onshore Land Rig 4 Onshore Rig 1500 2812 Onshore Land Rig 5 Onshore Rig 1000 28
Average dwt/age - 29
ESPLL operates two VLCC vessels that are deployed on time charter contract with IOC and Morgan Stanley ESPLL operates 18 dry bulk vessels that comprise five Capesize vessels, two Supramax vessels and 11 Mini Bulk carriers ESPLL operates one Semi Submersible Rig “Wildcat” that is deployed on time charter contract with Gujarat State Petroleum Corporation Ltd. It also operates two Diving Support Vessels and four Harbour Tugs that support the operations of ESPLL ESPLL has a fleet of 12 onshore rigs that cater to oil exploration and production activities
Essar Shipping (ESSSHI)
ICICIdirect.com | Equity Research Page 31
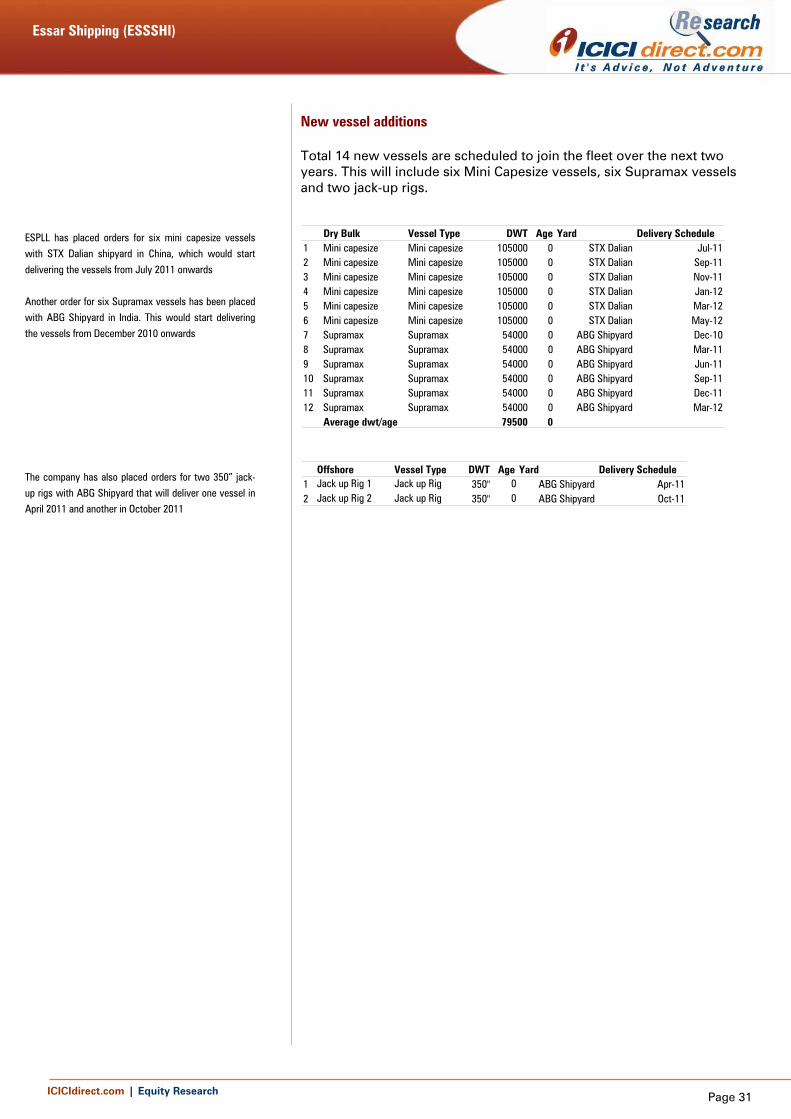
New vessel additions Total 14 new vessels are scheduled to join the fleet over the next two years. This will include six Mini Capesize vessels, six Supramax vessels and two jack-up rigs.
Dry Bulk Vessel Type DWT Age Yard Delivery Schedule1 Mini capesize Mini capesize 105000 0 STX Dalian Jul-112 Mini capesize Mini capesize 105000 0 STX Dalian Sep-113 Mini capesize Mini capesize 105000 0 STX Dalian Nov-114 Mini capesize Mini capesize 105000 0 STX Dalian Jan-125 Mini capesize Mini capesize 105000 0 STX Dalian Mar-126 Mini capesize Mini capesize 105000 0 STX Dalian May-127 Supramax Supramax 54000 0 ABG Shipyard Dec-108 Supramax Supramax 54000 0 ABG Shipyard Mar-119 Supramax Supramax 54000 0 ABG Shipyard Jun-1110 Supramax Supramax 54000 0 ABG Shipyard Sep-1111 Supramax Supramax 54000 0 ABG Shipyard Dec-1112 Supramax Supramax 54000 0 ABG Shipyard Mar-12
Average dwt/age 79500 0
Offshore Vessel Type DWT Age Yard Delivery Schedule1 Jack up Rig 1 Jack up Rig 350" 0 ABG Shipyard Apr-112 Jack up Rig 2 Jack up Rig 350" 0 ABG Shipyard Oct-11
ESPLL has placed orders for six mini capesize vessels with STX Dalian shipyard in China, which would start delivering the vessels from July 2011 onwards Another order for six Supramax vessels has been placed with ABG Shipyard in India. This would start delivering the vessels from December 2010 onwards The company has also placed orders for two 350” jack-up rigs with ABG Shipyard that will deliver one vessel in April 2011 and another in October 2011
Essar Shipping (ESSSHI)
ICICIdirect.com | Equity Research Page 32
RATING RATIONALE ICICIdirect.com endeavours to provide objective opinions and recommendations. ICICIdirect.com assigns ratings to its stocks according to their notional target price vs. current market price and then categorises them as Strong Buy, Buy, Add, Reduce, and Sell. The performance horizon is two years unless specified and the notional target price is defined as the analysts' valuation for a stock. Strong Buy: 20% or more; Buy: Between 10% and 20%; Add: Up to 10%; Reduce: Up to -10% Sell: -10% or more;
Pankaj Pandey Head – Research [email protected]
ICICIdirect.com Research Desk, ICICI Securities Limited, 7th Floor, Akruti Centre Point, MIDC Main Road, Marol Naka, Andheri (East) Mumbai – 400 093
[email protected] ANALYST CERTIFICATION We /I, Bharat Chhoda MBA, Jehangir Master ACA, Prerna Jhunjhunwala MBA, research analysts, authors and the names subscribed to this report, hereby certify that all of the views expressed in this research report accurately reflect our personal views about any and all of the subject issuer(s) or securities. We also certify that no part of our compensation was, is, or will be directly or indirectly related to the specific recommendation(s) or view(s) in this report. Analysts aren't registered as research analysts by FINRA and might not be an associated person of the ICICI Securities Inc.
Disclosures: ICICI Securities Limited (ICICI Securities) and its affiliates are a full-service, integrated investment banking, investment management and brokerage and financing group. We along with affiliates are leading underwriter of securities and participate in virtually all securities trading markets in India. We and our affiliates have investment banking and other business relationship with a significant percentage of companies covered by our Investment Research Department. Our research professionals provide important input into our investment banking and other business selection processes. ICICI Securities generally prohibits its analysts, persons reporting to analysts and their dependent family members from maintaining a financial interest in the securities or derivatives of any companies that the analysts cover.
The information and opinions in this report have been prepared by ICICI Securities and are subject to change without any notice. The report and information contained herein is strictly confidential and meant solely for the selected recipient and may not be altered in any way, transmitted to, copied or distributed, in part or in whole, to any other person or to the media or reproduced in any form, without prior written consent of ICICI Securities. While we would endeavour to update the information herein on reasonable basis, ICICI Securities, its subsidiaries and associated companies, their directors and employees (“ICICI Securities and affiliates”) are under no obligation to update or keep the information current. Also, there may be regulatory, compliance or other reasons that may prevent ICICI Securities from doing so. Non-rated securities indicate that rating on a particular security has been suspended temporarily and such suspension is in compliance with applicable regulations and/or ICICI Securities policies, in circumstances where ICICI Securities is acting in an advisory capacity to this company, or in certain other circumstances.
This report is based on information obtained from public sources and sources believed to be reliable, but no independent verification has been made nor is its accuracy or completeness guaranteed. This report and information herein is solely for informational purpose and may not be used or considered as an offer document or solicitation of offer to buy or sell or subscribe for securities or other financial instruments. Though disseminated to all the customers simultaneously, not all customers may receive this report at the same time. ICICI Securities will not treat recipients as customers by virtue of their receiving this report. Nothing in this report constitutes investment, legal, accounting and tax advice or a representation that any investment or strategy is suitable or appropriate to your specific circumstances. The securities discussed and opinions expressed in this report may not be suitable for all investors, who must make their own investment decisions, based on their own investment objectives, financial positions and needs of specific recipient. This may not be taken in substitution for the exercise of independent judgment by any recipient. The recipient should independently evaluate the investment risks. The value and return of investment may vary because of changes in interest rates, foreign exchange rates or any other reason. ICICI Securities and affiliates accept no liabilities for any loss or damage of any kind arising out of the use of this report. Past performance is not necessarily a guide to future performance. Investors are advised to see Risk Disclosure Document to understand the risks associated before investing in the securities markets. Actual results may differ materially from those set forth in projections. Forward-looking statements are not predictions and may be subject to change without notice.
ICICI Securities and its affiliates might have managed or co-managed a public offering for the subject company in the preceding twelve months. ICICI Securities and affiliates might have received compensation from the companies mentioned in the report during the period preceding twelve months from the date of this report for services in respect of public offerings, corporate finance, investment banking or other advisory services in a merger or specific transaction. ICICI Securities and affiliates expect to receive compensation from the companies mentioned in the report within a period of three months following the date of publication of the research report for services in respect of public offerings, corporate finance, investment banking or other advisory services in a merger or specific transaction. It is confirmed that Bharat Chhoda MBA, Jehangir Master ACA, Prerna Jhunjhunwala MBA, research analysts and the authors of this report have not received any compensation from the companies mentioned in the report in the preceding twelve months. Our research professionals are paid in part based on the profitability of ICICI Securities, which include earnings from Investment Banking and other business.
ICICI Securities or its subsidiaries collectively do not own 1% or more of the equity securities of the Company mentioned in the report as of the last day of the month preceding the publication of the research report.
It is confirmed that Bharat Chhoda MBA, Jehangir Master ACA, Prerna Jhunjhunwala MBA, research analysts and the authors of this report or any of their family members does not serve as an officer, director or advisory board member of the companies mentioned in the report.
ICICI Securities may have issued other reports that are inconsistent with and reach different conclusion from the information presented in this report. ICICI Securities and affiliates may act upon or make use of information contained in the report prior to the publication thereof.
This report is not directed or intended for distribution to, or use by, any person or entity who is a citizen or resident of or located in any locality, state, country or other jurisdiction, where such distribution, publication, availability or use would be contrary to law, regulation or which would subject ICICI Securities and affiliates to any registration or licensing requirement within such jurisdiction. The securities described herein may or may not be eligible for sale in all jurisdictions or to certain category of investors. Persons in whose possession this document may come are required to inform themselves of and to observe such restriction.