Embed Size (px)
DESCRIPTION
The Lawrence Chamber of Commerce
Citation preview
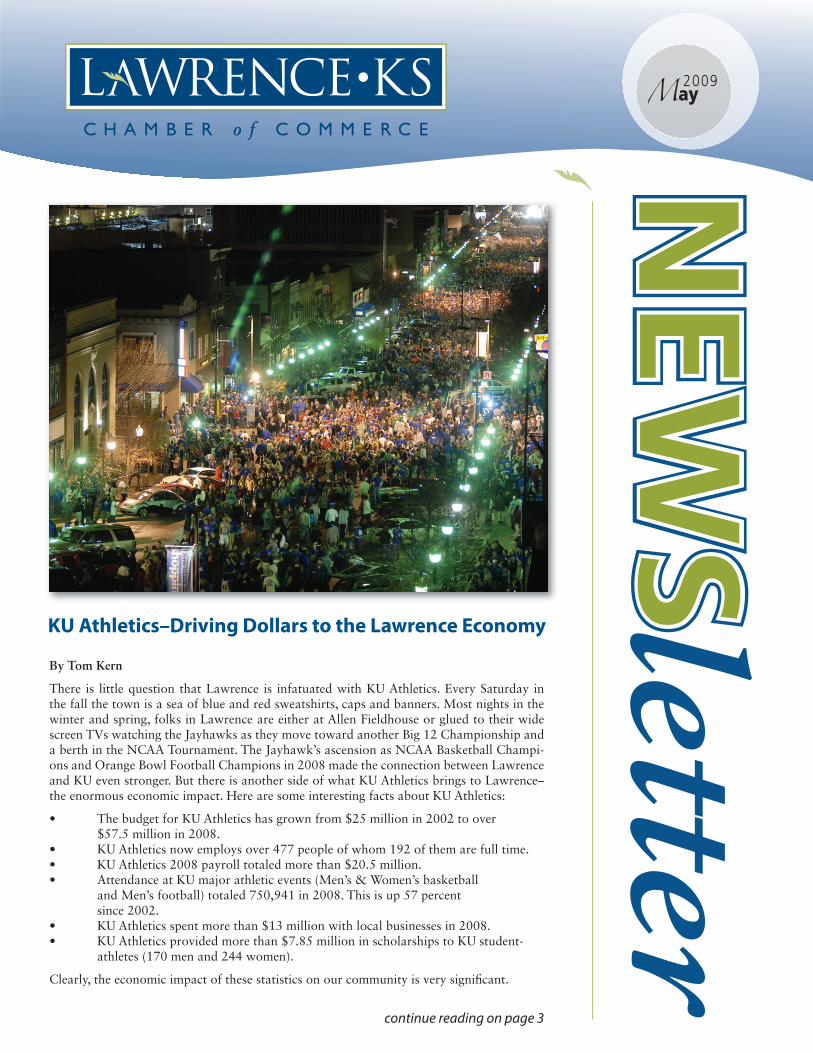
KU Athletics–Driving Dollars to the Lawrence Economy
May2009
By Tom Kern
There is little question that Lawrence is infatuated with KU Athletics. Every Saturday in the fall the town is a sea of blue and red sweatshirts, caps and banners. Most nights in the winter and spring, folks in Lawrence are either at Allen Fieldhouse or glued to their wide screen TVs watching the Jayhawks as they move toward another Big 12 Championship and a berth in the NCAA Tournament. The Jayhawk’s ascension as NCAA Basketball Champi-ons and Orange Bowl Football Champions in 2008 made the connection between Lawrence and KU even stronger. But there is another side of what KU Athletics brings to Lawrence–the enormous economic impact. Here are some interesting facts about KU Athletics:
• ThebudgetforKUAthleticshasgrownfrom$25millionin2002toover $57.5millionin2008.• KUAthleticsnowemploysover477peopleofwhom192ofthemarefulltime.• KUAthletics2008payrolltotaledmorethan$20.5million.• AttendanceatKUmajorathleticevents(Men’s&Women’sbasketball andMen’sfootball)totaled750,941in2008.Thisisup57percent since 2002.• KUAthleticsspentmorethan$13millionwithlocalbusinessesin2008.• KUAthleticsprovidedmorethan$7.85millioninscholarshipstoKUstudent- athletes(170menand244women).
Clearly, the economic impact of these statistics on our community is very signifi cant.
continue reading on page 3

Lawrence Kansas Chamber of Commerce • 734 Vermont, Ste. 101 • Lawrence, KS 66044
2
• CONSTRUCTIONOFTHENEWSCHOOLOFPHARMACYBUILDINGONTHEWESTCAMPUS
Thisprojectisnowscheduledtocommencecon-structionin2009.Itisa$50millionfacilitythatwill, along with the construction of the Bioscience Incubator,generatehundredsofjobsforlocalandregional architectural, engineering and construc-tion firms.
So, even though the economic news on the nation-al, state and local level is still not the best, there continues to be some positive economic news for Lawrence. KU continues to be the stabilizing eco-nomic force in the Lawrence economy generating bothnewjobsandsignificanteconomicimpacttothe region.
T H E P R E S I D E N T ’ S M E S S A G E
As you will note from the lead article on KU Ath-letics, much of the recent news that affects the Lawrence business community is being driven by activities from the University of Kansas.
The University of Kansas continues to be the en-gine that drives the economy of Lawrence. Even in the present economic environment KU continues to push forward on a number of initiatives that will have a significant economic impact on Lawrence. Those initiatives include:
• CONSTRUCTIONOFTHE$7.25MIL-LIONKUBIOSCIENCEINCUBATOR
ThisprojectisthecriticalfirststepinmakingLaw-rence and KU a state of the art bioscience research and development destination. This incubator will provide a home for the companies that are created out of KU’s bioscience research and should even-tually lead to the development and location of a number of bioscience firms here in Lawrence.
• NATIONALCANCERRESEARCHCENTERDESIGNATION
KU, with assist from a number of organizations, including KBA, continues to move toward in ob-taining this critical designation. Once received, it will dramatically increase the number and amount of research dollars that come to KU. More research dollarsmeansmoreresearchjobsfortheLawrencecampus, which translates into more dollars being circulated into the local economy.
Tom Kern President&
CEO
The Lawrence Education Achievement Partners (LEAP)program is in its16thyearof tapping lo-cal resources to benefit students in the Lawrence Public Schools. The LEAP program’s mission is to create and foster effective community partnerships that support and enrich student achievement and success.
Help LEAP Support and Enrich Student Achievement and Success
BeginningasajointeffortbetweentheLawrenceChamber of Commerce and the school district in 1993, the program currently includes 108 localbusinesses and organizations actively providing volunteers, mentors, in-kind support, and finan-cial contributions to the 22 public schools in Law-rence.
These relationships are extremely beneficial to the students and teachers, as well as to the partners andtheiremployees.Duringthe2007-2008schoolyear,partnersprovidedsupportofover$360,000to the district. The Lawrence Public Schools need LEAP partners more than ever due to the econ-omy and pending state budget cuts. If anyoneis interested in becoming a LEAP partner, please contact LEAP staff at (785) 330-2434 and visit www.leapforlawrence.org.

2009
785.865.4411 • lawrencechamber.com
3
KU Athletics–Driving Dollars to the Lawrence Economy
ECONOMIC DE VELOPMENT
Continued from page 1
• Themajorityofthe477peoplewhoworkforKUAthletics live in Lawrence.
Their $20.5millionpayroll is primarily spent here inLaw-rence on goods and services provided by Lawrence-based businesses. Full-time employees buy homes in Lawrence. Part-timeemployees(mostlystudents)rentapartments.
• Spectators atKUathletic events fill ourdowntownand area restaurants and bars on game days and purchase goods and services from our retailers. The economic impact of those spectators is signifi cant to the bottom line of many Lawrence businesses. These spectators also generate signifi -cant sales tax revenues, which help to support city and county services and programs.
• The $7.85 million that KU Athletics provides inscholarships for student athletes also has an economic impact on Lawrence. Most of these student live off campus and spend themajorityoftheirincomesatLawrencebusinesses.
• The$13millionthatKUAthleticsspendsinthelocalLawrenceeconomydirectlyimpactsover250Lawrencebusi-nesses.Itincludesexpensesfortravelservicesandhotels,in-surance, professional services, catering/banquet services, city/county services, medical services, printing/graphics, advertis-ing/promotion services, trophies/plaques, sporting goods, con-cession services, offi ce supplies and a list of numerous other goods and services.
Whenyou take intoaccountall these facts, therecanbenoargument that the economic impact to Lawrence from the KU Athleticprogramissubstantial.Fromthepayrollandjobsitputs into the local economy, to the spectators its events gener-ate, to the sales tax revenue it generates, to the dollars it ex-pends with Lawrence businesses, its impact is felt everywhere.
Next time you are sitting in traffi c after a KU football game, or you are frustrated because you can’t get your favorite seat atadowntownrestaurant,justrememberthebigpicture–KUAthleticshasamajorpositiveeconomicimpactonLawrence.One that is surely worth sitting through a traffi c light or two.
Help Our Youth AchieveWork Experience!
The Lawrence Chamber of Com-merce would like to introduce you to a new and wonderful program–HeartlandWorksSummerYouthPro-gram 2009.Designed byHeartlandWorksInc.,theprogramwillprovideapproximately350areayouth,ages14-24,theopportunitytobeplacedin a paid work environment or in-ternship, wherein each will obtain a safe and meaningful work experience in any given work environment.
Heartland Works, Inc. would liketo collaborate with other non-profi t organizations, businesses, communi-ty-based organizations, faith-based organizations and educational insti-tutions in establishing quality work sites sometime between June 1 and Sept.25,2009.Worksiteswillplayan important role in supervising and mentoring youth to infl uence them in a positive way for continued success beyond the work experience. Special consideration will be given to high-growth/high-demand industries and “green”jobswhereavailable.
If yourorganization is interested inparticipating in this mutually benefi -cial opportunity and would like to apply as a work site or simply ob-tain further information, please visit, www.heartlandworks.org or contact Jennifer Jessee atHeartlandWorks,Inc., 234-0500, 506-1545 (cell),email:[email protected].
C L I C K O N T H E L I N K B E L O W T O V I E W
Economic Barometer Report
May
Fourth Quarter 2008

Lawrence Kansas Chamber of Commerce • 734 Vermont, Ste. 101 • Lawrence, KS 66044
4
UPCOMING E VENTS
The Lawrence Chamber of Commerce invites you to one of their fun and effective networking events to take place at the Bowersock Mills and Power Company.
Join the Chamber and its members at the Bower-sock Powerhouse for drinks, hors d’oeuvres, and a tour of the facility. Take advantage of this oppor-tunity to get to know different community busi-nesses and their leaders, visit the oldest renewable energy generator in the state of Kansas and enjoyanafternoonat the river. If it rains, the eventwilltake place inside the warehouse, so please join us!
Bowersock encourages guests to park in the public parking lot on the south side of 6th Street acrossfrom City Hall or in the Public Parking Sectors of the Spring Hill Suites Parking structure. From City Hall, walk north on the Massachusetts Street Bridge past City Hall. Just past City Hall, descend the wooden stairway, and walk east towards the Pow-erhouse. Wewill gather in the park,which is justwest of the Powerhouse and overlooks the fl ume. Guests with concerns regarding walking, shouldcontacttheBowersockofficeat843-1385fordirec-tions on where and how to park closer to the plant.
The Bowersock Mills and Power Company is proud to have been generating clean, renewable energy in Lawrencesince1874.Withpotentialforexpansion,Bowersock represents both the history and future of energy and economic development for Kansas.
Renew Your Energy ... Invigorate Your BusinessBusiness After Hours, 5 p.m., Wednesday, May 6, The Bowersock Mills and Power Company, 546 Mass. St., the event is FREE of charge.
RAIN DATE: MAY 15TH
GOLF TOURNAMENT 2009
ALVAMAR GOLF COURSE11:30 a.m.
SIGN UP FOR 2009 START HERE GOLF TOURNAMENT – THE LAWRENCE
CHAMBER’S GREATEST TRADITION!
PLEASE REMEMBER TO REGISTER BY TUESDAY, MAY 5.
CLICK HERE TO PRINT YOUR REGISTRATION FORM.
T H E R E I S S T I L L T I M E !
DIRECTIONS & PARKING
ABOUT THE HOST
An Invitation to Grow Your BusinessThe Lawrence Chamber of Commerce together with KU Small BusinessDevelopmentCenter (KU-SBDC)and the Foundation for the Advancement of Market-ingExcellenceinEntrepreneurs(FAMEE)wouldliketoinviteyoufora6-monthprogramtohelpyougrowyour business by using the “Customer Pillars,” book and workbook.
8:30-10:30a.m.,everyotherMonday,May4–Nov.2
KU-SBDC,734Vermont,Ste.104
$40/meeting, RSVP toMaggie Bornholdt, [email protected].
WHEN
WHERE
HOW

785.865.4411 • lawrencechamber.com
5
2009
PIECE Project
Sue HackExecutive Director of Leadership Lawrence
FromLeft:BeckyCheek-King,JandiSmith,KristyWempeandLloydHetrickare getting ready to take a fl ight over the city and county.
The Leadership Lawrence Class participated in itsFinalRetreatonThursday,April16. Theday started at the Lawrence Municipal Airport withagreetingfromRickBryant,formerchairof theAviationAdvisory Board. Due to thegenerosity of several local pilots, class mem-bers were able to take fl ights over the city and county. Following the fl ights, the class heard a presentation about ECO2 and then traveled toFireStation#5fortheafternoon.Theclassreceived information about the Smart Code, thePIECEProjectandtookpartinastrategicplanning exercise with Lawrence as the topic.
Lunch was provided by 23rd Street Brewery and the program sponsor for Leadership Law-rence is Capitol Federal Savings.
LEADERSHIP L AWRENCE
On April 8, the PIECE Class participate inBusinessDay.Thepurposeofthedaywastoenhance what the class had learned on Eco-nomic Development Day by having the stu-dents meet with business people from various aspects of our community. And based on infor-mation they received, develop a concept for a business plan with fi nancial information and a marketing strategy. Students met with Am-berNickellwithPawshWash,GlynnSheridanwith Sunfl ower Bank, Sarah McKinley with SauerDanfossandMattLlewellynwith23rdStreet Brewery.
Lunch was provided by Marisco’s and the pro-gramsponsorforPIECEisSunfl ower Bank.
555
Leadership Lawrence
NickiSnodgrass(left)andKaleJoycepresentingtheirteam’sbusinessplanthey had to develop based on what they’ve learned during the Economic DevelopmentDay.
LeadershipLawrenceClassof2009haslaunchedacharitableanddynamicclassproject,calledtheLawrenceVirtualFoodDrive.Thisprojectisaquickandeasywaytopurchasecriticallyneededitemsatsubstantiallydiscountedpricesforlocalpantries.Itisextremelyeasyandfun,justclickhere.Remember,itonlytakesafewclickstohelppreventhun-gerintheLawrencecommunity!
Whilemanygenerousdonorshelpthesepantrieswiththeircontributionsofnon-perishablefoods,thereisagrowingneed to supply pantries with donations to purchase the most nourishing and critical foods.
TheLawrenceVirtualFoodDriveaimstofillthisneedbyofferingyouaquickandeasywaytoe-purchasecriticallyneeded items. Because the pantries can buy items for pennies on the dollar from the Harvesters Food Bank in Kansas City,everydollaryoudonatecanpurchaseasmuchas$5worthofdistributeditems.
Thepantriesarestrugglingtokeepupwithdemand,soweneedyourhelp!
Help Local Pantries with Just a Couple of Clicks
May
Lawrence Kansas Chamber of Commerce • 734 Vermont, Ste. 101 • Lawrence, KS 66044
6
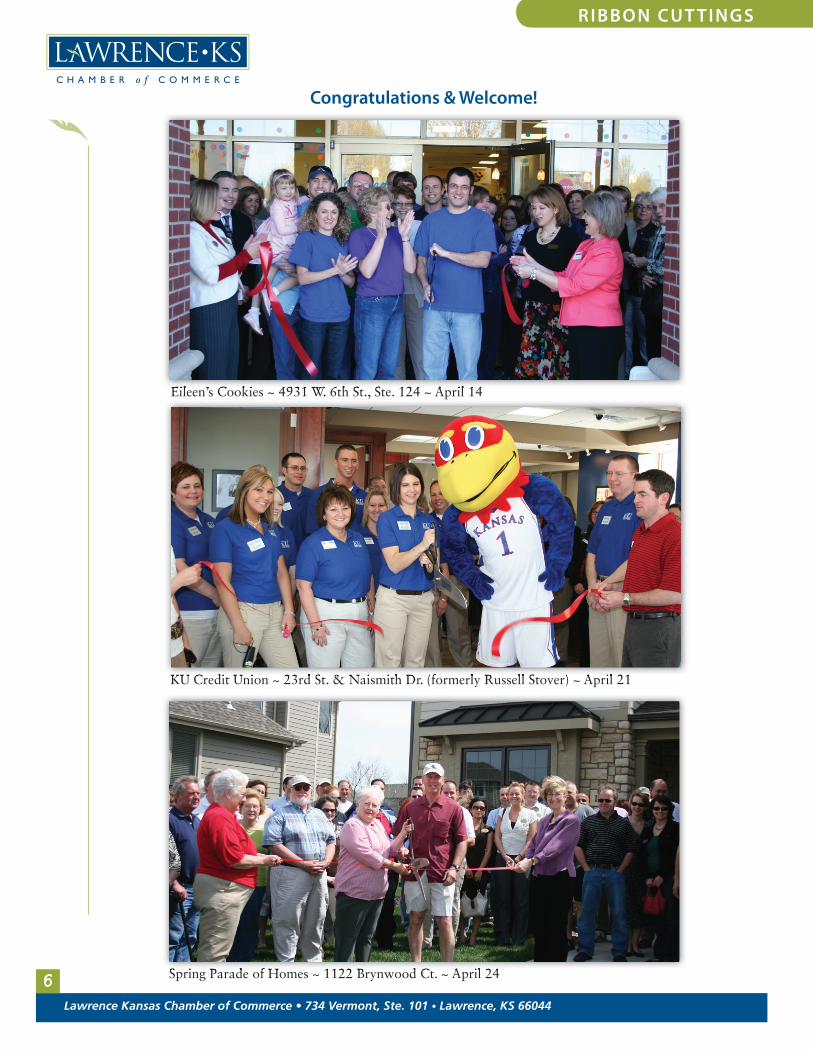
Congratulations & Welcome!
Eileen’sCookies~4931W.6thSt.,Ste.124~April14
KUCreditUnion~23rdSt.&NaismithDr.(formerlyRussellStover)~April21
Eileen’sCookies~4931W.6thSt.,Ste.124~April14
KUCreditUnion~23rdSt.&NaismithDr.(formerlyRussellStover)~April21
SpringParadeofHomes~1122BrynwoodCt.~April24SpringParadeofHomes~1122BrynwoodCt.~April24
RIBBON CUT TINGS

785.865.4411 • lawrencechamber.com
7
DID YOU
The employees of Berry Plastics are in the process of growing a produce garden at their site.
They initiated the “Berry Grow Green Team” to tiein directly with the similar Chamber Task Force.
All produce grown will be consumed during one of their summer cookouts in-volving all employees.
This is one of many “fun” activities at Berry Plastics.
2009
I Global Network DiversityConsulting&Leadership 10E.9thSt. Lawrence,KS66044 Phone:785-856-8053 Fax:866-465-3035 www.thei-globalnetwork.com Bruce Stewart [email protected]
Al Vidricksen Individuals 2016SW4thSt. Lee’sSummit,MO64081 Phone:816-524-6191 Fax:816-524-6191 [email protected]
The Exchange @ Lawrence Apartments 3100Ousdale Lawrence,KS66046 Phone:785-842-3336 Fax:785-842-3362 www.notthedorm.com Kelli Scheuerman [email protected]
Fineline Vespa/Aprilin MotorcycleDealer 1502W.23rdSt. Lawrence,KS66046 Phone:785-841-0927 Fax:785-727-4130 www.vespalawrence.com Jae Landreth [email protected]
Lawrence–Douglas County Biosciences Authority Bio Sciences/Technology 1617SaintAndrewsDr. Lawrence,KS66047 Phone:785-856-2676 Fax:785-832-8234 www.ldcba.org E. LaVerne Epp [email protected]
McCownGordon Construction Contractors – Construction 422AdmiralBlvd. KansasCity,MO64106 Phone:816-960-1111 Fax:816-960-1182 www.mccowngordon.com Moira Holland [email protected]
Set ‘Em Up Jacks Restaurants 1800E.23rdSt.,Ste.G Lawrence,KS66046 Phone:785-832-2030 Fax:785-832-2064 www.setemupjacks.com DanielKoehn [email protected]
Western International Inc. BookDistributing 2220DelawareSt. Lawrence,KS66046 Phone:785-856-1840 Fax:785-856-1845 www.yourbooksource.com Todd Stauffer [email protected]
Westridge Wash & Lube Automobile Maintenance 3530W.6thSt. Lawrence,KS66049 Phone:785-842-7406 Fax:785-856-5342 DonGreenfield [email protected]
MEMBERSHIP
The Lawrence Chamber of Commerce advocates for business and community prosperity as it creates diverse jobs; cultivates a successful business environment; develops active community leaders; and promotes the assets of Lawrence and Douglas County.
W E L C O M E N E W M E M B E R S
KNOW?
May

734Vermont,Suite101 Lawrence,KS66044
Tom Kern,President&CEO [email protected]
Cathy Lewis,IOM Vice President of Membership [email protected]
Beth Johnson, Vice President of EconomicDevelopment [email protected]
Sue Hack,ExecutiveDirector Leadership Lawrence [email protected]
Hank Booth,Government& CommunityAffairsDirector [email protected]
Natasha Buller,Marketing& Communications Manager [email protected]
Christy Bogner, Accountant/ Office Operations [email protected]
Adam Handshy,Project&ProgramCoordinator [email protected]
J. Taylor, Administrative Assistant [email protected]
OFFICERSChair Bonnie LowePast-Chair Jim Otten, DDSIncomingChairMatt Hoy, Stevens&BrandTreasurer Cindy Yulich, Emprise BankSecretary&President/CEOTom Kern
PERMANENT POSITIONSRobert Hemenway, KU ChancellorDr. Linda Sue Warner,HaskellIndian Nations University PresidentRandy Weseman,USD497 Superintendent
BOARD MEMBERSAllison Vance Moore,Grubb&Ellis| TheWinburyGroup,ViceChairof Chamber Member ServicesBill Fuerst, KU School of Business Bobbie Flory, Lawrence Home Builders Association Bradley Burnside, U.S Bank David Johnson, Bert Nash, Co-Vice Chair ofGovernment&CommunityAffairsDavid Livingood, Treanor Architects Debra Vignatelli Konzem,AT&T
Doug Gaumer,INTRUSTBank, Vice Chair of Chamber OperationsGary Bennett, Laird Noller Automotive,Inc. Jane Bateman,JaneBateman,TheInteriors Store,Co-ViceChairofGovernment &CommunityAffairsJohn Ross,LaserLogic,Inc.Kathy Pryor,KUTheatre&Film, Vice Chair of Leadership Lawrence &StrategicPlanning Larissa Long, Black Hills Energy, Co-Vice Chair of CommunicationsLinda Robinson,KUCenterforResearch on LearningMike McGrew,McGrewRealEstate, ViceChairofEconomicDevelopmentRodger Henry, Lawrence Medical PlazaShannon Frost,HallmarkCards,Inc. Steve Brown, Berry PlasticsSteve Schwada, Meadowbrook Apartments, Venture Properties Terry Campbell, Barber Emerson, L.C., Co-Vice Chair of CommunicationsTodd Thompson,Thompson,Ramsdell &Qualseth,P.A. Trudy Rice,RiceEnterprises
Phone number: (785) 865-4411
STAFFBOARD OF DIRECTORS

The Economic Barometer A Quarterly Economic Report Produced: March 31, 2009 4th Quarter 2008
IN THIS ISSUE PAGE Editor’s Note 1 Summary 1 Employment 2 Real Estate 3 - 4 Retail Sales 5 Inflation and the Cost of Living 6 Focus On…. Tourism and Downtown 7 - 8
EDITOR’S NOTE This issue marks the first issue of the Economic Barometer Report produced by the City
of Lawrence. We will continue to provide timely economic information on the City of Lawrence
and Douglas County, but we will do so in a new layout format that we hope our readers will
enjoy.
First, in each issue we’ll have a table of contents so that people who are interested in a
certain subject will know where to find that material. Second, there will be a summary at the very
beginning for those who just want a synopsis. We have placed a greater emphasis on text for
those readers who prefer narrative over charts. Finally, there will now be a “Focus On” section
at the end of the report. Once a year, highlight a certain aspect of the Lawrence economy. In the
4th Quarter, for example, we will spotlight Tourism and Downtown in Lawrence.
We hope you enjoy the new Report, and we welcome any feedback you might have. If
there’s any information you think should be added or you have suggestions on how to improve the
layout, we’d be glad to hear from you. Thanks, and enjoy!
SUMMARY
• Key Changes from the Third Quarter: Employment (down), Building Permits (down), Home Values (up), Taxable Retail Sales (up), Inflation (down)
• The unemployment rate increased to 4% in Douglas County, nearly 20% higher than a year ago, but still well below the national average;
• Both the number and value of building permits continues to fall. The value of building permits is down substantially due to a decline in non-residential permitting;
• Median home values increased in the 4th Quarter; and
• Quarterly taxable retail sales were down slightly from a year ago, while inflation-adjusted annual taxable retail sales were flat.

Economic Barometer Report 4th
Quarter 2008
2
EMPLOYMENT IN LAWRENCE AND DOUGLAS COUNTY
The number of Lawrence and Douglas County residents employed rose steadily from 2003 to late 2004. This number remained stable through 2006, before declining in early and mid 2007. Little changed from the middle of 2007 until the 4th Quarter of 2008. As of the 4th Quarter, just over 60,000 people (on a yearly average) were employed in Douglas County. This is a roughly a 1% decline from the 4th Quarter of 2007.
The unemployment rate has also been increasing. By the 4th Quarter of 2008, unemployment had returned to 4%. This is a 19% increase from the 4th Quarter of 2007. Readers may note that the unemployment rate was higher in 2004 and 2005, which is the same time the number of residents employed was peaking. The higher unemployment rate was likely caused by residents entering or returning to the labor force due to economic growth, resulting in an uptick in both unemployment rates and total employment.
Unemployment has been rising more slowly in Lawrence than in either Kansas or nationally. Also, compared to both the national and state unemployment averages, Lawrence’s 4% local unemployment rate remains below average.
Unemployment Rate, Douglas County
2003 to Present
3.0%
3.3%
3.5%
3.8%
4.0%
4.3%
4.5%
2003 Q
1
2003 Q
3
2004 Q
1
2004 Q
3
2005 Q
1
2005 Q
3
2006 Q
1
2006 Q
3
2007 Q
1
2007 Q
3
2008 Q
1
2008 Q
3
Note: One Year Rolling Average
Source: Kansas DOL and US Bureau of Labor Statistics (BLS)
Fourth Quarter 2008 Unemployment DataCivilian Unemployment Change
Employment Rate vs. 1 Year Ago
U.S. (thousands) 144,540 6.6% 43%
Kansas 1,430,637 4.6% 23%
Kansas City, KS MSA 417,369 5.4% 24%
Lawrence MSA 60,208 4.0% 19%
Topeka MSA 115,823 5.4% 23%
Wichita MSA 305,252 4.7% 28%
Source: US Bureau of Labor Service
Number of Douglas County Residents Who Are Employed
2003 to Present
56,000
56,500
57,000
57,500
58,000
58,500
59,000
59,500
60,000
60,500
61,000
20
03
Q1
20
03
Q3
20
04
Q1
20
04
Q3
20
05
Q1
20
05
Q3
20
06
Q1
20
06
Q3
20
07
Q1
20
07
Q3
20
08
Q1
20
08
Q3
Note: One Year Rolling Average
Source: Kansas Department of Labor

Economic Barometer Report 4th
Quarter 2008
3
REAL ESTATE
There was a general decline in the number of building permits issued from the 4th Quarter of 2007 to the 4th Quarter of 2008. While the number of permits issued fell by 15%, the value of the permits fell by about 57%. A large portion of this can be attributed to Lawrence Memorial Hospital, which received approval for its $11 million expansion in December of last year. There were also several multi-family constructions that began in the 4th Quarter of 2007, and none in the 4th Quarter of 2008. Multi-family is listed as Non-Residential by the City. A large majority of the decline in permit value is explained by these two factors.
The number of building permits peaked in 2002 and generally declined since then. In fact, the number of building permits issued in 2008 was the lowest number of building permits issued in the last 15 years. However, the value of building permits in 2008 was higher than in 2007. Permit values increased to $146 million from about $104 million in 2007.
These permit values are adjusted for inflation. Without this adjustment, the data would show that the greatest dollar value of permits was issued in 2006. However, accounting for inflation, the highest value of permits issued was in 1996, followed by the year 2000.
Fourth Quarter Building Permits in LawrenceQ4 Q4 % Change
2007 2008 2007-2008
TOTAL
Number 598 511 -15%
Valuation $42,427,720 $18,318,749 -57%
RESIDENTIAL
Number 52 31 -40%
Valuation $11,652,562 $11,393,941 -2%
NON-RESIDENTIAL
Number 43 39 -9%
Valuation $26,197,495 $4,106,377 -84%
Source: City of Lawrence, Neighborhood Resources DepartmentValuation of Building Permits
Building Permits and Value of Building Permits in Lawrence
1994 to Present
1,000
1,500
2,000
2,500
3,000
3,500
4,000
199
4
199
5
199
6
199
7
199
8
199
9
200
0
200
1
200
2
200
3
200
4
200
5
200
6
200
7
200
8
Nu
mb
er o
f P
erm
its
$0
$50,000
$100,000
$150,000
$200,000
$250,000
Va
lue
of
Per
mit
s ($
,000
)
Number of Permits
Total Value
Note: permit value adjusted for inflation (source:
US BLS)

Economic Barometer Report 4th
Quarter 2008
4
Some of the decline in permit value is due to the reduction in permits issued. However, there has also been a decline in value per permit as well. Adjusted for inflation, values per permit fell from roughly $73,000 in the late 1990s to about $54,000 in the 2001 to 2004 period. This was likely driven by the recession in the early part of the decade. Values have returned to almost $60,000 per permit, but remain below the permit values of the late 1990s:
The 4th Quarter of 2008 saw an increase in the median home sale value in Lawrence. The increase from $160,000 in the Third Quarter to $170,000 in the 4th Quarter represents a jump of over 6%. Median home sale values are also up from the 4th Quarter of 2007, when the price was below $160,000. The change in home values in the 4th Quarter of 2008 represents the sharpest increase in housing prices in the last 4 years. Because this increase in median home sales price is only one quarter old, it is difficult to say whether this trend will continue. However, early 2009 data from the County assessors’ office suggests that the 4th Quarter price trend may be temporary.
Value per Permit over a Four Year Average, Lawrence
Period 1994-1997 1995-1998 1996-1999 1997-2000 1998-2001 1999-2002 2000-2003 2001-2004 2002-2005 2003-2006 2004-2007 2005-2008
Value per Permit $73,561 $69,993 $72,100 $67,712 $63,544 $61,077 $59,824 $53,842 $54,108 $57,934 $53,665 $58,589
Source: City of Lawrence, Neighborhood Resources Department
Median Home Value in Lawrence
2005 to Present
$100,000
$110,000
$120,000
$130,000
$140,000
$150,000
$160,000
$170,000
$180,000
$190,000
$200,000
20
05
Q1
20
05
Q2
20
05
Q3
20
05
Q4
20
06
Q1
20
06
Q2
20
06
Q3
20
06
Q4
20
07
Q1
20
07
Q2
20
07
Q3
20
07
Q4
20
08
Q1
20
08
Q2
20
08
Q3
20
08
Q4
Note: Median Home Sales Value adjusted for inflation (source: US BLS)
Source: Douglas County Appraiser's Office

Economic Barometer Report 4th
Quarter 2008
5
RETAIL SALES
Retail sales decreased slightly in Douglas County. From the 4th Quarter of 2007 to the 4th Quarter of 2008, taxable retail sales fell by about .7%. In contrast, most other counties- including adjacent Johnson and Shawnee Counties- saw more than a 2% decrease in taxable retail sales since last year. Statewide, 4th Quarter retail sales were down by about .4%, slightly less than in Douglas County.
An analysis of statewide sales taxes shows that, compared to 2007, sales tax growth was generally strong through the first half of the year. It was after July that sales taxes began to consistently weaken, falling below 2007 totals late in the year. In general, Douglas County exhibited a similar but slightly lower trend. Here, taxable retail sales declined more in the late winter than the overall statewide average, and peaked earlier in the spring as well.
The importance of adjusting for inflation is amply demonstrated when reviewing taxable retail sales in Lawrence. If one simply looked at taxable retail sales, it would appear that retail sales had been growing steadily since 2002, rising from about $1.08
billion to $1.29 billion in 2008. This would represent an increase of about 19%. Adjusting for inflation, however, taxable retail sales in Lawrence have barely changed in the last seven years. The change from $1.25 billion in 2002 to $1.27 billion in 2008 is about 1.8% over the period. This is roughly 1/10th the increase of taxable retail sales not adjusted for inflation. This suggests that about 90% of the increase in value of taxable retail sales over the last seven years in Lawrence is nominal, not real.
State Tax Receipts by Location
4th Quarter 4th Quarter Change
County 2007 2008 (%)
Douglas $17,707,990 $17,578,853 -0.7%
Johnson $133,184,044 $129,439,546 -2.8%
Wyandotte (Kansas City, KS) $25,764,495 $25,206,384 -2.2%
Shawnee (Topeka) $35,313,064 $34,474,843 -2.4%
Sedgwick (Wichita) $101,313,198 $100,369,100 -0.9%
Total, State of Kansas $512,068,024 $510,071,021 -0.4%
Source: Kansas Department of Revenue
Taxable Retail Sales in Lawrence
With and Without Inflation Adjustment
2002 to Present
$1,000,000
$1,050,000
$1,100,000
$1,150,000
$1,200,000
$1,250,000
$1,300,000
$1,350,000
2002 2003 2004 2005 2006 2007 2008
Ret
ail
Sa
les
($,0
00)
Lawrence Taxable Retail Sales, Adjusted for Inflation
Lawrence Retail Sales, Not Adjusted for InflationSource: Kansas Department of Revenues
State Tax Receipts Versus One Year Ago
Kansas and Douglas County
85%
90%
95%
100%
105%
110%
115%
Jan
-08
Feb
-08
Mar
-08
Apr-
08
May
-08
Jun
-08
Jul-
08
Au
g-0
8
Sep
-08
Oct
-08
Nov-0
8
Dec
-08S
tate
Tax R
ecei
pts
as
a S
hare
of
2007
Tax R
ecei
pts
Kansas Retail Taxable Sales
Douglas County Retail Taxable Sales
Source: Kansas Department of Revenue

Economic Barometer Report 4th
Quarter 2008
6
INFLATION AND THE COST OF LIVING
Throughout most of the decade, inflation has been moderate and consistent. This changed in 2008. Inflation rose sharply in the first half of the year, only to fall off in the second half of the year. By the end of the year, price levels were about the same as if the trend for the first part of the decade had been continued.
A large part of the increase and decrease in inflation was likely caused by large changes in commodity prices. By mid-2008 many commodities, most notably for commuters oil, had risen to record high prices. Food was also being affected. As the recession became stronger, however, commodity prices weakened considerably and thus reduced inflation in the latter half of the year.
The cost of living relative to the United States increased in Lawrence in 2008. In general, the relative cost of living in Kansas increased somewhat slightly, with a slight rise in cost of living reported in Manhattan and Topeka as well. Among the peer cities surveyed, however, Lawrence
saw the second largest increase in relative cost of living, behind only Fort Collins, Colorado. In contrast, the relative cost of living in other Midwest cities such as Champaign, Illinois and Ames, Iowa appears to have declined over the last year. The slight increase in relative cost of living here in Kansas may have occurred because, in general, the economy remained healthier in Kansas through most of 2008 than it did elsewhere in the United States.
Change in CPI, 2001 to 2008
150
160
170
180
190
200
210
220
20
02
Q1
20
02
Q3
20
03
Q1
20
03
Q3
20
04
Q1
20
04
Q3
20
05
Q1
20
05
Q3
20
06
Q1
20
06
Q3
20
07
Q1
20
07
Q3
20
08
Q1
20
08
Q3
Source: Bureau of Labor Statistics
Annual Average
Comparative Cost of Living Index2007 2008 Change (%)
US Average 100.0 100.0
Lawrence, KS 92.3 93.4 1.2%
Manhattan, KS 97.6 97.9 0.3%
Topeka, KS 89.5 89.6 0.1%
Ames, IA 96.8 93.0 -3.9%
Champaign, IL 98.2 96.7 -1.5%
Columbia, MO 91.2 91.0 -0.2%
Fort Collins, CO 93.9 95.3 1.5%
Source: ACCRA

Economic Barometer Report 4th
Quarter 2008
7
FOCUS ON… Downtown and Tourism
Lawrence prides itself on its history, high quality amenities and university life. Because of this, tourism and the vibrancy of downtown play key roles in the local economy. This “Focus On” section spotlights these two features of the Lawrence economy and how they have performed over the last several years.
As in many areas of the country, tourism suffered in Lawrence in the wake of the September 11th terrorist attacks. Indeed, both occupancy rates and transient guest taxes fell from 2003 to fiscal year 2004. However, both recovered quickly to more traditional norms. Occupancy rates for hotel rooms have stayed fairly constant at about 57%. It is particularly noteworthy that occupancy rates have not fallen, even as more lodging options in western Wyandotte County have become available for tourism. Transient guest taxes have also been increasing through this time period, indicating that people are willing to pay more to stay in Lawrence. Transient guest taxes in 2008 were the highest they have been this decade, reaching almost $940,000.
While basketball has long been a well-known draw for University of Kansas athletics, football is becoming more important as well. Total football attendance has risen this decade and received a strong boost after the Orange Bowl victory in January of 2008. This year, average attendance per home game for the KU Jayhawks topped 50,000 for the first time ever. This helped propel total
Transient Guest Taxes and Occupancy Rates in
Lawrence, 2002 to Present
$0
$100,000
$200,000
$300,000
$400,000
$500,000
$600,000
$700,000
$800,000
$900,000
$1,000,000
2002 2003 2004 2005 2006 2007 2008
Tra
nsi
ent
Gu
est
Ta
xes
51%
52%
53%
54%
55%
56%
57%
58%
59%
Occ
up
an
cy R
ate
Transient Guest Taxes Occupancy Rate
Note: Adjusted for inflation. Transient Guest Tax prior to 2004 of 4% also adjusted.
Source: Kansas Department of Revenue
University of Kansas Football Attendance
2000 to Present
-
50,000
100,000
150,000
200,000
250,000
300,000
350,000
400,000
2001 2002 2003 2004 2005 2006 2007 2008
To
tal
Att
end
an
ce
-
10,000
20,000
30,000
40,000
50,000
60,000
Av
era
ge
Att
end
an
ce p
er G
am
e
Total Football Attendance
Average Attendance per Game
Source: University of Kansas Athletics Department Website, NCAA Website

Economic Barometer Report 4th
Quarter 2008
8
attendance to over 350,000 for the season. Since Memorial Stadium seats roughly 53,000 people, capacity per game is now close to 95%.
In contrast to tourism, Downtown has seen more level trends in recent years. Sales tax receipts in Downtown for retail, restaurants and bars suffered in the early part of the decade. From Fiscal Year 2001 (July 1, 2000 to June 30, 2001) to Fiscal Year 2003, sales tax receipts fell from $3.3 million to $3.1
million or about 6 percent. They rose strongly through 2006, before falling again in the last two years. As a share of retail, restaurant and bar receipts throughout the City, downtown sales tax receipts have fallen from over 8% in the early part of the decade to about 6.5% in 2008. Downtown sales in these categories have been between 6.3% and 7.2% of the City as a whole since Fiscal Year 2002.
Occupied space in Downtown and the immediate vicinity has decreased slightly from 2007 to 2008. This is consistent with an increase in vacancy throughout Lawrence, and is likely driven by softening economic conditions. Most notably, industrial vacancy- primarily along Delaware Street east of the main downtown core- has more than doubled. Retail vacancy downtown decreased slightly, but may be rising at this time as several stores closed in the beginning of 2009. Downtown office space continues to have very high vacancy rates. At almost 20%, this represents one of the highest localized vacancy rates for office space in the City. Overall, these trends have resulted in an almost 5% increase in vacancy rates Downtown since last year.
Questions? Comments? Please contact Roger Zalneraitis at [email protected]
Vacancy Rate by Use Type, Downtown Lawrence
Change
Use Type
Total Square
Feet 2007 2008 (%)
Retail 1,278,000 8.0% 4.9% -38.8%
Office 832,300 18.5% 19.9% 7.6%
Industrial 581,000 5.8% 12.1% 108.6%
Total 2,691,300 10.6% 11.1% 4.5%
source: Grubb and Ellis 2008 and 2009 Forecast Reports
Downtown Sales Tax Receipts
FY 2001-2008
$2,900,000
$3,000,000
$3,100,000
$3,200,000
$3,300,000
$3,400,000
$3,500,000
$3,600,000
2001 2002 2003 2004 2005 2006 2007 2008
Sta
te S
ale
s T
ax R
ecei
pts
0%
1%
2%
3%
4%
5%
6%
7%
8%
9%
Sh
are
of
Cit
y S
ale
s T
ax
Rec
eip
ts
Downtown Sales Tax Receipts Share of Citywide Sales Tax Receipts
Note: Sales tax receipts adjusted for inflation
Source: Convention and Visitors Bureau, Kansas Department of Revenue