Embed Size (px)
Citation preview

8/8/2019 May 2010 Oppenheimer Report
http://slidepdf.com/reader/full/may-2010-oppenheimer-report 1/41
Oppenheimer & Co. Inc. does and seeks to do business with companies covered in its research repora result, investors should be aware that the firm may have a conflict of interest that could affect theobjectivity of this report. Investors should consider this report as only a single factor in making their investment decision. See "Important Disclosures and Certifications" section at the end of this report foimportant disclosures, including potential conflicts of interest. See "Price Target Calculation" and "Keyto Price Target" sections at the end of this report, where applicable.
May 12, 2010
HEALTHCARE/MANAGED CARE & OTHERHEALTHCARE SERVICES
Carl McDonald, CFA
James Naklicki, CFA
The Game Has Changed,
But Still Trying to Play by the Old Rules--MLR UpdateSUMMARY
There will be a negative impact on health plan earnings from the minimum medicaloss ratio requirements that take effect next year. The hit won't be enormous, aplans will reduce broker commissions and cut non-core SG&A to offset most of th
rebates, but we now anticipate earnings growth of just 3% next year for the largediversified plans. This has already been reflected in stock prices, as these stockare down an average of 13% since April 8, compared to a 2% loss in the S&P. Thbigger valuation issue, in our view, is that it has become harder for plans to improvmargins, making the industry more dependent on increasing risk membership grow operating earnings, which is a problem, because the industry has no volumgrowth.
KEY POINTS
s There are opportunities to improve margins, but only in those markets wibelow average profitability. Re-pricing can help, but this normally results imembership losses, further pressuring revenue, and there are often structurreasons why a plan is less profitable, like lack of scale, or a difficult hospita
system that won't negotiate a reasonable price.
s The unfortunate truth is that the current Administration simply doesn't like thhealth insurance industry, and it believes plans make too much money. It maynot be rational, and it may not be true, but this is the world that plans inhabiand it isn't going to change in 2010, 2011, or 2012.
s So whether it it through minimum loss ratios, premium rate oversight, or judaring plans to step out of line, it doesn't seem like the for-profit plans are gointo be allowed to earn the kind of margins they have historically.
s This is why we're hesitant to step into the group here despite the drop valuation. The stocks look cheap, but that assumes the current margin structu
survives. And while margins have fallen from peak levels, profit levels are stiabove historical averages.
s Moreover, we can't forget that the industry still faces a steep drop in earnings i2014 when reform is fully implemented, led by adverse selection in thindividual business, the commoditization of the small group product, Medicarmargin pressure, employers converting to lower profit self-funded arrangementsand small employers dropping coverage and pushing employees into thexchange.
EQUITY RESEARCH
INDUSTRY UPDATE
Oppenheimer & Co Inc. 300 Madison Avenue 4th Floor New York, NY 10017 Tel: 800-221-5588 Fax: 212-667-822

8/8/2019 May 2010 Oppenheimer Report
http://slidepdf.com/reader/full/may-2010-oppenheimer-report 2/41
2
Investment Thesis
This report updates our prior analysis on the impact that minimum medical loss ratios wil
have on the industry next year (see The Average Person Thinks He Isn’t – Minimum
Medical Loss Ratio Analysis , published on April 8, 2010) with 2009 data. The conclusion is
relatively unchanged from our prior analysis, which is that earnings in the group will be
negatively impacted by the minimum loss ratios, but that the bigger valuation issue for the
group is the effective cap on margins that plans will now operate under. For investors, we
think this skews the risk / reward dynamics of the industry, since it leaves shareholdersexposed to company mispricing and lower than expected earnings, but doesn’t allow
investors to benefit as much when plans price above cost trends, like they are doing now.
Of course, with the large diversified plans (Aetna, CIGNA, UnitedHealth, WellPoint) down
12.9% since the initial loss ratio report was issued (relative to a 2.2% decline in the S&P
500), the most frequent question we get these days is whether the bad news is
appropriately factored into valuations. The simple answer is that we’re still not ready to
own the diversified managed care plans. It’s kind of an odd situation for us, because these
are the times we normally like the managed care stocks the most.
The stocks have traded down a lot, sentiment is awful, and there’s very little interest in the
group, but we can’t get rid of the nagging feeling that the world has changed for the
managed care industry. The stocks all look cheap right now, but that assumes that thehistorical margin structure for the industry holds, and we’re not sure that will be the case
Margins for the group have fallen from peak levels, but they are still above average. And
we can’t avoid the fact that the current Administration doesn’t like the health insurance
industry, and it believes plans make too much money. It isn’t rational, and the health
insurance industry has a lower margin than almost every other industry, but that is the
environment that the managed care group now operates in, and there isn’t any hope of it
changing in 2010, 2011, or 2012. Even if Republicans take back the House in the
upcoming mid-term elections, it just means that things can’t get any worse legislatively for
the industry. It wouldn’t do anything to change the legislation on the books, or the
interpretation of how the legislative language should be implemented. The point here is
whether it is through minimum medical loss ratios, premium rate increase oversight, or
simply daring plans to step out of the line, it feels like this Administration is going to do
everything in their power to keep the for-profit health plans from earning the kind ofmargins they have enjoyed historically.
We also don’t like that every day we seem to come across a new negative for the industry
For example, there hasn’t been a lot of attention paid to the student health insurance
business, which is a product that will likely see a major drop in revenue and earnings now
that children are allowed to remain on their parents’ insurance until the age of 26. Today
most insurers cut off children from parents’ insurance at either 19 or 23. This isn’t a huge
deal, and the product won’t go away entirely, because many enrollees are internationa
students. But the business generated $470 million in premiums for Aetna in 2009, and had
a loss ratio of 83.3%, while United’s student business reported 2009 premiums of $390
million and a loss ratio of 71.0%. (In 2008, the loss ratio on Aetna’s student business was
around 75%, while United’s student loss ratio was 56%). Assuming the student business
falls by half in 2011 because of the new regulation, and that the SG&A ratio typically runs
about 15%, we estimate it will cost Aetna about $4 million in earnings ($0.01 per share)
while United will take a slightly larger hit, at more than $25 million ($0.01 per share).
Another example is the unexpected places that the minimum MLR requirements show up
For example, no one thinks about the impact that the minimum MLR will have on Centene
since it is predominantly a Medicaid plan. However, we often forget that Centene bought
an individual health insurance company, Celtic Insurance, back in 2008. In 2009, Celtic
had $40 million in premiums, and a medical expense of 61.8%. If we assume the company
can increase its MLR by 300 basis points through tax adjustments and shifting SG&A
Centene would have incurred a rebate of $6.2 million on the business in 2009, which
would have negatively impacted earnings by $0.09 per share. Again, it’s not enormous
but it’s just another headwind facing the industry next year.
HEALTHCARE

8/8/2019 May 2010 Oppenheimer Report
http://slidepdf.com/reader/full/may-2010-oppenheimer-report 3/41
We also don’t think the market fully appreciates the administrative complexity that health
reform will place on the industry, and the spending that will be incurred complying with al
the new reporting requirements plans will have to abide by. It’s difficult to size the tota
cost at this point, but the incremental spending will be another reason (in addition to the
shrinking commercial membership base) that will make it difficult for plans to show
meaningful improvements in operating expenses over the next couple years. For example
most people believe the large group market is essentially immune from the minimum MLR
requirements because most large groups are already operating close to or above the 85%
loss ratio requirement. That depends. One of the issues that needs to be clarified is how
to treat a large group that technically buys its health insurance in one state, and hasemployees in a number of states. For purposes of the MLR calculation, does the health
plan need an 85% MLR in each state, or only in aggregate? Perhaps more importantly, if
plans do need to track loss ratios by state, rather than by employer group, they will need
to create an entirely new administrative structure, or spend a lot of time re-working
existing systems to provide the required data.
There has been a lot of attention focused on premium rate increase issues at the state
level, particularly in California, but a lot less on the regulation of “excessive” rate increases
currently being discussed in tandem with the minimum MLR definition. The debate at the
NAIC on how to define an excessive rate increase is ongoing, but there is more discussion
than we’d like around the idea that rates above a certain amount should be considered
excessive. From our perspective, no rate increase should be considered excessive if the
underlying claims data supports it. In other words, if cost trends are rising 40%, then a40% premium increase is more than reasonable, whereas there is some discussion at the
NAIC about capping rates at a certain amount. In addition, there’s also been some debate
about whether plans will have the ability to adjust pricing for prior year issues. In othe
words, if a plan misprices a product, the following year it will adjust premium rates to
account for normal cost trend, as well as to make-up for the mispricing the prior year,
whereas the NAIC has discussed limiting the increase to cost trend only.
Moreover, we can’t forget that in addition to all the modest earnings challenges facing the
group in 2011, the bigger negative earnings impact actually hits in 2014 when reform is
fully implemented. It is still a few years away, of course, but at that point, plans will have to
deal with financial losses in the individual business because of adverse selection, the
commoditization of the small group product because of product standardization and
pricing transparency, Medicare margin pressure, employers converting to lower profit self-
funded arrangements because the health insurance industry tax only applies to fully
insured plans, and smaller employers dropping coverage entirely and pushing employees
into the exchange to take advantage of the subsidies offered by the government and the
lack of penalty for small employers that don’t offer coverage. The earnings drop the
industry is facing in 2014 will re-base industry earnings back to 2011/2012 levels, and tha
is one reason why more long-term long only investors have been reluctant to step into the
group.
In any event, the point of this report is to update our minimum medical loss ratio analysis
with 2009 statutory data. The conclusion is that while the calculated rebate amounts are
lower in 2009, each company would still have incurred a rebate last year. Said differently
even though many plans would have characterized 2009 as a pretty bad year, companies
would still have had to return money to customers because certain markets remained very
profitable. Since it appears that 2010 will be a far more favorable year from a medical lossratio perspective, as the flu has not been a factor, and plans are pricing above cost trend
our sense is that the rebate amounts will grow dramatically in 2010 performance. A few
highlights of the analysis:
• Our sense is that plans will be able to increase medical loss ratios by abou
300-500 basis points. This will be driven by shifting certain SG&A expenses into
medical expenses (100 basis points), but this will be limited to clearly defined
items, like nurse hotlines and disease management. We don’t think plans have
gotten much traction on including items like health care information technology
We also think plans will be able to deduct state and federal taxes (including
income taxes) from premiums (200-400 basis points). The adjustment for federa
HEALTHCAR

8/8/2019 May 2010 Oppenheimer Report
http://slidepdf.com/reader/full/may-2010-oppenheimer-report 4/41
4
income taxes is still being debated, and is the primary reason for the wide range
of our estimate.
• Depending on the interpretation, the minimum loss ratio has the potentia
to create significant administrative expenses for plans. As noted, if plans
aren’t allowed to aggregate large group loss ratios at the employer level, and are
instead required to calculate loss ratios on a state by state basis, it wil
necessitate significant changes to the systems used by plans, increasing
administrative spending. In other words, let's assume an employer like Delta
Airlines is a fully insured plan. The question is whether plans can report one lossratio for that account, or if they would have to report 50 separate state by state
loss ratios.
In addition, the mechanism for rebating premiums has the potential to create
significant administrative headaches. Plans would much prefer to rebate
premiums back to employer groups, rather than rebating premiums back to
individual customers. In many cases, the cost of administering and sending the
check would be more than the actual rebate amount.
Another lingering question is whether MLRs will be based on calendar years o
plan years. The industry likely favors a calendar year approach, since the
administrative complexity of tracking rebates based on plan years would be
staggering.
• Some plans are pushing for a rolling three-year average medical loss ratio
to be implemented immediately in 2011, and some would like to see broker
commissions excluded from premium revenue, at least initially, but the
NAIC doesn’t seem likely to recommend these changes. The legislation
specifically requires a single year MLR calculation in 2011, with rolling averages
implemented in 2014, so it seems difficult to simply ignore the legislative
language. In the case of broker commissions, the probability of adjusting the
MLR calculation is basically zero. The legislative language clearly allows fo
adjustments related to quality improvement measures and taxes, but nothing
else, so it seems to us that plans are wasting their time pushing for a broad
commission adjustment.
• It still isn’t clear how closely the HHS Secretary plans to follow the NAIC
recommendations. With all the attention focused on the deliberations of the
NAIC, it is often lost that they are simply making recommendations to HHS
rather than determining the definition and interpretation. For example, the NAIC
could recommend that federal income taxes be excluded from premiums, but the
HHS Secretary could very easily have a different interpretation. Plans have
deployed most of their efforts to lobbying the NAIC, whereas consume
advocates and some Democratic members of Congress have focused their
attention on the HHS Secretary.
• In addition, it isn’t clear whether state regulators will implement the reform
legislation language, or do their own thing. As per the legislation, individua
state regulators have the authority to implement even more stringent minimum
loss ratio requirements if they see fit. For example, it is within the power of state
regulators to require an 87% large group loss ratio (rather than the 85% cited in
the legislation) if they believe their market can sustain it.
• It’s important to point out again that we are relying on statutory entity data
because the loss ratio minimums will likely be calculated on a state by
state basis, the rebates we’ve calculated in this report are likely
understated by a material amount. For example, United’s Golden Rule
subsidiary reported 2009 premiums of $1.3 billion, with an overall loss ratio of
around 63%. However, Golden Rule writes business in all 50 states, and while
there are some large markets, like Florida ($307 million in premiums), Texas
($113 million in premiums), and Ohio ($74 million), there are many states tha
HEALTHCARE

8/8/2019 May 2010 Oppenheimer Report
http://slidepdf.com/reader/full/may-2010-oppenheimer-report 5/41
write under $10 million in premiums. A state by state look at Golden Rule medica
loss ratios would likely reveal a number of states with loss ratios well below the
consolidated 63%.
• The NAIC is in the midst of several concurrent processes. The mos
immediate concern is responding to the questions issued by HHS regarding both
minimum medical loss ratios as well as excessive premium rate increases. The
NAIC was careful in these responses to try and provide information, rather than
make any recommendations. The responses to these questions will be
submitted by the May 14, 2010 deadline.
After responding to the HHS questions, the NAIC will develop a set o
recommendations regarding how both the minimum MLR and excessive rate
increases should be implemented and defined. These recommendations, o
course, are of the greatest interest to investors, and the NAIC appears to be on
track to submit these recommendations to HHS by the June 1, 2010 deadline.
• It is still unclear exactly what products will be subject to the minimum MLR
It is certain that individual, small group, and large group products will each
separately have to meet their respective minimum loss ratio on a state by state
basis. Less clear is whether things like limited benefit products, short-term
medical offerings, student health insurance, and the Federal Employees Health
Benefits Program (FEHBP) will also be subject to the minimum MLRs. Planswould prefer that these other products be excluded from the MLR calculation
with the exception of the FEHBP program. Because of they way that produc
operates, plans typically have a loss ratio of around 95%, so including it in the
calculation pushes up the large group loss ratio. This is a particularly important
question for Blue Cross plans, since they serve the majority of enrollees in the
FEHBP program.
In our analysis, we’ve excluded all of these other products from the rebate
calculation, with the exception of the student health insurance, which we’ve
included in the individual rebate calculation. While it is possible that student
health insurance is excluded entirely from the minimum MLR discussion, it is also
possible that it is counted as a large group product, since it is typically sold to
universities and there are generally more than 100 enrollees. In the latter caseplans would be subject to a minimum 85% MLR, which would put pressure on
what has historically been a very profitable business for plans. As noted earlier
we think the student health insurance business will be under significant pressure
next year because of the new provision allowing children to remain on their
parents’ insurance until the age of 26.
• Not surprisingly, the calculated rebates in 2009 are much lower than wha
we found looking at 2008 data. Aetna missed earnings several times in 2009
while WellPoint has frequently discussed the loss it incurred on its California
individual business. And many plans were vocal about the unexpected cos
increases experienced last year because of the flu season and the highe
penetration of COBRA members. But it is a bit of a disappointment that even in
what most plans believe was a bad year, each plan would have still incurred a
significant rebate. Financial results for the industry appear to be improving
significantly in 2010, so this means rebates will presumably be larger based on
the 2010 data.
The Earnings Impact
Since the ultimate amount of SG&A shifting and tax adjustment is still unknown, we are
presenting our data in the form of a scenario analysis to illustrate the potential rebates
plans could incur. In Exhibit 1, below, we’ve picked a spot estimate of a 500 basis poin
shift to give a sense of the potential earnings impact that plans would experience
assuming that plans did nothing else to offset the impact of the consumer rebates, like cu
HEALTHCAR

8/8/2019 May 2010 Oppenheimer Report
http://slidepdf.com/reader/full/may-2010-oppenheimer-report 6/41
6
broker commissions. In any event, after all those caveats, we estimate that rebates for the
average plan in the industry will negatively impact earnings by about 5% based on the
2009 data. Since 2010 earnings appear to be shaping up a lot better, it suggests that the
amount of rebates paid by plans will grow a lot as we head into 2011.
Exhibit 1: 2009 Rebates, Assuming 500 Basis Point Shift to MLR, andthat Rebates are Calculated at a Statutory Entity
Rebate, Assuming EPS 2011 % of
500 bp MLR Shift Impact EPS Total
Aetna $33,766,955 $0.05 $3.05 2%CIGNA $28,355,735 $0.07 $4.10 2%Humana $63,844,106 $0.24 $5.65 4%United $323,385,304 $0.19 $3.35 6%WellPoint $179,532,572 $0.27 $6.75 4%
Source: Company reports and Oppenheimer & Co. analysis.
Of course, as we noted above, the figures in Exhibit 1 assume the full impact of the rebate
falls to the bottom line. That's not reasonable, considering that plans do have othe
options. As we pointed out in a prior eHealth report (see EHTH: Disposing Of Medica
Waste-Health Reform Update, published on March 30, 2010), many plans are considering
reducing individual commissions in order to come into compliance with the new
regulations. In addition, whatever non-core SG&A that isn’t counted as medical expense
could be eliminated. For example, if nurse hotlines are ruled to be an administrative cost
they can simply be ended. Plans don't have to offer disease management programs, or
spend as much on health care IT as they do.
There are a couple points here. The first is that the ultimate earnings impact on plans wil
not be as dire as the raw numbers suggest. But the data also indicates that there will be
some impact on earnings in 2011 that will slow the industry’s earnings growth rate, and
will put pressure on consensus projections. In other words, even if plans can re-size their
administrative cost base, it is unlikely they will be able to do it fully for 2011 given the tigh
timeframe in which these regulations will likely be announced.
Company by Company Data
What follows is our company by company analysis of enrollment, premiums, and medica
expense broken down into individual, small group, and large group products, as well as
the other products sold by plans that aren’t subject to the minimum MLR requirements.
We'll start with WellPoint. In Exhibit 2, we’ve summarized WellPoint’s 2009 results, where
tracked down almost $31 billion of WellPoint’s commercial premiums. Almost $24 billion o
the premiums come from traditional individual, small group, and large group products
The balance comes from other products such as Medicare supplemental and FEHBP, bu
it is still unclear if these products will be counted in the minimum MLR calculations. We
estimate that WellPoint had something less than $44 billion in commercial premiums
overall in 2009, with the difference largely due to the premiums derived from WellPoint’sBlue Cross of California subsidiary. Because of the different California statutory filing, we
can’t derive profitability by product for the state. In any event, while WellPoint’s overal
commercial medical loss ratio appeared to be about 81.9%, the breakdown by produc
makes clear that loss ratios differ materially by product, as WellPoint’s individual loss ratio
was 75.3%, while its small group loss ratio was 81.4%, followed by a large group medica
loss ratio of 84.8%.
HEALTHCARE

8/8/2019 May 2010 Oppenheimer Report
http://slidepdf.com/reader/full/may-2010-oppenheimer-report 7/41
Exhibit 2: WellPoint Summary of 2009 Results by Product
Member Medical
Plan Lives Months PMPM Premiums Expense MLR
Individual 1,816,207 22,203,195 $192.70 $4,278,501,638 $3,223,119,439 75.3%
Small Group 2,132,580 26,565,602 $316.67 $8,412,636,472 $6,848,486,952 81.4%Large Group 2,859,619 35,001,440 $325.50 $11,393,036,704 $9,659,941,591 84.8%
Total 6,808,406 83,770,237 $287.50 $24,084,174,814 $19,731,547,982 81.9% Source: Company reports and Oppenheimer & Co. analysis.
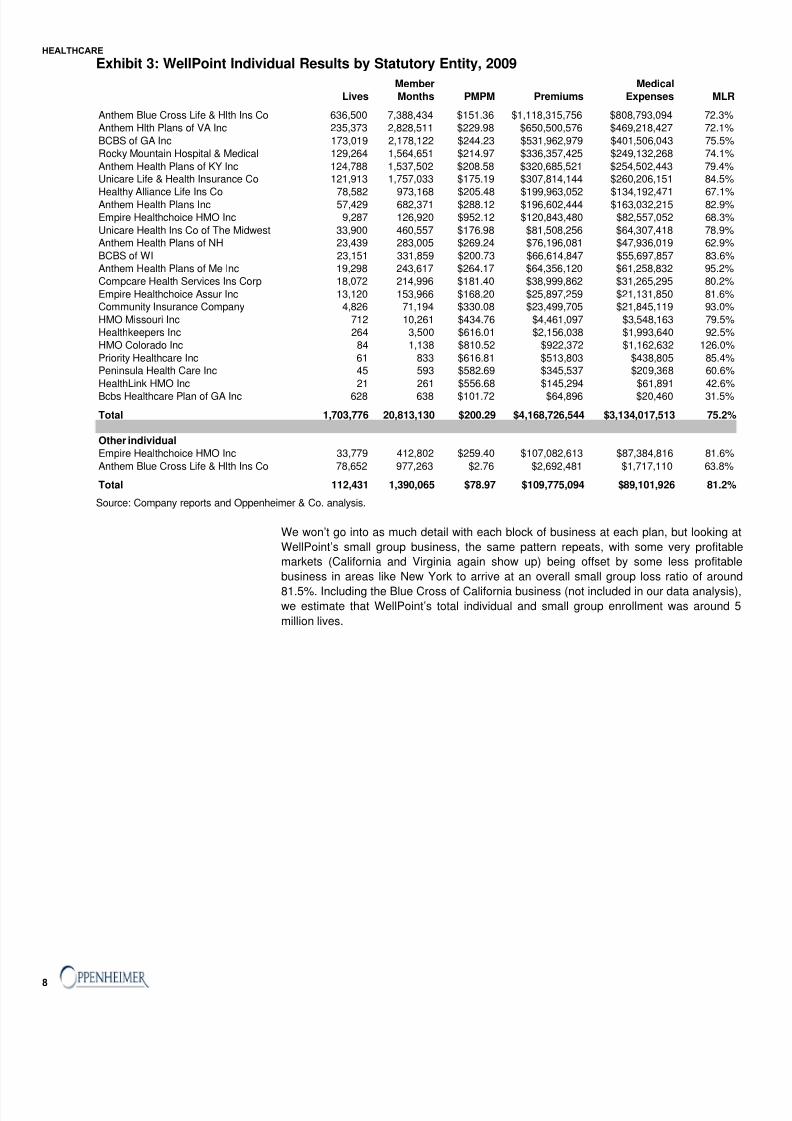
Our analysis tracked down 1.8 million individual lives at WellPoint in 2009, although if we
had been able to include the California data, WellPoint’s individual book would have been
over 2 million lives. From a statutory entity perspective, even if WellPoint was able to shift
500 basis points into its MLR, the company would have still incurred an individual rebate
in excess of $85 million in 2009. Looking at the data, a few things stand out. The first is
extraordinary profitability of a handful of markets. Specifically, the individual gross profits
from the Anthem Blue Cross Life & Health Insurance Company (California), Anthem o
Virginia, BCBS of GA Inc. and Rocky Mountain (Colorado) subsidiaries account over two
thirds of the individual gross profits in our analysis.
Second, WellPoint is one plan that would probably be heavily in favor of a state by state
interpretation, rather than a statutory entity look at minimum loss ratios, since it would beable to combine its presumably less profitable Blue Cross of California subsidiary with
Anthem Blue Cross Life & Health, which could significantly reduce its customer giveback
something it could also do with its multiple New York and Virginia entities. Third, WellPoin
has a number of individual markets that don't appear to be very profitable, and don't have
a lot of membership. These are the markets we would view as being most at-risk if
WellPoint decided to reduce its exposure to the individual business and pulled out of some
individual markets.
HEALTHCAR
8/8/2019 May 2010 Oppenheimer Report
http://slidepdf.com/reader/full/may-2010-oppenheimer-report 8/41
8
Exhibit 3: WellPoint Individual Results by Statutory Entity, 2009
Member MedicalLives Months PMPM Premiums Expenses MLR
Anthem Blue Cross Life & Hlth Ins Co 636,500 7,388,434 $151.36 $1,118,315,756 $808,793,094 72.3%Anthem Hlth Plans of VA Inc 235,373 2,828,511 $229.98 $650,500,576 $469,218,427 72.1%
BCBS of GA Inc 173,019 2,178,122 $244.23 $531,962,979 $401,506,043 75.5%Rocky Mountain Hospital & Medical 129,264 1,564,651 $214.97 $336,357,425 $249,132,268 74.1%
Anthem Health Plans of KY Inc 124,788 1,537,502 $208.58 $320,685,521 $254,502,443 79.4%Unicare Life & Health Insurance Co 121,913 1,757,033 $175.19 $307,814,144 $260,206,151 84.5%
Healthy Alliance Life Ins Co 78,582 973,168 $205.48 $199,963,052 $134,192,471 67.1%Anthem Health Plans Inc 57,429 682,371 $288.12 $196,602,444 $163,032,215 82.9%Empire Healthchoice HMO Inc 9,287 126,920 $952.12 $120,843,480 $82,557,052 68.3%
Unicare Health Ins Co of The Midwest 33,900 460,557 $176.98 $81,508,256 $64,307,418 78.9%Anthem Health Plans of NH 23,439 283,005 $269.24 $76,196,081 $47,936,019 62.9%
BCBS of WI 23,151 331,859 $200.73 $66,614,847 $55,697,857 83.6%Anthem Health Plans of Me Inc 19,298 243,617 $264.17 $64,356,120 $61,258,832 95.2%Compcare Health Services Ins Corp 18,072 214,996 $181.40 $38,999,862 $31,265,295 80.2%
Empire Healthchoice Assur Inc 13,120 153,966 $168.20 $25,897,259 $21,131,850 81.6%Community Insurance Company 4,826 71,194 $330.08 $23,499,705 $21,845,119 93.0%
HMO Missouri Inc 712 10,261 $434.76 $4,461,097 $3,548,163 79.5%Healthkeepers Inc 264 3,500 $616.01 $2,156,038 $1,993,640 92.5%HMO Colorado Inc 84 1,138 $810.52 $922,372 $1,162,632 126.0%
Priority Healthcare Inc 61 833 $616.81 $513,803 $438,805 85.4%Peninsula Health Care Inc 45 593 $582.69 $345,537 $209,368 60.6%
HealthLink HMO Inc 21 261 $556.68 $145,294 $61,891 42.6%
Bcbs Healthcare Plan of GA Inc 628 638 $101.72 $64,896 $20,460 31.5%
Total 1,703,776 20,813,130 $200.29 $4,168,726,544 $3,134,017,513 75.2%
Other individualEmpire Healthchoice HMO Inc 33,779 412,802 $259.40 $107,082,613 $87,384,816 81.6%
Anthem Blue Cross Life & Hlth Ins Co 78,652 977,263 $2.76 $2,692,481 $1,717,110 63.8%
Total 112,431 1,390,065 $78.97 $109,775,094 $89,101,926 81.2% Source: Company reports and Oppenheimer & Co. analysis.
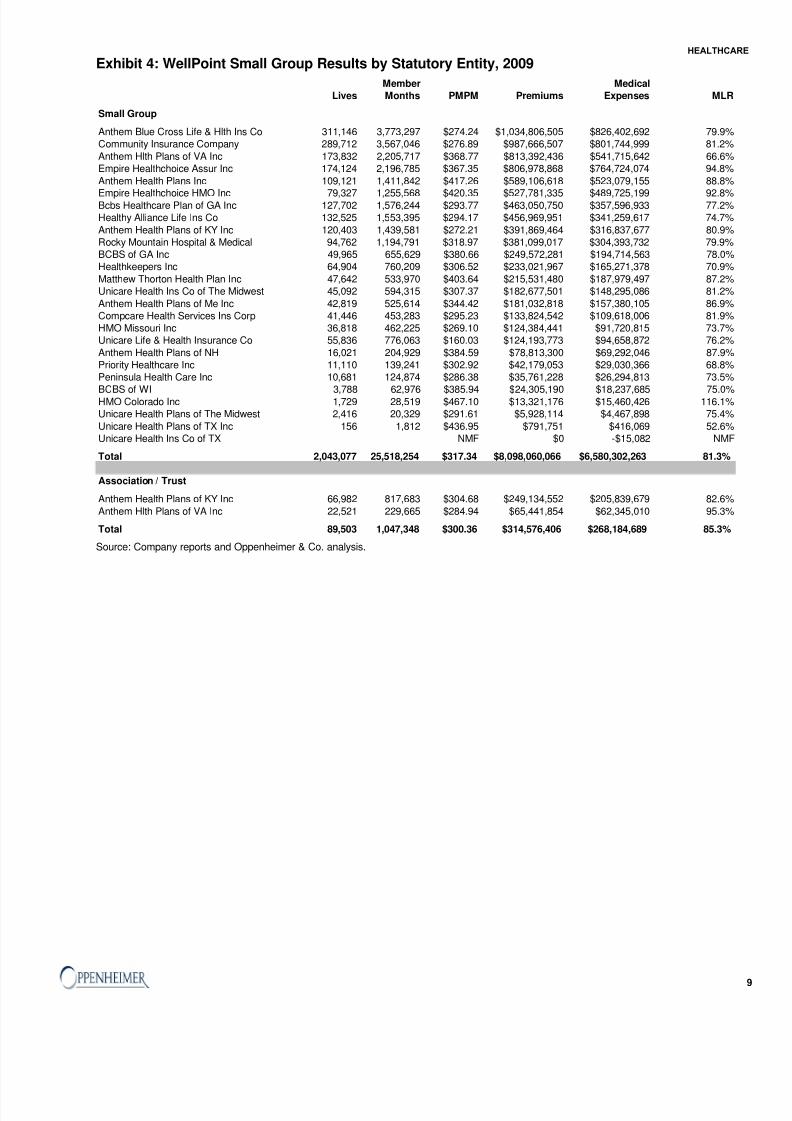
We won’t go into as much detail with each block of business at each plan, but looking at
WellPoint’s small group business, the same pattern repeats, with some very profitable
markets (California and Virginia again show up) being offset by some less profitable
business in areas like New York to arrive at an overall small group loss ratio of around
81.5%. Including the Blue Cross of California business (not included in our data analysis),we estimate that WellPoint’s total individual and small group enrollment was around 5
million lives.
HEALTHCARE
8/8/2019 May 2010 Oppenheimer Report
http://slidepdf.com/reader/full/may-2010-oppenheimer-report 9/41
Exhibit 4: WellPoint Small Group Results by Statutory Entity, 2009
Member Medical
Lives Months PMPM Premiums Expenses MLR
Small Group
Anthem Blue Cross Life & Hlth Ins Co 311,146 3,773,297 $274.24 $1,034,806,505 $826,402,692 79.9%Community Insurance Company 289,712 3,567,046 $276.89 $987,666,507 $801,744,999 81.2%Anthem Hlth Plans of VA Inc 173,832 2,205,717 $368.77 $813,392,436 $541,715,642 66.6%Empire Healthchoice Assur Inc 174,124 2,196,785 $367.35 $806,978,868 $764,724,074 94.8%Anthem Health Plans Inc 109,121 1,411,842 $417.26 $589,106,618 $523,079,155 88.8%
Empire Healthchoice HMO Inc 79,327 1,255,568 $420.35 $527,781,335 $489,725,199 92.8%Bcbs Healthcare Plan of GA Inc 127,702 1,576,244 $293.77 $463,050,750 $357,596,933 77.2%Healthy Alliance Life Ins Co 132,525 1,553,395 $294.17 $456,969,951 $341,259,617 74.7%Anthem Health Plans of KY Inc 120,403 1,439,581 $272.21 $391,869,464 $316,837,677 80.9%Rocky Mountain Hospital & Medical 94,762 1,194,791 $318.97 $381,099,017 $304,393,732 79.9%BCBS of GA Inc 49,965 655,629 $380.66 $249,572,281 $194,714,563 78.0%Healthkeepers Inc 64,904 760,209 $306.52 $233,021,967 $165,271,378 70.9%Matthew Thorton Health Plan Inc 47,642 533,970 $403.64 $215,531,480 $187,979,497 87.2%Unicare Health Ins Co of The Midwest 45,092 594,315 $307.37 $182,677,501 $148,295,086 81.2%Anthem Health Plans of Me Inc 42,819 525,614 $344.42 $181,032,818 $157,380,105 86.9%Compcare Health Services Ins Corp 41,446 453,283 $295.23 $133,824,542 $109,618,006 81.9%HMO Missouri Inc 36,818 462,225 $269.10 $124,384,441 $91,720,815 73.7%Unicare Life & Health Insurance Co 55,836 776,063 $160.03 $124,193,773 $94,658,872 76.2%Anthem Health Plans of NH 16,021 204,929 $384.59 $78,813,300 $69,292,046 87.9%Priority Healthcare Inc 11,110 139,241 $302.92 $42,179,053 $29,030,366 68.8%Peninsula Health Care Inc 10,681 124,874 $286.38 $35,761,228 $26,294,813 73.5%
BCBS of WI 3,788 62,976 $385.94 $24,305,190 $18,237,685 75.0%HMO Colorado Inc 1,729 28,519 $467.10 $13,321,176 $15,460,426 116.1%Unicare Health Plans of The Midwest 2,416 20,329 $291.61 $5,928,114 $4,467,898 75.4%Unicare Health Plans of TX Inc 156 1,812 $436.95 $791,751 $416,069 52.6%Unicare Health Ins Co of TX NMF $0 -$15,082 NMF
Total 2,043,077 25,518,254 $317.34 $8,098,060,066 $6,580,302,263 81.3%
Association / Trust
Anthem Health Plans of KY Inc 66,982 817,683 $304.68 $249,134,552 $205,839,679 82.6%Anthem Hlth Plans of VA Inc 22,521 229,665 $284.94 $65,441,854 $62,345,010 95.3%
Total 89,503 1,047,348 $300.36 $314,576,406 $268,184,689 85.3% Source: Company reports and Oppenheimer & Co. analysis.
HEALTHCAR

8/8/2019 May 2010 Oppenheimer Report
http://slidepdf.com/reader/full/may-2010-oppenheimer-report 10/41
10
Exhibit 5: WellPoint Large Group Results by Statutory Entity, 2009
Member Medical
Lives Months PMPM Premiums Expenses MLR
Large Group
Community Insurance Company 427,168 5,134,866 $312.67 $1,605,530,292 $1,412,451,513 88.0%
Anthem Health Plans Inc 308,715 3,765,128 $379.41 $1,428,511,843 $1,259,628,898 88.2%Anthem Blue Cross Life & Hlth Ins Co 360,252 4,274,311 $284.47 $1,215,925,607 $1,027,064,085 84.5%
Bcbs Healthcare Plan of GA Inc 252,809 3,054,670 $280.30 $856,213,244 $699,889,480 81.7%
Anthem Hlth Plans of VA Inc 152,927 2,002,480 $425.11 $851,283,871 $675,712,717 79.4%
BCBS of GA Inc 175,915 2,268,958 $309.54 $702,341,574 $604,085,050 86.0%Healthy Alliance Life Ins Co 165,896 1,853,050 $307.69 $570,167,870 $471,913,230 82.8%Anthem Health Plans of Me Inc 106,085 1,281,843 $412.17 $528,333,440 $472,976,576 89.5%
Anthem Health Plans of KY Inc 120,090 1,505,237 $309.39 $465,708,674 $381,657,260 82.0%
Empire Healthchoice HMO Inc 70,144 984,559 $429.29 $422,659,379 $338,330,181 80.0%
Unicare Life & Health Insurance Co 52,424 730,210 $499.24 $364,552,333 $326,230,630 89.5%
Rocky Mountain Hospital & Medical 92,288 1,100,024 $302.86 $333,152,526 $276,882,822 83.1%
Healthkeepers Inc 93,462 1,104,974 $301.08 $332,689,093 $276,336,819 83.1%
HMO Colorado Inc 68,303 815,990 $322.87 $263,458,857 $238,205,532 90.4%
Unicare Health Plans of The Midwest 61,430 781,597 $323.47 $252,819,505 $209,216,749 82.8%
Compcare Health Services Ins Corp 55,799 658,542 $338.91 $223,186,203 $199,370,510 89.3%
Matthew Thorton Health Plan Inc 34,529 426,066 $407.19 $173,490,811 $150,753,534 86.9%
HMO Missouri Inc 26,856 349,085 $301.38 $105,206,671 $84,112,744 80.0%
Anthem Health Plans of NH 17,405 237,283 $357.41 $84,806,913 $74,990,064 88.4%Priority Healthcare Inc 22,319 273,627 $281.92 $77,140,290 $58,445,090 75.8%
Unicare Health Ins Co of The Midwest 16,770 233,509 $217.36 $50,755,273 $40,671,273 80.1%
BCBS of WI 11,460 142,485 $344.08 $49,026,435 $42,538,996 86.8%Unicare Health Plans of TX Inc 10,933 139,515 $344.37 $48,044,912 $43,877,764 91.3%
Peninsula Health Care Inc 12,882 148,796 $284.81 $42,378,462 $32,493,285 76.7%
Total 2,716,861 33,266,805 $332.08 $11,047,384,078 $9,397,834,802 85.1%
Other comprehensive major medical
Empire Healthchoice Assur Inc 2,109,022 25,436,802 $168.98 $4,298,372,042 $3,850,175,356 89.6%
Community Insurance Company 125,237 1,520,516 $190.80 $290,109,196 $220,540,996 76.0%
Empire Healthchoice HMO Inc 17,521 214,119 $259.40 $55,543,430 $41,565,793 74.8%
Total 142,758 1,734,635 $199.27 $345,652,626 $262,106,789 75.8% Source: Company reports and Oppenheimer & Co. analysis.
HEALTHCARE
8/8/2019 May 2010 Oppenheimer Report
http://slidepdf.com/reader/full/may-2010-oppenheimer-report 11/41
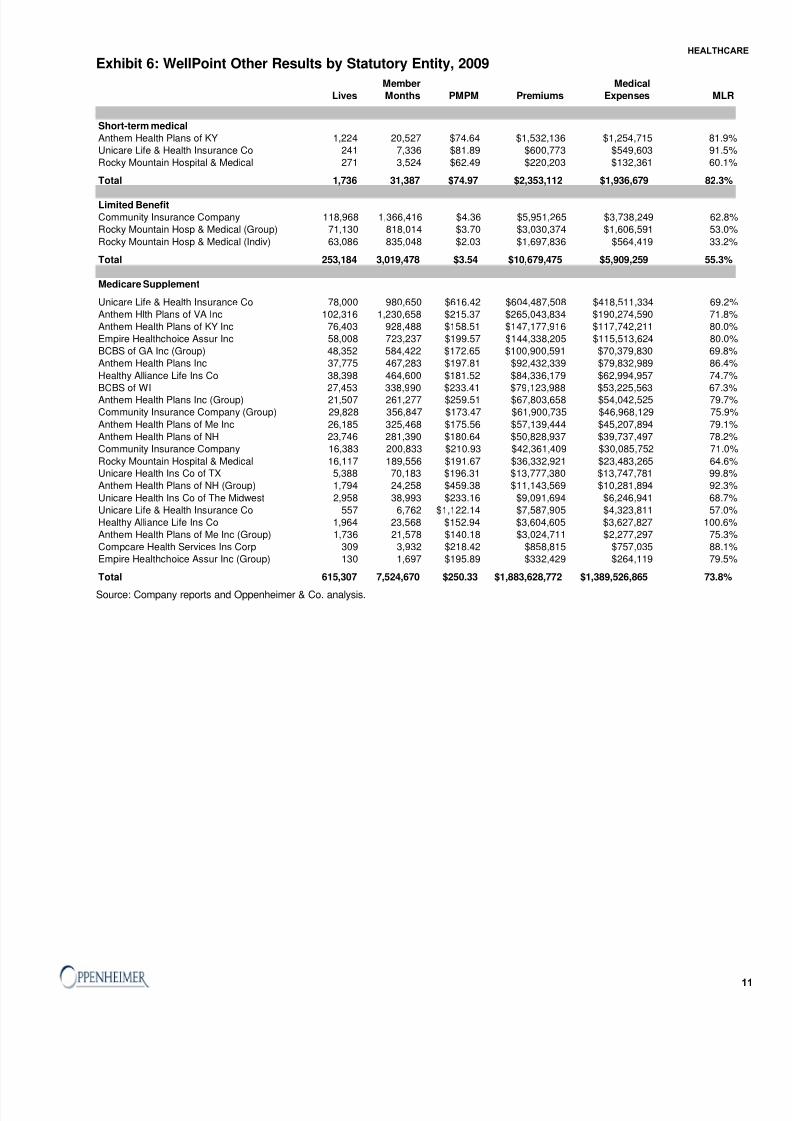
Exhibit 6: WellPoint Other Results by Statutory Entity, 2009
Member Medical
Lives Months PMPM Premiums Expenses MLR
Short-term medical
Anthem Health Plans of KY 1,224 20,527 $74.64 $1,532,136 $1,254,715 81.9%
Unicare Life & Health Insurance Co 241 7,336 $81.89 $600,773 $549,603 91.5%
Rocky Mountain Hospital & Medical 271 3,524 $62.49 $220,203 $132,361 60.1%
Total 1,736 31,387 $74.97 $2,353,112 $1,936,679 82.3%
Limited Benefit
Community Insurance Company 118,968 1,366,416 $4.36 $5,951,265 $3,738,249 62.8%
Rocky Mountain Hosp & Medical (Group) 71,130 818,014 $3.70 $3,030,374 $1,606,591 53.0%
Rocky Mountain Hosp & Medical (Indiv) 63,086 835,048 $2.03 $1,697,836 $564,419 33.2%
Total 253,184 3,019,478 $3.54 $10,679,475 $5,909,259 55.3%
Medicare Supplement
Unicare Life & Health Insurance Co 78,000 980,650 $616.42 $604,487,508 $418,511,334 69.2%
Anthem Hlth Plans of VA Inc 102,316 1,230,658 $215.37 $265,043,834 $190,274,590 71.8%
Anthem Health Plans of KY Inc 76,403 928,488 $158.51 $147,177,916 $117,742,211 80.0%
Empire Healthchoice Assur Inc 58,008 723,237 $199.57 $144,338,205 $115,513,624 80.0%
BCBS of GA Inc (Group) 48,352 584,422 $172.65 $100,900,591 $70,379,830 69.8%
Anthem Health Plans Inc 37,775 467,283 $197.81 $92,432,339 $79,832,989 86.4%
Healthy Alliance Life Ins Co 38,398 464,600 $181.52 $84,336,179 $62,994,957 74.7%
BCBS of WI 27,453 338,990 $233.41 $79,123,988 $53,225,563 67.3%Anthem Health Plans Inc (Group) 21,507 261,277 $259.51 $67,803,658 $54,042,525 79.7%
Community Insurance Company (Group) 29,828 356,847 $173.47 $61,900,735 $46,968,129 75.9%
Anthem Health Plans of Me Inc 26,185 325,468 $175.56 $57,139,444 $45,207,894 79.1%
Anthem Health Plans of NH 23,746 281,390 $180.64 $50,828,937 $39,737,497 78.2%
Community Insurance Company 16,383 200,833 $210.93 $42,361,409 $30,085,752 71.0%
Rocky Mountain Hospital & Medical 16,117 189,556 $191.67 $36,332,921 $23,483,265 64.6%Unicare Health Ins Co of TX 5,388 70,183 $196.31 $13,777,380 $13,747,781 99.8%
Anthem Health Plans of NH (Group) 1,794 24,258 $459.38 $11,143,569 $10,281,894 92.3%
Unicare Health Ins Co of The Midwest 2,958 38,993 $233.16 $9,091,694 $6,246,941 68.7%
Unicare Life & Health Insurance Co 557 6,762 $1,122.14 $7,587,905 $4,323,811 57.0%
Healthy Alliance Life Ins Co 1,964 23,568 $152.94 $3,604,605 $3,627,827 100.6%
Anthem Health Plans of Me Inc (Group) 1,736 21,578 $140.18 $3,024,711 $2,277,297 75.3%
Compcare Health Services Ins Corp 309 3,932 $218.42 $858,815 $757,035 88.1%
Empire Healthchoice Assur Inc (Group) 130 1,697 $195.89 $332,429 $264,119 79.5%
Total 615,307 7,524,670 $250.33 $1,883,628,772 $1,389,526,865 73.8% Source: Company reports and Oppenheimer & Co. analysis.
HEALTHCAR

8/8/2019 May 2010 Oppenheimer Report
http://slidepdf.com/reader/full/may-2010-oppenheimer-report 12/41
12
Exhibit 7: WellPoint Other Results by Statutory Entity Continued, 2009
Member MedicalLives Months PMPM Premiums Expenses MLR
FEHBP
Anthem Hlth Plans of VA Inc 268,378 3,199,062 $346.92 $1,109,814,630 $1,043,702,467 94.0%
BCBS of GA Inc 173,341 2,072,223 $410.63 $850,924,466 $787,893,093 92.6%Rocky Mountain Hospital & Medical 97,143 1,158,845 $411.23 $476,549,869 $450,954,037 94.6%
Empire Healthchoice Assur Inc 98,648 1,185,893 $378.52 $448,886,118 $421,003,134 93.8%BCBS of WI 54,394 655,569 $499.28 $327,310,781 $311,556,283 95.2%
Healthy Alliance Life Ins Co 49,198 590,330 $392.58 $231,753,646 $230,488,843 99.5%Anthem Health Plans of NH 31,834 383,045 $508.21 $194,666,590 $185,650,461 95.4%Anthem Health Plans Inc 32,105 385,697 $423.46 $163,328,445 $154,195,533 94.4%
Anthem Health Plans of Me Inc 34,331 414,545 $370.06 $153,407,588 $144,090,230 93.9%HMO Missouri Inc 21,215 257,599 $369.63 $95,216,115 $91,220,120 95.8%
Unicare Health Plans of The Midwest 8,384 106,542 $394.58 $42,039,427 $39,252,829 93.4%Unicare Health Ins Co of The Midwest 36 355 $45.20 $16,047 -$3,333 -20.8%Community Insurance Company 0 0 NMF -$602,581 $715,317 -118.7%
Total 869,007 10,409,705 $393.22 $4,093,311,141 $3,860,719,014 94.3%
Total commercial 8,547,640 104,755,477 $287.09 $30,074,147,314 $24,989,639,799 83.1%
Dental
Anthem Blue Cross Life & Hlth Ins Co 308,113 3,969,216 $41.20 $163,536,186 $100,693,600 61.6%
Anthem Blue Cross Life & Hlth (Indiv) 162,764 1,995,990 $28.65 $57,176,238 $29,234,331 51.1%Community Insurance Company (Group) 150,217 1,904,349 $23.56 $44,874,399 $32,089,528 71.5%
Anthem Health Plans Inc (Group) 69,056 882,978 $35.38 $31,241,792 $21,037,548 67.3%Empire Healthchoice Assur Inc (Group) 94,835 1,225,832 $23.07 $28,274,865 $20,895,804 73.9%
Unicare Life & Health Insurance Co (Group) 57,744 817,315 $30.44 $24,881,614 $16,794,060 67.5%
Compcare Health Services Ins Corp (Group) 45,068 563,235 $31.51 $17,746,574 $13,831,569 77.9%BCBS of WI (Group) 57,140 697,334 $24.05 $16,772,046 $11,380,937 67.9%Rocky Mountain Hospital & Medical (Group) 40,296 497,867 $30.61 $15,240,408 $10,504,521 68.9%Healthy Alliance Life Ins Co (Group) 46,586 567,190 $22.07 $12,517,200 $7,323,938 58.5%
BCBS of GA Inc (Group) 49,359 593,415 $20.12 $11,941,959 $8,025,090 67.2%
Anthem Health Plans of KY Inc (Group) 28,143 332,740 $30.46 $10,135,948 $7,439,427 73.4%Healthy Alliance Life Ins Co 22,678 268,055 $20.30 $5,442,612 $2,893,349 53.2%
Rocky Mountain Hosp & Medical (Indiv) 23,046 272,764 $19.87 $5,420,266 $2,696,425 49.7%Anthem Health Plans of KY Inc (Indiv) 31,016 366,709 $10.09 $3,701,905 $2,102,099 56.8%
Unicare Life & Health Insurance Co 14,261 215,755 $14.24 $3,071,446 $786,336 25.6%
Anthem Health Plans of Me Inc (Group) 7,955 86,275 $29.34 $2,531,006 $1,897,005 75.0%
BCBS of WI (Indiv) 7,016 87,162 $24.20 $2,109,109 $963,673 45.7%Anthem Health Plans of NH (Group) 4,289 55,079 $32.08 $1,766,939 $1,303,394 73.8%Onenation Ins Co (Group) 295 4,068 $36.47 $148,347 $57,875 39.0%
Total 1,219,877 15,403,328 $29.77 $458,530,859 $291,950,509 63.7%
Stop loss
Community Insurance Company 521,739 6,370,318 $10.72 $68,317,681 $62,162,749 91.0%Anthem Health Plans Inc $47,890,963 $40,604,042 84.8%Anthem Blue Cross Life & Hlth Ins Co 445,880 3,535,057 $12.94 $45,731,322 $46,861,819 102.5%
BCBS of GA Inc $34,880,756 $29,972,371 85.9%BCBS of WI 84,377 1,059,619 $18.48 $19,582,115 $17,554,818 89.6%
Rocky Mountain Hospital & Medical $15,815,780 $15,912,626 100.6%
Bcbs Healthcare Plan of GA Inc $10,578,946 $3,851,750 36.4%Anthem Health Plans of NH $3,667,144 $523,958 14.3%
Matthew Thorton Health Plan Inc $3,038,724 $1,447,984 47.7%
Anthem Health Plans of Me Inc $2,024,693 $587,205 29.0%HMO Colorado Inc $807,480 $515,508 63.8%
Total 1,051,996 10,964,994 $23.01 $252,335,604 $219,994,830 87.2% Source: Company reports and Oppenheimer & Co. analysis.
HEALTHCARE

8/8/2019 May 2010 Oppenheimer Report
http://slidepdf.com/reader/full/may-2010-oppenheimer-report 13/41
Exhibit 8: WellPoint Other Results by Statutory Entity Continued, 2009
Member MedicalLives Months PMPM Premiums Expenses MLR
Accident only
Anthem Life Ins Co 1,019,266 13,208,542 $0.84 $11,061,147 $4,412,091 39.9%
Unicare Life & Health Insurance Co 315,039 4,172,152 $1.53 $6,372,596 $3,735,796 58.6%
Anthem Blue Cross Life & Hlth (Group) 384,566 4,696,640 $0.90 $4,219,454 $1,164,522 27.6%Greater Georgia Life Insurance Co 159,207 1,958,004 $0.64 $1,243,473 $808,897 65.1%
Unicare Health Ins Co of The Midwest 9,662 128,852 $0.81 $104,318 $37,609 36.1%
Anthem Blue Cross Life & Hlth (Individ) 64,408 784,377 $0.10 $81,538 $1,519 1.9%Anthem Life & Disability Ins Co 1,445 6,037 $2.00 $12,068 $3,343 27.7%Anthem Life Ins Co 11 150 $1.12 $168 $0 NMF
Total 1,953,604 24,954,754 $0.93 $23,094,762 $10,163,777 44.0%
Disability (Short-term)
Anthem Life Ins Co (Group) 146,121 1,193,154 $18.62 $22,212,780 $13,764,223 62.0%
Unicare Life & Health Insurance Co (Group) 35,340 470,819 $12.97 $6,108,709 $4,934,134 80.8%Greater Georgia Life Insurance Co (Group) 22,978 289,340 $15.64 $4,526,372 $2,563,313 56.6%
Unicare Health Ins Co of The Midwest 43 528 $12.48 $6,592 $1,361 20.6%Anthem Life & Disability Ins Co (Group) 61 61 $15.54 $948 $678 71.5%
Total 204,543 1,953,902 $16.82 $32,855,401 $21,263,709 64.7%
Disability (Long-term)
Anthem Life Ins Co (Group) 122,751 1,465,318 $24.31 $35,618,024 $23,230,400 65.2%
Unicare Life & Health Insurance Co (Group) 41,790 517,628 $16.05 $8,305,436 $2,104,785 25.3%Greater Georgia Life Insurance Co (Group) 18,527 230,909 $15.82 $3,652,381 $4,698,310 128.6%Unicare Health Ins Co of The Midwest 11 145 $88.83 $12,881 $0 0.0%
Anthem Life & Disability Ins Co (Group) 165 557 $23.03 $12,825 $9,213 71.8%
Anthem Life Ins Co 29 372 $20.08 $7,471 $11,942 159.8%
Total 183,273 2,214,929 $21.49 $47,609,018 $30,054,650 63.1%
Long-term Care
Anthem Blue Cross Life & Hlth Ins Co 2,265 27,870 $202.07 $5,631,658 $6,852,808 121.7%
Healthy Alliance Life Ins Co 139 1,668 $62.24 $103,821 $483,691 465.9%Anthem Health Plans of VA Inc. 0 0 NMF $84,943 -$14,803 -17.4%
BCBS of WI 32 384 $162.73 $62,488 $83,751 134.0%
Unicare Health Ins Co of The Midwest 9 110 $197.82 $21,760 $8,470 38.9%Unicare Life & Health Insurance Co 18 248 $77.97 $19,337 -$23,444 -121.2%
Total 2,463 30,280 $195.64 $5,924,007 $7,390,473 124.8%
Other group care
American Imaging Management E Llc 81,641 1,061,661 $21.19 $22,497,919 $21,075,959 93.7%Anthem Blue Cross Life & Hlth Ins Co 304,542 3,357,573 $5.41 $18,152,376 $10,614,493 58.5%
Empire Healthchoice Assur Inc 5,917 70,917 $124.76 $8,847,860 $5,437,986 61.5%
Anthem Health Plans Inc 11,057 130,434 $37.75 $4,923,833 $1,650,978 33.5%Rocky Mountain Hospital & Medical 1,911 20,596 $232.03 $4,778,787 $3,171,052 66.4%
Anthem Health Plans of KY Inc 98,758 1,124,828 $3.99 $4,487,004 $2,853,522 63.6%
Anthem Health Plans of Me Inc 23,655 279,786 $4.96 $1,388,282 $659,824 47.5%
Anthem Health Plans of NH 3,546 39,645 $6.48 $256,777 $98,478 38.4%BCBS of WI 6,960 $169,520 $81,103 47.8%
Anthem Life Ins Co 3 36 $0 $18,782
Total 537,990 6,085,476 $10.76 $65,502,358 $45,662,177 69.7%
Total Specialty $885,852,009 $626,480,125 70.7%
Overall $30,959,999,323 $25,616,119,924 82.7% Source: Company reports and Oppenheimer & Co. analysis.
In the next exhibit, we lay out a scenario analysis of what WellPoint’s rebates would have
been had the minimum medical loss ratio requirements been in effect in 2008, depending
on how much in SG&A / premium taxes plans are able to shift into medical costs. Note
that we’re doing these calculations on a statutory entity basis (rather than state by state)
a treatment that probably has a more negative impact on WellPoint than any other plan. In
addition, we aren’t giving any credit to plans for their ability to reduce broker commissions
or eliminate other non-essential SG&A.
HEALTHCAR
8/8/2019 May 2010 Oppenheimer Report
http://slidepdf.com/reader/full/may-2010-oppenheimer-report 14/41
14
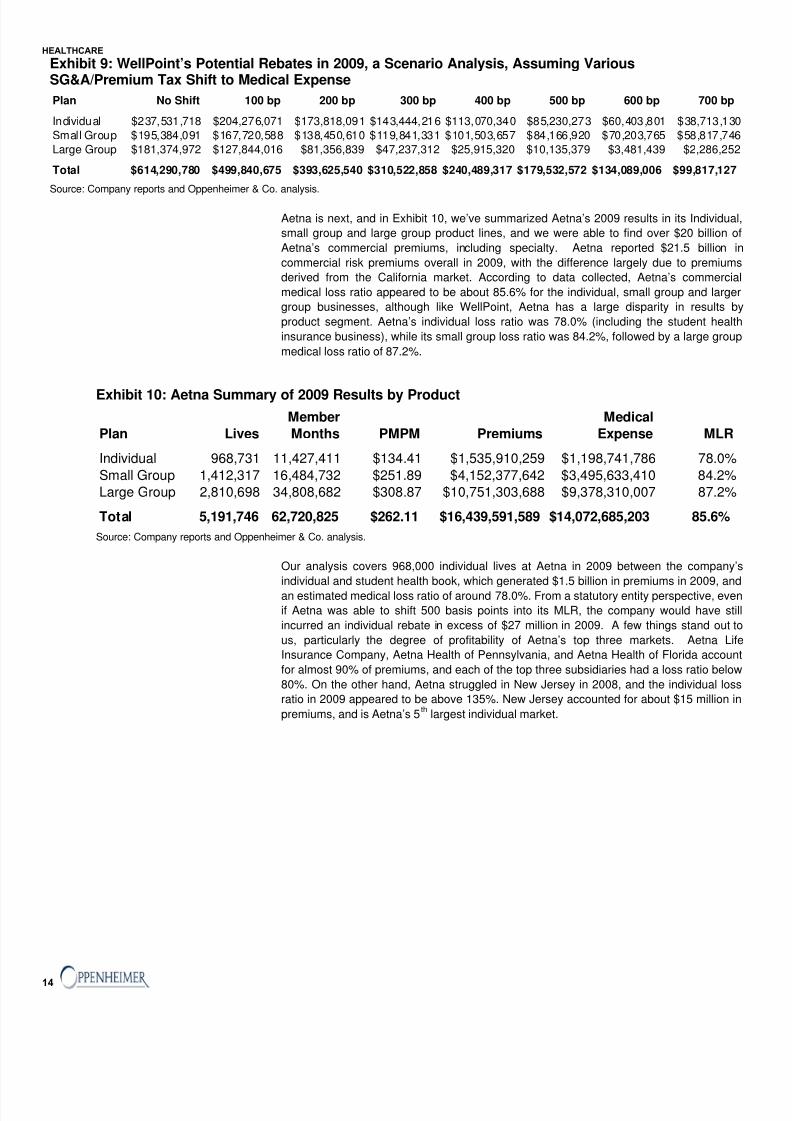
Exhibit 9: WellPoint’s Potential Rebates in 2009, a Scenario Analysis, Assuming VariousSG&A/Premium Tax Shift to Medical Expense
Plan No Shift 100 bp 200 bp 300 bp 400 bp 500 bp 600 bp 700 bp
Individual $237,531,718 $204,276,071 $173,818,091 $143,444,216 $113,070,340 $85,230,273 $60,403,801 $38,713,130Small Group $195,384,091 $167,720,588 $138,450,610 $119,841,331 $101,503,657 $84,166,920 $70,203,765 $58,817,746Large Group $181,374,972 $127,844,016 $81,356,839 $47,237,312 $25,915,320 $10,135,379 $3,481,439 $2,286,252
Total $614,290,780 $499,840,675 $393,625,540 $310,522,858 $240,489,317 $179,532,572 $134,089,006 $99,817,127 Source: Company reports and Oppenheimer & Co. analysis.
Aetna is next, and in Exhibit 10, we’ve summarized Aetna’s 2009 results in its Individual
small group and large group product lines, and we were able to find over $20 billion of
Aetna’s commercial premiums, including specialty. Aetna reported $21.5 billion in
commercial risk premiums overall in 2009, with the difference largely due to premiums
derived from the California market. According to data collected, Aetna’s commercia
medical loss ratio appeared to be about 85.6% for the individual, small group and larger
group businesses, although like WellPoint, Aetna has a large disparity in results by
product segment. Aetna’s individual loss ratio was 78.0% (including the student health
insurance business), while its small group loss ratio was 84.2%, followed by a large group
medical loss ratio of 87.2%.
Exhibit 10: Aetna Summary of 2009 Results by Product
Member MedicalPlan Lives Months PMPM Premiums Expense MLR
Individual 968,731 11,427,411 $134.41 $1,535,910,259 $1,198,741,786 78.0%
Small Group 1,412,317 16,484,732 $251.89 $4,152,377,642 $3,495,633,410 84.2%Large Group 2,810,698 34,808,682 $308.87 $10,751,303,688 $9,378,310,007 87.2%
Total 5,191,746 62,720,825 $262.11 $16,439,591,589 $14,072,685,203 85.6% Source: Company reports and Oppenheimer & Co. analysis.
Our analysis covers 968,000 individual lives at Aetna in 2009 between the company’s
individual and student health book, which generated $1.5 billion in premiums in 2009, and
an estimated medical loss ratio of around 78.0%. From a statutory entity perspective, even
if Aetna was able to shift 500 basis points into its MLR, the company would have stil
incurred an individual rebate in excess of $27 million in 2009. A few things stand out to
us, particularly the degree of profitability of Aetna’s top three markets. Aetna Life
Insurance Company, Aetna Health of Pennsylvania, and Aetna Health of Florida account
for almost 90% of premiums, and each of the top three subsidiaries had a loss ratio below
80%. On the other hand, Aetna struggled in New Jersey in 2008, and the individual loss
ratio in 2009 appeared to be above 135%. New Jersey accounted for about $15 million in
premiums, and is Aetna’s 5th
largest individual market.
HEALTHCARE

8/8/2019 May 2010 Oppenheimer Report
http://slidepdf.com/reader/full/may-2010-oppenheimer-report 15/41
Exhibit 11: Aetna Individual Results by Statutory Entity, 2009
Member MedicalIndividual Lives Months PMPM Premiums Expenses MLR
Aetna Life Insurance Co 359,541 4,047,278 $177.80 $719,620,244 $512,673,722 71.2%Aetna Health Inc PA Corp 36,490 477,613 $264.71 $126,429,380 $98,678,116 78.0%Aetna Health Inc FL Corp 44,443 555,888 $219.72 $122,137,375 $93,577,646 76.6%Aetna Health Inc NY Corp 8,218 102,207 $762.47 $77,930,135 $74,483,529 95.6%Aetna Health Inc NJ Corp 1,364 19,023 $811.46 $15,436,326 $20,781,713 134.6%Aetna Health Inc GA Corp 562 7,037 $504.14 $3,547,601 $4,927,103 138.9%
Aetna Health Inc TX Corp 86 1,114 $888.69 $989,999 $1,118,069 112.9%Aetna Health Inc 3 906 $357.44 $323,840 $79,651 24.6%Aetna Health Inc Co Corp 37 447 $715.78 $319,954 $1,010,328 315.8%Aetna Health Inc CT Corp 39 518 $567.11 $293,764 $263,843 89.8%Aetna Health Inc ME Corp 17 187 $905.72 $169,369 $326,680 192.9%Aetna Health of The Carolinas Inc 18 229 $634.74 $145,356 $282,977 194.7%Aetna Health Inc DE Corp 6 80 $382.73 $30,618 $37,897 123.8%
Total 450,824 5,212,527 $204.77 $1,067,373,961 $808,241,274 75.7%
Student
Aetna Life Insurance Co 517,907 6,214,884 $75.39 $468,536,298 $390,500,512 83.3% Source: Company reports and Oppenheimer & Co. analysis.
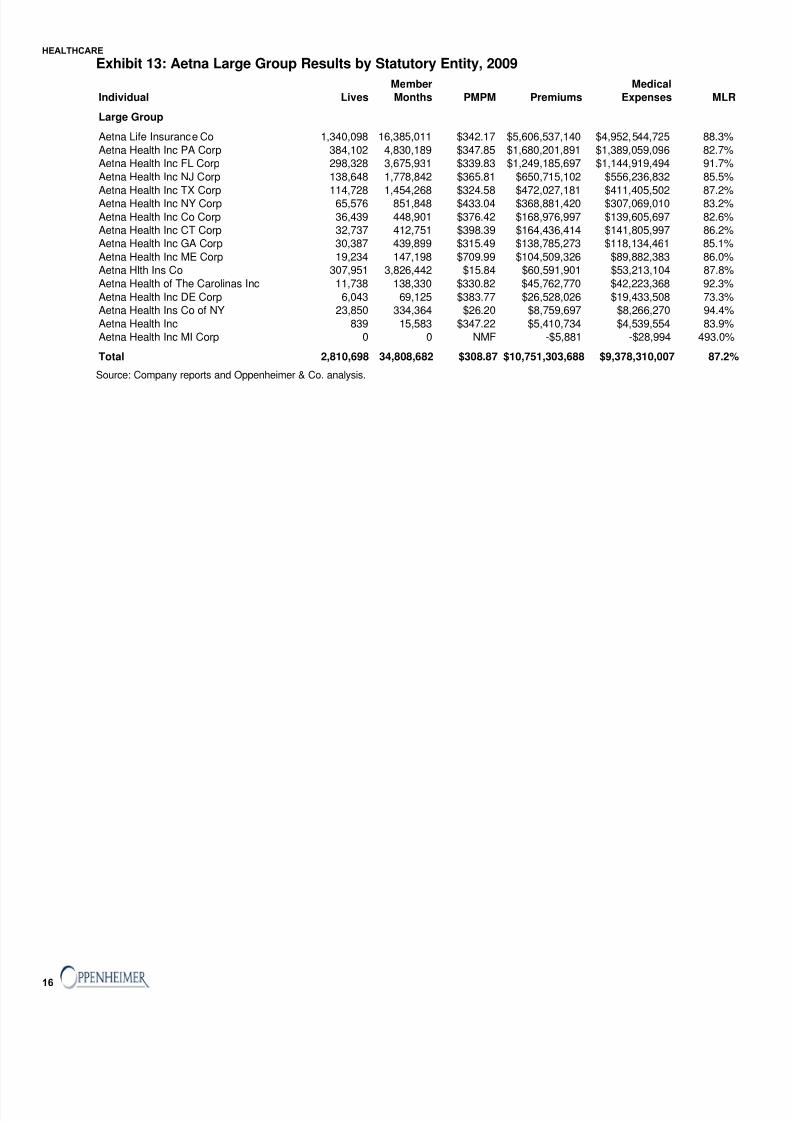
We won’t go into as much detail with each block of business at each plan, but looking atAetna’s small group business, the same pattern repeats, with some very profitable
markets (Florida and Texas) offset by some less profitable business in areas like Maryland
to arrive at an overall small group loss ratio of 79.4%. In the large group business, i
appears as though the company is producing a loss ratio substantially above the 85%
threshold, as only four of Aetna’s top ten large group markets had MLR’s below 85%.
Exhibit 12: Aetna Small Group Results by Statutory Entity, 2009
Member Medical
Individual Lives Months PMPM Premiums Expenses MLR
Small Group
Aetna Life Insurance Co 524,611 6,041,270 $306.68 $1,852,717,485 $1,582,377,988 85.4%Aetna Health Inc NJ Corp 157,941 1,970,254 $343.99 $677,740,318 $625,290,085 92.3%Aetna Health Inc PA Corp 190,389 2,232,034 $293.00 $653,984,981 $522,048,133 79.8%Aetna Health Inc FL Corp 127,899 1,630,551 $361.66 $589,707,409 $463,389,409 78.6%Aetna Health Inc GA Corp 48,451 533,422 $269.47 $143,739,061 $118,243,930 82.3%Aetna Health Inc TX Corp 28,491 319,085 $318.47 $101,618,484 $77,910,270 76.7%Aetna Health Inc CT Corp 18,024 174,418 $314.90 $54,924,593 $51,155,122 93.1%Aetna Health Inc NY Corp 5,371 60,766 $490.23 $29,789,113 $23,276,661 78.1%Aetna Hlth Ins Co 290,660 3,373,154 $5.91 $19,937,510 $10,746,354 53.9%Aetna Health Inc ME Corp 2,276 40,054 $415.40 $16,638,342 $12,227,818 73.5%Aetna Health of The Carolinas Inc 2,160 17,249 $303.67 $5,238,078 $4,120,210 78.7%Aetna Health Inc DE Corp 2,698 16,739 $310.07 $5,190,201 $3,730,581 71.9%Aetna Health Ins Co of NY 13,342 75,671 $14.05 $1,063,258 $1,203,808 113.2%Aetna Health Inc 4 65 $1,366.29 $88,809 -$86,959 -97.9%
Total 1,412,317 16,484,732 $251.89 $4,152,377,642 $3,495,633,410 84.2% Source: Company reports and Oppenheimer & Co. analysis.
HEALTHCAR
8/8/2019 May 2010 Oppenheimer Report
http://slidepdf.com/reader/full/may-2010-oppenheimer-report 16/41
16
Exhibit 13: Aetna Large Group Results by Statutory Entity, 2009
Member MedicalIndividual Lives Months PMPM Premiums Expenses MLR
Large Group
Aetna Life Insurance Co 1,340,098 16,385,011 $342.17 $5,606,537,140 $4,952,544,725 88.3%Aetna Health Inc PA Corp 384,102 4,830,189 $347.85 $1,680,201,891 $1,389,059,096 82.7%Aetna Health Inc FL Corp 298,328 3,675,931 $339.83 $1,249,185,697 $1,144,919,494 91.7%Aetna Health Inc NJ Corp 138,648 1,778,842 $365.81 $650,715,102 $556,236,832 85.5%Aetna Health Inc TX Corp 114,728 1,454,268 $324.58 $472,027,181 $411,405,502 87.2%Aetna Health Inc NY Corp 65,576 851,848 $433.04 $368,881,420 $307,069,010 83.2%Aetna Health Inc Co Corp 36,439 448,901 $376.42 $168,976,997 $139,605,697 82.6%Aetna Health Inc CT Corp 32,737 412,751 $398.39 $164,436,414 $141,805,997 86.2%Aetna Health Inc GA Corp 30,387 439,899 $315.49 $138,785,273 $118,134,461 85.1%Aetna Health Inc ME Corp 19,234 147,198 $709.99 $104,509,326 $89,882,383 86.0%Aetna Hlth Ins Co 307,951 3,826,442 $15.84 $60,591,901 $53,213,104 87.8%Aetna Health of The Carolinas Inc 11,738 138,330 $330.82 $45,762,770 $42,223,368 92.3%Aetna Health Inc DE Corp 6,043 69,125 $383.77 $26,528,026 $19,433,508 73.3%Aetna Health Ins Co of NY 23,850 334,364 $26.20 $8,759,697 $8,266,270 94.4%Aetna Health Inc 839 15,583 $347.22 $5,410,734 $4,539,554 83.9%Aetna Health Inc MI Corp 0 0 NMF -$5,881 -$28,994 493.0%
Total 2,810,698 34,808,682 $308.87 $10,751,303,688 $9,378,310,007 87.2% Source: Company reports and Oppenheimer & Co. analysis.
HEALTHCARE

8/8/2019 May 2010 Oppenheimer Report
http://slidepdf.com/reader/full/may-2010-oppenheimer-report 17/41
Exhibit 14: Aetna Other Results by Statutory Entity, 2009
Member MedicalIndividual Lives Months PMPM Premiums Expenses MLR
Medicare Supplement
Aetna Life Insurance Co 7,420 65,396 $164.84 $10,779,602 $9,071,468 84.2%
Total 7,420 65,396 $164.84 $10,779,602 $9,071,468 84.2%
FEHBP
Aetna Health Inc PA Corp 171,241 2,050,539 $366.05 $750,590,777 $645,307,719 86.0%Aetna Life Insurance Co 420,112 4,814,506 $58.61 $282,171,282 $255,812,778 90.7%
Aetna Health Inc NJ Corp 21,502 258,480 $460.89 $119,129,623 $106,798,039 89.6%Aetna Health Inc NY Corp 23,117 279,488 $424.75 $118,713,621 $103,908,703 87.5%Aetna Health Inc TX Corp 12,123 146,820 $414.58 $60,868,498 $55,674,162 91.5%
Aetna Health Inc GA Corp 11,817 144,398 $386.91 $55,868,344 $47,983,377 85.9%Aetna Health Inc CT Corp 971 11,314 $370.77 $4,194,943 $4,837,318 115.3%Aetna Health of The Carolinas Inc 938 10,147 $306.75 $3,112,566 $5,272,996 169.4%
Aetna Health Inc DE Corp 359 3,845 $360.31 $1,385,393 $1,050,197 75.8%Aetna Health Inc Co Corp 0 0 NMF $185,764 -$589,726 -317.5%Aetna Health Inc NMF $97,597 -$341,331 -349.7%
Total 662,180 7,719,537 $180.88 $1,396,318,408 $1,225,714,232 87.8%
Total commercial 5,861,346 70,505,758 $253.12 $17,846,689,599 $15,307,470,903 85.8%
Dental
Aetna Life Insurance Co 3,663,040 46,566,632 $24.15 $1,124,791,995 $884,211,265 78.6%
Aetna Dental Inc 323,044 5,461,053 $11.40 $62,282,437 $33,973,817 54.5%Aetna Dental Inc NJ Corp 188,492 2,306,247 $5.21 $12,004,344 $10,032,964 83.6%
Aetna Health Inc PA Corp 52,102 636,445 $18.54 $11,799,092 $8,952,607 75.9%
Aetna Health Inc GA Corp 52,043 650,112 $4.60 $2,988,430 $1,297,891 43.4%
Total 4,278,721 55,620,489 $21.82 $1,213,866,298 $938,468,544 77.3%
Stop loss
Aetna Life Insurance Co 1,986,724 23,840,638 $18.91 $450,814,679 $300,461,506 66.6%
Total 1,986,724 23,840,638 $18.91 $450,814,679 $300,461,506 66.6%
Accident only
Aetna Life Insurance Co. 2,992,694 35,912,328 $2.00 $71,661,493 $34,001,805 47.4%
Total 2,992,694 35,912,328 $2.00 $71,661,493 $34,001,805 47.4%
Disability (Short-term)
Aetna Life Insurance Co. 631,279 8,039,019 $17.73 $142,552,798 $107,230,113 75.2%
Total 631,279 8,039,019 $17.73 $142,552,798 $107,230,113 75.2%
Disability (Long-term)
Aetna Life Insurance Co. 2,098,325 26,137,603 $16.15 $422,052,098 $406,685,955 96.4%
Total 2,098,325 26,137,603 $16.15 $422,052,098 $406,685,955 96.4%
Long-term Care
Aetna Life Insurance Co. 76,413 1,071,357 -$16.03 -$17,177,220 -$29,806,900 173.5%
Other group care
Total Specialty $2,283,770,146 $1,757,041,023 76.9%
Overall $20,130,459,745 $17,064,511,926 84.8% Source: Company reports and Oppenheimer & Co. analysis.
HEALTHCAR

8/8/2019 May 2010 Oppenheimer Report
http://slidepdf.com/reader/full/may-2010-oppenheimer-report 18/41
18
The scenario analysis of what Aetna’s rebates would have been had the minimum medica
loss ratio requirements been in effect in 2009 is shown below. If the company could have
shifted 500 basis points of SG&A into the MLR, Aetna would have paid a rebate of $33
million under the new laws laid out in reform. Again, keep in mind that we aren’t giving
any credit to plans for their ability to reduce broker commissions or eliminate other non-
essential SG&A.
Exhibit 15: Aetna’s Potential Rebates In 2009, a Scenario Analysis, Assuming Various SG&A / Premium
Tax Shift to Medical ExpensePlan No Shift 100 bp 200 bp 300 bp 400 bp 500 bp 600 bp 700 bp
Individual $69,799,536 $60,114,428 $50,492,519 $42,071,704 $34,404,131 $27,204,690 $20,005,249 $12,805,808Small Group $20,391,865 $11,569,933 $7,381,146 $5,946,412 $5,191,901 $4,773,353 $4,354,804 $4,018,084
Large Group $52,792,343 $30,292,352 $8,738,438 $2,319,473 $2,054,193 $1,788,913 $1,523,633 $1,258,352
Total $142,983,744 $101,976,713 $66,612,103 $50,337,590 $41,650,225 $33,766,955 $25,883,686 $18,082,244 Source: Company reports and Oppenheimer & Co. analysis.
In the case of Humana, we‘ve summarized the company’s 2009 results in Exhibit 16. We
were able to track down $6.1 billion of Humana’s commercial premiums. Humana had a
total of $6.2 billion in commercial premiums overall in 2009. Humana’s commercia
medical loss ratio appeared to be about 83.1% in the individual, small group and large
group segments, and the breakdown by product makes clear that loss ratios diffematerially by product, as Humana’s individual loss ratio was 68.1% for the subsidiaries we
analyzed, while its small group loss ratio was 80.0%, followed by a large group medica
loss ratio of 88.2%.
Exhibit 16: Humana Summary of 2009 Results by Product
Member Medical
Plan Lives Months PMPM Premiums Expense MLR
Individual 382,412 4,368,359 $138.52 $605,085,496 $412,170,572 68.1%
Small Group 565,372 7,105,633 $299.48 $2,127,994,874 $1,703,155,307 80.0%Large Group 783,031 9,934,372 $306.10 $3,040,915,262 $2,683,218,711 88.2%
Total 1,730,815 21,408,364 $269.71 $5,773,995,632 $4,798,544,590 83.1% Source: Company reports and Oppenheimer & Co. analysis.
Our analysis covered 382,000 individual lives for Humana during 2009. These individua
members generated $605 million in premiums in 2009, and an estimated medical loss
ratio of around 68.1%. From a statutory entity perspective, even if Humana was able to
shift 500 basis points into its MLR, the company would have still incurred an individua
rebate in excess of $43 million in 2009, or $0.16 per share. Looking at the data, it appears
that Humana’s top subsidiary is extremely profitable. Humana Insurance Co. accounts fo
about 63% of the company’s individual premiums, and had a loss ratio of 68% during
2009, well below the threshold of 80% that will go into effect on January 1, 2011.
HEALTHCARE

8/8/2019 May 2010 Oppenheimer Report
http://slidepdf.com/reader/full/may-2010-oppenheimer-report 19/41
Exhibit 17: Humana Individual Results by Statutory Entity, 2009
Member Medical
Individual Lives Months PMPM Premiums Expenses ML
Humana Ins Co 241,548 2,745,342 $139.06 $381,766,173 $258,694,277 67.8%
Humana Health Insurance Co of FL Inc 81,609 950,649 $155.76 $148,076,760 $99,128,434 66.9%
Humana Health Benefit Plan of LA Inc 12,426 151,829 $193.15 $29,325,146 $21,756,956 74.2%Humana Health Plan Inc 18,269 234,806 $113.93 $26,752,412 $19,080,906 71.3%Humana Employers Health Plan GA Inc 13,467 133,827 $107.32 $14,361,935 $7,789,928 54.2%
Humana Medical Plan Inc 185 2,061 $749.74 $1,545,223 $2,005,235 129.8%
Humana Health Plan of Ohio Inc 102 1,257 $560.52 $704,573 $1,321,329 187.5%Humana Ins Co of KY 19 272 $775.33 $210,891 $425,572 201.8%
Humana Health Plan of TX Inc 3 36 $1,036.44 $37,312 $3,983 10.7%
Humana WI Health Org Ins Corp 1 12 $2,260.83 $27,130 $35,357 130.3%
Total 367,629 4,220,091 $142.84 $602,807,555 $410,241,977 68.1
Other Individual Business
Denticare Inc 11,879 111,894 $10.83 $1,212,078 $828,586 68.4%
Kanawha Insurance Co 2,904 36,374 $29.30 $1,065,863 $1,100,009 103.2%
Total 14,783 148,268 $15.36 $2,277,941 $1,928,595 84.7
Source: Company reports and Oppenheimer & Co. analysis.
Looking at Humana’s small group business, the loss ratio for was just above the 80%threshold, but there are variations among the subsidiaries. Humana Health Plan of Texas
had $170 million in premiums, and a loss ratio of just 70%. Humana Insurance, however
the company’s largest small group subsidiary, had a loss ratio of 81.8 %, in excess of the
threshold.
Exhibit 18: Humana Small Group Results by Statutory Entity, 2009
Member $0.63 Medical
Individual Lives Months PMPM Premiums Expenses MLR
Small Group
Humana Ins Co 274,794 3,495,719 $333.58 $1,166,114,745 $953,634,043 81.8%Humana Health Plan Inc 87,060 1,113,114 $247.00 $274,938,069 $215,948,938 78.5%
Humana Health Plan of TX Inc 64,102 722,875 $235.39 $170,154,160 $119,800,579 70.4%Humana Medical Plan Inc 33,593 444,590 $322.26 $143,274,983 $128,260,392 89.5%Humana Employers Health Plan GA Inc 36,090 417,333 $247.64 $103,347,153 $65,702,968 63.6%Humana Health Plan of Ohio Inc 26,583 330,723 $232.16 $76,782,133 $60,257,676 78.5%Humana Health Benefit Plan of LA Inc 15,934 194,180 $300.04 $58,262,229 $47,979,729 82.4%Humana WI Health Org Ins Corp 12,289 158,985 $283.65 $45,096,516 $39,366,948 87.3%Humana Health Insurance Co of FL Inc 3,613 56,264 $607.08 $34,156,913 $28,126,378 82.3%Cariten Insurance Co 5,898 85,277 $328.17 $27,985,336 $21,436,930 76.6%
Cariten Health Plan Inc 4,428 54,969 $277.05 $15,229,259 $11,891,238 78.1%Humana Benefit Plan of IL Inc 656 26,245 $409.96 $10,759,437 $9,469,621 88.0%Emphesys Ins Co 308 5,058 $281.26 $1,422,636 $915,647 64.4%Humana Ins Co of KY 24 301 $1,565.80 $471,305 $364,220 77.3%
Total 565,372 7,105,633 $299.48 $2,127,994,874 $1,703,155,307 80.0%
Association / Trust
Humana Medical Plan Inc 1,267 14,037 $316.95 $4,449,006 $4,475,098 100.6%Humana Ins Co 607 11,338 $174.33 $1,976,593 $1,988,618 100.6%Humana Health Insurance Co of FL Inc 438 5,023 $379.57 $1,906,598 $2,205,519 115.7%
Total 2,312 30,398 $274.10 $8,332,197 $8,669,235 104.0% Source: Company reports and Oppenheimer & Co. analysis.
HEALTHCAR

8/8/2019 May 2010 Oppenheimer Report
http://slidepdf.com/reader/full/may-2010-oppenheimer-report 20/41
20
Exhibit 19: Humana Large Group Results by Statutory Entity, 2009
Member $0.63 Medical
Individual Lives Months PMPM Premiums Expenses MLR
Large Group
Humana Ins Co 196,947 2,547,320 $316.28 $805,659,139 $751,069,845 93.2%Humana Health Plan Inc 149,470 2,005,040 $269.25 $539,847,414 $455,529,795 84.4%
Humana Medical Plan Inc 122,724 1,499,215 $328.39 $492,331,306 $441,341,813 89.6%Humana Health Plan of TX Inc 74,344 892,627 $235.10 $209,853,398 $173,224,486 82.5%
Humana WI Health Org Ins Corp 41,980 503,069 $409.08 $205,795,583 $185,502,476 90.1%Humana Health Plan of Ohio Inc 61,402 783,067 $262.62 $205,647,272 $169,383,535 82.4%
Humana Health Benefit Plan of LA Inc 41,624 513,435 $350.59 $180,003,914 $155,701,196 86.5%Humana Benefit Plan of IL Inc 17,065 231,614 $455.71 $105,549,041 $95,606,760 90.6%
Humana Health Insurance Co of FL Inc 17,428 229,350 $444.06 $101,845,266 $90,992,981 89.3%Humana Employers Health Plan GA Inc 34,790 409,133 $247.67 $101,329,472 $83,749,959 82.7%Cariten Health Plan Inc 14,190 178,395 $288.07 $51,390,656 $43,732,755 85.1%Cariten Insurance Co 10,512 138,595 $288.56 $39,992,306 $35,491,144 88.7%
Humana Ins Co of KY 512 2,745 $491.10 $1,348,061 $1,838,565 136.4%Emphesys Ins Co 43 767 $420.38 $322,434 $53,401 16.6%
Total 783,031 9,934,372 $306.10 $3,040,915,262 $2,683,218,711 88.2%
Source: Company reports and Oppenheimer & Co. analysis.
HEALTHCARE

8/8/2019 May 2010 Oppenheimer Report
http://slidepdf.com/reader/full/may-2010-oppenheimer-report 21/41
Exhibit 20: Humana Other Results by Statutory Entity, 2009
Member MedicalIndividual Lives Months PMPM Premiums Expenses MLR
Medicare Supplement
Humana Ins Co 26,153 266,512 $150.85 $40,203,673 $35,524,918 88.4%Kanawha Insurance Co 1,276 18,021 $252.47 $4,549,842 $3,108,211 68.3%
Humana Ins Co of KY 1,646 16,779 $145.95 $2,448,835 $2,135,338 87.2%Humana Health Benefit Plan of LA Inc 525 6,060 $204.55 $1,239,566 $981,575 79.2%
Humana Health Insurance Co of FL Inc 279 3,348 $67.52 $226,058 $183,870 81.3%Humana Ins Co of NY 111 522 $180.82 $94,386 $105,294 111.6%Humana Health Plan Inc 2 33 $279.76 $9,232 $3,512 38.0%
Total 29,992 311,275 $156.68 $48,771,592 $42,042,718 86.2%
Limited Benefit
Compbenefits - Group 1,661,122 19,933,969 $2.05 $40,879,398 $39,090,817 95.6%Compbenefits Ins Co 425,206 5,297,032 $6.93 $36,715,650 $22,725,506 61.9%
The Dental Concern Inc 86,495 768,081 $7.47 $5,738,605 $4,148,998 72.3%Humana Ins Co 63,809 814 $3,882.34 $3,160,227 $1,855,962 58.7%Kanawha Insurance Co 7,886 89,010 $15.92 $1,417,405 $523,851 37.0%
Humana Ins Co of KY 7,181 73,460 $4.80 $352,485 $290,436 82.4%Humana Health Benefit Plan of LA Inc 2,359 28,416 $6.17 $175,405 $60,219 34.3%Compbenefits - Individual 1,142 13,199 $8.82 $116,407 $394,479 338.9%
Total 2,255,200 26,203,981 $3.38 $88,555,582 $69,090,268 78.0%
FEHBP
Humana Health Plan Inc 22,987 279,855 $383.67 $107,371,182 $95,215,359 88.7%
Humana Health Plan of TX Inc 14,498 176,422 $380.45 $67,120,431 $63,556,336 94.7%Humana Medical Plan Inc 8,741 105,093 $327.65 $34,434,044 $32,607,236 94.7%Humana Ins Co 2,445 28,097 $337.88 $9,493,350 $8,052,174 84.8%Compbenefits Co 10,879 125,285 $65.03 $8,147,692 $3,527,951 43.3%Humana Health Plan of Ohio Inc 1,490 17,945 $246.86 $4,429,977 $7,526,320 169.9%Humana Employers Health Plan GA Inc 1,463 16,183 $255.23 $4,130,405 $4,154,708 100.6%
Compbenefits Dental Inc 17,684 199,777 $18.96 $3,788,475 $2,053,353 54.2%Denticare Inc 10,188 117,987 $19.65 $2,318,792 $649,262 28.0%Humana Benefit Plan of IL Inc 1,696 20,433 $94.25 $1,925,790 $1,960,980 101.8%
Humana Health Insurance Co of FL Inc 473 5,430 $304.15 $1,651,529 $2,652,141 160.6%
Humana Health Benefit Plan of LA Inc 260 3,056 $273.24 $835,020 $680,285 81.5%American Dental Plan of NC Inc 1,470 16,411 $28.40 $466,054 $268,913 57.7%
American Dental Providers of AR Inc 392 4,532 $24.27 $109,988 $50,705 46.1%
Total 94,666 1,116,506 $220.53 $246,222,729 $222,955,723 90.6%
Total commercial 1,843,002 22,718,275 $271.31 $6,163,599,791 $5,139,373,939 83.4%
Dental - Individual
Humanadental Ins Co 55,138 608,256 $28.70 $17,456,888 $10,709,198 61.3%Compbenefits Co 115,476 1,355,558 $7.29 $9,886,196 $9,145,069 92.5%Kanawha Insurance Co 5,770 72,258 $28.82 $2,082,451 $1,680,720 80.7%Compbenefits Dental Inc 16,734 179,066 $9.62 $1,722,599 $1,357,060 78.8%Denticare Inc 11,879 111,894 $10.83 $1,212,078 $828,586 68.4%
The Dental Concern Inc 3,571 38,970 $24.84 $967,981 $669,626 69.2%American Dental Plan of NC Inc 3,231 18,775 $15.02 $281,983 $282,129 100.1%American Dental Providers of AR Inc 176 2,269 $9.27 $21,044 $16,107 76.5%
Total 211,975 2,387,046 $14.09 $33,631,220 $24,688,495 73.4% Source: Company reports and Oppenheimer & Co. analysis.
HEALTHCAR

8/8/2019 May 2010 Oppenheimer Report
http://slidepdf.com/reader/full/may-2010-oppenheimer-report 22/41
22
Exhibit 21: Humana Other Results by Statutory Entity, 2009
Member MedicalIndividual Lives Months PMPM Premiums Expenses MLR
Dental - Group
Humanadental Ins Co 859,894 10,246,458 $27.11 $277,759,322 $189,236,665 68.1%Compbenefits Ins Co 379,895 4,783,247 $18.94 $90,583,854 $67,675,258 74.7%Compbenefits Co 717,875 8,716,433 $7.94 $69,215,402 $43,155,028 62.3%
The Dental Concern Inc 69,212 836,970 $18.79 $15,726,808 $11,221,596 71.4%Denticare Inc 258,997 1,713,207 $8.93 $15,302,167 $9,886,861 64.6%
Compbenefits Dental Inc 78,478 934,103 $11.14 $10,408,707 $7,638,917 73.4%Kanawha Insurance Co 11,480 137,760 $27.22 $3,750,486 $2,905,552 77.5%Humana Ins Co of KY 8,691 111,171 $19.68 $2,187,725 $1,147,161 52.4%
Dental Concern Ltd 3,455 45,288 $15.54 $703,671 $412,324 58.6%Humana Ins Co 47 581,085 $0.10 $58,442 $542,433 928.2%
American Dental Plan of NC Inc 417 5,197 $10.24 $53,197 $46,028 86.5%American Dental Providers of AR Inc 225 2,679 $11.76 $31,508 $27,295 86.6%
Total 2,388,666 28,113,598 $17.28 $485,781,289 $333,895,118 68.7%
382,412 605,085,496 412,170,572 68.1%Stop loss
Humana Ins Co 216,320 2,595,840 $19.97 $51,826,657 $43,784,443 84.5%Kanawha Insurance Co 324,289 1,618,446 $21.02 $34,022,115 $30,365,669 89.3%Humana Ins Co of KY 111,821 1,341,852 $9.23 $12,386,878 $11,468,555 92.6%
Humana Health Insurance Co of FL Inc $3,897,966 $3,494,612 89.7%
Humana Health Benefit Plan of LA Inc $1,478,340 $1,170,262 79.2%Total 111,821 1,341,852 $77.22 $103,611,956 $90,283,541 87.1%
Specified Disease
Kanawha Insurance Co (Individual) 72,386 828,813 $14.74 $12,218,501 $12,349,672 101.1%Kanawha Insurance Co (Group) 18,308 181,695 $4.99 $906,731 $94,749 10.4%
Total 90,694 1,010,508 $12.99 $13,125,232 $12,444,421 94.8%
Accident only
Humana Ins Co 435 1,201 $2,816.04 $3,382,068 $671,600 19.9%Kanawha Insurance Co 16,741 162,425 $14.35 $2,330,613 $703,437 30.2%
Kanawha Insurance Co (Group) 16,945 20,827 $33.60 $699,883 $81,682 11.7%Humana Ins Co of KY 0 0 NMF $293,234 $1,791,151 610.8%
Total 34,121 184,453 $36.36 $6,705,798 $3,247,870 48.4%
Disability (Short-term)
Kanawha Insurance Co (Individual) 36,381 431,482 $37.34 $16,113,659 $11,759,392 73.0%Kanawha Insurance Co (Group) 24,624 311,371 $20.40 $6,352,654 $3,553,914 55.9%Humana Ins Co 6,476 86,488 $22.04 $1,906,624 $604,284 31.7%
Humana Ins Co of KY 357 4,485 $24.76 $111,065 $36,845 33.2%
Total 67,838 833,826 $29.36 $24,484,002 $15,954,435 65.2%
Disability (Long-term)
Kanawha Insurance Co 36,971 443,654 $12.95 $5,745,459 $3,397,713 59.1%Humana Ins Co 4,035 48,420 $41.38 $2,003,550 $5,165,366 257.8%
Humanadental Ins Co 161 1,932 $21.86 $42,229 $325,663 771.2%
Total 41,167 494,006 $15.77 $7,791,238 $8,888,742 114.1%
Long-term Care
Kanawha Insurance Co 36,243 437,802 $122.25 $53,519,513 $124,404,469 232.4%
Other group care
Kanawha Insurance Co 4,017 426,025 $0.33 $139,458 $1,425 1.0%
Total Specialty $731,067,647 $615,737,111 84.2%
Overall 6,894,667,438 5,755,111,050 83.5% Source: Company reports and Oppenheimer & Co. analysis.
HEALTHCARE

8/8/2019 May 2010 Oppenheimer Report
http://slidepdf.com/reader/full/may-2010-oppenheimer-report 23/41
In the next exhibit, we lay out a scenario analysis of what Humana’s rebates would have
been had the minimum medical loss ratio requirements been in effect in 2008, depending
on how much in SG&A / premium taxes plans are able to shift into medical costs. In
addition, we aren’t giving any credit to plans for their ability to reduce broker commissions
or eliminate other non-essential SG&A. Assuming a 500 basis points shift, Humana would
have incurred a hit of nearly $64 million.
Exhibit 22: Humana’s Potential Rebates in 2009, a Scenario Analysis, Assuming Various SG&A /
Premium Tax Shift to Medical ExpensePlan No Shift 100 bp 200 bp 300 bp 400 bp 500 bp 600 bp 700 bp
Individual $73,942,383 $67,927,065 $61,911,746 $55,896,428 $49,881,110 $43,865,792 $37,906,822 $32,184,755Small Group $39,945,845 $33,242,544 $28,416,516 $25,384,025 $22,523,007 $19,773,768 $17,024,528 $14,275,289Large Group $16,508,816 $7,996,783 $2,825,257 $210,995 $207,771 $204,546 $201,322 $198,098
Total $130,397,043 $109,166,392 $93,153,520 $81,491,449 $72,611,888 $63,844,106 $55,132,672 $46,658,141 Source: Company reports and Oppenheimer & Co. analysis.
In Exhibit 23, we’ve summarized United’s results for 2009. We were able to account fo
$37 billion of the company’s commercial premiums. United’s overall commercial medica
loss ratio appeared to be about 81.4%, driven by an individual loss ratio of 70.2%, a smal
group loss ratio of 80.4%, and a large group medical loss ratio of 83.1%. That said
premiums for the individual represent just 5-6% of total commercial premiums, with largegroup accounting for the largest portion of the total revenue.
Exhibit 23: United Summary of 2009 Results by Product
Member Medical
Plan Lives Months PMPM Premiums Expense MLR
Individual 797,235 9,533,337 $198.18 $1,889,321,462 $1,326,568,358 70.2%
Small Group 2,870,711 35,274,436 $286.99 $10,123,304,939 $8,140,870,159 80.4%
Large Group 4,426,949 54,499,598 $317.81 $17,320,490,992 $14,400,667,638 83.1%
Total 8,094,895 99,307,371 $295.38 $29,333,117,393 $23,868,106,155 81.4% Source: Company reports and Oppenheimer & Co. analysis.
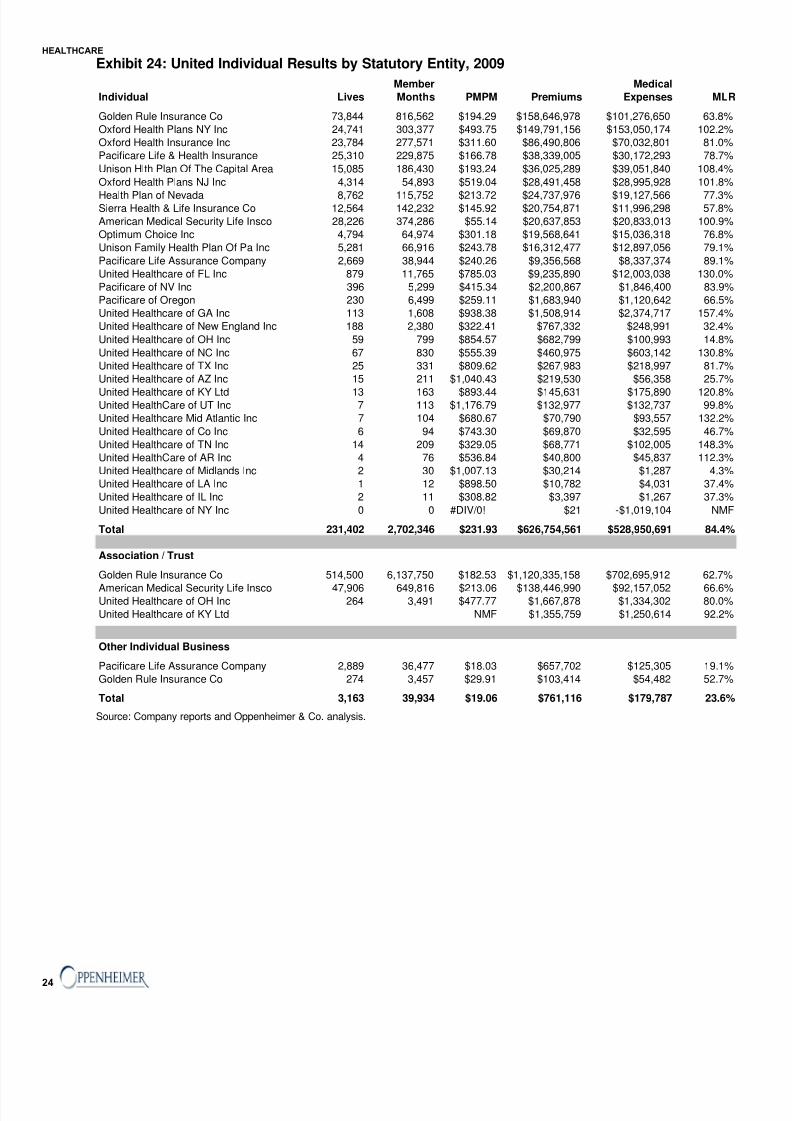
Our individual analysis shown below includes roughly 797,000 student health insurance
lives, along with the significant amount of business that Golden Rule writes through its
trust / association product. United’s individual product had a loss ratio of 70.2%
suggesting that even if United is able to shift significant SG&A to its medical expense, it
will still incur a large rebate. In particular, the company’s Golden Rule was quite profitable
in 2009.
HEALTHCAR
8/8/2019 May 2010 Oppenheimer Report
http://slidepdf.com/reader/full/may-2010-oppenheimer-report 24/41
24
Exhibit 24: United Individual Results by Statutory Entity, 2009
Member Medical
Individual Lives Months PMPM Premiums Expenses MLR
Golden Rule Insurance Co 73,844 816,562 $194.29 $158,646,978 $101,276,650 63.8%
Oxford Health Plans NY Inc 24,741 303,377 $493.75 $149,791,156 $153,050,174 102.2%
Oxford Health Insurance Inc 23,784 277,571 $311.60 $86,490,806 $70,032,801 81.0%
Pacificare Life & Health Insurance 25,310 229,875 $166.78 $38,339,005 $30,172,293 78.7%
Unison Hlth Plan Of The Capital Area 15,085 186,430 $193.24 $36,025,289 $39,051,840 108.4%
Oxford Health Plans NJ Inc 4,314 54,893 $519.04 $28,491,458 $28,995,928 101.8%
Health Plan of Nevada 8,762 115,752 $213.72 $24,737,976 $19,127,566 77.3%Sierra Health & Life Insurance Co 12,564 142,232 $145.92 $20,754,871 $11,996,298 57.8%
American Medical Security Life Insco 28,226 374,286 $55.14 $20,637,853 $20,833,013 100.9%
Optimum Choice Inc 4,794 64,974 $301.18 $19,568,641 $15,036,318 76.8%
Unison Family Health Plan Of Pa Inc 5,281 66,916 $243.78 $16,312,477 $12,897,056 79.1%
Pacificare Life Assurance Company 2,669 38,944 $240.26 $9,356,568 $8,337,374 89.1%
United Healthcare of FL Inc 879 11,765 $785.03 $9,235,890 $12,003,038 130.0%
Pacificare of NV Inc 396 5,299 $415.34 $2,200,867 $1,846,400 83.9%
Pacificare of Oregon 230 6,499 $259.11 $1,683,940 $1,120,642 66.5%
United Healthcare of GA Inc 113 1,608 $938.38 $1,508,914 $2,374,717 157.4%
United Healthcare of New England Inc 188 2,380 $322.41 $767,332 $248,991 32.4%
United Healthcare of OH Inc 59 799 $854.57 $682,799 $100,993 14.8%
United Healthcare of NC Inc 67 830 $555.39 $460,975 $603,142 130.8%
United Healthcare of TX Inc 25 331 $809.62 $267,983 $218,997 81.7%
United Healthcare of AZ Inc 15 211 $1,040.43 $219,530 $56,358 25.7%
United Healthcare of KY Ltd 13 163 $893.44 $145,631 $175,890 120.8%United HealthCare of UT Inc 7 113 $1,176.79 $132,977 $132,737 99.8%
United Healthcare Mid Atlantic Inc 7 104 $680.67 $70,790 $93,557 132.2%
United Healthcare of Co Inc 6 94 $743.30 $69,870 $32,595 46.7%
United Healthcare of TN Inc 14 209 $329.05 $68,771 $102,005 148.3%
United HealthCare of AR Inc 4 76 $536.84 $40,800 $45,837 112.3%
United Healthcare of Midlands Inc 2 30 $1,007.13 $30,214 $1,287 4.3%
United Healthcare of LA Inc 1 12 $898.50 $10,782 $4,031 37.4%
United Healthcare of IL Inc 2 11 $308.82 $3,397 $1,267 37.3%
United Healthcare of NY Inc 0 0 #DIV/0! $21 -$1,019,104 NMF
Total 231,402 2,702,346 $231.93 $626,754,561 $528,950,691 84.4%
Association / Trust
Golden Rule Insurance Co 514,500 6,137,750 $182.53 $1,120,335,158 $702,695,912 62.7%
American Medical Security Life Insco 47,906 649,816 $213.06 $138,446,990 $92,157,052 66.6%United Healthcare of OH Inc 264 3,491 $477.77 $1,667,878 $1,334,302 80.0%
United Healthcare of KY Ltd NMF $1,355,759 $1,250,614 92.2%
Other Individual Business
Pacificare Life Assurance Company 2,889 36,477 $18.03 $657,702 $125,305 19.1%
Golden Rule Insurance Co 274 3,457 $29.91 $103,414 $54,482 52.7%
Total 3,163 39,934 $19.06 $761,116 $179,787 23.6% Source: Company reports and Oppenheimer & Co. analysis.
HEALTHCARE
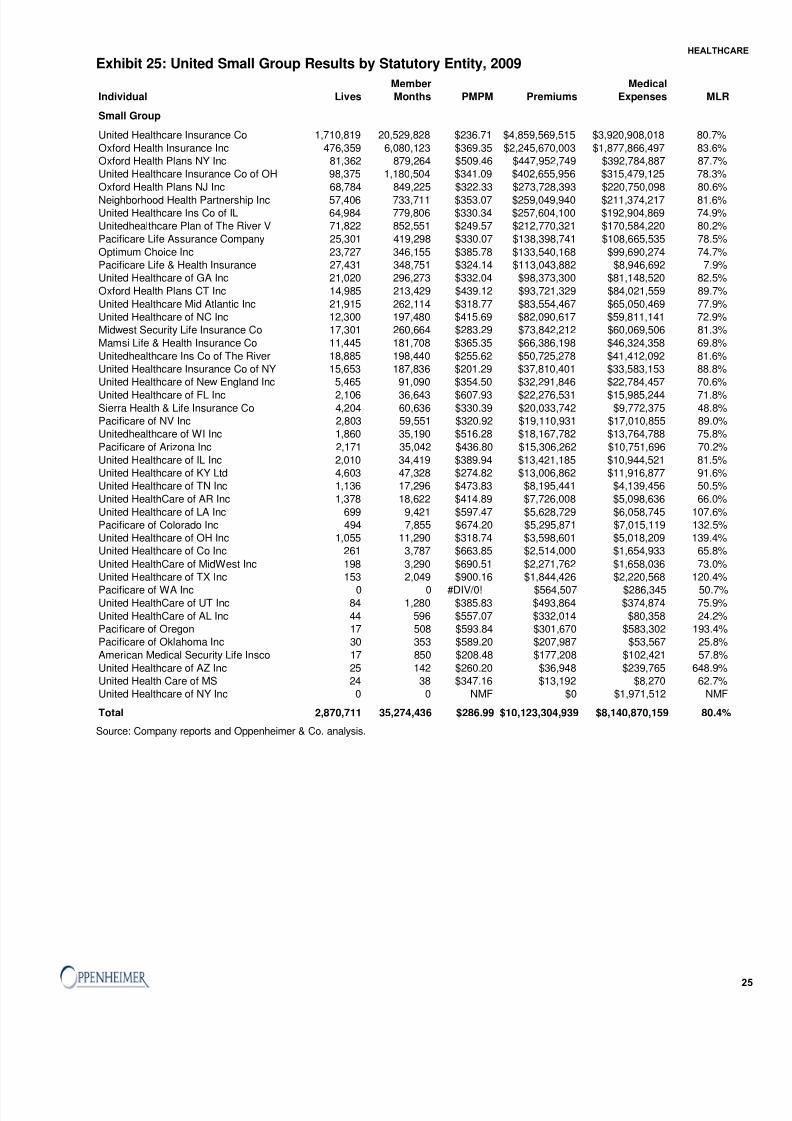
8/8/2019 May 2010 Oppenheimer Report
http://slidepdf.com/reader/full/may-2010-oppenheimer-report 25/41
Exhibit 25: United Small Group Results by Statutory Entity, 2009
Member Medical
Individual Lives Months PMPM Premiums Expenses MLR
Small Group
United Healthcare Insurance Co 1,710,819 20,529,828 $236.71 $4,859,569,515 $3,920,908,018 80.7%
Oxford Health Insurance Inc 476,359 6,080,123 $369.35 $2,245,670,003 $1,877,866,497 83.6%Oxford Health Plans NY Inc 81,362 879,264 $509.46 $447,952,749 $392,784,887 87.7%United Healthcare Insurance Co of OH 98,375 1,180,504 $341.09 $402,655,956 $315,479,125 78.3%
Oxford Health Plans NJ Inc 68,784 849,225 $322.33 $273,728,393 $220,750,098 80.6%
Neighborhood Health Partnership Inc 57,406 733,711 $353.07 $259,049,940 $211,374,217 81.6%United Healthcare Ins Co of IL 64,984 779,806 $330.34 $257,604,100 $192,904,869 74.9%Unitedhealthcare Plan of The River V 71,822 852,551 $249.57 $212,770,321 $170,584,220 80.2%
Pacificare Life Assurance Company 25,301 419,298 $330.07 $138,398,741 $108,665,535 78.5%
Optimum Choice Inc 23,727 346,155 $385.78 $133,540,168 $99,690,274 74.7%Pacificare Life & Health Insurance 27,431 348,751 $324.14 $113,043,882 $8,946,692 7.9%United Healthcare of GA Inc 21,020 296,273 $332.04 $98,373,300 $81,148,520 82.5%
Oxford Health Plans CT Inc 14,985 213,429 $439.12 $93,721,329 $84,021,559 89.7%
United Healthcare Mid Atlantic Inc 21,915 262,114 $318.77 $83,554,467 $65,050,469 77.9%United Healthcare of NC Inc 12,300 197,480 $415.69 $82,090,617 $59,811,141 72.9%Midwest Security Life Insurance Co 17,301 260,664 $283.29 $73,842,212 $60,069,506 81.3%
Mamsi Life & Health Insurance Co 11,445 181,708 $365.35 $66,386,198 $46,324,358 69.8%
Unitedhealthcare Ins Co of The River 18,885 198,440 $255.62 $50,725,278 $41,412,092 81.6%United Healthcare Insurance Co of NY 15,653 187,836 $201.29 $37,810,401 $33,583,153 88.8%United Healthcare of New England Inc 5,465 91,090 $354.50 $32,291,846 $22,784,457 70.6%
United Healthcare of FL Inc 2,106 36,643 $607.93 $22,276,531 $15,985,244 71.8%Sierra Health & Life Insurance Co 4,204 60,636 $330.39 $20,033,742 $9,772,375 48.8%Pacificare of NV Inc 2,803 59,551 $320.92 $19,110,931 $17,010,855 89.0%Unitedhealthcare of WI Inc 1,860 35,190 $516.28 $18,167,782 $13,764,788 75.8%
Pacificare of Arizona Inc 2,171 35,042 $436.80 $15,306,262 $10,751,696 70.2%
United Healthcare of IL Inc 2,010 34,419 $389.94 $13,421,185 $10,944,521 81.5%United Healthcare of KY Ltd 4,603 47,328 $274.82 $13,006,862 $11,916,877 91.6%United Healthcare of TN Inc 1,136 17,296 $473.83 $8,195,441 $4,139,456 50.5%
United HealthCare of AR Inc 1,378 18,622 $414.89 $7,726,008 $5,098,636 66.0%
United Healthcare of LA Inc 699 9,421 $597.47 $5,628,729 $6,058,745 107.6%Pacificare of Colorado Inc 494 7,855 $674.20 $5,295,871 $7,015,119 132.5%United Healthcare of OH Inc 1,055 11,290 $318.74 $3,598,601 $5,018,209 139.4%United Healthcare of Co Inc 261 3,787 $663.85 $2,514,000 $1,654,933 65.8%
United HealthCare of MidWest Inc 198 3,290 $690.51 $2,271,762 $1,658,036 73.0%United Healthcare of TX Inc 153 2,049 $900.16 $1,844,426 $2,220,568 120.4%
Pacificare of WA Inc 0 0 #DIV/0! $564,507 $286,345 50.7%United HealthCare of UT Inc 84 1,280 $385.83 $493,864 $374,874 75.9%
United HealthCare of AL Inc 44 596 $557.07 $332,014 $80,358 24.2%Pacificare of Oregon 17 508 $593.84 $301,670 $583,302 193.4%Pacificare of Oklahoma Inc 30 353 $589.20 $207,987 $53,567 25.8%
American Medical Security Life Insco 17 850 $208.48 $177,208 $102,421 57.8%
United Healthcare of AZ Inc 25 142 $260.20 $36,948 $239,765 648.9%United Health Care of MS 24 38 $347.16 $13,192 $8,270 62.7%United Healthcare of NY Inc 0 0 NMF $0 $1,971,512 NMF
Total 2,870,711 35,274,436 $286.99 $10,123,304,939 $8,140,870,159 80.4% Source: Company reports and Oppenheimer & Co. analysis.
HEALTHCAR
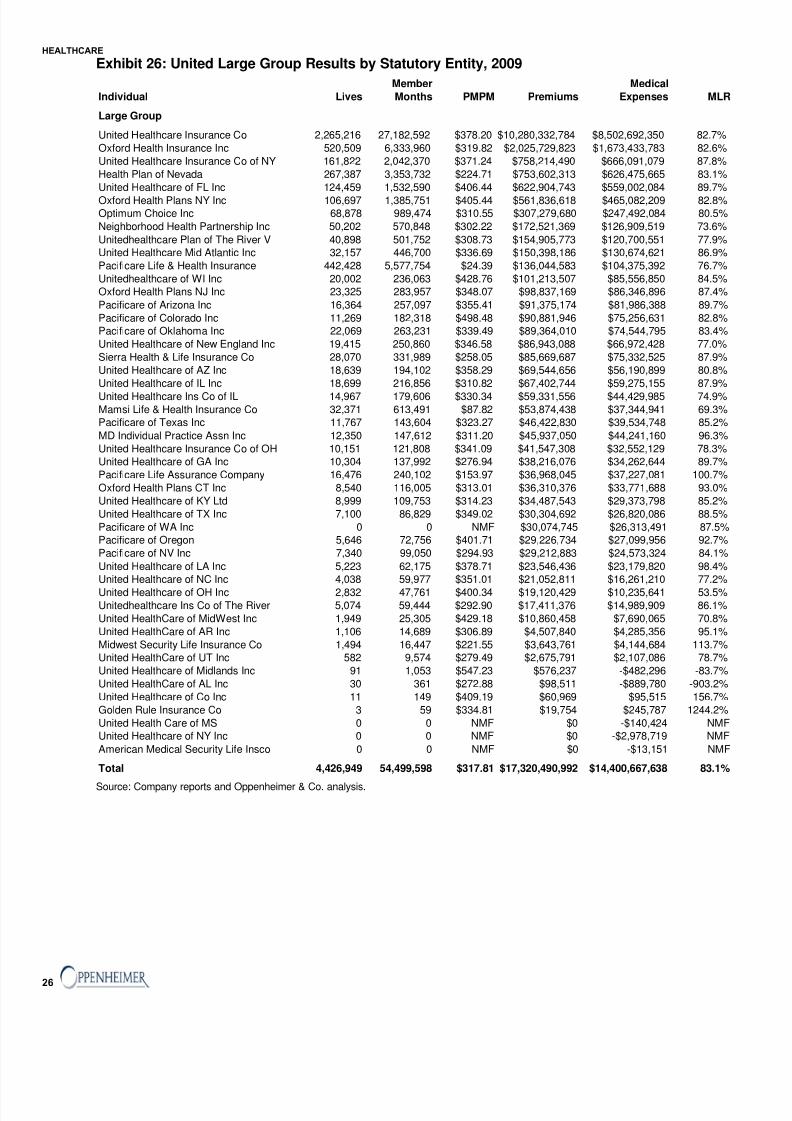
8/8/2019 May 2010 Oppenheimer Report
http://slidepdf.com/reader/full/may-2010-oppenheimer-report 26/41
26
Exhibit 26: United Large Group Results by Statutory Entity, 2009
Member Medical
Individual Lives Months PMPM Premiums Expenses MLR
Large Group
United Healthcare Insurance Co 2,265,216 27,182,592 $378.20 $10,280,332,784 $8,502,692,350 82.7%
Oxford Health Insurance Inc 520,509 6,333,960 $319.82 $2,025,729,823 $1,673,433,783 82.6%
United Healthcare Insurance Co of NY 161,822 2,042,370 $371.24 $758,214,490 $666,091,079 87.8%
Health Plan of Nevada 267,387 3,353,732 $224.71 $753,602,313 $626,475,665 83.1%
United Healthcare of FL Inc 124,459 1,532,590 $406.44 $622,904,743 $559,002,084 89.7%
Oxford Health Plans NY Inc 106,697 1,385,751 $405.44 $561,836,618 $465,082,209 82.8%Optimum Choice Inc 68,878 989,474 $310.55 $307,279,680 $247,492,084 80.5%
Neighborhood Health Partnership Inc 50,202 570,848 $302.22 $172,521,369 $126,909,519 73.6%
Unitedhealthcare Plan of The River V 40,898 501,752 $308.73 $154,905,773 $120,700,551 77.9%United Healthcare Mid Atlantic Inc 32,157 446,700 $336.69 $150,398,186 $130,674,621 86.9%
Pacificare Life & Health Insurance 442,428 5,577,754 $24.39 $136,044,583 $104,375,392 76.7%
Unitedhealthcare of WI Inc 20,002 236,063 $428.76 $101,213,507 $85,556,850 84.5%Oxford Health Plans NJ Inc 23,325 283,957 $348.07 $98,837,169 $86,346,896 87.4%
Pacificare of Arizona Inc 16,364 257,097 $355.41 $91,375,174 $81,986,388 89.7%
Pacificare of Colorado Inc 11,269 182,318 $498.48 $90,881,946 $75,256,631 82.8%Pacificare of Oklahoma Inc 22,069 263,231 $339.49 $89,364,010 $74,544,795 83.4%
United Healthcare of New England Inc 19,415 250,860 $346.58 $86,943,088 $66,972,428 77.0%
Sierra Health & Life Insurance Co 28,070 331,989 $258.05 $85,669,687 $75,332,525 87.9%
United Healthcare of AZ Inc 18,639 194,102 $358.29 $69,544,656 $56,190,899 80.8%
United Healthcare of IL Inc 18,699 216,856 $310.82 $67,402,744 $59,275,155 87.9%
United Healthcare Ins Co of IL 14,967 179,606 $330.34 $59,331,556 $44,429,985 74.9%Mamsi Life & Health Insurance Co 32,371 613,491 $87.82 $53,874,438 $37,344,941 69.3%Pacificare of Texas Inc 11,767 143,604 $323.27 $46,422,830 $39,534,748 85.2%
MD Individual Practice Assn Inc 12,350 147,612 $311.20 $45,937,050 $44,241,160 96.3%
United Healthcare Insurance Co of OH 10,151 121,808 $341.09 $41,547,308 $32,552,129 78.3%United Healthcare of GA Inc 10,304 137,992 $276.94 $38,216,076 $34,262,644 89.7%
Pacificare Life Assurance Company 16,476 240,102 $153.97 $36,968,045 $37,227,081 100.7%
Oxford Health Plans CT Inc 8,540 116,005 $313.01 $36,310,376 $33,771,688 93.0%
United Healthcare of KY Ltd 8,999 109,753 $314.23 $34,487,543 $29,373,798 85.2%
United Healthcare of TX Inc 7,100 86,829 $349.02 $30,304,692 $26,820,086 88.5%
Pacificare of WA Inc 0 0 NMF $30,074,745 $26,313,491 87.5%Pacificare of Oregon 5,646 72,756 $401.71 $29,226,734 $27,099,956 92.7%
Pacificare of NV Inc 7,340 99,050 $294.93 $29,212,883 $24,573,324 84.1%
United Healthcare of LA Inc 5,223 62,175 $378.71 $23,546,436 $23,179,820 98.4%United Healthcare of NC Inc 4,038 59,977 $351.01 $21,052,811 $16,261,210 77.2%
United Healthcare of OH Inc 2,832 47,761 $400.34 $19,120,429 $10,235,641 53.5%Unitedhealthcare Ins Co of The River 5,074 59,444 $292.90 $17,411,376 $14,989,909 86.1%
United HealthCare of MidWest Inc 1,949 25,305 $429.18 $10,860,458 $7,690,065 70.8%
United HealthCare of AR Inc 1,106 14,689 $306.89 $4,507,840 $4,285,356 95.1%
Midwest Security Life Insurance Co 1,494 16,447 $221.55 $3,643,761 $4,144,684 113.7%United HealthCare of UT Inc 582 9,574 $279.49 $2,675,791 $2,107,086 78.7%
United Healthcare of Midlands Inc 91 1,053 $547.23 $576,237 -$482,296 -83.7%
United HealthCare of AL Inc 30 361 $272.88 $98,511 -$889,780 -903.2%
United Healthcare of Co Inc 11 149 $409.19 $60,969 $95,515 156.7%
Golden Rule Insurance Co 3 59 $334.81 $19,754 $245,787 1244.2%
United Health Care of MS 0 0 NMF $0 -$140,424 NMFUnited Healthcare of NY Inc 0 0 NMF $0 -$2,978,719 NMF
American Medical Security Life Insco 0 0 NMF $0 -$13,151 NMF
Total 4,426,949 54,499,598 $317.81 $17,320,490,992 $14,400,667,638 83.1%
Source: Company reports and Oppenheimer & Co. analysis.
HEALTHCARE
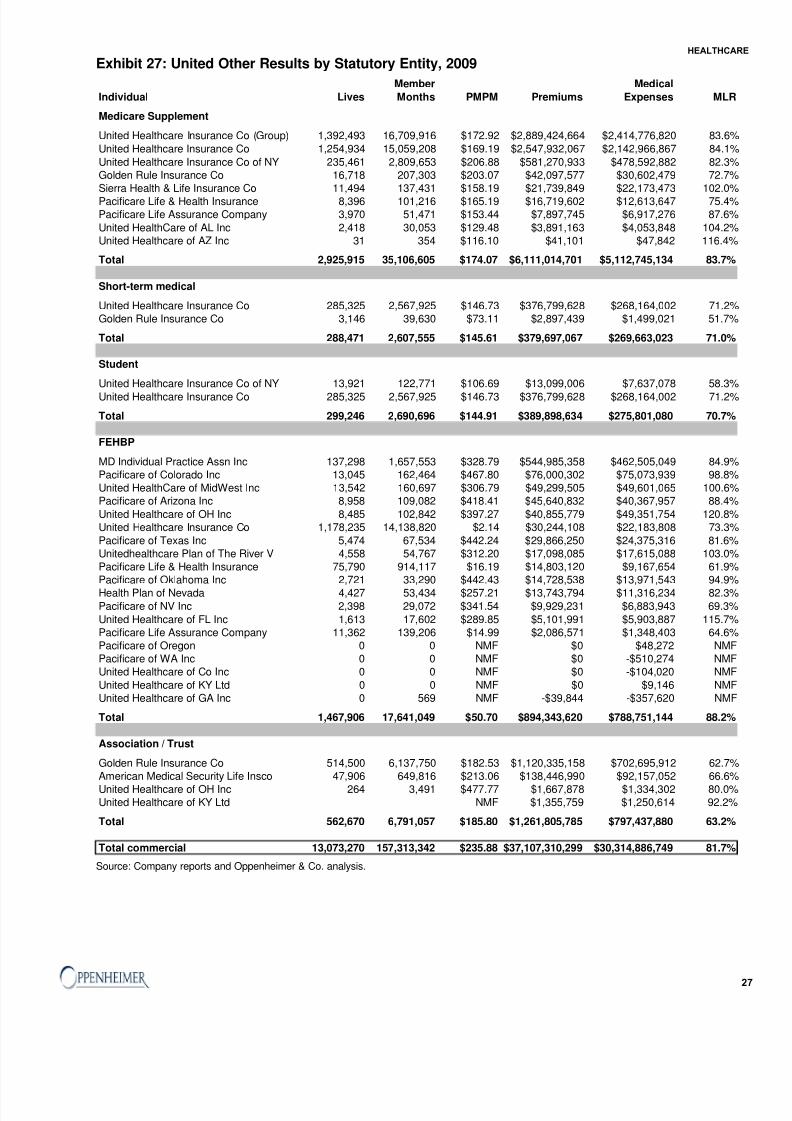
8/8/2019 May 2010 Oppenheimer Report
http://slidepdf.com/reader/full/may-2010-oppenheimer-report 27/41
Exhibit 27: United Other Results by Statutory Entity, 2009
Member Medical
Individual Lives Months PMPM Premiums Expenses MLR
Medicare Supplement
United Healthcare Insurance Co (Group) 1,392,493 16,709,916 $172.92 $2,889,424,664 $2,414,776,820 83.6%United Healthcare Insurance Co 1,254,934 15,059,208 $169.19 $2,547,932,067 $2,142,966,867 84.1%United Healthcare Insurance Co of NY 235,461 2,809,653 $206.88 $581,270,933 $478,592,882 82.3%Golden Rule Insurance Co 16,718 207,303 $203.07 $42,097,577 $30,602,479 72.7%Sierra Health & Life Insurance Co 11,494 137,431 $158.19 $21,739,849 $22,173,473 102.0%Pacificare Life & Health Insurance 8,396 101,216 $165.19 $16,719,602 $12,613,647 75.4%Pacificare Life Assurance Company 3,970 51,471 $153.44 $7,897,745 $6,917,276 87.6%United HealthCare of AL Inc 2,418 30,053 $129.48 $3,891,163 $4,053,848 104.2%United Healthcare of AZ Inc 31 354 $116.10 $41,101 $47,842 116.4%
Total 2,925,915 35,106,605 $174.07 $6,111,014,701 $5,112,745,134 83.7%
Short-term medical
United Healthcare Insurance Co 285,325 2,567,925 $146.73 $376,799,628 $268,164,002 71.2%Golden Rule Insurance Co 3,146 39,630 $73.11 $2,897,439 $1,499,021 51.7%
Total 288,471 2,607,555 $145.61 $379,697,067 $269,663,023 71.0%
Student
United Healthcare Insurance Co of NY 13,921 122,771 $106.69 $13,099,006 $7,637,078 58.3%
United Healthcare Insurance Co 285,325 2,567,925 $146.73 $376,799,628 $268,164,002 71.2%
Total 299,246 2,690,696 $144.91 $389,898,634 $275,801,080 70.7%
FEHBP
MD Individual Practice Assn Inc 137,298 1,657,553 $328.79 $544,985,358 $462,505,049 84.9%Pacificare of Colorado Inc 13,045 162,464 $467.80 $76,000,302 $75,073,939 98.8%United HealthCare of MidWest Inc 13,542 160,697 $306.79 $49,299,505 $49,601,065 100.6%Pacificare of Arizona Inc 8,958 109,082 $418.41 $45,640,832 $40,367,957 88.4%United Healthcare of OH Inc 8,485 102,842 $397.27 $40,855,779 $49,351,754 120.8%United Healthcare Insurance Co 1,178,235 14,138,820 $2.14 $30,244,108 $22,183,808 73.3%Pacificare of Texas Inc 5,474 67,534 $442.24 $29,866,250 $24,375,316 81.6%Unitedhealthcare Plan of The River V 4,558 54,767 $312.20 $17,098,085 $17,615,088 103.0%Pacificare Life & Health Insurance 75,790 914,117 $16.19 $14,803,120 $9,167,654 61.9%Pacificare of Oklahoma Inc 2,721 33,290 $442.43 $14,728,538 $13,971,543 94.9%
Health Plan of Nevada 4,427 53,434 $257.21 $13,743,794 $11,316,234 82.3%Pacificare of NV Inc 2,398 29,072 $341.54 $9,929,231 $6,883,943 69.3%United Healthcare of FL Inc 1,613 17,602 $289.85 $5,101,991 $5,903,887 115.7%Pacificare Life Assurance Company 11,362 139,206 $14.99 $2,086,571 $1,348,403 64.6%Pacificare of Oregon 0 0 NMF $0 $48,272 NMFPacificare of WA Inc 0 0 NMF $0 -$510,274 NMFUnited Healthcare of Co Inc 0 0 NMF $0 -$104,020 NMFUnited Healthcare of KY Ltd 0 0 NMF $0 $9,146 NMFUnited Healthcare of GA Inc 0 569 NMF -$39,844 -$357,620 NMF
Total 1,467,906 17,641,049 $50.70 $894,343,620 $788,751,144 88.2%
Association / Trust
Golden Rule Insurance Co 514,500 6,137,750 $182.53 $1,120,335,158 $702,695,912 62.7%American Medical Security Life Insco 47,906 649,816 $213.06 $138,446,990 $92,157,052 66.6%
United Healthcare of OH Inc 264 3,491 $477.77 $1,667,878 $1,334,302 80.0%United Healthcare of KY Ltd NMF $1,355,759 $1,250,614 92.2%
Total 562,670 6,791,057 $185.80 $1,261,805,785 $797,437,880 63.2%
Total commercial 13,073,270 157,313,342 $235.88 $37,107,310,299 $30,314,886,749 81.7% Source: Company reports and Oppenheimer & Co. analysis.
HEALTHCAR
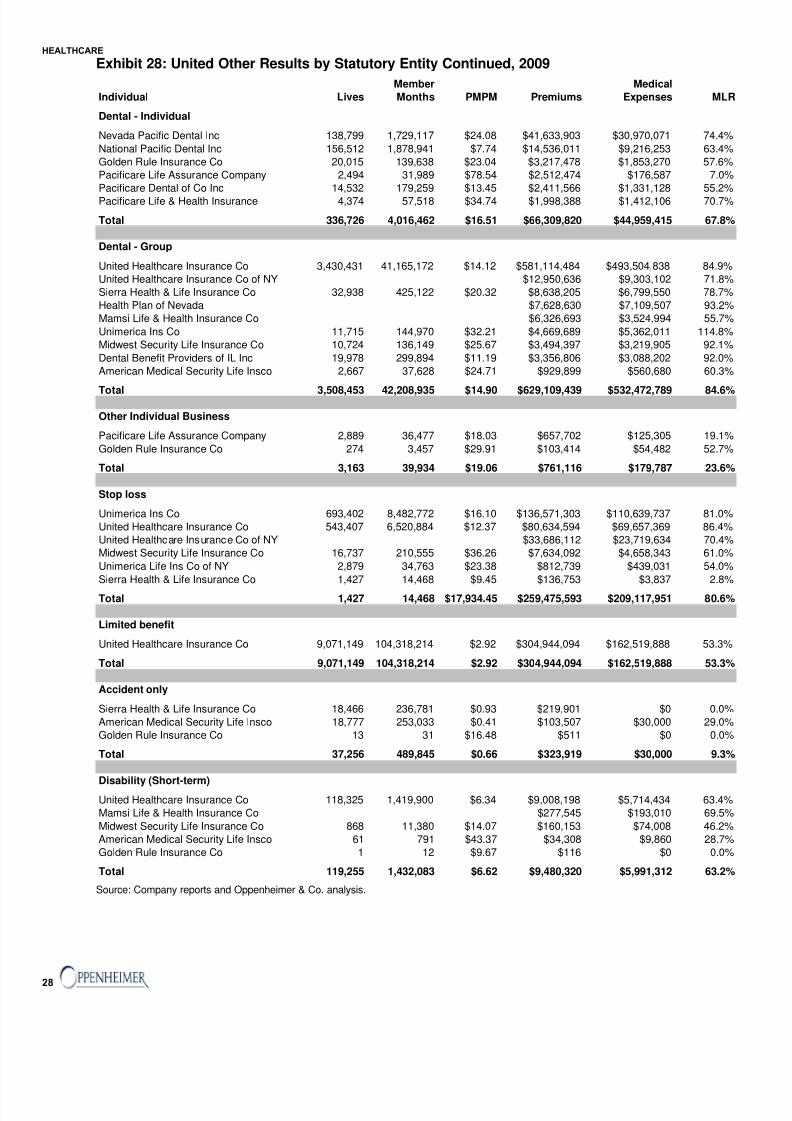
8/8/2019 May 2010 Oppenheimer Report
http://slidepdf.com/reader/full/may-2010-oppenheimer-report 28/41
28
Exhibit 28: United Other Results by Statutory Entity Continued, 2009
Member Medical
Individual Lives Months PMPM Premiums Expenses MLR
Dental - Individual
Nevada Pacific Dental Inc 138,799 1,729,117 $24.08 $41,633,903 $30,970,071 74.4%
National Pacific Dental Inc 156,512 1,878,941 $7.74 $14,536,011 $9,216,253 63.4%
Golden Rule Insurance Co 20,015 139,638 $23.04 $3,217,478 $1,853,270 57.6%
Pacificare Life Assurance Company 2,494 31,989 $78.54 $2,512,474 $176,587 7.0%
Pacificare Dental of Co Inc 14,532 179,259 $13.45 $2,411,566 $1,331,128 55.2%
Pacificare Life & Health Insurance 4,374 57,518 $34.74 $1,998,388 $1,412,106 70.7%
Total 336,726 4,016,462 $16.51 $66,309,820 $44,959,415 67.8%
Dental - Group
United Healthcare Insurance Co 3,430,431 41,165,172 $14.12 $581,114,484 $493,504,838 84.9%
United Healthcare Insurance Co of NY $12,950,636 $9,303,102 71.8%
Sierra Health & Life Insurance Co 32,938 425,122 $20.32 $8,638,205 $6,799,550 78.7%
Health Plan of Nevada $7,628,630 $7,109,507 93.2%
Mamsi Life & Health Insurance Co $6,326,693 $3,524,994 55.7%
Unimerica Ins Co 11,715 144,970 $32.21 $4,669,689 $5,362,011 114.8%
Midwest Security Life Insurance Co 10,724 136,149 $25.67 $3,494,397 $3,219,905 92.1%
Dental Benefit Providers of IL Inc 19,978 299,894 $11.19 $3,356,806 $3,088,202 92.0%
American Medical Security Life Insco 2,667 37,628 $24.71 $929,899 $560,680 60.3%
Total 3,508,453 42,208,935 $14.90 $629,109,439 $532,472,789 84.6%
Other Individual Business
Pacificare Life Assurance Company 2,889 36,477 $18.03 $657,702 $125,305 19.1%
Golden Rule Insurance Co 274 3,457 $29.91 $103,414 $54,482 52.7%
Total 3,163 39,934 $19.06 $761,116 $179,787 23.6%
Stop loss
Unimerica Ins Co 693,402 8,482,772 $16.10 $136,571,303 $110,639,737 81.0%
United Healthcare Insurance Co 543,407 6,520,884 $12.37 $80,634,594 $69,657,369 86.4%
United Healthcare Insurance Co of NY $33,686,112 $23,719,634 70.4%
Midwest Security Life Insurance Co 16,737 210,555 $36.26 $7,634,092 $4,658,343 61.0%
Unimerica Life Ins Co of NY 2,879 34,763 $23.38 $812,739 $439,031 54.0%
Sierra Health & Life Insurance Co 1,427 14,468 $9.45 $136,753 $3,837 2.8%
Total 1,427 14,468 $17,934.45 $259,475,593 $209,117,951 80.6%
Limited benefit
United Healthcare Insurance Co 9,071,149 104,318,214 $2.92 $304,944,094 $162,519,888 53.3%
Total 9,071,149 104,318,214 $2.92 $304,944,094 $162,519,888 53.3%
Accident only
Sierra Health & Life Insurance Co 18,466 236,781 $0.93 $219,901 $0 0.0%
American Medical Security Life Insco 18,777 253,033 $0.41 $103,507 $30,000 29.0%
Golden Rule Insurance Co 13 31 $16.48 $511 $0 0.0%
Total 37,256 489,845 $0.66 $323,919 $30,000 9.3%
Disability (Short-term)United Healthcare Insurance Co 118,325 1,419,900 $6.34 $9,008,198 $5,714,434 63.4%
Mamsi Life & Health Insurance Co $277,545 $193,010 69.5%
Midwest Security Life Insurance Co 868 11,380 $14.07 $160,153 $74,008 46.2%
American Medical Security Life Insco 61 791 $43.37 $34,308 $9,860 28.7%
Golden Rule Insurance Co 1 12 $9.67 $116 $0 0.0%
Total 119,255 1,432,083 $6.62 $9,480,320 $5,991,312 63.2% Source: Company reports and Oppenheimer & Co. analysis.
HEALTHCARE

8/8/2019 May 2010 Oppenheimer Report
http://slidepdf.com/reader/full/may-2010-oppenheimer-report 29/41
Exhibit 29: United Other Results by Statutory Entity Continued, 2009
Member Medical
Individual Lives Months PMPM Premiums Expenses MLR
Disability (Long-term)
Unimerica Ins Co 167,882 335,764 $91.05 $30,571,871 $16,336,273 53.4%
United Healthcare Insurance Co 37,255 447,060 $36.88 $16,486,029 $10,049,919 61.0%
Unimerica Life Ins Co of NY 11,740 140,880 $22.46 $3,164,040 $1,656,762 52.4%
Golden Rule Insurance Co 78 991 $169.41 $167,884 -$1,822 -1.1%
Total 216,955 924,695 $54.49 $50,389,824 $28,041,132 55.6%
Long-term Care
Golden Rule Insurance Co 20 240 $75.29 $18,069 $51,341 284.1%
Other group care
United Healthcare Insurance Co 14,001 168,012 $50.44 $8,474,614 $6,427,641 75.8%
Health Plan of Nevada $1,497,342 $2,216,066 148.0%
Total Specialty $1,329,286,808 $989,791,256 74.5% Source: Company reports and Oppenheimer & Co. analysis.
The scenario analysis below suggests that United would have incurred a rebate of over
$320 million in 2008 assuming it were able to shift 500 basis points from SG&A to medica
costs, which would negatively impact earnings by around 5%. Of course, as we’ve pointedout before, United would have some ability to reduce broker commissions and other non-
core SG&A in order to maintain more of its profitability.
Exhibit 30: United’s Potential Rebates in 2009, a Scenario Analysis, Assuming Various SG&A / PremiumTax Shift to Medical Expense
Plan No Shift 100 bp 200 bp 300 bp 400 bp 500 bp 600 bp 700 b
Individual $209,597,661 $268,281,764 $251,608,480 $235,198,221 $219,036,015 $202,873,809 $186,711,602 $170,549,39
Small Group $214,809,191 $116,693,574 $92,858,890 $81,312,702 $70,703,853 $61,879,122 $53,054,391 $44,229,66
Large Group $442,412,670 $318,515,893 $198,466,717 $99,511,556 $79,326,747 $58,632,374 $46,016,605 $38,414,57
Total $866,819,521 $703,491,232 $542,934,087 $416,022,479 $369,066,615 $323,385,304 $285,782,598 $253,193,63
Source: Company reports and Oppenheimer & Co. analysis.
In Exhibit 31, we’ve summarized CIGNA’s results for 2009. We were able to account fo
$4.7 billion of the company’s commercial premiums. We estimate that CIGNA had abou
$5.1 billion in commercial premiums overall in 2009. CIGNA’s overall commercial medica
loss ratio appeared to be about 85.7%. Its individual loss ratio was 88.1%, while its sma
group loss ratio was 93.1%, followed by a large group medical loss ratio of 85.2%.
Exhibit 31: CIGNA’s Summary of 2009 Results by Product
Member Medical
Plan Lives Months PMPM Premiums Expense MLR
Individual 45,224 327,245 $207.52 $67,909,705 $59,807,847 88.1%Small Group 93,077 733,062 $411.44 $301,613,160 $280,923,752 93.1%Large Group 1,570,834 30,347,692 $141.19 $4,284,908,505 $3,649,551,378 85.2%
Total 1,709,135 31,407,999 $148.19 $4,654,431,370 $3,990,282,977 85.7% Source: Company reports and Oppenheimer & Co. analysis.
Our individual analysis shown below includes roughly 45,000 individual insurance lives
CIGNA’s individual product had a loss ratio of 88.1%, suggesting that the impact on the
plan from minimum MLR requirements will be modest. It will still incur a small rebate, as a
few subsidiaries are operating below the minimum MLR threshold, led by CIGNA
HEALTHCAR

8/8/2019 May 2010 Oppenheimer Report
http://slidepdf.com/reader/full/may-2010-oppenheimer-report 30/41
30
Healthcare of Maine Inc and Alta Health & Life Ins Co., although both are relatively smal
subs.
Exhibit 32: CIGNA Individual Results by Statutory Entity, 2009
Member Medical
Individual Lives Months PMPM Premiums Expenses MLR
Connecticut General Life Insurance 40,990 269,916 $180.58 $48,742,637 $42,051,570 86.3%CIGNA HealthCare of AZ Inc 4,171 56,238 $319.53 $17,969,716 $15,919,962 88.6%
CIGNA Healthcare of NJ Inc 54 901 $1,201.91 $1,082,918 $1,648,524 152.2%CIGNA HealthCare of NY Inc 2 89 $745.47 $66,347 $180,033 271.4%CIGNA Healthcare of Me Inc 7 101 $362.60 $36,623 $19,336 52.8%Alta Health & Life Ins Co 0 0 NMF $11,464 -$11,578 -101.0%
Total 45,224 327,245 $207.52 $67,909,705 $59,807,847 88.1% Source: Company reports and Oppenheimer & Co. analysis.
Exhibit 33: CIGNA Small Group Results by Statutory Entity, 2009
Member MedicalIndividual Lives Months PMPM Premiums Expenses MLR
Small Group
Connecticut General Life Insurance 31,891 191,346 $624.93 $119,578,547 $111,985,963 93.7%CIGNA Healthcare SC Inc 3,169 51,780 $330.34 $17,104,914 $15,091,692 88.2%CIGNA Healthcare Nh Inc 1,008 24,782 $451.54 $11,190,109 $10,604,144 94.8%Allegiance Life & Hlth Ins Co Inc 3,620 39,121 $274.15 $10,725,097 $9,404,346 87.7%CIGNA HealthCare of AZ Inc 1,176 18,069 $356.15 $6,435,301 $5,850,284 90.9%CIGNA Healthcare of NC Inc 711 10,328 $439.64 $4,540,619 $3,334,793 73.4%CIGNA HealthCare of NY Inc 0 3,736 $462.47 $1,727,806 $1,609,548 93.2%CIGNA Healthcare of NJ Inc 118 1,629 $394.09 $641,976 $559,741 87.2%CIGNA Healthcare of CT Inc 1 22 $1,588.64 $34,950 $33,094 94.7%
Total 41,694 340,813 $504.61 $171,979,319 $158,473,605 92.1%
Association / Trust
Connecticut General Life Insurance 38,274 229,644 $347.68 $79,841,860 $72,671,556 91.0%CIGNA Healthcare of CT Inc 12,076 143,863 $316.86 $45,584,637 $45,326,349 99.4%Allegiance Life & Hlth Ins Co Inc 689 7,852 $280.94 $2,205,914 $2,103,863 95.4%CIGNA HealthCare of AZ Inc 311 3,918 $456.44 $1,788,338 $1,499,852 83.9%
CIGNA HealthCare of IL Inc 7 138 $1,468.30 $202,626 $113,373 56.0%CIGNA Healthcare of NJ Inc 17 6,705 $1.56 $10,466 $694,494 6635.7%CIGNA HealthCare of Co Inc 1 5 $0.00 $0 $2,532 NMFCIGNA HealthCare of FL Inc 0 13 $0.00 $0 $28,402 NMFCIGNA HealthCare of GA Inc 0 0 NMF $0 $39 NMFCIGNA Healthcare Midatlantic Inc 1 18 $0.00 $0 $2,481 NMFCIGNA Healthcare SC Inc 2 24 $0.00 $0 $1,012 NMFCIGNA Healthcare of Me Inc 0 8 $0.00 $0 $184 NMFCIGNA Healthcare of NC Inc 1 13 $0.00 $0 $1,239 NMFCIGNA Healthcare of Texas Inc 0 5 $0.00 $0 $1,045 NMFCIGNA Healthcare of UT Inc 1 12 $0.00 $0 $156 NMFCIGNA Hlthcare of Massachusetts Inc 3 31 $0.00 $0 $3,570 NMF
Total 51,383 392,249 $330.49 $129,633,841 $122,450,147 94.5% Source: Company reports and Oppenheimer & Co. analysis.
HEALTHCARE

8/8/2019 May 2010 Oppenheimer Report
http://slidepdf.com/reader/full/may-2010-oppenheimer-report 31/41
Exhibit 34: CIGNA Large Group Results by Statutory Entity, 2009
Member Medical
Individual Lives Months PMPM Premiums Expenses MLR
Large Group
Connecticut General Life Insurance 1,207,996 25,848,660 $139.61 $3,608,614,694 $3,101,992,746 86.0%CIGNA Healthcare of Texas Inc 29,331 369,565 $369.93 $136,713,187 $117,608,436 86.0%
CIGNA HealthCare of AZ Inc 26,300 347,160 $307.42 $106,724,331 $97,148,204 91.0%CIGNA HealthCare of TN Inc 24,014 303,021 $313.43 $94,974,911 $71,696,183 75.5%
CIGNA Healthcare of NC Inc 13,472 176,396 $366.67 $64,679,057 $52,627,815 81.4%Life Insurance Co of North America 212,135 2,545,620 $25.36 $64,560,618 $35,046,924 54.3%Allegiance Life & Hlth Ins Co Inc 10,571 114,703 $284.10 $32,587,154 $31,880,710 97.8%CIGNA Healthcare Midatlantic Inc 5,747 86,238 $352.95 $30,437,735 $21,488,523 70.6%CIGNA HealthCare of Co Inc 6,667 89,071 $336.43 $29,966,165 $28,048,998 93.6%CIGNA HealthCare of FL Inc 5,352 74,957 $339.26 $25,430,033 $20,800,135 81.8%CIGNA Healthcare of CT Inc 2,768 33,682 $421.59 $14,200,135 $12,563,678 88.5%CIGNA Healthcare of NJ Inc 1,636 21,786 $485.71 $10,581,711 $9,318,649 88.1%CIGNA HealthCare of GA Inc 1,819 27,033 $360.22 $9,737,695 $7,122,927 73.1%CIGNA Healthcare SC Inc 1,523 21,893 $444.35 $9,728,198 $7,284,307 74.9%CIGNA Hlthcare of Massachusetts Inc 1,055 19,891 $446.79 $8,887,066 $6,686,219 75.2%CIGNA Healthcare of OH Inc 1,455 18,011 $336.36 $6,058,144 $5,035,815 83.1%Alta Health & Life Ins Co 15,698 189,450 $31.69 $6,003,476 $4,433,868 73.9%
CIGNA Healtcare of In Inc 1,051 14,129 $361.04 $5,101,180 $4,437,803 87.0%CIGNA Worldwide Insurance Co 0 0 NMF $3,432,999 $3,473,566 101.2%
CIGNA Healthcare of Me Inc 560 8,606 $362.94 $3,123,474 $1,644,246 52.6%CIGNA Healthcare Nh Inc 257 6,290 $430.44 $2,707,468 $1,712,320 63.2%CIGNA HealthCare of IL Inc 515 7,409 $342.57 $2,538,084 $1,948,027 76.8%CIGNA Healthcare of UT Inc 222 7,849 $282.89 $2,220,400 $1,948,431 87.8%CIGNA HealthCare of St Louis Inc 250 6,229 $322.59 $2,009,414 $1,538,210 76.6%
CIGNA HealthCare of NY Inc 7 3,167 $269.88 $854,701 $470,284 55.0%Cigna Healthcare of Pennsylvania 1 212 $203.90 $43,226 $18,437 42.7%CIGNA HealthCare of de Inc 0 50 $360.70 $18,035 -$1,809 -10.0%CIGNA Life Ins Co of NY 0 0 NMF -$50,529 $3,273 -6.5%
Total 1,570,402 30,341,078 $141.12 $4,281,882,762 $3,647,976,925 85.2%
Other comprehensive major medical
CIGNA Hlthcare Centennial State Inc 432 6,614 $457.48 $3,025,743 $1,574,453 52.0%
Source: Company reports and Oppenheimer & Co. analysis.
HEALTHCAR
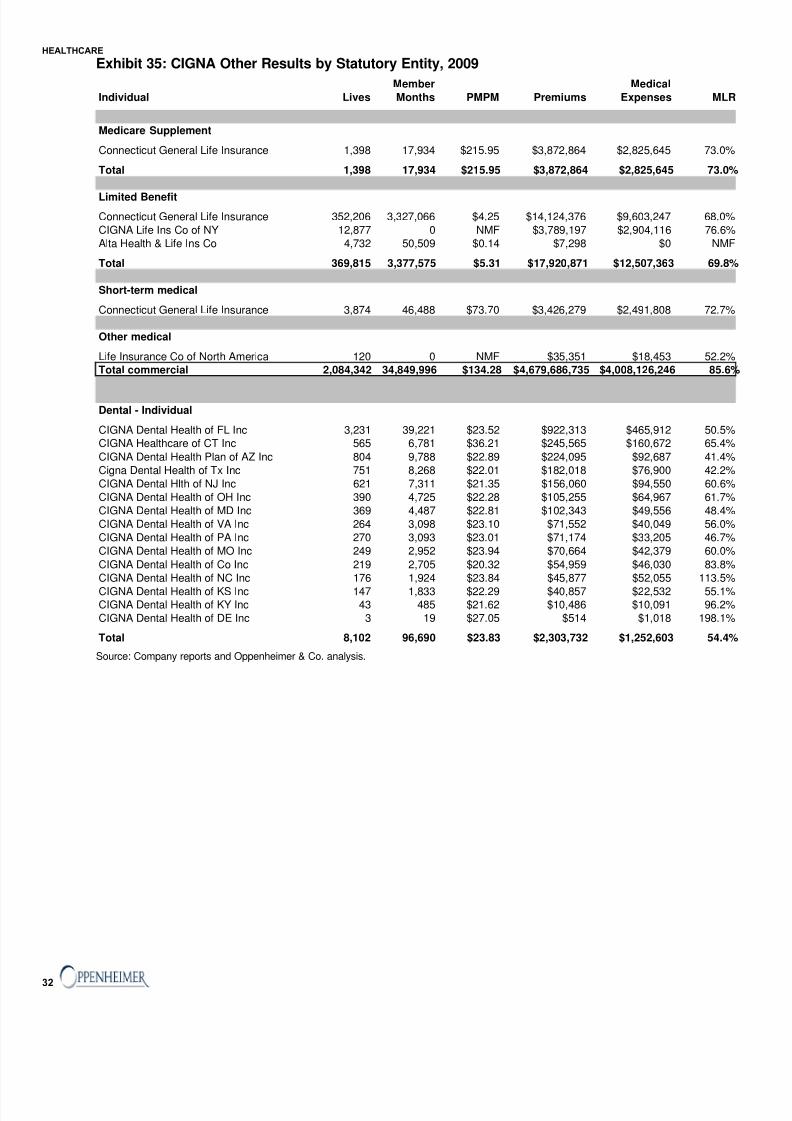
8/8/2019 May 2010 Oppenheimer Report
http://slidepdf.com/reader/full/may-2010-oppenheimer-report 32/41
32
Exhibit 35: CIGNA Other Results by Statutory Entity, 2009
Member Medical
Individual Lives Months PMPM Premiums Expenses MLR
Medicare Supplement
Connecticut General Life Insurance 1,398 17,934 $215.95 $3,872,864 $2,825,645 73.0%
Total 1,398 17,934 $215.95 $3,872,864 $2,825,645 73.0%
Limited Benefit
Connecticut General Life Insurance 352,206 3,327,066 $4.25 $14,124,376 $9,603,247 68.0%CIGNA Life Ins Co of NY 12,877 0 NMF $3,789,197 $2,904,116 76.6%Alta Health & Life Ins Co 4,732 50,509 $0.14 $7,298 $0 NMF
Total 369,815 3,377,575 $5.31 $17,920,871 $12,507,363 69.8%
Short-term medical
Connecticut General Life Insurance 3,874 46,488 $73.70 $3,426,279 $2,491,808 72.7%
Other medical
Life Insurance Co of North America 120 0 NMF $35,351 $18,453 52.2%Total commercial 2,084,342 34,849,996 $134.28 $4,679,686,735 $4,008,126,246 85.6%
Dental - Individual
CIGNA Dental Health of FL Inc 3,231 39,221 $23.52 $922,313 $465,912 50.5%CIGNA Healthcare of CT Inc 565 6,781 $36.21 $245,565 $160,672 65.4%
CIGNA Dental Health Plan of AZ Inc 804 9,788 $22.89 $224,095 $92,687 41.4%Cigna Dental Health of Tx Inc 751 8,268 $22.01 $182,018 $76,900 42.2%CIGNA Dental Hlth of NJ Inc 621 7,311 $21.35 $156,060 $94,550 60.6%CIGNA Dental Health of OH Inc 390 4,725 $22.28 $105,255 $64,967 61.7%CIGNA Dental Health of MD Inc 369 4,487 $22.81 $102,343 $49,556 48.4%CIGNA Dental Health of VA Inc 264 3,098 $23.10 $71,552 $40,049 56.0%CIGNA Dental Health of PA Inc 270 3,093 $23.01 $71,174 $33,205 46.7%CIGNA Dental Health of MO Inc 249 2,952 $23.94 $70,664 $42,379 60.0%
CIGNA Dental Health of Co Inc 219 2,705 $20.32 $54,959 $46,030 83.8%CIGNA Dental Health of NC Inc 176 1,924 $23.84 $45,877 $52,055 113.5%
CIGNA Dental Health of KS Inc 147 1,833 $22.29 $40,857 $22,532 55.1%CIGNA Dental Health of KY Inc 43 485 $21.62 $10,486 $10,091 96.2%CIGNA Dental Health of DE Inc 3 19 $27.05 $514 $1,018 198.1%
Total 8,102 96,690 $23.83 $2,303,732 $1,252,603 54.4% Source: Company reports and Oppenheimer & Co. analysis.
HEALTHCARE
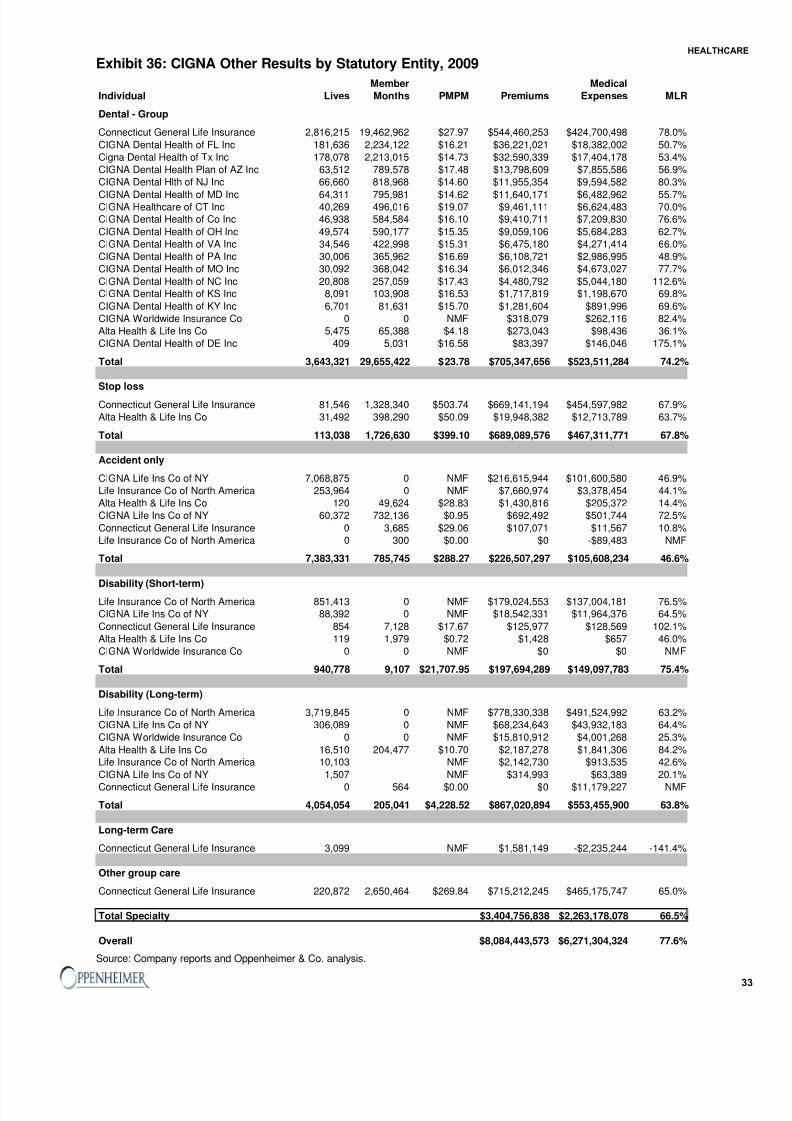
8/8/2019 May 2010 Oppenheimer Report
http://slidepdf.com/reader/full/may-2010-oppenheimer-report 33/41
Exhibit 36: CIGNA Other Results by Statutory Entity, 2009
Member MedicalIndividual Lives Months PMPM Premiums Expenses MLR
Dental - Group
Connecticut General Life Insurance 2,816,215 19,462,962 $27.97 $544,460,253 $424,700,498 78.0%
CIGNA Dental Health of FL Inc 181,636 2,234,122 $16.21 $36,221,021 $18,382,002 50.7%Cigna Dental Health of Tx Inc 178,078 2,213,015 $14.73 $32,590,339 $17,404,178 53.4%CIGNA Dental Health Plan of AZ Inc 63,512 789,578 $17.48 $13,798,609 $7,855,586 56.9%CIGNA Dental Hlth of NJ Inc 66,660 818,968 $14.60 $11,955,354 $9,594,582 80.3%
CIGNA Dental Health of MD Inc 64,311 795,981 $14.62 $11,640,171 $6,482,962 55.7%CIGNA Healthcare of CT Inc 40,269 496,016 $19.07 $9,461,111 $6,624,483 70.0%CIGNA Dental Health of Co Inc 46,938 584,584 $16.10 $9,410,711 $7,209,830 76.6%
CIGNA Dental Health of OH Inc 49,574 590,177 $15.35 $9,059,106 $5,684,283 62.7%CIGNA Dental Health of VA Inc 34,546 422,998 $15.31 $6,475,180 $4,271,414 66.0%CIGNA Dental Health of PA Inc 30,006 365,962 $16.69 $6,108,721 $2,986,995 48.9%CIGNA Dental Health of MO Inc 30,092 368,042 $16.34 $6,012,346 $4,673,027 77.7%
CIGNA Dental Health of NC Inc 20,808 257,059 $17.43 $4,480,792 $5,044,180 112.6%CIGNA Dental Health of KS Inc 8,091 103,908 $16.53 $1,717,819 $1,198,670 69.8%
CIGNA Dental Health of KY Inc 6,701 81,631 $15.70 $1,281,604 $891,996 69.6%CIGNA Worldwide Insurance Co 0 0 NMF $318,079 $262,116 82.4%Alta Health & Life Ins Co 5,475 65,388 $4.18 $273,043 $98,436 36.1%CIGNA Dental Health of DE Inc 409 5,031 $16.58 $83,397 $146,046 175.1%
Total 3,643,321 29,655,422 $23.78 $705,347,656 $523,511,284 74.2%
Stop loss
Connecticut General Life Insurance 81,546 1,328,340 $503.74 $669,141,194 $454,597,982 67.9%Alta Health & Life Ins Co 31,492 398,290 $50.09 $19,948,382 $12,713,789 63.7%
Total 113,038 1,726,630 $399.10 $689,089,576 $467,311,771 67.8%
Accident only
CIGNA Life Ins Co of NY 7,068,875 0 NMF $216,615,944 $101,600,580 46.9%Life Insurance Co of North America 253,964 0 NMF $7,660,974 $3,378,454 44.1%Alta Health & Life Ins Co 120 49,624 $28.83 $1,430,816 $205,372 14.4%CIGNA Life Ins Co of NY 60,372 732,136 $0.95 $692,492 $501,744 72.5%
Connecticut General Life Insurance 0 3,685 $29.06 $107,071 $11,567 10.8%Life Insurance Co of North America 0 300 $0.00 $0 -$89,483 NMF
Total 7,383,331 785,745 $288.27 $226,507,297 $105,608,234 46.6%
Disability (Short-term)
Life Insurance Co of North America 851,413 0 NMF $179,024,553 $137,004,181 76.5%CIGNA Life Ins Co of NY 88,392 0 NMF $18,542,331 $11,964,376 64.5%
Connecticut General Life Insurance 854 7,128 $17.67 $125,977 $128,569 102.1%Alta Health & Life Ins Co 119 1,979 $0.72 $1,428 $657 46.0%CIGNA Worldwide Insurance Co 0 0 NMF $0 $0 NMF
Total 940,778 9,107 $21,707.95 $197,694,289 $149,097,783 75.4%
Disability (Long-term)
Life Insurance Co of North America 3,719,845 0 NMF $778,330,338 $491,524,992 63.2%CIGNA Life Ins Co of NY 306,089 0 NMF $68,234,643 $43,932,183 64.4%CIGNA Worldwide Insurance Co 0 0 NMF $15,810,912 $4,001,268 25.3%
Alta Health & Life Ins Co 16,510 204,477 $10.70 $2,187,278 $1,841,306 84.2%Life Insurance Co of North America 10,103 NMF $2,142,730 $913,535 42.6%
CIGNA Life Ins Co of NY 1,507 NMF $314,993 $63,389 20.1%
Connecticut General Life Insurance 0 564 $0.00 $0 $11,179,227 NMF
Total 4,054,054 205,041 $4,228.52 $867,020,894 $553,455,900 63.8%
Long-term Care
Connecticut General Life Insurance 3,099 NMF $1,581,149 -$2,235,244 -141.4%
Other group care
Connecticut General Life Insurance 220,872 2,650,464 $269.84 $715,212,245 $465,175,747 65.0%
Total Specialty $3,404,756,838 $2,263,178,078 66.5%
Overall $8,084,443,573 $6,271,304,324 77.6% Source: Company reports and Oppenheimer & Co. analysis.
HEALTHCAR

8/8/2019 May 2010 Oppenheimer Report
http://slidepdf.com/reader/full/may-2010-oppenheimer-report 34/41
34
The scenario analysis below suggests that CIGNA would have incurred a rebate of ove
$28 million in 2009 assuming it were able to shift 500 basis points from SG&A to medica
costs. Of course, as we’ve pointed out before, CIGNA would have some ability to reduce
broker commissions and other non-core SG&A in order to maintain more of its profitability.
Exhibit 37: CIGNA’s Potential Rebates in 2009, a Scenario Analysis, Assuming Various SG&A / PremiumTax Shift to Medical Expense
Plan No Shift 100 bp 200 bp 300 bp 400 bp 500 bp 600 bp 700 bp
Individual $30,712 $30,231 $29,750 $29,269 $28,788 $28,307 $27,826 $27,34Small Group $297,702 $252,296 $206,890 $161,484 $116,077 $70,671 $25,265 $Large Group $43,467,632 $40,119,462 $36,778,846 $33,491,257 $30,643,255 $28,256,756 $25,870,258 $23,483,75
Total $43,796,046 $40,401,988 $37,015,486 $33,682,010 $30,788,120 $28,355,735 $25,923,349 $23,511,105
Source: Company reports and Oppenheimer & Co. analysis.
We’re providing our analysis of Coventry next, although the data is a lot more suspect for
Coventry than for other plans, since the company is not required to report the relevant
data for Summit Health Plan, Vista Health Plan and Vista Health Plan of South Florida. As
a result, we don’t think the information provides a tremendous amount of insight into the
rebates that Coventry could potentially incur. That said, like the other plans, it seems clea
that Coventry could incur some significant rebates because of the minimum medical loss
ratio requirements, as the company’s loss ratio was below the required minimums in theindividual, small group, and large group products. We have accounted for about 61% o
Coventry’s commercial premiums.
Exhibit 38: Coventry Summary of 2009 Results by Product
Member MedicalPlan Lives Months PMPM Premiums Expense MLR
Individual 112,171 1,222,477 $147.43 $180,227,803 $129,866,507 72.1%Small Group 235,415 3,047,477 $316.87 $965,665,003 $736,716,915 76.3%
Large Group 542,491 6,787,921 $294.97 $2,002,244,249 $1,700,630,330 84.9%
Total 890,077 11,057,875 $284.70 $3,148,137,055 $2,567,213,752 81.5% Source: Company reports and Oppenheimer & Co. analysis.
Exhibit 39: Coventry Individual Results by Statutory Entity, 2009
Member MedicalIndividual Lives Months PMPM Premiums Expenses MLR
Coventry Health & Life Insurance Co 44,301 466,364 $151.71 $70,750,933 $50,644,063 71.6%Wellpath Select Inc 20,747 264,237 $157.44 $41,600,379 $30,759,962 73.9%Coventry Health Care of GA Inc 28,131 277,228 $118.08 $32,734,594 $21,332,112 65.2%
Coventry Health Care of LA Inc 9,042 94,497 $152.02 $14,365,765 $12,038,073 83.8%Altius Health Plans 7,878 93,867 $140.51 $13,189,013 $10,351,744 78.5%Personalcare Insurance of Illinois 1,752 21,571 $290.38 $6,263,733 $3,979,823 63.5%
Group Health Plan Inc 319 4,701 $279.64 $1,314,579 $761,202 57.9%First Health Life & Health Ins Co 1 12 $733.92 $8,807 -$472 -5.4%
Total 112,171 1,222,477 $147.43 $180,227,803 $129,866,507 72.1%
Source: Company reports and Oppenheimer & Co. analysis.
HEALTHCARE
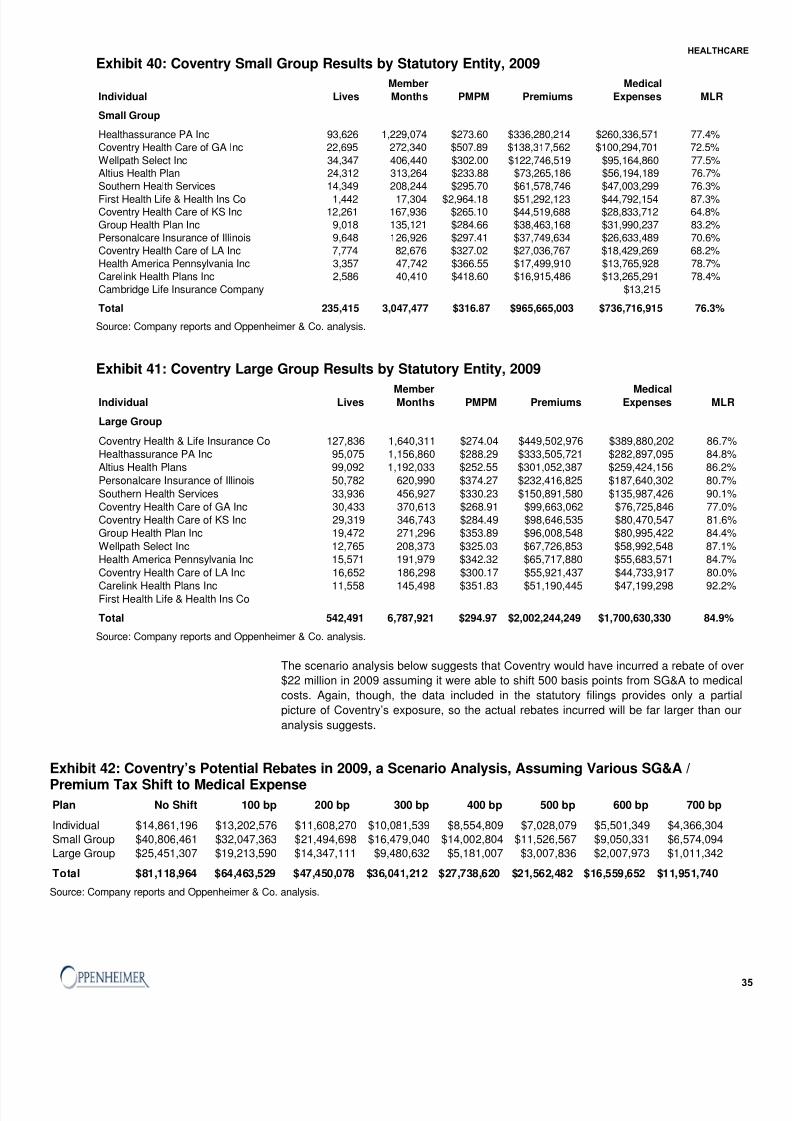
8/8/2019 May 2010 Oppenheimer Report
http://slidepdf.com/reader/full/may-2010-oppenheimer-report 35/41
Exhibit 40: Coventry Small Group Results by Statutory Entity, 2009
Member Medical
Individual Lives Months PMPM Premiums Expenses MLR
Small Group
Healthassurance PA Inc 93,626 1,229,074 $273.60 $336,280,214 $260,336,571 77.4%Coventry Health Care of GA Inc 22,695 272,340 $507.89 $138,317,562 $100,294,701 72.5%
Wellpath Select Inc 34,347 406,440 $302.00 $122,746,519 $95,164,860 77.5%Altius Health Plan 24,312 313,264 $233.88 $73,265,186 $56,194,189 76.7%Southern Health Services 14,349 208,244 $295.70 $61,578,746 $47,003,299 76.3%
First Health Life & Health Ins Co 1,442 17,304 $2,964.18 $51,292,123 $44,792,154 87.3%Coventry Health Care of KS Inc 12,261 167,936 $265.10 $44,519,688 $28,833,712 64.8%Group Health Plan Inc 9,018 135,121 $284.66 $38,463,168 $31,990,237 83.2%Personalcare Insurance of Illinois 9,648 126,926 $297.41 $37,749,634 $26,633,489 70.6%Coventry Health Care of LA Inc 7,774 82,676 $327.02 $27,036,767 $18,429,269 68.2%Health America Pennsylvania Inc 3,357 47,742 $366.55 $17,499,910 $13,765,928 78.7%Carelink Health Plans Inc 2,586 40,410 $418.60 $16,915,486 $13,265,291 78.4%Cambridge Life Insurance Company $13,215
Total 235,415 3,047,477 $316.87 $965,665,003 $736,716,915 76.3% Source: Company reports and Oppenheimer & Co. analysis.
Exhibit 41: Coventry Large Group Results by Statutory Entity, 2009
Member MedicalIndividual Lives Months PMPM Premiums Expenses MLR
Large Group
Coventry Health & Life Insurance Co 127,836 1,640,311 $274.04 $449,502,976 $389,880,202 86.7%Healthassurance PA Inc 95,075 1,156,860 $288.29 $333,505,721 $282,897,095 84.8%Altius Health Plans 99,092 1,192,033 $252.55 $301,052,387 $259,424,156 86.2%Personalcare Insurance of Illinois 50,782 620,990 $374.27 $232,416,825 $187,640,302 80.7%Southern Health Services 33,936 456,927 $330.23 $150,891,580 $135,987,426 90.1%Coventry Health Care of GA Inc 30,433 370,613 $268.91 $99,663,062 $76,725,846 77.0%Coventry Health Care of KS Inc 29,319 346,743 $284.49 $98,646,535 $80,470,547 81.6%Group Health Plan Inc 19,472 271,296 $353.89 $96,008,548 $80,995,422 84.4%Wellpath Select Inc 12,765 208,373 $325.03 $67,726,853 $58,992,548 87.1%Health America Pennsylvania Inc 15,571 191,979 $342.32 $65,717,880 $55,683,571 84.7%Coventry Health Care of LA Inc 16,652 186,298 $300.17 $55,921,437 $44,733,917 80.0%
Carelink Health Plans Inc 11,558 145,498 $351.83 $51,190,445 $47,199,298 92.2%First Health Life & Health Ins Co
Total 542,491 6,787,921 $294.97 $2,002,244,249 $1,700,630,330 84.9% Source: Company reports and Oppenheimer & Co. analysis.
The scenario analysis below suggests that Coventry would have incurred a rebate of ove
$22 million in 2009 assuming it were able to shift 500 basis points from SG&A to medica
costs. Again, though, the data included in the statutory filings provides only a partia
picture of Coventry’s exposure, so the actual rebates incurred will be far larger than our
analysis suggests.
Exhibit 42: Coventry’s Potential Rebates in 2009, a Scenario Analysis, Assuming Various SG&A /
Premium Tax Shift to Medical ExpensePlan No Shift 100 bp 200 bp 300 bp 400 bp 500 bp 600 bp 700 bp
Individual $14,861,196 $13,202,576 $11,608,270 $10,081,539 $8,554,809 $7,028,079 $5,501,349 $4,366,304
Small Group $40,806,461 $32,047,363 $21,494,698 $16,479,040 $14,002,804 $11,526,567 $9,050,331 $6,574,094
Large Group $25,451,307 $19,213,590 $14,347,111 $9,480,632 $5,181,007 $3,007,836 $2,007,973 $1,011,342
Total $81,118,964 $64,463,529 $47,450,078 $36,041,212 $27,738,620 $21,562,482 $16,559,652 $11,951,740 Source: Company reports and Oppenheimer & Co. analysis.
HEALTHCAR
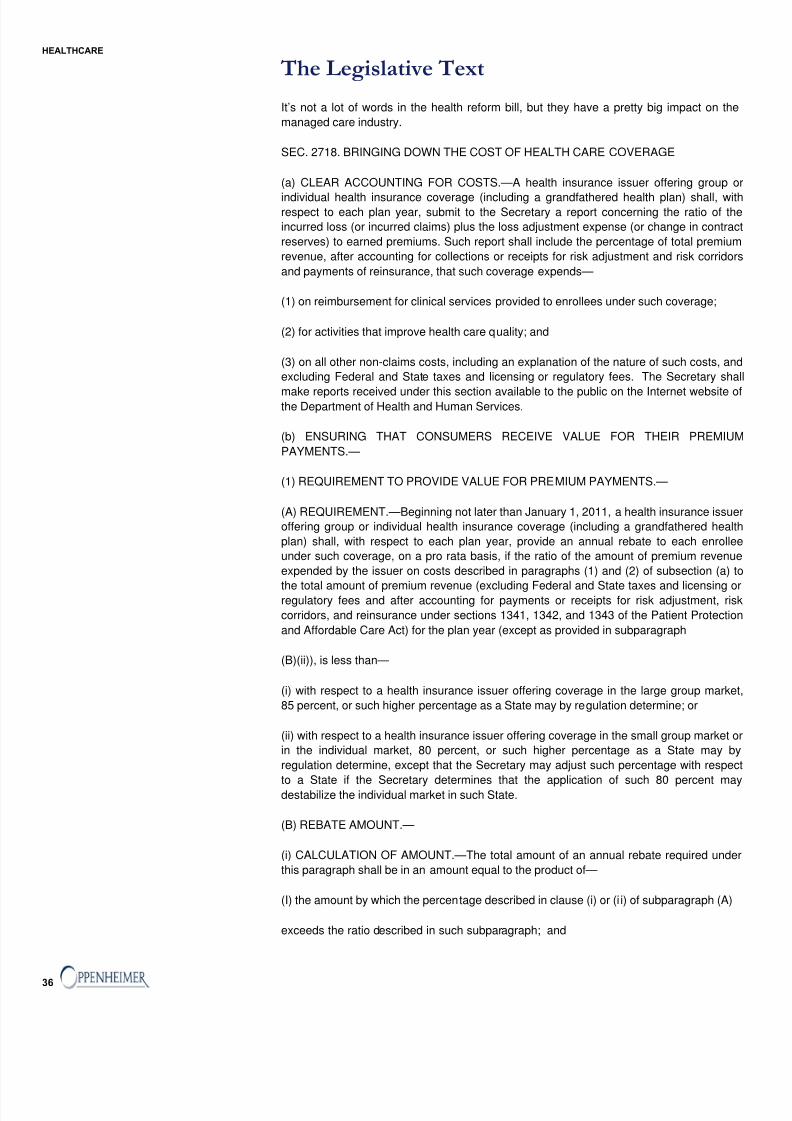
8/8/2019 May 2010 Oppenheimer Report
http://slidepdf.com/reader/full/may-2010-oppenheimer-report 36/41
36
The Legislative Text
It’s not a lot of words in the health reform bill, but they have a pretty big impact on the
managed care industry.
SEC. 2718. BRINGING DOWN THE COST OF HEALTH CARE COVERAGE
(a) CLEAR ACCOUNTING FOR COSTS.—A health insurance issuer offering group o
individual health insurance coverage (including a grandfathered health plan) shall, withrespect to each plan year, submit to the Secretary a report concerning the ratio of the
incurred loss (or incurred claims) plus the loss adjustment expense (or change in contrac
reserves) to earned premiums. Such report shall include the percentage of total premium
revenue, after accounting for collections or receipts for risk adjustment and risk corridors
and payments of reinsurance, that such coverage expends—
(1) on reimbursement for clinical services provided to enrollees under such coverage;
(2) for activities that improve health care quality; and
(3) on all other non-claims costs, including an explanation of the nature of such costs, and
excluding Federal and State taxes and licensing or regulatory fees. The Secretary sha
make reports received under this section available to the public on the Internet website othe Department of Health and Human Services.
(b) ENSURING THAT CONSUMERS RECEIVE VALUE FOR THEIR PREMIUM
PAYMENTS.—
(1) REQUIREMENT TO PROVIDE VALUE FOR PREMIUM PAYMENTS.—
(A) REQUIREMENT.—Beginning not later than January 1, 2011, a health insurance issue
offering group or individual health insurance coverage (including a grandfathered health
plan) shall, with respect to each plan year, provide an annual rebate to each enrollee
under such coverage, on a pro rata basis, if the ratio of the amount of premium revenue
expended by the issuer on costs described in paragraphs (1) and (2) of subsection (a) to
the total amount of premium revenue (excluding Federal and State taxes and licensing orregulatory fees and after accounting for payments or receipts for risk adjustment, risk
corridors, and reinsurance under sections 1341, 1342, and 1343 of the Patient Protection
and Affordable Care Act) for the plan year (except as provided in subparagraph
(B)(ii)), is less than—
(i) with respect to a health insurance issuer offering coverage in the large group market
85 percent, or such higher percentage as a State may by regulation determine; or
(ii) with respect to a health insurance issuer offering coverage in the small group market o
in the individual market, 80 percent, or such higher percentage as a State may by
regulation determine, except that the Secretary may adjust such percentage with respec
to a State if the Secretary determines that the application of such 80 percent maydestabilize the individual market in such State.
(B) REBATE AMOUNT.—
(i) CALCULATION OF AMOUNT.—The total amount of an annual rebate required under
this paragraph shall be in an amount equal to the product of—
(I) the amount by which the percentage described in clause (i) or (i i) of subparagraph (A)
exceeds the ratio described in such subparagraph; and
HEALTHCARE
8/8/2019 May 2010 Oppenheimer Report
http://slidepdf.com/reader/full/may-2010-oppenheimer-report 37/41
(II) the total amount of premium revenue (excluding Federal and State taxes and licensing
or regulatory fees and after accounting for payments or receipts for risk adjustment, risk
corridors, and reinsurance under sections 1341, 1342, and 1343 of the Patient Protection
and Affordable Care Act) for such plan year.
(ii) CALCULATION BASED ON AVERAGE RATIO.— Beginning on January 1, 2014, the
determination made under subparagraph (A) for the year involved shall be based on the
averages of the premiums expended on the costs described in such subparagraph and
total H. R. 3590—769 premium revenue for each of the previous 3 years for the plan.
(2) CONSIDERATION IN SETTING PERCENTAGES.—In determining the percentages
under paragraph (1), a State shall seek to ensure adequate participation by health
insurance issuers, competition in the health insurance market in the State, and value for
consumers so that premiums are used for clinical services and quality improvements.
(3) ENFORCEMENT.—The Secretary shall promulgate regulations for enforcing the
provisions of this section and may provide for appropriate penalties.
(c) DEFINITIONS.—Not later than December 31, 2010, and subject to the certification of
the Secretary, the National Association of Insurance Commissioners shall establish
uniform definitions of the activities reported under subsection (a) and standardized
methodologies for calculating measures of such activities, including definitions of which
activities, and in what regard such activities, constitute activities described in subsection(a)(2). Such methodologies shall be designed to take into account the specia
circumstances of smaller plans, different types of plans, and newer plans.
(d) ADJUSTMENTS.—The Secretary may adjust the rates described in subsection (b) i
the Secretary determines appropriate on account of the volatility of the individual market
due to the establishment of State Exchanges.
(e) STANDARD HOSPITAL CHARGES.—Each hospital operating within the United States
shall for each year establish (and update) and make public (in accordance with guidelines
developed by the Secretary) a list of the hospital’s standard charges for items and
services provided by the hospital, including for diagnosis-related groups established unde
section 1886(d)(4) of the Social Securi ty Act.’’.
HEALTHCAR

8/8/2019 May 2010 Oppenheimer Report
http://slidepdf.com/reader/full/may-2010-oppenheimer-report 38/41
38
HEALTHCARE

8/8/2019 May 2010 Oppenheimer Report
http://slidepdf.com/reader/full/may-2010-oppenheimer-report 39/41
Important Disclosures and Certifications
Analyst Certification - The author certifies that this research report accurately states his/her personal views about t
subject securities, which are reflected in the ratings as well as in the substance of this report.The author certifies that n
part of his/her compensation was, is, or will be directly or indirectly related to the specific recommendations or view
contained in this research report.Potential Conflicts of Interest:
Equity research analysts employed by Oppenheimer & Co. Inc. are compensated from revenues generated by the firm
including the Oppenheimer & Co. Inc. Investment Banking Department. Research analysts do not receive compensatio
based upon revenues from specific investment banking transactions. Oppenheimer & Co. Inc. generally prohibits an
research analyst and any member of his or her household from executing trades in the securities of a company that suc
research analyst covers. Additionally, Oppenheimer & Co. Inc. generally prohibits any research analyst from serving as a
officer, director or advisory board member of a company that such analyst covers. In addition to 1% ownership positions
covered companies that are required to be specifically disclosed in this report, Oppenheimer & Co. Inc. may have a lon
position of less than 1% or a short position or deal as principal in the securities discussed herein, related securities or
options, futures or other derivative instruments based thereon. Recipients of this report are advised that any or all of th
foregoing arrangements, as well as more specific disclosures set forth below, may at times give rise to potential conflicts
interest.
Important Disclosure Footnotes for Companies Mentioned in this Report that Are Covered byOppenheimer & Co. Inc:
Stock Prices as of May 12, 2010
Aetna, Inc. (AET - NYSE, 29.05, OUTPERFORM)AMERIGROUP Corp. (AGP - NYSE, 34.19, OUTPERFORM)CIGNA Corp. (CI - NYSE, 32.63, PERFORM)Centene Corp. (CNC - NYSE, 21.69, UNDERPERFORM)Coventry Health Care, Inc. (CVH - NYSE, 20.55, PERFORM)eHealth, Inc. (EHTH - Nasdaq, 12.72, UNDERPERFORM)Triple-S Management Corp. (GTS - NYSE, 17.76, OUTPERFORM)
Health Net, Inc. (HNT - NYSE, 22.93, OUTPERFORM)HealthSpring Inc. (HS - NYSE, 16.84, PERFORM)Humana, Inc. (HUM - NYSE, 44.34, OUTPERFORM)Magellan Health Services (MGLN - Nasdaq, 39.23, OUTPERFORM)Molina Healthcare (MOH - NYSE, 27.34, PERFORM)Universal American Corp. (UAM - NYSE, 13.52, OUTPERFORM)UnitedHealth Group, Inc. (UNH - NYSE, 28.96, UNDERPERFORM)WellCare Health Plans, Inc. (WCG - NYSE, 25.85, PERFORM)WellPoint, Inc. (WLP - NYSE, 51.17, OUTPERFORM)
All price targets displayed in the chart above are for a 12- to- 18-month period. Prior to March 30, 2004, Oppenheimer
Co. Inc. used 6-, 12-, 12- to 18-, and 12- to 24-month price targets and ranges. For more information about target pric
histories, please write to Oppenheimer & Co. Inc., 300 Madison Avenue, New York, NY 10017, Attention: Equity ResearcDepartment, Business Manager.
Oppenheimer & Co. Inc. Rating System as of January 14th, 2008:
Outperform(O) - Stock expected to outperform the S&P 500 within the next 12-18 months.
Perform (P) - Stock expected to perform in line with the S&P 500 within the next 12-18 months.
HEALTHCAR
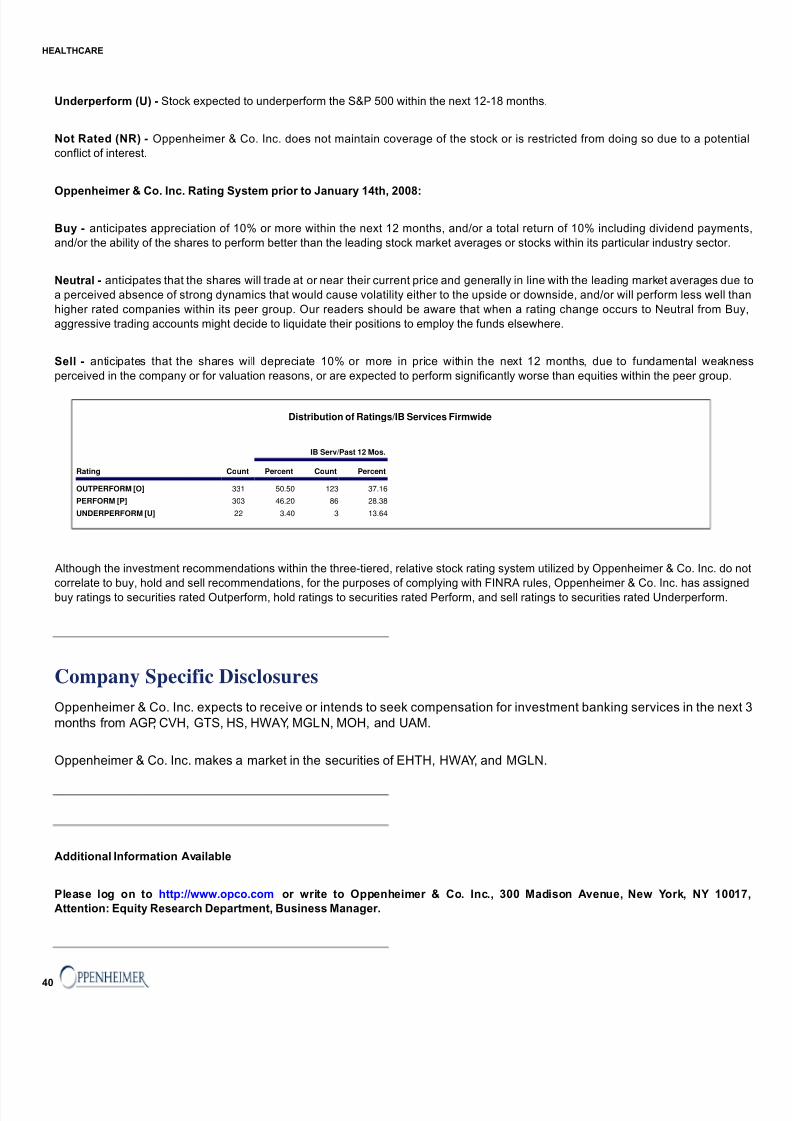
8/8/2019 May 2010 Oppenheimer Report
http://slidepdf.com/reader/full/may-2010-oppenheimer-report 40/41
40
Underperform (U) - Stock expected to underperform the S&P 500 within the next 12-18 months.
Not Rated (NR) - Oppenheimer & Co. Inc. does not maintain coverage of the stock or is restricted from doing so due to a potenti
conflict of interest.
Oppenheimer & Co. Inc. Rating System prior to January 14th, 2008:
Buy - anticipates appreciation of 10% or more within the next 12 months, and/or a total return of 10% including dividend paymen
and/or the ability of the shares to perform better than the leading stock market averages or stocks within its particular industry sector.
Neutral - anticipates that the shares will trade at or near their current price and generally in line with the leading market averages due
a perceived absence of strong dynamics that would cause volatility either to the upside or downside, and/or will perform less well tha
higher rated companies within its peer group. Our readers should be aware that when a rating change occurs to Neutral from Buy
aggressive trading accounts might decide to liquidate their positions to employ the funds elsewhere.
Sell - anticipates that the shares will depreciate 10% or more in price within the next 12 months, due to fundamental weakne
perceived in the company or for valuation reasons, or are expected to perform significantly worse than equities within the peer group.
Distribution of Ratings/IB Services Firmwide
IB Serv/Past 12 Mos.
Rating Count Percent Count Percent
OUTPERFORM [O] 331 50.50 123 37.16
PERFORM [P] 303 46.20 86 28.38
UNDERPERFORM [U] 22 3.40 3 13.64
Although the investment recommendations within the three-tiered, relative stock rating system utilized by Oppenheimer & Co. Inc. do n
correlate to buy, hold and sell recommendations, for the purposes of complying with FINRA rules, Oppenheimer & Co. Inc. has assigne
buy ratings to securities rated Outperform, hold ratings to securities rated Perform, and sell ratings to securities rated Underperform.
Company Specific Disclosures
Oppenheimer & Co. Inc. expects to receive or intends to seek compensation for investment banking services in the next
months from AGP, CVH, GTS, HS, HWAY, MGLN, MOH, and UAM.
Oppenheimer & Co. Inc. makes a market in the securities of EHTH, HWAY, and MGLN.
Additional Information Available
Please log on to http://www.opco.com or write to Oppenheimer & Co. Inc., 300 Madison Avenue, New York, NY 1001
Attention: Equity Research Department, Business Manager.
HEALTHCARE

8/8/2019 May 2010 Oppenheimer Report
http://slidepdf.com/reader/full/may-2010-oppenheimer-report 41/41
Other DisclosuresThis report is issued and approved for distribution by Oppenheimer & Co. Inc., a member of all Principal Exchanges and SIPC. Th
report is provided, for informational purposes only, to institutional and retail investor clients of Oppenheimer & Co. Inc. and does no
constitute an offer or solicitation to buy or sell any securities discussed herein in any jurisdiction where such offer or solicitation would
prohibited. The securities mentioned in this report may not be suitable for all types of investors. This report does not take into accou
the investment objectives, financial situation or specific needs of any particular client of Oppenheimer & Co. Inc. Recipients shou
consider this report as only a single factor in making an investment decision and should not rely solely on investment recommendatio
contained herein, if any, as a substitution for the exercise of independent judgment of the merits and risks of investments. The analys
writing the report is not a person or company with actual, implied or apparent authority to act on behalf of any issuer mentioned in th
report. Before making an investment decision with respect to any security recommended in this report, the recipient should consid
whether such recommendation is appropriate given the recipient's particular investment needs, objectives and financial circumstance
We recommend that investors independently evaluate particular investments and strategies, and encourage investors to seek the advic
of a financial advisor.Oppenheimer & Co. Inc. will not treat non-client recipients as its clients solely by virtue of their receiving th
report.Past performance is not a guarantee of future results, and no representation or warranty, express or implied, is made regardi
future performance of any security mentioned in this report. The price of the securities mentioned in this report and the income th
produce may fluctuate and/or be adversely affected by exchange rates, and investors may realize losses on investments in suc
securities, including the loss of investment principal. Oppenheimer & Co. Inc. accepts no liability for any loss arising from the use
information contained in this report, except to the extent that liability may arise under specific statutes or regulations applicable
Oppenheimer & Co. Inc.All information, opinions and statistical data contained in this report were obtained or derived from pubsources believed to be reliable, but Oppenheimer & Co. Inc. does not represent that any such information, opinion or statistical data
accurate or complete (with the exception of information contained in the Important Disclosures section of this report provided
Oppenheimer & Co. Inc. or individual research analysts), and they should not be relied upon as such. All estimates, opinions a
recommendations expressed herein constitute judgments as of the date of this report and are subject to change without notice.Noth
in this report constitutes legal, accounting or tax advice. Since the levels and bases of taxation can change, any reference in this repo
to the impact of taxation should not be construed as offering tax advice on the tax consequences of investments. As with any investme
having potential tax implications, clients should consult with their own independent tax adviser.This report may provide addresses of,
contain hyperlinks to, Internet web sites. Oppenheimer & Co. Inc. has not reviewed the linked Internet web site of any third party a
takes no responsibility for the contents thereof. Each such address or hyperlink is provided solely for the recipient's convenience an
information, and the content of linked third party web sites is not in any way incorporated into this document. Recipients who choose
access such third-party web sites or follow such hyperlinks do so at their own risk.
This report or any portion hereof may not be reprinted, sold, or redistributed without the written consent of Oppenheimer & Co. In
Copyright © Oppenheimer & Co. Inc. 2010.
HEALTHCAR