Embed Size (px)
Citation preview
MAY 2013
Insights on the Enterprise Value Frontier:The effect of a Funded Ratio advice model on advisors and investors
Johann Schneider, Program Director, Capital Markets Insights
THIS MATERIAL IS FOR FINANCIAL PROFESSIONAL USE ONLY AND NOT FOR DISTRIBUTION TO CURRENT OR POTENTIAL INVESTORS.
Important Information and Disclosures
While all material in this presentation is deemed to be reliable, accuracy and completeness cannot be guaranteed. The information, analysis, and opinions expressed herein are for general information only and are not intended to provide specific advice or recommendations for any individual or entity.
The information, analyses and opinions set forth herein are intended to serve as general information only and should not be relied upon by any individual or entity as advice or recommendations specific to that individual entity. It is not intended to constitute legal, tax, securities, or investment advice, nor an opinion regarding the appropriateness of any investment, nor a solicitation of any type. Anyone using this material should consult with their own attorney, accountant, financial or tax or consultants on whom they rely for investment advice specific to their own circumstances.
Some information shown is based on assumptions. Expected returns employ proprietary projections of the returns of each asset class. We estimate the performance of an asset class or strategy by analyzing current economic and market conditions and historical market trends. It is likely that actual returns will vary considerably from these assumptions, even for a number of years. References to future returns for either asset allocation strategies or asset classes are not promises or even estimates of actual returns a client portfolio may achieve. The assumptions do not take fees into consideration and all returns are assumed gross of fees. Asset classes are broad general categories which may or may not correspond well to specific products. Opinions and estimates offered constitute our judgment and are subject to change without notice, as are statements of financial market trends, which are based on current market conditions. This material is not intended as an offer or solicitation for the purchase or sale of any financial instrument.
Russell Investment Group is a Washington, USA corporation, which operates through subsidiaries worldwide, including Russell Investments, and is a subsidiary of The Northwestern Mutual Life Insurance Company.
Copyright© Russell Investments 2013. All rights reserved. This material is proprietary and may not be reproduced, transferred, or distributed in any form without prior written permission from Russell Investments. It is delivered on an “as is” basis without warranty.
Russell Financial Services, Inc., member FINRA, part of Russell Investments.
First used: May 2013.
RFS 13-10787
FINANCIAL PROFESSIONAL USE ONLYp.2
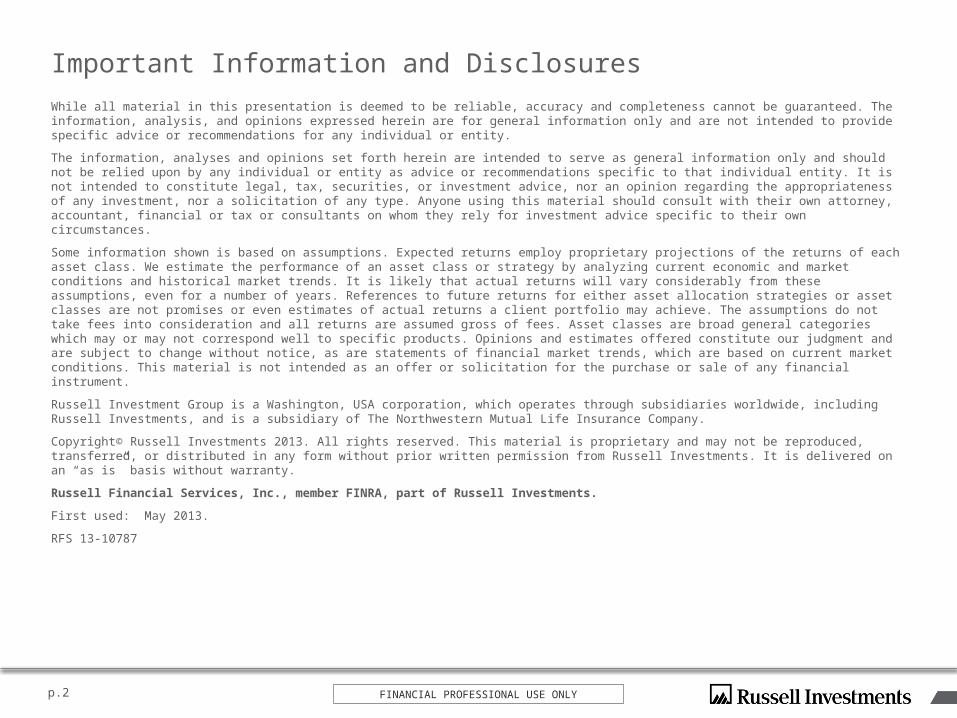
Staying on course: Successful navigation requires constant recalibrationSo does planning for retirement
p.3
Sailboat
Destination
Original c
ourse
Stay on old course
Ad
just
co
urs
e
Lost at sea
Blown off course
GPS
FINANCIAL PROFESSIONAL USE ONLY.
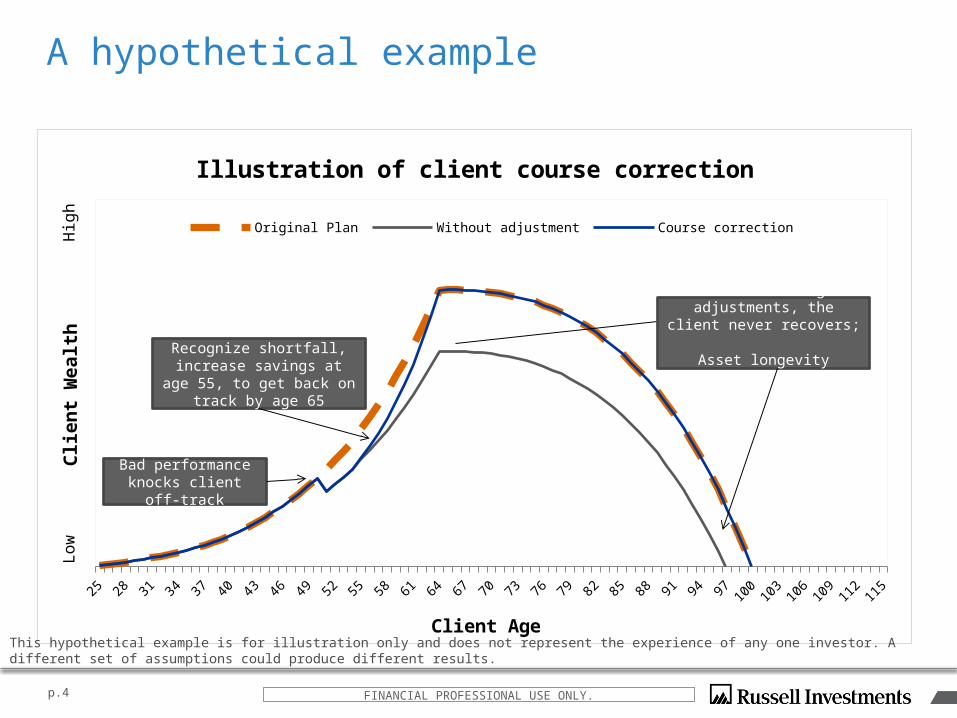
A hypothetical example
p.4
25 28 31 34 37 40 43 46 49 52 55 58 61 64 67 70 73 76 79 82 85 88 91 94 97 100
103
106
109
112
115
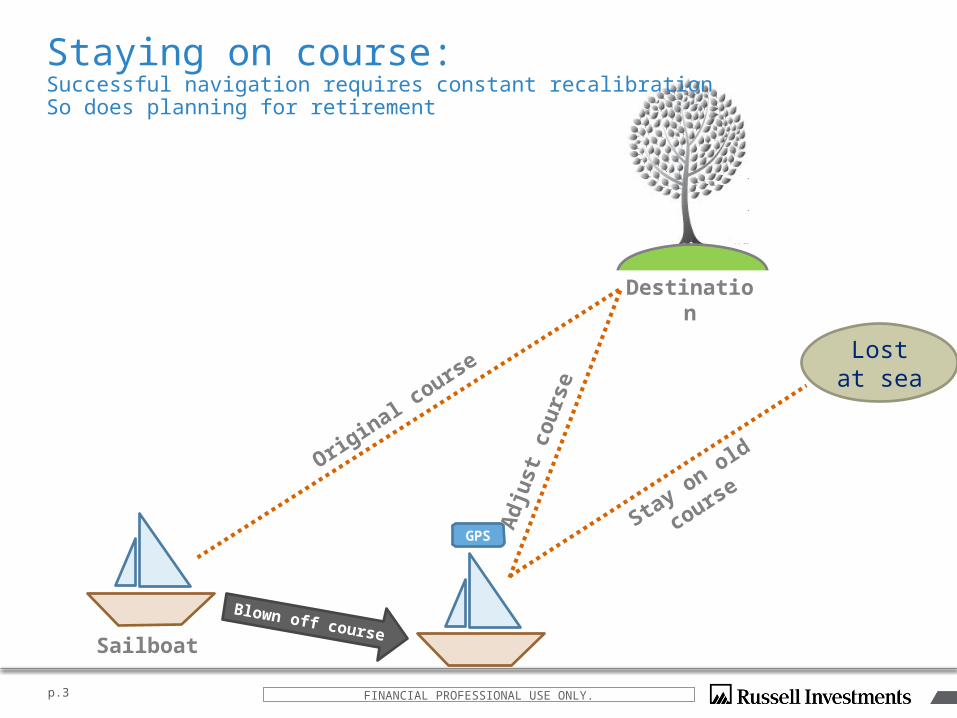
Illustration of client course correction
Original Plan Without adjustment Course correction
Client Age
Clie
nt
We
alt
h
Bad performance knocks client off-track
Recognize shortfall, increase savings at age 55, to get back on track by age 65
Without making adjustments, the client never recovers;
Asset longevity suffers
FINANCIAL PROFESSIONAL USE ONLY.
This hypothetical example is for illustration only and does not represent the experience of any one investor. A different set of assumptions could produce different results.
Lo
wH
igh
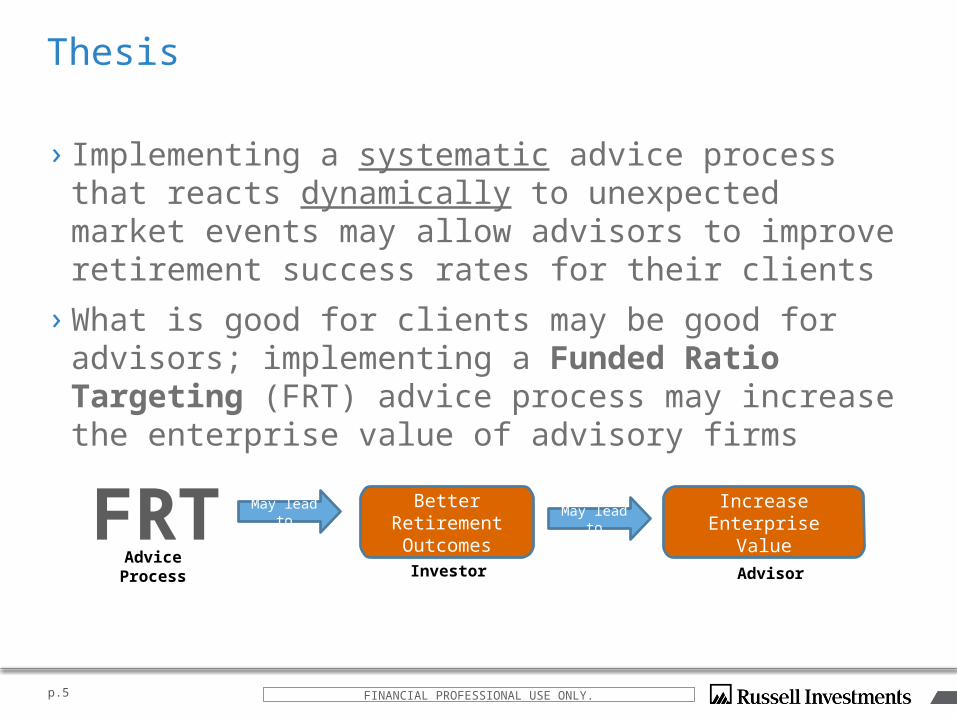
Thesis
› Implementing a systematic advice process that reacts dynamically to unexpected market events may allow advisors to improve retirement success rates for their clients
› What is good for clients may be good for advisors; implementing a Funded Ratio Targeting (FRT) advice process may increase the enterprise value of advisory firms
p.5
FRT May lead to
Advice Process
Better Retirement Outcomes
May lead to Increase Enterprise Value
Investor Advisor
FINANCIAL PROFESSIONAL USE ONLY.
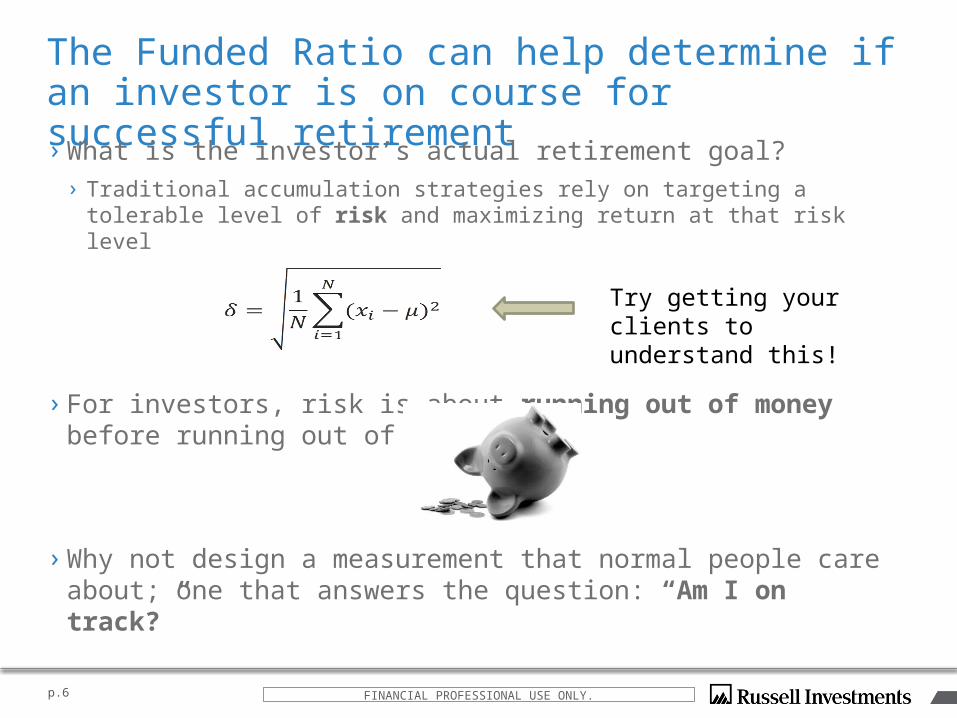
The Funded Ratio can help determine if an investor is on course for successful retirement
› What is the investor’s actual retirement goal?› Traditional accumulation strategies rely on targeting a tolerable level
of risk and maximizing return at that risk level
› For investors, risk is about running out of money before running out of life
› Why not design a measurement that normal people care about; one that answers the question: “Am I on track?”
p.6
Try getting your clients to understand this!
FINANCIAL PROFESSIONAL USE ONLY.

The key is balancing
Assets and Liabilities
FINANCIAL PROFESSIONAL USE ONLY.p.7
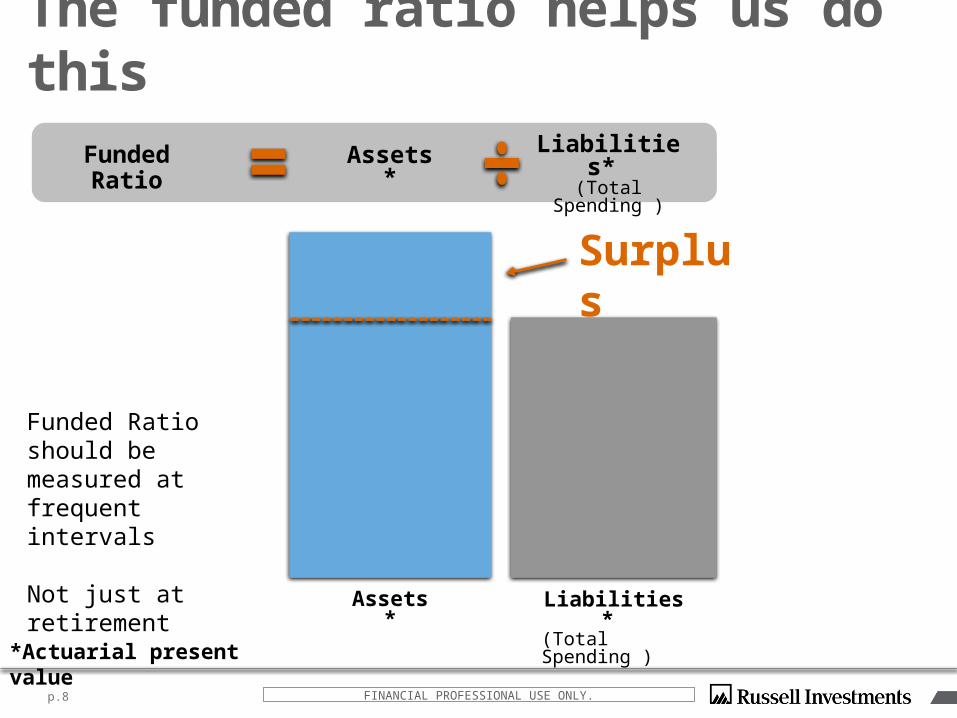
The funded ratio helps us do thisAssets* Liabilities*
(Total Spending )Funded Ratio
Surplus
Assets* Liabilities* (Total Spending )
*Actuarial present value
FINANCIAL PROFESSIONAL USE ONLY.p.8
Funded Ratio should be measured at frequent intervals
Not just at retirement
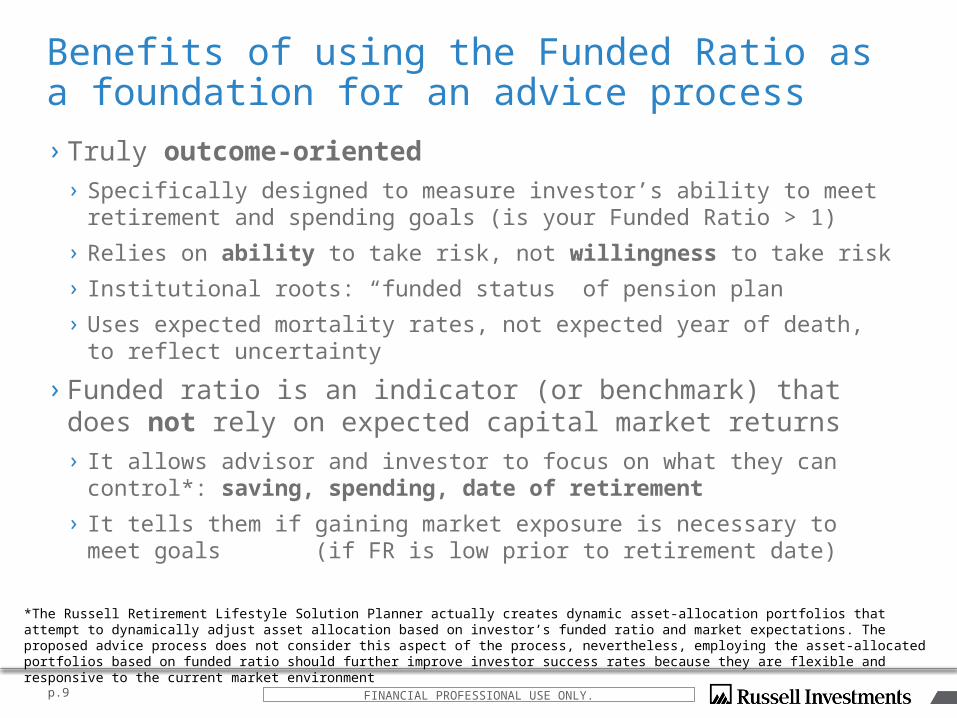
Benefits of using the Funded Ratio as a foundation for an advice process
› Truly outcome-oriented› Specifically designed to measure investor’s ability to meet retirement and
spending goals (is your Funded Ratio > 1)
› Relies on ability to take risk, not willingness to take risk
› Institutional roots: “funded status” of pension plan
› Uses expected mortality rates, not expected year of death, to reflect uncertainty
› Funded ratio is an indicator (or benchmark) that does not rely on expected capital market returns› It allows advisor and investor to focus on what they can control*: saving,
spending, date of retirement
› It tells them if gaining market exposure is necessary to meet goals (if FR is low prior to retirement date)
p.9
*The Russell Retirement Lifestyle Solution Planner actually creates dynamic asset-allocation portfolios that attempt to dynamically adjust asset allocation based on investor’s funded ratio and market expectations. The proposed advice process does not consider this aspect of the process, nevertheless, employing the asset-allocated portfolios based on funded ratio should further improve investor success rates because they are flexible and responsive to the current market environment
FINANCIAL PROFESSIONAL USE ONLY.
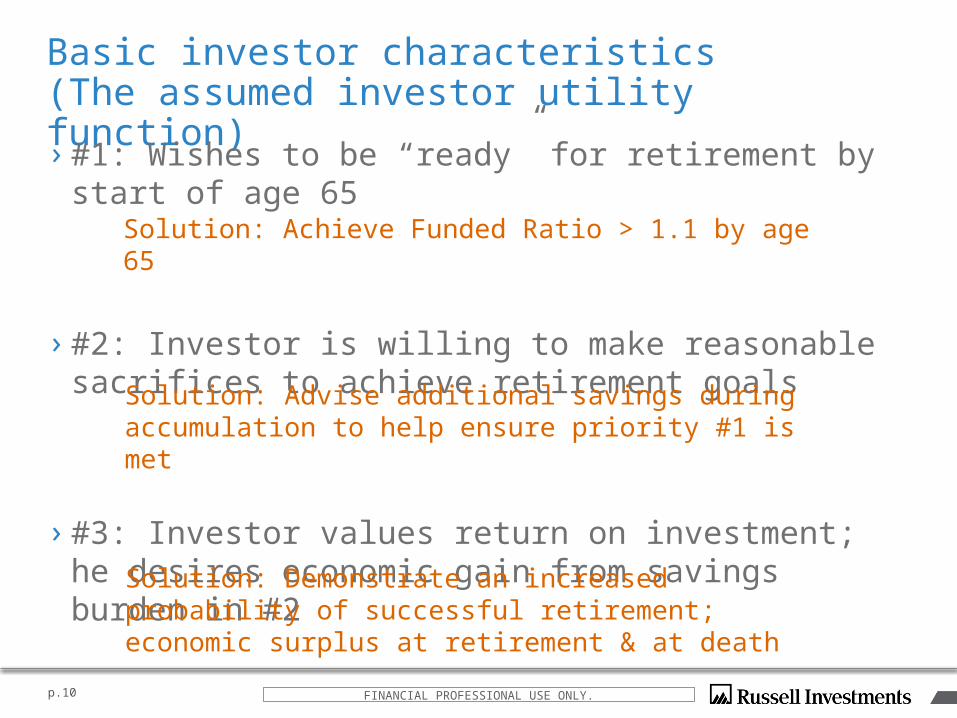
Basic investor characteristics(The assumed investor utility function)
› #1: Wishes to be “ready” for retirement by start of age 65
› #2: Investor is willing to make reasonable sacrifices to achieve retirement goals
› #3: Investor values return on investment; he desires economic gain from savings burden in #2
p.10
Solution: Achieve Funded Ratio > 1.1 by age 65
Solution: Advise additional savings during accumulation to help ensure priority #1 is met
Solution: Demonstrate an increased probability of successful retirement; economic surplus at retirement & at death
FINANCIAL PROFESSIONAL USE ONLY.
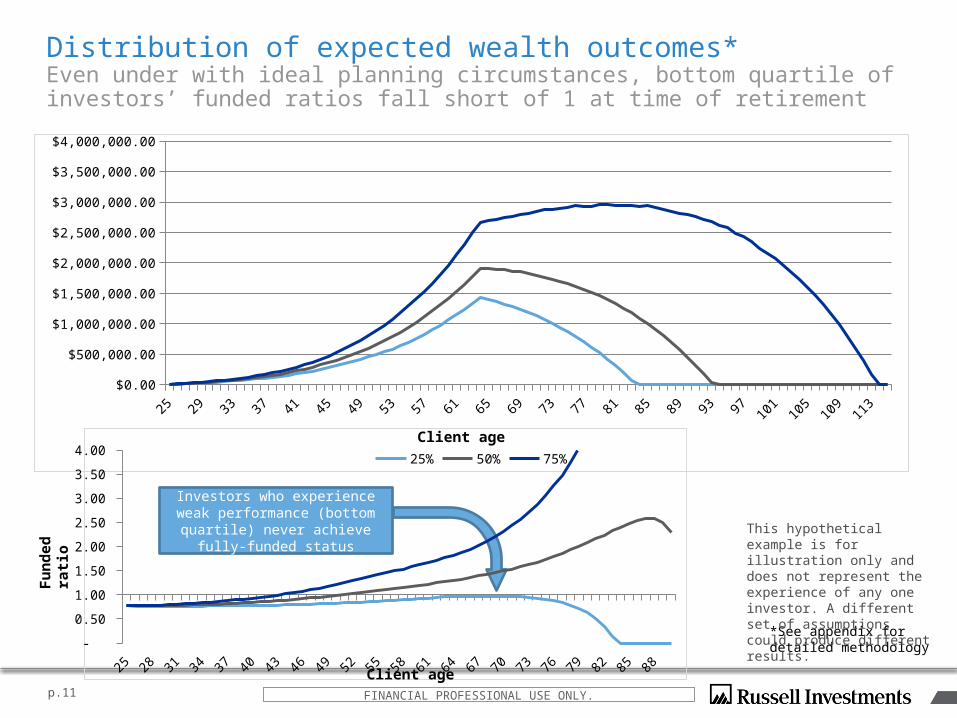
Distribution of expected wealth outcomes*Even under with ideal planning circumstances, bottom quartile of investors’ funded ratios fall short of 1 at time of retirement
p.11
25 28 31 34 37 40 43 46 49 52 55 58 61 64 67 70 73 76 79 82 85 88 91 94 97 100
103
106
109
112
115
$0.00
$500,000.00
$1,000,000.00
$1,500,000.00
$2,000,000.00
$2,500,000.00
$3,000,000.00
$3,500,000.00
$4,000,000.00
25% 50% 75%
-
0.50
1.00
1.50
2.00
2.50
3.00
3.50
4.00
Investors who experience weak performance (bottom quartile)
never achieve fully-funded status
*See appendix for detailed methodology
FINANCIAL PROFESSIONAL USE ONLY.
This hypothetical example is for illustration only and does not represent the experience of any one investor. A different set of assumptions could produce different results.
Fu
nd
ed r
atio
Client age
Client age
25 28 31 34 37 40 43 46 49 52 55 58 61 64 67 70 73 76 79 82 85 88 -
0.50
1.00
1.50
2.00
2.50
3.00
3.50
4.00
25 28 31 34 37 40 43 46 49 52 55 58 61 64 67 70 73 76 79 82 85 88 91 94 97 100
103
106
109
112
115
$0.00
$500,000.00
$1,000,000.00
$1,500,000.00
$2,000,000.00
$2,500,000.00
$3,000,000.00
$3,500,000.00
$4,000,000.00
25% 50% 75%
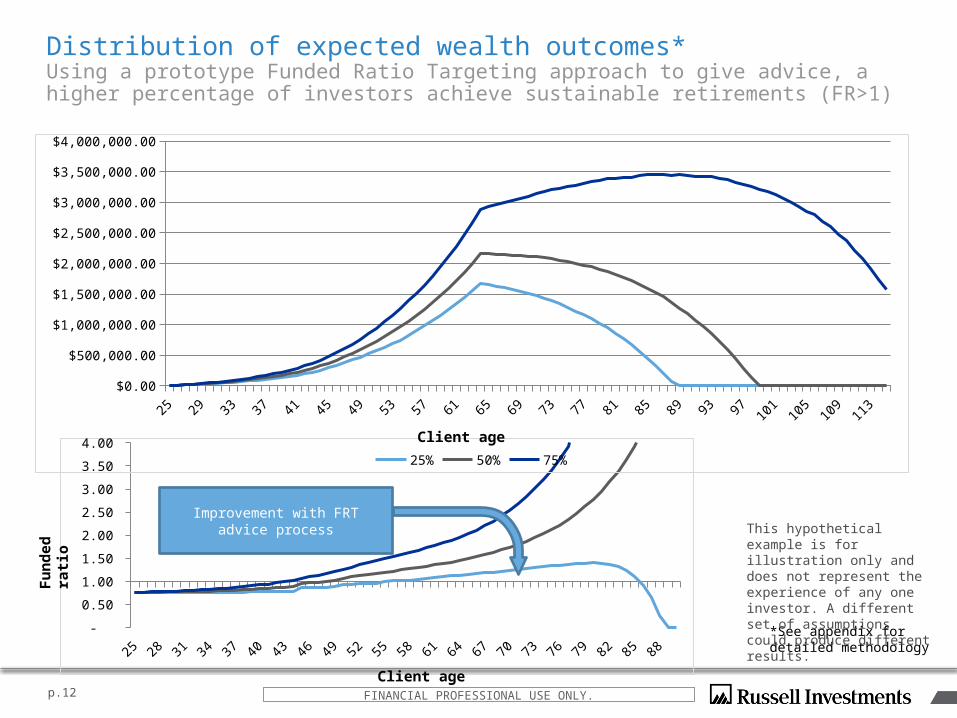
Distribution of expected wealth outcomes*Using a prototype Funded Ratio Targeting approach to give advice, a higher percentage of investors achieve sustainable retirements (FR>1)
p.12
Improvement with FRT advice process
FINANCIAL PROFESSIONAL USE ONLY.
*See appendix for detailed methodology
This hypothetical example is for illustration only and does not represent the experience of any one investor. A different set of assumptions could produce different results.
Client age
Client age
Fu
nd
ed r
atio
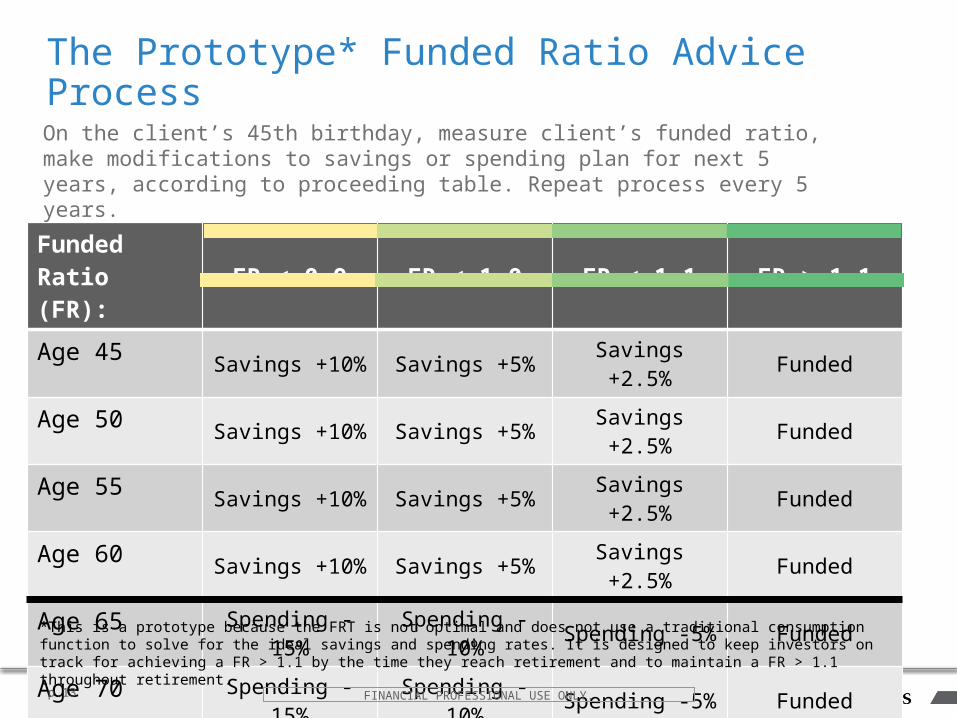
The Prototype* Funded Ratio Advice Process
Funded Ratio (FR):
FR < 0.9 FR < 1.0 FR < 1.1 FR > 1.1
Age 45 Savings +10% Savings +5% Savings +2.5% Funded
Age 50 Savings +10% Savings +5% Savings +2.5% Funded
Age 55 Savings +10% Savings +5% Savings +2.5% Funded
Age 60 Savings +10% Savings +5% Savings +2.5% Funded
Age 65 Spending -15% Spending -10% Spending -5% Funded
Age 70 Spending -15% Spending -10% Spending -5% Funded
Age 75 Spending -15% Spending -10% Spending -5% Funded
Age 80 Spending -15% Spending -10% Spending -5% Funded
p.13
On the client’s 45th birthday, measure client’s funded ratio, make modifications to savings or spending plan for next 5 years, according to proceeding table. Repeat process every 5 years.
*This is a prototype because the FRT is not optimal and does not use a traditional consumption function to solve for the ideal savings and spending rates. It is designed to keep investors on track for achieving a FR > 1.1 by the time they reach retirement and to maintain a FR > 1.1 throughout retirement.
FINANCIAL PROFESSIONAL USE ONLY.
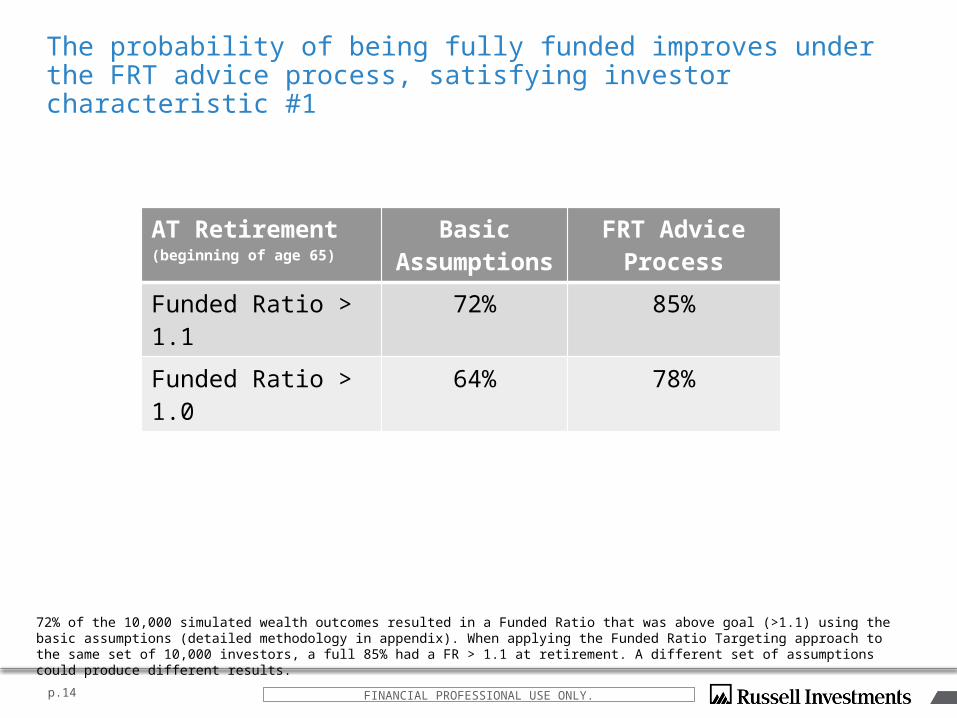
The probability of being fully funded improves under the FRT advice process, satisfying investor characteristic #1
p.14
AT Retirement (beginning of age 65)
Basic Assumptions
FRT Advice Process
Funded Ratio > 1.1 72% 85%
Funded Ratio > 1.0 64% 78%
72% of the 10,000 simulated wealth outcomes resulted in a Funded Ratio that was above goal (>1.1) using the basic assumptions (detailed methodology in appendix). When applying the Funded Ratio Targeting approach to the same set of 10,000 investors, a full 85% had a FR > 1.1 at retirement. A different set of assumptions could produce different results.
FINANCIAL PROFESSIONAL USE ONLY.
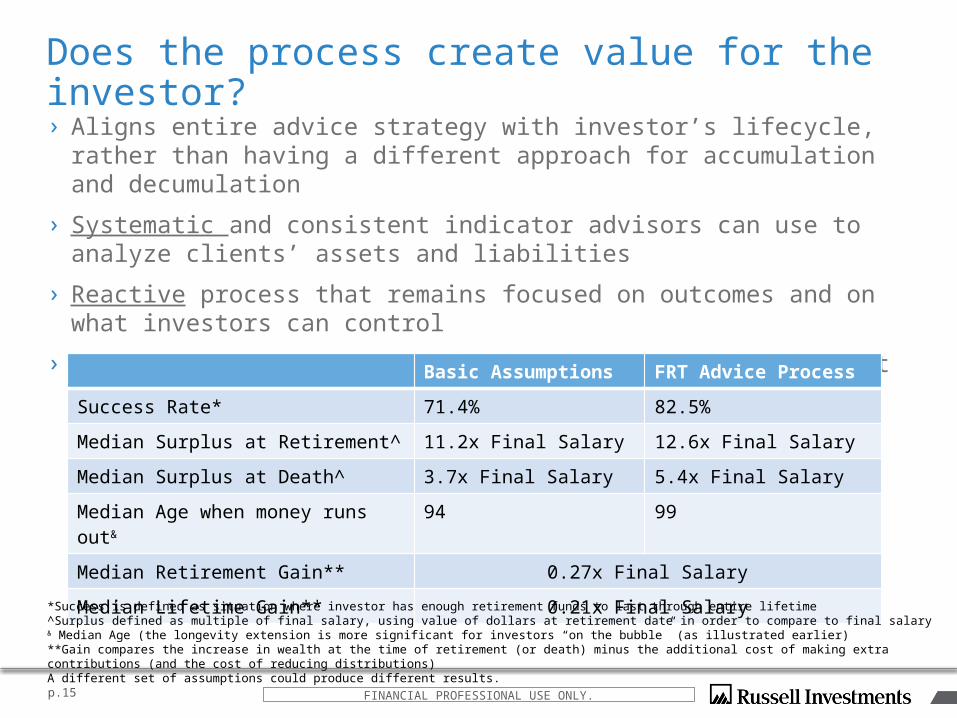
Does the process create value for the investor?
› Aligns entire advice strategy with investor’s lifecycle, rather than having a different approach for accumulation and decumulation
› Systematic and consistent indicator advisors can use to analyze clients’ assets and liabilities
› Reactive process that remains focused on outcomes and on what investors can control
› Increase probability of achieving a funded ratio > 1.1 at retirement
p.15
Basic Assumptions FRT Advice Process
Success Rate* 71.4% 82.5%
Median Surplus at Retirement^ 11.2x Final Salary 12.6x Final Salary
Median Surplus at Death^ 3.7x Final Salary 5.4x Final Salary
Median Age when money runs out& 94 99
Median Retirement Gain** 0.27x Final Salary
Median Lifetime Gain** 0.21x Final Salary
*Success is defined as situation where investor has enough retirement funds to last through entire lifetime^Surplus defined as multiple of final salary, using value of dollars at retirement date in order to compare to final salary& Median Age (the longevity extension is more significant for investors “on the bubble” (as illustrated earlier)**Gain compares the increase in wealth at the time of retirement (or death) minus the additional cost of making extra contributions (and the cost of reducing distributions)A different set of assumptions could produce different results.
FINANCIAL PROFESSIONAL USE ONLY.
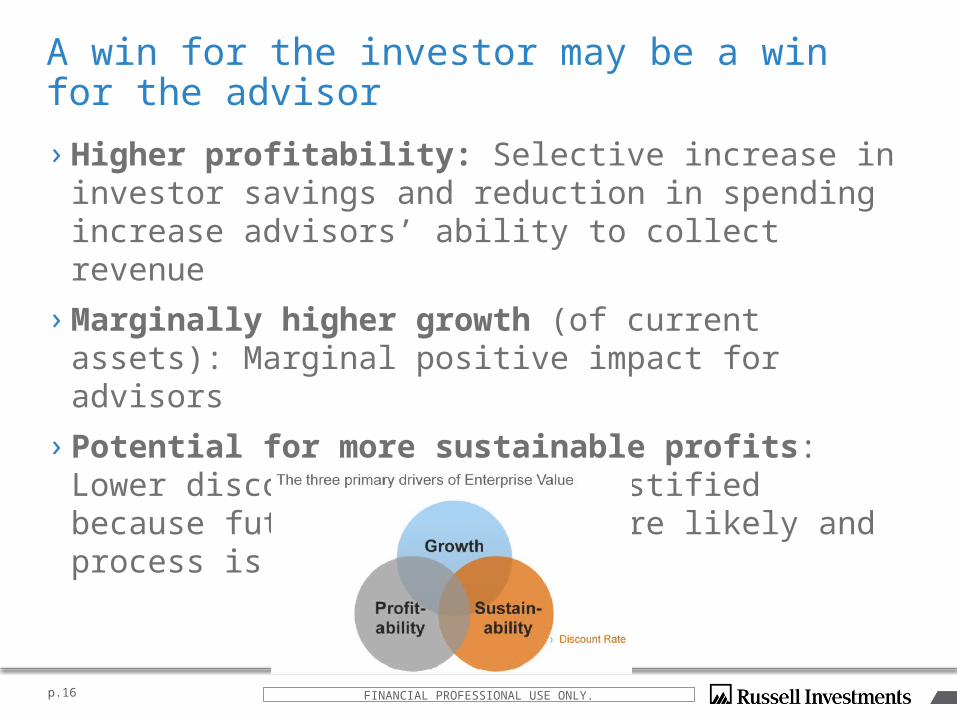
A win for the investor may be a win for the advisor
› Higher profitability: Selective increase in investor savings and reduction in spending increase advisors’ ability to collect revenue
› Marginally higher growth (of current assets): Marginal positive impact for advisors
› Potential for more sustainable profits: Lower discount rate may be justified because future profits are more likely and process is more consistent
p.16 FINANCIAL PROFESSIONAL USE ONLY.
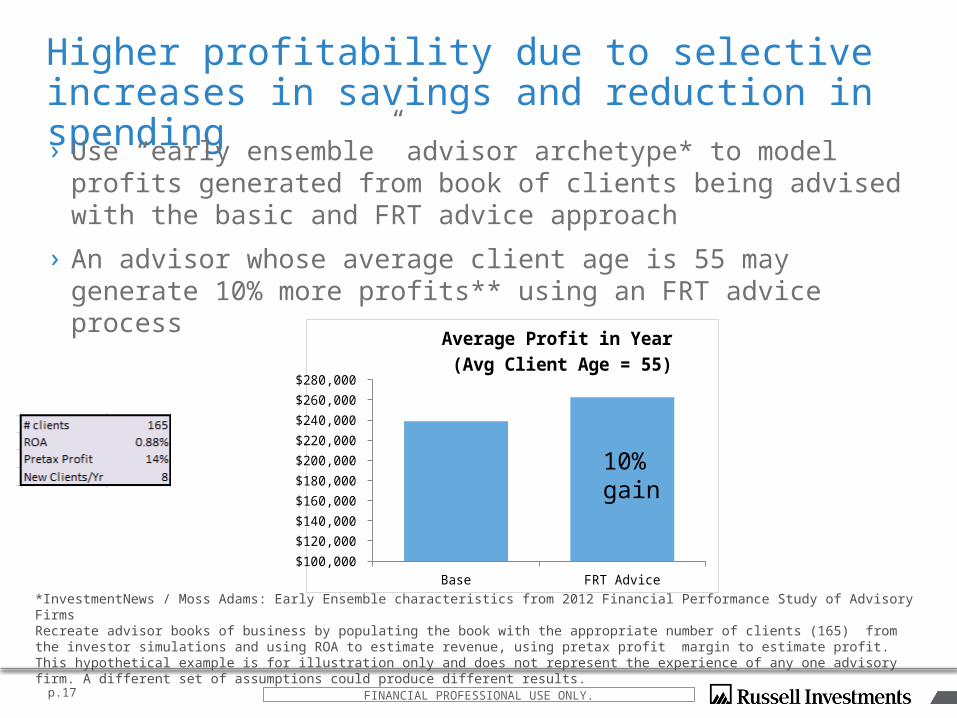
Higher profitability due to selective increases in savings and reduction in spending
› Use “early ensemble” advisor archetype* to model profits generated from book of clients being advised with the basic and FRT advice approach
› An advisor whose average client age is 55 may generate 10% more profits** using an FRT advice process
p.17
*InvestmentNews / Moss Adams: Early Ensemble characteristics from 2012 Financial Performance Study of Advisory FirmsRecreate advisor books of business by populating the book with the appropriate number of clients (165) from the investor simulations and using ROA to estimate revenue, using pretax profit margin to estimate profit.This hypothetical example is for illustration only and does not represent the experience of any one advisory firm. A different set of assumptions could produce different results.
Base FRT Advice $100,000
$120,000
$140,000
$160,000
$180,000
$200,000
$220,000
$240,000
$260,000
$280,000
Average Profit in Year (Avg Client Age = 55)
10% gain
FINANCIAL PROFESSIONAL USE ONLY.
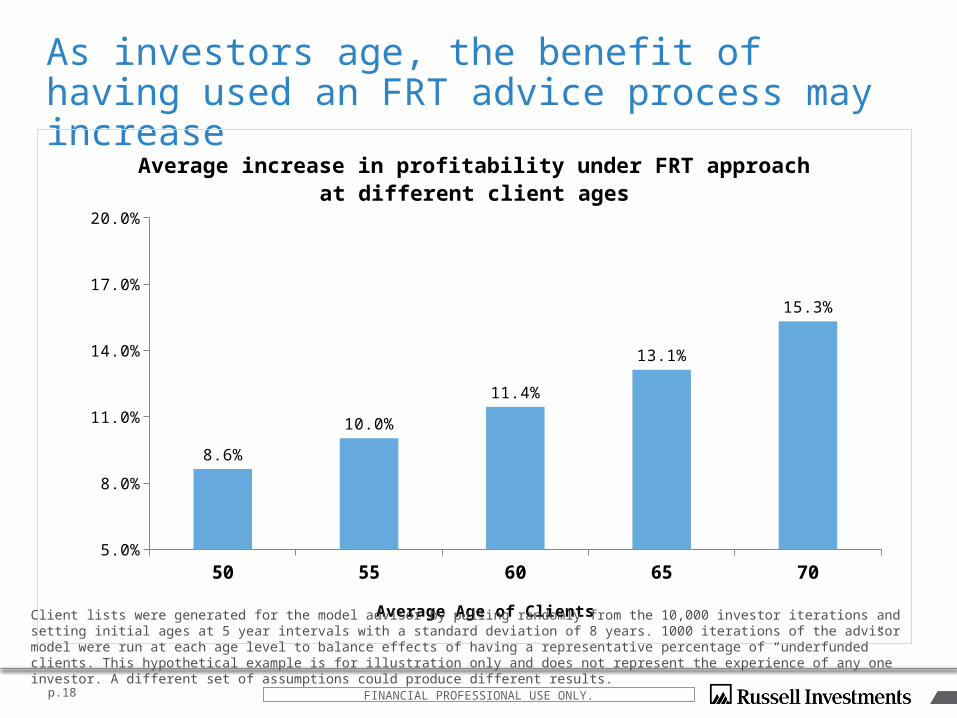
As investors age, the benefit of having used an FRT advice process may increase
p.18
50 55 60 65 705.0%
8.0%
11.0%
14.0%
17.0%
20.0%
8.6%
10.0%
11.4%
13.1%
15.3%
Average increase in profitability under FRT approach at different client ages
Average Age of ClientsClient lists were generated for the model advisor by pulling randomly from the 10,000 investor iterations and setting initial ages at 5 year intervals with a standard deviation of 8 years. 1000 iterations of the advisor model were run at each age level to balance effects of having a representative percentage of “underfunded” clients. This hypothetical example is for illustration only and does not represent the experience of any one investor. A different set of assumptions could produce different results.
FINANCIAL PROFESSIONAL USE ONLY.
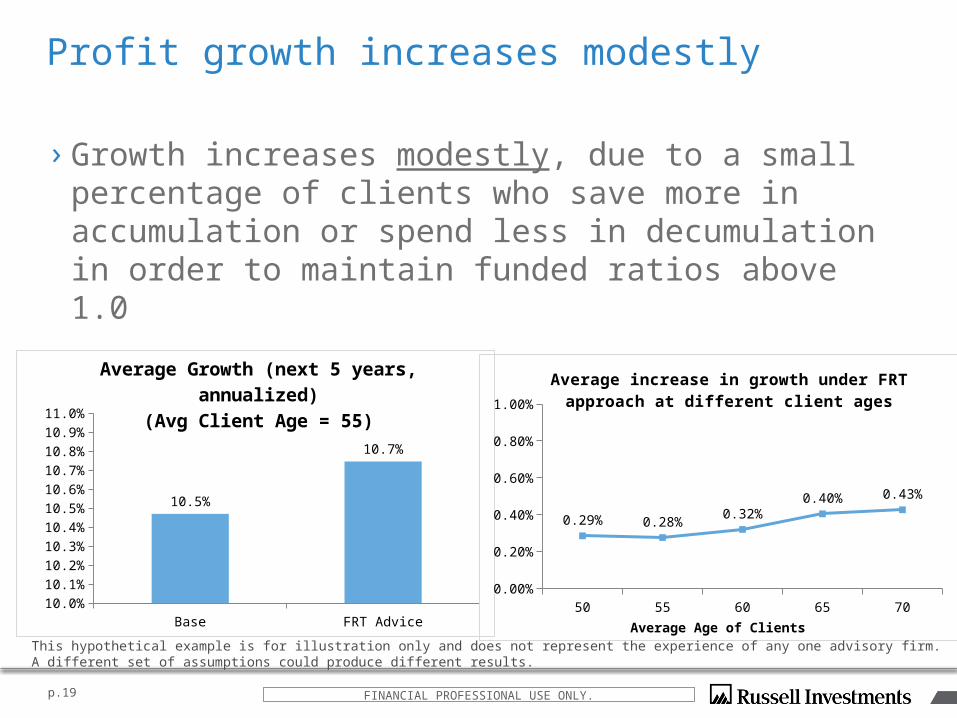
Profit growth increases modestly
› Growth increases modestly, due to a small percentage of clients who save more in accumulation or spend less in decumulation in order to maintain funded ratios above 1.0
p.19
Base FRT Advice10.0%
10.1%
10.2%
10.3%
10.4%
10.5%
10.6%
10.7%
10.8%
10.9%
11.0%
10.5%
10.7%
Average Growth (next 5 years, annual-ized)
(Avg Client Age = 55)
50 55 60 65 700.00%
0.20%
0.40%
0.60%
0.80%
1.00%
0.29% 0.28%0.32%
0.40% 0.43%
Average increase in growth under FRT approach at different client ages
Average Age of Clients
FINANCIAL PROFESSIONAL USE ONLY.
This hypothetical example is for illustration only and does not represent the experience of any one advisory firm. A different set of assumptions could produce different results.
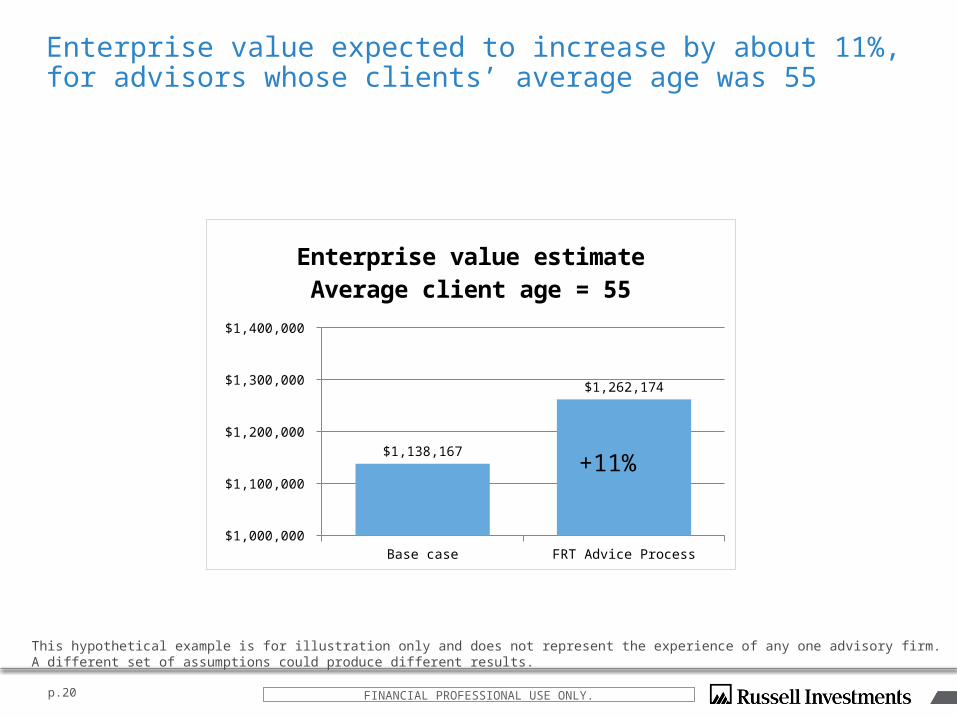
Enterprise value expected to increase by about 11%, for advisors whose clients’ average age was 55
p.20
Base case FRT Advice Process $1,000,000
$1,100,000
$1,200,000
$1,300,000
$1,400,000
$1,138,167
$1,262,174
Enterprise value estimateAverage client age = 55
+11%
FINANCIAL PROFESSIONAL USE ONLY.
This hypothetical example is for illustration only and does not represent the experience of any one advisory firm. A different set of assumptions could produce different results.
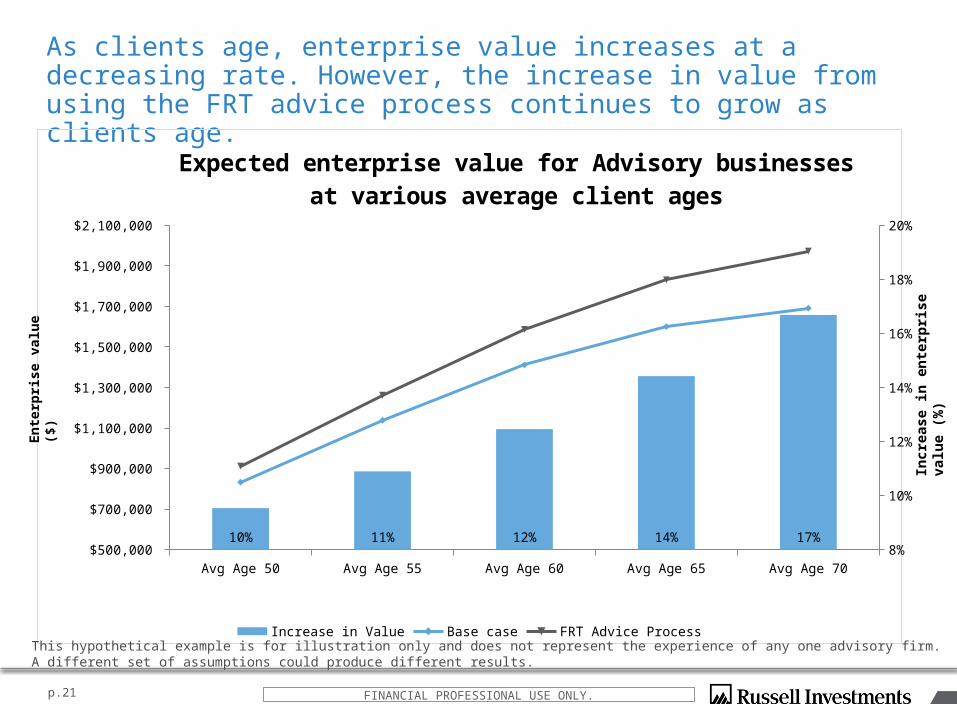
As clients age, enterprise value increases at a decreasing rate. However, the increase in value from using the FRT advice process continues to grow as clients age.
p.21
Avg Age 50 Avg Age 55 Avg Age 60 Avg Age 65 Avg Age 70 $500,000
$700,000
$900,000
$1,100,000
$1,300,000
$1,500,000
$1,700,000
$1,900,000
$2,100,000
8%
10%
12%
14%
16%
18%
20%
10% 11% 12% 14% 17%
Expected enterprise value for Advisory businesses at var-ious average client ages
Increase in Value Base case FRT Advice Process
FINANCIAL PROFESSIONAL USE ONLY.
This hypothetical example is for illustration only and does not represent the experience of any one advisory firm. A different set of assumptions could produce different results.
En
terp
rise
val
ue
($)
Incr
ease
in e
nte
rpri
se v
alu
e (%
)
Conclusions
› A systematic and dynamic advice process creates value for investors because it offers a reliable indicator of whether they are on track for retirement
› Advisors may use the funded ratio, borrowed from institutional pension investing, to objectively measure clients’ readiness for retirement and make suggestions about actions that may improve the chances of success
› Advisors may also benefit from incorporating a Funded Ratio Targeting (FRT) advice process by increasing potential profitability of clients, especially as they age
p.22 FINANCIAL PROFESSIONAL USE ONLY.
Appendix
FINANCIAL PROFESSIONAL USE ONLY.
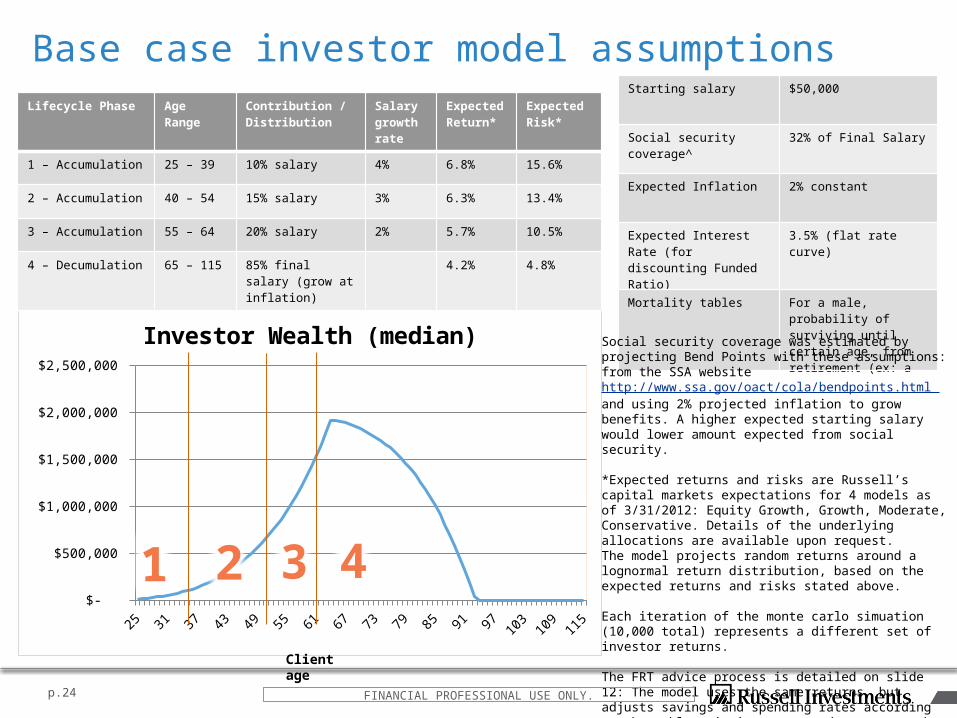
Base case investor model assumptions
p.24
25 30 35 40 45 50 55 60 65 70 75 80 85 90 95 100
105
110
115
$-
$500,000
$1,000,000
$1,500,000
$2,000,000
$2,500,000
Investor Wealth (median)
Lifecycle Phase Age Range
Contribution / Distribution
Salary growth rate
Expected Return*
Expected Risk*
1 – Accumulation 25 – 39 10% salary 4% 6.8% 15.6%
2 – Accumulation 40 – 54 15% salary 3% 6.3% 13.4%
3 – Accumulation 55 – 64 20% salary 2% 5.7% 10.5%
4 – Decumulation 65 – 115 85% final salary (grow at inflation)
4.2% 4.8%
1 2 3 4
Starting salary $50,000
Social security coverage^ 32% of Final Salary
Expected Inflation 2% constant
Expected Interest Rate (for discounting Funded Ratio)
3.5% (flat rate curve)
Mortality tables For a male, probability of surviving until certain age, from retirement (ex: a
Social security coverage was estimated by projecting Bend Points with these assumptions: from the SSA website http://www.ssa.gov/oact/cola/bendpoints.html and using 2% projected inflation to grow benefits. A higher expected starting salary would lower amount expected from social security.
*Expected returns and risks are Russell’s capital markets expectations for 4 models as of 3/31/2012: Equity Growth, Growth, Moderate, Conservative. Details of the underlying allocations are available upon request.The model projects random returns around a lognormal return distribution, based on the expected returns and risks stated above.
Each iteration of the monte carlo simuation (10,000 total) represents a different set of investor returns.
The FRT advice process is detailed on slide 12: The model uses the same returns, but adjusts savings and spending rates according to the table – it is meant to demonstrate the impact of using a different advice approach on the same investor.
FINANCIAL PROFESSIONAL USE ONLY.
Client age
Advisor Assumptions
› Use # of clients, return on assets, pre-tax profit margin, expected client growth from InvestmentNews / Moss Adams 2012 Financial Performance Study of Advisor Firms to generate profitability and next 5 years growth for advisors.
› Assume tax rate of 35%, long-term growth rate of 5%, discount rate of 25%.
› Look at advisors at different stages in career by generating client books with average age 50, 55, 60, 65, 70. Standard deviation: 8 years.
› Generate 1000 iterations for each age-group.
› Use average profitability, growth and discount rate to arrive at enterprise value for each advisor-type.
› Use a 5 year discounted cash flow model that projects a terminal value at the end of 5 years.
p.25 FINANCIAL PROFESSIONAL USE ONLY.

www.russell.com“Russell,” “Russell Investments,” “Russell 1000,” “Russell 2000,” and “Russell 3000” are registered trademarks of the Frank Russell Company.
FINANCIAL PROFESSIONAL USE ONLY.