Embed Size (px)
Citation preview

THE
Thought leadership and insights from Frontier Advisors
Issue 130 August 2017

Prior to joining Frontier, Benjamin gained experience as a Project Coordinator with Quanco, a boutique business consultancy based in Los Angeles, USA. Benjamin has completed a Bachelor of Commerce (Finance and Management) from the University of Melbourne and is currently undertaking a Masters of Applied Finance at Macquarie University. Ben has also completed the highly regarded AIST Super Grads program.
Michael is also an infrastructure specialist. He works with clients to design and build infrastructure portfolios. He advises on direct transactions and manages the group’s global infrastructure research database, RADIAS. Michael completed a Bachelor of Commerce and Bachelor of Aerospace Engineering (Hons) at Monash University. He graduated Class Dux for Engineering and received the University Medal for Commerce. He is a CFA Charterholder.
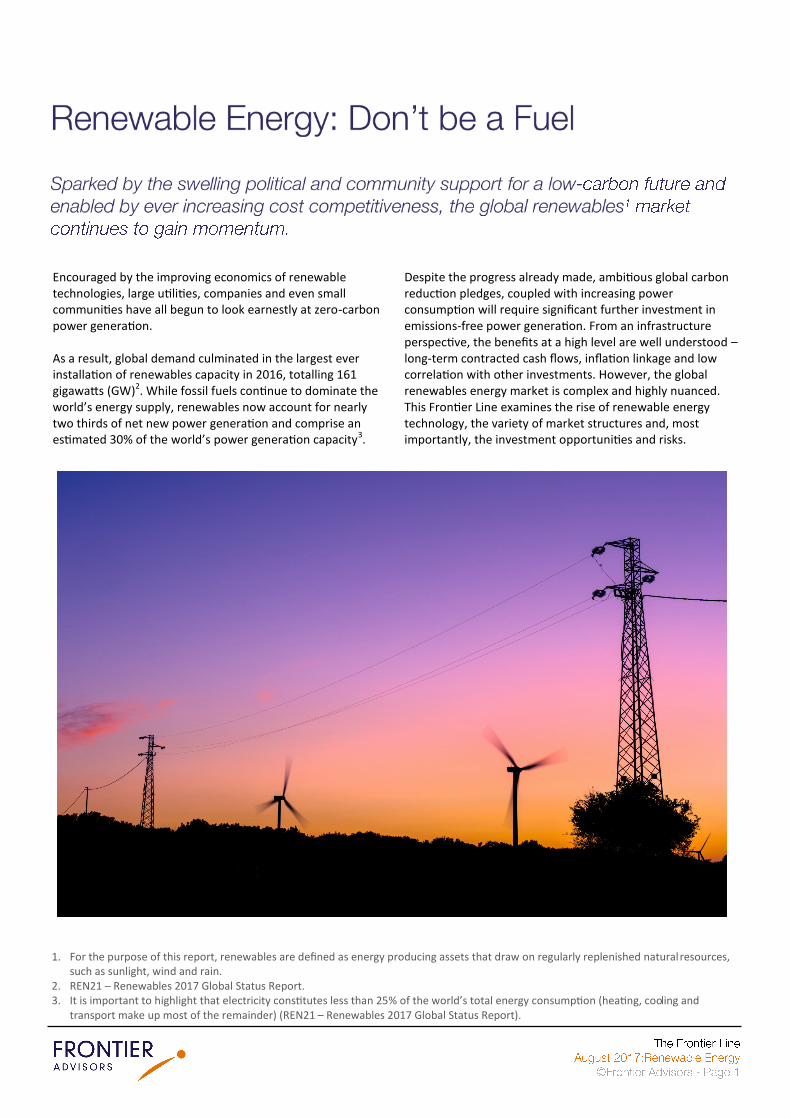
Encouraged by the improving economics of renewable technologies, large utilities, companies and even small communities have all begun to look earnestly at zero-carbon power generation.
As a result, global demand culminated in the largest ever installation of renewables capacity in 2016, totalling 161 gigawatts (GW)2. While fossil fuels continue to dominate the world’s energy supply, renewables now account for nearly two thirds of net new power generation and comprise an estimated 30% of the world’s power generation capacity3.
Despite the progress already made, ambitious global carbon reduction pledges, coupled with increasing power consumption will require significant further investment in emissions-free power generation. From an infrastructure perspective, the benefits at a high level are well understood – long-term contracted cash flows, inflation linkage and low correlation with other investments. However, the global renewables energy market is complex and highly nuanced. This Frontier Line examines the rise of renewable energy technology, the variety of market structures and, most importantly, the investment opportunities and risks.
1. For the purpose of this report, renewables are defined as energy producing assets that draw on regularly replenished natural resources, such as sunlight, wind and rain.
2. REN21 – Renewables 2017 Global Status Report. 3. It is important to highlight that electricity constitutes less than 25% of the world’s total energy consumption (heating, cooling and
transport make up most of the remainder) (REN21 – Renewables 2017 Global Status Report).
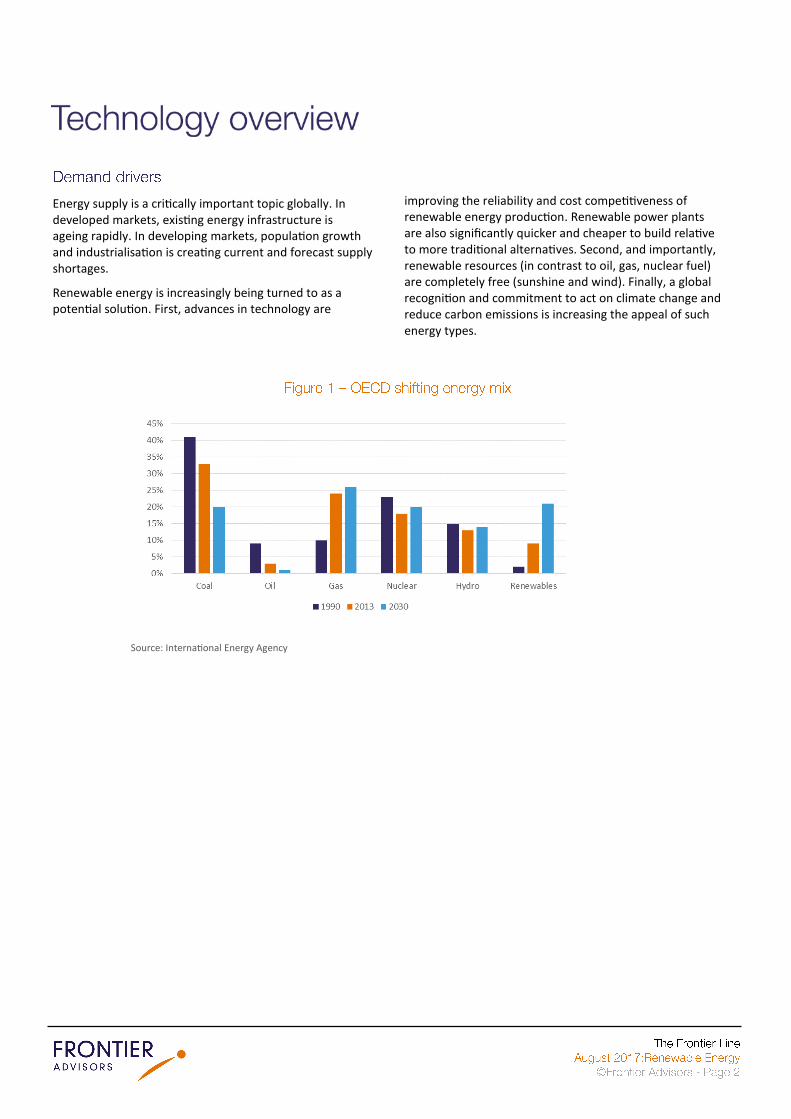
Energy supply is a critically important topic globally. In developed markets, existing energy infrastructure is ageing rapidly. In developing markets, population growth and industrialisation is creating current and forecast supply shortages.
Renewable energy is increasingly being turned to as a potential solution. First, advances in technology are
improving the reliability and cost competitiveness of renewable energy production. Renewable power plants are also significantly quicker and cheaper to build relative to more traditional alternatives. Second, and importantly, renewable resources (in contrast to oil, gas, nuclear fuel) are completely free (sunshine and wind). Finally, a global recognition and commitment to act on climate change and reduce carbon emissions is increasing the appeal of such energy types.
Source: International Energy Agency
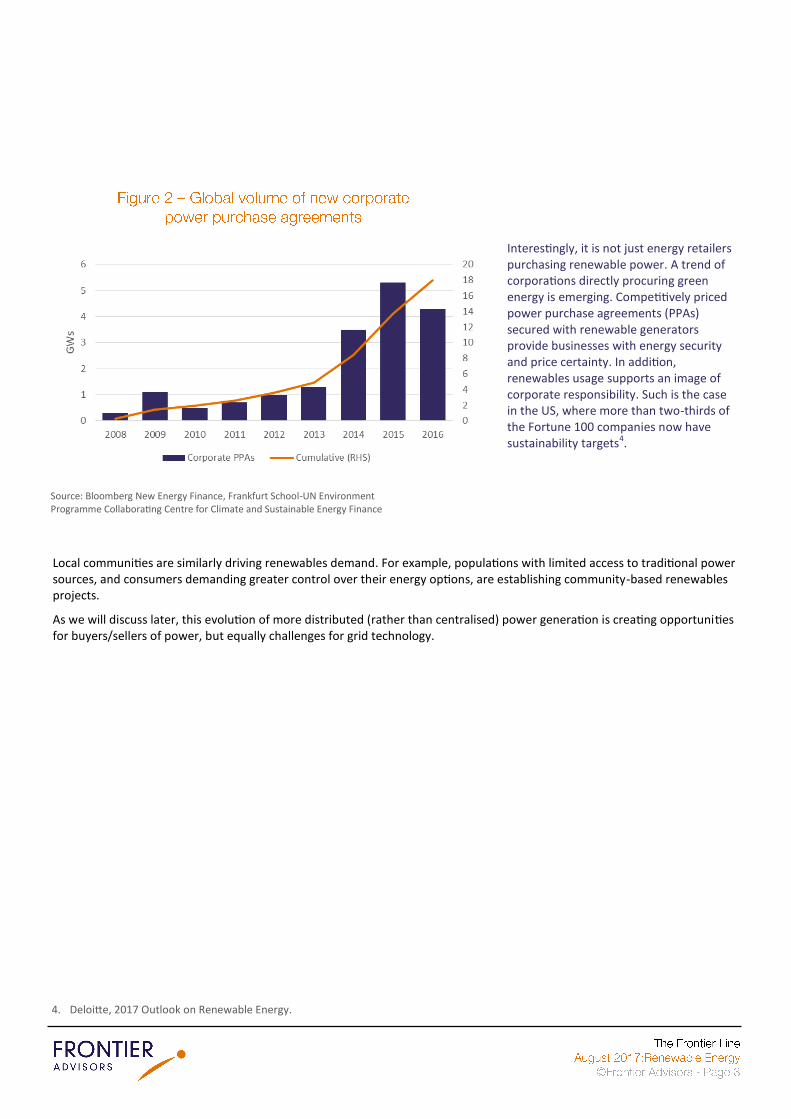
Local communities are similarly driving renewables demand. For example, populations with limited access to traditional power sources, and consumers demanding greater control over their energy options, are establishing community-based renewables projects.
As we will discuss later, this evolution of more distributed (rather than centralised) power generation is creating opportunities for buyers/sellers of power, but equally challenges for grid technology.
4. Deloitte, 2017 Outlook on Renewable Energy.
Source: Bloomberg New Energy Finance, Frankfurt School-UN Environment Programme Collaborating Centre for Climate and Sustainable Energy Finance
Interestingly, it is not just energy retailers purchasing renewable power. A trend of corporations directly procuring green energy is emerging. Competitively priced power purchase agreements (PPAs) secured with renewable generators provide businesses with energy security and price certainty. In addition, renewables usage supports an image of corporate responsibility. Such is the case in the US, where more than two-thirds of the Fortune 100 companies now have sustainability targets4.
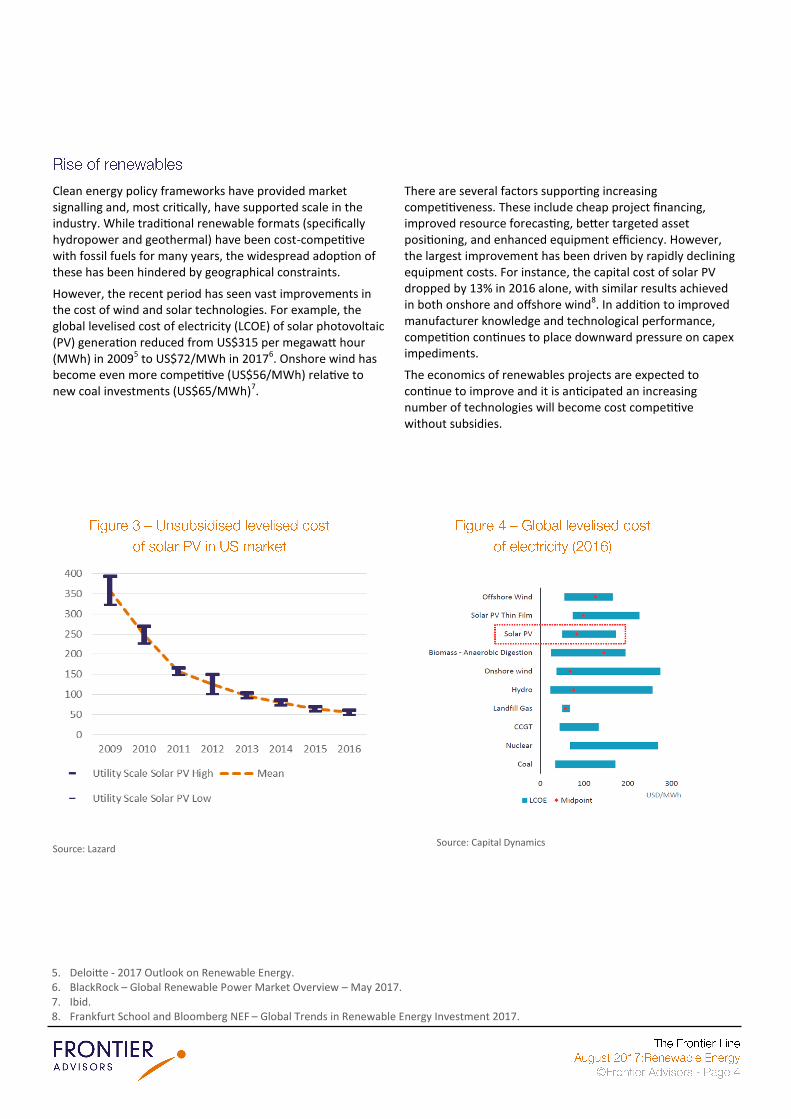
Clean energy policy frameworks have provided market signalling and, most critically, have supported scale in the industry. While traditional renewable formats (specifically hydropower and geothermal) have been cost-competitive with fossil fuels for many years, the widespread adoption of these has been hindered by geographical constraints.
However, the recent period has seen vast improvements in the cost of wind and solar technologies. For example, the global levelised cost of electricity (LCOE) of solar photovoltaic (PV) generation reduced from US$315 per megawatt hour (MWh) in 20095 to US$72/MWh in 20176. Onshore wind has become even more competitive (US$56/MWh) relative to new coal investments (US$65/MWh)7.
There are several factors supporting increasing competitiveness. These include cheap project financing, improved resource forecasting, better targeted asset positioning, and enhanced equipment efficiency. However, the largest improvement has been driven by rapidly declining equipment costs. For instance, the capital cost of solar PV dropped by 13% in 2016 alone, with similar results achieved in both onshore and offshore wind8. In addition to improved manufacturer knowledge and technological performance, competition continues to place downward pressure on capex impediments.
The economics of renewables projects are expected to continue to improve and it is anticipated an increasing number of technologies will become cost competitive without subsidies.
Source: Lazard Source: Capital Dynamics
5. Deloitte - 2017 Outlook on Renewable Energy. 6. BlackRock – Global Renewable Power Market Overview – May 2017. 7. Ibid. 8. Frankfurt School and Bloomberg NEF – Global Trends in Renewable Energy Investment 2017.
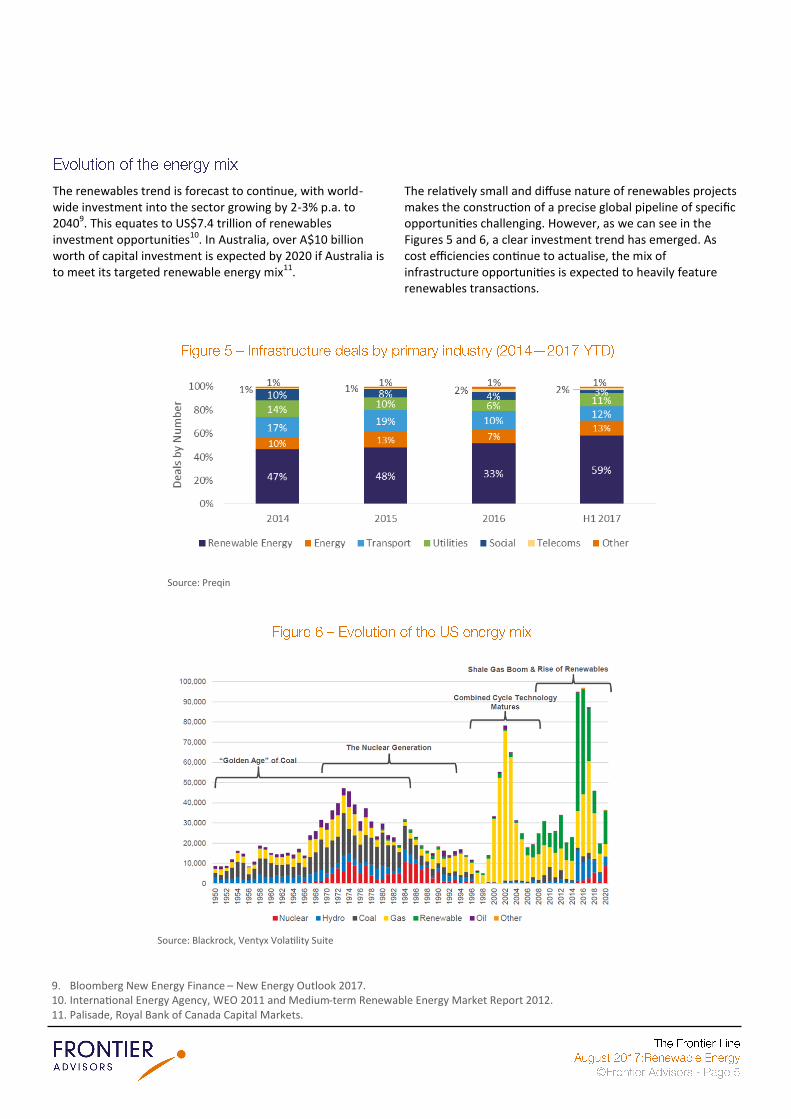
The renewables trend is forecast to continue, with world-wide investment into the sector growing by 2-3% p.a. to 20409. This equates to US$7.4 trillion of renewables investment opportunities10. In Australia, over A$10 billion worth of capital investment is expected by 2020 if Australia is to meet its targeted renewable energy mix11.
The relatively small and diffuse nature of renewables projects makes the construction of a precise global pipeline of specific opportunities challenging. However, as we can see in the Figures 5 and 6, a clear investment trend has emerged. As cost efficiencies continue to actualise, the mix of infrastructure opportunities is expected to heavily feature renewables transactions.
9. Bloomberg New Energy Finance – New Energy Outlook 2017. 10. International Energy Agency, WEO 2011 and Medium-term Renewable Energy Market Report 2012. 11. Palisade, Royal Bank of Canada Capital Markets.
Source: Preqin
Source: Blackrock, Ventyx Volatility Suite
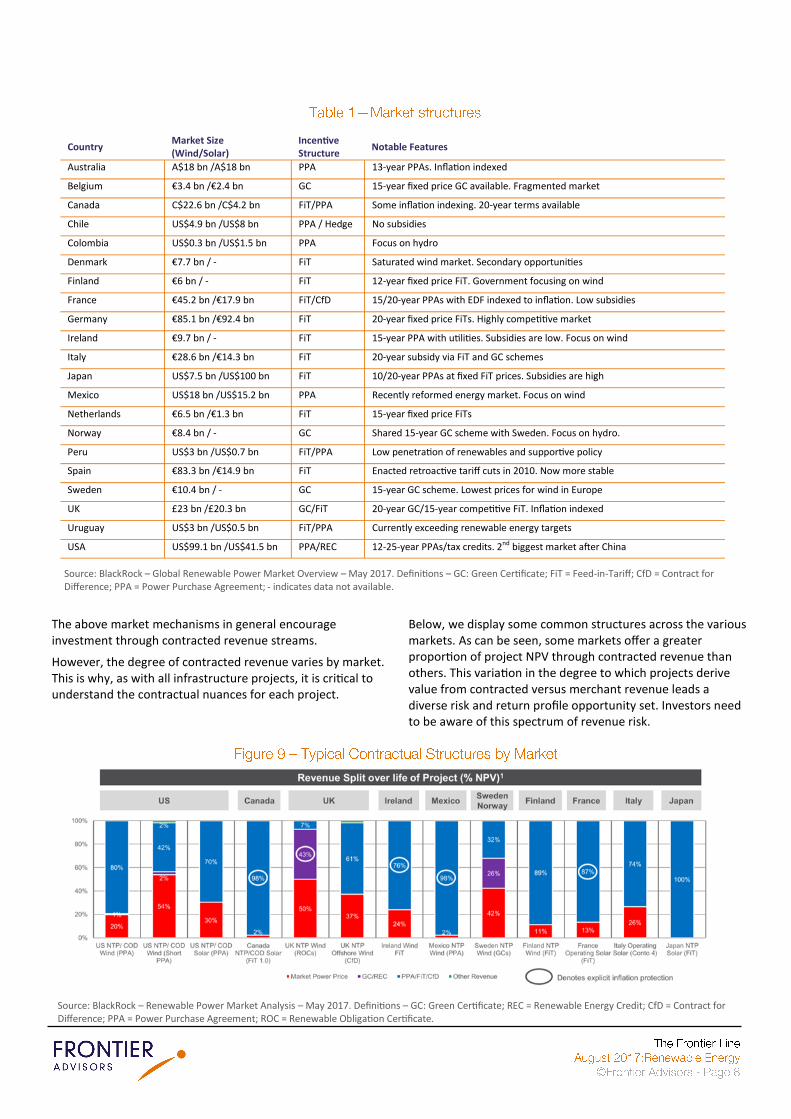
Breaking down investment by technology also reveals some important trends. According to Bloomberg New Energy Finance, wind, solar, biomass and waste, geothermal, small hydro and marine accounted for 55% of all new power generation added worldwide in 2016. However, overwhelmingly, the majority of investment went into solar and wind projects, and China accounted for a material proportion of this total investment.
Notably in Figure 8, total renewable energy investment has fallen over 2016. Renewable Energy Policy Network for the 21st Century (REN21) attributes the bulk of this decline to slowdowns in Japan, China and some other emerging countries. Interestingly, despite the total dollar value of investment in renewables falling in 2016, record levels of renewable generation were installed. This highlights that the significant cost reduction in solar and wind technology has allowed investors to acquire more capacity for less money.
12. Frankfurt School and Bloomberg NEF – Global Trends in Renewable Energy Investment 2017. 13. Ibid. 14. REN21 – Renewables 2017 Global Status Report.
Source: REN21 – Renewables 2017 Global Status Report
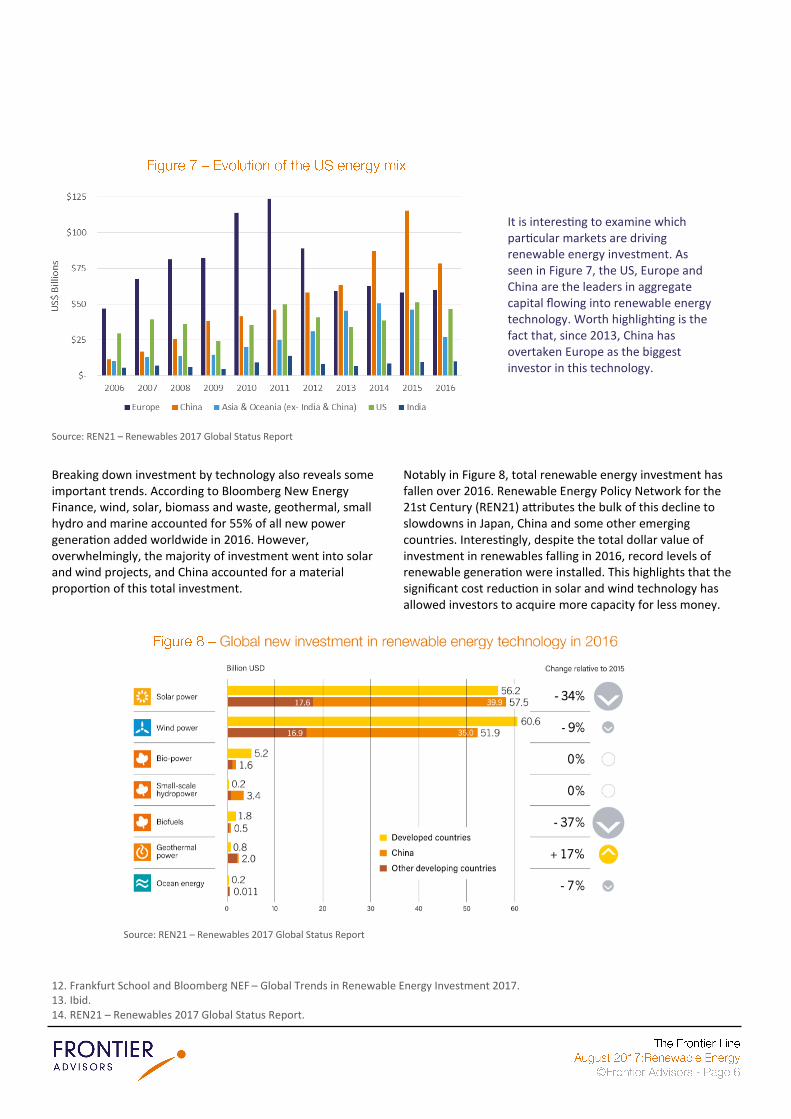
It is interesting to examine which particular markets are driving renewable energy investment. As seen in Figure 7, the US, Europe and China are the leaders in aggregate capital flowing into renewable energy technology. Worth highlighting is the fact that, since 2013, China has overtaken Europe as the biggest investor in this technology.
Source: REN21 – Renewables 2017 Global Status Report

Each market operates with its own subtleties and characteristics. However, the key markets are summarised below15. Australia is covered in a separate section.
Western Europe (France, UK, Ireland, Italy) – The region has a long history of supporting renewable energy technology. Typical structures include Feed-in-Tariff (FiT) legislation, which allows renewable energy projects to secure long-term contracts for the provision of power at fixed prices (but can include inflation indexing and other mechanisms) with utility companies. New market mechanisms are also emerging, such as contracts-for-difference (where a top-up payment is paid to producers if the wholesale price is below the target price, while the government is paid if the inverse is true) and competitive bidding auctions, which seek to improve cost effectiveness and limit distortions.
Nordics (Sweden and Norway) – Sweden and Norway typically feature long-term Power Purchase Agreements(PPAs) which cover the sale of power, but also the sale of green certificates.
US – The US is quite different to other markets and mostly encourages renewable energy investment through a tax credit system. Investment Tax Credits (ITCs) are generated before operation commences whereas Production Tax Credits (PTCs) apply to credits issued during operation. In addition, many states support investment in renewable energy technology through Renewable Portfolio Standards (RPS), which set minimum targets for renewable generation (e.g. California has a 50% RPS for 2030). Further, the Obama Administration did enact the Clean Power Plan, which sought to reduce CO2 emissions from electrical power generation in the US by 32% from 2005 levels by 2030. However, President Trump is currently seeking to dismantle this policy.
Table 1 provides further granular detail on the specifics of each market.
15. BlackRock – Global Renewable Power Market Overview – May 2017.
The above market mechanisms in general encourage investment through contracted revenue streams.
However, the degree of contracted revenue varies by market. This is why, as with all infrastructure projects, it is critical to understand the contractual nuances for each project.
Below, we display some common structures across the various markets. As can be seen, some markets offer a greater proportion of project NPV through contracted revenue than others. This variation in the degree to which projects derive value from contracted versus merchant revenue leads a diverse risk and return profile opportunity set. Investors need to be aware of this spectrum of revenue risk.
Source: BlackRock – Renewable Power Market Analysis – May 2017. Definitions – GC: Green Certificate; REC = Renewable Energy Credit; CfD = Contract for Difference; PPA = Power Purchase Agreement; ROC = Renewable Obligation Certificate.
Country Market Size (Wind/Solar)
Incentive Structure Notable Features
Australia A$18 bn /A$18 bn PPA 13-year PPAs. Inflation indexed
Belgium €3.4 bn /€2.4 bn GC 15-year fixed price GC available. Fragmented market
Canada C$22.6 bn /C$4.2 bn FiT/PPA Some inflation indexing. 20-year terms available
Chile US$4.9 bn /US$8 bn PPA / Hedge No subsidies
Colombia US$0.3 bn /US$1.5 bn PPA Focus on hydro
Denmark €7.7 bn / - FiT Saturated wind market. Secondary opportunities
Finland €6 bn / - FiT 12-year fixed price FiT. Government focusing on wind
France €45.2 bn /€17.9 bn FiT/CfD 15/20-year PPAs with EDF indexed to inflation. Low subsidies
Germany €85.1 bn /€92.4 bn FiT 20-year fixed price FiTs. Highly competitive market
Ireland €9.7 bn / - FiT 15-year PPA with utilities. Subsidies are low. Focus on wind
Italy €28.6 bn /€14.3 bn FiT 20-year subsidy via FiT and GC schemes
Japan US$7.5 bn /US$100 bn FiT 10/20-year PPAs at fixed FiT prices. Subsidies are high
Mexico US$18 bn /US$15.2 bn PPA Recently reformed energy market. Focus on wind
Netherlands €6.5 bn /€1.3 bn FiT 15-year fixed price FiTs
Norway €8.4 bn / - GC Shared 15-year GC scheme with Sweden. Focus on hydro.
Peru US$3 bn /US$0.7 bn FiT/PPA Low penetration of renewables and supportive policy
Spain €83.3 bn /€14.9 bn FiT Enacted retroactive tariff cuts in 2010. Now more stable
Sweden €10.4 bn / - GC 15-year GC scheme. Lowest prices for wind in Europe
UK £23 bn /£20.3 bn GC/FiT 20-year GC/15-year competitive FiT. Inflation indexed
Uruguay US$3 bn /US$0.5 bn FiT/PPA Currently exceeding renewable energy targets
USA US$99.1 bn /US$41.5 bn PPA/REC 12-25-year PPAs/tax credits. 2nd biggest market after China
Source: BlackRock – Global Renewable Power Market Overview – May 2017. Definitions – GC: Green Certificate; FiT = Feed-in-Tariff; CfD = Contract for Difference; PPA = Power Purchase Agreement; - indicates data not available.
Renewable energy technology is contributing more and more to global power production. While this is positive from a technology (renewables are now cost competitive with more traditional means of power production) and environmental (reduced carbon emissions) perspective, we are in the midst of a structural shift in power markets.
We highlight below two of the key challenges to be overcome.
Policy instability – We won’t cover this in detail given the diversity of regimes and markets globally. However, government policy around the world has played, and continues to play, a significant role in supporting renewable energy projects. Hence, future policy changes or uncertainty has a material ability to influence the pipeline of projects available. This is a key risk facing the renewable energy market. However, offsetting this is the fact that policy settings are likely to remain supportive given the benefits of pursuing the technology. Further, most government driven renewable energy policies around the world have reached a level of maturity, which is providing the certainty and confidence required by investors.
Technology – The rapid advances in renewable energy technology are making it an increasingly attractive option for energy generation. However, a critical issue will be how electricity grids, which have been built on the basis of fairly constant fossil-fuel-based electricity supply, adapt to deal with intermittent renewable energy supply. While battery technology is also developing quickly, it isn't yet at the point where it can regulate supply at the scale required. Security of energy (i.e. supply when required) is also an important issue that will become increasingly prevalent as renewable energy technology delivers an increasing proportion of total electricity requirements.
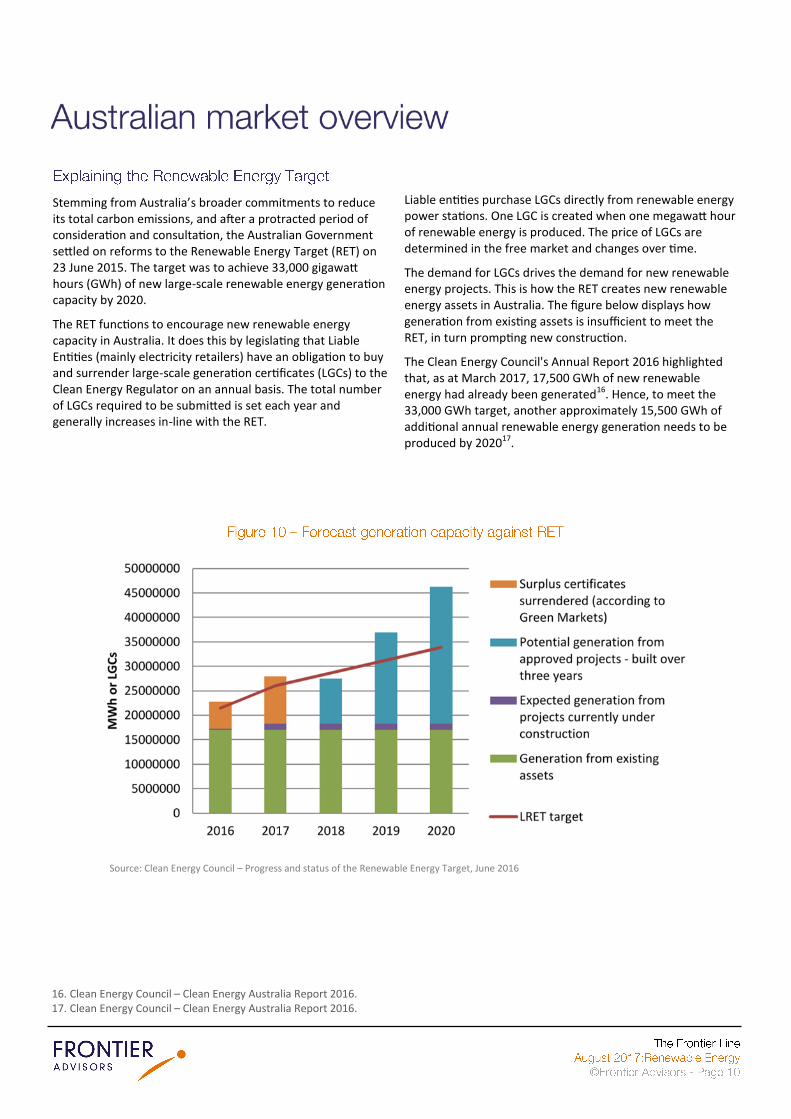
Stemming from Australia’s broader commitments to reduce its total carbon emissions, and after a protracted period of consideration and consultation, the Australian Government settled on reforms to the Renewable Energy Target (RET) on 23 June 2015. The target was to achieve 33,000 gigawatt hours (GWh) of new large-scale renewable energy generation capacity by 2020.
The RET functions to encourage new renewable energy capacity in Australia. It does this by legislating that Liable Entities (mainly electricity retailers) have an obligation to buy and surrender large-scale generation certificates (LGCs) to the Clean Energy Regulator on an annual basis. The total number of LGCs required to be submitted is set each year and generally increases in-line with the RET.
Liable entities purchase LGCs directly from renewable energy power stations. One LGC is created when one megawatt hour of renewable energy is produced. The price of LGCs are determined in the free market and changes over time.
The demand for LGCs drives the demand for new renewable energy projects. This is how the RET creates new renewable energy assets in Australia. The figure below displays how generation from existing assets is insufficient to meet the RET, in turn prompting new construction.
The Clean Energy Council's Annual Report 2016 highlighted that, as at March 2017, 17,500 GWh of new renewable energy had already been generated16. Hence, to meet the 33,000 GWh target, another approximately 15,500 GWh of additional annual renewable energy generation needs to be produced by 202017.
16. Clean Energy Council – Clean Energy Australia Report 2016. 17. Clean Energy Council – Clean Energy Australia Report 2016.
Source: Clean Energy Council – Progress and status of the Renewable Energy Target, June 2016
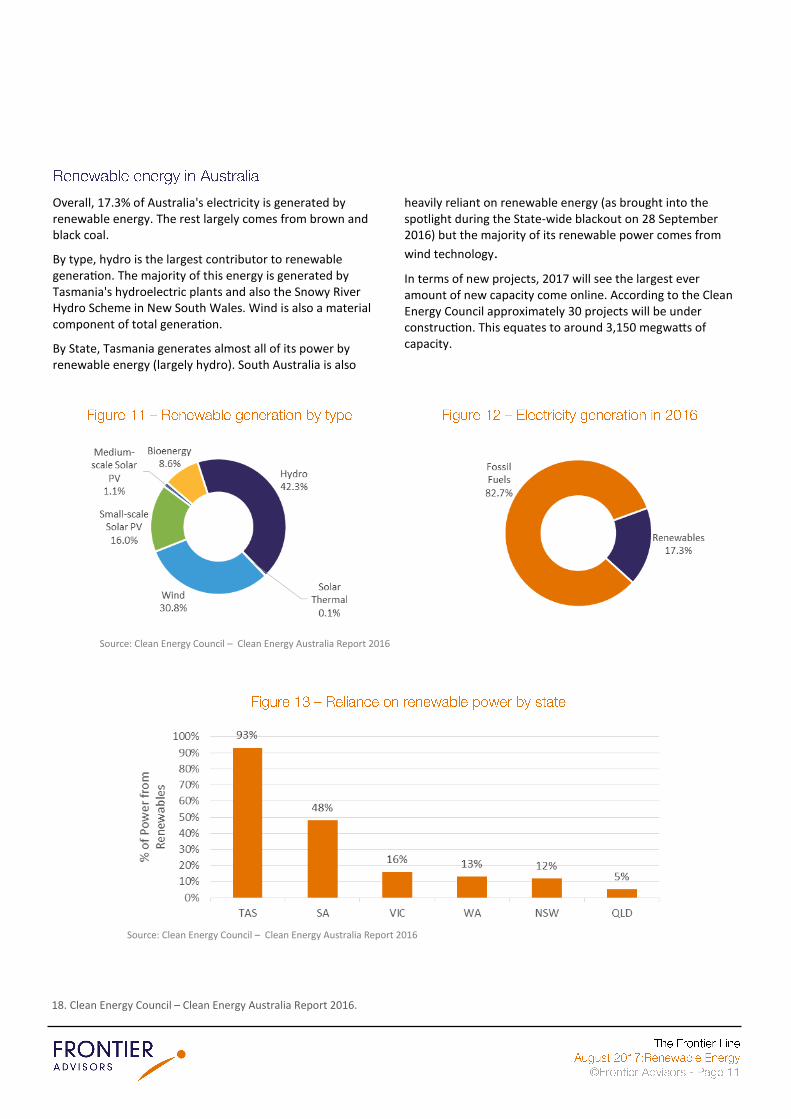
Overall, 17.3% of Australia's electricity is generated by renewable energy. The rest largely comes from brown and black coal.
By type, hydro is the largest contributor to renewable generation. The majority of this energy is generated by Tasmania's hydroelectric plants and also the Snowy River Hydro Scheme in New South Wales. Wind is also a material component of total generation.
By State, Tasmania generates almost all of its power by renewable energy (largely hydro). South Australia is also
heavily reliant on renewable energy (as brought into the spotlight during the State-wide blackout on 28 September 2016) but the majority of its renewable power comes from
wind technology.
In terms of new projects, 2017 will see the largest ever amount of new capacity come online. According to the Clean Energy Council approximately 30 projects will be under construction. This equates to around 3,150 megwatts of capacity.
18. Clean Energy Council – Clean Energy Australia Report 2016.
Source: Clean Energy Council – Clean Energy Australia Report 2016
Source: Clean Energy Council – Clean Energy Australia Report 2016
The RET expires in 2020 although LGCs produced under the scheme are valid until 2030. It is for this reason that Power Purchase Agreements (PPAs) offered to renewable energy power plants do not extend past 2030; it is unclear if the LGCs will have any value beyond this time. Post 2020, a new scheme will likely be required.
On 9 June 2017, the Finkel Review into the Future Security of the National Electricity Market was released. It made 50 different policy recommendations in response to Australia’s energy “trilemma”, being the long-term provision of reliable, affordable and low emitting electricity18.
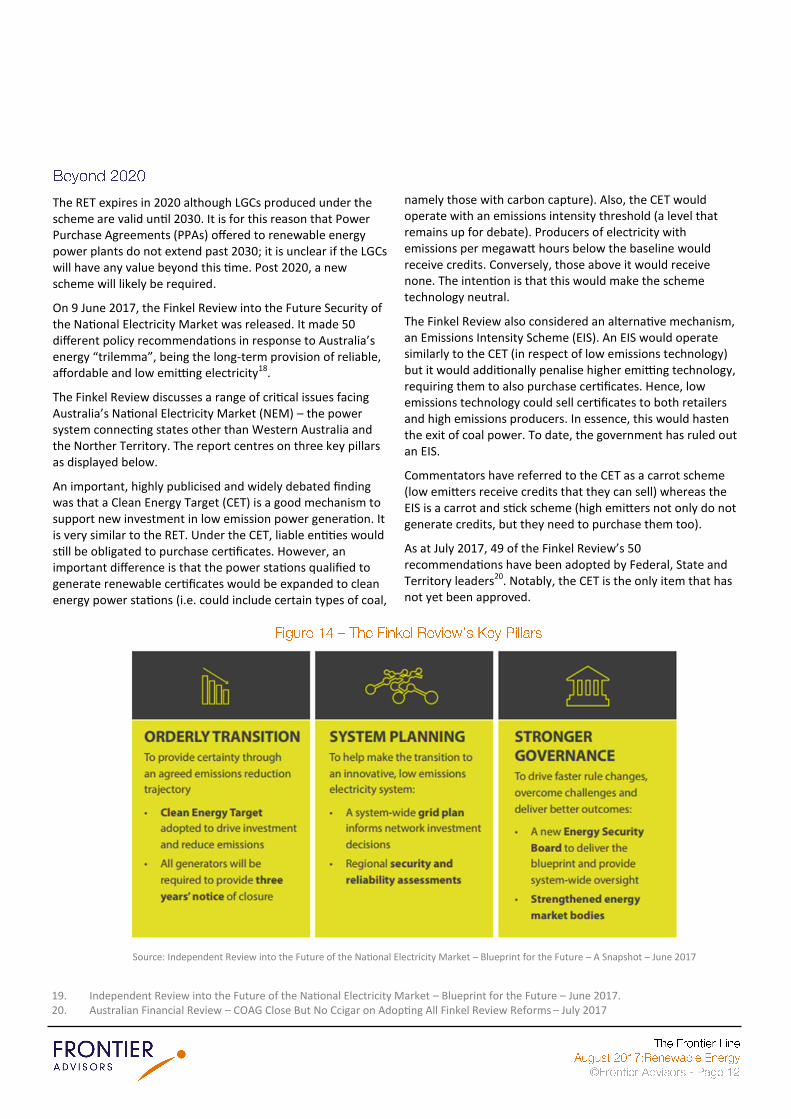
The Finkel Review discusses a range of critical issues facing Australia’s National Electricity Market (NEM) – the power system connecting states other than Western Australia and the Norther Territory. The report centres on three key pillars as displayed below.
An important, highly publicised and widely debated finding was that a Clean Energy Target (CET) is a good mechanism to support new investment in low emission power generation. It is very similar to the RET. Under the CET, liable entities would still be obligated to purchase certificates. However, an important difference is that the power stations qualified to generate renewable certificates would be expanded to clean energy power stations (i.e. could include certain types of coal,
namely those with carbon capture). Also, the CET would operate with an emissions intensity threshold (a level that remains up for debate). Producers of electricity with emissions per megawatt hours below the baseline would receive credits. Conversely, those above it would receive none. The intention is that this would make the scheme technology neutral.
The Finkel Review also considered an alternative mechanism, an Emissions Intensity Scheme (EIS). An EIS would operate similarly to the CET (in respect of low emissions technology) but it would additionally penalise higher emitting technology, requiring them to also purchase certificates. Hence, low emissions technology could sell certificates to both retailers and high emissions producers. In essence, this would hasten the exit of coal power. To date, the government has ruled out an EIS.
Commentators have referred to the CET as a carrot scheme (low emitters receive credits that they can sell) whereas the EIS is a carrot and stick scheme (high emitters not only do not generate credits, but they need to purchase them too).
As at July 2017, 49 of the Finkel Review’s 50 recommendations have been adopted by Federal, State and Territory leaders20. Notably, the CET is the only item that has not yet been approved.
19. Independent Review into the Future of the National Electricity Market – Blueprint for the Future – June 2017. 20. Australian Financial Review – COAG Close But No Ccigar on Adopting All Finkel Review Reforms – July 2017
Source: Independent Review into the Future of the National Electricity Market – Blueprint for the Future – A Snapshot – June 2017
The future of renewable energy technology in Australia faces similar challenges to those set out in the global market overview. This relates to grid resilience, energy security and price stability in the face of a greater contribution from renewable energy technology.
On the policy side, beyond the end of the RET in 2020, uncertainty remains as to the future of clean energy policy in Australia. There is disagreement amongst political parties on the best way forward. There are disparate approaches at both Federal and State levels and, finally, Australia does not yet
have a clear strategy in place to meet its broader target set at the Conference of Parties (COP21) in Paris in December 2015 to reduce emissions by 26-28% below 2005 levels by 2030 (note that the Finkel Review largely concerns the electricity sector, which accounts for 35% of total emissions in Australia21). This is obviously a very important issue and the Finkel Review encourages a coordinated and national approach to renewable energy policy. The clarity provided through future policy will be pivotal in maintaining and encouraging new investment in Australia.
21. Australian Government Department of the Environment and Energy – Quarterly Update of Australian’s National Greenhouse Gas Inventory: June 2016 – December 2016
Source: BlackRock, Palisade Investment Partners
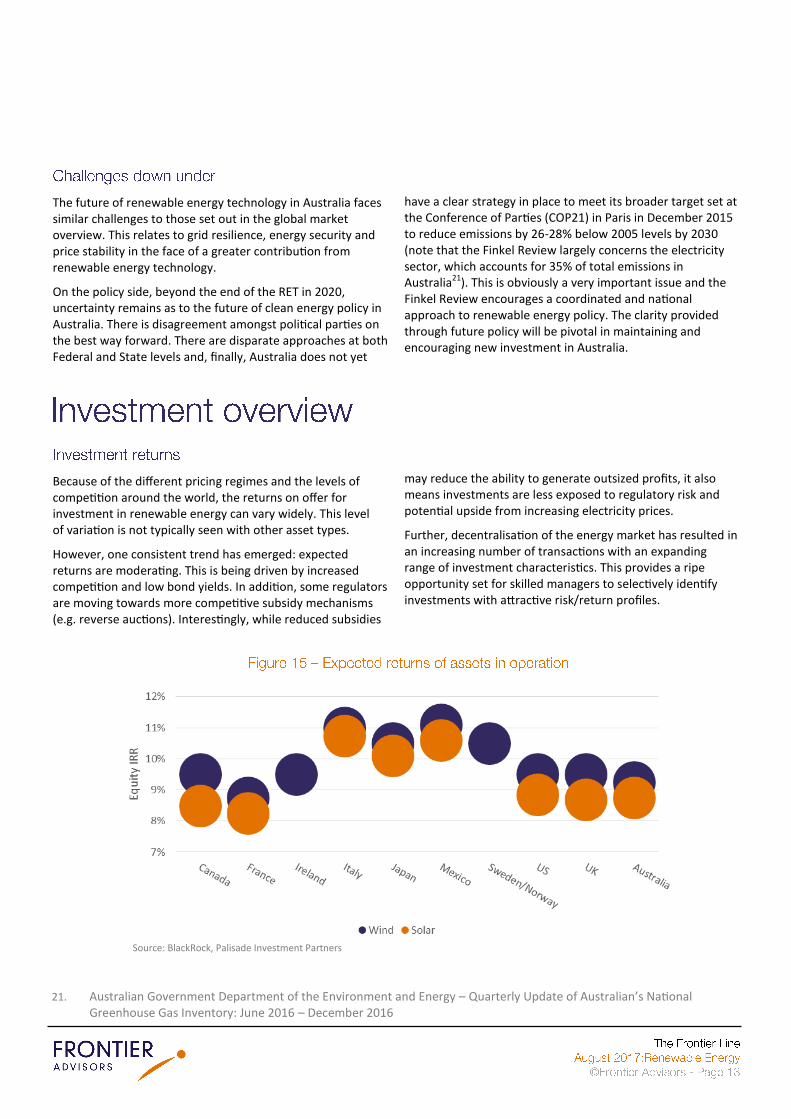
Because of the different pricing regimes and the levels of competition around the world, the returns on offer for investment in renewable energy can vary widely. This level of variation is not typically seen with other asset types.
However, one consistent trend has emerged: expected returns are moderating. This is being driven by increased competition and low bond yields. In addition, some regulators are moving towards more competitive subsidy mechanisms (e.g. reverse auctions). Interestingly, while reduced subsidies
may reduce the ability to generate outsized profits, it also means investments are less exposed to regulatory risk and potential upside from increasing electricity prices.
Further, decentralisation of the energy market has resulted in an increasing number of transactions with an expanding range of investment characteristics. This provides a ripe opportunity set for skilled managers to selectively identify investments with attractive risk/return profiles.

All investment entails risk. However, there are a number of risks specific to the renewables asset class.
Resource – With no ability to control the weather, renewables generators cannot guarantee resource quantity (wind in particular). Therefore, what renewables gain in terms of input cost certainty (the sun and wind are free), they give up in quantity variability. While resource forecasting and resource conversion efficiency continue to improve, quantity risk remains a key risk faced by investors.
Regulation – Despite marked cost reductions improving competitiveness, government subsidies continue to be vital for the subsistence of most renewable technologies in the near-term. While it is unlikely that transparent government regimes would renege on existing agreements, changes to renewables policies are not implausible and regulatory risk must be properly considered.
Market pricing – Greenfield projects in developed markets typically seek long-term PPA agreements which can extend up to 20 years. However, asset lifespans can reach up to 30 years. As highlighted in Figure 8, this mismatch means that investors can be made to bear merchant pricing risk. This can be negative if the rise of renewables reduces energy prices.
Technology – Renewables assets are often intentionally located in harsh climates with high resource availability. In addition, while renewables technologies are mature, they are
still developing and changing rapidly. These two conditions combined can result in technical issues (particularly at later stages of an asset’s lifecycle) which can be costly to resolve.
Operations and maintenance (O&M) – The limited number of O&M providers can prove challenging when an asset moves towards the end of its life, as limited competition reduces the negotiating position for owners. This issue may increase operational costs beyond what has been anticipated, reducing returns to investors.
Capital structuring – Renewables are often highly geared. While leverage is okay when cash flows are contracted, refinancing could prove problematic if revenues are no longer supported by a PPA or market liquidity dries up. Similarly, some jurisdictions (such as the US) incentivise investment with tax credits. Therefore, a reduction in the corporate tax rate can reduce the attractiveness of tax shields.
Construction – Relative to other infrastructure assets, solar and wind assets are often comparatively straightforward to construct. However, the permitting, approvals and development process can be binary and entails a high degree of risk.
Stakeholder engagement – As with many infrastructure projects, renewable technology interfaces with a wide variety of stakeholders (e.g. local communities, governments and the private sector). These relationships must be managed carefully and responsibly.

The rise of renewables will continue, with carbon-free generation set to capture an increasing share of the global energy mix. While a demonstrated track record of policy support around the world has nurtured the development of the industry so far, vast technological advances and broad cost efficiencies are resulting in an increasing number of renewable formats becoming competitive with fossil fuel power without subsidies.
From an investment perspective, renewables can be a good compliment to an existing portfolio. Renewables provide access to long-dated cash flows, inflation linkage and portfolio diversification. However, investment into the sector is not without risk. Further, returns are varied and falling in some markets. This emphasises the importance of highly active and experienced management. In particular, skilled underwriting is critical. On balance, renewables
investment can be appealing for long-term investors provided a considered approach is adopted.
Looking forward, a critical ingredient required for continued investment is certainty and stability. In the past, policy confusion created volatility in the asset class which deterred investors and slowed development. This is likely to be less important as renewable technology becomes less reliant on subsidies and is viable in its own right. Also, policy is becoming more mature and there is general recognition that clear, cohesive and consistent policy is paramount for investment.
For any further information on implementation of a renewables investment program, or on renewables more broadly, please contact Frontier’s Real Assets Team.
The long-term (and often inflation-linked) nature of cash flows offered by renewables are attractive to investors with long-dated liabilities. The ability to contract revenue with highly creditworthy counterparties, and the low correlation with other infrastructure assets, further solidifies their appeal. However, there are some important considerations investors must think of before committing to the asset class.
Once an asset enters operation there are limited levers available to enhance performance. Beyond cost efficiencies (achieved by rolling up assets and renegotiating O&M contracts) and capital structuring (renegotiating favourable debt terms), there are few options available to reposition an investment. The long-term nature of cash flows, combined with the variability of renewable resource availability and the volatility of energy prices, means the need for sound underwriting and experienced management cannot be understated.
Much like most infrastructure assets, renewables are typically large and difficult to relocate. An ill-positioned wind turbine or an unexpectedly revoked government subsidy could jeopardise an investment. Suitably skilled management with the requisite resources and local market knowledge to properly identify, assess and mitigate risk is paramount.
Diversification is highly beneficial. While regional expertise is important, a well-diversified global portfolio can limit key risk factor exposure (e.g. resources, regulators, counterparties and technologies). If the wind doesn’t blow in Lisbon, it may be howling in Houston. Adoption of a global investment approach should provide the best platform suited to meeting a strategy’s return objectives.
Several options are available for investors seeking renewables exposure. Some investors will prefer to access the sector through diversified infrastructure funds (which devote a portion of their portfolio to renewable energy investments). For others, a targeted allocation via a specialist renewables product may make sense.
While strategies vary by approach, sophistication and region, targeted net returns are typically in the order of 8% to 10% per annum. Management fees tend to range from 0.9% to 1.5% per annum on invested capital (although fees on commitments for closed-end funds are common) with a 10% to 20% performance fee above a hurdle rate of return.