Embed Size (px)
Citation preview
Understanding digital engagement in later life
May 2015
Katey Matthews and James Nazroo
University of Manchester
1
Summary
How does use of the internet vary among older people?
● For the English population aged 50 and over, large differences exist in the frequency of internet use by each of gender, age, wealth and region of England.
● The percentage of people using the internet frequently (at least once a week) shows a strong decrease with age. Over 90 per cent of men aged 50 to 54 use the internet frequently, but by age 80 only just over a third of men are frequent internet users.
● The proportion of women using the internet is lower. At age 50-54 81 per cent use the internet frequently and by age 80 this is the case for fewer than 14 per cent of women.
● The prevalence of frequent internet use drops to below half by age 75 for men and by age 70 for women.
● Over the ten year period of 2002/3 to 2012/13 there is an overall increase in frequent internet use for those aged 50 and over. However, frequent internet use increased at a greater rate for those who were younger than for those who were older, meaning that the gap in internet use between earlier and more recent age cohorts increased over time. Additionally, among older age cohorts (those aged 75 or older when first interviewed) the initial increase in internet use becomes a decline towards the end of the study period. These patterns are present for both men and women.
● The rate of internet use at a particular age is lower for earlier age cohorts than for more recent age cohorts. For example, at an average age of just below 72 the earliest cohort (aged 70-74) had a rate of frequent internet use of about 18 per cent, compared with a rate of about 33 per cent for the next cohort (aged 65 to 69 when first interviewed) and a rate of almost 50 per cent for the cohort that followed that (aged 60 to 64 when first interviewed).
● For the population overall, the richest fifth of the population (highest wealth quintile) were more likely to use the internet frequently, 87 per cent of men and 80 per cent of women used the internet frequently, compared with only half of men and two-fifths of women in the poorest fifth of the population.
● Frequently use of the internet is less common among those in lower wealth quintiles regardless of age group. For example, in the 75 to 79 age group less than a fifth of people in the poorest fifth frequently access the internet, compared with over half of people in the wealthiest fifth. These associations suggest that differences in internet behaviour occur not only as the result of age, but also as a result of social position.
● The North East of England has the lowest proportion of both men and women who use the internet daily (46 per cent of men and 38 per cent of women) and the highest proportion who never use the internet (34 per cent and 43 per cent, respectively). The highest rates of internet use are found in the East of England, London, the South East of England and the South West of England (each region over 60 per cent of men and over 50 per cent of women using the internet daily).
2
● As population density decreases there are increasing rates of both men and women using the internet frequently. This means that men and women in more rural locations are more likely to use the internet than men and women in cities.
● There is a strong relationship between internet use and indicators of area deprivation for those aged 50 and over. Just over half of men in the most deprived areas use the internet frequently, compared with over four-fifths of men in the least deprived areas. And less than half of women in the most deprived areas use the internet frequently, compared with around 70 per cent of women in the least deprived areas.
Where do older people use the internet and which devices do they use?
● Among those who use the internet almost everyone (regardless of frequency of use, age, gender and wealth) uses the internet at home. The next most frequent place of use is work, followed by using the internet while on the move and while at other people’s houses. Very few people use the internet in educational establishments (a little over 3 per cent of both men and women with little variation by age or wealth).
● Notably higher proportions of men than women access the internet on the move (27 per cent of men in total compared with 19 per cent of women). The use of internet on the move is also more common among wealthier quintiles: the percentage of women accessing the internet on the move is over twice as high in the wealthiest fifth compared with the poorest fifth of the population. There is also a large drop with increasing age in accessing the internet on the move for both men and women.
● Internet use at work is consistently higher among those in wealthier quintiles for both men and women. And, as would be expected, the proportion of people accessing the internet from places of work falls rapidly as age increases, reflecting workforce exit.
● Desktop computers are used to access the internet by 70 per cent of male and 60 per cent of female internet users aged 50 or older, and laptop computers are used at similar rates to the use of desktop computers (67 per cent of male and 68 per cent of female internet users).
● The use of other devices to access the internet is much less common, with only 30 per cent of men and 20 per cent of women in this age group using smartphones and only 16 per cent of men and 14 per cent of women using tablets.
● The use of laptops falls at a faster rate with age than the use of desktop computers for both men and women. By age 80 and over, the use of desktop computers for internet access is 8 per cent lower for men and 9 per cent lower for women than at age 50-54, while for laptops it is 23 per cent and 33 per cent lower for men and women respectively.
● Similarly, the use of tablet computers by age 80 is half the rate at age 50-54 among men, and almost two thirds lower among women. There is also a sharp decline with age in the proportions of men and women using smartphones for internet access. Almost half of all men aged 50-54 use smartphones to access the internet, but by age 70-74 this figure is less than 10 per cent and continues to decline thereafter. Over a third of women use smartphones at age 50-54, but only 5 per cent do so at age 70-74 and as for men, the proportion continues to decline thereafter.
3
What do older people use the internet for and does internet use compensate for lack of physical
access to services?
● Among those aged 50 and older the use of the internet is particularly common for activities such as: sending/receiving email, finding information about goods or services, searching for information for learning or research, shopping or buying goods and services, news or newspaper websites, and streaming or downloading live or on demand TV or radio. Sixty-five per cent of men and 54 per cent of women use the internet for one or more of these purposes.
● Men are generally more likely than women to use the internet for financial purposes across all ages – 38 per cent of men compared with 27 per cent of women aged 50 and older use the internet for this purpose.
● For both men and women, the percentage reporting using the internet for finances lessens with age. Just over half of men aged 50-54 use the internet to deal with finances, compared with 13 per cent of men aged 80 and over.
● Network and gaming activities is the only category of internet use that is consistently reported more among women than men. And this remains across ages until the 75-79 age group. Overall 27 per cent of women and 24 per cent of men use the internet for these purposes.
● All uses of the internet become less common with declining wealth. However the rate of drop varies by type of use. So, although networking and gaming becomes less commonly reported as wealth decreases, the difference between the highest and lowest quintiles, among both men and women, is much smaller than is observable among more popular activities, such as email and dealing with finances. About a third more men and women in the richest fifth of the population use the internet for networking and gaming, compared with the poorest fifth. While more than twice as many men and women in the richest fifth of the population use the internet for email and research, and for finances, compared with the poorest fifth.
● For both men and women aged 50 or older those with no difficulty in accessing services are more likely than those with difficulty to use the internet frequently (78 per cent with no difficulty compared with 65 per cent with difficulty for men and 70 per cent compared with 47 per cent for women). (Difficulty is defined as it being quite or very difficult to access at least one service from a predefined list of: bank or cash point, post office, corner shop, medium or large supermarket, shopping centre, general practitioner, chiropodist, dentist, optician and hospital.)
What is the relationship between internet use and wellbeing?
● The cross-sectional association between internet use and a range of wellbeing outcomes was examined, net of the influence of gender, age, wealth and self-rated health.
● More frequent internet use is significantly associated with lower levels of depression and higher quality of life, but internet use was not associated with satisfaction with life.
● More frequent internet use was also associated with higher levels of social and civic
4

engagement, but it was not associated with levels of social isolation.
● However, frequent internet use was associated with greater (rather than lower) feelings of loneliness.
5
Introduction
This report is focussed on examining factors that relate to older people’s use of digital
technologies. It concentrates on those aged 50 or older, and examines within this group how age,
gender, socioeconomic position and where people live influences: access to the internet,
frequency of internet use, where they use the internet, types of devices they use, and what they
use the internet for. It begins with a review of existing literature and then moves on to analyse
data from the English Longitudinal Study of Ageing (ELSA) (Steptoe et al. 2013).
Background
Differences between the younger and older population in rates of digital engagement are well
recognised (Dutton et al. 2009, Green and Rossal 2013, Wei 2012). Older people are less likely to
engage with digital technology than their younger counterparts, and their lower rate of
engagement has persisted over time, with a slow rate of progression towards equal rates of use.
Interventions designed to increase the rate of internet access and use within the older population
have been limited in their effectiveness, and are said to be hindered by a lack of detailed
knowledge of the characteristics of older digitally excluded people (Green and Rossal 2013).
In fact, the older population is a ‘diverse user group’ of digital technology (Morris et al. 2007, p.
55) and cannot be considered homogeneous (Hill et al. 2008). The patterning of factors related to
the use of digital technologies may be different for older people than those observed in the wider
population (Green and Rossal 2013) and it is possible that the characteristics of the older digitally
excluded will change over time. As people with more easily surmountable barriers engage with
internet technology, the remaining disengaged group will comprise those with barriers that are
persistent and difficult to overcome. Gaining a detailed knowledge of factors that currently relate
to the use of digital technologies therefore means focusing on recent research that concentrates
specifically on the older population.
This review summarises the key findings and recommendations from the body of literature
surrounding digital engagement in the older population. Inequalities between men and women
and across socioeconomic groups are of particular interest. Before progressing, there are two
points to note: first, the definition of older person differs throughout the literature. The spread of
age ranges observed varies with ‘50 and over’ on the lower end of the scale and ‘over 65’ on the
higher end of the scale. Approximately half of the papers cover age ranges that exactly coincide
with the 50 and over population. A second issue arising from the included studies is the manner in
which digital engagement is measured. In most cases – and particularly where survey data are
involved – the measure is a simple binary indicator of whether or not the respondent has ever
used the internet. In the majority of studies there is little consideration of how recently or
frequently the technology may have been used, nor for how long, nor for what purposes.
6

This review progresses in the next section with a summary of recent literature that examines
digital inequalities between older men and women. Following that, evidence for differences in
engagement across socioeconomic indicators is considered.
Gender inequalities
There is evidence to suggest that use of the internet is higher among older men than women.
From an analysis of data from the Understanding Society survey, covering individuals aged 55 and
over, Green and Rossal (2013) find that men are estimated to be 1.25 times more likely to use the
internet than women of this same age. Green and Rossal’s (2013) analysis is one of the few
available quantitative investigations into varying rates of internet use – other research that
considers gender differences uses qualitative methods that are small in scale and often with
samples potentially biased towards those predisposed to digital engagement.
A study by Morris et al. (2007) is one example of this qualitative research. In this study 120 people
from two distinct older populations were interviewed to ascertain their rate of internet use and
non-use. In the first Scotland-wide sample of people aged 50 and over, 57 per cent of men had
used the internet compared with 40 per cent of women; in the second sample from Derbyshire
covering ages 55 and above the figures were 35 per cent for men and 26 per cent for women.
These findings do correlate with those from Green and Rossal’s (2013) work in that usage rates for
men are higher than for their female counterparts. However, the two samples in Morris et al.’s
(2007) study differ with respect to location and age range, but also in the mode of internet access
considered. The Scottish sample was based on respondents who accessed the internet only
through a computer, whereas the Derbyshire group included internet use through any mode. This
focus on mode of internet use is a novel dimension to the study, but, because of the additional
differences in age and location, we cannot draw any strong inferences from these data on how
mode of access might influence internet usage.
Official statistics from the Quarterly Internet Survey (Office for National Statistics 2014) provide
an indication of longer term trends in internet use for older men and women. In this work older
men and women are categorized into age brackets of 55 to 64 years and 65 to 74 years. The data
show that in 2011 80.4 per cent of 55 to 64 year old men reported having used the internet
compared with 77.6 per cent of women of this age; however figures for the 65 to 74 age group
show a greater gender gap with 61.9 per cent for men and 52.7 per cent for women. This suggests
the gender difference may vary with age and be more pronounced among the oldest of this
population. Figures for 2014 show a similar pattern. In that year, in the 55 to 64 year old group
88.7 per cent of men reported ever having used the internet compared with 86.4 per cent of
women, but, as before, the difference between usage rates is higher in the 65 to 74 age band with
figures of 73.6 per cent for men and 67.7 per cent for women. So, while the proportion of those
aged 55 and over that used the internet has increased during this three year period, there is
evidence of an enduring gender difference in the oldest age group.
The patterns of internet use and gender differences discussed here clearly contrast with those
observed in the younger population. Usage rates for people aged less than 45 remained stable
between 2011 and 2014, at over 90per cent and with negligible difference between men and
women (Office for National Statistics 2014). Gender inequalities in internet use are seemingly
7
unique to the older population, but there is a scarcity of detailed and robust research that
investigates this in more depth.
The focus of the literature discussed thus far is on the rate of internet use. However Wei (2012)
asserts that it is the types of usage that matters most when examining potential divides; that is,
the extent to which the internet is used as a recreational activity versus access for information
services. It is possible that older people have a narrower range of goals and activities when online
than younger cohorts (Wei 2012), but there is limited evidence on what these differences in goals
and activities might be. There is, as Sourbati (2009, p. 1088) explains, only a `minor body of
qualitative studies into small samples' that considers this issue. Morris et al. (2007) is an example
of one; they conclude that women aged 50 and over prefer to use the internet to communicate
with friends and family, whereas men are more likely to use it for information and research
purposes. In their study men also had a greater incidence of online shopping and banking than
women. However, they have little to say about age differences.
Socioeconomic inequalities
Internet use in the wider population varies across people from different socioeconomic groups
(Hill et al. 2008, Dutton et al. 2009). However, as is the case with gender, there is limited published
research that examines differences in the use of digital technologies across socioeconomic groups
among older adults. The research that is available includes a range of indicators of socioeconomic
group, such as income, poverty level, education status, or occupational class, and that is
summarised here.
Green and Rossal (2013) find that low income is correlated with low levels of internet use among
people aged over 55. This is consistent with the relationship between income and internet use
observed in the wider population aged 14 and over, where people with lower income have also
been found to be less likely to report using the internet (Dutton et al. 2009). However the income
effect may be greater within the 55 and over population. People of this age and in the highest
income category are over five times more likely to use the internet than those in the lowest
income group (Green and Rossal 2013), but in the 14 and over population this ratio is estimated as
only twice as high (Dutton et al. 2009).
In addition to income, Green and Rossal (2013) refer to a possible relationship between pensioner
poverty and internet use. They consider internet use for various regions within England and Wales
and suggest that areas with high rates of pensioner poverty might have a higher proportion of
people who have never used the internet. The authors stress, however, that this is a tentative
finding due to considerable uncertainty in the survey data used in their analysis, and there is no
available alternative research to support this finding. Nevertheless, Green and Rossal (2013)
advocate geographical variation in digital inequalities as a topic for further research.
Possible relationships between each of education and occupational class and digital inequalities in
the older population are referred to in the literature, but this literature provides limited evidence.
The evidence for education level is conflicting. Results from some sources indicate that
educational attainment does relate to internet use (Friemel 2014, Helsper and Eynon 2010, Selwyn
2004), but Green and Rossal (2013) find no evidence of this relationship and assert its significance
8

has been overstated in other studies. Occupational class is referenced only briefly in the literature
(although this is not unusual in research with older people), with older people in professional and
non-manual classes reported to have a higher rate of internet use in one recent study (Friemel
2014).
9
Methods
Data and sample
The data used in this analysis are taken from the English Longitudinal Study of Ageing (ELSA),
which is a multidisciplinary, nationally representative, that collects detailed information on the
health, economic and social circumstances of people aged 50 and over. The first wave was
collected in 2002-3 and participants have been interviewed biennially thereafter, allowing a
longitudinal examination of changes in their circumstances over time. The multidisciplinary and
longitudinal nature of ELSA makes it a unique and powerful source of data for the study of
individual circumstances in later life.
At wave 6 of ELSA, collected between 2012 and 2013, detailed questions were asked of all
respondents (10,372 individuals aged 50 and over) on internet use covering: frequency of use,
location of use, devices the internet is accessed from and reasons for use. This allows a detailed
mapping of who uses the internet, with what frequency, how it is used and what it is used for.
Simple descriptive statistics are used to show the relationships between individual characteristics
and internet use, and multivariate analyses are used to show the cross-sectional association
between internet use and wellbeing.
Throughout the duration of ELSA (six data collections covering the period 2002/3 to 2012/14))
basic information was collected on whether or not individuals used the internet. This allowed for
an examination of changing levels of internet use for individuals and how that relates to their
characteristics. This analysis is based on responses from participants who were interviewed at
wave 1 of ELSA and who responded to the study at least once, which gives 40,534 observations
from 10,886 participants. Multilevel growth models were used to analyse these longitudinal data,
which shows the average prevalence of internet use at the starting point (wave 1 of ELSA) and
how this changes over time, and how both starting points and changes over time vary according to
people’s characteristics.
Measures
Internet use
Waves 1 to 5 of ELSA ask respondents whether or not they participate in a list of activities
including whether or not they use the internet and/or email (among other items such as, taking
outings, holidays and reading newspapers). Potential responses are binary. At wave 6, participants
are asked a more detailed set of questions regarding internet use. Rather than a binary variable
covering any internet use, respondents are asked how frequently they use the internet, with the
possible responses ‘every day or almost every day’, ‘at least once a week (but not every day)’, ‘at
least once a month (but not every week)’, ‘at least once every three months’, ‘less than every
three months’ and ‘never’. Frequency tables of internet use at waves 1-5 show a similar number of
people consider themselves users of the internet as those who at wave 6 who state they use the
internet once a week or more. So, when combing the wave 6 data with the waves 1-5 data for the
10

purpose of the longitudinal analyses we include as ‘internet users’ those who used the internet
once a week or more (the top two categories of response to the wave 6 frequency question).
For some of the cross-sectional analyses using wave 6 data in this report a four-category version of
the wave 6 frequency of internet use variable is used. Here, respondents are broken down into
those who use the internet every day or almost every day, between once a week and once a
month, once a month or less, or never.
Location of internet use
At wave 6, respondents are also asked to provide details of the locations at which they had used
the internet over the past three months. Possible response categories are: ‘at home’, ‘at places of
work (other than home)’, ‘at a place of education’, ‘at another person’s home’, ‘on the move’ and
‘other place (such as the library or an internet cafe)’. Respondents could list more than one
location of use.
Devices used to access the internet
The wave 6 data also ask participants to list which devices they used to access the internet from
the categories: ‘desktop computer’, ‘laptop computer’, ‘tablet computer (e.g. iPad, Samsung
Galaxy Tab)’, ‘smartphone (e.g. iPhone, Blackberry)’, ‘TV (games console or set top box)’, ‘other
mobile devices’, ‘don’t know’ and ‘do not access the internet’. Again, respondents could list as
many relevant answers as applied.
Activities the internet is used for
The final question relating to internet use asked at wave 6 focussed on reasons for using the
internet within the last three months. The original variable consisted of a possible thirteen
internet uses, of which respondents could list all of relevance. There was also an option for
respondents to state they use the internet for none of the listed activities. The thirteen
activitieswere: ‘sending/receiving emails’, ‘finding information about goods and services’,
‘searching for information for learning, research or fact finding’, ‘finances (banking, paying bills)’,
‘shopping or buying goods or services’, ‘selling goods or services over the internet, e.g. via
auctions’, ‘social networking sites (Facebook, Twitter, Myspace)’, ‘creating, uploading or sharing
content (YouTube, blogging or Flickr)’, ‘news, newspaper or blog websites’, ‘streaming or
downloading live or on demand TV, radio (BBC iplayer, 4OD, ITV player, Demand 5), music (iTunes,
Spotify) or ebooks’, ‘games’, ‘looking for a job or sending a job application’ and ‘other’.
Prior to running the analyses presented within this report, a principal components analysis (PCA)
model was used to reduce the thirteen items of reasons for internet use into a smaller set of
meaningful categories. However, this analysis did not successfully identify categories of use.
Rather it identified a group of frequent internet users who were likely to participate in almost all
activities, with other identified groups not being particularly meaningful in terms of types of older
internet users. As an alternative, frequencies of internet use for each activity were examined by
sex, age and wealth, and five distinct categories of typical internet use were subsequently
identified:
● Frequently observed activities (sending/receiving email, finding information about goods
or services, searching for information for learning or research, shopping or buying goods
11
and services, news or newspaper websites and streaming or downloading live or on
demand TV or radio);
● Finances (banking or paying bills);
● Networking (social networking sites such as Facebook or Twitter and playing games);
● Jobs (looking for jobs or sending job applications);
● Other (less frequently observed activities, including selling goods or services, creating or
uploading content and activities contained within the original ‘other activity’ item).
Demographic and socio-economic measures
The forthcoming analyses use a range of measures in order to differentiate the characteristics of
internet users aged 50 and over. These measures are outlined in the paragraphs below.
Gender: All descriptive analyses are run for men and women separately.
Age cohort: Age is separated into five-year age groups for both the cross-sectional and
longitudinal analyses. Cross-sectional analyses, using wave 6 data, show information on aspects of
internet use by age group (50-54, 55-59, 60-64, 65-69, 70-74, 75-80 and 80 and over). The
longitudinal analyses examine change in internet use over the data collection period by age cohort
group defined as age group at wave 1.
Wealth: Wealth quintiles are used to define individuals’ total household wealth excluding pension
wealth (because pension wealth correlates linearly with age). The wealth variable includes the net
financial and physical wealth and the net housing wealth for each household.
Location: Three variables are used to examine trends in internet use on the basis of location. The
first is Government Office Region (GOR). GORs were first established in England in 1994. Wave 6 of
ELSA divides the population into nine regions of England: North East, North West, Yorkshire and
the Humber, East Midlands, West Midlands, East of England, London, South East and South West.
ELSA also lists respondents who live outside of England by region, but as these numbers were very
low (n=35), these respondents were recoded as missing and are therefore be excluded from the
tables showing internet use by GOR.
The second measure of location is the Department of the Environment, Food and Rural Affairs
(DEFRA) identifier of whether the respondent lives in an urban or rural area. The variable has four
categories: urban (an area with a population greater than 10,000), town and fringe, village, and
hamlet or isolated dwelling.
Finally, location is measured in terms of quintiles of the 2004 Index of Multiple Deprivation (IMD),
which is a measure of deprivation at the small area level created by the Department for
Communities and Local Government. There are seven domains of deprivation used to capture the
level of deprivation within each area, and these are income deprivation, employment deprivation,
health deprivation and disability, education, skills and training deprivation, barriers to housing and
services, crime and living environment deprivation.
Access to services: The report considers the relationship between internet use and respondents’
physical access to services. Access to services is measured using a variable that asked respondents
whether they find it very easy, quite easy, quite difficult or very difficult to access a range of
12
services. They were also offered the option of responding that they are unable to go, or do not
wish to go. The list covers ten services: a bank or cash point, post office, corner shop, medium or
large supermarket, shopping centre, general practitioner, chiropodist, dentist, optician and
hospital. The analysis concerning access to services presented in this report uses a binary variable
that identifies whether the respondent had at least one difficulty in accessing a service, or
whether they had no difficulty accessing any of the services. A cut-off of one difficulty was used as
the number of people experiencing more than one was reasonably low (n=928) and crosstabs of
internet use by this variable often showed cells with very low frequencies.
Wellbeing measures: The final set of analyses considered the association between internet use
and wellbeing. Here, wellbeing was assessed using a range of measures described next.
Depression: Depression was measured using an eight-item version of the CES-D scale, comprised
of questions asking respondents whether, over the last week, they have suffered feelings of
depression, loneliness and sadness, whether they have suffered restless sleep or feelings of
everything being effortful, whether they struggled to ‘get going’ and whether or not they have
often felt happy and enjoyed life. A lower score is indicative of lower levels of depression, and
potential scores range from zero to eight.
Quality of life: Quality of life was measured using the Control, Autonomy, Self-realisation and
Pleasure (CASP) scale, which is specifically designed to measure life quality among older
populations (Hyde et al. 2003). The models in this report use a 15-item version of CASP in place of
the usual 19-item version (Vanhoutte et al. 2012) and covers aspects such as feelings of control,
pleasure, enjoyment, meaning, sociability, happiness, opportunity and satisfaction. Respondents
were asked how often these feelings are experienced (e.g. ‘I look back on my life with a sense of
happiness’) and are offered the response options of often, sometimes, not often and never.
Subsequently, a continuous scale is constructed, with a possible range of 0 (poorest quality of life)
to 45 (highest quality of life).
Satisfaction with life: Satisfaction with life was measured using the Diener (1984) scale that asks
the respondent to rate how satisfied they are with five aspects of their life: how ideal their life has
been, the conditions of their life, whether or not important goals have been attained, whether
they would change anything about the way in which their life has been lived and how satisfied
they are with their life overall. Again, respondents were offered a range of response options:
strongly agree, agree, slightly agree, neither agree nor disagree, slightly disagree, disagree and
strongly disagree. A continuous scale is derived from these variables, with a potential range of 1
(highest life satisfaction) to 35 (lowest life satisfaction).
Social isolation: Social isolation was measured using a four-item measure that asks the respondent
about lack of companionship, feeling left out, feeling isolated and feeling out of tune with others
around them.
Loneliness: Loneliness was measured using a binary version of a question that asked the
respondent how often they feel lonely. Participants were considered to not experience loneliness
if they respond to the original question with the response never or hardly ever, and are
considered to experience loneliness if they answer either some of the time, or often.
13

Social and civic engagement: Social and civic engagement was measured using a continuous
variable comprised of whether or not the respondent answered positively to eight questions
regarding their involvement in various social and civic organisations, including political parties,
resident groups, religious groups, charitable organisations, education or evening classes, social
clubs, sport and exercise clubs and ‘other’ organisations, clubs or societies. A score of 0 reflects
non-participation in any of the listed organisations, and a score of 8 reflects participation in them
all.
Self-rated health: Although not used as an outcome itself, the models in the wellbeing analysis
control for a person’s self-rated health (given the correlation between health and both wellbeing
and internet use). Here, self-rated health is measured using a Likert-scale question asking how the
individual rates their overall general health. The five categories of excellent, very good, good, fair
and poor are offered as responses. In the models, a lower score indicates better self-rated health.
Statistical analysis
Sections 1 to 5 of the results chapter of the report display basic cross-tabs of internet behaviours
and other variables of interest using wave 6 of the ELSA data (2012-2013). Results are always
broken down by gender, and all tables are weighted using the wave 6 cross-sectional weight.
Section 6 of the results chapter takes advantage of the longitudinal nature of the ELSA data in
order to examine trajectories of internet use over time by age cohort. Waves 1 to 6 of ELSA (2002
to 2012-2013) are used to observe patterns of frequent internet use over time by age cohort at
wave 1 (2002). Multilevel growth curve models are run in order to observe the level of internet
use at wave 1 and the subsequent rate of change in internet use across cohorts at equivalent ages
at different points in time, dependent on the respondent’s age cohort at wave 1. Models also
demonstrate whether these trajectories vary on the basis of gender and wealth.
Section 7 of the report uses linear and logistic regression models to examine associations between
frequency of internet use and reasons for internet use, and six different aspects of mental and
social wellbeing. The models for each wellbeing outcome contain relevant control variables that
potentially explain the relationship between internet and wellbeing: gender, age, wealth and
self-rated health. Linear regression models are used to examine the association between internet
use and wellbeing for the five outcomes using continuous scales (depression, quality of life, life
satisfaction, social isolation and social and civic engagement), and a logistic regression model is
used to examine the association between internet use and loneliness, which is measured using a
binary variable. The wave 6 cross-sectional weight is applied to these analyses.
14

Results
1. Variations in internet use among people aged 50 and over by gender, age and socioeconomic
position
Frequency of internet use
Tables 1 and 2 show the frequency of internet use by gender, age and wealth, weighted by the
wave 6 cross-sectional weight. Here, frequent users are denoted as those who state they use the
internet either once a day or almost once a day, or at least once a week. Non-frequent users are
denoted as those who use the internet around once a month or less, or never. Non-frequent users
are combined into the same category as those who never use the internet as the numbers of
people using the internet less frequently were low, especially when broken down by age group
and wealth quintile.
Base: all wave 6 ELSA respondents
Table 1. Frequency of internet use by gender and age at wave 6 (per cent) 50-54 55-59 60-64 65-69 70-74 75-79 80+ All Men At least once a week
91.0 85.9 79.9 71.9 55.4 43.7 34.7 71.2
Once a month or less/never
9.1 14.1 20.1 28.1 44.6 56.3 65.3 28.8
Women At least once a week
80.7 80.5 72.9 61.2 48.6 29.8 13.9 59.7
Once a month or less/never
19.3 19.5 27.1 38.8 51.4 70.2 86.1 40.3
N (unweighted) Men 266 620 790 783 556 462 397 3874 Women 451 873 939 862 632 561 482 4800
Tables 1 and 2 show that in 2012-13, notable differences exist in the frequency of internet use by
each of gender, age and wealth. Across all age and wealth groups, over seven in ten men use the
internet frequently, compared with less than six in ten women. The percentage of people using
the internet frequently shows a strong declining gradient with age. Over 90 per cent of men aged
50 to 54 use the internet frequently, but by age 80 only just over a third of men are frequent
internet users. The proportion of women using the internet by age 80 is even lower at just under
14 per cent, less than half the proportion of men of the same age using the internet. By age 75 for
men, and by age 70 for women, less than half of the older population are using the internet
frequently.
Base: all wave 6 ELSA respondents
15
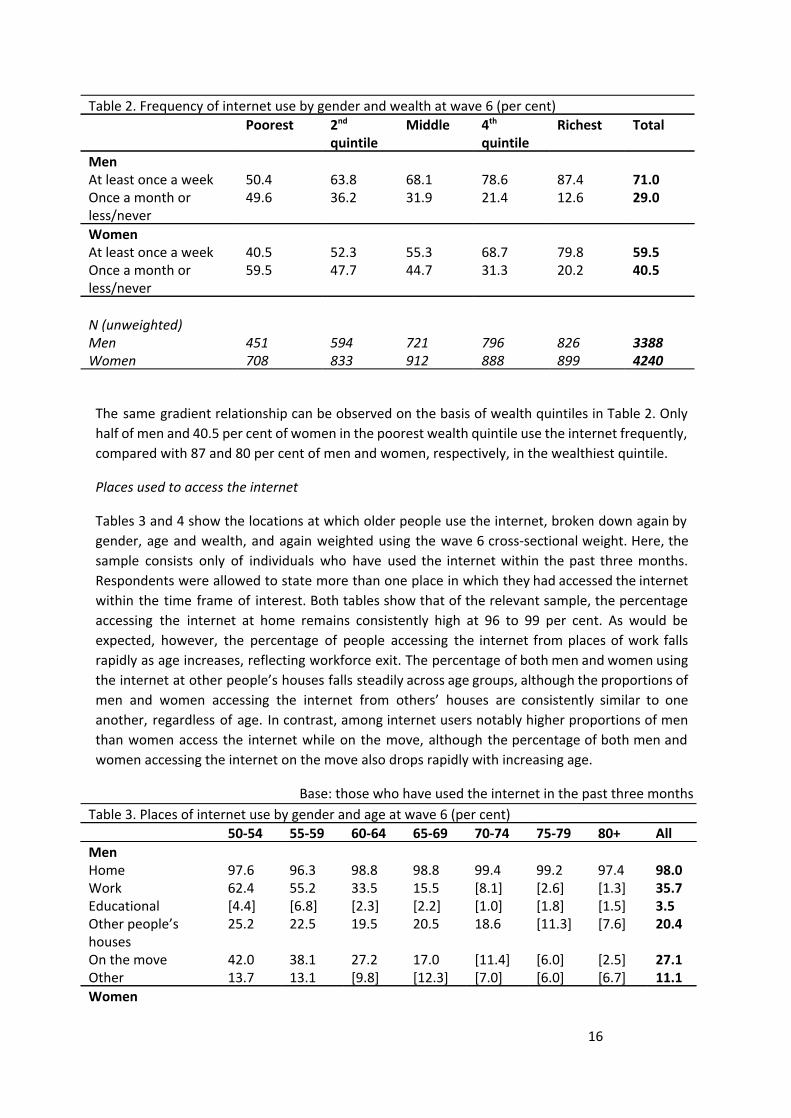
Table 2. Frequency of internet use by gender and wealth at wave 6 (per cent) Poorest 2nd
quintile Middle 4th
quintile Richest Total
Men At least once a week 50.4 63.8 68.1 78.6 87.4 71.0 Once a month or less/never
49.6 36.2 31.9 21.4 12.6 29.0
Women At least once a week 40.5 52.3 55.3 68.7 79.8 59.5 Once a month or less/never
59.5 47.7 44.7 31.3 20.2 40.5
N (unweighted) Men 451 594 721 796 826 3388 Women 708 833 912 888 899 4240
The same gradient relationship can be observed on the basis of wealth quintiles in Table 2. Only
half of men and 40.5 per cent of women in the poorest wealth quintile use the internet frequently,
compared with 87 and 80 per cent of men and women, respectively, in the wealthiest quintile.
Places used to access the internet
Tables 3 and 4 show the locations at which older people use the internet, broken down again by
gender, age and wealth, and again weighted using the wave 6 cross-sectional weight. Here, the
sample consists only of individuals who have used the internet within the past three months.
Respondents were allowed to state more than one place in which they had accessed the internet
within the time frame of interest. Both tables show that of the relevant sample, the percentage
accessing the internet at home remains consistently high at 96 to 99 per cent. As would be
expected, however, the percentage of people accessing the internet from places of work falls
rapidly as age increases, reflecting workforce exit. The percentage of both men and women using
the internet at other people’s houses falls steadily across age groups, although the proportions of
men and women accessing the internet from others’ houses are consistently similar to one
another, regardless of age. In contrast, among internet users notably higher proportions of men
than women access the internet while on the move, although the percentage of both men and
women accessing the internet on the move also drops rapidly with increasing age.
Base: those who have used the internet in the past three months
Table 3. Places of internet use by gender and age at wave 6 (per cent) 50-54 55-59 60-64 65-69 70-74 75-79 80+ All Men Home 97.6 96.3 98.8 98.8 99.4 99.2 97.4 98.0 Work 62.4 55.2 33.5 15.5 [8.1] [2.6] [1.3] 35.7 Educational [4.4] [6.8] [2.3] [2.2] [1.0] [1.8] [1.5] 3.5 Other people’s houses
25.2 22.5 19.5 20.5 18.6 [11.3] [7.6] 20.4
On the move 42.0 38.1 27.2 17.0 [11.4] [6.0] [2.5] 27.1 Other 13.7 13.1 [9.8] [12.3] [7.0] [6.0] [6.7] 11.1 Women
16

Home 97.1 98.4 98.3 98.4 98.3 98.6 97.8 98.1 Work 60.1 51.4 25.9 [7.8] [3.3] [1.2] [0.0] 31.6 Educational [3.2] [4.8] [2.3] [1.4] [4.3] [0.8] [3.1] 3.1 Other people’s houses
25.1 21.4 21.4 16.7 13.6 [11.2] [6.2] 19.6
On the move 30.7 26.7 18.8 10.6 [5.0] [2.3] [1.5] 19.0 [Other] [7.1] [6.5] [6.9] [3.9] [5.4] [5.7] [3.0] 6.0 Unweighted N Men 240 552 678 616 342 237 157 2822 Women 400 767 749 606 356 213 87 3178
Strong associations appear to exist between places of internet access and wealth. While a
consistently high proportion of people aged 50 and over access the internet from home across all
wealth quintiles, internet use at work is consistently higher among those in wealthier quintiles for
both men and women. Accessing the internet from someone else’s house is more common among
internet users in wealthier quintiles, as is accessing the internet while on the move. The
percentage of women accessing the internet on the move is over twice as high in the wealthiest
quintile (25.5 per cent) than the poorest quintile (11.7 per cent). Men are consistently more likely
to access the internet while on the move than women, but there is also a strong gradient by
increasing wealth quintile.
Base: those who have used the internet in the past three months
Table 4. Places of internet use by gender and wealth at wave 6 (per cent) Poorest 2nd quintile Middle 4th quintile Richest Total Men Home 95.8 96.1 98.8 98.0 99.4 98.0 Work 31.7 35.8 34.6 34.2 38.4 35.4 Educational [4.9] [3.5] [2.8] [3.0] [4.0] 3.6 Other people’s houses
[18.3] 16.8 14.6 19.5 28.8 20.4
On the move [22.5] 21.9 22.1 24.4 38.4 27.1 Other [10.6] [5.4] [8.1] [11.2] [17.8] 11.3 Women Home 98.1 95.3 98.5 98.2 99.5 98.1 Work 20.0 35.5 30.3 35.3 31.8 31.4 Educational [1.2] [2.7] [3.1] [3.9] [3.1] 2.9 Other people’s houses
13.8 15.2 18.7 21.8 24.1 19.5
On the move [11.7] 16.5 15.2 19.9 25.5 18.7 Other [7.0] [4.4] [4.1] [5.8] [8.2] 6.0 Unweighted N
Men 216 362 493 368 734 2443 Women 297 471 536 653 746 2703
17
Devices used to access the internet
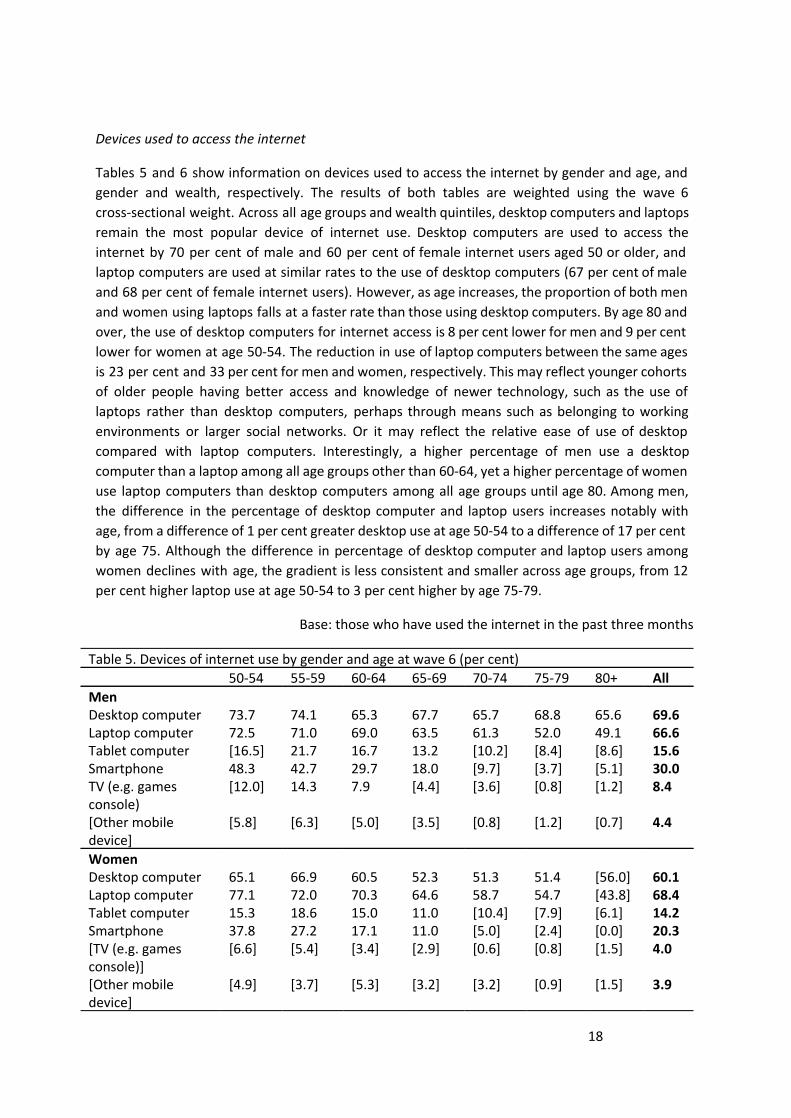
Tables 5 and 6 show information on devices used to access the internet by gender and age, and
gender and wealth, respectively. The results of both tables are weighted using the wave 6
cross-sectional weight. Across all age groups and wealth quintiles, desktop computers and laptops
remain the most popular device of internet use. Desktop computers are used to access the
internet by 70 per cent of male and 60 per cent of female internet users aged 50 or older, and
laptop computers are used at similar rates to the use of desktop computers (67 per cent of male
and 68 per cent of female internet users). However, as age increases, the proportion of both men
and women using laptops falls at a faster rate than those using desktop computers. By age 80 and
over, the use of desktop computers for internet access is 8 per cent lower for men and 9 per cent
lower for women at age 50-54. The reduction in use of laptop computers between the same ages
is 23 per cent and 33 per cent for men and women, respectively. This may reflect younger cohorts
of older people having better access and knowledge of newer technology, such as the use of
laptops rather than desktop computers, perhaps through means such as belonging to working
environments or larger social networks. Or it may reflect the relative ease of use of desktop
compared with laptop computers. Interestingly, a higher percentage of men use a desktop
computer than a laptop among all age groups other than 60-64, yet a higher percentage of women
use laptop computers than desktop computers among all age groups until age 80. Among men,
the difference in the percentage of desktop computer and laptop users increases notably with
age, from a difference of 1 per cent greater desktop use at age 50-54 to a difference of 17 per cent
by age 75. Although the difference in percentage of desktop computer and laptop users among
women declines with age, the gradient is less consistent and smaller across age groups, from 12
per cent higher laptop use at age 50-54 to 3 per cent higher by age 75-79.
Base: those who have used the internet in the past three months
Table 5. Devices of internet use by gender and age at wave 6 (per cent) 50-54 55-59 60-64 65-69 70-74 75-79 80+ All Men Desktop computer 73.7 74.1 65.3 67.7 65.7 68.8 65.6 69.6 Laptop computer 72.5 71.0 69.0 63.5 61.3 52.0 49.1 66.6 Tablet computer [16.5] 21.7 16.7 13.2 [10.2] [8.4] [8.6] 15.6 Smartphone 48.3 42.7 29.7 18.0 [9.7] [3.7] [5.1] 30.0 TV (e.g. games console)
[12.0] 14.3 7.9 [4.4] [3.6] [0.8] [1.2] 8.4
[Other mobile device]
[5.8] [6.3] [5.0] [3.5] [0.8] [1.2] [0.7] 4.4
Women Desktop computer 65.1 66.9 60.5 52.3 51.3 51.4 [56.0] 60.1 Laptop computer 77.1 72.0 70.3 64.6 58.7 54.7 [43.8] 68.4 Tablet computer 15.3 18.6 15.0 11.0 [10.4] [7.9] [6.1] 14.2 Smartphone 37.8 27.2 17.1 11.0 [5.0] [2.4] [0.0] 20.3 [TV (e.g. games console)]
[6.6] [5.4] [3.4] [2.9] [0.6] [0.8] [1.5] 4.0
[Other mobile device]
[4.9] [3.7] [5.3] [3.2] [3.2] [0.9] [1.5] 3.9
18
Unweighted N Men 240 552 677 615 340 236 157 2817 Women 400 766 751 606 357 211 86 3177
The use of tablet computers by age 80 and over the use of is half of that at age 50-54 among men,
and almost two thirds lower among women. There is also a sharp decline with age in the
proportions of men and women using smartphones for internet access. Almost half of men aged
50-54 use smartphones to access the internet, but by age 70-74 this figure is less than 10 per cent
and it continues to decline thereafter. Over a third of women use smartphones at age 50-54, but
only 5 per cent do so at age 70-74 and, as for men, the proportion continues to decline thereafter.
Again, this may reflect greater access to sources of knowledge about such technology for younger
people, such as the workplace and larger social networks. Or the usability of such technologies for
older people.
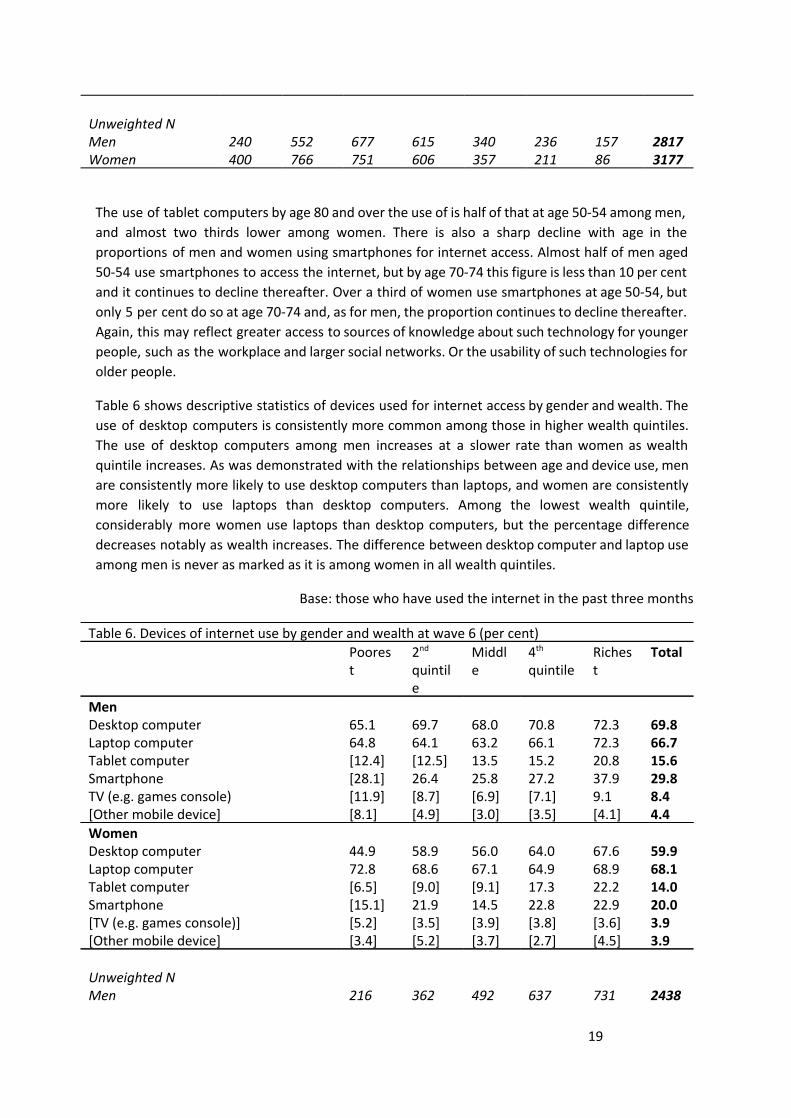
Table 6 shows descriptive statistics of devices used for internet access by gender and wealth. The
use of desktop computers is consistently more common among those in higher wealth quintiles.
The use of desktop computers among men increases at a slower rate than women as wealth
quintile increases. As was demonstrated with the relationships between age and device use, men
are consistently more likely to use desktop computers than laptops, and women are consistently
more likely to use laptops than desktop computers. Among the lowest wealth quintile,
considerably more women use laptops than desktop computers, but the percentage difference
decreases notably as wealth increases. The difference between desktop computer and laptop use
among men is never as marked as it is among women in all wealth quintiles.
Base: those who have used the internet in the past three months
Table 6. Devices of internet use by gender and wealth at wave 6 (per cent) Poores
t 2nd quintile
Middle
4th quintile
Richest
Total
Men Desktop computer 65.1 69.7 68.0 70.8 72.3 69.8 Laptop computer 64.8 64.1 63.2 66.1 72.3 66.7 Tablet computer [12.4] [12.5] 13.5 15.2 20.8 15.6 Smartphone [28.1] 26.4 25.8 27.2 37.9 29.8 TV (e.g. games console) [11.9] [8.7] [6.9] [7.1] 9.1 8.4 [Other mobile device] [8.1] [4.9] [3.0] [3.5] [4.1] 4.4 Women Desktop computer 44.9 58.9 56.0 64.0 67.6 59.9 Laptop computer 72.8 68.6 67.1 64.9 68.9 68.1 Tablet computer [6.5] [9.0] [9.1] 17.3 22.2 14.0 Smartphone [15.1] 21.9 14.5 22.8 22.9 20.0 [TV (e.g. games console)] [5.2] [3.5] [3.9] [3.8] [3.6] 3.9 [Other mobile device] [3.4] [5.2] [3.7] [2.7] [4.5] 3.9 Unweighted N Men 216 362 492 637 731 2438
19
Women 298 470 537 652 744 2701
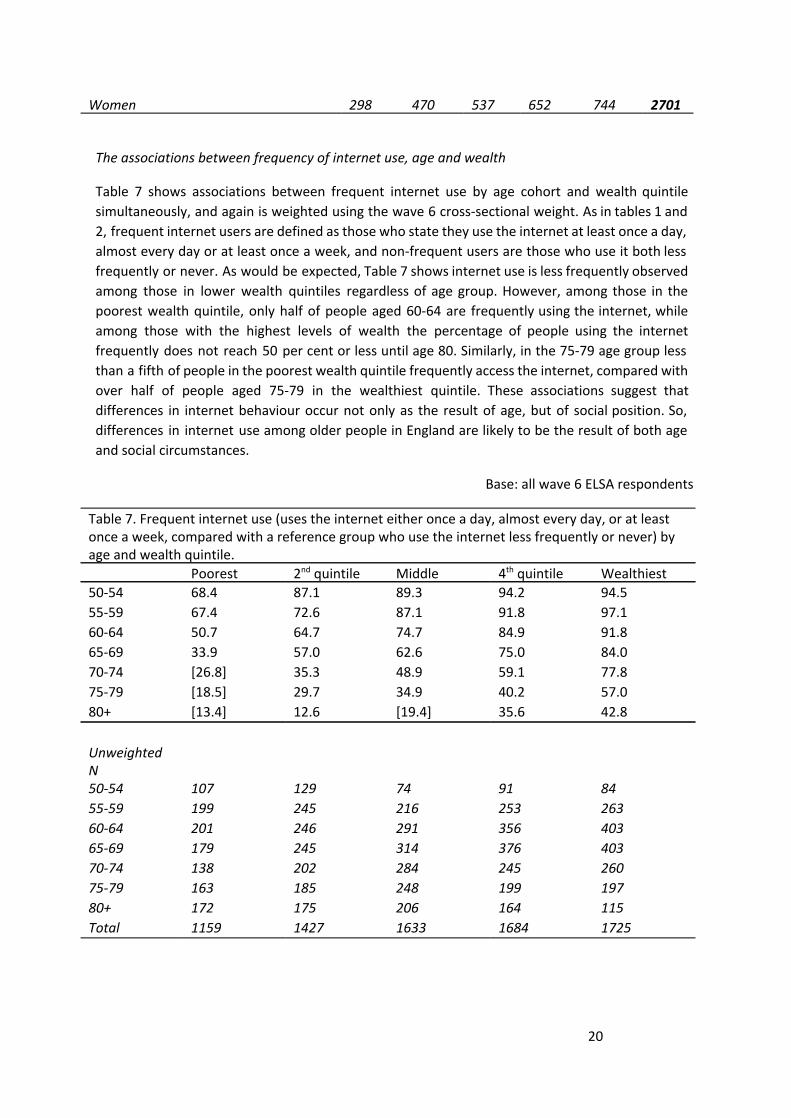
The associations between frequency of internet use, age and wealth
Table 7 shows associations between frequent internet use by age cohort and wealth quintile
simultaneously, and again is weighted using the wave 6 cross-sectional weight. As in tables 1 and
2, frequent internet users are defined as those who state they use the internet at least once a day,
almost every day or at least once a week, and non-frequent users are those who use it both less
frequently or never. As would be expected, Table 7 shows internet use is less frequently observed
among those in lower wealth quintiles regardless of age group. However, among those in the
poorest wealth quintile, only half of people aged 60-64 are frequently using the internet, while
among those with the highest levels of wealth the percentage of people using the internet
frequently does not reach 50 per cent or less until age 80. Similarly, in the 75-79 age group less
than a fifth of people in the poorest wealth quintile frequently access the internet, compared with
over half of people aged 75-79 in the wealthiest quintile. These associations suggest that
differences in internet behaviour occur not only as the result of age, but of social position. So,
differences in internet use among older people in England are likely to be the result of both age
and social circumstances.
Base: all wave 6 ELSA respondents
Table 7. Frequent internet use (uses the internet either once a day, almost every day, or at least once a week, compared with a reference group who use the internet less frequently or never) by age and wealth quintile. Poorest 2nd quintile Middle 4th quintile Wealthiest 50-54 68.4 87.1 89.3 94.2 94.5
55-59 67.4 72.6 87.1 91.8 97.1
60-64 50.7 64.7 74.7 84.9 91.8
65-69 33.9 57.0 62.6 75.0 84.0
70-74 [26.8] 35.3 48.9 59.1 77.8
75-79 [18.5] 29.7 34.9 40.2 57.0
80+ [13.4] 12.6 [19.4] 35.6 42.8
Unweighted N
50-54 107 129 74 91 84
55-59 199 245 216 253 263
60-64 201 246 291 356 403
65-69 179 245 314 376 403
70-74 138 202 284 245 260
75-79 163 185 248 199 197
80+ 172 175 206 164 115
Total 1159 1427 1633 1684 1725
20
2. Reasons for internet use
The data collected at wave 6 of ELSA allow in-depth observations of the reasons for internet use
among people aged 50 and over in England. For the purpose of the analyses presented within this
report, the original thirteen listed reasons for internet use have been reduced to five key
categories of reasons for internet use:
1. Frequently observed activities (sending/receiving email, finding information about goods
or services, searching for information for learning or research, shopping or buying goods
and services, news or newspaper websites and streaming or downloading live or on
demand TV or radio).
2. Finances (banking or paying bills).
3. Networking (social networking sites such as Facebook or Twitter and playing games).
4. Jobs (looking for jobs or sending job applications).
5. Other (less frequently observed activities, including selling goods or services, creating or
uploading content and activities contained within the original ‘other activity’ item).
The means by which these categories were decided are outlined in the Methods section of the
report.
Base: those who have used the internet in the past three months
Table 8. Reasons internet use by gender and age at wave 6 (per cent) 50-54 55-59 60-64 65-69 70-74 75-79 80+ All Men Email, research, etc. 71.7 71.2 72.6 66.1 52.3 40.0 28.8 64.5 Finances 51.5 44.1 45.8 39.5 23.7 20.2 12.7 37.5 Networking/gaming 37.8 30.7 26.7 20.7 14.2 [11.6] [5.91] 23.7 Selling, uploading, other
28.0 23.9 20.3 17.0 [10.7] [4.67] [3.79] 17.7
Job searching/applications
16.1 13.4 [5.8] [1.46] [0.00] [0.13] [0.00] 6.7
Women Email, research, etc. 66.5 73.6 68.2 61.2 48.4 29.9 10.7 53.8 Finances 37.8 45.5 35.7 27.3 17.4 [9.1] [2.5] 27.2 Networking/gaming 40.2 39.0 34.1 28.7 17.6 10.7 [3.3] 26.8 Selling, uploading, other
15.6 17.7 14.4 10.1 [6.3] [2.8] [1.6] 10.7
Job searching/applications
22.4 12.8 [3.3] [0.8] [0.1] [0.0] [0.0] 6.6
Unweighted N Men 349 792 919 914 631 544 530 4679 Women 570 997 1060 954 709 663 740 5693
21
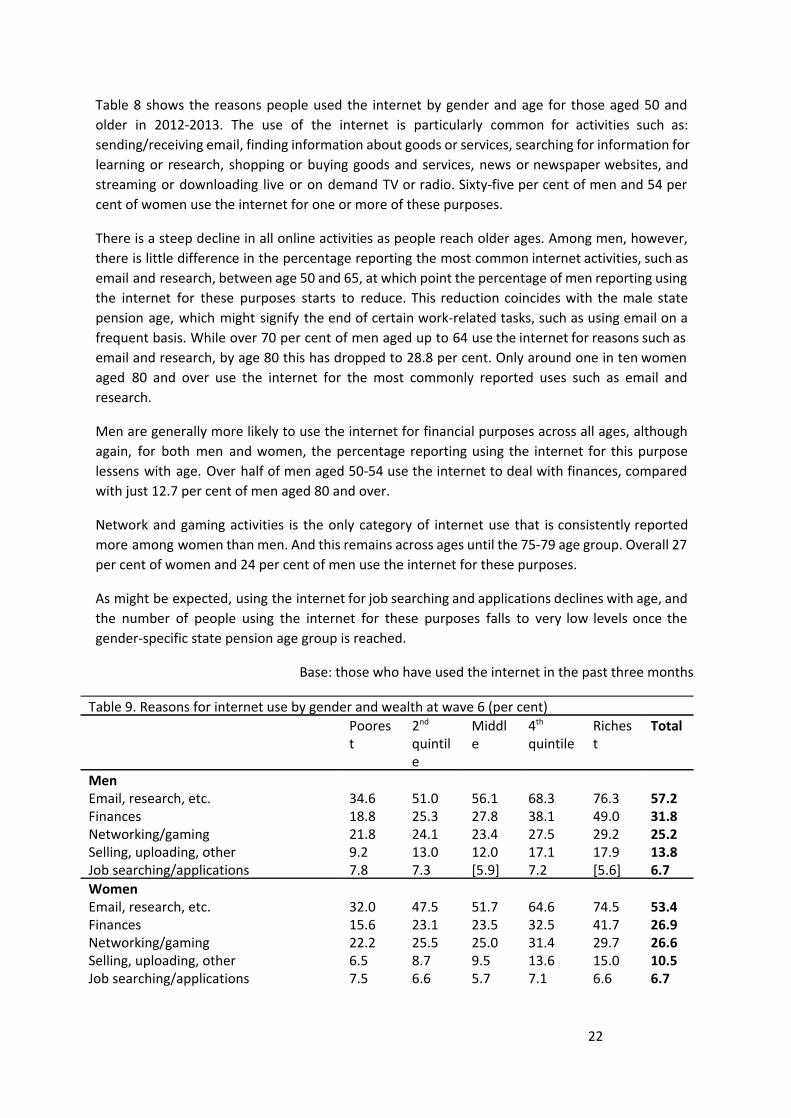
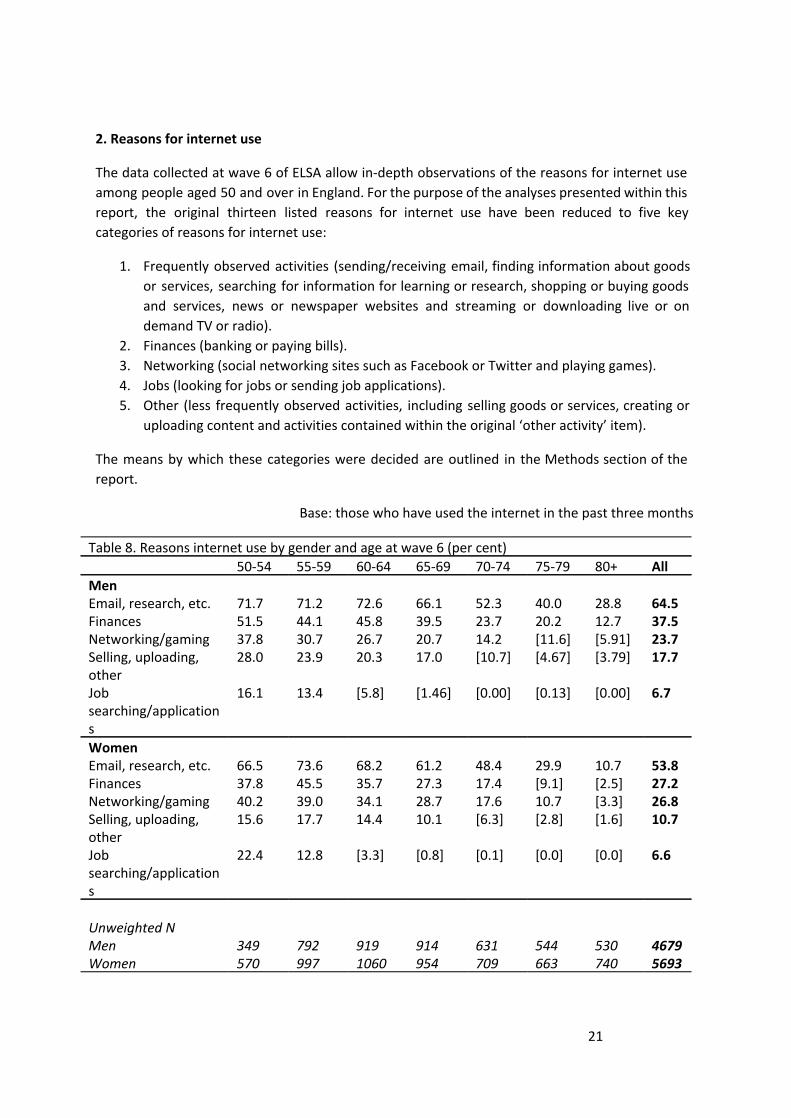
Table 8 shows the reasons people used the internet by gender and age for those aged 50 and
older in 2012-2013. The use of the internet is particularly common for activities such as:
sending/receiving email, finding information about goods or services, searching for information for
learning or research, shopping or buying goods and services, news or newspaper websites, and
streaming or downloading live or on demand TV or radio. Sixty-five per cent of men and 54 per
cent of women use the internet for one or more of these purposes.
There is a steep decline in all online activities as people reach older ages. Among men, however,
there is little difference in the percentage reporting the most common internet activities, such as
email and research, between age 50 and 65, at which point the percentage of men reporting using
the internet for these purposes starts to reduce. This reduction coincides with the male state
pension age, which might signify the end of certain work-related tasks, such as using email on a
frequent basis. While over 70 per cent of men aged up to 64 use the internet for reasons such as
email and research, by age 80 this has dropped to 28.8 per cent. Only around one in ten women
aged 80 and over use the internet for the most commonly reported uses such as email and
research.
Men are generally more likely to use the internet for financial purposes across all ages, although
again, for both men and women, the percentage reporting using the internet for this purpose
lessens with age. Over half of men aged 50-54 use the internet to deal with finances, compared
with just 12.7 per cent of men aged 80 and over.
Network and gaming activities is the only category of internet use that is consistently reported
more among women than men. And this remains across ages until the 75-79 age group. Overall 27
per cent of women and 24 per cent of men use the internet for these purposes.
As might be expected, using the internet for job searching and applications declines with age, and
the number of people using the internet for these purposes falls to very low levels once the
gender-specific state pension age group is reached.
Base: those who have used the internet in the past three months
Table 9. Reasons for internet use by gender and wealth at wave 6 (per cent) Poores
t 2nd quintile
Middle
4th quintile
Richest
Total
Men Email, research, etc. 34.6 51.0 56.1 68.3 76.3 57.2 Finances 18.8 25.3 27.8 38.1 49.0 31.8 Networking/gaming 21.8 24.1 23.4 27.5 29.2 25.2 Selling, uploading, other 9.2 13.0 12.0 17.1 17.9 13.8 Job searching/applications 7.8 7.3 [5.9] 7.2 [5.6] 6.7 Women Email, research, etc. 32.0 47.5 51.7 64.6 74.5 53.4 Finances 15.6 23.1 23.5 32.5 41.7 26.9 Networking/gaming 22.2 25.5 25.0 31.4 29.7 26.6 Selling, uploading, other 6.5 8.7 9.5 13.6 15.0 10.5 Job searching/applications 7.5 6.6 5.7 7.1 6.6 6.7
22
Unweighted N Men 612 721 829 886 932 3980 Women 909 998 1042 995 996 4940
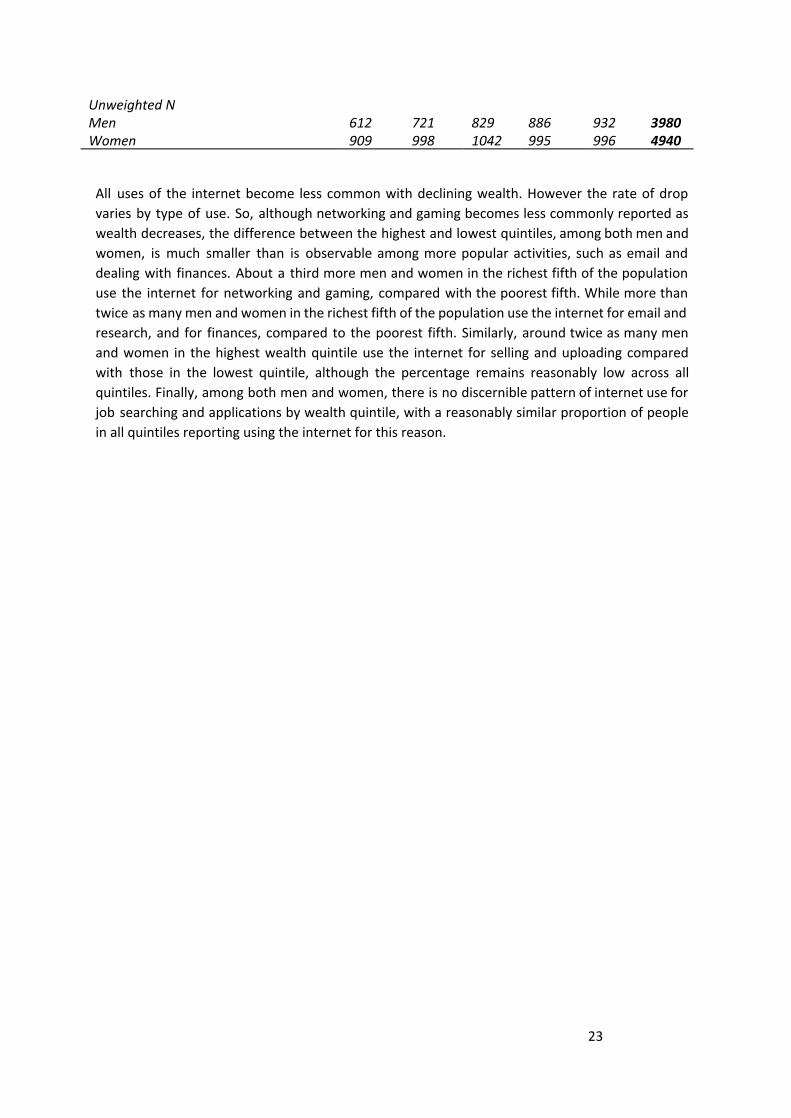
All uses of the internet become less common with declining wealth. However the rate of drop
varies by type of use. So, although networking and gaming becomes less commonly reported as
wealth decreases, the difference between the highest and lowest quintiles, among both men and
women, is much smaller than is observable among more popular activities, such as email and
dealing with finances. About a third more men and women in the richest fifth of the population
use the internet for networking and gaming, compared with the poorest fifth. While more than
twice as many men and women in the richest fifth of the population use the internet for email and
research, and for finances, compared to the poorest fifth. Similarly, around twice as many men
and women in the highest wealth quintile use the internet for selling and uploading compared
with those in the lowest quintile, although the percentage remains reasonably low across all
quintiles. Finally, among both men and women, there is no discernible pattern of internet use for
job searching and applications by wealth quintile, with a reasonably similar proportion of people
in all quintiles reporting using the internet for this reason.
23
3. The relationship between different internet behaviours
Tables 10 and 11 show frequency of internet use by the places in which the internet is used. Table
10 shows row percentages (the frequency of internet use according to location) and table 11
shows the locations of internet use according to frequency.
Base: all wave 6 ELSA respondents
Table 10. Variation in frequency of internet use by places of internet use at wave 6 Every day, or
almost every day
At least once a week
Once a month or less
Unweighted N
Men Home 80.6 15.3 [4.1] 2801 Work 91.8 [7.2] [1.0] 847 Other people’s houses 92.2 [6.9] [0.9] 557 On the move 95.0 [5.0] [0.0] 697 Other (including place of education)
89.1 [8.3] [2.6] 631
Women Home 72.8 19.1 [8.1] 3232 Work 91.1 7.7 [1.2] 964 Other people’s houses 85.5 9.0 [5.0] 649 On the move 94.0 [5.3] [0.7] 608 Other (including place of education)
81.4 [11.0] [7.6] 289
Base: all wave 6 ELSA respondents
Table 11. Frequency of internet use by places of internet use at wave 6 Every day, or
almost every day At least once a week
Once a month or less
Men Home 98.9 95.0 92.3 Work 41.0 16.4 8.1 Other people’s houses 23.6 [9.0] [4.1] On the move 32.3 8.6 [0.0] Other (including place of education)
14.6 [6.9] [7.9]
Women Home 99.1 97.2 91.6 Work 40.0 12.7 4.2 Other people’s houses 23.2 9.2 [12.3] On the move 24.8 [5.2] [1.4] Other (including place of education)
9.5 [4.8] [7.3]
Unweighted N
24
Men 2259 464 133 Women 2358 663 273
Table 10 shows that, for men and women, while the majority of people who access the internet
from home do so every day, a higher percentage of people accessing the internet from all other
locations report using the internet on a daily basis more frequently. This may, in part, be reflecting
relationships between places and devices of internet use, especially when considering the high
percentage of people who access the internet on the move and from other people’s houses
(especially among men) reporting they access the internet daily, or almost daily. Table 11 shows
over 91 per cent of men and women across all frequency of internet access groups access the
internet from home. Around 40 per cent of men and women who access the internet daily do so
from work. Just under a quarter of men and women who access the internet daily or almost daily
do so from other people’s houses, yet under a tenth of people accessing the internet at least once
a week but less than daily report doing so from the houses of others. The reduction in the
percentage of both men and women who use the internet at least once a week, compared with
daily, among those who report accessing the internet while on the move is even greater, with
around three-quarters fewer men and almost four-fifths fewer women stating that they do so.
Base: all wave 6 ELSA respondents
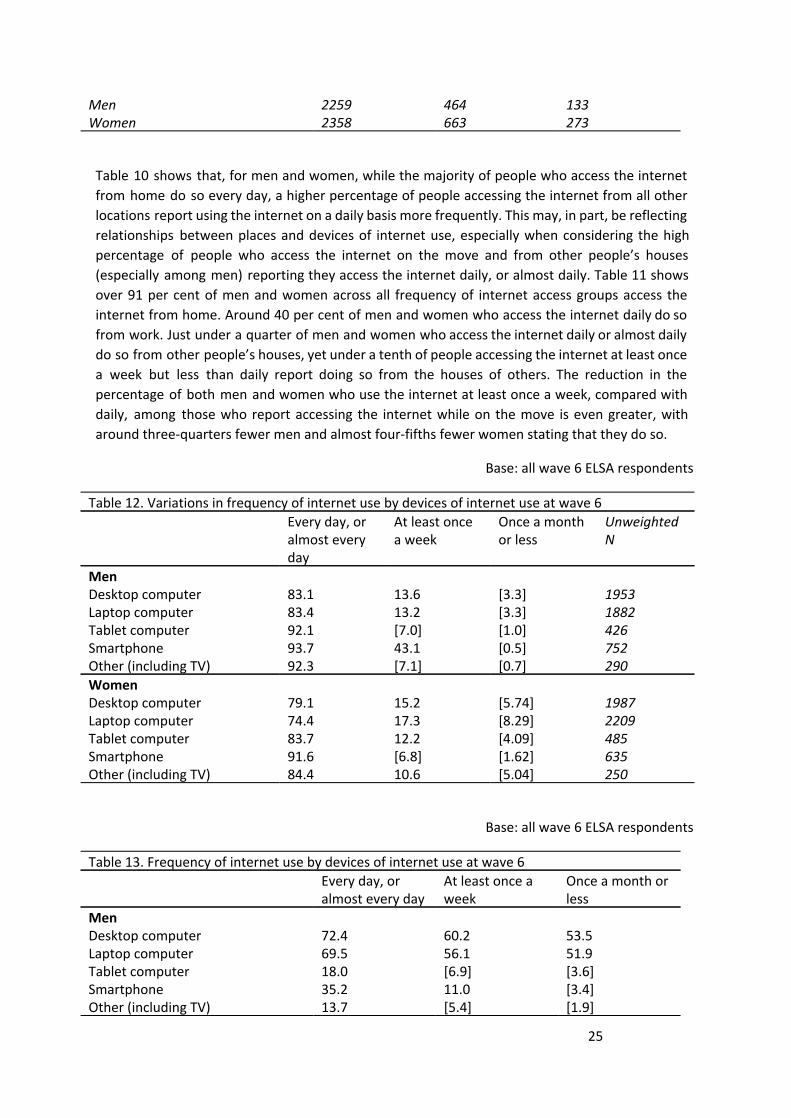
Table 12. Variations in frequency of internet use by devices of internet use at wave 6 Every day, or
almost every day
At least once a week
Once a month or less
Unweighted N
Men Desktop computer 83.1 13.6 [3.3] 1953 Laptop computer 83.4 13.2 [3.3] 1882 Tablet computer 92.1 [7.0] [1.0] 426 Smartphone 93.7 43.1 [0.5] 752 Other (including TV) 92.3 [7.1] [0.7] 290 Women Desktop computer 79.1 15.2 [5.74] 1987 Laptop computer 74.4 17.3 [8.29] 2209 Tablet computer 83.7 12.2 [4.09] 485 Smartphone 91.6 [6.8] [1.62] 635 Other (including TV) 84.4 10.6 [5.04] 250
Base: all wave 6 ELSA respondents
Table 13. Frequency of internet use by devices of internet use at wave 6 Every day, or
almost every day At least once a week
Once a month or less
Men Desktop computer 72.4 60.2 53.5 Laptop computer 69.5 56.1 51.9 Tablet computer 18.0 [6.9] [3.6] Smartphone 35.2 11.0 [3.4] Other (including TV) 13.7 [5.4] [1.9]
25

Women Desktop computer 65.9 47.5 39.4 Laptop computer 70.6 61.8 64.9 Tablet computer 16.5 9.0 [6.6] Smartphone 25.8 [7.2] [3.8] Other (including TV) 8.7 [4.1] [4.3] Unweighted N Men 2259 463 129 Women 2358 661 274
Table 12 shows device of internet use by frequency of internet use. Among both men and women,
the lowest proportion of people reporting using the internet daily can be observed among those
using desktop and laptop computers. This is interesting in light of the previous table that suggests
that those with more mobile devices, who are also likely to be those able to access the internet
while on the move or in places outside of the home, are likely to access the internet more
frequently than those who only access the internet from more ‘static’ locations, such as desktop
computers and laptops which are harder to remove from the home. However, table 13 shows that
among those who use the internet either less often than daily, desktop and laptop computers are
noticeably the most commonly reported devices of internet access. Additionally, mobile devices of
internet use, such as tablet computers and smart phones are noticeably more commonly used by
the most frequent internet users rather than those using the internet less often.
Table 14 shows associations between devices and places of internet use. The variables ask
respondents whether or not they have accessed the internet from the listed locations, as well as
by means of the listed devices, and respondents are able to answer positively to all categories that
apply. As a result, it is not possible to determine which devices are used at which locations, or at
which locations specific devices are more commonly used. However, some associations appear to
emerge.
Base: those who have used the internet in the past three months
Table 14. Places of internet use by devices of internet use at wave 6. Home Work Other
people’s houses
On the move Other (including education)
Men Desktop computer
69.4 82.1 71.5 74.2 77.2
Laptop computer
67.1 77.4 83.2 84.1 80.8
Tablet computer
15.6 21.5 31.0 31.4 29.2
Smartphone 30.4 51.0 56.2 82.8 48.8 Other (including TV)
11.9 16.8 19.3 23.3 20.1
Women Desktop computer
59.6 82.4 62.9 68.6 67.6
26
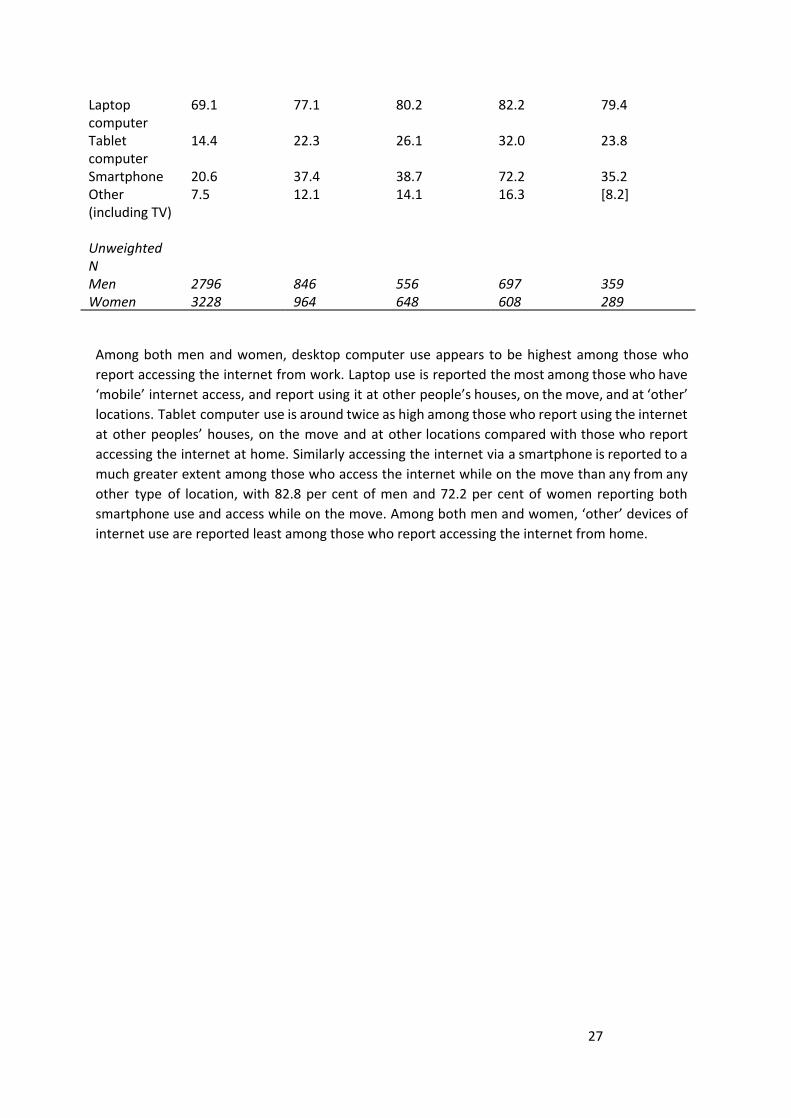
Laptop computer
69.1 77.1 80.2 82.2 79.4
Tablet computer
14.4 22.3 26.1 32.0 23.8
Smartphone 20.6 37.4 38.7 72.2 35.2 Other (including TV)
7.5 12.1 14.1 16.3 [8.2]
Unweighted N
Men 2796 846 556 697 359 Women 3228 964 648 608 289
Among both men and women, desktop computer use appears to be highest among those who
report accessing the internet from work. Laptop use is reported the most among those who have
‘mobile’ internet access, and report using it at other people’s houses, on the move, and at ‘other’
locations. Tablet computer use is around twice as high among those who report using the internet
at other peoples’ houses, on the move and at other locations compared with those who report
accessing the internet at home. Similarly accessing the internet via a smartphone is reported to a
much greater extent among those who access the internet while on the move than any from any
other type of location, with 82.8 per cent of men and 72.2 per cent of women reporting both
smartphone use and access while on the move. Among both men and women, ‘other’ devices of
internet use are reported least among those who report accessing the internet from home.
27

4. Variation in the use of internet by region and measures of area deprivation
The tables presented in this section of the report show information on internet use by three
regional identifiers. Firstly, trends in internet use are examined by Government Office Region
(GOR). Secondly, internet use is considered in relation to whether an individual lives in an urban or
rural location type, and finally, we look at internet use in relation to quintiles of the index of
multiple deprivation.
Internet use by Government Office Region
Base: all wave 6 ELSA respondents
Table 15. Frequency of internet use by Government Office Region at wave 6. Nort
h East
North West
Yorkshire and the Humber
East Midlands
West Midlands
East of England
London
South East
South West
Men Every day 46.1 56.3 53.2 60.5 54.5 63.1 63.8 64.8 60.7 At least once a month
[16.8]
12.2 [10.9] [11.1] [10.5] 10.9 [9.0] 12.0 14.7
Once a month or less
[3.0] [4.7] [4.7] [3.7] [6.1] [7.0] [4.9] [4.7] [4.1]
Never 34.2 26.8 31.1 24.7 28.9 19.0 22.4 18.6 20.5 Women Every day 37.7 44.8 41.5 42.0 38.9 52.1 50.8 52.2 53.8 At least once a month
[12.3]
12.3 13.1 14.6 12.5 13.9 12.2 12.4 10.5
Once a month or less
[7.0] [7.5] [9.6] 11.1 [8.2] [5.6] [4.1] 7.3 [6.0]
Never 43.0 35.4 35.8 32.3 40.4 28.5 32.9 28.0 29.7 Unweighted N Men 227 433 386 417 426 516 337 698 458 Women 300 539 531 521 534 637 418 852 571
Table 15 shows frequency of internet use by GOR. The North East of England has the lowest rate
of people using the internet every day or almost every day (46 per cent of men and 38 per cent of
women), although among men, it has the highest rate of people using the internet at least once a
month. The North East also has the highest proportion of both men and women who never use
the internet (34 per cent and 43 per cent, respectively). The highest rates of most frequent
internet use are found among both men and women in the East of England, London, the South
East and the South West of England (for each region over 60 per cent of men and over 50 per cent
28
of women). These areas also see the lowest proportions of both men and women who never use
the internet.
Base: those who have used the internet in the past three months
Table 16. Place of internet use by Government Office Region at Wave 6. Nort
h East
North West
Yorkshire and the Humber
East Midlands
West Midlands
East of England
London
South East
South West
Men Home 96.2 99.2 98.6 97.5 98.7 97.0 97.1 97.6 99.4 Work [32.3
] 33.2 37.4 34.5 36.2 36.9 46.3 35.1 27.9
Other people’s houses
[17.2]
17.8 [16.2] [22.0] [21.1] 19.5 24.8 22.4 18.9
On the move
[24.7]
25.2 [23.8] [21.2] 26.9 27.7 37.2 26.8 27.0
Other (including place of education)
[9.6] [13.5]
[10.4] [13.7] [12.6] [12.0] 18.7 12.2 [13.1]
Women Home 95.6 98.7 98.3 97.2 97.1 97.9 98.3 98.5 98.9 Work [34.8
] 35.0 29.0 25.1 31.2 31.6 35.2 31.7 31.1
Other people’s houses
[18.6]
19.8 [17.5] [16.2] 20.0 23.9 19.9 18.1 20.9
On the move
[18.0]
19.5 [16.7] [12.4] 19.8 20.6 24.2 16.1 23.0
Other (including place of education)
[6.2] [8.2] [8.1] [5.7] [7.6] [8.7] [12.1] [7.4] [9.6]
Unweighted N Men 143 309 253 301 291 396 249 546 356 Women 169 363 333 338 323 454 281 617 404
Table 16 shows locations in which the internet is accessed by GOR. While the percentage of
people using the internet at home is similar across all regions, the highest percentage of men is
found in the South West of England (99 per cent), and this is also the place in which the lowest
percentage of men access the internet from places of work (28 per cent). Locations of internet use
appear to be the most different in London, with over 46 per cent of men in London accessing the
internet from work, noticeably the highest rate, with the second highest percentage of people
29
accessing the internet being men from Yorkshire and the Humber (37 per cent). The highest rates
of internet use from other people’s houses, on the move and ‘other’ locations are also among men
in London. Women in London are also the most likely to access the internet from work (35 per
cent), on the move (24 per cent) and from ‘other’ locations (12 per cent).
Table 17 shows devices used for internet access by GOR. Again, people in London appear to have
slightly different trends in internet use than other locations in England. The highest proportion of
male laptop users is found in London (72 per cent, compared with the second highest rate of 68
per cent in the North West). The highest rates of men using tablets and smartphones for internet
access are also seen in London. While the previous section of the report showed women used
desktop computers considerably less than men, the highest proportion of women using desktop
computers can be observed in London and the South East. The highest percentage of women
accessing the internet from smartphones is also observable in London (over a quarter).
Base: those who have used the internet in the past three months
Table 17. Devices for internet use by Government Office Region at Wave 6. Nort
h East
North West
Yorkshire and the Humber
East Midlands
West Midlands
East of England
London
South East
South West
Men Desktop computer
65.8 65.1 70.1 64.7 69.3 72.5 69.2 72.5 72.0
Laptop computer
66.6 67.7 67.2 66.3 65.8 64.3 71.8 66.9 63.0
Tablet computer
[11.6]
[11.9]
[10.0] [10.7] [20.3] 16.9 20.5 16.8 16.7
Smartphone
[26.8]
32.7 26.0 26.5 29.6 31.4 37.6 28.1 28.4
Other (including TV)
[14.8]
[5.6] [11.1] [14.9] [9.1] [12.9] [14.7] 12.8 [11.9]
Women Desktop computer
61.5 58.8 52.5 61.4 55.7 59.0 63.2 63.5 62.4
Laptop computer
68.7 67.6 71.6 60.5 69.7 71.7 71.4 66.7 67.6
Tablet computer
[12.9]
16.5 [10.8] [10.8] [14.0] 15.5 [14.5] 14.6 15.1
Smartphone
[18.9]
16.6 [17.9] [17.3] 23.5 21.5 26.2 19.1 21.5
Other (including TV)
[9.7] [7.9] [7.3] [5.8] [10.4] [8.1] [8.4] [6.4] [5.2]
Unweighted N Men 143 308 254 301 292 396 249 542 354
30
Women 169 363 333 338 322 454 279 618 405
Base: those who have used the internet in the past three months
Table 18. Reasons for internet use by Government Office Region at Wave 6. North
East North West
Yorkshire and the Humber
East Midlands
West Midlands
East of England
London
South East
South West
Men Email, research, etc. 55.1 52.1 53.0 62.6 55.2 65.8 63.9 70.8 67.8
Finances 26.8 33.5 28.7 39.5 31.6 40.6 45.4 42.9 39.1
Networking/gaming [18.8]
23.8 17.3 28.4 22.1 23.6 29.2 23.3 24.5
Selling, uploading, other
[12.8]
15.1 [11.9] 19.5 16.1 18.0 19.9 22.1 19.3
Job searching/applications
[7.0] [5.2] [3.6] [6.6] [7.0] [7.8] [9.9] [6.1] [7.7]
Women
Email, research, etc. 44.2 50.2 50.4 53.0 44.8 60.5 50.9 60.8 60.5
Finances 21.5 23.5 24.1 27.5 22.4 31.0 25.2 32.7 29.3
Networking/gaming [17.9]
27.4 25.1 26.2 22.5 30.3 28.0 29.5 27.4
Selling, uploading, other
[7.3] 10.0 [8.9] 11.1 11.2 11.4 11.3 12.0 10.8
Job searching/applications
[3.3] [4.6] [6.7] [5.5] [5.6] [6.8] 9.9 8.3 [6.8]
Unweighted N Men 276 561 473 507 537 605 403 805 559
Women 359 665 634 628 642 729 525 990 659
Finally, Table 18 looks at reasons for internet use by GOR. Among both men and women, those in
northern areas of England (the North East, North West and Yorkshire and the Humber) are the
least likely to use the internet for purposes such as email and research, and those in the South
East and South West are the most likely to use the internet for these reasons. The percentage of
people using the internet for banking and finances is highest among men in London and the South
East and women in the South East. Both men and women in the North East use the internet for
financial reasons the least (27 per cent and 21 per cent, respectively, compared with 43 per cent
and 33 per cent of men and women, respectively, in the South East of England). The highest rates
of searching and applying for jobs online are seen among both men and women in London (10 per
cent for each).
Internet use by urban and rural identifiers
Tables 19 to 22 show internet use by rural identifiers. The sample is divided into those whose
locations can be described as urban, a town or fringe dwelling, a village, or a hamlet or isolated
31

dwelling. Due to smaller sample sizes among those in less populated areas, as well as the smaller
number of respondents using the internet less frequently (as opposed to both frequently and
never) the two-category version of the internet frequency variable is used in this section of the
report.
Base: all wave 6 ELSA respondents
Table 19. Frequency of internet use by urban/rural indicator at wave 6. Urban Town/fringe Village Hamlet/isolated
dwelling Men At least once a week to once a day
69.9 72.8 77.9 74.1
Less than once a week to never 30.1 27.2 22.1 25.9 Women At least once a week to once a day
58.5 59.1 65.6 68.9
Less than once a week to never 41.5 40.9 34.7 31.1 Unweighted N Men 2808 472 450 176 Women 3547 636 532 198
Table 19 shows both men and women in more rural locations are more likely to use the internet
between once a week and once a day than those in more densely populated areas. There is a
graded relationship between increasing rates of both men and women using the internet
frequently and decreasing area population density.
Table 20 shows locations of internet access by urban and rural identifiers. Again, internet access
from home is commonly observed among all groups of people. Unlike the previous section, which
showed gradient associations between accessing the internet from work and both increasing age
and wealth quintile, there is no real observable trend in accessing the internet from work on the
basis of an individual’s type of location. However, both men and women from hamlets and
isolated dwellings are the most likely to report accessing the internet from the houses of others
(32 per cent and 25 per cent, respectively) as well as on the move (36 per cent and 22 per cent,
respectively).
Base: those who have used the internet in the past three months
Table 20. Places of internet use by urban/rural indicator at wave 6. Urban Town/fringe Village Hamlet/isolated
dwelling Men Home 97.8 99.1 97.7 100.0 Work 36.7 33.0 29.5 [41.6] Other people’s houses 19.9 18.9 21.2 [31.9] On the move 27.1 28.1 23.7 [35.6] Other (including place of education)
13.0 [14.6] [12.8] [11.7]
32
Women Home 97.9 98.3 99.0 98.5 Work 31.8 27.7 33.6 [31.6] Other people’s houses 19.6 [18.8] 18.6 [25.2] On the move 19.6 14.5 18.9 [21.7] Other (including place of education)
8.4 [8.6] [7.3] [8.3]
Unweighted N Men 2005 358 356 132 Women 2328 431 386 146
Table 21 looks at the percentage of people accessing the internet via different devices on the basis
of whether they live in urban or rural locations. The highest percentages of both men and women
accessing the internet from laptops, tablets and smartphones is observable among those living in
hamlets and isolated dwellings.
Base: those who have used the internet in the past three months
Table 21. Devices for internet use by urban/rural indicator at wave 6. Urban Town/fringe Village Hamlet/isolated
dwelling Men Desktop computer 70.1 69.5 67.7 67.5 Laptop computer 66.7 67.0 63.4 73.2 Tablet computer 16.8 [10.7] [10.9] [21.6] Smartphone 29.1 29.6 30.8 [45.4] Other (including TV) 12.8 [12.0] [7.0] [9.9] Women Desktop computer 59.4 60.1 64.4 59.5 Laptop computer 68.5 67.6 67.4 71.8 Tablet computer 14.5 [11.5] [13.7] [17.5] Smartphone 21.0 18.3 16.2 [23.6] Other (including TV) 8.3 [6.0] [3.5] [6.6] Unweighted N Men 2001 358 354 133 Women 2327 431 386 146
Finally, table 22 shows reasons for internet use by whether the individual lives in an urban or rural
location. Those in more rural locations (villages or hamlets and isolated dwellings) are the most
likely to report using the internet for email and research. Ten per cent more men and women in
hamlets and isolated dwellings report using the internet for financial reasons than in urban areas,
possibly reflecting the reduction in physical access to banking services among these groups. Over a
quarter of men in hamlets and isolated dwellings report using the internet for selling and
uploading, compared with 18 per cent or less of men from all other area types. Finally, men from
33
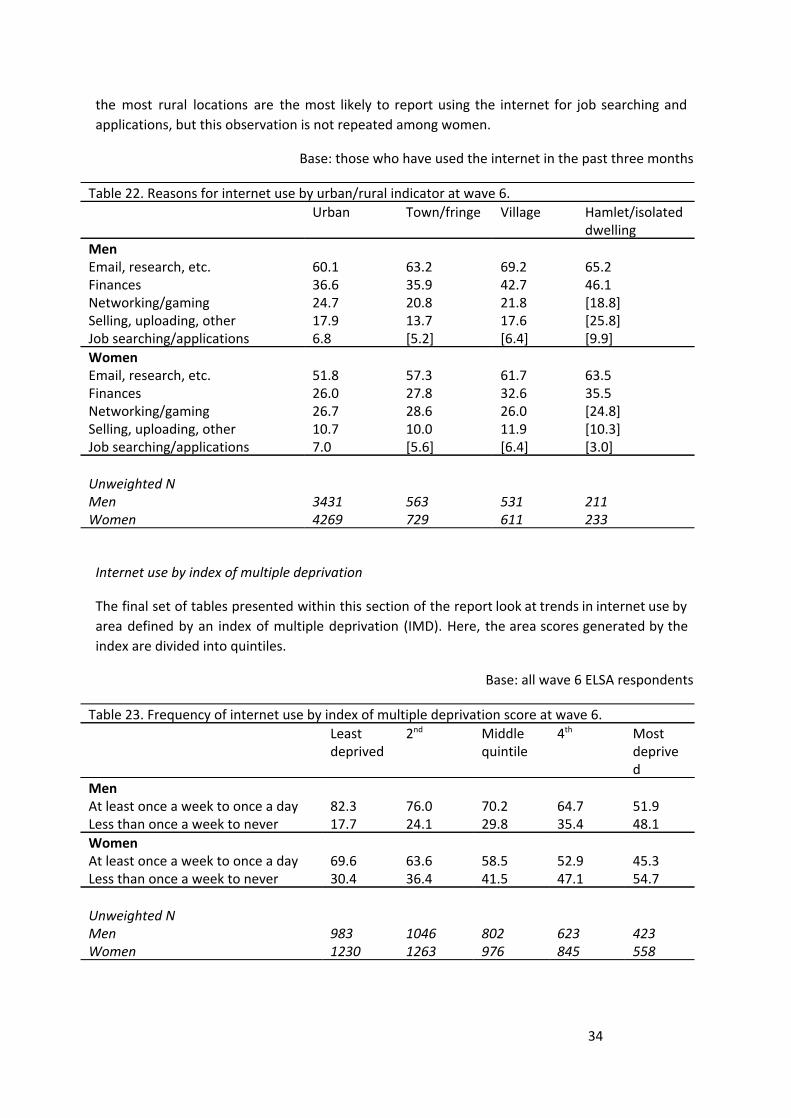
the most rural locations are the most likely to report using the internet for job searching and
applications, but this observation is not repeated among women.
Base: those who have used the internet in the past three months
Table 22. Reasons for internet use by urban/rural indicator at wave 6. Urban Town/fringe Village Hamlet/isolated
dwelling Men Email, research, etc. 60.1 63.2 69.2 65.2 Finances 36.6 35.9 42.7 46.1 Networking/gaming 24.7 20.8 21.8 [18.8] Selling, uploading, other 17.9 13.7 17.6 [25.8] Job searching/applications 6.8 [5.2] [6.4] [9.9] Women Email, research, etc. 51.8 57.3 61.7 63.5 Finances 26.0 27.8 32.6 35.5 Networking/gaming 26.7 28.6 26.0 [24.8] Selling, uploading, other 10.7 10.0 11.9 [10.3] Job searching/applications 7.0 [5.6] [6.4] [3.0] Unweighted N Men 3431 563 531 211 Women 4269 729 611 233
Internet use by index of multiple deprivation
The final set of tables presented within this section of the report look at trends in internet use by
area defined by an index of multiple deprivation (IMD). Here, the area scores generated by the
index are divided into quintiles.
Base: all wave 6 ELSA respondents
Table 23. Frequency of internet use by index of multiple deprivation score at wave 6. Least
deprived 2nd Middle
quintile 4th Most
deprived
Men At least once a week to once a day 82.3 76.0 70.2 64.7 51.9 Less than once a week to never 17.7 24.1 29.8 35.4 48.1 Women At least once a week to once a day 69.6 63.6 58.5 52.9 45.3 Less than once a week to never 30.4 36.4 41.5 47.1 54.7 Unweighted N Men 983 1046 802 623 423 Women 1230 1263 976 845 558
34
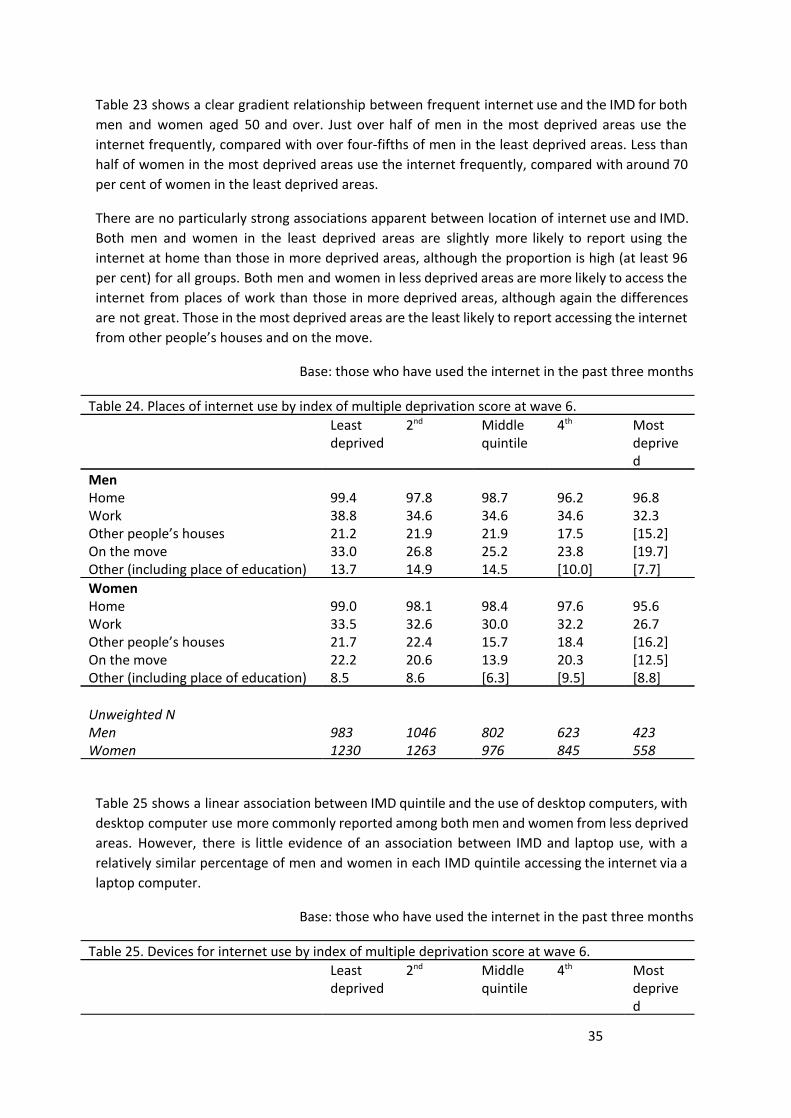
Table 23 shows a clear gradient relationship between frequent internet use and the IMD for both
men and women aged 50 and over. Just over half of men in the most deprived areas use the
internet frequently, compared with over four-fifths of men in the least deprived areas. Less than
half of women in the most deprived areas use the internet frequently, compared with around 70
per cent of women in the least deprived areas.
There are no particularly strong associations apparent between location of internet use and IMD.
Both men and women in the least deprived areas are slightly more likely to report using the
internet at home than those in more deprived areas, although the proportion is high (at least 96
per cent) for all groups. Both men and women in less deprived areas are more likely to access the
internet from places of work than those in more deprived areas, although again the differences
are not great. Those in the most deprived areas are the least likely to report accessing the internet
from other people’s houses and on the move.
Base: those who have used the internet in the past three months
Table 24. Places of internet use by index of multiple deprivation score at wave 6. Least
deprived 2nd Middle
quintile 4th Most
deprived
Men Home 99.4 97.8 98.7 96.2 96.8 Work 38.8 34.6 34.6 34.6 32.3 Other people’s houses 21.2 21.9 21.9 17.5 [15.2] On the move 33.0 26.8 25.2 23.8 [19.7] Other (including place of education) 13.7 14.9 14.5 [10.0] [7.7] Women Home 99.0 98.1 98.4 97.6 95.6 Work 33.5 32.6 30.0 32.2 26.7 Other people’s houses 21.7 22.4 15.7 18.4 [16.2] On the move 22.2 20.6 13.9 20.3 [12.5] Other (including place of education) 8.5 8.6 [6.3] [9.5] [8.8] Unweighted N Men 983 1046 802 623 423 Women 1230 1263 976 845 558
Table 25 shows a linear association between IMD quintile and the use of desktop computers, with
desktop computer use more commonly reported among both men and women from less deprived
areas. However, there is little evidence of an association between IMD and laptop use, with a
relatively similar percentage of men and women in each IMD quintile accessing the internet via a
laptop computer.
Base: those who have used the internet in the past three months
Table 25. Devices for internet use by index of multiple deprivation score at wave 6. Least
deprived 2nd Middle
quintile 4th Most
deprived
35
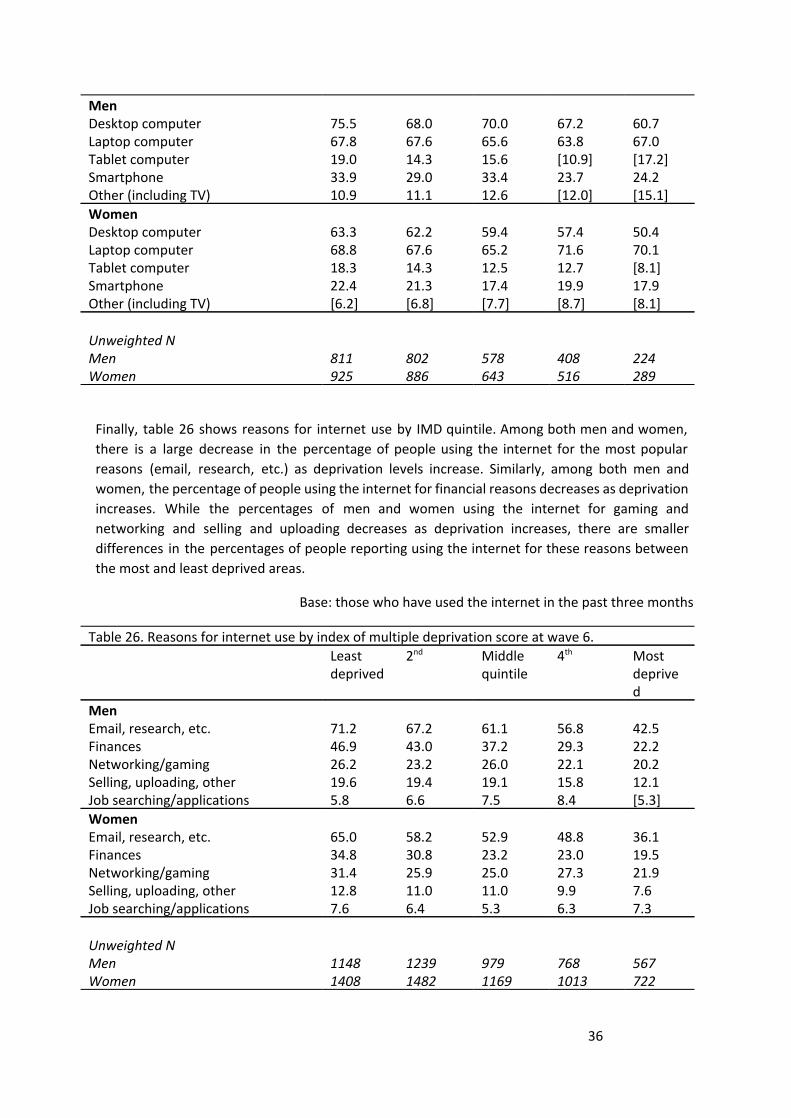
Men Desktop computer 75.5 68.0 70.0 67.2 60.7 Laptop computer 67.8 67.6 65.6 63.8 67.0 Tablet computer 19.0 14.3 15.6 [10.9] [17.2] Smartphone 33.9 29.0 33.4 23.7 24.2 Other (including TV) 10.9 11.1 12.6 [12.0] [15.1] Women Desktop computer 63.3 62.2 59.4 57.4 50.4 Laptop computer 68.8 67.6 65.2 71.6 70.1 Tablet computer 18.3 14.3 12.5 12.7 [8.1] Smartphone 22.4 21.3 17.4 19.9 17.9 Other (including TV) [6.2] [6.8] [7.7] [8.7] [8.1] Unweighted N Men 811 802 578 408 224 Women 925 886 643 516 289
Finally, table 26 shows reasons for internet use by IMD quintile. Among both men and women,
there is a large decrease in the percentage of people using the internet for the most popular
reasons (email, research, etc.) as deprivation levels increase. Similarly, among both men and
women, the percentage of people using the internet for financial reasons decreases as deprivation
increases. While the percentages of men and women using the internet for gaming and
networking and selling and uploading decreases as deprivation increases, there are smaller
differences in the percentages of people reporting using the internet for these reasons between
the most and least deprived areas.
Base: those who have used the internet in the past three months
Table 26. Reasons for internet use by index of multiple deprivation score at wave 6. Least
deprived 2nd Middle
quintile 4th Most
deprived
Men Email, research, etc. 71.2 67.2 61.1 56.8 42.5 Finances 46.9 43.0 37.2 29.3 22.2 Networking/gaming 26.2 23.2 26.0 22.1 20.2 Selling, uploading, other 19.6 19.4 19.1 15.8 12.1 Job searching/applications 5.8 6.6 7.5 8.4 [5.3] Women Email, research, etc. 65.0 58.2 52.9 48.8 36.1 Finances 34.8 30.8 23.2 23.0 19.5 Networking/gaming 31.4 25.9 25.0 27.3 21.9 Selling, uploading, other 12.8 11.0 11.0 9.9 7.6 Job searching/applications 7.6 6.4 5.3 6.3 7.3 Unweighted N Men 1148 1239 979 768 567 Women 1408 1482 1169 1013 722
36

37
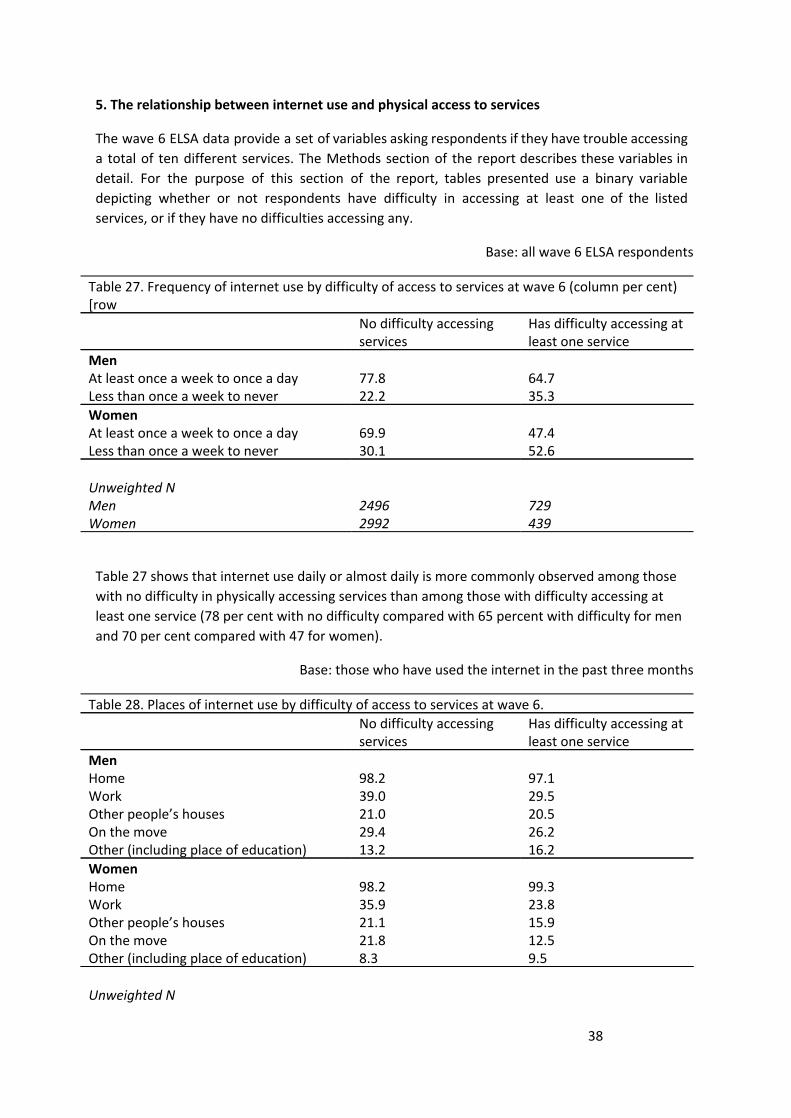
5. The relationship between internet use and physical access to services
The wave 6 ELSA data provide a set of variables asking respondents if they have trouble accessing
a total of ten different services. The Methods section of the report describes these variables in
detail. For the purpose of this section of the report, tables presented use a binary variable
depicting whether or not respondents have difficulty in accessing at least one of the listed
services, or if they have no difficulties accessing any.
Base: all wave 6 ELSA respondents
Table 27. Frequency of internet use by difficulty of access to services at wave 6 (column per cent) [row No difficulty accessing
services Has difficulty accessing at least one service
Men At least once a week to once a day 77.8 64.7 Less than once a week to never 22.2 35.3 Women At least once a week to once a day 69.9 47.4 Less than once a week to never 30.1 52.6 Unweighted N Men 2496 729 Women 2992 439
Table 27 shows that internet use daily or almost daily is more commonly observed among those
with no difficulty in physically accessing services than among those with difficulty accessing at
least one service (78 per cent with no difficulty compared with 65 percent with difficulty for men
and 70 per cent compared with 47 for women).
Base: those who have used the internet in the past three months
Table 28. Places of internet use by difficulty of access to services at wave 6. No difficulty accessing
services Has difficulty accessing at least one service
Men Home 98.2 97.1 Work 39.0 29.5 Other people’s houses 21.0 20.5 On the move 29.4 26.2 Other (including place of education) 13.2 16.2 Women Home 98.2 99.3 Work 35.9 23.8 Other people’s houses 21.1 15.9 On the move 21.8 12.5 Other (including place of education) 8.3 9.5 Unweighted N
38
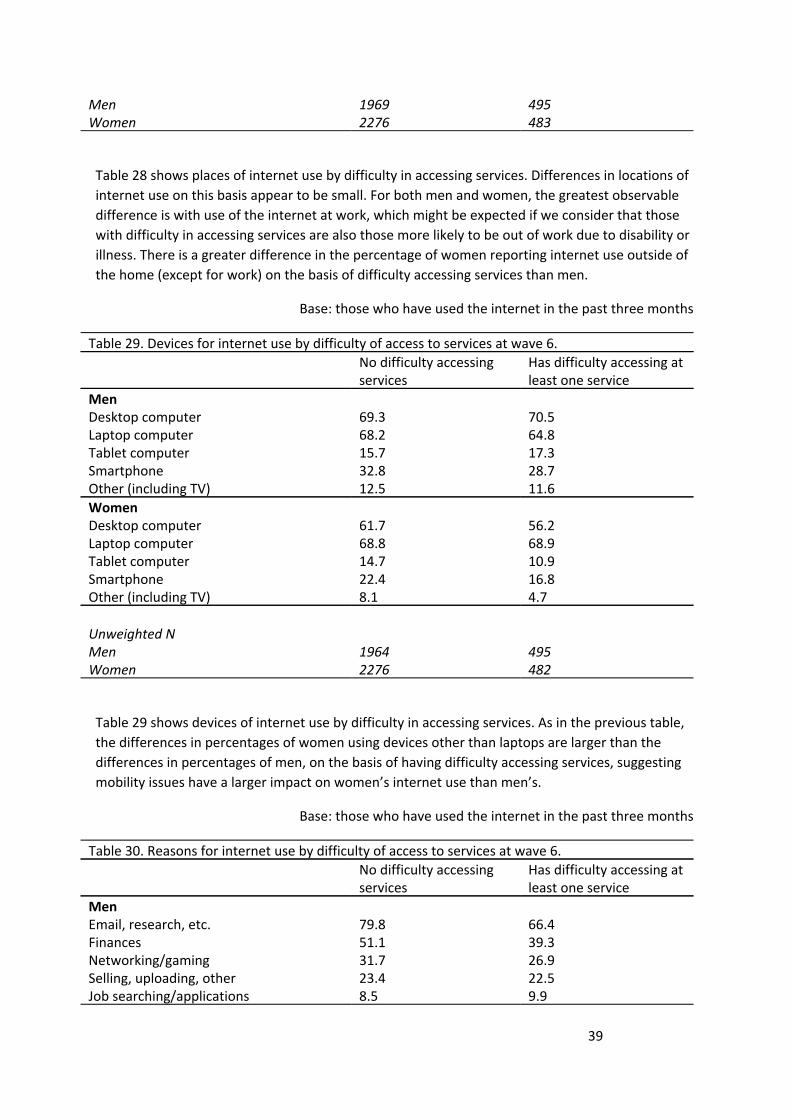
Men 1969 495 Women 2276 483
Table 28 shows places of internet use by difficulty in accessing services. Differences in locations of
internet use on this basis appear to be small. For both men and women, the greatest observable
difference is with use of the internet at work, which might be expected if we consider that those
with difficulty in accessing services are also those more likely to be out of work due to disability or
illness. There is a greater difference in the percentage of women reporting internet use outside of
the home (except for work) on the basis of difficulty accessing services than men.
Base: those who have used the internet in the past three months
Table 29. Devices for internet use by difficulty of access to services at wave 6. No difficulty accessing
services Has difficulty accessing at least one service
Men Desktop computer 69.3 70.5 Laptop computer 68.2 64.8 Tablet computer 15.7 17.3 Smartphone 32.8 28.7 Other (including TV) 12.5 11.6 Women Desktop computer 61.7 56.2 Laptop computer 68.8 68.9 Tablet computer 14.7 10.9 Smartphone 22.4 16.8 Other (including TV) 8.1 4.7 Unweighted N Men 1964 495 Women 2276 482
Table 29 shows devices of internet use by difficulty in accessing services. As in the previous table,
the differences in percentages of women using devices other than laptops are larger than the
differences in percentages of men, on the basis of having difficulty accessing services, suggesting
mobility issues have a larger impact on women’s internet use than men’s.
Base: those who have used the internet in the past three months
Table 30. Reasons for internet use by difficulty of access to services at wave 6. No difficulty accessing
services Has difficulty accessing at least one service
Men Email, research, etc. 79.8 66.4 Finances 51.1 39.3 Networking/gaming 31.7 26.9 Selling, uploading, other 23.4 22.5 Job searching/applications 8.5 9.9
39

Women Email, research, etc. 73.3 50.7 Finances 40.0 24.0 Networking/gaming 36.8 26.0 Selling, uploading, other 15.1 10.2 Job searching/applications 10.4 5.8 Unweighted N Men 2511 736 Women 3027 873
Table 30 shows reasons for internet use by difficulty in accessing services. All reasons for internet
use are reported more among those without difficulty accessing services than those with, for both
men and women.
40
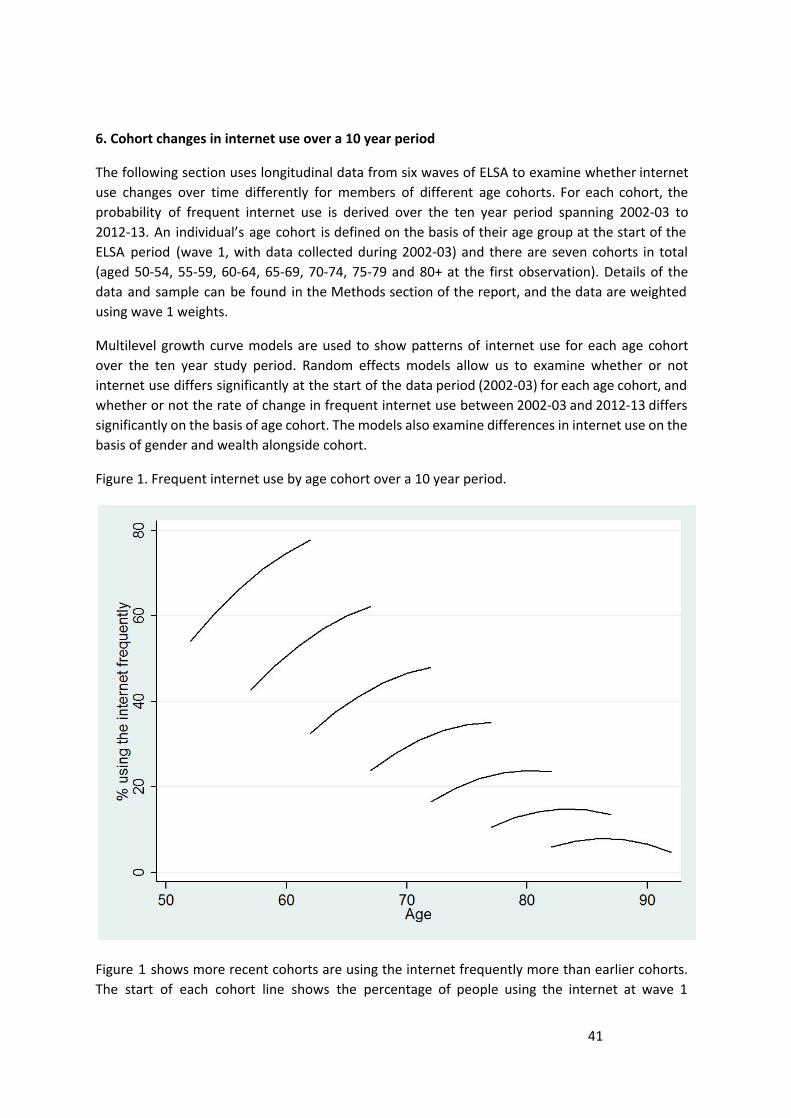
6. Cohort changes in internet use over a 10 year period
The following section uses longitudinal data from six waves of ELSA to examine whether internet
use changes over time differently for members of different age cohorts. For each cohort, the
probability of frequent internet use is derived over the ten year period spanning 2002-03 to
2012-13. An individual’s age cohort is defined on the basis of their age group at the start of the
ELSA period (wave 1, with data collected during 2002-03) and there are seven cohorts in total
(aged 50-54, 55-59, 60-64, 65-69, 70-74, 75-79 and 80+ at the first observation). Details of the
data and sample can be found in the Methods section of the report, and the data are weighted
using wave 1 weights.
Multilevel growth curve models are used to show patterns of internet use for each age cohort
over the ten year study period. Random effects models allow us to examine whether or not
internet use differs significantly at the start of the data period (2002-03) for each age cohort, and
whether or not the rate of change in frequent internet use between 2002-03 and 2012-13 differs
significantly on the basis of age cohort. The models also examine differences in internet use on the
basis of gender and wealth alongside cohort.
Figure 1. Frequent internet use by age cohort over a 10 year period.
Figure 1 shows more recent cohorts are using the internet frequently more than earlier cohorts.
The start of each cohort line shows the percentage of people using the internet at wave 1
41

(2002-03), and the final point of each line shows the percentage of people using the internet at
wave 6 (2012-13). The lines clearly demonstratea the graded relationship between higher levels of
internet use and more recent cohorts. As well as more recent cohorts displaying higher levels of
frequent internet use, Figure 1 shows that over the ten year study period, uptake of frequent
internet use occurs at a greater rate among more recent cohorts (demonstrated by the gradient of
each cohort’s line). Additionally, among the earlier cohorts the initial slow increase in frequent
internet use over time changes to a decline towards the end of the study period. The graph
suggests that this point of decline happens earliest among the oldest cohort, and that the rate of
decline is steepest among the oldest group. There is a gradient pattern of lessening decline, both
in terms of frequent internet use and rate of decline of internet use, as the cohorts become
younger.
Importantly, Figure 1 shows that for a given age the large differences in frequent internet use by
age cohort do not diminish over time, such that the lines are stacked above each other rather than
joining or crossing. Imagine a line drawn up from age 72 to illustrate this. At this point the earlist
cohort (aged 70 to74 when first observed) had a rate of frequent internet use of about 18 per
cent, compared with a rate of about 33 per cent for the next cohort (aged 65 to 69 when first
interviewed) and a rate of almost 50 per cent for the cohort that followed that (aged 60 to 64
when first interviewed).
Figure 2. Frequent internet use by age cohort and gender over a 10 year period.
Figure 2 appears to show the same overall pattern for both men and women in frequent internet
use as that shown in Figure 1. The separate lines for men and women show that, although men
42
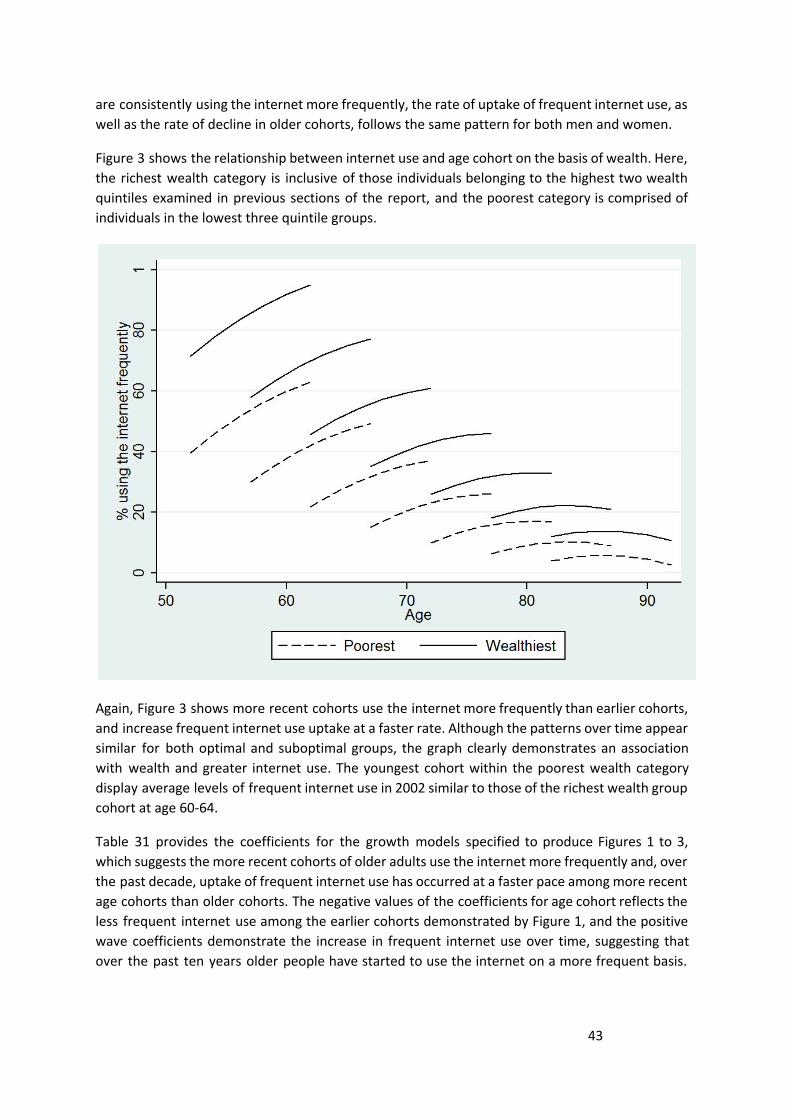
are consistently using the internet more frequently, the rate of uptake of frequent internet use, as
well as the rate of decline in older cohorts, follows the same pattern for both men and women.
Figure 3 shows the relationship between internet use and age cohort on the basis of wealth. Here,
the richest wealth category is inclusive of those individuals belonging to the highest two wealth
quintiles examined in previous sections of the report, and the poorest category is comprised of
individuals in the lowest three quintile groups.
Again, Figure 3 shows more recent cohorts use the internet more frequently than earlier cohorts,
and increase frequent internet use uptake at a faster rate. Although the patterns over time appear
similar for both optimal and suboptimal groups, the graph clearly demonstrates an association
with wealth and greater internet use. The youngest cohort within the poorest wealth category
display average levels of frequent internet use in 2002 similar to those of the richest wealth group
cohort at age 60-64.
Table 31 provides the coefficients for the growth models specified to produce Figures 1 to 3,
which suggests the more recent cohorts of older adults use the internet more frequently and, over
the past decade, uptake of frequent internet use has occurred at a faster pace among more recent
age cohorts than older cohorts. The negative values of the coefficients for age cohort reflects the
less frequent internet use among the earlier cohorts demonstrated by Figure 1, and the positive
wave coefficients demonstrate the increase in frequent internet use over time, suggesting that
over the past ten years older people have started to use the internet on a more frequent basis.
43

The negative value of the interaction between wave and age cohort suggests uptake of frequent
internet use is higher among the more recent cohorts, and again this is reflected in Figure 1.
44

Table 31. Growth curve model of frequent internet use by age cohort, gender and wealth. Model 1 Model 2 Model 3 Fixed effects Cohort -0.051*** -0.055*** -0.050*** Wave 0.163*** 0.163*** 0.160*** Wave*cohort -0.002*** -0.002*** -0.002*** Female -0.185*** Female*cohort -0.185*** Optimal wealth 0.001 Optimal wealth*cohort
0.734***
Intercept 0.238*** 0.274*** 0.212*** Random effects Within-person 0.162*** 0.160*** 0.148*** Intercept -0.013*** -0.013*** -0.013*** Slope 0.005*** 0.005*** 0.005***
Model 2 examines patterns of internet use by men and women separately, and corresponds to the
graph in Figure 2. The coefficient for females is negative and significant, telling us that women are
less likely to be frequent internet users than men. However, the interaction between sex and age
cohort is not significant, which suggests that there are no real differences in the gender patterns
of frequent internet use across age cohorts.
Model 3 considers the relationship between internet use, age cohort and wealth. The wealth
coefficient is positive and significant, demonstrating those who are in the richest two wealth
quintiles are more likely to be frequent internet users, as is reflected in Figure 3. The interaction
between wealth and age cohort, however, is negative, suggesting that the wealth differences in
internet use lessen among older cohorts.
45

7. The relationship between internet use and wellbeing
The final section of the report focuses on six aspects of wellbeing: depression (measured using
CES-D score), quality of life, satisfaction with life, social isolation, loneliness and social
engagement. Details of these wellbeing variables were outlined in the Methods section of the
report. However, in order for easy interpretation of the tables below, it is worth noting that a
negative depression, satisfaction with life, social isolation and loneliness coefficient signifies
beneficial associations between internet use and wellbeing, while beneficial effects on quality of
life and social engagement are signified by positive coefficient values.
Table 32 shows the results of models regressing frequency of internet use on wellbeing. All models
are linear regressions, with the exception of the model of the binary variable of loneliness which is
a logistic regression model. Frequent internet use is defined as those using the internet every day,
almost every day or at least once a week. Non-frequent internet use is defined as using the
internet less than weekly to never. Again, less frequent users are combined with those who report
that they never use the internet due to low numbers. All models control for gender, age, wealth
quintile and self-rated health. Self-rated health is measured using the five-point Likert scale
self-rated health variable described in the Methods section of the report. All models are weighted
using the wave 6 cross-sectional weight.
Base: all wave 6 ELSA respondents
Table 32. Regression of frequent internet use (daily or almost daily) on wellbeing (models control for gender, age, wealth and self-rated health). CES-D -0.07 (0.02)*** Quality of life 0.15 (0.07)* Satisfaction with life 0.10 (0.06) Social isolation -0.03 (0.02) Loneliness 0.81 (0.06)** Social/civic engagement 0.04 (0.01)*
The models presented in Table 32 show those who use the internet frequently see depression
scores 0.07 lower than those who use it infrequently or not at all, and this association is
significant. Frequent internet users also have quality of life scores 0.15 higher than those who do
not use it frequently, and social and civic engagement scores 0.04 higher. However, frequent
internet users have significantly higher loneliness than those who use the internet less frequently,
with a 0.04 difference in scores.
Table 33 presents the results of regression models of reasons for internet use on the six wellbeing
outcomes of interest. Models are specified as in Table 32, controlling for gender, age, wealth and
self-rated health. All models are linear regressions, with the exception of the model of the binary
variable of loneliness which is a logistic regression model. The models are run only on the sample
of individuals who class themselves as frequent internet users which, as in the previous model, are
those who use the internet every day, almost every day or at least once a week. Again, all models
are weighted using the wave 6 cross-sectional weight.
46
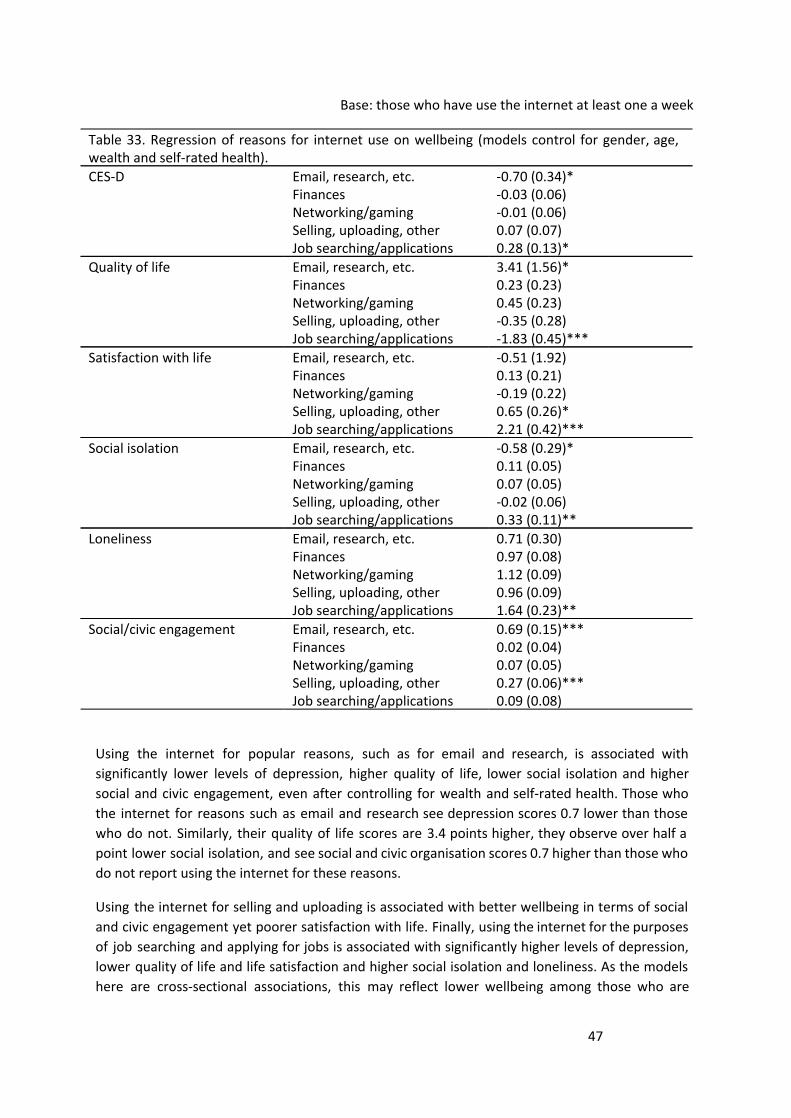
Base: those who have use the internet at least one a week
Table 33. Regression of reasons for internet use on wellbeing (models control for gender, age, wealth and self-rated health). CES-D Email, research, etc. -0.70 (0.34)* Finances -0.03 (0.06) Networking/gaming -0.01 (0.06) Selling, uploading, other 0.07 (0.07) Job searching/applications 0.28 (0.13)* Quality of life Email, research, etc. 3.41 (1.56)* Finances 0.23 (0.23) Networking/gaming 0.45 (0.23) Selling, uploading, other -0.35 (0.28) Job searching/applications -1.83 (0.45)*** Satisfaction with life Email, research, etc. -0.51 (1.92) Finances 0.13 (0.21) Networking/gaming -0.19 (0.22) Selling, uploading, other 0.65 (0.26)* Job searching/applications 2.21 (0.42)*** Social isolation Email, research, etc. -0.58 (0.29)* Finances 0.11 (0.05) Networking/gaming 0.07 (0.05) Selling, uploading, other -0.02 (0.06) Job searching/applications 0.33 (0.11)** Loneliness Email, research, etc. 0.71 (0.30) Finances 0.97 (0.08) Networking/gaming 1.12 (0.09) Selling, uploading, other 0.96 (0.09) Job searching/applications 1.64 (0.23)** Social/civic engagement Email, research, etc. 0.69 (0.15)*** Finances 0.02 (0.04) Networking/gaming 0.07 (0.05) Selling, uploading, other 0.27 (0.06)*** Job searching/applications 0.09 (0.08)
Using the internet for popular reasons, such as for email and research, is associated with
significantly lower levels of depression, higher quality of life, lower social isolation and higher
social and civic engagement, even after controlling for wealth and self-rated health. Those who
the internet for reasons such as email and research see depression scores 0.7 lower than those
who do not. Similarly, their quality of life scores are 3.4 points higher, they observe over half a
point lower social isolation, and see social and civic organisation scores 0.7 higher than those who
do not report using the internet for these reasons.
Using the internet for selling and uploading is associated with better wellbeing in terms of social
and civic engagement yet poorer satisfaction with life. Finally, using the internet for the purposes
of job searching and applying for jobs is associated with significantly higher levels of depression,
lower quality of life and life satisfaction and higher social isolation and loneliness. As the models
here are cross-sectional associations, this may reflect lower wellbeing among those who are
47

unemployed yet would prefer to be working, rather than a specific effect of this particular type of
internet use.
48
Conclusions
It has been well acknowledged that older people use the internet less often than the younger
people, and that interventions designed to increase rates of internet use among older people have
had limited success. The analyses presented within this report provide a useful insight into the
internet behaviours of older people living in England. Previous research into the topic has been
sparse and studies have not been representative of the older English population. However, the
results discussed here complement some previous findings, such as the fact that older women use
the internet less than older men, and that those in poorer social circumstances are less likely to
use the internet than those with better circumstances.
The analyses reported here used ELSA data, which enabled exploration into the internet
behaviours of older people on several levels. ELSA is a large dataset, and is nationally
representative, allowing a substantive analysis of behaviour, rather than the qualitative analyses
that have made up the majority of previous research. Additionally, the ELSA data, particularly at
wave 6 (2012-13), contain a rich set of variables on internet behaviour, allowing us to look at
specific behaviours beyond frequency of use, such as how and where the internet is accessed, as
well as why older people choose to go online. The multidisciplinary nature of ELSA also allows us
to look at these behaviours in relation to a variety of other factors, such as geographical region,
indicators of disability and social disadvantage and various aspects of mental wellbeing. Finally,
the longitudinal nature of ELSA allows us to look at how internet behaviours are changing over
time and as people become older.
In terms of general internet use, this report shows that large differences in frequency of use exist
on the basis of gender, age and wealth. Younger cohorts of older people use the internet far more
frequently than older cohorts, and men of all age groups consistently use the internet more
frequently than women. The analyses also demonstrate those with lower levels of wealth use the
internet less frequently than those with higher levels of wealth, and again, across all levels of
wealth, men are more likely to use the internet frequently than women. The longitudinal analysis
presented showed that internet use among older people increased over time, but uptake of
frequent internet use happened much faster among the more recent cohorts of older people
compared with those in the oldest cohorts. These relationships exist for both men and women,
and are independent of wealth.
The results also showed some regional variations in frequent internet use, with the North East of
England having the lowest proportion of internet users and the south and east of England,
including London, having the highest. Additionally, those living in cities are less likely to be
frequent internet users than those in more rural locations, and people living in areas characterised
by higher deprivation are also less likely to use the internet frequently when compared with those
in less deprived areas. The lower internet use among people living in cities and in areas of
deprivation reflect the initial findings that level of wealth is associated with internet use.
Frequent internet use was more commonly observed among older people without difficulty
accessing services than among those with difficulty accessing one or more services. Again, this
finding is likely to be related to the associations with wealth and internet use, as those
49
experiencing difficulties in accessing services are likely to be in poorer health and poorer social
circumstances. Again, the relationship was the same for both men and women.
Finally, cross-sectional regression analyses, controlling for age, gender, wealth and self-rated
health, showed that frequent internet use was significantly associated with better wellbeing in
terms of lower levels of depression and higher quality of life. However, frequent internet use was
also associated with increased feelings of loneliness.
Some associations were also found between the circumstances of older people and specific
internet behaviours. Almost all internet users access the internet from home, and this finding
persists across all age and wealth groups for both men and women. The second most commonly
reported place of access is the workplace and, as might be expected, this is particularly true
among younger age groups and higher wealth groups, with a noticeable decline in the proportion
using the internet at work for both men and women once State Pension Age is reached. Those in
higher wealth groups are more likely to be employed in sedentary occupations where computer
use is a central part of the job role, compared with those in lower wealth groups who might be
more likely to be working in manual types of employment. There is also a relationship between
higher levels of wealth and accessing the internet while on the move, but, for both men and
women, the proportion of people accessing the internet while on the move decreases rapidly with
age.
The majority of people access the internet with either desktop or laptop computers, but the use of
laptop computers falls with age at a much faster rate than the use of desktop computers. Other
devices for internet use are much less commonly used, but again, when they are, the rate of use
drops quickly as age increases for both men and women. This may be because younger older
people have better access to knowledge of more modern devices to access the internet and
therefore are more likely to access the internet by such means, or that such devices are less
usable as people get older. Older age cohorts might have less knowledge about newer
technologies, perhaps due to longer periods of retirement and a lower dependence on internet
use prior to workforce exit. Mobile devices might also be more difficult to operate for older
individuals in poorer health, such as those with disability limitations or poorer vision.
Among all age and wealth groups, the most commonly reported use of the internet is for activities
such as email and research. All types of activity decrease with age and wealth for both men and
women. Men are noticeably more likely to use the internet for finances than women, but women
are more likely to report using the internet for networking and gaming than men.
The results presented within this report provide a useful insight into the internet behaviour of
older people, an under-researched area. It is commonly acknowledged that older people in
general use the internet less frequently than younger people, but little else is known about how
and why older people use the internet and the impact internet use might have on factors affecting
their wider lives, such as certain aspects of mental wellbeing. The association between internet
use and better wellbeing demonstrates the importance of encouraging older people to use the
internet, and the tables presented in sections 1 to 5 are useful in highlighting the individuals who
are most at risk of being excluded from internet use; those who are the oldest, those who
experience the lowest levels of wealth, in terms of overall wealth and regional characteristics, and
50
those with poorer health or higher rates of disability, demonstrated by means of whether or not
the individual struggles to physically access key services.
While the analyses show internet use is less common among the oldest age groups, and the
longitudinal analysis demonstrates that uptake of frequent internet use over the past ten years
has been lowest and slowest among the oldest age cohorts, it is worth considering that these
groups might have been excluded from internet use at a higher level than more recent cohorts of
older people. The individuals who were already older at wave 1 of the study are likely to have
been retired for some time from occupations, and occupations that were less dependent on
internet use than those engaged in by more recent cohorts, and so may not have been
encouraged to engage in internet use at any point in their lives. As internet use has become
increasingly common across many domains of life, including the workplace, future cohorts of older
people might be more likely to display higher levels of internet use than those participating in this
study. However, the low levels of internet use at older ages point to an important source of social
exclusion as internet access becomes more important for active citizenship.
51
References
Dutton, W. H., Helsper, E. and Gerber, M. (2009), ‘The Internet in Britain: 2009’.
Friemel, T. N. (2014), ‘The digital divide has grown old: Determinants of a digital divide among seniors’, New Media and Society.
Green, M. and Rossal, P. (2013), ‘Digital inclusion evidence review’, Age UK Digital Inclusion Evidence Report.
Helsper, E. J. and Eynon, R. (2010), ‘Digital natives: where is the evidence?’ British Educational Research Journal 36(3), 503–520.
Hill, R., Beynon-Davies, P. and Williams, M. D. (2008), ‘Older people and internet engagement: Acknowledging social moderators of internet adoption, access and use’, Information Technology and People 21(3), 244–266.
Morris, A., Goodman, J. and Brading, H. (2007), ‘Internet use and non-use: Views of older users’, Universal Access in the Information Society 6(1), 43–57.
Office for National Statistics (2014), ‘Internet Access Quarterly Update 2014 Q1’.
Selwyn, N. (2004), ‘The information aged: A qualitative study of older adults’ use of information and communications technology’, Journal of Aging Studies 18(4), 369–384.
Sourbati, M. (2009), ‘It could be useful but not for me at the moment: Older people, internet access and e-public service provision’, New Media and Society
Steptoe, A., Breeze, E., Banks, J. and Nazroo, J. (2013) ‘Cohort Profile: The English Longitudinal Study of Ageing (ELSA)’, International Journal of Epidemiology, 42, 1640-1648
Wei, L. (2012), ‘Number matters: The multimodality of internet use as an indicator of the digital inequalities’, Journal of Computer-Mediated Communication 17(3), 303–318.
52