Embed Size (px)
Citation preview

May 2018:Tech Media Telecom Pulse Survey
© 2018 HarrisX. All Rights Reserved.

© 2018 HarrisX. All rights reserved. 2
About the May 2018 TMT Pulse
HarrisX conducted an online survey of 2,000 U.S. Adults 18+ from May 4-5, 2018 asking their opinions about the announced merger between T-Mobile and Sprint as well as new technologies like 5G.
Additionally, HarrisX conducted oversamples of Sprint customers (to reach a total of n=539) and T-Mobile customers (to reach a total of n=532) for more in-depth analysis of both groups’ reactions to the merger.
This survey was fielded during the same week the T-Mobile & Sprint merger was announced. The results reflect a nationally representative sample.
Results were weighted for age within gender, region, race/ethnicity, income, and wireless carrier where necessary to align them with their actual proportions in the population.
Survey Methodology:

© 2018 HarrisX. All rights reserved. 3
About the Mobile Insights Survey & Passion Groups Studies
Mobile Insights Survey is conducted monthly among 30,000 smartphone owners, and is the largest U.S. tracker of consumer attitudes behavior for wireless services and mobile devices. Data is weighted monthly to be nationally representative of the 13+ US population. The sample is weighted by various demographic factors (age, gender, household size, annual income, marital status, race/ethnicity) as well as wireless carrier. Weights are produced on a national and market level for 103 markets.
Passion Groups Study was conducted online between February 9-12, 2018, among 2,517 adult (18+) U.S. consumers.
Results were weighted for age within gender, region, race/ethnicity, income, and wireless carrier where necessary to align them with their actual proportions in the population. Survey included an oversample of recent and likely carrier switchers.
Slides 6-8 contain information from two our syndicated HarrisX Mobile Insights Survey and the bi-annual HarrisX Passion Groups Study.

© 2018 HarrisX. All rights reserved. 4
A. Regulatory Concerns

© 2018 HarrisX. All rights reserved. 5
Highlights: Regulatory Concerns
Only 17% of incoming new subscribers to T-Mobile and to Sprint came from the other company.
T-Mobile & Sprint primarily compete with the rest of the industry rather than one another1
But a majority of consumers do not feel the same way about ISPs and Cable.
Consumers say they have a lot of choice in selecting wireless services and devices3
Only 4% of past year’s switchers have moved between T-Mobile and Sprint.
Movements bet. T-Mobile & Sprint are a very small proportion of the industry’s switching dynamic2
Small pluralities not concerned about consolidation in telecom, media, and technology industries, separately considered.
Consumers are uncertain whether to be concerned about consolidation in the TMT space 4
Includes the consumers of over half of the four major wireless carriers and strong majorities of cable providers, DISH consumers being the only exception.
Majority of consumers are open to purchasing wireless services from a cable provider5
Bundled services, lower cost on devices, and better network follow, supported by half of consumers
Lower pricing makes consumers most likely to consider purchasing wireless from a cable provider6

© 2018 HarrisX. All rights reserved. 6
28%
24%
17%
19%
12%
Carrier 1 Carrier 2 Sprint
Big 4 Prepaid Other
21%
28%
17%
18%
17%
Carrier 1 Carrier 2 T-Mobile
Big 4 Prepaid Other
T-Mobile and Sprint each contribute only 17% of incoming new subscribers to one another
Traffic Source of Current T-Mobile subscribers Subscribers who switched to T-Mobile from another Carrier in the Past year
Q1 2017 – Q1 2018 Average
Traffic Source of Current Sprint subscribers Subscribers who switched to Sprint from another Carrier in the Past year
Q1 2017 – Q1 2018 Average
Source: HarrisX Mobile Insights, Q1 2017 – Q1 2018

© 2018 HarrisX. All rights reserved. 7
1%
2%
4%
Current T-Mobileintending to Switch
to Sprint
Current Sprintintending to Switch
to T-Mobile
Total of eitherdirection
2%
3%
4%
From T-Mobile toSprint
From Sprint to T-Mobile
Total of eitherdirection
Movements between T-Mobile and Sprint account for a very small proportion of the industry’s switching dynamic
Proportion of T-Mobile-Sprint Movements among All Prospective Switchers
All Subscribers Likely to Switch Carriers in the Next YearQ1 2017 – Q1 2018 Average
Proportion of T-Mobile-Sprint Movements among All Past Year Switchers
All Subscribers Switched Carriers in the Past YearQ1 2017 – Q1 2018 Average
Source: HarrisX Mobile Insights Survey, Q1 2017 – Q1 2018

© 2018 HarrisX. All rights reserved. 8
44% 56%
Likelihood to consider wireless brands:
Majority of Sprint subscribers are a flight risk and likely to consider other carriers, primarily Verizon
Only 44% of Sprint’s subscribers are favorable towards the brand and are
unlikely to switch…
While 56% are at risk of leaving Sprint or are unfavorable towards the brand
51% 48% 40% 38%
Source: HarrisX Passion Groups Study. This survey was conducted among 2,500 respondents in the United States in early February 2018. The survey audience targeted “switchers” (recent plan or carrier switchers or likely carrier switchers in the next year).

© 2018 HarrisX. All rights reserved. 9
59%50%
29% 28%
25%
24%
20% 19%
16%26%
51% 53%
Smartphone manufacturers Wireless services providers Internet service providers Cable service providers
Perceived amount of choice when shopping for…A lot of choice Right amount of choice Not enough choice
Majority say that they have a lot of choice in selecting wireless services and smartphone manufacturers; majority do not feel the same way about ISPs and Cable
BASE: All respondents (n=2,000)GP3. How much choice do you feel you have when it comes to shopping for your …?
© 2018 HarrisX. All rights reserved. 10
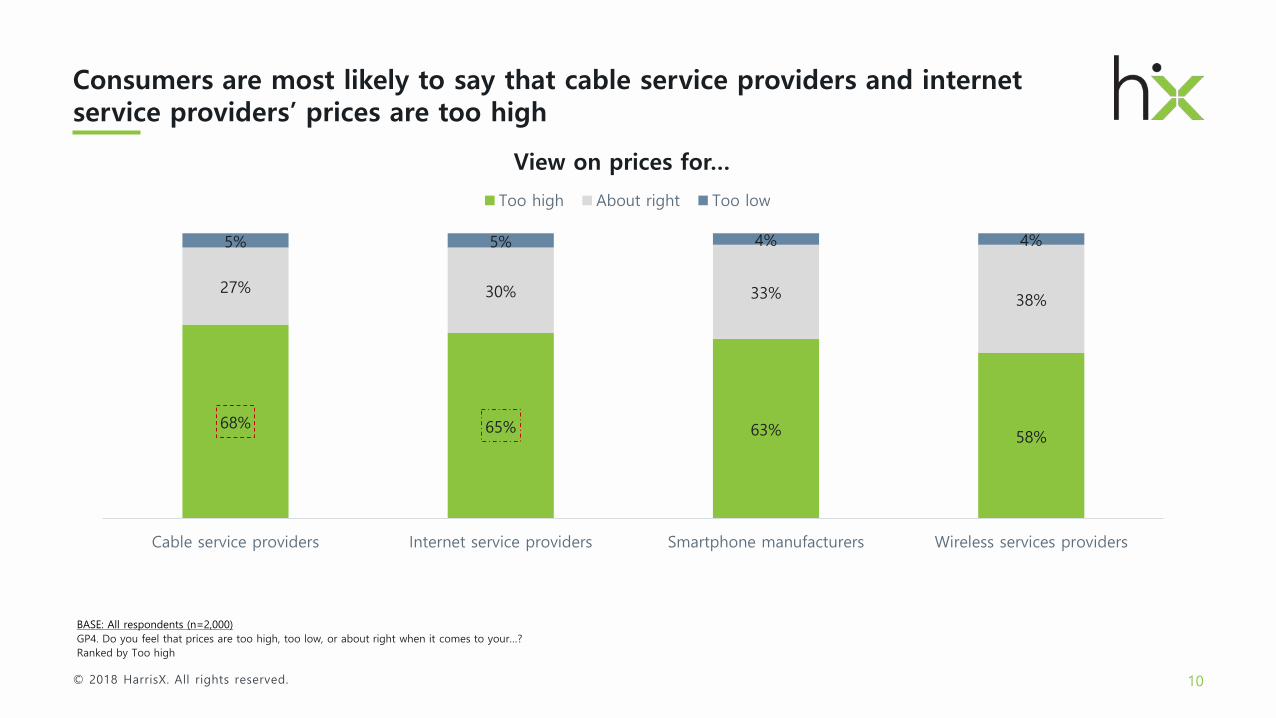
68% 65% 63% 58%
27% 30% 33% 38%
5% 5% 4% 4%
Cable service providers Internet service providers Smartphone manufacturers Wireless services providers
View on prices for…
Too high About right Too low
Consumers are most likely to say that cable service providers and internet service providers’ prices are too high
BASE: All respondents (n=2,000)GP4. Do you feel that prices are too high, too low, or about right when it comes to your…?Ranked by Too high

© 2018 HarrisX. All rights reserved. 11
43% 42% 41% 40% 37% 37%
16% 15% 17% 16% 18% 17%
40% 44% 42% 44% 45% 46%
Telecom, Media, andTechnology companies
(i.e. AT&T acquiring TimeWarner Inc. or Verizonacquiring Yahoo, etc.)
Telecommunicationscompanies (i.e. Verizon, T-
Mobile, etc.)
Financial servicescompanies
Media companies Technology companies Airlines
Concern about consolidation of…Concerned Don’t know/Unsure Not concerned
Consumers are split on whether to be concerned or not about consolidation in the TMT and telecom space
BASE: All respondents (n=2,000)GP6B. Are you concerned or not concerned about consolidation amongst the following types of companies?Ranked by Concerned

© 2018 HarrisX. All rights reserved. 12
55% 59% 61% 57% 57%46%
74% 72%60% 57% 55%
43%
45% 41% 39% 43% 43%54%
26% 28%40% 43% 45%
57%
Total Verizon AT&T T-Mobile Sprint OtherCarriers
Verizon(Fios)
AT&T (U-verse)
Comcast(Xfinity)
DirecTV Spectrum Dish
Would you consider purchasing wireless service from your cable provider?
Yes No
Majority of consumers are open to purchasing wireless services from a cable provider
BASE: All respondents (n=2,000)SB9. Would you consider purchasing wireless service from your cable provider?Ranked by Yes
Wireless Providers Cable Providers

© 2018 HarrisX. All rights reserved. 13
63%
51% 50% 50%
31% 29%
22%
1%
Lower pricing onwireless plan
Bundled services Lower pricing onnew wireless
devices
Quality of thenetwork
More attractiveupgrade program
More flexibleservice contract
More attractivefinance program
Other
Factors that would make you consider purchasing wireless service from cable provider
Lower pricing on a wireless plan would make consumers most likely to consider purchasing wireless service from a cable provider
BASE: Respondents who would consider purchasing wireless service from their cable provider (n=1,055)SB10 What are the factors that would make you consider purchasing wireless service from a cable provider? Please select all that apply.Ranked by Total

© 2018 HarrisX. All rights reserved. 14
B. T-Mobile and Sprint Merger
© 2018 HarrisX. All rights reserved. 15
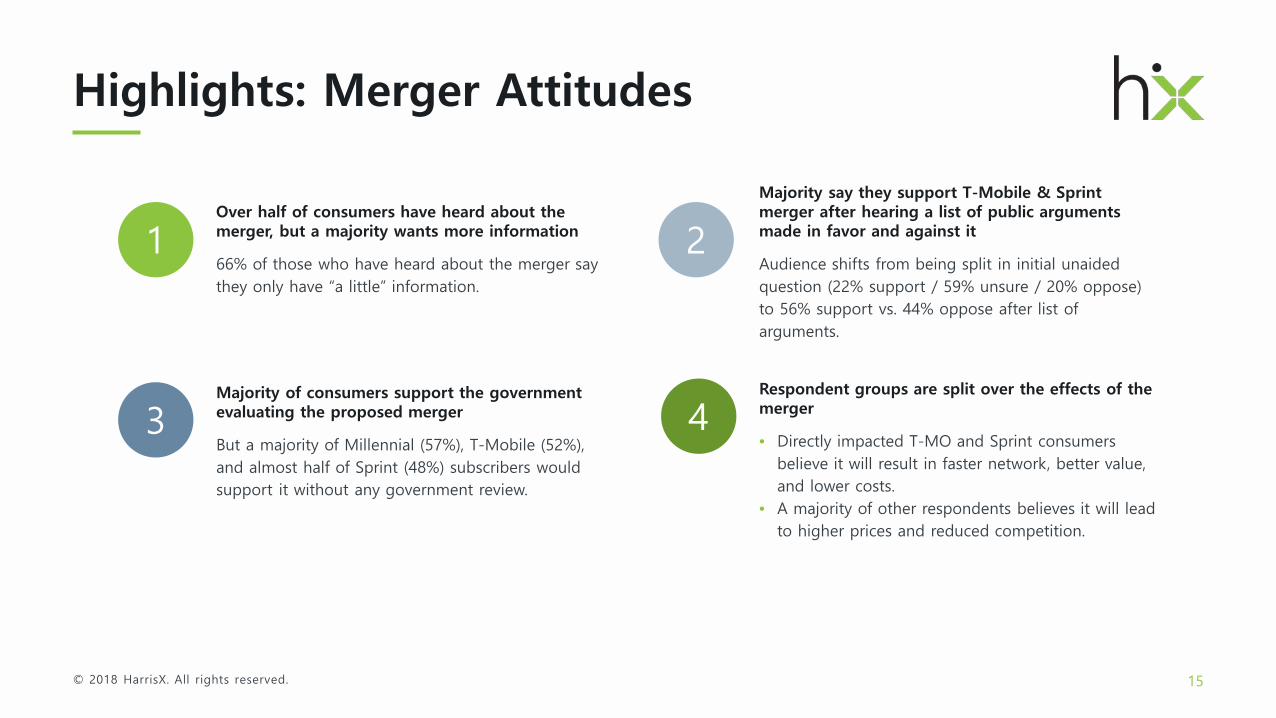
Highlights: Merger Attitudes
Audience shifts from being split in initial unaided question (22% support / 59% unsure / 20% oppose) to 56% support vs. 44% oppose after list of arguments.
Majority say they support T-Mobile & Sprint merger after hearing a list of public arguments made in favor and against it1
But a majority of Millennial (57%), T-Mobile (52%), and almost half of Sprint (48%) subscribers would support it without any government review.
Majority of consumers support the government evaluating the proposed merger3
66% of those who have heard about the merger say they only have “a little” information.
Over half of consumers have heard about the merger, but a majority wants more information 2
• Directly impacted T-MO and Sprint consumers believe it will result in faster network, better value, and lower costs.
• A majority of other respondents believes it will lead to higher prices and reduced competition.
Respondent groups are split over the effects of the merger4
© 2018 HarrisX. All rights reserved. 16
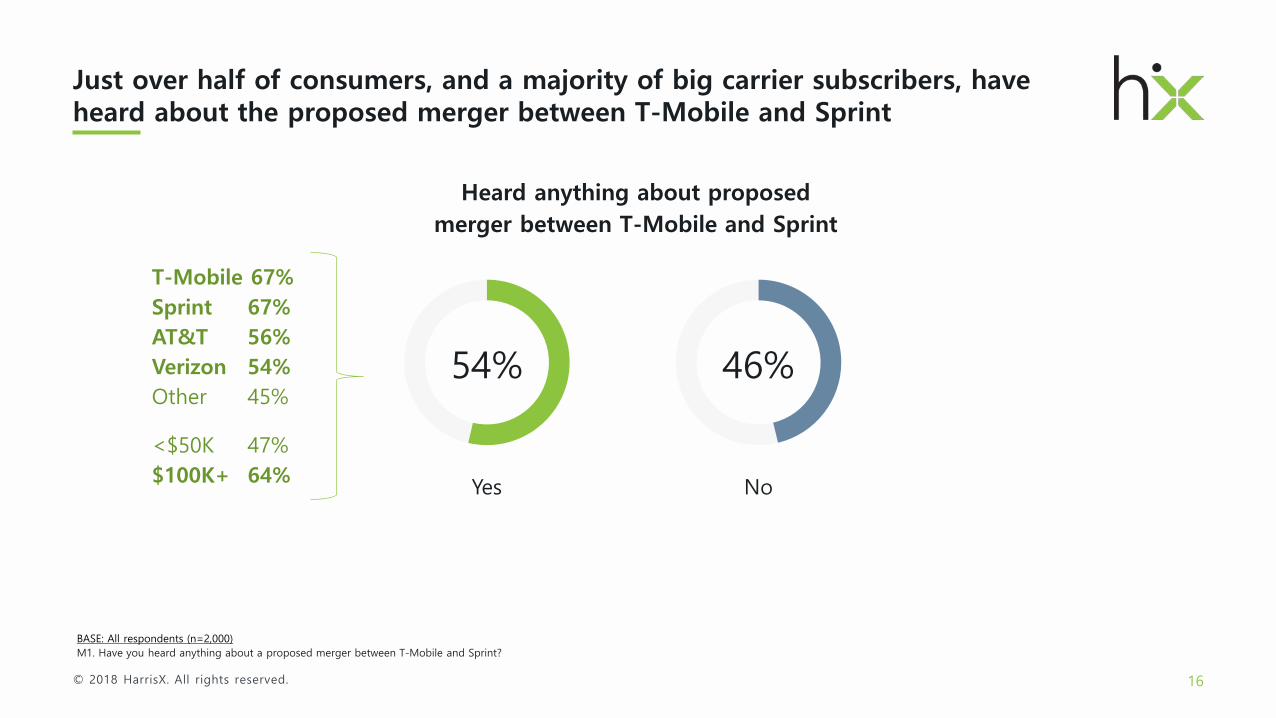
Just over half of consumers, and a majority of big carrier subscribers, have heard about the proposed merger between T-Mobile and Sprint
BASE: All respondents (n=2,000)M1. Have you heard anything about a proposed merger between T-Mobile and Sprint?
54% 46%
Heard anything about proposed merger between T-Mobile and Sprint
Yes No
T-Mobile 67%Sprint 67%AT&T 56%Verizon 54%Other 45%
<$50K 47%$100K+ 64%

© 2018 HarrisX. All rights reserved. 17
Nearly two-thirds of consumers that have heard of the merger say they have only “a little” information about it
BASE: Respondents who have heard of the proposed merger (n=1,080)M2. How much information do you feel you have about the proposed merger between T-Mobile and Sprint?
11% 24%
A lot Enough
65%
A little
Amount of information you have about the proposed merger

© 2018 HarrisX. All rights reserved. 18
A majority of respondents are waiting to learn more about the merger before taking a stand on the merger
BASE: All respondents (n=2,000)M3 Have you formed an opinion on whether you support or oppose the proposed merger?
22% 59%
Support Waiting to learn more to
decide
20%
Oppose
Opinion about the proposed merger

© 2018 HarrisX. All rights reserved. 19
After hearing a list of public arguments for and against the merger a majority of consumers say they support the merger
BASE: All respondents (n=2,000)M5 If all of the above effects were true, would you support or oppose the proposed merger between T-Mobile and Sprint?
56% 44%
Support Oppose
22% 59%
Support Waiting to learn more to
decide
20%
Oppose
Initial / unaidedsupport for
merger
Support for merger after hearing all possible effects
T-Mobile 68%Sprint 60%Verizon 60%AT&T 57%Other 48%
<$50K 50%$100K+ 66%

© 2018 HarrisX. All rights reserved. 20
Possible effects from T-Mobile/Sprint Merger (Positive) Much more likely to support
Somewhat more likely to support
Neutral/No effect
Somewhat less likely to support
Much less likely to support
Delivers better services and lower prices to consumers across all parts of the US 27 30 33 5 4
Generates economic growth in the United States 24 32 37 4 3
Creates new reach for wireless and online services into rural communities 22 33 38 5 3
Creates more new jobs than T-Mobile and Sprint currently have 21 33 38 5 3
Provides enhanced customer service 21 32 39 5 4
Invests over $40 billion dollars in the next 3 years in the US 19 30 41 5 5
Ensures America leads the way in a rapidly changing digital era by accelerating America's leadership in 5G technology 18 29 45 4 4
Quickly and broadly deploys a nationwide 5G network 18 28 46 5 3
Triggers new investment into the United States wireless and digital infrastructure 17 31 44 5 3
Creates robust competition among wireless carriers by evening the playing field 16 29 43 7 5
Spurs competition in adjacent industries including wireless, broadband, media and technology 14 29 44 7 5
Messaging around better services, jobs, growth, and investments make respondents much more likely to support the merger
BASE: All respondents (n=2,000)M4 Please indicate if the following possible effects from the T-Mobile and Sprint merger would make you more or less likely to support it?; Ranked by Much more likely to support
Consumers were run through a randomized series of positive and negative arguments towards the merger that have been made in public.

© 2018 HarrisX. All rights reserved. 21
Possible effects from T-Mobile/Sprint Merger (Negative) Much more likely to support
Somewhat more likely to support
Neutral/No effect
Somewhat less likely to support
Much less likely to support
Increase consumer prices 9 10 28 19 34
Costs consumers millions of dollars a year through less choice and higher prices 8 11 31 17 34
Harms in particular lower income families dependent on cheaper plans 7 12 36 18 27
Creates a powerful force in the wireless industry that will be owned primarily by foreign entities 8 14 39 17 22
Decreases the availability of offers and promotions in the market 8 10 36 24 21
Makes it harder for new competitors to enter the market 8 13 39 22 19
Stifles competition amongst low cost carriers 8 14 40 19 19
Harms competition by taking away one of the wireless carriers 8 12 42 20 18
Stifles innovation amongst low cost carriers 9 14 39 20 18
Leads to short term job cuts triggered by the consolidation of the two companies 8 13 41 22 15
Messages around increases in pricing and harm to lower income families make respondents much less likely to support the merger
BASE: All respondents (n=2,000)M4 Please indicate if the following possible effects from the T-Mobile and Sprint merger would make you more or less likely to support it?; Ranked by Much less likely to support
Consumers were run through a randomized series of positive and negative arguments towards the merger that have been made in public.

© 2018 HarrisX. All rights reserved. 22
A majority of consumers support the government evaluating the proposed merger
BASE: All respondents (n=2,000)M6. Which is closer to your view?
Views on government involvement on the merger
If the shareholders of T-Mobile and Sprint want to merge and believe a combined
entity creates value they should be allowed to do so without interference by the United
States government
The United States government needs to evaluate the merits of the merger by
looking at other issues besides shareholder value such as competition and impacts on
consumers and pricing
44% 56%
T-Mobile 52%Sprint 48%Verizon 45%AT&T 44%Other 35%
18-34 57%65+ 30%
But a majority of Millennials (57%), T-Mobile (52%) almost half of Sprint subscribers (48%) would support it without intervention.

© 2018 HarrisX. All rights reserved. 23
Respondent groups are split over the effects of the merger
BASE: All respondents (n=2,000)M8. In your view will the new merger primarily result in ...
Will the merger result in…
A faster more reliable network that offers lower prices and
better values to its customers
Higher prices for customers because of reduced
competition in the market
44% 56%
Other 65% AT&T 56% Verizon 54%Sprint 45% T-Mobile 43%
T-Mobile 57%Sprint 55%Verizon 46% AT&T 44%Other 35%
18-34 56%65+ 32%
<$50K 40%$100K+ 53%
Directly impacted T-MO and Sprint consumers believe it will result in a faster network, better value and lower costs. A majority of other respondents believes it will lead to higher prices and reduced competition.

© 2018 HarrisX. All rights reserved. 24
C. 5G
© 2018 HarrisX. All rights reserved. 25
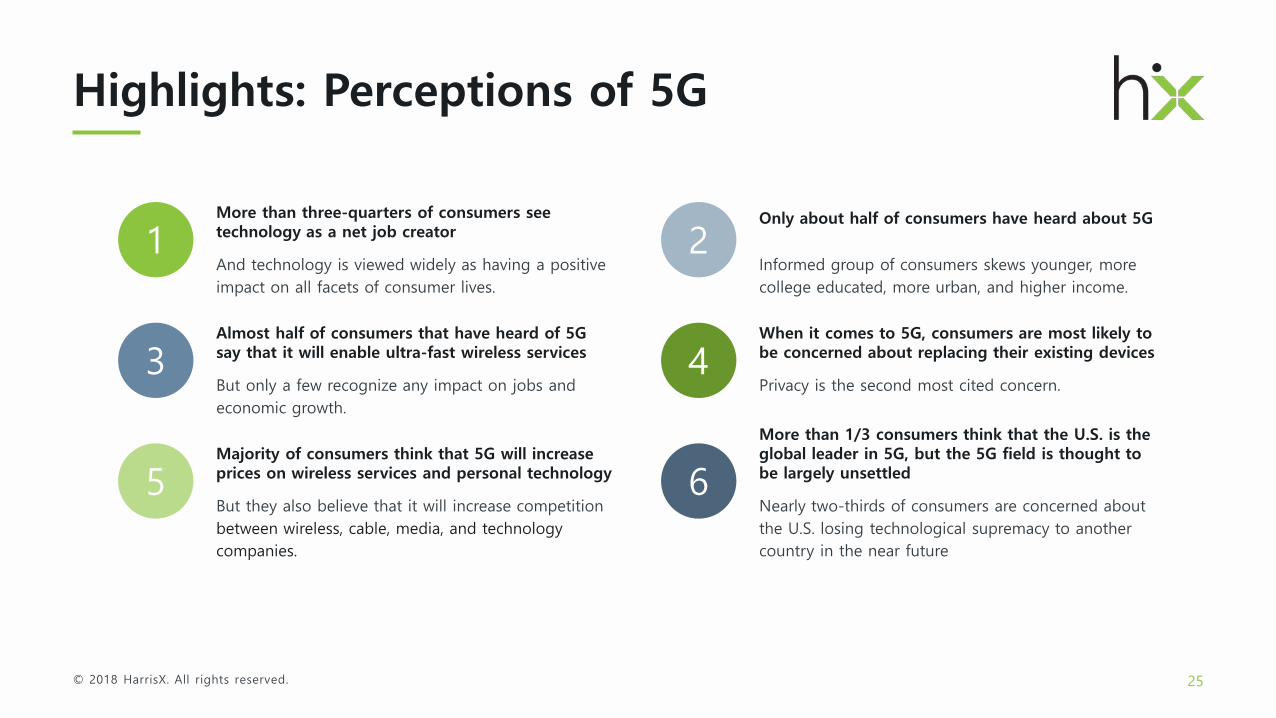
Highlights: Perceptions of 5G
And technology is viewed widely as having a positive impact on all facets of consumer lives.
More than three-quarters of consumers see technology as a net job creator1
But only a few recognize any impact on jobs and economic growth.
Almost half of consumers that have heard of 5G say that it will enable ultra-fast wireless services3
Informed group of consumers skews younger, more college educated, more urban, and higher income.
Only about half of consumers have heard about 5G
2
Privacy is the second most cited concern.
When it comes to 5G, consumers are most likely to be concerned about replacing their existing devices4
But they also believe that it will increase competition between wireless, cable, media, and technology companies.
Majority of consumers think that 5G will increase prices on wireless services and personal technology5
Nearly two-thirds of consumers are concerned about the U.S. losing technological supremacy to another country in the near future
More than 1/3 consumers think that the U.S. is the global leader in 5G, but the 5G field is thought to be largely unsettled6

© 2018 HarrisX. All rights reserved. 26
85% 83% 83% 83% 82% 80% 79% 79%69% 67%
15% 17% 17% 17% 18% 20% 21% 21%31% 33%
Education Personal life Career Prospects forthe future
Jobopportunities
World Finances Community Society Children
Effect of technology on…Positive Negative
Technology is viewed widely as having a positive impact on all facets of consumer lives
BASE: All respondents (n=2,000)GP5. Has technology had a positive or negative impact on your…?Ranked by Positive

© 2018 HarrisX. All rights reserved. 27
More than three-quarters of consumers see technology as a net job creator
BASE: All respondents (n=2,000)GP6A. Do you view technology as a net job creator or net job destroyer?
77% 23%
View of technology’s effect on jobs
Job creator Job destroyer

© 2018 HarrisX. All rights reserved. 28
Only about half of consumers have heard about 5G – which skews younger, more college educated, more urban, and higher income
BASE: All respondents (n=2,000)GP7. Have you heard or not heard about a new technology named “5G”?
49% 51%
Awareness of 5G
Heard Not heard
18-34 57%65+ 42%
<College 42%College+ 55%
Urban 56%Suburb 48%Rural 38%
<$50K 41%$100K+ 57%

© 2018 HarrisX. All rights reserved. 29
48%
33% 31%27%
24%
15% 14% 14% 14% 12% 11% 10% 10% 8%
1% 3%
19%
Ultra-FastWireless Service
Better onlineservices
Ultra-ReliableWireless Service
EnhancedMobile Video
Internet ofThings
Driverless Cars Job Creation Machine toMachine
Communication
EconomicGrowth
Cheaperwireless cableand internet
services
Price decreasesfor services
Robots Cheaperpersonal
technology andhardware
SocialDisruption
Other None of theabove
Unsure/Don'tKnow
Which of the following changes will 5G enable?
Almost half of consumers that have heard of 5G say that it will enable ultra-fast wireless services, but few realize jobs and economic growth impact
BASE: Respondents who have heard of 5G (n=956)GP8. In your opinion which of the following changes will “5G” enable? Please select all that apply.Ranked by Total

© 2018 HarrisX. All rights reserved. 30
28%25% 24% 24% 23% 22%
19%
15%
2%
26%
I will have toreplace my
existing devices
Privacyinfringement
Amount ofinvestmentneeded in
order to build5G
infrastructure
It will only lasta few years
before havingto be replaced
Governmentinvolvement indeveloping 5Ginfrastructure
Susceptible tocybersecurity
attacks
It will lead to amonopolywithin thetechnology
industry
Concerns aboutradiation
Other None of theabove
Concerns relating to 5G
When it comes to 5G, consumers are most likely to be concerned about replacing their existing devices
BASE: Respondents who have heard of 5G (n=956)GP8A. Which of the following, if any, are you concerned about related to 5G? Please select all that apply. Ranked by Total

© 2018 HarrisX. All rights reserved. 31
A wide majority of consumers think that 5G will increase prices on wireless services and personal technology, but will also increase competition
BASE: Respondents who have heard of 5G (n=956)GP9. Do you think “5G” will increase or decrease prices for wireless, cable, and internet services?GP10. Do you think “5G” will increase or decrease competition between wireless, cable, media, and technology companies?GP11. Do you think “5G” will increase or decrease prices for personal technology and hardware?
90% 10%
5G: Effect on prices for wireless cable and internet services
Increase Decrease
87% 13%
5G: Effect on prices for personal technology and hardware
Increase Decrease
78% 22%
5G: Effect on competition between wireless, cable, media, and technology
companies
Increase Decrease

© 2018 HarrisX. All rights reserved. 32
35%
16%
11%
4%2% 2% 1%
29%
United States China Japan South Korea European Union Russia Other No one
Global leader in 5G
More than one-in-three consumers think that the U.S. is the global leader in 5G, but the 5G field is still thought to be largely unsettled
BASE: All respondents (n=2,000)GP12. Who do you think is the global leader in “5G”? Ranked by Total

© 2018 HarrisX. All rights reserved. 33
25%
37%
28%
9%
Concern about U.S. losing technological supremacy
Very concerned Concerned Not concerned Not concerned at all
Nearly two-thirds of consumers are concerned about the U.S. losing technological supremacy to another country in the near future
BASE: All respondents (n=2,000)GP13. How concerned are you about the United States losing technological supremacy to another country in the near future?
62%

© 2018 HarrisX. All rights reserved. 34
D. Industry Perceptions

© 2018 HarrisX. All rights reserved. 35
Highlights: Industry Perceptions
T-Mobile and Sprint customers say that price is the most satisfying element of their wireless service provider, while Verizon and AT&T cite reliability.
Verizon and T-Mobile are tied in customer satisfaction and lead the pack1
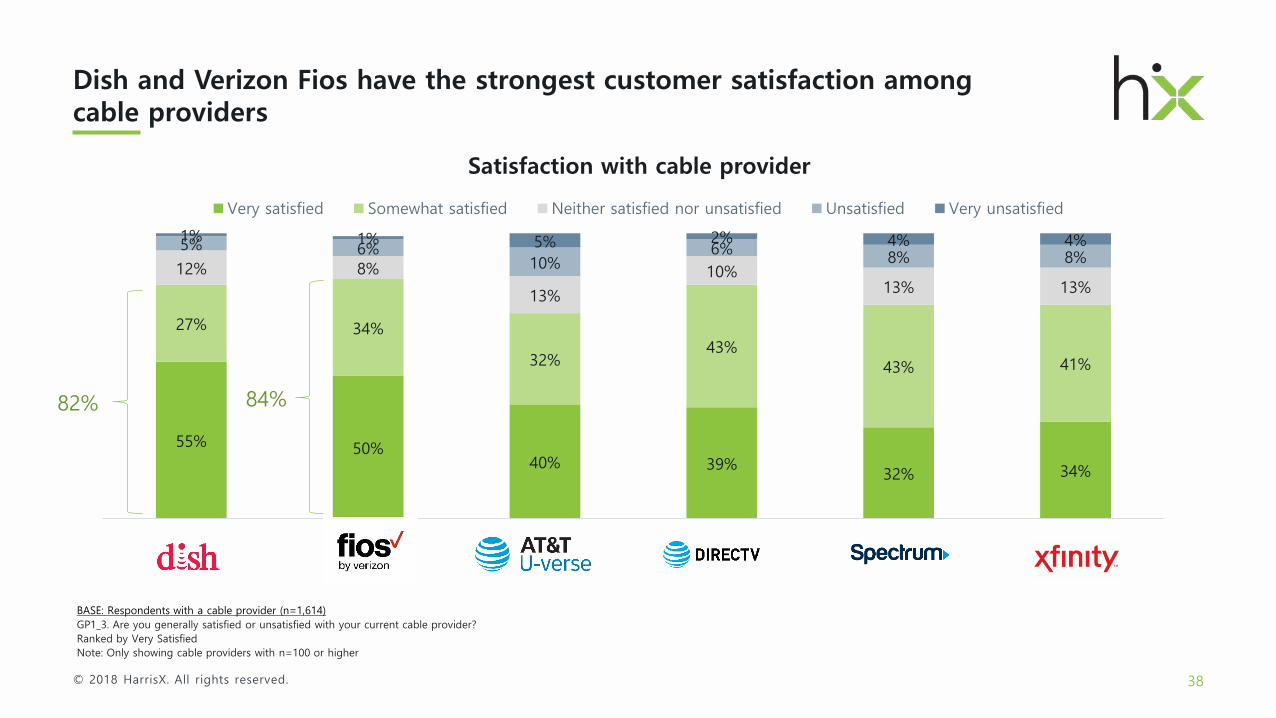
Spectrum and Comcast Xfinity TV customers cite reliability as particularly satisfying, while AT&T U-verse and Dish customers cite price.
Dish and Verizon Fios have the strongest customer satisfaction among cable providers3
Among ISP providers, AT&T customers are the most likely to cite price as the most satisfying element, while Time Warner customers cite network coverage.
Verizon leads other ISPs in customer satisfaction
2
Privacy is the second most cited concern.
Samsung has the highest satisfaction rates among smartphone users4
T-Mobile and Sprint customers are most likely to cite network coverage as the most unsatisfying element of their service
Price, network quality and service quality are the most unsatisfying elements of wireless services 5
• ISPs: Comcast Xfinity and Verizon Fios customers are most likely to cite price as the most unsatisfying element of their service
• Cable: Comcast and Charter ISP customers are most likely to cite price as the most unsatisfying element of their service
Price and customer service are cited as the most unsatisfying elements for Cable and ISPs6

© 2018 HarrisX. All rights reserved. 36
52%44% 42% 41%
33%40% 40% 38%
7% 9% 8% 11%
5% 6% 6% 6%3% 1% 4% 4%
Satisfaction with wireless services provider
Very satisfied Somewhat satisfied Neither satisfied nor unsatisfied Unsatisfied Very unsatisfied
85%
Of the four major carriers, Verizon and T-Mobile customers are tied in customer satisfaction and lead the pack
BASE: Respondents with a wireless services provider (n=2,553)GP1_1. Are you generally satisfied or unsatisfied with your current wireless service provider?Ranked by Very Satisfied
79%84% 82%

© 2018 HarrisX. All rights reserved. 37
50%41% 39% 39% 38%
35%39% 37% 36% 40%
9%11%
11% 13% 11%
6% 7% 10% 8% 7%3% 3% 4% 4%
Satisfaction with internet services provider
Very satisfied Somewhat satisfied Neither satisfied nor unsatisfied Unsatisfied Very unsatisfied
Verizon leads other ISPs in customer satisfaction
BASE: Respondents with an internet services provider (n=1,906)GP1_2. Are you generally satisfied or unsatisfied with your current internet services provider?Ranked by Very SatisfiedNote: Only showing internet service providers with n=100 or higher
85%
© 2018 HarrisX. All rights reserved. 38
55% 50%40% 39%
32% 34%
27% 34%
32%43%
43% 41%
12% 8%
13%
10%13% 13%
5% 6%10%
6% 8% 8%1% 1% 5% 2% 4% 4%
Satisfaction with cable provider
Very satisfied Somewhat satisfied Neither satisfied nor unsatisfied Unsatisfied Very unsatisfied
Dish and Verizon Fios have the strongest customer satisfaction among cable providers
BASE: Respondents with a cable provider (n=1,614)GP1_3. Are you generally satisfied or unsatisfied with your current cable provider?Ranked by Very SatisfiedNote: Only showing cable providers with n=100 or higher
82% 84%

© 2018 HarrisX. All rights reserved. 39
45%38% 34%
29% 41%40%
10%12%
13%
12%6% 9%
3% 3% 4%
Satisfaction with smartphone manufacturer
Very satisfied Somewhat satisfied Neither satisfied nor unsatisfied Unsatisfied Very unsatisfied
Samsung has the highest satisfaction rates among smartphone users
BASE: Respondents that own a smartphone (n=1,781)GP1_4. Are you generally satisfied or unsatisfied with your current cable provider?Ranked by Very SatisfiedNote: Only showing smartphone manufacturers with n=100 or higher
74% 79% 74%
© 2018 HarrisX. All rights reserved. 40
30%
18% 17%15%
9%
3% 3%1% 1% 1%
28%
20%
11%
14%
10%
5% 6%
1%3%
1%
18%
36%
8%
14%
9%
5% 4% 4%1% 1%
17%
29%
8%
15%
5%8% 7%
3% 3% 2%
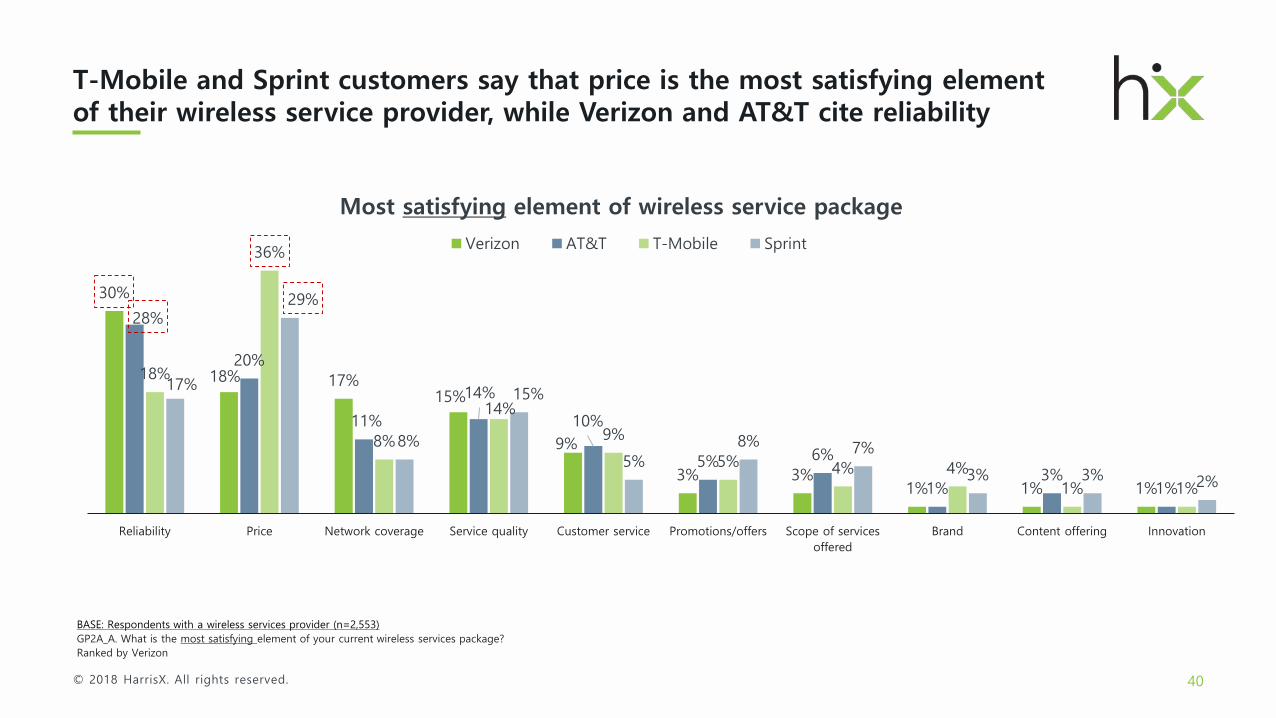
Reliability Price Network coverage Service quality Customer service Promotions/offers Scope of servicesoffered
Brand Content offering Innovation
Most satisfying element of wireless service package
Verizon AT&T T-Mobile Sprint
T-Mobile and Sprint customers say that price is the most satisfying element of their wireless service provider, while Verizon and AT&T cite reliability
BASE: Respondents with a wireless services provider (n=2,553)GP2A_A. What is the most satisfying element of your current wireless services package? Ranked by Verizon

© 2018 HarrisX. All rights reserved. 41
35%
20%18%
6% 6% 5%3% 2% 1% 1%
27%
13%
30%
5% 5%6%
5%2% 2% 1%
29%
10%
16% 15%
5%5%
8%5% 3%
0%
32%
16%
17%
4%6% 8%
12%
2%0% 1%
33%
9%
21%
6%3%
9%6% 7%
0%2%
Reliability Service quality Price Network coverage Scope of servicesoffered
Customer service Promotions/offers Content offering Brand Innovation
Most satisfying element of internet service packageComcast AT&T Time Warner Verizon Charter
Among ISP providers, AT&T customers are the most likely to cite price as the most satisfying element, while Time Warner customers cite network coverage
BASE: Respondents with an internet services provider (n=1,906)GP2A_B. What is the most satisfying element of your current internet service package?Ranked by Comcast
© 2018 HarrisX. All rights reserved. 42
24%
20%
14%11%
8% 7%5% 4% 2%
1%
12% 12%
29%
10% 8%
6%
10%
6%
2% 2%
18%
14%
19%
11%
7%
11%
3%
10%
2%
1%
29%
18%15%
4% 4% 4%
12%
5% 5%
0%
16% 15%
22%
14%
8%4% 8%
8%
1% 1%
16%19%
25%
9%10%
5% 3%
7%
1% 3%
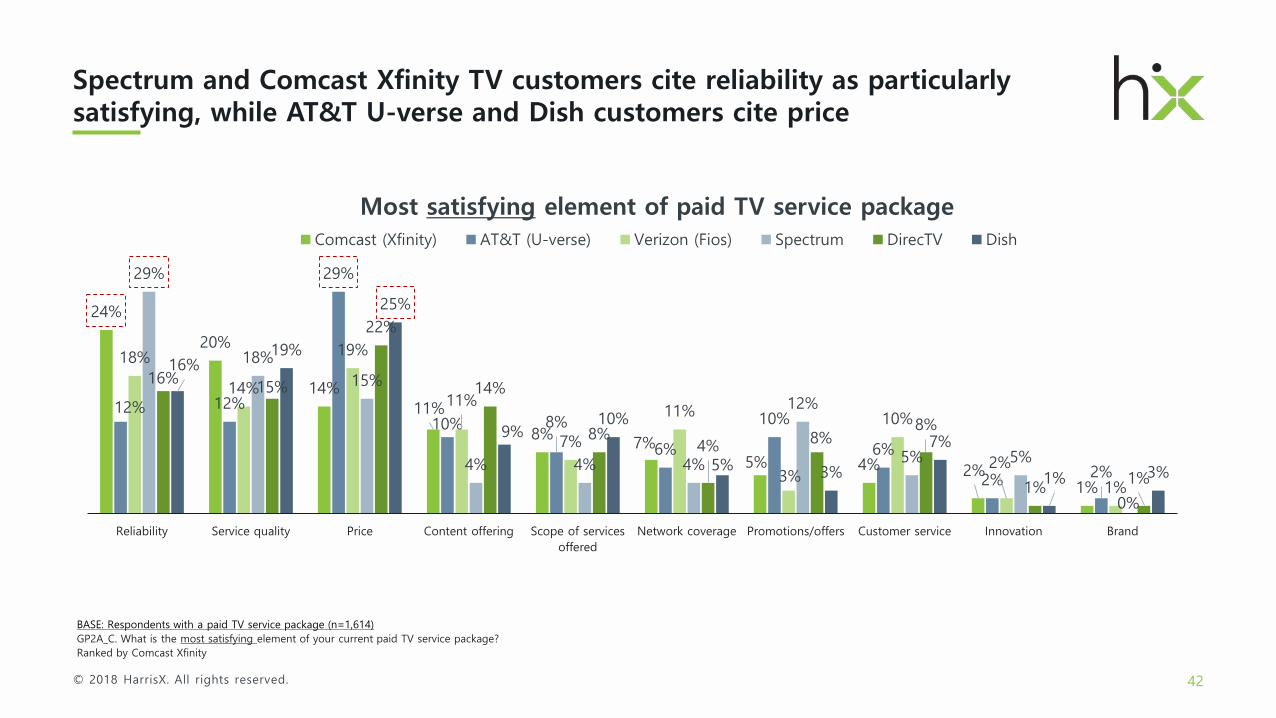
Reliability Service quality Price Content offering Scope of servicesoffered
Network coverage Promotions/offers Customer service Innovation Brand
Most satisfying element of paid TV service packageComcast (Xfinity) AT&T (U-verse) Verizon (Fios) Spectrum DirecTV Dish
Spectrum and Comcast Xfinity TV customers cite reliability as particularly satisfying, while AT&T U-verse and Dish customers cite price
BASE: Respondents with a paid TV service package (n=1,614)GP2A_C. What is the most satisfying element of your current paid TV service package?Ranked by Comcast Xfinity
© 2018 HarrisX. All rights reserved. 43
43%
10%8%
6% 5%5% 5% 4%
4%
2%
40%
9% 8%10%
5%9%
3%6%
4%1%
24%
7%
14%
8%6%
11%
5%
14%
3%2%
37%
9%7% 6% 6% 9%
2%
13%
3%1%
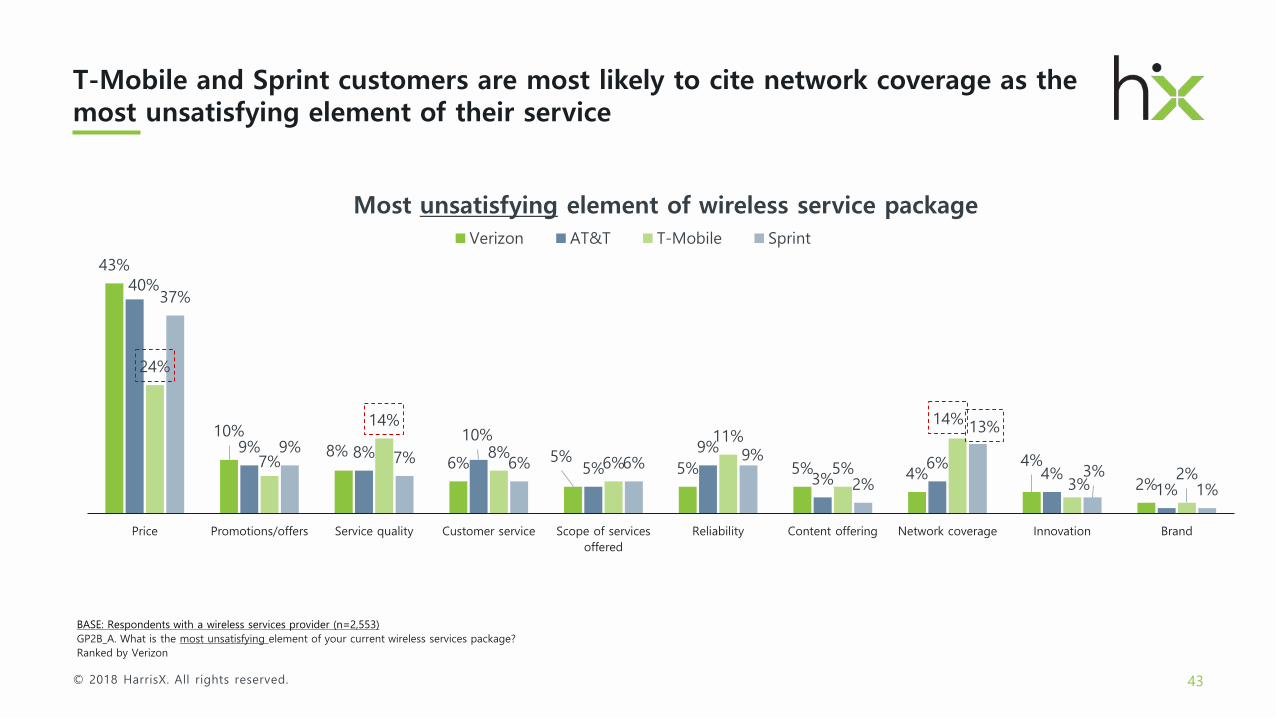
Price Promotions/offers Service quality Customer service Scope of servicesoffered
Reliability Content offering Network coverage Innovation Brand
Most unsatisfying element of wireless service packageVerizon AT&T T-Mobile Sprint
T-Mobile and Sprint customers are most likely to cite network coverage as the most unsatisfying element of their service
BASE: Respondents with a wireless services provider (n=2,553)GP2B_A. What is the most unsatisfying element of your current wireless services package? Ranked by Verizon
© 2018 HarrisX. All rights reserved. 44
44%
10%9% 9%
6% 5%4% 3% 3%
1%
37%
8%
14%10%
7%3%
2%4% 5% 2%
32%
6%8%
15%11%
3%
3% 7%4%
2%
33%
7%
14%12% 11%
4% 3%3%
6% 2%
44%
9% 10% 9%
4%2%
3% 5%1% 0%
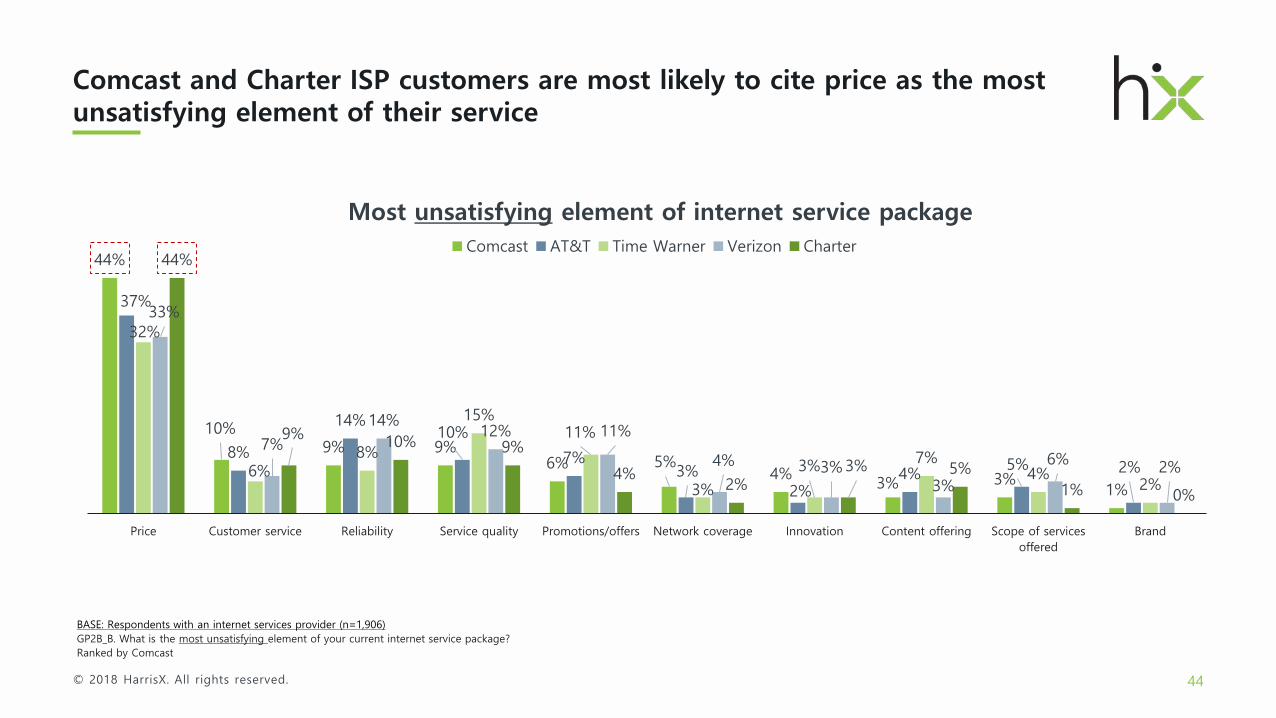
Price Customer service Reliability Service quality Promotions/offers Network coverage Innovation Content offering Scope of servicesoffered
Brand
Most unsatisfying element of internet service packageComcast AT&T Time Warner Verizon Charter
Comcast and Charter ISP customers are most likely to cite price as the most unsatisfying element of their service
BASE: Respondents with an internet services provider (n=1,906)GP2B_B. What is the most unsatisfying element of your current internet service package?Ranked by Comcast

© 2018 HarrisX. All rights reserved. 45
50%
10% 8%7%
6%5%
4%3%
3%0%
41%
10% 7%11% 8%
3% 2% 4% 3% 3%
46%
4% 4%
11%
6% 5% 3% 8% 4%2%
35%
10%13%
5%
13%5%
0% 2%
7%
0%
38%
7%
11% 9% 9%
3% 2% 8%
2% 2%
34%
3%
14%12%
5% 7%
1%
10%5% 2%
Price Customer service Promotions/offers Reliability Service quality Scope of servicesoffered
Network coverage Content offering Innovation Brand
Most unsatisfying element of paid TV service packageComcast (Xfinity) AT&T (U-verse) Verizon (Fios) Spectrum DirecTV Dish
Comcast Xfinity and Verizon Fios customers are most likely to cite price as the most unsatisfying element of their service
BASE: Respondents with a paid TV service package (n=1,614)GP2B_C. What is the most unsatisfying element of your current paid TV service package?Ranked by Comcast Xfinity

© 2018 HarrisX. All rights reserved. 46
E. Favorability

© 2018 HarrisX. All rights reserved. 47
26% 22%13% 11% 10% 9% 7% 6% 4%
28%28%
28%19% 23% 19%
12% 12%7%
1%1%
1%
6% 1%3%
28%23%
57%
30%31% 44%
43% 45% 45%
39% 45%
24%
8% 10% 8%12% 12% 16%
8% 8%4%7% 8% 6% 9% 8% 9% 7% 5% 3%
Comcast Dish Charter Cox Altice
Favorability of technology companies
Very favorable Somewhat favorable Have not heard of them Neither favorable nor unfavorable Unfavorable Very Unfavorable
Of the four major carriers, Verizon and AT&T are viewed most favorably, while nearly half of adults have no opinion of T-Mobile or Sprint
BASE: All respondents (n=2,000)F1. Do you have a favorable or unfavorable view of ...Ranked by Very Favorable

© 2018 HarrisX. All rights reserved. 48
18% 17% 13% 11% 10% 9% 8% 5% 4% 4% 4% 4% 3%
16% 16% 22% 27% 23% 19% 21%11% 9% 8% 7% 6% 6%
3% 6% 2% 2%2%
3% 4%37%
59% 62% 61% 62%55%
16%23% 28%
35%32%
49% 45%
25%
22% 20% 22% 21%21%
10%
12%16%
14%19%
12% 13% 7%
4% 4% 3% 3%4%
38%26%
20%11% 13%
8% 10%15%
3% 3% 3% 3%10%
DonaldTrump
Mike Pence White House DOJ U.S.Government
FTC FCC StevenMnuchin
John Legere Randal L.Stephenson
John G.Stratton
MarceloClaure
Ajit Pai
Favorability of public figures and government institutions
Very favorable Somewhat favorable Have not heard of them Neither favorable nor unfavorable Unfavorable Very Unfavorable
Carrier favorability ratings are higher than government stakeholders in the deal
BASE: All respondents (n=2,000)F1. Do you have a favorable or unfavorable view of ...Ranked by Very Favorable
© 2018 HarrisX. All rights reserved.
2000 Pennsylvania Avenue NW, Suite 3350Washington, DC 20006, USA
About US: www.harrisx.comContact: [email protected]
Thank You
Disclosure: This survey was conducted independently by HarrisX as part of its monthly Telecom, Media, and Technology Pulse survey, which tracks public attitudes and actions around major events. Several companies in the wireless, cable, and broadband industries, including T-Mobile, subscribe to HarrisX syndicated research services.