Embed Size (px)
Citation preview
May 23, 2005 Andrew LaManque, Ph.D. 1
Maintaining Access for Low Income Students at California Community Colleges:
BOG Tuition Waivers and Financial Aid Outreach
Research Presentation Prepared for the Association for Institutional Research Annual Conference, 2005, San Diego
Andrew LaManque, Ph.D.
May 23, 2005 Andrew LaManque, Ph.D. 2
Presentation Overview• Developing a Framework for Analysis
1) “Market” Research to Help Financial Aid Staff Target Outreach Efforts
2) Exploration of Additional Indicators That Can Be Used to Predict The Number of BOG Recipients
• Work in Progress!• Suggestions Welcome

May 23, 2005 Andrew LaManque, Ph.D. 3
Outline of Presentation
• Overview of Financial Aid Outreach (BFAP) Funding Statistics– Included Performance Indicators
• Demographics of De Anza College BOG Students
• Review of Potential Data Sources for Additional Performance Indicators
May 23, 2005 Andrew LaManque, Ph.D. 4
• Augmented Funding for Financial Aid Outreach and Administration
• Minimize the Impact from Tuition Increases (“Sticker Shock”) on Access for Low Income Students
2003-04 Budget Initiative for California Community Colleges
May 23, 2005 Andrew LaManque, Ph.D. 5
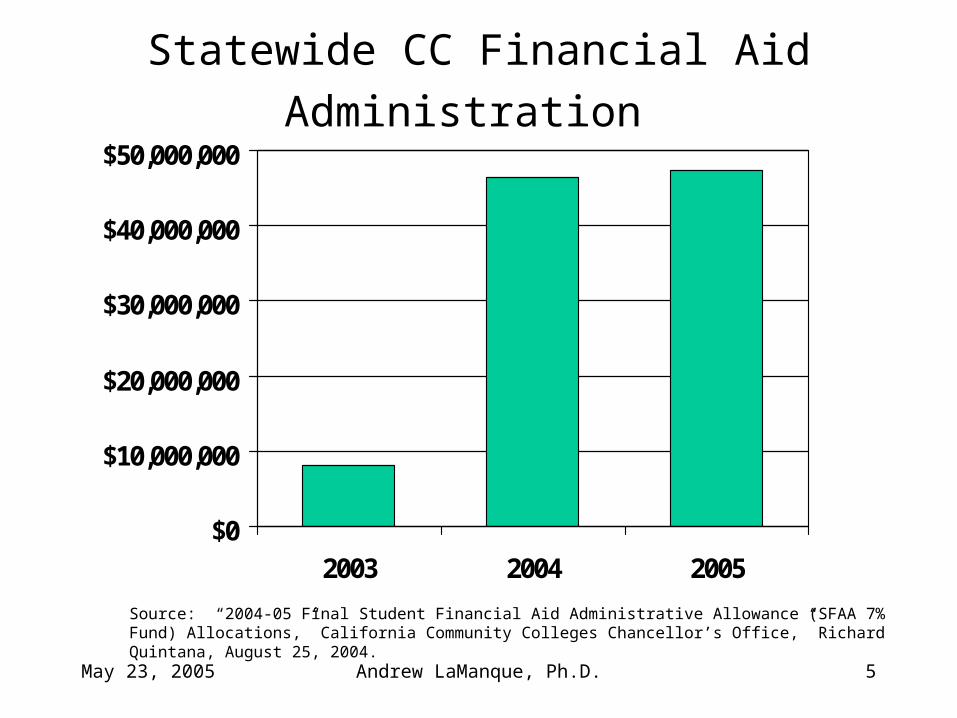
Statewide CC Financial Aid Administration
$0
$10,000,000
$20,000,000
$30,000,000
$40,000,000
$50,000,000
2003 2004 2005
Source: “2004-05 Final Student Financial Aid Administrative Allowance (SFAA 7% Fund) Allocations,” California Community Colleges Chancellor’s Office,” Richard Quintana, August 25, 2004.
May 23, 2005 Andrew LaManque, Ph.D. 6
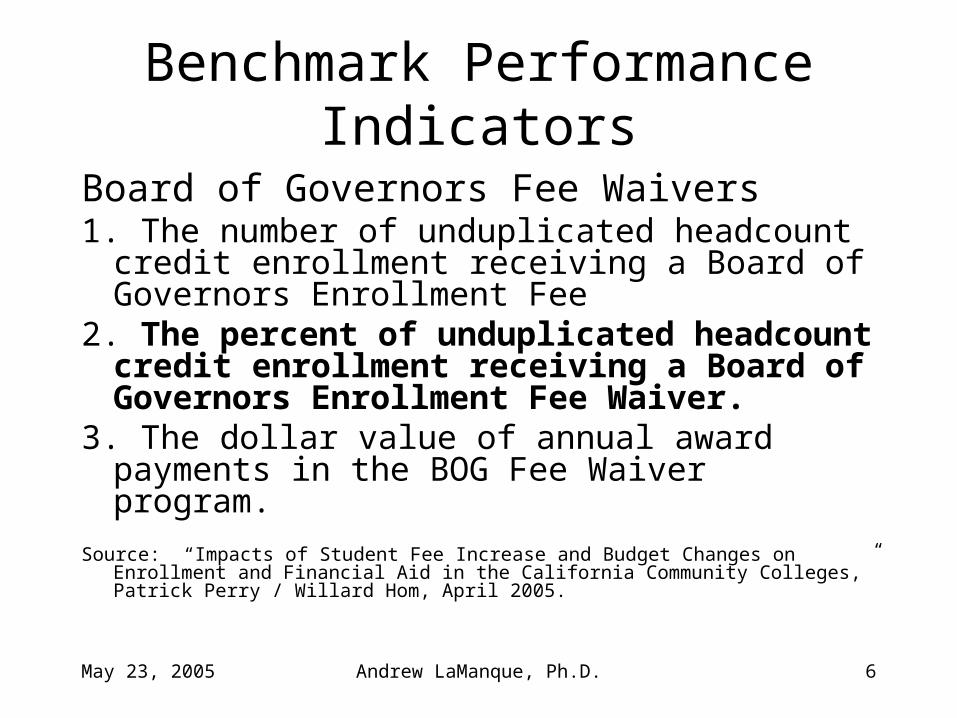
Benchmark Performance Indicators
Board of Governors Fee Waivers1. The number of unduplicated headcount credit
enrollment receiving a Board of Governors Enrollment Fee
2. The percent of unduplicated headcount credit enrollment receiving a Board of Governors Enrollment Fee Waiver.
3. The dollar value of annual award payments in the BOG Fee Waiver program.
Source: “Impacts of Student Fee Increase and Budget Changes on Enrollment and Financial Aid in the California Community Colleges,” Patrick Perry / Willard Hom, April 2005.
May 23, 2005 Andrew LaManque, Ph.D. 7
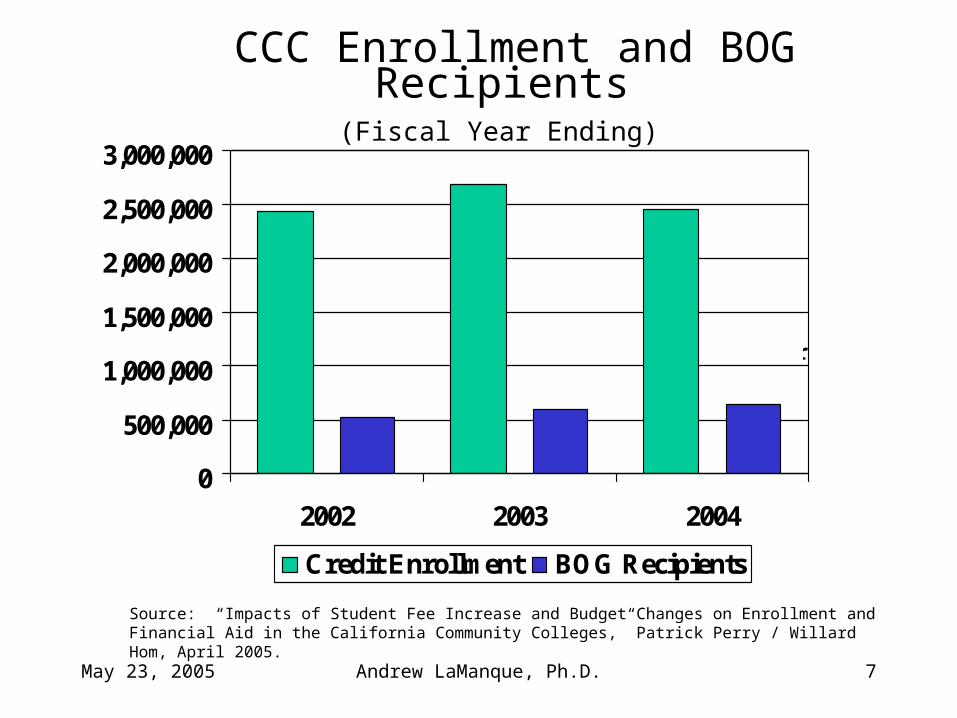
CCC Enrollment and BOG Recipients (Fiscal Year Ending)
0
500,000
1,000,000
1,500,000
2,000,000
2,500,000
3,000,000
2002 2003 2004
Credit Enrollment BOG Recipients
BOG / Enr = 22 %
BOG / Enr = 26 %
BOG / Enr = 22 %
Source: “Impacts of Student Fee Increase and Budget Changes on Enrollment and Financial Aid in the California Community Colleges,” Patrick Perry / Willard Hom, April 2005.

May 23, 2005 Andrew LaManque, Ph.D. 8
Research Suggestion for a Financial Aid Outreach Program
“ In this hypothetical scenario, the state is planning to study a proposed outreach program that is intended to increase the use of financial aid by target populations.
• What explicit student-level result should be a program objective?
• What factors influence student use of financial aid beyond financial need? ”
Source: “Planning Research on Student Services: Variety in Research,” Willard Hom, iJournal, No 6, Fall 2003.
May 23, 2005 Andrew LaManque, Ph.D. 9
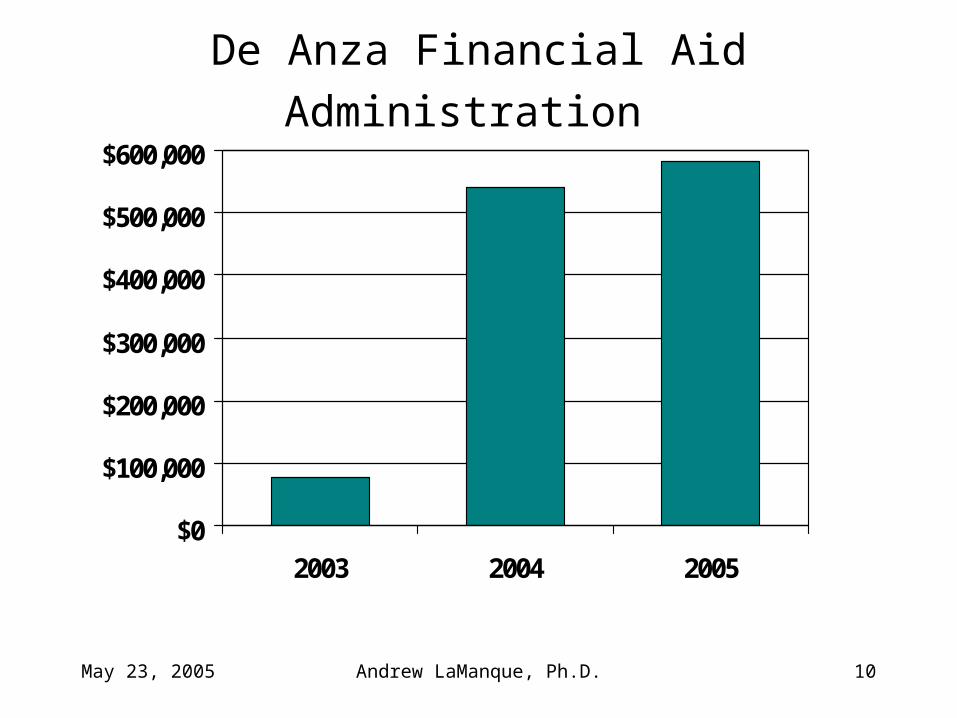
De Anza’s Use of BFAP Funds• Additional Staffing for New Center
– In-Reach and Outreach• Development of On-Line BOG Application• Application and Award Status On-Line• Self-Help Interactive Multi-media On-Line• More Bilingual Access Points• Development of Email Communication Systems
(e.g. contacting students that have a balance due)• Purchase of Media Materials
May 23, 2005 Andrew LaManque, Ph.D. 10
De Anza Financial Aid Administration
$0
$100,000
$200,000
$300,000
$400,000
$500,000
$600,000
2003 2004 2005
May 23, 2005 Andrew LaManque, Ph.D. 11
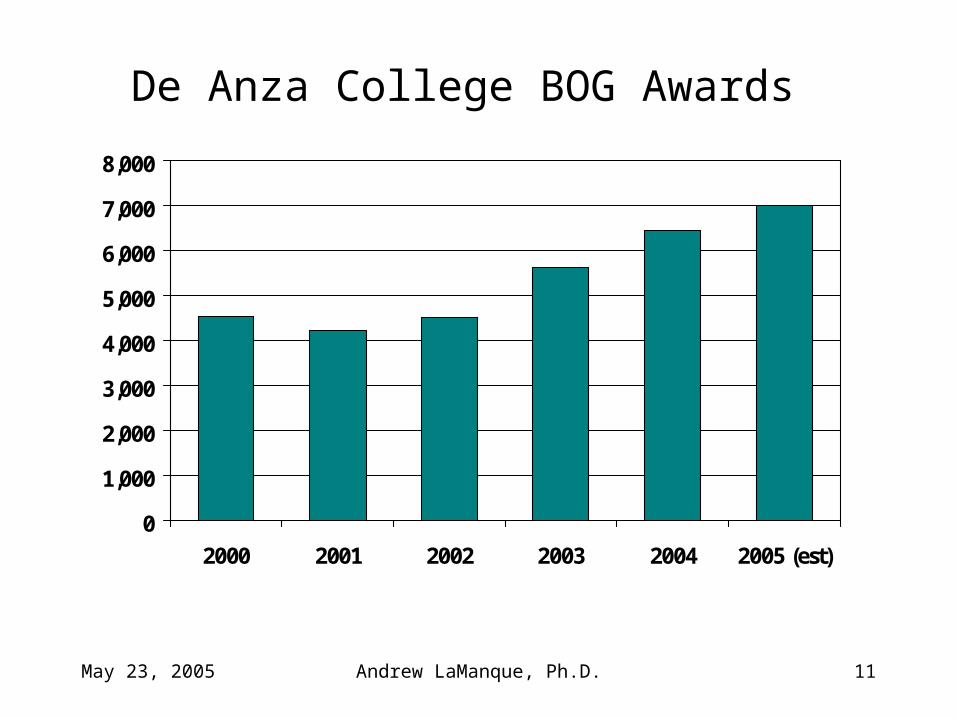
De Anza College BOG Awards
0
1,000
2,000
3,000
4,000
5,000
6,000
7,000
8,000
2000 2001 2002 2003 2004 2005 (est)

May 23, 2005 Andrew LaManque, Ph.D. 12
De Anza College Baseline BOG Performance
11% 13% 15%
0%
20%
40%
60%
80%
100%
2003 2004 2005 (est)
BO
G R
ecip
ien
ts /
Cre
dit
En
roll
men
t
Note: Based on State MIS Data
May 23, 2005 Andrew LaManque, Ph.D. 13
Demographics of De Anza College’s BOG Recipients
• Outreach Efforts Can be Better Targeted If We Know:
– Where BOG Students Live
– Where Overall College Enrollment Comes From
– Where Low Income Individuals are More Likely to Reside in the County
– The Ethnicity of BOG Recipients
May 23, 2005 Andrew LaManque, Ph.D. 14
Zip Code Groupings
• “Low Income” Zips: San Jose East of 880, Alviso, Milpitas, Fremont, Union City, Newark, Hayward, East Palo Alto
• “Middle Income Zips: San Jose Other, Santa Clara, Morgan Hill, Gilroy, Campbell, Sunnyvale (94086, 94089)
• “High Income” Zips: Cupertino, Sunnyvale (94087), Los Altos, Mountain View, Palo Alto, Los Gatos, Saratoga

May 23, 2005 Andrew LaManque, Ph.D. 15
2001 Adjusted Gross Income by Zip Code Groupings
0%
10%
20%
30%
40%
50%
60%
70%
80%
90%
100%
Under $25,000 $25,000 to $50,000 $50,000 or more
"Low Income" ZIPs "Middle Income" ZIPs "High Income" ZIPs
Note: Income groups are defined by college market areas.
May 23, 2005 Andrew LaManque, Ph.D. 16
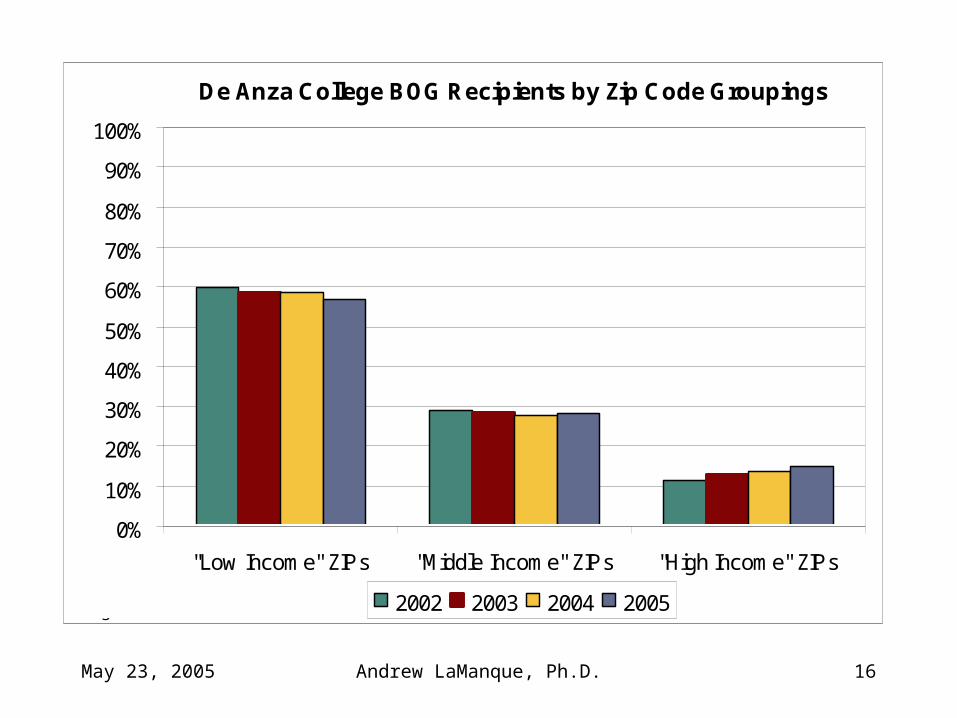
De Anza College BOG Recipients by Zip Code Groupings
0%
10%
20%
30%
40%
50%
60%
70%
80%
90%
100%
"Low Income" ZIPs "Middle Income" ZIPs "High Income" ZIPs
2002 2003 2004 2005Note: Income groups are defined by college market areas.
May 23, 2005 Andrew LaManque, Ph.D. 17
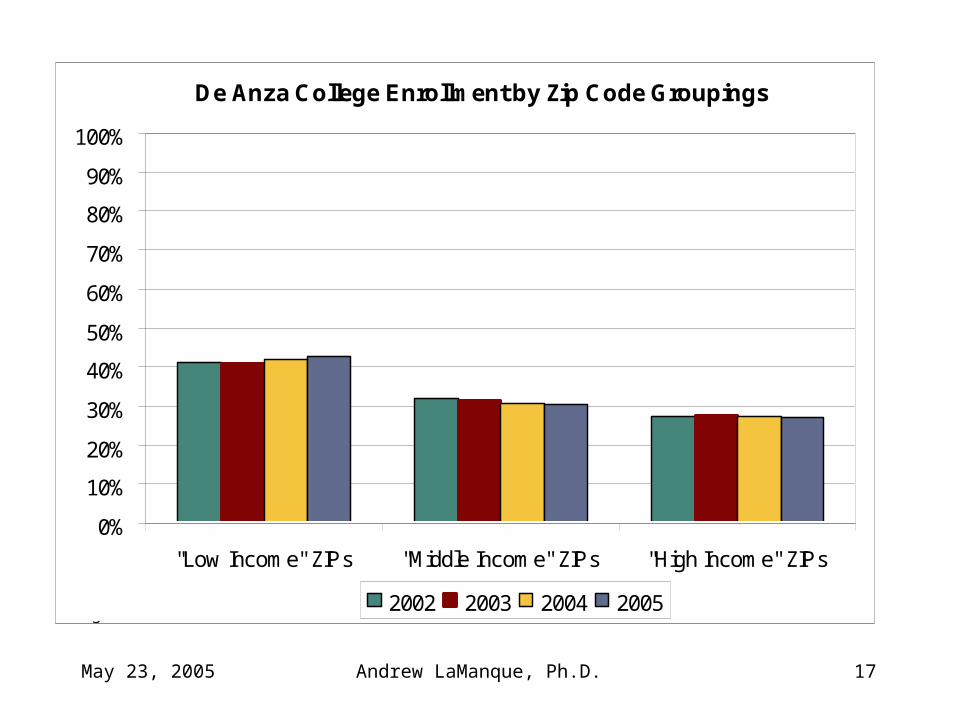
De Anza College Enrollment by Zip Code Groupings
0%
10%
20%
30%
40%
50%
60%
70%
80%
90%
100%
"Low Income" ZIPs "Middle Income" ZIPs "High Income" ZIPs
2002 2003 2004 2005Note: Income groups are defined by college market areas.
May 23, 2005 Andrew LaManque, Ph.D. 18
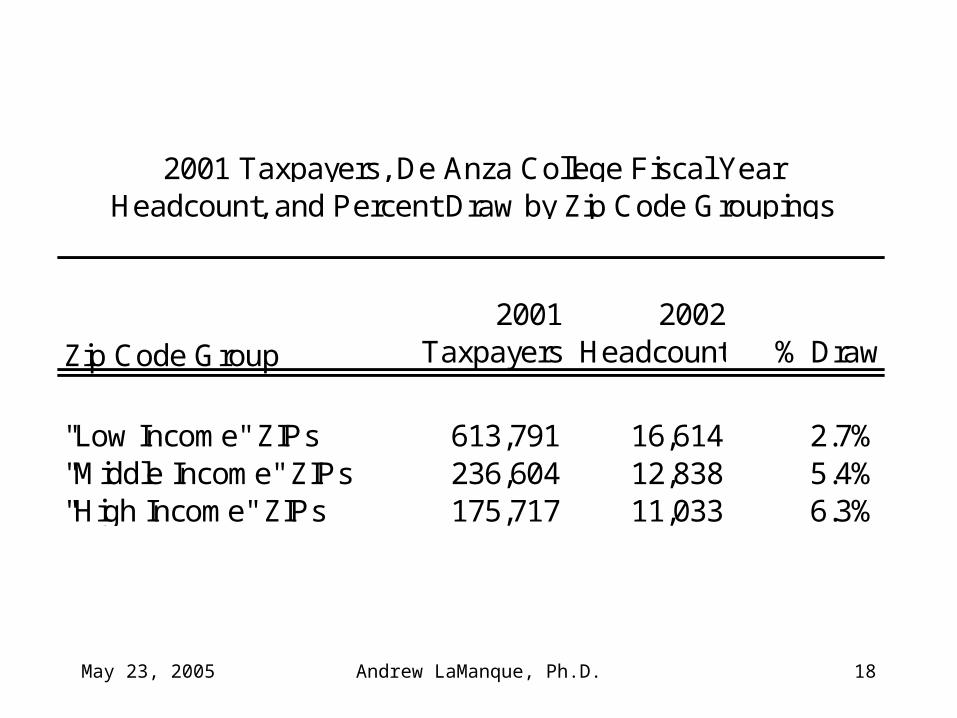
Zip Code Group2001
Taxpayers2002
Headcount % Draw
"Low Income" ZIPs 613,791 16,614 2.7%"Middle Income" ZIPs 236,604 12,838 5.4%"High Income" ZIPs 175,717 11,033 6.3%
2001 Taxpayers, De Anza College Fiscal YearHeadcount, and Percent Draw by Zip Code Groupings
May 23, 2005 Andrew LaManque, Ph.D. 19
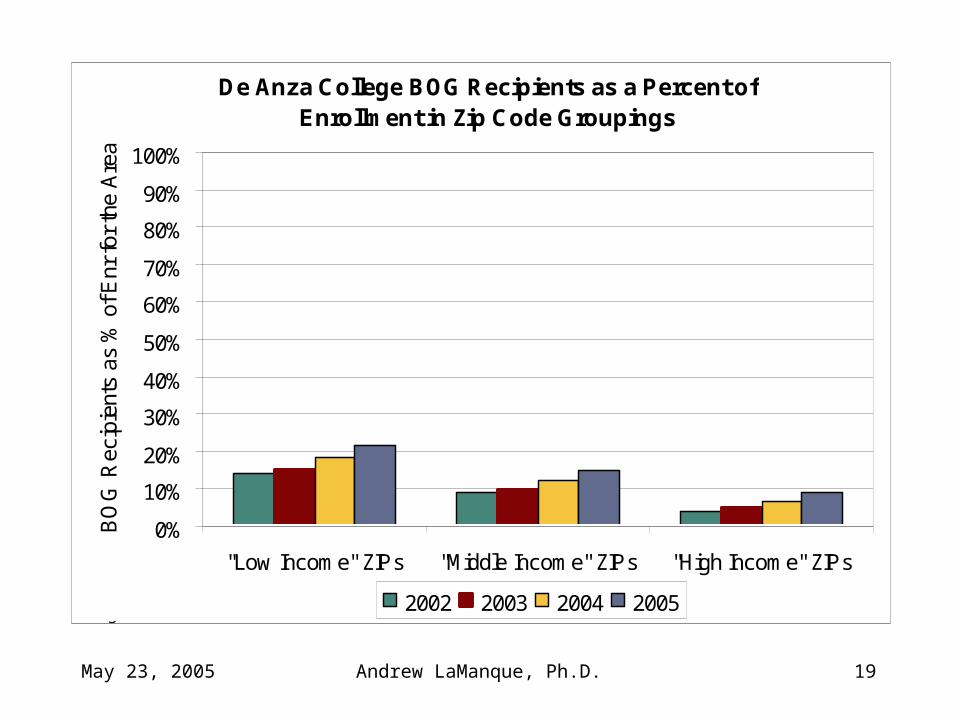
De Anza College BOG Recipients as a Percent of Enrollment in Zip Code Groupings
0%
10%
20%
30%
40%
50%
60%
70%
80%
90%
100%
"Low Income" ZIPs "Middle Income" ZIPs "High Income" ZIPs
BO
G R
ecip
ient
s as
% o
f Enr
for
the
Are
a
2002 2003 2004 2005Note: Income groups are defined by college market areas.
May 23, 2005 Andrew LaManque, Ph.D. 20
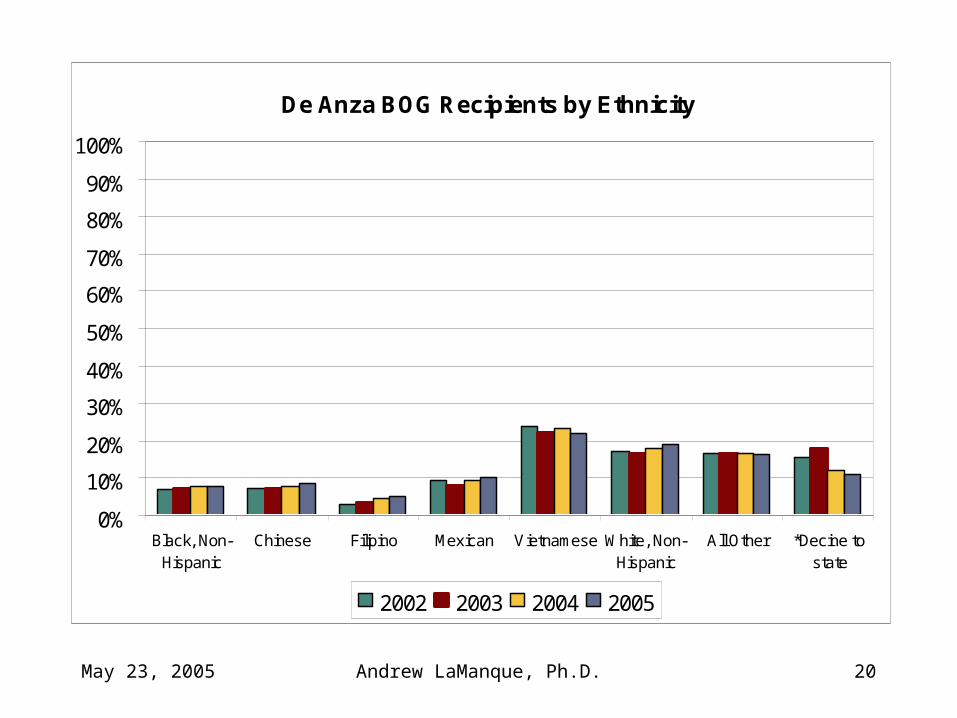
De Anza BOG Recipients by Ethnicity
0%
10%
20%
30%
40%
50%
60%
70%
80%
90%
100%
Black, Non-Hispanic
Chinese Filipino Mexican Vietnamese White, Non-Hispanic
All Other *Decine tostate
2002 2003 2004 2005
May 23, 2005 Andrew LaManque, Ph.D. 21
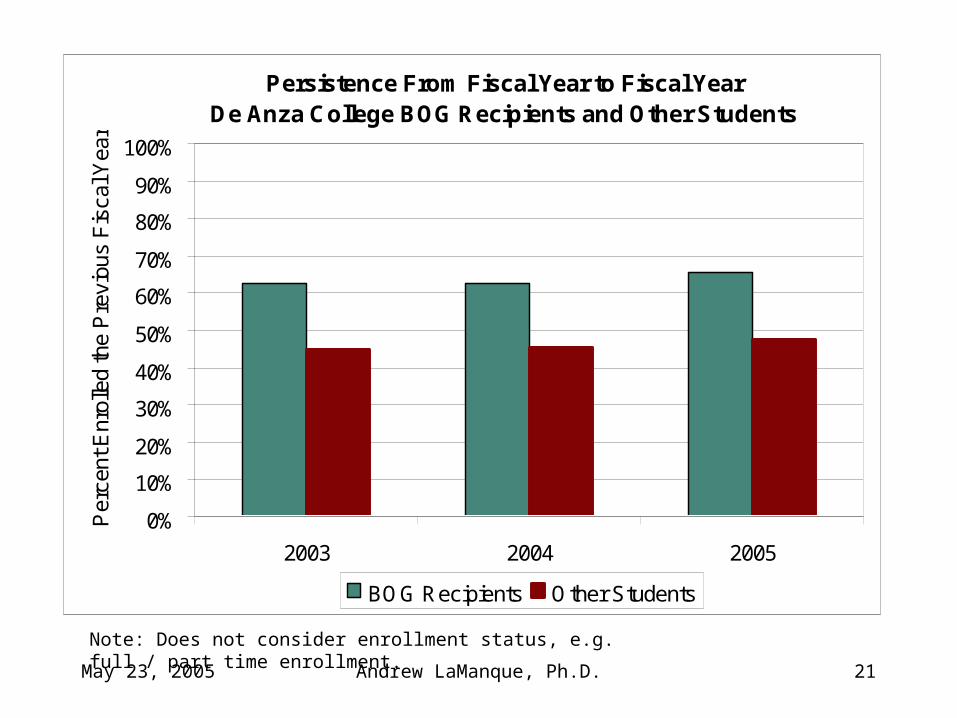
Persistence From Fiscal Year to Fiscal YearDe Anza College BOG Recipients and Other Students
0%
10%
20%
30%
40%
50%
60%
70%
80%
90%
100%
2003 2004 2005
Per
cent
Enr
olle
d th
e P
revi
ous
Fis
cal Y
ear
BOG Recipients Other Students
Note: Does not consider enrollment status, e.g. full / part time enrollment.
May 23, 2005 Andrew LaManque, Ph.D. 22
The Need for Additional Measures• “Districts and Colleges have been encouraged to
identify additional local goals, objectives and performance measures ...”
– “Information on the Effect of Fee Increases on Enrollment and a Report on Efforts to Mitigate Loss of Access Through Improved Financial Aid Outreach and Administrative Capacity,” CCC Chancellor’s Office, November 2003, Preliminary Report to the Legislature.
• Additional Indicators Can Assist Financial Aid Staff With Targeting Resources to Meet Student Needs

May 23, 2005 Andrew LaManque, Ph.D. 23
Factors Affecting the Number of BOG Recipients(A Simple Model)
DBOG =
f (income, ENR, “BOG knowledge”, other)– Income = f (employment, wages, wealth/savings, etc.)
– ENR = f (population, perceived affordability, enrollment previous year, alternatives, “college knowledge”, etc.)
– “BOG knowledge” = f (outreach, friends, family, etc.)
May 23, 2005 Andrew LaManque, Ph.D. 24
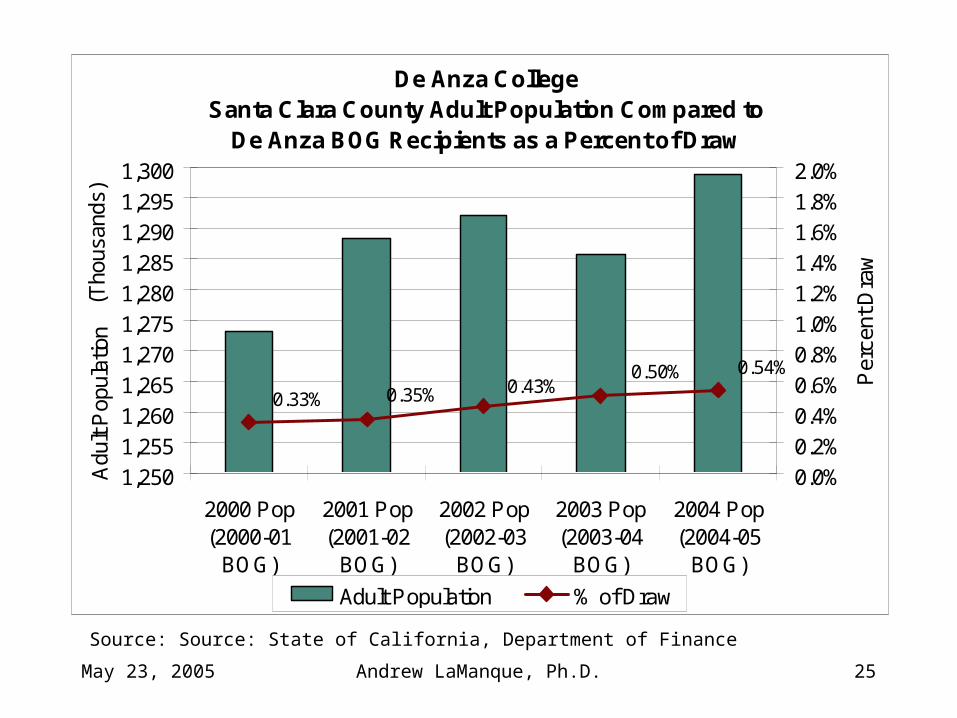
External Demographic and Economic Variables
• Factors independent of “BOG Knowledge” and outreach efforts – in addition to enrollment
– County Population– Lower Income Individuals in County– Number of Individuals Employed
May 23, 2005 Andrew LaManque, Ph.D. 25
De Anza CollegeSanta Clara County Adult Population Compared to
De Anza BOG Recipients as a Percent of Draw
0.54%0.50%0.43%0.35%0.33%
1,250
1,255
1,260
1,265
1,270
1,275
1,280
1,285
1,290
1,295
1,300
2000 Pop(2000-01
BOG)
2001 Pop(2001-02
BOG)
2002 Pop(2002-03
BOG)
2003 Pop(2003-04
BOG)
2004 Pop(2004-05
BOG)
(Tho
usan
ds)
Adu
lt P
opul
atio
n
0.0%
0.2%
0.4%
0.6%
0.8%
1.0%
1.2%
1.4%
1.6%
1.8%
2.0%
Per
cent
Dra
w
Adult Population % of Draw
Source: Source: State of California, Department of Finance
May 23, 2005 Andrew LaManque, Ph.D. 26
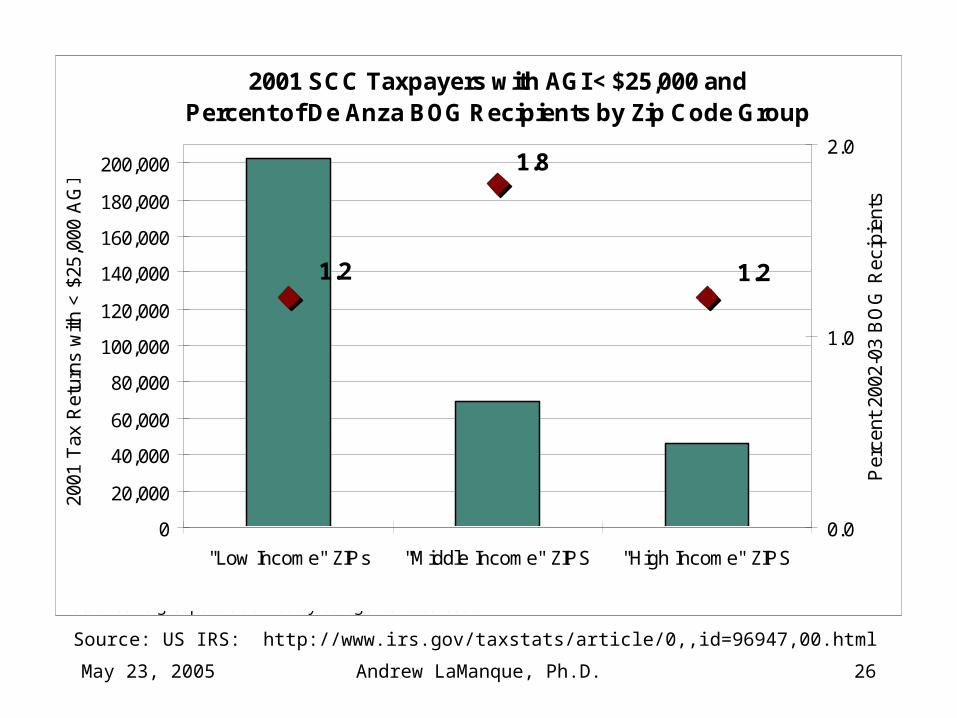
Source: US IRS: http://www.irs.gov/taxstats/article/0,,id=96947,00.html
2001 SCC Taxpayers with AGI < $25,000 andPercent of De Anza BOG Recipients by Zip Code Group
1.2
1.8
1.2
0
20,000
40,000
60,000
80,000
100,000
120,000
140,000
160,000
180,000
200,000
"Low Income" ZIPs "Middle Income" ZIPS "High Income" ZIPS
2001
Tax
Ret
urns
with
< $
25,0
00 A
GI
0.0
1.0
2.0
Per
cent
200
2-03
BO
G R
ecip
ient
s
Note: Income groups are defined by college market areas.
May 23, 2005 Andrew LaManque, Ph.D. 27
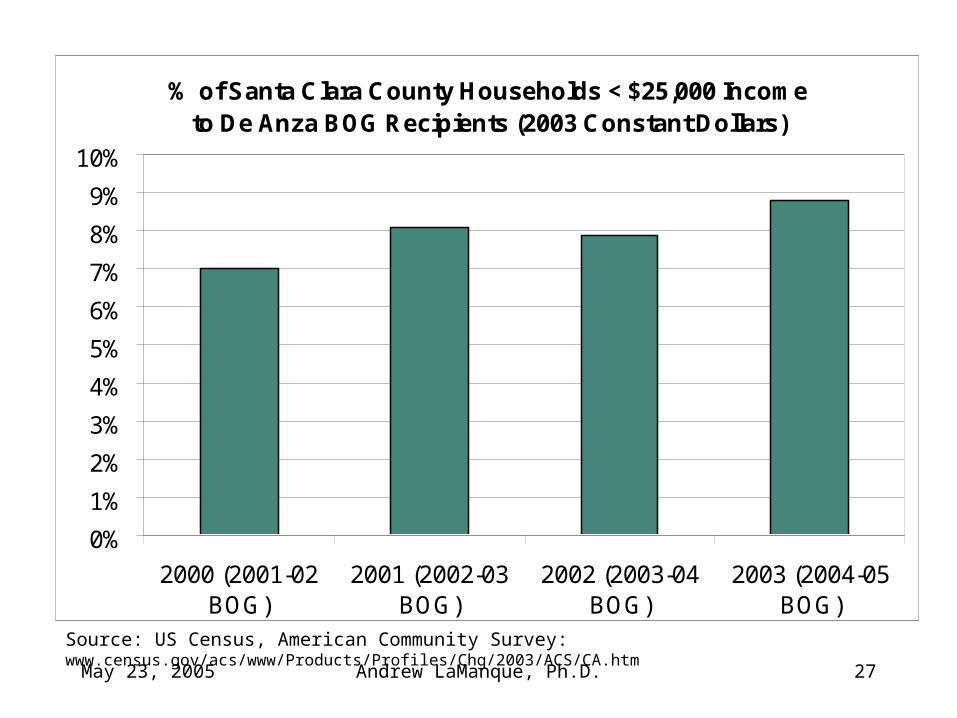
% of Santa Clara County Households < $25,000 Income to De Anza BOG Recipients (2003 Constant Dollars)
0%
1%
2%
3%
4%
5%
6%
7%
8%
9%
10%
2000 (2001-02BOG)
2001 (2002-03BOG)
2002 (2003-04BOG)
2003 (2004-05BOG)
Source: US Census, American Community Survey: www.census.gov/acs/www/Products/Profiles/Chg/2003/ACS/CA.htm
May 23, 2005 Andrew LaManque, Ph.D. 28
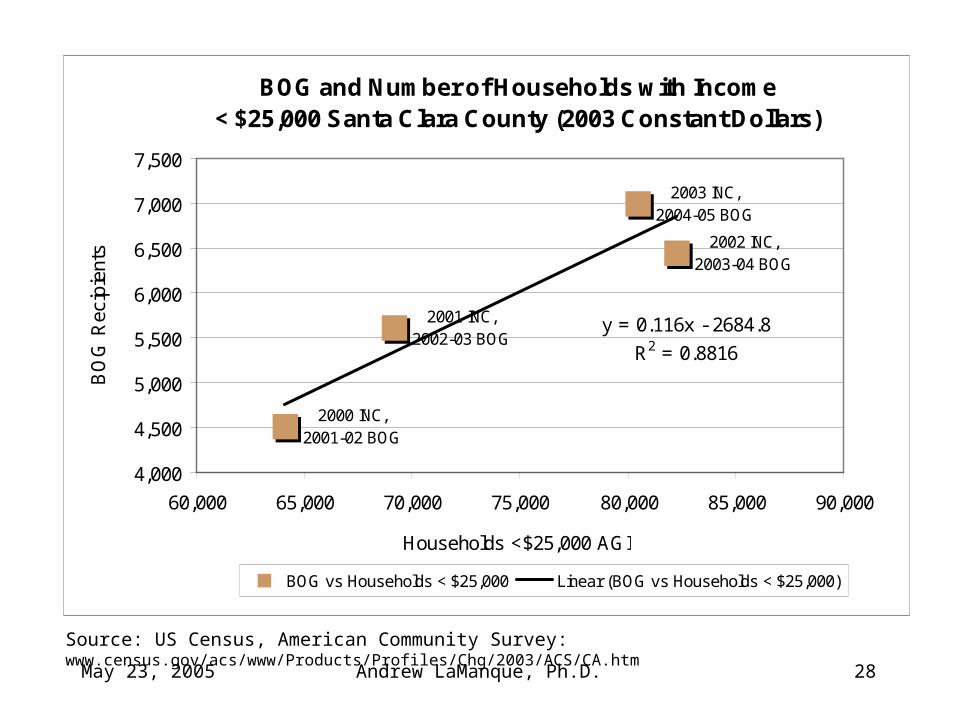
Source: US Census, American Community Survey: www.census.gov/acs/www/Products/Profiles/Chg/2003/ACS/CA.htm
BOG and Number of Households with Income < $25,000 Santa Clara County (2003 Constant Dollars)
2002 INC, 2003-04 BOG
2003 INC,2004-05 BOG
2000 INC, 2001-02 BOG
2001 INC, 2002-03 BOG
y = 0.116x - 2684.8
R2 = 0.8816
4,000
4,500
5,000
5,500
6,000
6,500
7,000
7,500
60,000 65,000 70,000 75,000 80,000 85,000 90,000
Households <$25,000 AGI
BO
G R
ecip
ient
s
BOG vs Households < $25,000 Linear (BOG vs Households < $25,000)
May 23, 2005 Andrew LaManque, Ph.D. 29
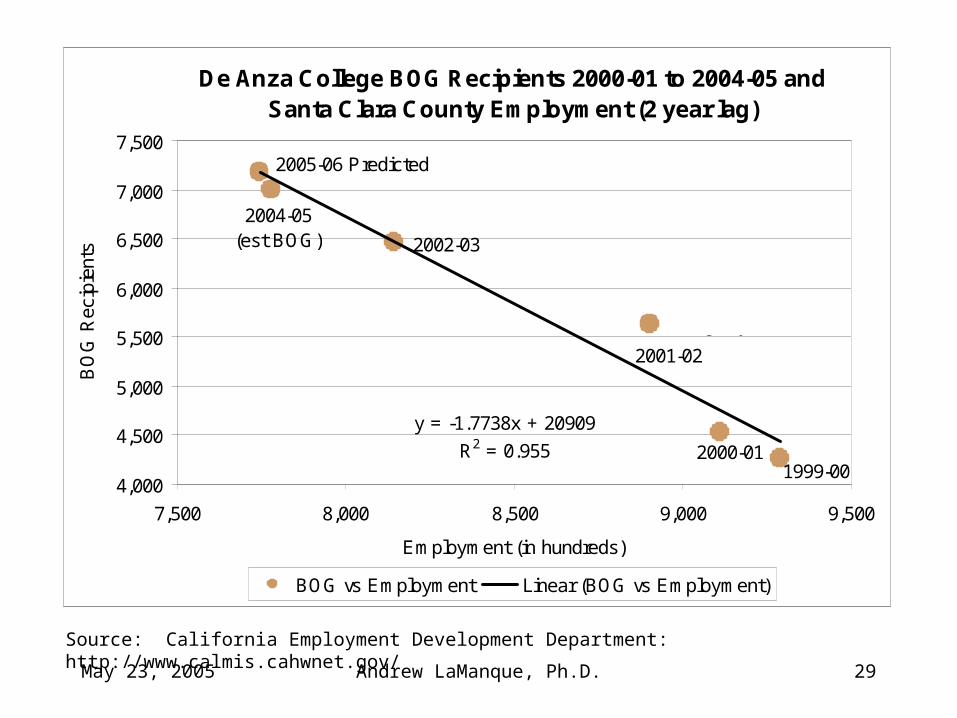
Source: California Employment Development Department: http://www.calmis.cahwnet.gov/
De Anza College BOG Recipients 2000-01 to 2004-05 and Santa Clara County Employment (2 year lag)
2000-01
2004-05 (est BOG)
2005-06 Predicted
2002-03
1999-00
2001-02
y = -1.7738x + 20909
R2 = 0.955
4,000
4,500
5,000
5,500
6,000
6,500
7,000
7,500
7,500 8,000 8,500 9,000 9,500
Employment (in hundreds)
BO
G R
ecip
ient
s
BOG vs Employment Linear (BOG vs Employment)
Professional judgement: current year data used for eligibility
May 23, 2005 Andrew LaManque, Ph.D. 30
Next Steps
• Additional Trend Data
• More Sophisticated Statistical Model
• Integrate Financial Indicators
• Discuss with Campus Financial Aid Staff
May 23, 2005 Andrew LaManque, Ph.D. 31
Summary
• BOG Recipient Analysis By Zip Code Can Assist in Identifying How Well You Are Serving Your Population
• The Number of BOG Recipients Appears Related to County Economic Variables
• Multiple Measures Can Better Demonstrate the Impact Financial Aid Outreach Has On Achievement of Campus Access Goals

May 23, 2005 Andrew LaManque, Ph.D. 32
END SLIDE
May 23, 2005 Andrew LaManque, Ph.D. 33
Data Notes:• Zip Code Groupings Exclude “Other” Areas
(About 5%) That Are Not Included in the Calculations
• Enrollment is Based on College End of Term Files. Fiscal Year Figures Count Students Enrolled At Least One of the 4 Quarters, Including Summer
• Depending on the Data Source, Some Zip Codes May Be Excluded (e.g. Post Office Boxes)


![Bog Je Jedan,Bog Je u Nama[1]](https://img.pdfslide.net/doc/110x75/544a8aa9af7959a8438b49d0/bog-je-jedanbog-je-u-nama1.jpg)