Embed Size (px)
Citation preview

II.0. Jj1! IOn
KnigmanCity ofGeneral Plan Update
2030Mayor and Com.non Council
Janet Vatson, MayorCarole Young, Vice-Mayor
Richard Aiaderson, CouncilmenaberLawrence Carver, Councilmenaber
Erm Cochran, CouncilmemberJennee Miles, Councilmember
Mark Wunpee, Sr. Councilmember
1’laimmg and Zoning CommissionMatthew Ladendecker, ChairAllen Mossberg, Vice-ChairMike Blair, Commissioner
Dana Harvey, CommissionerEugene Kirkham, Com.nissioner
Vicki Kress, CommissionerDustm Lewis, CommissioHer
March 2014

••
•.
••
.•
••
•..
-:-
•••
••:
••
•••
••.
•
-4.4
1—
4
4’.-
.4,
-:44
•4H
•;
44•
4-
44
4-4
‘.4’
4.
—
$
4
a,—
44-4
-r
-4+
,.
4.
..-
—4.
444
t-•‘
-.
-
‘3’
4’,--‘
j,
‘-44$
a.‘-
‘-3
-,
44 4-
4-’.
-a
‘$3
3-.
3 .4 ‘-J.
-
3- 43
.‘:•
4€;
-
-
‘4
---
.-.!
444
‘,,•‘
t’-4-ra..-,,
44
-4
3-
-:4-’;
**
*_:
$4
.
4:4
42’
;‘44a.,
3444341
•,,4
‘--3
4-
$3.
4-
3
4.,
43•
444$
;

TABLE OF CONTENTS
CHAPTER 1: GOALS AND OBJECTIVESLand Use Element Page 1Growth Area Element Page 1Redevelopment and Public Facilities and Buildings Element Page 4Circulation Element Page 6Parks, Recreation, Trails and Open Space Element Page 7Cost of Development Page 10Environmental Planning Page 12
CHAPTER 2: DEMOGRAPHICS2010 Census Page 17Racial Composition Page 17Education Page 17Housing Page 17Income Page 18Vehicles Page 18Poverty Page 18Economy Page 18Aviation Page 19Energy Page 20Healthcare Services Page 20Manufacturing Page 20Mining Page 21Motorsports Page 21Transportation and Logistics Page 212015 Demographic Projection Page 22Conclusion Page 23
CHAPTER 3: TRANSPORTATION Page 27
CHAPTER 4: LAND USE ELEMENTIntroduction Page 29Kingman General Plan 2030 Projected Land Use Map Narrative Page 30Neighborhood Planning Areas Page 32Summary of Land Use Issues byNPA Page 33Population Growth Page 43Land Use Projections Page 45Conclusion Page 51KINGMAN GENERAL PLAN 2030 PROJECTED LAND USE MAP Page 53

CHAPTER 5: GROWTH AREA ELEMENTIntroduction Page 55Major Issues Page 55Identified Growth Areas Page 59Figure 3-1 Growth Area Map Page 63
CHAPTER 6: PUBLIC FACILITIES AND SERVICES ELEMENTIntroduction Page 65Major Issues Page 65Current Conditions Page 65
CHAPTER 7: PARKS, RECREATION, TRAILS AND OPEN SPACEELEMENT
Introduction Page 71Parks, Recreation, Open Space and Trails (PROST) Plan Page 71Major Issues Page 72
CHAPTER 8: COST OF DEVELOPMENT ELEMENTIntroduction Page 89Funding Mechanisms Page 89Current Conditions Page 96
CHAPTER 9: ENVIRONMENTAL PLANNING ELEMENTIntroduction Page 99Major Issues Page 99
APPENDIX: KINGMAN AREA TRANSPORTATION STUDY EXECUTIVESUMMARY
PagelO3

CHAPTER 1
GOALS AND OBJECTIVESLAND USE ELEMENT
GOAL: To create the environment that makes Kingman the heart of historicRoute 66 and the crossroads of the Southwest, a place its residentsproudly call home because there are outstanding economic opportunitiesand numerous employment options, excellent post-secondary educationalopportunities, a healthy business climate and diverse recreational andcultural amenities.
Objective 1: Promote Kingman as the place to live, be employed, become educated,and to locate a business.
Objective 2: Provide aesthetically pleasing streetscapes to accommodate all modes oftransportation.
Objective 3: Encourage compatible mix of land uses, which allows accessibility togoods and services without extensive travel.
Objective 4: Develop Kingman into a place that is internationally and domesticallyknown as a Historic Route 66 destination.
GROWTH AREA ELEMENT
GOALS, OBJECTIVES AND POLICIES
GOAL: To promote managed, economically sound and orderly growth thatsupports a variety of land uses, conserves natural resources, reducesautomobile dependency, and provides for the logical expansion ofinfrastructure and service capacities.
Objective 1.0: Encourage infihl development to occur in the Downtown, Stockton HillRoad, and Hualapai Mountain Road corridors to promote the most costefficient and logical expansion of public services and infrastructure.
Policies:
1.1 Expand the public infrastructure and encourage redevelopment and infillthrough the use of private enterprise, neighborhood projects,redevelopment districts, and Infihl Incentive Districts.

1.2 Target public investments and infrastructure improvements with the use ofassessment districts and improvement districts within the Downtown,Stockton Hill Road and Hualapai Mountain Road corridor growth areasthat are surrounded by or adjacent to existing infrastructure.
1.3 Consider incentives for new development such as lower permit fees anddevelopment fees where appropriate in the Downtown, Stockton Hill Roadand Hualapai Mountain Road corridor growth areas.
Objective 2.0: Work with other jurisdictions to ensure that all development that occurswithin the City’s water service boundary is in accordance with Citydevelopment standards.
Policies:
2.1: The Municipal Utilities Commission may recommend and the CityCouncil may require any development outside the City limits requesting awater extension and/or a water meter to meet the following Cityrequirements and policies:
--The Minor Lot Splitting Ordinance requirements--Subdivision Ordinance requirements--Street improvement requirements
2.2: The City and Mohave County should work together for a coordinatedimproved street system, including paved streets, curb, gutter and sidewalk,wherever feasible.
2.3: Coordinate with the State Land Department on preparing plans and thetiming of development for State Trust lands which support the KingmanGeneral Plan 2030.
2.4: The City and the Kingman Airport Authority should work together toidentify methods to mitigate potential conflicts between the airport andnearby uses, such as requiring the recording of avigation easements forproperties lying within two miles of the Airport boundary which arelocated inside aircraft over flight zones.
2

Objective 3.0: Encourage a planned mixture of land uses that provides for a choice oftransportation modes which reduces automobile dependency, providesfor needed public open space and creates a sense of place.
Policies:
3.1: A mixture of housing types, densities, prices, rents and designs should beprovided throughout Neighborhood Planning Areas with higher densityareas near improved collector streets and close to commercial and publicservice areas.
3.2: Encourage commercial development to occur around identifiable nodesand discourage strip commercial development.
3.3: Neighborhood centers and gathering places in central locations should beencouraged.
3.4: Offer incentives for developers to create Planned Development Districtswith a variety of retail and employment opportunities, housing choices,public open spaces and multi-modal transportation options.
3.5: Provide safe pedestrian and/or bicycle paths between and withinneighborhoods, shopping areas, employment, and parks/open space areasby assigning them greater priority in the City’s Street Policy andSubdivision standards.
3.6: Coordinate developer plans with the City’s Parks, Recreation, Trails andOpen Space Element of the General Plan with regard to provisions forparks and other recreational areas.
3.7: Provide for the development of a public transit system to linkneighborhoods, shopping, employment, and public service areas andpromote transit-friendly design and amenities.
3.8: Follow Overlay District standards where appropriate to ensure newdevelopment fits within existing neighborhoods in terms of scale, designcirculation, etc.
3

REDEVELOPMENT AND PUBLICFACILITIES AND BUILDINGS ELEMENT
GOALS, OBJECTIVES AND POLICIES
GOAL: To rehabilitate and expand residential and commercial development,maintain and enhance governmental and public use facilities whilepreserving the historic heritage of downtown Kingman.
Objective 1.0: Preserve and enhance the historic heritage and preserve a sense of placein the downtown area.
Policies:
1.1: Upgrade and enhance development along the Route 66 frontage whilepreserving the historic fabric of the area.
1.2: Maintain and potentially expand the existing Historic Overlay District anduse a historic building code to provide alternative building regulations forthe rehabilitation, preservation, or restoration of structures designated ashistoric buildings.
1.3: Support the strong transportation infrastructure that made this location theheart of Mohave County to encourage an active downtown area.
1.4: Support, enhance and encourage opportunities for new housingdevelopment as well as preserve existing and historic houses whereverpossible.
1.5: Support the positive open space and park system enhancements to providefor the needs of area residents and to attract tourists.
1.6: Encourage the disbursement of social service uses throughout thecommunity so as to remove any perception problems regardingredevelopment.
1.7: The rehabilitation of low to moderate income housing through the use ofCommunity Development Block Grants and other available State, Federaland private sources of funding should be tapped to assist in the provisionof affordable housing for all citizens.
4
Objective 2.0: Support the private sector in playing a major role in the enhancement ofcommercial businesses to rejuvenate the downtown area with a varietyof compatible land uses and implement programs to fund the ongoingmaintenance standards of the downtown area.
Policies:
2.1 Support and enhance a single cohesive downtown association dedicated tocommercial improvements in the area.
2.2 Explore the use of the Main Street approach with regard to organization,design of physical improvements, promotion, and economic restructuringin the downtown area.
2.3 Land bank property or be prepared to acquire properties as they becomeavailable for redevelopment efforts.
2.4 Allow light industrial uses only if they enhance supportive job creation inthe area.
Objective 3.0: Maintain a daytime workforce and customer base by enhancing thegovernmental center and area schools.
Policies:
3.1 Consider a civic center and activity center in historic Downtown.
3.2 Support the upgrading of local educational facilities (high school,elementary school) located in the area.
3.3 Support and develop policies to continue historic Downtown as the centerof government in Kingman and Mohave County. The City should workwith other governmental entities to the fullest extent possible to encouragethe development and maintenance of governmental offices in thedowntown area.
Objective 4.0 Provide adequate, efficient and safe public services and facilities to allresidents and properties in the City.
Policies:4.1 Construct and staff a fire station in the northeastern quadrant of the City4.2 Upgrade or replace Fire Station #2 to consolidate fire management
personnel and equipment.4.3 Develop water pressure zones to serve all incorporated areas of the City.4.4 Extend sanitary sewer lines throughout the water service area of the City.
5

CIRCULATION ELEMENT
GOAL: Provide a safe, efficient, and aesthetically pleasing circulation networkwhich considers all modes of vehicular and non-vehicular movement.
Objective 1.0: Create safe and efficient patterns of circulation.Policies:
1.1 Provide criteria for the location of ingress and egress points on all arterialand collector streets.
1.2 Review the current policies for curbs, gutters and sidewalk placement.
1.3 Encourage secondary access in all areas that plan to develop over 100residential lots or commercial and industrial areas.
1.4 Develop a program to pave all streets that have development on them orserve as the access to developed areas.
Objective 2.0: Provide aesthetically pleasing circulation systems.
Policies:2.1 Develop roadway landscape standards for landscaped medians and other
portions of the unpaved rights-of-way.
2.2 Encourage the design of off-street parking area to be adequatelylandscaped.
Objective 3.0:Provide for and encourage use of non-vehicular modes of transportation
Policies:3.1 Ensure that new developments will be designed and provide for pedestrian
and bicycle paths.
3.2 Develop standards for bikeways systems along roadways, off-road areasand in drainage ways.
6

PARKS, RECREATION, TRAILS ANDOPEN SPACE ELEMENT
GOALS, OBJECTIVES AND POLICIES
GOAL: To provide the necessary recreational opportunities to meet the needs ofthe citizens of Kingman through the acquisition of land for open space andpark sites and the funding and development of new parks and trails whileremaining committed to maintaining and improving the condition andsafety of existing facilities and programs.
Objective 1.0: Provide newly developed park space city-wide, based on the levelof service standards established in this plan to address growth andmaintain and improve the existing high quality park systemexpected by the citizens of Kingman.
Policies:
1.1. Concentrate park development efforts on neighborhood parks and play lotsto provide developed park space within walking and bicycling distance ofarea residents.
1.2: Open space, parks and recreation uses should be a high priority in thedevelopment of any State Lands.
1.3: Consideration should be given to requiring open space, parks andrecreation areas in developments and subdivisions.
1.4: Hold public hearings and use other forms of citizen input prior to thecreation of parks and play lots to ensure strong neighborhood support andcommitment to the project.
Objective 2.0: Continue the current program of open space acquisition,concentrating on areas of unique geographical formation areas withlimited development potential due to slope or flooding potential,and areas of archeological significance.
Policies:
2.1: The mountains, hillsides, buttes and viewsheds that frame the Kingmanarea as well as natural habitat areas should be preserved. The purchase ofproperty for the preservation of open space and providing buffers todevelopment should be prioritized within the designated open spacereserves.
7
2.2: Flood zone areas, drainage easements/parcels, watercourses anddrainageways should be maintained as parks, open space and greenbeltswhenever feasible.
2.3: Continue to work with the Bureau of Land Management to acquireproperty for open space preservation as part of the Cerbat FoothillsRecreation Area.
Objective 3.0: Ensure that access to and between open space areas is protectedand preserved and improve these connections with developedmulti-use paths and trails.
Policies:
3.1: Follow the recommendations of the City of Kingman Pedestrian andBikeway Plan 2000 with regard to developing bicycle and pedestrianfacilities.
3.2: Develop multi-use paths and trails along washes, utility and transportationcorridors to connect parks and open space areas, creating linear parks.
3.3: Continue to work with the U.S. Bureau of Land Management (BLM) toplan and develop multiple use trails in the Cerbat Foothills RecreationArea based upon the management agreement signed by both entities.
Objective 4.0: Continue and improve current efforts to address the constantlychanging demand for recreational programs to serve all elementsof Kingman’ s population.
Policies:
4.1: Use questionnaires and community surveys to identify the level ofcommunity interest in various City programs and facilities.
4.2: Continue to monitor park space to determine which facilities are overusedor abused.
Objective 5.0: Identify and use where appropriate various funding sources for theacquisition, development, operation and maintenance of parks,recreational programs, open space and trails.
Policies:
5.1: Acquire property for parks, open space or trails through a variety of meansincluding, land donations, General Fund budgeting, general obligationbonds, land trades, grant programs, cooperative agreements with othergovernmental agencies, purchases for other public facilities and theArizona Preserve Initiative.
8

5.2: Fund construction of parks and trails through the General Fund budgeting,grant funds and general obligation bonds.
5.3: Keep user fees to the minimum needed to cover direct costs of theprograms in order to make them as affordable and accessible as possible.
Objective 6.0: Address safety issues in the design, development, and maintenanceof park and open space areas.
Policies.
6.1: Parks should be safely accessible by pedestrians and bicyclists.
6.2: New park facilities will incorporate low-maintenance features to addressmaintenance and vandalism issues from the onset.
6.3: New park site plans will incorporate safety features. These could includeseparating sports areas from picnic and playground areas, allowing foremergency vehicle access and providing security lighting in any restroombuildings.
6.4: Explore the possibility of working with private organizations towarddeveloping an adopt-a-park or adopt-a-trail program to assist withmaintenance and vandalism issues.
9
COST OF DEVELOPMENT
GOALS, OBJECTIVES AND POLICIES
GOAL: To apportion the costs of development by ensuring that development paysits “fair-share” of the costs of additional public service facifities, and needsgenerated by new development.
Objective 1.0: Ensure that City services, facilities, equipment and infrastructureproperly serve the community in a manner that enhances quality oflife, optimizes existing facilities, and provides for future needs.
Policies:
1.1 Identify levels of service indicators for the delivery of City services thatreflect the typical experiences of residents and visitors.
1.2 Maintain adequate levels of City facilities and services for existing and newdevelopment.
1.3 Identify strategies for redevelopment and infihl and enhancing existing servicedelivery for City residents and visitors.
1.4 Identify and use a variety of sources to finance necessary City services,facilities, equipment and infrastructure that meet community needs, includingconsideration of levying a primary property tax, if approved by the voters.
1.5 Adopt the City’s Capital Budget program annually as well as a five yearprogram.
1.6 Form special improvement districts to provide for improvements such asutility undergrounding, and storm drainage updates in specific areas.
1.7 Encourage dedication of open space; parks and park sites in considerconjunction with development.
1.8 Evaluate public/private partnerships, and development agreements.
1.9 Require concurrent infrastructure development with any hard zoning approval.
10

Objective 2.0: Ensure new development pays its fair share of municipal costsnecessary to support impacts created by new development.
Policies:
2.1: Continue to require new development pay for its fair, proportionate shareof service and infrastructure costs through development agreements,development impact fees, community facilities districts and otherappropriate methods.
2.2: Periodically review the need for development impact fees to ensure thatthe City collects sufficient monies to construct additional infrastructureneeded to serve new residents and businesses developing in Kingman.
Objective 3.0: Coordinate with non-municipal utility providers to ensure adequateservices are provided for existing users as well as newdevelopment.
Policies:
3.]: Work with non-municipal utility providers to ensure adequate levels ofservice and upgrade services for new development as necessary.
3.2: Coordinate with non-municipal utility providers in the planning of newfacilities/corridors and upgrade and/or expansion of existing facilities.
Objective 4.0: Cooperate with other governmental and public entities as a strategyto reduce and share certain costs of development.
Policies:
4.] Coordinate with Mohave County with regard to sharing infrastructureimprovement costs prior to annexation.
4.2 Encourage infrastructure improvements that meet City developmentstandards in County areas subject to annexation.
4.3 Actively coordinate with local school districts, charter schools andinstitutions of higher learning in the planning, construction andrehabilitation ofjoint use facilities.
11

ENVIRONMENTAL PLANNING ELEMENT
WATER RESOURCES
GOALS, OBJECTIVES AND POLICIES
GOAL: To ensure that all development within the municipal water system servicearea shall have an adequate and secure source of water for domestic use and fireprotection flows.
Objective 1.O:Maintain current and long term water demands through sustainable andappropriate development.
Policies.
1.1: Approve new water service in accord with the Municipal UtilityRegulations.
1.2 Continue to use Mohave County Water Authority funds to upgrade,enhance and expand water resource opportunities for the KingmanMunicipal Water System.
1.3 Encourage development to occur adjacent to existing utilities.
1.4 Work with other jurisdictions to discourage remote 40 acre subdivisionsand their unregulated lot splitting that could have the cumulative effect ofdamaging ground water resources.
Objective 2.0: Continue and enhance water conservation programs and policies.
Policies:
2.1: Develop a plan for groundwater recharge within the next 10 years.
2.2: Conserve groundwater resources by utilizing water conservationtechniques, water conserving appliances in home, businesses andindustrial uses and encourage appropriate drought tolerate landscaping.
2.3: Encourage low water use economic development enhancements in thecommunity.
2.4: Discourage large water users from establishing in the community.
12

Objective 3.0:Protect the City’s water resources from all potential sources ofcontamination
Policies:
3.1: Absolutely protect the existing ground water, the current sole source forKingman’s water from any pollution that will downgrade the community’squality of life.
3.2: Absolutely protect city well and tank sites from unauthorized entry,sabotage and other terrorist-type activities through the use of fencing,locked gates, alarm systems, and other security measures as needed.
Objective 4.0: In the next 10 years, develop an economically effective use ofreclaimed effluent.
Policies:
4.1: Discourage the development of artificial lakes unless using reclaimedwater or effluent.
4.2: Explore the use of reclaimed effluent where there is a site-specific demandthat is sufficient to justify the investment for the requisite infrastructure.
4.3: Keep user fees to the minimum needed to cover direct costs of theprograms, in order to make them as affordable and accessible as possible.
AIR QUALITY AND RESOURCE CONSERVATION
GOALS, OBJECTIVES AND POLICIES
GOAL: To ensure the maintenance of high air quality standards and theconservation of natural resources in the Kingman area while encouragingquality development to enhance the image of the area.
Objective 1.0: Develop policies and continue programs to help the area’s air quality bydecreasing automobile dependence by promoting pedestrian, bicycle andtransit alternatives.
Policies:
1.1 Expand City’s sidewalk system along existing streets through theestablishment of improvement districts and other funding mechanismswhenever feasible.
1.2 Continue to enforce bicycle parking requirements which require most newdevelopment to install bicycle racks.
13

1.3 Continue to promote and expand, as needed, the Kingman Area RapidTransit (KART) system.
1.4 Consider land use policies that place services in proximity to residentialareas to decrease the necessity of vehicle trips.
1.5 Encourage employers with over 25 employees to develop traffic reductionprograms such as car pooling.
Objective 2.0: Develop policies and enforce existing ordinances designed to reduceexisting air and water pollution sources.
Policies:
2.1: Monitor air quality at construction projects and enforce existing City dustcontrol ordinance.
2.2: Enforce ordinances against clear grading of property unless immediatelyprior to development and continue to require permits for other gradingprojects.
2.3: Promote the paving of unpaved streets through the Low Cost MaintenancePaving Program and through Improvement District projects.
2.4: Continue to enforce paved parking requirements for new commercial andcommercial areas that have a change of use or occupancy.
2.5: Protect area aquifers from degradation from non-point pollution sourcesby continuing to monitor well sites for pollution contaminates.
2.6: Support zoning and development policies which support industries that arenot “major point-source of pollution” operations.
Objective 3.0: Develop polices and enforce existing ordinances to mitigate potentialhazards to development caused by the natural and man-madeenvironment
Policies:
3.1: Continue to enforce the Hillside Development ordinance in hillside areas.
3.2: Limit development around the hills and buttes and similar topographicfeatures in order to protect the public from erosion and geologic hazards.Foothill development should be limited to rural or low density residential.
14

3.3: Street grids should respond to topography. Cuts and fills should beavoided where possible. Curvilinear streets may have to be used in someinstances.
3.4: Continue to implement the recommendations of the Kingman Area MasterDrainage and Design Manual to serve as a guide for providing a stormdrainage system in Kingman, which offers the greatest affordableprotection from hazards and nuisances and which complies with State,Federal and local regulations.
Objective 4.0: Promote environmental awareness, conservation of resources andmethods to protect and enhance the image of Kingman
Policies:
4.1: Promote the use of energy efficient site design and constructiontechniques.
4.2: Promote the use of passive solar energy to light and heat residential,commercial, industrial, and public/government buildings.
4.3: Encourage the use of low-water use vegetation and other drought-tolerantplants, as developed by the local Soil Conservation Office, especiallyalong sidewalks, in parking lots and along streets.
4.4: Encourage the preservation of the original landscape wherever feasible.
4.5: Identify strategies to reuse effluent for irrigation purposes.
4.6: Continue adequate solid waste collection and disposal which complieswith Arizona Environmental Regulations, minimizes solid waste, andprovides opportunities for recycling.
4.7: Implement education programs to raise awareness of impacts of litteringon Kingman’s environment.
4.8: Enforce the Public Nuisances and Property Maintenance Ordinance andAnti-Noise Ordinance to abate trash, weeds, unkempt buildings,inoperable vehicles and other potentially hazardous or offensive uses.
4.9: Continue to enforce the Outdoor Lighting Code to promote dark skies.
4.10: Continue to enforce the Underground Utility Ordinance
15

91

CHAPTER 2DEMOGRAPHICS
2010 U.S. CENSUS
In reviewing the findings from the 2010 decennial U.S. Census for Kingman, MohaveCounty, the State of Arizona, and the United States as a whole, a profile of Kingman canbe developed to see how the community compares to the county, state and nation. Froma population standpoint point, Kingman has about 14-percent of the Mohave Countypopulation on about one-fourth of one percent of the Mohave County land area. Althoughthe City has a lower percent (19.1%) of its population over 65-years of age compared to24-percent of the overall Mohave County population (24%), the City exceeds the State’spercent of 14.2-percent and the national percentage of 13.3-percent.
The median age in Kingman is 38.7 years, which is slightly younger than the MohaveCounty median age of 42.8.
RACIAL COMPOSITION
Kingman has a predominantly white population (88%), which is lower than the MohaveCounty percentage of 92.5-percent, but higher than the State percentage of 84.6-percentand the national composition of 78.1-percent. However, Kingman exceeds the County,State and nation in the percentage of white residents who are not Hispanic (81.3%). TheCity exceeds all comparison population groups in people reporting to be two or moreraces (3.1%). Kingman’s Hispanic population percent is lower than the County, State andnation.
EDUCATION
Kingman has a higher percentage (86.6%) of high school graduates or greater thanMohave County (83%), the State of Arizona (85%) and the nation (85%). Even thoughthe City’s population exceeds the Mohave County percentage of people with bachelordegrees or higher, (15.4% compared to 12%), the City fall significantly below the Stateof Arizona percentage of 26.3-percent and the national average of 27.9-percent. Frominformation gathered by the consulting firm, Buxton, in 2012, Kingman has 34-percent ofits population whose highest educational achieve is a high school diploma; 27.9-percentwith some college, but no degree; 8.8-percent with an associates degree; 10-percent witha bachelor degree; and 5.3-percent with a graduate degree.
HOUSING
Homeownership percentage is slightly lower in Kingman (64.9%) than Mohave County(7 1.5%), the State of Arizona (67.4%), and the nation (66.6%). Housing values are lowerin Kingman than in the comparative jurisdictions. A median value of an owner-occupied
17
house in Kingman from 2006 to 2010 was $161,700. Mohave County has a medianhousing value of $171,000 for owner-occupied housing units and such housing in theState of Arizona had a median value of $215,000. Nationally, the median value of anowner-occupied house was $188,400.
INCOME
According to the 2010 U.S. Census, the median income in the City was slightly higher($43,849) in 2006-2010 than the County ($39,785), but lower than the State’s medianincome of $50,448 and the national median income of $51,914. The 2007 retail sales percapita figure for Kingman was $36,218, which is significantly higher in the City thanMohave County ($14,489), the State’s per capita of $13,637, and nationally of $12,990.Bullhead City had a per capita retail sale figure of $13,919, and Lake Havasu City had aper capita retail sales figure of $15,414. This latest statistic is not as a result of Kingmanresidents spending significantly more than the average county, state, or US citizen, butrather, it demonstrates that Kingman serves more county residents and travelers.
Information provided to the City by Buxton, shows the 2012 average household incometo be $54,992, with the median income being $45,828, and the per capita income of$22,384. There was 11.2-percent of the Kingman’s population with a household incomeover $100,000. The percent of households with a household income under $35,000 a yearis 37.2-percent. Therefore, 51.6-percent of the households in Kingman have an annualhousehold income of more than $35,000, but less than $100,000.
VEHICLES
There were 20,262 vehicles in Kingman, which averages to two vehicles per household.However, 62.5-percent of the households (approximately 7230-households) have two ormore vehicles, 34.2-percent (approximately 3950-households) have only one vehicle, and3.4-percent (approximately 390-households) have no vehicle.
POVERTY
Kingman has slightly less of its population living below the poverty level (13.2%) incomparison to Mohave County (16.1%), the State of Arizona (15.3%) and nationally(13.8%). Kingman appears to be close to the national norm.
ECONOMY
In 2011, Mohave County commissioned a Target Industry Analysis to provide a strategicframework for public policy by identifying those industries that share the demand for asimilarly educated labor pooi, supply chain or customer base. It’s a method utilized byeconomic development organizations to understand the market and align their limitedresources in order to more effectively create jobs, brand, and market their community andregion.
18

This Targeted Industry Analysis focused on the southern portion of Mohave County,where the majority of the population and economic activity is concentrated. The threedistinct regions analyzed for this study included Bullhead City/Laughlin, Kingman, andLake Havasu City.
Most of the data utilized in this analysis comes from the U.S. Bureau of EconomicAnalysis, U.S. Bureau of Labor Statistics, and IMPLAN. The data year for employment,industry wages, and occupational wages is 2009. Industry growth rates are measuredfrom 2005 to 2009 and occupational growth projections are for 2008 to 2018, which isthe most current data available. Industries were categorized by the North AmericanIndustrial Classification System (NAICS) used in the United States, Canada, and Mexico.
There are several steps utilized in the analysis to identify industry targets and ultimatelythe aggregation of industries into cluster families. After defining the study area, ananalysis of existing employment is undertaken to uncover the concentration ofemployment by industry, its growth rate and the average industry wage based on payroll.
The Kingman Economic Region is made up of eight zip codes that encompass 2,133square miles, which contained 61,735 people in 2009. The Kingman region has thehighest population density of the three geographies detailed in the Mohave County TargetIndustry Analysis at 28.9 persons per square mile, whom compose a total of 24,063households, with a household size of 2.6. Approximately 52 percent of these householdsearn between $15,000 to $50,000. Total employment in this economic region is 21,334persons with an average income of $40,027. The major employers in the KingmanEconomic Region include Kingman Regional Medical Center, American WoodmarkCorp., IWX Motor Freight, and McKee Foods.
The industry clusters represent the priority areas approved by the regional economicdevelopment partners. Over time these clusters should be reviewed and updated in orderto respond to changing market conditions and maximize economic developmentopportunities. The industry cluster recommendations are not intended to entirely replaceexisting economic and workforce development efforts, but rather supplement them. Forexample, workforce development efforts in the County should continue to focus on areasof need such as construction and waste management training.
The Target Industry Analysis provides an overview of each industry cluster identifyingthe types of industries embodied within the cluster, its significance in the region, and howwell it pays in aggregate.
Aviation
The Aviation Cluster provides commercial and industrial aviation operational supportservices, as well as, the manufacturing of aviation parts and products, and the restorationof airplanes and other aviation equipment. Specific Aviation Cluster activities includeairport operation and maintenance, airplane restoration, airplane maintenance, andairplane hangar storage.
19

The existing Aviation Cluster in the Kingman Economic Region at the Kingman Airportbuilds on the historic use of the area for an Air Force training field, then one of fivenational aircraft disposal centers, which involved storage, sales, and scrapping activities.Once these Armed Forces activities subsided, the airfield was transferred to civilian usein 1949. The Industries that make up the existing Aviation Cluster in Mohave Countyhave an average annual pay of $62,197, surpassing the total Mohave County Industryannual pay of $39,133 by $23,064.
Energy
The Energy Cluster produces electricity through various means of generation including,but not limited to, natural gas, biomass, wind, PV solar, and other fuel sources. ThisCluster also involves the transmission and distribution of electric power, and distributionof natural gas.
Certain energy industries are growing nationally, as well as locally, as government policyhopes to nudge the industry to cleaner burning fuels and alternative energy sources. TheKingman Economic Region receives its natural gas supplies through pipelines thatoriginate in New Mexico and Texas. In addition, much of Northern Arizona has beenrated favorably for wind power generation potential. At $78,016, the existing industriesin the Energy Cluster in Mohave County exceed the County’s average annual industrypay, $39,133, by $38,883.
Healthcare Services
The Healthcare Services cluster includes industries offering health services primarily tothe general public through hospitals, medical facilities and offices. The HealthcareCluster includes a full spectrum of health services including mental health, pediatrics,acute care, long-term care, outpatient services, home healthcare, and elderly care.
Each Economic Region contains a hospital facility and is poised to add healthcarefacilities as the population grows larger and demand increases for these services. Theexisting Healthcare Services Cluster in Mohave County has average annual pay of$51,327, which is $12,194 higher than the overall County average annual pay of $39,133.
Manufacturing
The Manufacturing Cluster is involved in the production of hard-goods ranging the gamutof materials from composites and metals, to plastics and refractory materials. Thesegoods may be simple one piece components, mechanical devices, electronics, complexmultiple part apparatus, or anything in between.
Manufacturing Industries have been a mainstay of the Arizona economy for decades, andthe Mohave County Region is no exception. The Kingman Economic Region contains themost manufacturing activity, followed by the Lake Havasu City Economic Region. The
20

industries that make up each economic region’s cluster vary, however the AverageAnnual Pay for all manufacturing industries currently operating in the Clusters identifiedin Mohave County is $50,630, and is $11,497 higher than the overall Mohave CountyAverage Industry Wage at $39,133.
Mining
The Mining Cluster includes industries involved in and supporting the extraction ofnaturally occurring mineral solids, liquids, and gases. It also includes quarrying, welloperations, and the general processing of mined material. The core of this cluster operatesmines, quarries, and wells, while the main mining support activities include geophysicalexploration.
The Mohave County Mining Cluster has its roots in the extraction of metallic ores andnon-metallic minerals. This Cluster is experiencing resurgence as metal prices haveincreased over the last decade and many uranium claims have been established of late, inthe immediate vicinity. Mohave County also contains oil and natural gas extractionactivities, in addition to coal mining, which support energy generation, and the quarryingof sand and gravel. The Mining Cluster in Mohave County pays an average annual wageof $71,218, which is $32,085 higher than the overall Mohave County Average IndustrialAnnual Pay at $39,133.
Motorsports
The Motorsports Cluster provides products and services to the myriad of motorsportsindustries including but not limited to the automotive, motorcycle, marine, off-road,street-legal, and professional track and other racing motorsport activities. These productsand services include parts suppliers, fabricators, maintenance, restoration, andafter-market replacement and upgrade components manufacturers, suppliers, wholesalers,and retailers.
Although the Motorsports Cluster is considered to be in the Lake Havasu City EconomicRegion, many Kingman residents are employed in the test facilities located in Yucca. TheMotorsports Cluster is largely made up of industries that appeal to automotiveenthusiasts. This economic region is based upon an original planned community that hasalways focused on tourism, and motor boating in particular. The Motorsports Cluster inMohave County enjoys a higher average annual pay than the County as a whole at$41,048, which is $1,915 higher than the overall Mohave County Average IndustrialAnnual Pay at $39,133.
Transportation and Logistics
The Transportation and Logistics Cluster is primarily involved in the movement ofgoods, including but not limited to, freight hauling, storage, and distribution. The core ofthis cluster revolves around trucking, rail hauling, and warehousing, however, includesair and marine freight and other storage and distribution activities.
21

The Kingman Transportation and Logistics Cluster is currently in a strategic position forgrowth as Pacific ports and other west coast inland ports continue to reach capacity andpush eastward. The ability for multimodal transportation opportunities also abound withKingman’s access to major highway, rail, and airport operations in the vicinity. TheTransportation and Logistics Cluster in Mohave County pays an average annual wage of$67,623, which is $28,490 higher than the overall Mohave County Average IndustrialAnnual Pay at $39,133.
2015 DEMOGRAPHIC PROJECTION
Kingman is projected to grow at a five-percent annual growth rate to a 2015 populationof 36,000. The projected average household size will be 2.38 persons per household,down from the current 2.52 persons per household. Although Kingman is projected togrow, it is projected to lose a number of its young adults. Incomes will rise slightly.
Employment
The U.S. Bureau of Labor Statistics information for Mohave County is the same as thelabor statistics for the Lake Havasu City-Kingman Metropolitan area. In comparison withthe State of Arizona, Mohave County shows a lower than average percent of its laborforce employed in information system type work and a higher than average percentageemployed in State and local government. The other employment sectors are comparableto the State of Arizona in terms of percentage of total labor force.
Bureau of Labor Statistics
Total Nonfarm Payroll Employment -
Private Sector 37,500
Goods-Producing Industries 5 100
Service-Providing Industries 40,900
Private Service Providing 32,400
Mining and Construction 2,400
Manufacturing 2,700
Trade, Transportation and Utilities 10,400
Information 700
Financial Activities 1,600
Professional and Business Services 3,600
Education and health services 8,400
Leisure and Hospitality 5,700
Other Services (except Public Administration) 2,000
Government 8,500
Federal Government 500
State and Local Government p00
Lake Havasu
September 2012 CitylKingman State ofMetropolitan ArizonaArea
2,474,600
2,049,100
284,700
2,189,900
1,764,400
263,300
152,000
480,900
282,100
1 170,300356,500388,200265,80087,500425,50056,200
369,300
22
CONCLUSION
Kingman has a larger percentage of seniors than Arizona and the United States.Programs, services, and land use planning decisions should be made to accommodate alarge senior population, plus to attract a younger population. Health care facilities, theneed for facilities to have accessibility features and facilities that allow greater low-intensity physical exercise are considerations in land use planning. Community amenitiesto attract a younger population are also needed. More neighborhood parks andrecreational facilities are needed. Safe sidewalks programs, particularly to known activedestinations, are needed to link neighborhoods and the community.
Kingman will largely remain the same unless intervention takes place. Kingman is anidentified retail center, therefore progress towards developing the two proposedinterchanges on 1-40 at Kingman Crossing and Rancho Santa Fe Parkway will providegreater opportunity for regional retail development.
Along with the income from retirees, Kingman’s economy is based on manufacturing.Kingman is the manufacturing center of Mohave County and Kingman must enhance itsworkforce, along with create the infrastructure to sustain and attract manufacturers.
The development of post-secondary educational facilities is vitally important to retainyoung adults, increase the educational level of those in the current workforce and toattract educated people to locate in Kingman. The development of Mohave CommunityCollege; along with the further enhancement of the Northern Arizona Universityextension; plus Arizona State University in Lake Havasu City are all elements to furtherthe educational upgrades needed in Kingman.
The private owned vehicle is important in Kingman and the surrounding area. Althoughthe City of Kingman operates the Kingman Area Regional Transit (KART), the system isunderfunded and infrequent to serve a significant portion of the workforce for commutingpurposes and the citizenry for routine transportation needs. The transportationinfrastructure continues to be developed to support private vehicles.
The large portion of the population is retired which identifies the need for greater healthcare facilities and skilled health care professionals. The Kingman Regional MedicalCenter’s expansion is an important element of the community and essential part of thecommunity’s economy.
23

C) 00 00 C OZO00 ow
c 3’. 3’.o coD 0
People QuickFacts g
Population, 201 1 estimate 28,279 202,351 13.98% 6,482,505 0.44% 311,591,917 0.01%Population, 2010 (April 1) estimates base 28,068 200,186 14.02% 6,392,013 0.44% 308,745,538 0.01%Population, percent change, April 1, 2010 to July 1,2011 0.8% 1.1% 72.73% 1.4% 57.14% 0.90% 88.89%Population, 2010 28,068 200,186 14.02% 6,392,017 0.44% 308,745,538 0.01%Persons under 5 years, percent, 2011 6.4% 5.3% 120.75% 6.9% 92.75% 6.50% 98.46%Persons under 18 years, percent, 2011 23.3% 20.2% 115.35% 25.1% 92.83% 23.70% 98.31%Persons 65 years and over, percent, 201 1 19.1% 24.0% 79.58% 14.2% 134.51% 13.30% 143.61%
Female persons, percent, 2011 51.1% 49.9% 102.40% 50.3% 101 .59% 50.80% 100.59%
Population CharacteristicsRacial and EthnicWhite persons, percent, 2011 (a) 88.0% 92.5% 95.14% 84.6% 104.02% 78.10% 112.68%
Black persons, percent, 2011 (a) 1.0% 1.2% 83.33% 4.5% 22.22% 13.10% 7.63%American Indian and Alaska Native persons, percent,2011 (a) 1.7% 2.7% 62.96% 5.2% 32.69% 1.20% 141.67%
Asian persons, percent, 2011 (a) 1.7% 1.2% 141 .67% 3.0% 56.67% 5.00% 34.00%Native Hawaiian and Other Pacific Islander persons,percent, 2011 (a) 0.3% 0.2% 150.00% 0.3% 100.00% 0.20% 150.00%
Persons reporting two or more races, percent, 2011 3.1% 2.2% 140.91% 2.5% 124.00% 2.30% 134.78%
Persons of Hispanic or Latino Origin, percent, 2011 (b) 12.5% 15.2% 82.24% 30.1% 41 .53% 16.70% 74.85%
White persons not Hispanic, percent, 2011 81.3% 79.0% 102.91% 57.4% 141.64% 63.40% 128.23%
Foreign born persons, percent, 2006-2010 5.2% 6.4% 81 .25% 14.2% 36.62% 12.70% 40.94%
Language other than English spoken at home, pct age 5+,2006-2010 8.3% 10.7% 77.57% 27.1% 30.63% 20.10% 41.29%
24

(0 00 00 C OZO
c Fr3 o o .O
W ‘<CD WO W
.
People QuickFactsEducationHigh school graduates, percent of persons age 25+,2006-2010 86.6% 83.0% 104.34% 85.0% 101.88% 85.00% 101.88%Bachelor’s degree or higher, pct of persons age 25+,2006-2010 15.4% 12.0% 128.33% 26.3% 58.56% 27.90% 55.20%Mean travel time to work (minutes), workers age 16+,2006-2010 15.2 19.4 78.35% 24.8 61.29% 25.2 60.32%
Housing InformationHousing units, 2011 11,570 111,845 10.34% 2,864,335 0.40% 132,312,404 0.01%
Living in same house 1 year & over, 2006-2010 69.0% 79.3% 87.01% 79.8% 86.47% 84.20% 81.95%
Homeownership rate, 2006-2010 64.9% 71.5% 90.77% 67.4% 96.29% 66.60% 97.45%Housing units in multi-unit structures, percent, 2006-2010 13.5% 9.8% 137.76% 20.7% 65.22% 25.90% 52.12%Median value of owner-occupied housing units, 2006- $161,702010 0 $170,600 94.78% $215,000 75.21% $188,400 85.83%
Households, 2006-2010 10,622 80,361 13.22% 2,326,468 0.46% 114,235,996 0.01%
Persons per household, 2006-2010 2.52 2.44 103.28% 2.63 95.82% 2.59 97.30%Per capita money income in past 12 months (2010 dollars)2006-2010 $22,353 $21,523 103.86% $25,680 87.04% $27,334 81.78%
Median household income 2006-2010 $43,849 $39,785 110.21% $50,448 86.92% $51,914 84.46%
Persons below poverty level, percent, 2006-2010 13.2% 16.1% 81 .99% 15.3% 86.27% 13.80% 95.65%
Employment InformationTotal number of firms, 2007 2,930 14,568 20.11% 491,529 0.60% 27,092,908 0.01%
Black-owned firms, percent, 2007 S 1.1% 2.0% 7.10%
American Indian firms, percent, 2007 2.0% 2.6% 76.92% 1.9% 105.26% 0.90% 222.22%
Asian-owned firms, percent, 2007 S 1.6% 3.3% 5.70%Native Hawaiian & Other Pacific Islander-owned firms,percent, 2007 F F S 0.10%
Hispanic-owned firms, percent, 2007 6.5% 4.6% 141.30% 10.7% 60.75% 8.30% 78.31%
Women-owned firms, percent, 2007 28.7% 25.9% 110.81% 28.1% 102.14% 28.80% 99.65%
25

0 00 00 C OZO00 0 0 U) 0
( 3 3.D) o -
‘<CD D0 wD
People QuickFacts g
Economic IndicatorsManufacturers shipments, 2007 ($1000) NA 1,349,965 57,977,827 5,338,306,501
Merchant wholesaler sales, 2007 ($1000) 136,902 423,845 32.30% 57,573,459 0.24% 4,174,286,516 0.00%
Retail sales, 2007 ($1000) 993,640 2,837,691 35.02% 86,758,801 1.15% 3,917,663,456 0.03%
Retail sales per capita, 2007 $36,218 $14,489 249.97% $13,637 265.59% $12,990 278.81%
Accommodation and food services sales, 2007 ($1000) 75,590 274,299 27.56% 13,268,514 0.57% 613,795,732 0.01%
Building permits, 2011 308 196 157.14% 13,007 2.37% 624,061 0.05%
Geography QuickFactsLand area in square miles, 2010 34.82 13,311.08 0.26% 113,594.08 0.03% 3,531,905.43 0.00%
Persons per square mile, 2010 806.1 15 5374.0% 56.3 1431 .79% 87.4 922.31%
(a) Includes persons reporting only one race.
(b) Hispanics may be of any race, so also are included in applicable race categories.
EN: Footnote on this item for this area in place of data
NA: Not available
D: Suppressed to avoid disclosure of confidential information
X: Not applicable
S: Suppressed; does not meet publication standards
Z: Value greater than zero but less than half unit of measure shown
F: Fewer than 100 firms
Source: US Census Bureau State & County QuickFacts
26

CHAPTER 3TRANSPORTATION
The Kingman Area Transportation Study (KATS) was prepared in conjunction with the ArizonaDepartment of Transportation and Mohave County. Much of the study is centered on the City ofKingman. Much of the emphasis of the KATS is on road improvement projects to permit privatemotor vehicles to circulate throughout the city easier. This approach appears to be the preferredthe option over capital improvements to enhance mass transit and non-motorized transportationoptions. Convenience, safety and time-savings all favor expanding our road network toaccommodate the private vehicles.
The Transportation Element Update is the Kingman Area Transportation Study. Attached at theend of this General Plan Update is the executive summary of the Kingman Area TransportationStudy.
27

81

CHAPTER 4LAND USE ELEMENT
INTRODUCTION
The Land Use Element is one of the elements required under the Arizona Revised Statutes. The followingitems are required to be addressed:
A) Designate the proposed general distribution and location and extent of such uses of land forhousing, business, industry, agriculture, recreation, education, public buildings and grounds, openspace and other categories of public and private uses of land as may be appropriate to themunicipality.
B) Includes a statement of the standards of population density and building intensityrecommended for the various land use categories covered by the plan.
C) Identifies specific programs and policies that the municipality may use to promote infill orcompact form development activity and locations where those development patterns should beencouraged.
D) Includes consideration of air quality and access to incident solar energy for all generalcategories of land use.
F) Includes policies that address maintaining a broad variety of land uses including the range ofuses existing in the municipality when the plan is adopted, readopted or amended.
F) Includes sources of currently identified aggregates from maps that are available from stateagencies, policies to preserve currently identified aggregates sufficient for future developmentand policies to avoid incompatible land uses, except that this subdivision shall not be construed toaffect any permitted underground storage facility or limit any person’s right to obtain a permit foran underground storage facility pursuant to Arizona Revised Statute Title 45, chapter 3.1.
The Land Use Element specifically addresses items A and B in detail. The Goals, Objectives and Policiesof the Growth Area Element and the Environmental Planning Element of the General Plan address itemsC and D, respectively. Item E is addressed in the Code of Ordinances of the City ofKingman Section 2-133 through 2-137. After researching the available maps from the Arizona Geological Survey, the onequarry in the southeastern portion of the planning area is only designated aggregate site. The currentProjected Land Use Map has designated this site as an industrial area and therefore addresses Item F.
There are two other known quarry sites known in the planning area. One is located at the RattlesnakeWash area north of 1-40 and the other is located northwest of the Camelback area.
29

KINGMAN GENERAL PLAN 2030 PROJECTED LAND USE MAP
PURPOSE AND FUNCTION OF THE LAND USE MAP
The projected land uses, as indicated on the Kingman General Plan 2030 Projected Land Use Map,designate the proposed general distribution, location and extent of such uses of land as housing, business,industry, recreation, public uses, and open space. Densities and intensities of uses are also indicated onthe map and are discussed within the Land Use Element.
The land use map and the Land Use Element both function as a guide for all implementation strategies fordevelopment including zoning. However, they do not have the effect of rezoning any property. The mapgives an indication of the existing and possible future land uses within a given area. It indicates a rangeof residential densities, which already exist or may be possible in the future in a certain area. It alsoindicates the intensities of commercial and industrial uses, for both existing and future development. It isrequired under the Arizona Revised Statutes §9-462.01 .F that when rezoning a particular property therezone must be consistent with and “conform” to adopted General Plan.
However, a particular land use projection by the land use map does not automatically guarantee a specificzoning will be approved on a specific site. The Planning and Zoning Commission and the City Councilcan consider timing of the rezoning request in terms of available infrastructure and access whendetermining the proper zoning. The land use map is also not static in that it may be amended by the CityCouncil when it determines that conditions warrant. However, the land use map should not be viewed asa super-layer of zoning subject to monthly revisions and changes.
LAND USE CATEGORIES
The Kingman General Plan 2030 Projected Land Use Map designates land uses within the GeneralPlan Study Area as either Residential, Commercial, Industrial, Public/Quasi-public or Parks/OpenSpace.
Residential Land Uses are broken into five separate categories that are characterized in terms of density,and which specify a number range of dwelling units per acre (du/ac) as follows:
Rural Density— 1 dwelling unit per acre or lessLow Density— 1-2 dwelling units per acreMedium Density— 3-8 dwelling units per acreIntermediate Density— 9-16 dwelling units per acreHigh Density— 17-28 dwelling units per acre
The density of housing is always a fundamental decision in city design. Public costs of services andprivate development costs that are transferred to the end-user, are closely linked with residential densities.Density provides a benchmark from which the amount and type of public services that must be furnishedcan be measured.
The overwhelming majority of housing stock in the City of Kingman comprises single family detachedhomes, while County areas within the plan area are mostly manufactured homes. Both areas haveresidential densities primarily within the Low and Medium Density spectrum. The residential land usecategories on the map, however, do not indicate a specific dwelling type (i.e. single family detached,
30

single family attached, manufactured homes, mobile homes, apartments, duplexes, triplexes). Thespecific types of dwellings are determined by the uses permitted in each zoning district. However, thenumber of dwelling units per acre does give an indication of the type of residential development that mayoccur. For example Rural, Low and Medium Density Residential Areas are generally going to becharacterized by single family homes that are either site-built or are manufactured. Intermediate and HighDensity Residential Areas are generally going to be characterized by duplexes, triplexes and largerapartment complexes, depending on the size of the individual property.
Commercial Land Uses are broken down into four categories that are characterized by service areaand/or the nature of the goods and services provided. The land use categories do not indicate a specificexisting or projected commercial zoning district. However, in general, Neighborhood Commercial useswill tend to correspond with less intensive land uses typically found in C-i and some C-2 areas. WhileCommunity Commercial, Regional Commercial and Highway Service uses will tend to correspond withmore intensive land uses found in certain C-2 and C-3 areas. The commercial land uses are as follows:
Neighborhood Commercial: These are low intensity commercial areas typically located near orwithin residential areas at “nodes” disbursed throughout various residentially designated areas atmajor crossroads. This land use category would provide for goods and services that fit into aresidential environment without undue detriment to the character of the area. This wouldgenerally include offices and low-intensity small scale retail uses.
Community Commercial: These are mostly major retail/service uses serving the community atlarge that are generally buffered from residential uses. Community Commercial uses are founddispersed throughout the city along major roadways in order to manage projected increases intraffic flows. Development criteria for the Community Commercial land uses demand thatproperty development standards insure compatibility with adjacent non-commercial land uses.
Regional Commercial: These are major commercial shopping areas that are designated atspecific central locations along Stockton Hill Road and E. Andy Devine near the 1-40interchanges. Regional Commercial uses are designated in areas that are in or near adequateinfrastructure and are accessible to a large population base in central Mohave County that wouldbe necessary to support such commercial centers usually located along major arterials.
Highway Service Commercial: These commercial areas are generally located near the 1-40interchanges or along Andy Devine Avenue (Historic Route 66) and West Beale Street (Highway93). Highway Service Commercial land uses provide for traveler oriented establishments such as:Truck stops, hotels, motels, and full-service automotive gas stations.
Industrial Land Uses provide for the development of industrial areas in suitable locations and are brokendown into two categories:
Light Industrial: These areas will accommodate industrial business activities that are notoffensive to nearby commercial and residential uses. Development of such designated landswould be limited to uses such as light manufacturing, assembly, research and development,wholesale distribution, construction, other types of low-intensity industrial activities.
Manufacturing Industrial: These areas are characterized by industrial businesses and useshaving more intensive types of industrial processes such as mechanical and/or chemicalprocessing, extractive uses, materials transfer, multiple-shift operations, and large structures.
31

Public/Quasi-Public land uses include public uses such as government buildings and properties, schoolsites, the Kingman Airport, and quasi-public uses such as maj or places of worship.
Parks/Open Space land uses include developed recreational areas such as public parks and golf courses,as well as lands that are held for, or identified for, recreational use or preservation. They can also includeareas that are not likely to be developed due to topography. This may include hilltops and washes, forexample.
NEIGHBORHOOD PLANNING AREAS
The Kingman General Plan 2030 Projected Land Use Map includes a study area of approximately 79square miles. Within this study area are six geographic areas known as Neighborhood Planning Areasor NPAs. The boundaries of the NPAs follow various political and physical barriers such as major roads,section lines, and municipal boundaries as shown in Figure 1 at the end of this chapter. The overallGeneral Plan Study Area envelopes the City’s water service boundaiy and includes several additionalsections.
The purpose of dividing the study area into six NPAs is to allow for an opportunity to focus on a numberof unique land use issues within each geographic area. The Neighborhood Planning Areas are as follows:
NPA 1: Historic Downtown /West Highway 93 represent approximately 8.5 square miles or about 11-percent of the entire study area and include land both inside and outside the city limits. This NPA islocated in the southwest portion of the study area, and contains Downtown Kingman as well as areas westof 1-40 along West Highway 93 (W. Beale Street). This NPA is characterized as being the historicresidential and existing governmental center of Kingman with a growing boutique-style shopping area inthe CBD and a highway-oriented commercial area west of 1-40.
NPA 2: Hilltop/Country Club represents approximately three square miles or about four-percent of thestudy area and lies entirely within the city limits of Kingman. This NPA is located south of 1-40, northand east of Downtown Kingman, and west of the BN SF railroad tracks. This NPA is characterized as amixture of older affordable housing, and some newer infill residential neighborhoods, existing parks theCity golf course and the County Fairgrounds, and a variety of retail commercial and office development.This NPA has the highest population density per square mile.
NPA 3: East Kingman/Hualapai Mountain Road represents 17 square miles or about 22-percent of thestudy area and includes parts of the City and a portion of Mohave County. This NPA is located south of1-40 and east of the BNSF railroad tracks. This NPA is characterized by a mixture of older, affordablehousing and a rapidly expanding area of higher end residential development on large lots in the easternand southern portions of the NPA. This NPA is the scenic corridor to Hualapai Mountains withopportunities for park development and open space preservation.
NPA 4: Centennial Park/Canyon Shadows represents approximately 11.5 square miles or about 15-percent of the study area and lies partly within the City and partly within Mohave County. This NPA islocated north of 1-40, south of NPA 6: Camelback/New Kingman Addition and west of the BNSF railroadtracks. This NPA is characterized as having rapidly developing commercial and medical areas, and amixture of older affordable housing and higher end influl residential along with multiple familydevelopments and parks.
32
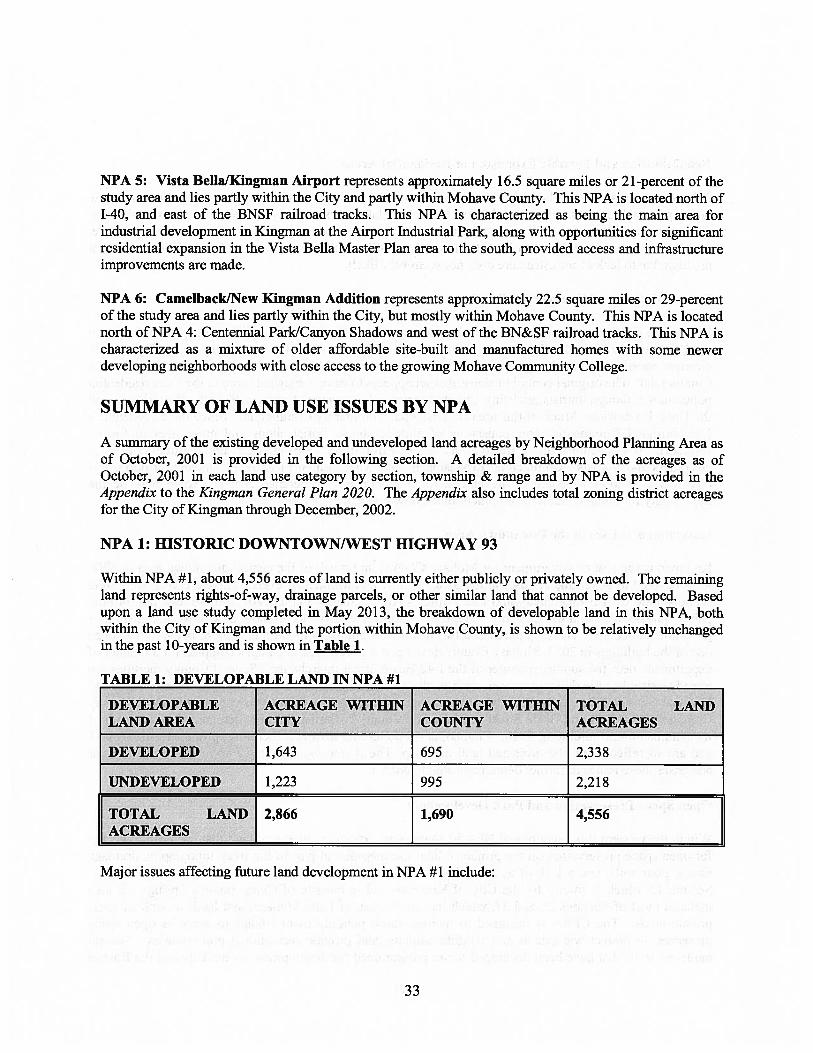
NPA 5: Vista Bella/Kingman Airport represents approximately 16.5 square miles or 21 -percent of thestudy area and lies partly within the City and partly within Mohave County. This NPA is located north of1-40, and east of the BNSF railroad tracks. This NPA is characterized as being the main area forindustrial development in Kingman at the Airport Industrial Park, along with opportunities for significantresidential expansion in the Vista Bella Master Plan area to the south, provided access and infrastructureimprovements are made.
NPA 6: CamelbackfNew Kingman Addition represents approximately 22.5 square miles or 29-percentof the study area and lies partly within the City, but mostly within Mohave County. This NPA is locatednorth of NPA 4: Centennial Park/Canyon Shadows and west of the BN&SF railroad tracks. This NPA ischaracterized as a mixture of older affordable site-built and manufactured homes with some newerdeveloping neighborhoods with close access to the growing Mohave Community College.
SUMMARY OF LAND USE ISSUES BY NPA
A summary of the existing developed and undeveloped land acreages by Neighborhood Planning Area asof October, 2001 is provided in the following section. A detailed breakdown of the acreages as ofOctober, 2001 in each land use category by section, township & range and by NPA is provided in theAppendix to the Kingman General Plan 2020. The Appendix also includes total zoning district acreagesfor the City of Kingman through December, 2002.
NPA 1: HISTORIC DOWNTOWN/WEST HIGHWAY 93
Within NPA #1, about 4,556 acres of land is currently either publicly or privately owned. The remainingland represents rights-of-way, drainage parcels, or other similar land that cannot be developed. Basedupon a land use study completed in May 2013, the breakdown of developable land in this NPA, bothwithin the City of Kingman and the portion within Mohave County, is shown to be relatively unchangedin the past 10-years and is shown in Table 1.
TABLE 1: DEVELOPABLE LAND IN NPA #1
DEVELOPABLE ACREAGE WITHIN ACREAGE WITHIN TOTAL LAN])LAND AREA CITY COUNTY ACREAGES
DEVELOPED 1,643 695 2,338
UNDEVELOPED 1,223 995 2,218
TOTAL LAN]) 2,866 1,690 4,556ACREAGES
Major issues affecting future land development in NPA #1 include:
33

Rehabilitation and Possible Expansion of Residential Areas
NPA #1 contains some of the oldest housing stock within the Kingman General Plan Study Area, and newhousing growth over the last several years has been relatively minor. It is likely that future residentialdevelopment will mostly infill areas where water and sewer lines exist and/or extensions are possible.Major residential expansion into hillside areas where soil conditions are poor and costs of developmentare high due to lack of infrastructure does not seem very likely.
Type and Extent of Commercial Development
Downtown Kingman was once the central business district of the City until residential expansion began inthe 1 960s and 1 970s in the Hilltop area. Within NPA #1 development that is west of 1-40 on Highway 93consists mostly of motels, gas stations and truck stops which are considered Highway ServiceCommercial. The original central business district appears to cater somewhat more to the local residentialpopulation, although tourists are being attracted to several redeveloped areas such as the Powerhouse andthe Hotel Brunswick. Much of this area is considered Community Commercial. Since the early 1 990s aNeighborhood Commercial area consisting of antique shops, florist shops and other uses in formerresidences, has developed along Beale Street east of Fifth Street. This area appears to attract both localcustomers and tourists. Commercial expansion is somewhat limited in NPA #1; however a portion ofcity-owned Section 15 could be developed for a hotel/resort conference center. There may be theopportunity for commercial redevelopment in the downtown area as well.
Governmental Uses in the Downtown Area
Kingman is the seat of government for Mohave County, and much of the central downtown area in NPA#1 is devoted to governmental uses at the State, County and Municipal levels. There are also two publicschools, Palo Christi Elementary and Lee Williams High School Campus. All of these uses fall into thepublic/quasi-public land use category. The City continues to strive to promote downtown Kingman as agovernmental center. The City purchased two downtown buildings in 2005 and 2008, but sold one sinceone of the buildings in 2013. Mohave County developed a governmental campus complex for a number ofdepartments near the southeast corner of the 1-40/Beale Street interchange. Several County facilities arealready existed in the downtown area, such as the Juvenile Detention Facility, the Jail Annex at the oldNational Guard facility, and the Cerbat Justice Court. The Sheriff’s Office was constructed at the CountyComplex site at 1-40 and Beale Street in 2003. The County constructed a new detention facility south ofits administration building in 2010. Public/Quasi-Public land uses are, therefore, prominent in NPA #1and are so reflected on the projected land use map. The Redevelopment and Public Facilities Elementaddresses these issues in further detail regarding to NPA 1.
Open Space Preservation and Park Development
Within the western three sections of NPA #1 there is an extensive amount of land that has been indicatedfor open space preservation on the projected land use map due in part to the steep topography, drainageissues, poor soils, and a lack of access. The Cerbat Foothills Recreation Area (CFRA) includes all ofSection 15 which is owned by the City of Kingman and is the site of Camp Beale’s Springs. It alsoincludes most of Sections 22 and 27, which include Bureau of Land Management lands as well as someprivate lands. The CFRA is designed to manage these publicly owned lands to serve as open spacepreserves, to protect watersheds and wildlife habitats, and provide recreational opportunities. Severalmulti-use trails that have been developed or are programmed for development by the City and the Bureau
34
of Land Management (BLM) are located in this area. In addition to areas being preserved, there are fiveexisting City parks in NPA #1, the largest number of parks in any NPA.
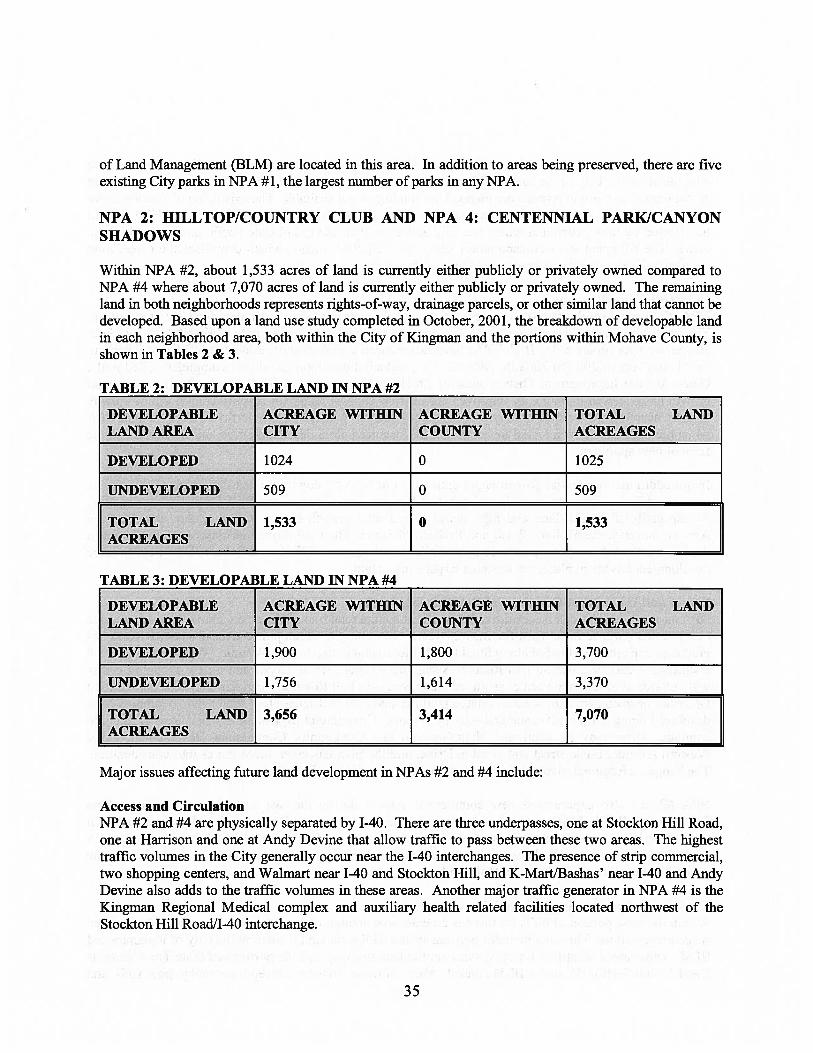
NPA 2: HILLTOP/COUNTRY CLUB AND NPA 4: CENTENNIAL PARK/CANYONSHADOWS
Within NPA #2, about 1,533 acres of land is currently either publicly or privately owned compared toNPA #4 where about 7,070 acres of land is currently either publicly or privately owned. The remainingland in both neighborhoods represents rights-of-way, drainage parcels, or other similar land that cannot bedeveloped. Based upon a land use study completed in October, 2001, the breakdown of developable landin each neighborhood area, both within the City of Kingman and the portions within Mohave County, isshown in Tables 2 & 3.
TABLE 2: DEVELOPABLE LAND IN NPA #2
DEVELOPABLE ACREAGE WITIITN ACREAGE WITHIN TOTAL LAN])LAND AREA CITY COUNTY ACREAGES
DEVELOPED 1024 0 1025
UNDEVELOPED 509 0 509
TOTAL LAND 1,533 0 1,533ACREAGES
TABLE 3: DEVELOPABLE LAND iN NPA #4
DEVELOPABLE ACREAGE WITHIN ACREAGE WITHIN TOTAL LANDLAN]) AREA CITY COUNTY ACREAGES
DEVELOPED 1,900 1,800 3,700
UNIEVELOPED 1,756 1,614 3,370
TOTAL LAND 3,656 3,414 7,070ACREAGES
Maj or issues affecting future land development in NPAs #2 and #4 include:
Access and CirculationNPA #2 and #4 are physically separated by 1-40. There are three underpasses, one at Stockton Hill Road,one at Harrison and one at Andy Devine that allow traffic to pass between these two areas. The highesttraffic volumes in the City generally occur near the 1-40 interchanges. The presence of strip commercial,two shopping centers, and Walmart near 1-40 and Stockton Hill, and K-MartlBashas’ near 1-40 and AndyDevine also adds to the traffic volumes in these areas. Another major traffic generator in NPA #4 is theKingman Regional Medical complex and auxiliary health related facilities located northwest of theStockton Hill RoadJI-40 interchange.
35
Maj or improvements which widened Stockton Hill from two lanes to four lanes north of Gordon werecompleted by the City in the early 2000s. Plans to expand Stockton Hill Road to six-lanes from DetroitAvenue north to Gordon Avenue are planned but funding is not available. The expansion of Gordon Drivetook place in 2013. Bank Street was expanded in 2006. Future development in NPA #2 and NPA #4 willbe affected by how, when and where the City addresses methods to alleviate traffic congestion in theseareas. The Kingman Area Transportation Study (KATS) 2011 update, which comprises the Circulationelement, addresses solutions to many of these traffic issues.
Residential DevelopmentNPA #2, located south of 1-40, is currently the most densely populated portion of the City of Kingman.The current population density is slightly less than 2,000 persons per square mile while NPA #4 has about500 persons per square mile. Both NPAs have experienced a great deal of residential infill, particularly inthe “boom” era of 2003 to 2008. In NPA #2, the residential development almost completely filled in theGates Avenue Improvement District west of Stockton Hill Road. In NPA #4, substantial residentialgrowth has occurred in both City improvement districts such as Kingman Airport Tract north of AirwayAvenue near Willow, as well as in new subdivisions such as Walleck Ranch north of Kino. Also in NPA#4, some high density residential development has occurred along Harrison Drive and Rutherford in theform of new apartments.
Major additional residential growth is not anticipated in NPA #2 due to the fact that much of this area isalready infihled. However, there is still substantial room for additional residential development in NPA#4 especially if intermediate and high density residential growth occurs within a core area betweenAirway, Beverly, the Mohave Wash and Rutherford Street. The City formed an improvement district inthe area north of Airway Avenue and south of Kino Avenue, east of Willow and west of Roosevelt. Somedevelopment has taken place, but this area largely sits vacant
Extent and Intensity of Commercial DevelopmentNPA #4 north of 1-40, can be considered the current commercial hub of Kingman and will likely continueto serve this purpose for at least the next 20 years. Commercial development over the last 10 years hasgradually expanded northward along Stockton Hill Road and along Airway Avenue. Walmart constructeda superstore east of Stockton Hill Road at Sycamore Avenue. Home Depot and a new shopping centerwith a Safeway store have been constructed along Stockton Hill Road between Kino Avenue and GordonDrive has been constructed. Medical related facilities and a 97,000 square foot senior living complex havedeveloped along Western Avenue and Airway Avenue. Commercial expansion in these areas is likely tocontinue. There may be additional Neighborhood and Community Commercial Development alongWestern Avenue, Bank Street and Gordon Drive, and the plan has taken these issues into consideration.The Kingman Regional Medical Center continues to expand throughout the City.
NPA #2 has also experienced new commercial growth during the last several years, mainly alongStockton Hill Road. Much of the development has been in the form of new small scale office and retailuses, along with several conversions of residential homes along Stockton Hill Road into office uses. Amaj or issue in NPA #2 will likely continue to be pressure for additional commercial development near theresidential interface along Stockton Hill Road.
Open Space Preservation and Park DevelopmentWithin the west portion of NPA #4 there is an extensive amount of land that has been set aside for openspace preservation. This area includes portions of the CFRA on land owned by the City of Kingman andBLM. Other areas identified for open space on the land use map include portions of State Trust Sections2 and 36 and Section 35, under BLM control. Much of these lands have steep topography, poor soils, and
36

a lack of access, lack of infrastructure, all of which makes these areas difficult to develop. In addition toareas being preserved, there are two neighborhood parks, with a third neighborhood park programmed inNPA #4 in 2014. A fourth park is planned in the Shangri-La area, however, a specific location is notidentified and lack of funding has been a major obstacle to pursuing new park development. Trailimprovements will occur along the Mohave Wash, which will add to the recreational opportunities in thisarea.
Within the Hilltop/Country Club NPA #2, there are two existing neighborhood parks and the CerbatCliffs Municipal Golf Course. In addition, the City has acquired about 100 acres of hillside land justsouth of the golf course for the White Cliffs Preserve which includes the White Cliffs Wagon Trailhistoric site. This area is also identified for open space preservation and possible recreationaldevelopment in the future. A 5-10 acre neighborhood park is also programmed in 5-10 years near the golfcourse. However, no specific location has yet been identified.
NPA 3: EAST KINGMAN/HUALAPAI MOUNTAIN ROADWithin NPA #3 is about 10,587 acres. This area is one of the most significant areas of growth.Development in this area has largely been higher valued single-family residential development. Thehistorically platted vacant area in the western portion of NPA#3 has infilled with newer moderately pricedsingle-family residential development. Plats have been approved for larger lot development in the easternportion of NPA#3. Based upon a land use study completed in May 2013, the breakdown of developableland in this neighborhood area, both within the City limits of Kingman and the portion within MohaveCounty, is shown in Table 4.
TABLE 4: DEVELOPABLE LAND IN NPA #3
DEVELOPABLE ACREAGE WITHIN ACREAGE WITIIIN TOTAL LANDLAN]) AREA CITY COUNTY ACREAGES
DEVELOPED 1,450 218 1,668
UNDEVELOPED 3,872 5,047 8,919
TOTAL LAND 5,322 5,265 10,587ACREAGES
Major issues affecting future land development in NPA #3 includes:
Access and CirculationNPA #3 is physically separated by both 1-40 and the railroad tracks from the rest of Kingman. The onlyaccess into this area is by way of the Hualapai Mountain Road bridge over the railroad tracks and bytraveling on Eastern Avenue to Airway Avenue, via Kenwood Avenue to Yavapai Drive. Two trafficinterchanges on 1-40 at Kingman Crossing and Rancho Santa Fe Parkway are planned, but funding hasnot been secured for either interchange. The Kingman Crossing traffic interchange is an interchange thatinitially provides access only to the north. This interchange will access approximately 175 acres of futureretail space and hospital. The Rancho Santa Fe Parlcway traffic interchange will provide access to theRancho Santa Fe residential development to the south of 1-40, which has some planned retail developmentareas, and access north of the Kingman Airport area.
37

In 2006, the surface railroad crossing at Louise Avenue was closed when the Airway Underpass wascompleted. At the same time, this neighborhood area has seen perhaps the greatest population increasewithin the City of Kingman since the last plan was adopted in 2003. Commercial development onHualapai Mountain Road has also started to occur over the last several years as well.
Residential Development and DensitiesNPA #3, as mentioned, has experienced a significant amount of mostly residential growth over the last 10years. The Rancho Santa Fe area was first developed with over 400 new single family homes. Othermajor new residential developments have included the Hualapai Mountain Ranch/Fripps Ranchdevelopment, Boulder Springs, Canyon Bluffs, Granite Bluffs, Southern Vista, Hualapai Shadows andHualapai Foothills Estates. Significant infill has occurred in Kingman Park Estates, Kingman Air-RailManor, and Golden Gate Addition. Additional infill can be expected upon completion of the East GoldenGate Improvement District.
This growth has not occurred without some controversy. In 1997 there were two referenda on therezoning of property along Southern Avenue. This was spurred by the opposition of many residents tohigher residential densities in the area that could have occurred under the approved zoning. At the sametime, development costs for water, sewer, underground utilities, and street improvements have continuedto rise, making the cost per lot to develop larger lot subdivisions increasingly expensive. Despite thesecontroversies, it is expected that NPA #3 will be a primary area of residential development due to largeamounts of available land and the proximity to infrastructure.
Perhaps the single biggest unknown in NPA #3 in terms of future residential development is what willhappen on State Trust Section 16. At the present time there is no adopted state plan for Section 16,however, this land is now surrounded on three sides by half acre and one acre residential development. Asewer trunk line has been extended across the northern boundary of Section 16 in order to serve futureareas of Rancho Santa Fe. In 2006, a master plan was developed and the Arizona Land Department heldan auction to sell Section 16. The proposed developer did not bid on the project and no plans to sell thissection of land have been proposed. The location of the sewer line makes it more likely that Section 16,once sold by the State, will develop with residences on lots smaller than what has previously occurred inthe surrounding areas. This is due to the high costs per lot of extending sewer lines in larger lotsubdivisions. Although the land use map does indicate Rural Density Residential 1 unit or less per acreand Low Density Residential, 1-2 units per acre for Section 16, it is certainly possible that should thesection be sold there will be future requests to change the land use scenario in the area. It seems unlikelythat a square mile entirely consisting of 4 acre and greater than one-acre lots will occur in Section 16, dueto the increasing costs of development for such large lots.
Extent and Intensity of Commercial DevelopmentThe City owns 168-acres located directly south of the proposed Kingman Crossing Interchange. Theproperty is currently designated as Parks/Open Space. In 2006, the City approved a major General Planamendment to designate this area as Regional Commercial. A referendum on the resolution that adoptedthis General Plan Amendment was overturned by the electorate in 2007.
There is a neighborhood commercial area at Eastern Avenue and Southern Avenue that has a potential forgreater commercial development. The property owner sought to intensif’ the zoning classification fromCommercial: Neighborhood Convenience (C-l) to Commercial: Community Business (C-2) in 2008. Thisrezoning request resulted in a Planned Development District, but the commercial buildings have beenvacant and vandalized.
38

There has been some commercial development within NPA #3 along Hualapai Mountain Road, but over40-acres of commercially zoned property is vacant. Medical facilities have been constructed. KingmanRegional Medical Center constructed a medical office building in 2012 and the Veterans Administrationis constructing a clinic in 2013. Hualapai Mountain Road has a design review overlay district corridor toassure a southwestern architecture and greater landscaping.
The second major Community Commercial area in NPA #3 is projected at the proposed 1-40 at theRancho Santa Fe Parkway interchange. It should be noted, however, that future commercial developmentof this site would be dependent on the completion of the interchange and at least a portion of the parkway,not to mention extensive infrastructure expansion.
Siting of Public and Quasi-Public UsesAs NPA #3 continues to grow, the ability to site public and quasi-public uses will be of increasingimportance. The siting of schools and places of worship can be controversial at times, especially in ornear residential neighborhoods. This is due to concerns such as increased traffic, safety issues, andimpacts on property values. As a result, the land use plan considers multiple locations for such futurepublic/quasi-public uses to serve the needs of future residents.
Open Space Preservation and Park DevelopmentWithin the southeastern and southwestern portion of NPA #3, there is an extensive amount of land,mostly under the U.S. Bureau of Land Management’s jurisdiction that has been indicated for open spacepreservation on the land use map. Much of this land has steep topography, poor soils, a lack of access,and lack of infrastructure, which would make them difficult to develop should a land trade occur. Inaddition to areas being preserved, there is one existing City neighborhood park, one play lot in a drainagebasin, and one neighborhood park programmed in NPA #3 in the next 3-5 years. A community park isplanned in the next 5-10 years, which is identified within City-owned property on Section 9.
NPA 5: VISTA BELLAIKINGMAN AIRPORT AND NPA 6: CAMELBACK/NEWKINGMAN ADDITION
Within NPA #5 is about 10,048 acres. NPA #6 is about 13,741 acres. Based upon a land use studycompleted in May 2013, the breakdown of developable land in these neighborhood areas, both within theCity limits of Kingman and the portion within Mohave County, are shown in Tables 5 and 6. The Cityhas annexed over 2600 acres in NPA #5 and 1680-acres in NPA #6 since 2003 and an area plan needs tobe developed to this area.
The breakdown between City and County land acreages also takes into account the December, 2002annexation of 1,040 acres in Section 24, T.22N., R.17W. and part of Section 19, T.22N., R.16W. by theCity of Kingman in NPA #6.
39

TABLE 5: DEVELOPABLE LAND IN NPA #5
DEVELOPABLE ACREAGE WITHIN ACREAGE WITHIN TOTAL LANDLAND AREA CITY COUNTY ACREAGES
DEVELOPED 375 2,850 3,225
UNDEVELOPED 5,228 1,595 6,823
TOTAL LAND 5,603 4,445 10,048ACREAGES -______________
TABLE 6: DEVELOPABLE LAND IN NPA #6
DEVELOPABLE ACREAGE WITH]i ACREAGE WITHIN TOTAL LAN])LAND AREA CITY COUNTY ACREAGES
DEVELOPED 275 4,005 4,280
UNDEVELOPED 1,353 7,838 9,191
TOTAL LAND 1,628 11,843 13,471ACREAGES
Major issues affecting future land development in NPAs #5 and #6 include:
Access and CirculationNPA #5 is physically separated by 1-40 and the BN & SF Railroad tracks from areas to the south andwest. At present, there are only two roads into this area. The first is Eastern Street, which is accessibleby way of an underpass at 1-40. The other access is the Airway Avenue Underpass. An unimproved roadlinking this area to the Kingman Airport area, which has an underpass at Mohave Airport Drive whichconnects to the Kingman Airport Industrial Park to Route 66 is a third access. The property owners in thisarea form an improvement district to fund the Airway Avenue Underpass.
As was discussed in NPA #3, the proposed Rancho Santa Fe Parkway linking the east side of Kingmanwith the Airport, 1-40 and Hualapai Mountain Road is indicated on the projected land use map. Theparkway is proposed to continue northward from 1-40 just east of the Vista Bella Master Plan area andconnect into the Kingman Airport Industrial Park. However, the interchange proponents are seekingfunding from the State of Arizona and the City of Kingman. Although the interchange has been designedto a 95-percent stage, there is no funding commitment from either funding source. A secondary accessinto the Kingman Industrial Park from the DW Ranch Road exit at 1-40, just east of the Kingman GeneralPlan 2020 study area, is also indicated. Finally, an underpass at Airway Avenue and the railroad tracks isshown as has been proposed.
In addition, a frontage road paralleling 1-40 has been proposed by a number of local land owners thatwould extend from the I-40!DW Ranch Road interchange east of the General Plan study area, past apossible future Rancho Santa Fe Parkway interchange and connecting with Airway Avenue at Santa RosaBoulevard. This road could serve as an alternative route to commercial and industrial areas movingtraffic away from any future residential development in the Vista Bella area.
40

The proposed Kingman Crossing Boulevard traffic interchange will provide another access to the NPA#5.This interchange will be at milepost 55 with Kingman Crossing Boulevard as the cross street with 1-40.Initially the interchange will only provide access to the north (NPA#5), but a change of access report isunderway for permit access to the south of 1-40. The City is petitioning the Arizona State LandDepartment for right-of-way access along the east side of Sectioni 6.
Within NPA #6, a number of roadway improvements are recommended by the KATS study, which isreflected on the projected land use plan. A parkway corridor, known as the Grace Neal Parkway, isproposed across the northern portion of NPA #6. This roadway could potentially open the area up to newresidential and commercial development. This parkway would also provide essentially a loop-routebypass around the northern and eastern sides of Kingman with a connection through the Kingman AirportIndustrial Park to the parkway in NPA #5 and the future 1-40 interchange.
Residential Development Potential and Possible LimitationsNPA #5 is currently the least populated NPA in the Kingman General Plan Study Area. Residentialdevelopment is mostly confined to the Greater Kingman Addition Improvement District area, and TheVillas and Valle del Sole subdivisions, which are part of the Vista Bella development. Vista Bella has arevised master plan, which includes Section 3 and portions of 4 and 10 that was approved in 2002 withhard zoning. This master plan includes a 9 hole and 18 hole golf course with residential, commercial andindustrial land uses, which are reflected on the projected land use map. This master plan area has beenaltered by the selling of the southwest portion of the property to the Kingman Unified School District forthe placement of two schools.
The future development of Vista Bella as well as other residential areas of NPA #5 will depend on anumber of factors, but most importantly it will depend on extensive infrastructure expansion includingmajor road improvements and the extension of water and sewer lines.
NPA #6, which primarily lies outside the City limits, is the largest NPA in the Kingman General PlanStudy Area at about 22 square miles. It also has the highest population of any NPA at 15,101, with anoverall density of approximately 700 persons per square mile. Population growth in this area has beensomewhat slower than the City of Kingman. Average annual growth rates in the City over the last 40years have been 4.5-percent. The average annual growth rate in the New KingmanlButler CDP, whichincludes NPA #6 has been 2.7-percent over for the same period.
Most of the population lies south of Jagerson in the New Kingman Addition, Chaparral Mesa, andCollege Heights subdivisions. This area is developed with lot sizes mostly less than 8,000 square feet insize. A significant number of residences are either manufactured homes or older mobile homes. Also,much of this area is presently on individual septic systems except some newer areas, such as ChaparralMesa. The ability to extend and the timing of the extension of infrastructure such as water and sewer willlargely guide where, when and what type of new residential development will occur in this area.Although much of this NPA lies outside the City limits, it still mostly lies within the City’s water servicearea. Because of requests for water service in unsubdivided areas and for new subdivisions, the Citycould play a significant role in guiding the location and type of residential development in NPA #6.Ultimately, much of NPA #6 may eventually be annexed by the City, which would allow much moredirect control by the City over when, where and what type of development occurs in this area.
41

Extent and Intensity of Commercial Development
NPA #5 is completely devoid of any existing commercial development. However, there is a significantamount of land on the projected land use map that is designated for future Community Commercial andLight Industrial development. NPA #5 has approximately four miles of undeveloped freeway frontage,some of which could be prime for future commercial and industrial development should the access andinfrastructure problems be solved. In fact, this type of development would be dependent on thecompletion of the interchange with 1-40 and the proposed parkway and/or the construction of the Airwayunderpass. Neither project is programmed yet.
In NPA #6, most of the existing commercial development is along Northern and Bank Streets, with somelimited commercial areas along Highway 66. The largest single area for new commercial developmentnearest a population center would be in Section 29 and in State Trust Section 32 between Bank and CastleRock along Northern. Additional commercial development will likely be needed if and when thepopulation increases and moves north.
Kingman Airport and Industrial Park
The Kingman Airport, located in NPA #5, was originally built by the U.S. military during World War II.It later became a County airport and is now under the City’s jurisdiction, although it remains outside theKingman city limits. The airfield operations area is designated as Public/Quasi-Public on the projectedland use map. Areas that have been approved by the City for industrial development have been indicatedas Manufacturing Industrial. Heavier industrial development requiring large parcels of land, havetraditionally found that the Kingman Industrial Park to be an appropriate location. This trend will likelycontinue. However, roadway connections between the Airport and 1-40 could open up areas south of theAirport for manufacturing and light industrial development as well. The airport and the industrial parkhave an important impact on the economy of Kingman by providing opportunities for current and futurebusinesses and job growth. In other cities, a number of airports have found themselves in the center ofcontroversy from residents upset with aircraft noise, even when the airport was there long beforeresidential development encroached. Therefore, projected areas for residential development have beenshown in areas that are not directly in the path of aircraft overflights.
The Development Future of State Trust and BLM LandsWithin NPA #5 there are two areas of State Trust land. One is Section 2, T21N, Ri 6W, and the other isthe east half of Section 24, T22N, Ri 6W. There are also Bureau of Land Management lands in a portionof Section 13, T2 iN, Ri 6W. Within NPA #6, there are five State Trust sections including Sections 16,18, the north half of 20 and most of Section 32 in T22N, Ri 6W, as well as Section 24, T22N, Ri 7W.There is also one BLM section, Section 26, T22N, R17W. At present, the only state section that has anadopted land use plan by the state is Section 32. All of the State Trust sections lie within the City waterservice boundary and could be deveioped in the future. Section 32 is centrally located in NPA #6 andcontains a mixture of land uses including commercial, residential and parks/open space in accord with theapproved State plan. Likewise, Section 2 in NPA #5, is in a good location for future deveiopment with itsproximity to the airport. Development within this section could include a variety of industrial,commercial and residential uses as shown in the projected land use plan. Within the two BLM sections,development is also possible in the future. However, it should be noted that Section 26 in NPA #6 isquite mountainous, lies outside the City water service boundary, lies higher than the City water tank in theCamelback neighborhood, and therefore, is above any current water pressure zones. Therefore, thissection is projected for open space preservation on the projected land use map.
42

POPULATION GROWTH
2010 CENSUS POPULATION FIGURES
The City of Kingman and the surrounding areas within the Kingman General Plan Study Area haveexperienced steady, sustained growth since the last Kingman General Plan was adopted in 2003. In 1990,the population within the City of Kingman was 13,769, and by the year 2000 the population had risen to20,069; an average annual increase of 3.84. The 2010 census for Kingman was 28,068, an annual growthrate of 3.41-percent for this 10-year period and with the 2012 population estimate of 28,335. Over theprevious 30 year period, the average growth rate was 2.44-percent. The New Kingman/Butler CDP,which includes much of the area north of Kingman that lies within the General Plan Study area, had apopulation of 11,627 in 1990. This population rose to 14,810 in 2000; an average annual increase of2.45-percent. In 2010, this area had a population of 22,764. The entire General Plan Study Area is,therefore, estimated to have had a population in the year 2010 of 62,236. This would mean the StudyArea as a whole experienced about a 5.78-percent annual population growth between 2000 and 2010.Table 7 indicates the estimated population breakdown by Neighborhood Planning Area.
TABLE 7:2010 CENSUS FIGURES BY NPA
NEIGIIBORBOOD POPULATION POPULATION TOTALPLANNiNG AREA WITHIN CITY WITHIN COUNTY POPULATION BY
NPA
#1 Historic Downtown! 2,690 94 2,784W. Hwy 93
#2 Hilltop/Country Club 6,261 0 6,261
#3EastKingmanl 8,369 7,512 15,881Hualapai Mountain Rd
#4 Centennial Park! 5,080 845 5,925Canyon Shadows
#5 Kingman Airport! 3,552 2,333 5,885Vista Bella
#6 Camelback/New 2,116 23,384 25,500Kingman Addition
TOTAL POPULATION 28,068 34,168 62,236BY JURISDICTION
POPULATION PROJECTIONS
Population projections for the Kingman General Plan Study Area and the City of Kingman alone havebeen made for a period of twenty years (2010-2030). The annual population growth rate from 2000 to
43

2010 was 5.8-percent. However, this growth rate has not been experienced since 2010. Three differentgrowth rates have been utilized:
• Slow growth at 2% per year.• Existing moderate growth at 4% per year.• Boom growth at 6% per year.
Each scenario is projected at a constant rate per year through the twenty year time frame. Populationprojections can be helpful in planning for and determining the timing and development of services,infrastructure and other public facilities. Table 8 indicates the growth rate scenarios for the entire studyarea. Table 9 indicates the growth rate for the City of Kingman only.
TABLE 8: POPULATION PROJECTIONS FOR KINGMAN GENERAL PLAN STUDY AREA
YEAR 2% iNCREASE 4% INCREASE 6% INCREASEPER YEAR PER YEAR PER YEAR
2010 62,236 62,236 62,236
2015 68,714 75,720 83,286
2020 75,865 92,124 111,456
2025 83,761 112,084 149,152
2030 92,479 136,367 199,599
OVERALL INCREASE 30,243 j 74,131 137,363
TABLE 9: POPULATION PROJECTIONS FOR THE CITY OF KINGMAN
YEAR 2% INCREASE 4% INCREASE 6% INCREASEPER YEAR PER YEAR PER YEAR
2010 28,068 28,068 28,068
2015 30,989 34,149 37,561
2020 34,215 41,548 50,266
2025 37,776 50,549 67,267
2030 41,708 61,500 90,018
OVERALL INCREASE 13,640 33,432 61,950
Population increases for the Kingman General Plan Study Area range from a low of 92,479 people (2%growth rate) to a high of 137,363 people (6% growth rate) at the end of the 20 year period.
44
Projected increases for the City of Kingman at the end of the same time period range from 13,640 people(2% growth rate) to a high of 61,950 (6% growth rate). It should be noted that no assumptions have beenmade as to how the population growth rate may be affected should the City annex any populated areasduring the next 20 years.
Even though the area experienced a 5.78-percent growth rate from 2000 to 2010, the current populationestimates show a much lower growth rate. A two-percent annual growth rate for the area is most likely.Therefore, and increase of 30,243 for the area and 13,640 for the City is expected over the next 20-years.
LAND USE PROJECTIONS
ACHIEVING AN IDEAL BALANCE OF LAND USES
There is a variety of thought as to the ideal balance of land uses within an urbanized area. One source,The Small Town Planning Handbook, suggests that approximately 30-40-percent of land within a townshould be zoned residential, rights-of-way should occupy about 20-percent; public/quasi-public usesshould occupy 5-15-percent; Commercial uses should represent 5-percent; Industrial should be 5-15-percent; Agriculture and open space should be 10-30-percent.
As of June 2013, the City of Kingman was approximately 36.47 square miles or 23,340-acres.Approximately about 57-percent of the land (15,691-acres) within the City was zoned residential; 9-percent was devoted to various rights-of-way; 10-percent (2234 acres) was zoned commercial; two-percent (553 acres) was zoned industrial; and 12-percent (2890- acres) zoned recreational open space.
Based upon the above figures it would appear that no additional acreage in the City limits should bedesignated on the general plan such that it could be zoned residential or commercial according to therecommendations of The Small Town Planning Handbook. This suggests between 4%-14% (805-2,689acres) of more land could be designed for industrial zoning; and 0%-i 4% (0-2,602 acres) of land could bedesignated for open space zoning.
However, to get a more accurate picture of the residential, right-of-way, public-quasi-public, commercial,industrial, open space land use needs as opposed to the amount of zoned areas, it would first be importantto determine the amount of the existing land devoted to these types of uses within the entire General PlanStudy Area. The Kingman General Plan 2030 Study area is about 79 square miles or 50,560 acres in size.Table 10 indicates the breakdown of existing land uses as of June, 2013 when a land use survey wascompleted.
45

TABLE 10: EXISTING LAND USES IN KINGMAN GENERAL PLAN 2030 STUDY AREA
LAND USE CATEGORY ACRES % OFTOTALAREA
Residential 15,336 30.4%
Commercial 900 1.8%
Industrial 750 1.5%
Public/Quasi-Public 3,092 6.1%
Parks/Open Space 3,152 6.2%
Rights-of-way, etc. 3,294 6.5%
Vacant 24036 47.5%
TOTAL GENERAL PLAN STUDY AREA__j 50,560 100%
The next step is to determine a balance of residential land uses to provide for future population growthwith commercial, industrial, public/quasi-public, and parks/open space areas that would be supported byfuture population.
RESIDENTIAL LAND USE PROJECTIONS AND MAXIMUM POTENTIAL POPULATION
A method used to estimate the ultimate population growth within a given area, as opposed to a populationprojection based upon possible growth rates, is a maximum potential population calculation. Thiscalculation is determined by taking the projected acreages of each residential land use category (rural,low, medium, intermediate, and high density), as proposed in the projected land use map, and multiplyingthis figure by the maximum number of units allowable in each category. This figure is then multiplied by2.5, which is the average household size in the City of Kingman based upon the 2010 census figures. Theresulting figure is the maximum potential population for each residential land use category. These figuresmay be added together for a total population figure for each NPA and ultimately for the entire study area.
It should be emphasized, however, that the maximum potential population numbers are exaggerated. Thisis because we do account for undeveloped property that may not be capable of being developedresidentially due to topographic issues, or the need to use land for roads, rights-of-way, drainage parcelsand other non-residential purposes. In all likelihood, even at full build-out in each NPA, the overallpopulation numbers will be significantly smaller.
Table 11 indicates the acreages of each residential land use category and maximum potential populationand maximum densities for each NPA and for the entire Kingman General Plan 2030 Study Area.
46
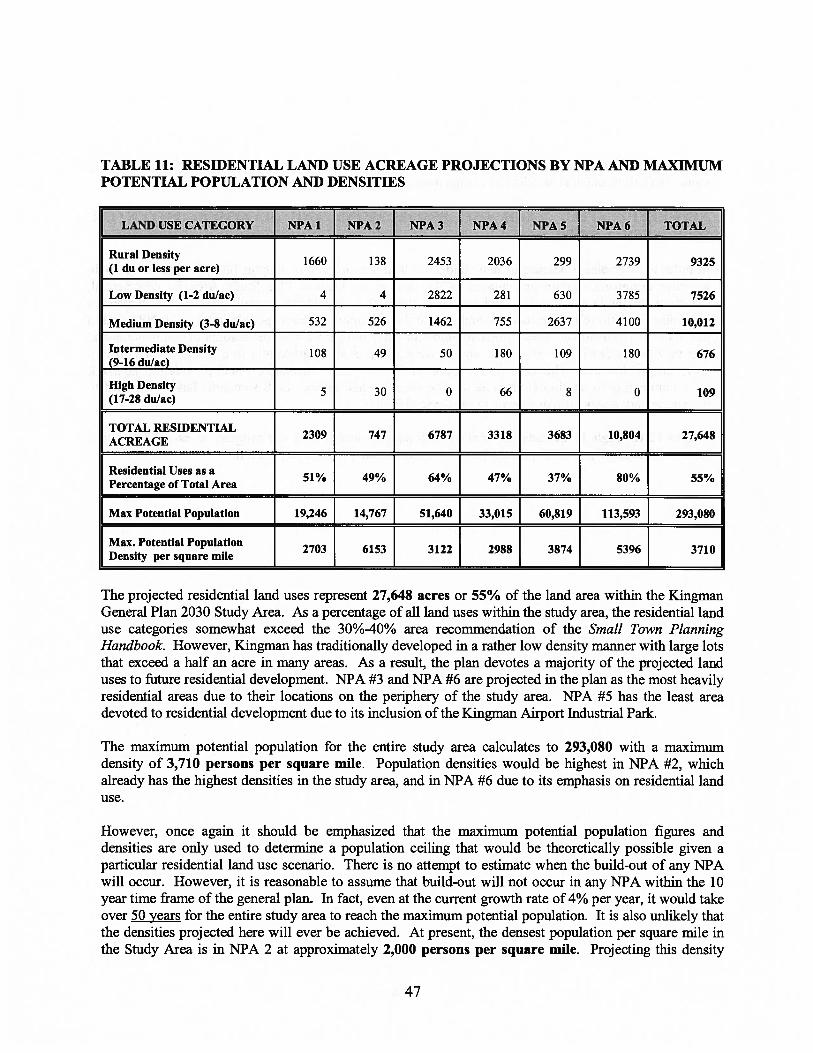
TABLE 11: RESIDENTIAL LAND USE ACREAGE PROJECTIONS BY NPA AND MAXIMUMPOTENTIAL POPULATION AND DENSITIES
AND USE CATEGO? PA 1 NPA 2 NPA irNPA 4 NPA 5 NPA 6
Rural Density 1660 138 2453 2036 299 2739 9325(1 du or less per acre)
Low Density (1-2 du/ac) 4 4 2822 281 630 3785 7526
Medium Density (3-8 du/ac) 532 526 1462 755 2637 4100 10,012
IntermediateDensity 108 49 50 180 109 180 676(9-16 du/ac)
High Density 5 30 0 66 8 0 109(17-28 dulac)
TOTAL RESIDENTIAL2309 747 6787 3318 3683 10,804 27,648
ACREAGE
Residential Uses as aPercentage of Total Area
37% 80% 55%51% 49% 64% 47%
Max Potential Population 19,246 14,767 51,640 33,015 60,819 113,593 293,080
Max. Potential Population2703 6153 3122 2988 3874 5396 3710Density per square mile
The projected residential land uses represent 27,648 acres or 55% of the land area within the KingmanGeneral Plan 2030 Study Area. As a percentage of all land uses within the study area, the residential landuse categories somewhat exceed the 30%-40% area recommendation of the Small Town PlanningHandbook. However, Kingman has traditionally developed in a rather low density manner with large lotsthat exceed a half an acre in many areas. As a result, the plan devotes a majority of the projected landuses to future residential development. NPA #3 and NPA #6 are projected in the plan as the most heavilyresidential areas due to their locations on the periphery of the study area. NPA #5 has the least areadevoted to residential development due to its inclusion of the Kingman Airport Industrial Park.
The maximum potential population for the entire study area calculates to 293,080 with a maximumdensity of 3,710 persons per square mile. Population densities would be highest in NPA #2, whichalready has the highest densities in the study area, and in NPA #6 due to its emphasis on residential landuse.
However, once again it should be emphasized that the maximum potential population figures anddensities are only used to determine a population ceiling that would be theoretically possible given aparticular residential land use scenario. There is no attempt to estimate when the build-out of any NPAwill occur. However, it is reasonable to assume that build-out will not occur in any NPA within the 10year time frame of the general plan. In fact, even at the current growth rate of 4% per year, it would takeover 50 years for the entire study area to reach the maximum potential population. It is also unlikely thatthe densities projected here will ever be achieved. At present, the densest population per square mile inthe Study Area is in NPA 2 at approximately 2,000 persons per square mile. Projecting this density
47

over the entire 79 square mile study area would result in a maximum population of 158,000, or slightlymore than half as much as is calculated using a maximum potential population projection.
NON-RESIDENTIAL LAND USE PROJECTIONS AND MAXIMUM POTENTIALPOPULATION RATIOS
In order to determine a balance of non-residential land uses needed to support future residential growth,we have designated certain percentages of the land in the General Plan Study Area for commercial,industrial and public/quasi-public, and park/open space uses. In addition, calculations have been made todetermine the ratio of non-residential land uses to the maximum potential population in each NPA and inthe study area as a whole. These ratios are important in helping determine the amount of commercial landthat may be needed to provide goods and services and provide employment to a given population in agiven geographic area. This is similar to Level of Service (LOS) standards, which provide a benchmarkfor a community to use in determining service demands and needs. LOS standards have been used todetermine park and open space needs in the General Plan.
Tables 12 through 15 indicate the area of each non-residential land use category in each NPA, and aratio of the acreage per 1,000 persons based upon maximum potential population.
48

TABLE 12: COMMERCIAL LAND USE ACREAGE PROJECTIONS BY NPA AND RATIO OFACREAGE TO MAXIMUM POTENTIAL POPULATION
The projected commercial land uses represent 2,711 acres or five-percent of the land area within theKingman General Plan Study Area. As a percentage of all land uses within the study area, thecommercial land use categories meet the five-percent recommendation of the Small Town PlanningHandbook. At full build-out at the maximum potential population level, there will be nine-acres ofcommercial land for every 1,000 persons. As a percentage of land area, NPA 2 and NPA 4 have thelargest amount of land projected for commercial development, as these areas include the maincommercial growth corridors along Stockton Hill, E. Andy Devine and Airway Avenue.
TABLE 13: INDUSTRIAL LAND USE ACREAGE PROJECTIONS BY NPA ANDACREAGE TO MAXIMUM POTENTIAL POPULATION
RATIO OF
LAND USE NPA 1 NPA 2 NPA 3 NPA 4 NPA 5 NPA 6 TOTALCATEGORY
Light Industrial 17 10 59 105 983 423 1,597
Manufacturing Ind. 0 0 0 40 2,918 0 2,958
TOTAL INDUSTRIAL 17 10 59 145 3,901 423 4,555ACREAGE
PercentofTotalArea 0.3% 0.7% 0.6% 2.1% 38.8% 3.1% 9%
Ratio of Industrial 1 ac 1 ac 1 ac 4 ac 64 ac 4 ac 15 ac perAcreage per 1,000 per per per per per per 1,000persons at maximum 1,000 1,000 1,000 1,000 1,000 1,000population level
LAND USE CATEGORY NPA 1 NPA 2 NPA 3 NPA 4 NPA 5 NPA 6 TOTAL
Neighborhood 15 120 71 56 97 319 678
Community 86 47 233 569 258 511 1,704
Regional 0 10 0 149 0 0 159
Highway Service 83 54 0 33 0 0 170
TOT. COMMERCIAL AC. 184 231 304 807] 355 830 2,711
Percent of Total area 4% 15% 3% 11%] 4% 6% 5%
Ratio of Commercial 10 ac 16 ac 6 ac 24 ac 6 ac 7 ac 9 acAcreage per 1,000 per per per per per per perpersons at maximum 1,000 1,000 1,000 1,000 1,000 1,000 1,000population level
49

The projected industrial land uses represent 4,555 acres or nine-percent of the land area within theKingman General Plan Study Area. As a percentage of all land uses within the study area, the industrialland use categories are within the 5-15-percent recommendation of the Small Town Planning Handbook.At full build-out at the maximum potential population level, there will be 15-acres of industrial land forevery 1,000 persons. As a percentage of land area, NPA 5 has by far the largest amount of landprojected for industrial development, as this area includes the Kingman Airport Industrial Park wheremost of the future industrial development in the study area is projected to occur.
TABLE 14: PTJBLIC/QUASI-PUBLIC LAND USE ACREAGE PROJECTIONS BY NPA ANDRATIO OF ACREAGE TO MAXIMUM POTENTIAL POPULATION
The projected public/quasi-public land uses represent 2,705 acres or 5-percent of the land area within theKingman General Plan Study Area. As a percentage of all land uses within the study area, thepublic/quasi-public land use category is within the 5-1 5-percent recommendation of the Small TownPlanning Handbook. At full build-out at the maximum potential population level, there will be nine-acres of public/quasi-public land for every 1,000 persons. As a percentage of land area, NPA 5 has byfar the largest amount of land projected for public/quasi-public development, due to the presence of theKingman Airport.
TABLE 15: PARKS/OPEN SPACE LAND USE ACREAGE PROJECTIONS BY NPA ANDRATIO OF ACREAGE TO MAXIMUM POTENTIAL POPULATION
LANI) USE NPA 1 NPA 2 NPA 3 NPA 4 NPA 5 NPA 6 TOTALCATEGORY
TOTAL PUBLIC/ 135 191 77 176 1,694 432 2,705QUASI- PUBLICACREAGE
Percent of Total Area 3% 12.5% 1% 2.5%] 16.8% 3.2% 5%
Ratio of Public/Quasi- 7 ac 13 ac 2 ac 5 ac 28 ac 4 ac 9 acPublic Acreage per 1,000 per 1,000 per per per per per perpersons at max. 1,000 1,000 1,000 1,000 1,000 1,000population level
LAND USE CATEGORY NPA 1 NPA 2 NPA 3 NPA 4 NPA 5 NPA 6 TOTAL
Developed Parks 51 28 58 57 20 70 284
Open Space Preserve 1,860 326 3,302 2,566 395 912 9,361
TOTAL PARKS/OPEN 1,911 354 3,360 2,623 415 982 9,645SPACE ACREAGE
Percent of Total Area 42% 23% 32% 37% 4% 7% 19%
Ratio of Parks/Open Space 99 ac per 24 ac per 65 ac per 78 ac per 7 ac per 9 ac per 33 ac perper 1,000 persons at maximum 1,000 1,000 1,000 1,000 1,000 1,000 1,000population level
50
The projected parks/open space areas represent 9,645 acres or 19-percent of the land area withinthe Kingman General Plan Study Area. As a percentage of all land uses within the study area,the parks/open space category is within the 10-30-percent recommendation of the Small TownPlanning Handbook. At full build-out at the maximum potential population level, there will be33 acres of parks/open space for every 1,000 persons. As a percentage of land area, NPAs 1,3 and 4 have the largest amount of land projected for parks/open space, due mainly totopographic limitations to development and the presence of public lands that have been or maybe preserved in these areas.
CONCLUSION
The Kingman General Plan Projected Land Use Map attempts to provide a reasonable overallbalance of land uses to meet the projected future needs of area residents as the populationcontinues to grow. Once again, the land use map is not static in that it may be amended by theCity Council when it determines that conditions warrant. However, the land use map should notbe viewed as a super-layer of zoning subject to monthly revisions and changes. The land usemap should only be amended when there is clear evidence of changes in assumptions, conditionsor dynamics exist. The Code of Ordinances of the City of Kingman, Arizona, Section 2-133through 2-137 provides further details for amending and implementing the land use plan to helpguide short-term and long-term growth and development within each NPA and within the studyarea as a whole.
51

zc

KINGMANGENERAL PLAN 2030
PROJECTED LAND USE MAPLAND USE DESIGNATION
______
RURAL DENSITY RESIDENTIAL(1 DU OR LESS I AC)
______
LOW DENSITY RESIDENTIAL(1-2 DU/AC)
______
MEDIUM DENSITY RESIDENTIAL(3-8 DU/AC)
______
INTERMEDIATE DENSITY RESIDENTIAL(9-16 DU/AC)
______
HIGH DENSITY RESIDENTIAL(17-28 DU/AC)
NEIGHBORHOOD COMMERCIAL
COMMUNITY COMMERCIAL
REGIONAL COMMERCIAL
HIGHWAY SERVICE COMMERCIAL
LIGHT INDUSTRIAL
MANUFACTURING INDUSTRIAL
PUBLIC I QUASI-PUBLIC
PARKS I OPEN SPACE
LEGENDo PROPOSED INTERCHANGE
/A / GENERAL PLAN BOUNDARY
,o°y // \. ,‘ MUNICIPAL CITY LIMITS
/ V.
MAJOR STREETSENGINEERING SERVICESlG\Engi000GrgICirVRVPS\Cily—CAD\GP2030—R201 3DWGRoger COnrelh
Rotor to Resolution Nos. 4206 or Golden Volley Renob& 4207 for Peooook Hrgfllnflds Lund Gee Plane

CHAPTER 5GROWTH AREA ELEMENT
INTRODUCTION
The Growth Area Element is one of the elements required by the Arizona Revised Statutes (ARS9-461.05 .D.2.), The purpose of the Growth Area Element is to identifi areas that are particularly suitablefor planned multi-modal transportation and infrastructure expansion, and improvements designed tosupport a planned concentration of a variety of uses, such as residential, office, commercial, tourism andindustrial uses. This element is required to include policies and implementation strategies that aredesigned to:
A.) Make automobile, transit, and other multi-modal circulation more efficient, makeinfrastructure expansion more economical and provide for a rational pattern of land development.
B.) Conserve significant natural resources and open space areas in the growth area and coordinatetheir location to similar areas outside the growth area’s boundaries.
C.) Promote the public and private construction of timely and financially sound infrastructureexpansion through the use of infrastructure funding and financing planning that is coordinatedwith development activity.
MAJOR ISSUES
POPULATION GROWTH
The City of Kingman and the surrounding areas within the Kingman General Plan Study Areaexperienced steady, sustained growth from the time the Kingman General Plan was adopted in 1992through 2008. In 1990 the population within the City of Kingman was 13,769, and by the year 2000 thepopulation had risen to 20,069; an average annual increase of 5.2%. The 2010 U.S. Census stated thatKingman had a population of 28,068 and a July 1, 2012 population estimate of 28,335. Over the previous40 year period the average growth rate was 2.7-percent.
The New Kingman/Butler CDP, which includes much of the area north of Kingman that lies within theGeneral Plan Study area, had a population of 11,627 in 1990. This population rose to 29,089 in 2010; anaverage annual increase of 4.7-percent since 1990. The 20-mile labor market area population was estimated tobe 56,000 in 2012 and is projected to be 61,521 in 2016. The Kingman area grew 24-percent from 2000 to2012 and 52.45-percent from 1990 to 2000.
RECENT RESIDENTIAL DEVELOPMENT
Substantial new residential development has occurred in the Kingman area from 1990 to 2008. Most ofthis residential development in the City has been in the form of single family homes. Between January,
55

1990 and December, 2008, 5805 new single family housing units were permitted The peak year of single-family residential development occurred in 2005 with 910 new housing starts. Since 2008, new housingstarts slowed with the City issuing only to 56 in 2009, 35 in 2010, and 36 in 2011. However, in 2012, newhousing starts have climbed to 78 new housing starts. Foreclosures and the lack of mortgage money areattributed to the slow down in the area economy. Much of the growth was a result of people being able tosell their houses in Southern California for a substantial profit and then relocating in Kingman wherehousing was less expensive. The result of buyers in Southern California not be able to secure mortgagemoney ended the retiree migration to Kingman and thereby eliminated the demand for homes for thesetypes of buyers and the demand for housing for construction workers and related industry workers.
Much of the new single family development in the City is occurring in the eastern portion of the City. Thecompletion of the Airway Underpass provided much easier access to the northeastern portion of the City.The areas southeast portion of the City also has been a significant growth area. Walleck Ranch in theGordon Drive/Stockton Hill Road area is another new housing development area. Additional residentialinfill has occurred throughout the City especially within several improvement districts. These areasinclude the Kingman Airport Tract, Kingman Air-Rail Manor, and Gates Avenue improvement districts.Within the Mohave County portion of the General Plan Study Area, residential development has been inthe form of infill within the existing New Kingman Addition, and within new subdivisions includingCerbat Ridge, Chaparral Mesa, and Fountain Hills.
In addition to single-family development, several multiple family developments have occurred in the Citywithin the last ten years. Tivoli Heights (78-units), Harrison Haven (57-units), Copper RidgeApartments with 156 units, Parkcrest Village Apartments with 80 units, and Rutherford Village with 45lots for duplexes, triplexes and four-plexes, have all been developed since 1992.
RECENT COMMERCIAL DEVELOPMENT
Commercial development with the City of Kingman has continued to increase in the past 20 years to keeppace with the population growth. The single largest commercial development that has occurred inKingman since 1992 is the Super Wal-Mart store east of Stockton Hill Road and south of AirwayAvenue.
New retail development along the Stockton Hill Road corridor has been added since 2006. CVSPharmacy, McDonalds, In-N-Out Burger, Carl’s Jr. Discount Tire, and Wash Me Car Wash havedeveloped north of 1-40 on Stockton Hill Road since 2008. Waigreens has a new store at Stockton HillRoad and Andy Devine Avenue. Though there still is a high vacancy rate in commercial buildings, retailestablishments locating in vacant commercial buildings. The commercial spaced that was occupied byWalmart and Albertson’s located on Stockton Hill Road and Beverly with about 230,000 square feet ofretail space is now fully occupied. A new owner of the “Frontier Center”, an 82,055 square footabandoned shopping center, located east of Stockton Hill Road and north of Detroit Street has beenpurchased by a developer and is under consideration for revitalization. New relatively small retaildevelopment is taking place along Route 66 north of 1-40.
Finally, Hualapai Mountain Road has begun to experience commercial growth including a conveniencestore and gas station, business office, doctor’s office, bank, and a small retail center. The HualapaiMountain Road Corridor was established to limit the range of commercial uses and to have a higher levelof development. However, as a result of a slow economy, the City is allowing a greater range of uses inthis corridor.
56
INFILL DEVELOPMENT VS. EDGE DEVELOPMENT
Residential and commercial development that has occurred in the Kingman area in the last several yearscan generally be characterized by distances from existing development, infrastructure and services. InfihlDevelopment is defined as that which occurs in areas largely surrounded by existing development. Edgedevelopment is the opposite and is defmed as development that occurs in areas where there is little or noexisting development or infrastructure, and few, if any, services, schools or parks. There are a number ofadvantages to development that occurs within infill areas within the Kingman General Plan Area. Infillhelps to expand and connect public infrastructure including roads, water and sewer into areas mostlysurrounded by existing development. Infihl also enables the more efficient provision of services such assanitation, fire and police protection.
Examples of recent infihl development include the Walleck Ranch development and Kingman AirportTract improvement district both located between Gordon Drive and Airway Avenue, east of Stockton HillRoad. Infrastructure including water and sewer lines, and paved streets with curb, gutter, sidewalk, wereextended throughout these developments. Residents who move into these developments also have theadvantage of being less than one mile from Centennial Park, the County Library, Kingman Academy ofLearning, and maj or shopping areas along Stockton Hill Road. These areas also abut the Mohave Washwhich is to be developed with non-motorized hiking and biking trails that may eventually link theKingman High School North Campus with Centennial Park.
There are also examples of successful commercial infill, redevelopment and reuse of existing commercialbuildings particularly in the Hilltop/Country Club Neighborhood Planning Area #2. This includes areasof new commercial development along Stockton Hill Road south of 1-40 and the redevelopment ofcommercial buildings including two hotels and an office building on E. Andy Devine south of 1-40.Downtown redevelopment projects include the Powerhouse Visitor’s Center which has become a primarytourist stop.
An example of edge development is the Rancho Santa Fe subdivision on the east side of Kingman.Rancho Santa Fe has actually been quite successful since its development in 1992. It has providedperhaps the single largest area of single family homes in a low density environment in Kingman.However, Rancho Santa Fe has a number of disadvantages such as a lack of a significant portion not beconnected to the City’s sewerage system and is more than a mile from any commercial development,schools, parks, or any other existing services. Rancho Santa Fe is currently connected by two nearlyparallel roads Southern Avenue and Louise Avenue with no other transportation linkage to the rest ofKingman. Development of the Rancho Santa Fe Parkway interchange with 1-40 will increaseaccessibility to the area and spur new development. Infrastructure costs in addition to securing the moniesto fund the interchange have stalled this project.
An example of edge development in the commercial sector is the Hualapai Mountain Medical Center(HIvIMC) on Santa Rosa Boulevard. The Hualapai Medical Center, which was completed in 2009 is a 70-bed acute care hospital and featured comprehensive hospital services. This four-story hospitalwas constructed in the Kingman Crossing area in anticipation of the Kingman Crossinginterchange with 1-40 and the new Kingman Crossing Boulevard. New infrastructure extended into serve this site. A controlled arterial traffic control system, the site’s portion of a majordrainage infrastructure has all been developed. The economic downturn caused the retaildevelopers to withdraw from the project area and the HMMC apparently was depending on the
57

anticipated growth experienced in the 2003-2008 period to continue. The hospital soon closedand has since been purchased by the Kingman Regional Medical Center. Reopening of portionsof the facility is anticipated in 2013.
SOME FACTORS THAT DETERMINE WHERE GROWTH OCCURS
In determining where growth is expected to occur in Kingman, it is important to know not onlywhere growth has occurred in the past, but how and why this growth has happened. Geography,ownership patterns, accessibility, and distance from existing infrastructure such as developedroads and utilities have been the primary determiners of whether and when a particular propertyis likely to be developed.
For example, the Cerbat Mountains and foothills on the west side of Kingman, the hills south ofdowntown Kingman and the Hualapai Mountains on the southeast side of Kingman have servedto direct most growth into the generally flatter areas in the Hualapai Valley. Growth has beengenerally progressing north and east throughout the area. U.S. Bureau of Land Management(BLM) Lands in the southern and western and southeast portions of the General Plan Study Areaalso limit growth. Although, BLM land can be traded in order to consolidate land holdings. TheVista Bella/Kingman Airport NPA #5, located north of 1-40 and East of the railroad tracks hasexperienced slow growth, due in part to geographic isolation from the rest of the Kingman areacreated by the 1-40 and railroad track bamers as well as the proximity of the Kingman Airport.The Airway Underpass, opened in 2007, has significantly increased the access to this area.Residential development in this area has had access to sewer only recently. The EastKingmanlHualapai Mountain Road NPA #3, located south of 1-40, on the other hand has seenrapid growth due in part to accessibility and the availability of water and sewer extensions.
Additional factors affecting growth include the condition and availability of land. During the late1920’s and early 1930’s in anticipation of the impact of Hoover Dam, several areas were plattedinto subdivisions that have 25-foot and 30-foot wide lots that are 100-feet deep. Thesesubdivisions were developed in a grid pattern. Many of these subdivisions were not developed,but sold to different individuals. A number of these tracts of land have been assembled andconstruction took place on them during the “boom” period. However, the lot configuration andplatted streets are not conducive to present day development. Developers have sought unplattedland for development, which is often not adjacent to the currently developed areas. Althoughdevelopment of these areas may be less expensive on a per unit cost, the work to assemble theproperty and replat the land makes the land less desirable in terms of time and the ability todevelop a desirable product.
Given these facts, it is possible to make some general predictions of where growth is likely tooccur in the next five, 10 and 20 years. It is also possible to create goals, objectives and policiesthat will serve to develop a rational pattern of land development and to make the infrastructureexpansion more efficient and economical. This is a strategy of the Growth Area Element as putforth in the Growing Smarter legislation.
58

IDENTIFIED GROWTH AREAS
Based upon recent growth patterns and the factors that influence where growth occurs, thiselement has identified and categorized likely growth areas within the Kingman General PlanStudy Area that may see development occur within the next 20 years.
FIRST TIER GROWTH AREAS
First Tier growth areas are regions within the General Plan Study Area in which developmenthas already occurred or is underway due to the proximity and availability of existinginfrastructure, and favorable geography, ownership patterns, and accessibility. It should be theCity’s goal to encourage new development to occur within these first tier growth areas. This goalwill serve to create opportunities for residential and commercial infill development that willprovide for needs of the expanding population and the local tax base. Within the First TierGrowth areas staff has identified several specific growth regions; they are as follows:
Downtown Kingman/NPA #1: The downtown area is identified in this case as the regionbetween 1-40 and El Trovatore Hill approximately one-half mile either side of Beale Street. Thisis the original townsite of Kingman that has seen little growth in the last several years. However,there are opportunities for infill development including residential, commercial and public uses.The infrastructure is largely in place in the downtown area, although upgrading will be needed incertain areas. The Redevelopment and Public Facilities and Buildings Element of the KingmanGeneral Plan addresses redevelopment and infill issues in the downtown area in more detail.Infill providing a mixture of uses should be encouraged in downtown Kingman to providehousing and employment opportunities as well as needed densities to support public transitopportunities. Quiet zone development to reduce train noise is an important step toward makingthis area more attractive to residential and commercial development. Improved propertymaintenance standards will make new investment more likely in this area.
North Stockton Hill Road CorridorlNPA #4: This area extends approximately one-half mileon either side of Stockton Hill Road between Northern Avenue and 1-40. This corridor isbecoming the primary commercial center of Kingman. Opportunities for residentialdevelopment are also there within this corridor as well. A mixture of regional and communitycommercial type development and medium to high density residential development should beencouraged within this area. The portion of this corridor that lies south of Airway Avenue andeast of Stockton Hill Road extending to the Centennial Park area is particularly suited for avariety of residential and commercial development that could reduce automobile dependency andencourage multi-modal transportation such as bicycling and public transit. The use of PlannedDevelopment Districts within these areas should be encouraged. Development of curb, gutter,sidewalks, and the improvement of property maintenance standards are needed to attract newinvestment and encourage development.
59
Hualapai Mountain Road Corridor/NPA #3: This area extends up to one-quarter mile on eachside of Hualapai Mountain Road from E. Andy Devine Avenue to Eastern Avenue. This corridoris just becoming ripe for a variety of commercial and residential development. This corridor isalso subject to the provisions of the Hualapai Mountain Road Overlay District which sets certaindesign standards for development along this street. The area is considered sensitive todevelopment which could disrupt view corridors, existing residential areas and/or traffic patterns.Development in this corridor would be expected to be of a lower intensity than the NorthStockton Hill Corridor. A mixture of neighborhood and community commercial, and mediumand intermediate density residential development should be encouraged within this area.
SECOND TIER GROWTH AREAS
Second Tier growth areas are regions within the General Plan Study Area in which somedevelopment has taken place or is adjacent to areas of major development. However, due to avariety of factors such as some accessibility problems, lack of infrastructure, steep geography inplaces, or distance from public services, etc., major development will be seeking public fundingassistance to develop. It should be the City’s goal to encourage new development to occur withinthese second tier growth areas before third-tier areas are developed. Second tier developmentshould occur after much of the first tier areas are developed. Second tier development shouldtake place to accommodate new population growth that requires the expansion of residential andcommercial development. Second Tier growth areas are beyond the area of the First Tier areasand include the following specific growth regions:
Vista Bella, Raneho Santa Fe, 1-40 Corridor/NPAs 3 & 5: The Rancho Santa Fe subdivisionsouth of 1-40 at the east end of Louise Avenue has become one of the main residential growthareas in the City of Kingman with the permitting of over 400 single family home since itsinception in 1992. The Vista Bella development north of 1-40 currently consists of The Villasand Valle del Sole subdivisions. Development in this area has been slower since the firstdwelling was built in the mid 1 980s. Even though there was a master plan developed of the areaand “hard” zoning was approved by the City for Vista Bella in 2002, the developer has sold landto the Kingman Unified School District, the master plan was amended and two schools havebeen developed that are not consistent with the original master plan. Between these twodevelopments lies undeveloped land on either side of 1-40.
Both developments have some things in common in that they are both served by City water, butlargely not served by sewer. The Villas portion of Vista Bella does have sewer service and Citysewer has been extended to the northern portion of the Rancho Santa Fe development. Bothdevelopments are accessible by only one or two major roads and do not yet have freeway access.Future development in the Vista Bella area is limited also by the proximity of the KingmanAirport to the north. Finally, both developments are not presently served by any commercialdevelopment, parks, or any other existing public services. Additional residential and futurecommercial development will become more possible once accessibility is improved with thedevelopment of the Rancho Santa Fe and Kingman Crossing interchanges and connecting
60

roadways. Infrastructure needs to be extended. The Airway Avenue underpass at the railroadtracks has improved access to the Vista Bella area.
State Trust Sections 16, 32 in T.21N., R.16W. and Section 36, T.21N., R.16W.: These threestate trust sections are surrounded by or adjacent to existing development, and, therefore, may beripe for development in the not too distant future. Section 16 is located along Louise Avenuebetween Rancho Santa Fe and Kingman Park Estates and is undeveloped at this time. Section 32is located adjacent to La Senita School and Kingman High North Campus has an approveddevelopment plan from the State. Section 36 lies west of Stockton Hill Road north of theCanyon Shadows area and south of the Camelback area. All three trust sections are immediatelyadjacent to City water and are adjacent to or within less than one-half mile from the Citysewerage system. Sections 16 and 32 have direct access to developed roadways while Section 36has access to a developed roadway, Sierra Vista Avenue. Section 36, while mountainous in thewestern region, is flatter on the east side which is immediately adjacent to a major commercialcorridor, Stockton Hill Road. The western portion of Section 36 should be considered for openspace preservation due to the steepness of the slopes in that area and the fact that much of thearea is above the City’s water pressure zones and also includes several ancient petroglyphs.Based upon these facts, the City and State Land Department have begun consulting with eachother regarding the development of plans for these State Trust lands which support the KingmanGeneral Plan 2020. The State Land Department held an auction of Section 16 in 2006, but therewere no bidders at the auction.
THIRD TIER GROWTH AREAS
Third Tier growth areas are regions within the General Plan Study Area in which developmenthas largely not yet taken place. Development in these areas is not likely for more than 10 yearsdue to one or more of the following: The lack of nearby infrastructure such as water and sewer,unfavorable geography, public land ownership, and limited access. The City should notencourage new development to occur within these third tier growth areas for at least 10-years oruntil the first and second tier areas are mostly built out and new population growth requires theexpansion of residential and commercial development. Much of the third tier development isoutside of the City and the City does not have land use jurisdiction of these areas. The Third Tiergrowth areas lie beyond the First and Second tier areas and include the following regions:
North of Jagerson Avenue/NPA 6: This region lies mostly outside the city limits and includesState Trust Sections 16, 18, 20, 24 in T.22N. R.16W. as well as State Trust Section 24 in T.22N.R. 17W which is in the City. It also includes private lands adjacent to these areas. With fewexceptions, land north of the Jagerson Avenue alignment is largely undeveloped at this juncture.City water and sewer is accessible to properties immediately along Jagerson, however, there isvery little other infrastructure, including developed roads. At present there is no commercialdevelopment to support residential growth in this area. What residential development that hasoccurred is limited to either unsubdivided parcels, or one subdivision, Fountain Hills, which isnot tied into the City water system. Although this area is mostly outside the City limits, it lieswithin the City Water Service Boundary. The City can exert some control over the timing and
61

location of growth by requiring new development in the County to adhere to City developmentstandards at the time of water service requests.
East of Vista Bella and North of Rancho Santa Fe/NPA 5: In 2010 and 2011, the Cityannexed this area in anticipation of the Rancho Santa Fe Parkway traffic interchange andsubsequent commercial development. Currently much this area is inaccessible by developedroads and has no nearby services. Funding for the traffic interchange has not been secured anduntil the traffic interchanged is constructed, development seems unlikely in the near term. Whendevelopment does take place, this area will be very attractive to a mix uses including industrial,commercial and residential development.
62

CITY OF KINGMANFIGURE 3-1. GROWTH AREA MAP
AW.
rilUll
- ::4>- :tzk?’ Li- /fr _c
1’ — ----—- —I?
--
QR4 NE.L YD.
NRTffERN AVEE
GORDON
KGMAN APORT
Li FlST I1FRSP1F1C GROWTH RG1OND-O YEARS IN FUTURESECONDTIERSPECJFLC GROWTH REGION5 -15 YEARS IN FUTURE.] THIRD TIERSPECIflC GROWTH REGION
63

..
..
...._.
...
..
.
—..
—C
‘C
..
St
•—
.•
••..••
..
‘..
•‘
:.
.•.
:;._
ç......
,r
:“r.
;:.“
•._:
‘.
•.•
,•••‘
--
-:-
‘-::L
:’’-
I
—tI
——
I‘
t—
——
•..:•
:——
a—
-—
-
V‘
.%—
‘..r’’
‘1’
+
.1
•.—
‘.
——
‘ft
—.
—
L
——
••_
••—
••Ct•
CI•
4_I
4.
‘.—
li••——
—
——
a—
•1I
t.%
at
••__
3_I
——
-••:
••..
‘“
•.‘_:Z
..,V
..•..
%y
!\
•:;‘
..:1._
a•.
••.
:—
V1
——
1
.
•••••
••
••
•.
•j*It
••?••
%I
.‘
:.-•••.
.I.
5j...
—.
••••••
I••
—‘2
‘4.•
•“b
Ii
I%
I•
C
P—
——
_•1
‘I
aI
—-
—
—•
••
:..
:
••.
r.•”-‘
•
•.
t”.
:I
•:‘•:.r
:::•
•...•.::•
•:
••
•.tt;
_
.:••-.
:
••
•—
•,•.
•.
.1.
t’s
—
tI:
•..W
.j
-•:
—•
.
-(b
••••.
•••
•t..•
;.•••
..•:••.
•••
rr-rir
••j
•.:-.•
••
•.
••‘
1:::?,.‘r:.:1
;t:.;.:.

CHAPTER 6PUBLIC FACILITIES AND SERVICES
ELEMENTINTRODUCTION
Essential in all community planning is an evaluation of the public services and facilities, which includeplans for police, fire, emergency services, sewage, refuse disposal, drainage, local utilities, rights-of-way,easements and facilities for them.
MAJOR ISSUES
Major issues to be addressed by this element include:
1) Adequate emergency services delivery services to all areas of the City;
2) Adequacy of public water and sewerage systems to service the City in the next 20-years.
3) Storm drainage system in the City that will protect all structures up to a 100-year storm event.
4) A refuse disposal system to assure proper sanitation from solid waste hazards.
5) Adequate rights-of-way and easements to accommodate public utilities, storm drainage, andemergency services access.
CURRENT CONDITIONS
FIRE SERVICE
The Kingman Fire Department has four fire stations located in various strategic areas of the City.Each station is staffed with three to four firefighter/emergency medical personnel 24-hours a day,seven days a week. The fire department is adequately equipped and the equipment is upgradedon a scheduled basis. Consolidated dispatch services with surrounding fire districts and theKingman Police Department was developed in 2012 and is under the direction of the KingmanFire Department.
The physical configuration of the City places challenges on the ability to efficiently provide thesame quality of fire and emergency medical services to the northwest area of the City. Theincorporations in the northwestern portion of the City created a long-narrow strip along StocktonHill Road and then east to the College Trails area without the inclusion of the more developedareas between Gordon Avenue and Jagerson Avenue. This annexation pattern makes the
65

justification of placing City fire service facilities and personnel close enough to respond to thisarea in the same quick manner as the remainder of the City very costly. As a result, a mutual aidagreement with the Northern Arizona Consolidated Fire District, which serves theunincorporated area north of Gordon Avenue, to provide first response services to this area. Thismutual aid agreement provides the same first response services to the northwest portion of theCity as it does in the remainder of the City.
As development in the northeast section takes place, a fire station is needed. Such a facility isestimated to be $2.8 millions (2012 dollars) for building, equipment and personnel. Subsequentoperations are estimated to be $800,000 annually to operate the station. Although various siteshave been considered, the location of the station is largely dependent on what the easternboundary of the City will be in the next 10-years.
Kingman Fire DepartmentTotal Responses
10-Year Comparison
% ofIncrease
2003 2004 2005 2006 2007 2008 2009 2010 2011 2012 from 2003Fire 751 775 947 1068 901 921 916 822 845 838 11.58%Medical 3024 3128 3475 3515 3375 3673 3831 4074 4229 4589 51.75%Non-Emergency 3134 3437 5,000 4,225 3944 3984 3788 3529 3828 3532 12.70%Total 6909 7340 9422 8808 8220 8578 8535 8425 8902 8959 29.67%
Total Emergency 3775 3903 4422 4583 4276 4594 4747 4896 5074 5427 43 .76%
••ii
Emergency Response 10 Year Comparison
500045004000350030002500200015001
66

POLICE SERVICES
The Kingman Police Department continues to provide outstanding law enforcement servicesdespite budget cuts since 2008. Staffing and equipment are as follows:
Police Department Staff
Sworn Officers 53
Cadets 2Communication Specialists 12Animal Control/Code Enforcement Officers 4Reserve Officers 1Records and Support Staff 6Evidence Technician 1
Average City Police Responses per Month: 2,436
Support Vehicles and Equipment
Total Police Vehicles 64
Marked Patrol Cars 32
Motorcycles 3
4WD Pickups 3
Animal Control Vans 2
Detective Vehicles 18
Tactical Support Van 1
Mobile Command Post 1
Armored Vehicle 1
“Jingles”(vintage patrol car) 1
Radar Trailer 1
Support Trailer 1
In 2012, the City experienced 2240 adult arrests and 555 juvenile arrests. The City responded to25,063 “911” calls and responded to 39,690 incidents.
67

Water
Water is provided to all areas within Kingman and the surrounding areas by the municipal watersystem. The service area is 70.6 square miles. All of the water in our system is pumped fromdeep groundwater wells. The Hualapai Basin Aquifer is to the north of Kingman and providesthe majority of our water. The downtown area wells pump from the Sacramento Basin Aquiferwhich extends south of Kingman.
Hualapai Basin Aquifer: Eleven active wells. The wells average 962 feet in depth, with theaverage depth to water being 640 feet.
Downtown Area: Four active wells. These wells average 251 feet in depth, with the averagedepth to water being 130 feet.
Present pumping capacity: 12,081 GPM!16.128 MGDTotal Well Production:2.9 Billion gallons per year (2009)Storage: 13.15 Million GallonsTreatment: ChlorinationTemperature: Average delivered temperature: 88FCurrent Usage: Average Daily Per Capita Use: 162 GPDTotal Water Accounts in January 2013: 18,481
The water system infrastructure is not extended to the newly incorporated areas of the City. Thearea known as Rattlesnake Wash does not have water service. A new water pressure zone anddistribution lines need to be developed to this area. The northwestern portion of the City alsoneeds the creation of the water pressure zone and line extension to serve any developmentbeyond the current development in the northwestern portion of the City. There is a private watercompany, Cerbat Water Company that is serving portions of the unincorporated area north of theCity.
Sewer
Sewage treatment and disposal is provided by the City and serves much of the incorporated areasof Kingman and in some surrounding areas. The City completed a new wastewater treatmentplant at the Hilltop facility north of the City in 2010. This plant has a treatment capacity of up to5.1-millions gallons a day and in 2013 was receiving half of its treatment capacity. TheDowntown Treatment Plant was rebuilt and completed at the end of 2012. This plant has atreatment capacity of 0.62 million gallons a day and in 2013 was receiving approximately 0.31millions gallons a day. Both plants were in compliance with the environmental standardsestablished by the Arizona Department of Environment Quality. The total number of seweraccounts in January 2013 was 9,111 connections. The number of sewer connections is less thanhalf of the water connections. In 2012, the City Council adopted an Ordinance that mandated thatall new subdivisions must connect to the City’s sewerage system.
68

The cost of upgrading the wastewater treatment plants to meet environmental quality standardsand long-term treatment needs has placed a tremendous burden on the users because the plantswere designed to treat greater capacities than the initial flows. The burden of paying for thesecapital improvements is falling on the current users, which is about 50-percent of total number ofusers that these plants can serve. Therefore, the current users and paying about double of thecapital cost to meet current debt service. The long-term benefits will be realized, but the short-term impact is burdensome.
Type of Treatment
The plant is designed to accept an annual average of 2 million gallons a day with a dischargelimit of 3 million gallons a day. The new oxidation ditch will have the capacity to treat 5.1million gallons a day with a permitted discharge of 4.8 MGD.
The Downtown Wastewater Plant currently has a discharge limit of 500,000 gallons per day.These aerated lagoons are being replaced with a Kubota Membrane Filtration system. Thetreatment capacity will increase to 650,000 gallons per day and produce reuse quality effluent.The discharge limit will be 600,000 gallons per day.
Solid Waste
Garbage collection and disposal is provided by the City of Kingman for all areas within theKingman City limits. Waste Management, Bulldog Disposal & Recycling and Westside DisposalServices provide service for Commercial garbage collection and for areas outside the City.
Landfill OperationThe sanitary landfill is operated by Gambi Disposal of Arizona,
69

OL

CHAPTER 7
PARKS, RECREATION, TRAILS ANDOPEN SPACE ELEMENT
INTRODUCTION
The Open Space Element is one the elements required under by the Arizona Revised Statutes.The following items are required to be addressed:
A. A comprehensive inventory of open space areas, recreational resources and designationsof access points to open space areas and resources.
B. An analysis of forecasted needs, policies for managing and protecting open space areasand resources and implementation strategies to acquire additional open space areas andfurther establish recreational resources.
C. Policies and implementation strategies designed to promote a regional system ofintegrated open space and recreational resources and a consideration of any existingregional open space plans.
For cities fewer than 50,000 in population, a Recreation Element showing a comprehensivesystem of areas and public sites for recreation may be included which deals with the location andproposed development of any part or phase of natural reservations, parks, parkways and scenicdrives, beaches, playgrounds and playfields, open space, bicycle routes, and other recreationareas.
PARKS, RECREATION, OPEN SPACE AND TRAILS (PROST) PLAN
In October, 2000 the Parks, Recreation, Open Space and Trails Plan or PROST Plan wasdeveloped to serve as a guideline for the Kingman Common Council and City staff to use in thedecision making process regarding park site acquisition, development and maintenance,recreational programs, open space acquisition and trail development. This plan included newstandards for all of these facilities and programs that will better meet the needs of all citizens ofKingman. As with all our planning programs, this document addressed all land within the Cityof Kingman General Plan Study Area. The PROST plan addresses the required features of theOpen Space Element as well as some of the optional features of the Recreation Element asoutlined by the Growing Smarter legislation. The PROST plan was updated for inclusion in theKingman General Plan 2020 and is included here as well.
71

MAJOR ISSUES
PARK STANDARDS
The following standards indicated in Table 1, will be the guide for the acquisition anddevelopment of new park sites. However, some current developed parks and currently city-owned future park sites may not meet the area requirements called out in these standards.
TABLE 1: KINGMAN PARK SITE STANDARDS
Play Lot Neighborhood CommunityPark Park
Minimum Area less than 1 acre 5-10 acres 40—50 acres
Service Radius 1/4 mile ½ mile 2 miles
Typical safe-play safe-play apparatus lighted baseball, softball,Facilities apparatus, picnic areas football, soccer fields
turf green sports areas tennis, volleyball,trees un-lighted fields racquetball, basketball
seating areas seating areas courts, playground, picnicshade multi-use court areas, recreation bldgs.,
restrooms pools, restroom,security lighting concession bldgs., security
lighting
There are and will continue to be a need for specialized parks that may be incorporated intoexisting or planned parks, or serve as stand alone facilities. Some of these types of facilitiesinclude skateboard parks, BMX bicycle tracks, indoor swimming pool, outdoor amphitheater,indoor ice rink, indoor running track, indoor basketball courts, water park, and a soccer complex.Standards for these specialized parks are outlined in Table 2.
TABLE 2: COMMON PARK FACILITIES STANDARDS
Facility Dimensions Area Orientation
Basketballyouth 46’ X 84’ 2400-3036 sf Long axishigh school 50’ X 84’ 5040-7280 sf north/southcollegiate 50’ X 94’ 5’ buffer 5600-7980 sf
Baseball 90’ baselinesofficial 60.5’ pitching distance 3.0-3.85 acres Line from home plate
320’ mm foul lines through pitchers mound to400’+ center field run east/west
little league 60’ baselines46’ pitching distance
200’ foul lines 1.2 acres200’-250’ center field
72

Facility Dimensions Area Orientation
Soccer 195’-225’ X 330”-360’ 1.7-2.1 acres Fall season-long axis10’ buffer northwest or
southeast. For longerperiods, north/south
Football 160’ X 360’ 1.5 acres Fall season-long axis6’ buffer northwest or
southeast. For longerperiods, north/south
Tennis 36’ X 78’ 12’ buffer 800-1,000 sf Long axis north/south
Volleyball 30’ X 60’ 6’ buffer 4,000 sf Long axis north/south
Handball 20’ X 40’ 10’ buffer 800-1,000 sf Long axis north/south,20’ overhead clearance front wall north end
Swimming Poolteaching 25 yds X 45’ even depth 1-2 acres N/A
.. of 3’-4’competitive
25mX16m2:1 decktowater ratio
Ice hockey 85’X200’ rink 22,000sf N/A
Field Hockey 180’ X 300’ 10’ buffer 1.5 acres Fall season-long axisnorthwest or
southeast. For longerperiods,_north/south
Golfdriving range 900” X 690” wide 13.5 acres for Long axis southwest
12” per additional tee 25 tees to northeast withgolfer driving
par 3 (18 hole) 600-2,700 average length 50-60 acres northeast
9 hole standard 2,250 average length50 acre mm
18 hole standard 6,500 average length north/south axis most180 acre mm holes
73

RECREATIONAL PROGRAMS
A broad variety of recreational programs are offered by the City of Kingman. These programs,like our parks, are intended to serve all people within the greater Kingman area, regardless ofwhether they live within the city limits. User fees for recreational programs are set to cover thedirect costs of the program such as instructors and equipment.
Many programs have a long history of support and community involvement, including youth andadult sports leagues. Developing new recreation programs is more complex. Surveys,questionnaires, advertisements in local media, suggestions, brainstorming, and national trendsare all used to come up with new ideas for programs. Staff then has to gauge the overall interestin the program, and try to find a qualified person to lead or instruct the activity, along withcoordinating the time, place, and equipment necessary for it. At the conclusion of the programschedule, evaluations, interviews, and costs analysis are conducted to determine whether itshould be offered again.
OPEN SPACE ACQUISITION
The acquisition of open space by the City is guided by a variety of criteria. The emphasis foracquisition are large parcels, in areas of unique geographical formation, areas with limiteddevelopment potential due to slope or flooding potential, and areas of archeological significance.
The mountains, hillsides, and buttes that frame the Kingman area should be preserved. Thepurchase of property for the preservation of open space and providing buffers to developmentshould be prioritized within the designated open space reserves such as the Cerbat FoothillsRecreation Area, the White Cliffs Reserve and other areas with significant natural features suchas mountain tops, hillsides, and buttes. In addition to providing development buffers, these areasserve as vital watersheds, wildlife habitat, recreational resources, and scenic view.
Another reason for property acquisition is for flood control purposes. In the purchase of thesetypes of sites, consideration should be given to acquiring larger sites that may also accommodatepark and recreation uses. Development of flood control parcels into parks and other attractiveopen space areas will enhance the beauty of the community and remove the unsightliness of theparcels. For example, the landscaping and development of Mohave Wash into fields and passiverecreational facilities that will not be damaged by the occasional flooding will aid in relieving theshortage of soccer practice fields and outdoor recreational needs.
TRAIL STANDARDS
Natural surface multiple use trails existing and proposed in the open space reserves are built toBureau of Land Management and Arizona State Parks standards. The typical cross section is afour-foot wide path with a two-percent cross slope, and a maximum grade of 10-percent.Switchbacks are frequently used in steep areas to minimize grades. Level landing areas are alsobeneficial at the end of sections with higher grades. Sight distances and erosion control are keyelements in trail design. A well designed trail greatly minimizes the amount of trail maintenanceand reconstruction required through normal use and/or heavy rains.
74

Urban multiple use paths of either concrete or asphalt are designed wider, 8-12 feet, with twofeet wide graded shoulders on each side. They generally have a two-percent cross slope with amaximum grade of five-percent. These paths must meet ADA requirements. Design speed,sight distance, and roadway intersections are important aspects for the design of these paths.Detailed information on path design can be found in the Guide for the Development of BicycleFacilities, published by AASHTO.
CURRENT CONDITIONS
EXISTING PARK FACILITIES
Table 3 on the following page is an inventory of existing park facilities by park type, size,location and amenities within the Kingman General Plan Study Area. The park locations arelisted by Neighborhood Planning Area (NPA). For reference purposes NPA 1 is the HistoricDowntownfWest Highway 93 area; NPA 2 is the Hilltop/Country Club area; NPA 3 is the EastKingmanlHualapai Mountain Road area; NPA 4 is the Centennial Park/Canyon Shadows area;NPA 5 is the Vista BellalKingman Airport area; and NPA 6 is the Camelback/New KingmanAddition area.
75

TABLE 3: EXISTING PARK FACILITIES AS OF THE YEAR 2013
Park Name Park Type Size NPA Other Amenities
Centennial Park Community 40 acres 4 playground, lighted softball fields, soccerfields, tennis courts, racquetball courts
lighted basketball courts,2 restroom and concession buildings,
swimming poolrecreation center, picnic areas
Southside Park Community 42 acres 1 playground, lighted softball fields, soccerfields, restroom and concession buildings
Lewis Kingman Park Neighborhood 967 2 dog park, restroom building, picnic areas,acres ball field
Firefighter’s Memorial Neighborhood 8.71 2 playground, Frisbee golf course, skatePark acres park, restroom, picnic areas
Cecil Davis Park Neighborhood 4.68 3 playground, restroom building, picnic areaacres
Locomotive Park Neighborhood 4 acres 1 picnic area, historic locomotive
Walleck Ranch Park Neighborhood 3 acres 4 playground, basketball court, picnic area,horseshoe pits, restroom
Canyon Shadows Park Neighborhood 3 acres 4 playground, basketball court, picnic area,horseshoe pits
Metcalfe Park Neighborhood 2 acres 1 playground, restroom building, stage, picnicarea
Hubbs Park Neighborhood 1.24 1 playground, picnic area, Hubbs Houseacres Head Start Center
Mohave Park Neighborhood 1 acre 1 playground, basketball court, picnic area
Downtown Swimming N/A .6 acres 1 swimming pool, restroom buildingPool
Neil Butler Community 20 acres 6 picnic area, ball field, restrooms,Park(County) playground
Pawnee Park Neighborhood 2.75 Playground, turf area, and a picnic tableacres with a canopy.
Monsoon Park Neighborhood 6.75 Turf area onlyacres
76

LEVEL OF SERVICE STANDARDS FOR PARKS
Level of Service (LOS) Standards provides a bench mark for a community to use in determiningservice demands and needs. LOS standards are given in this plan to show the needs for parkspace. The LOS number represents the acreage of developed park space per 1,000 residents. In2013 there were 129.4-acres of developed park space in the City of Kingman, with a populationof 28,279-people based upon the July 1, 2011 population estimate. The 2013 City of KingmanLOS was 4.58-acres of developed park space for 1,000 residents. These figures can be furtherbroken down to provide LOS numbers for Neighborhood Planning Areas (NPA), and by parktype, i.e., community park, neighborhood park, or pool. The LOS for the entire KingmanGeneral Plan Study Area using the 2011 census figure of 55,913 population and 149.4 acres ofpark land was 2.67-acres of park space per 1,000 residents.
The benefit of using LOS is that it provides an unbiased number to use in forecasting park needsand locating and developing park space. The drawback is that the goal LOS number is relative.Nationally, community standards vary widely from 6.25 to 10.5, and it really depends on whatthe community feels is sufficient for their needs. LOS standards would allow us to comparecurrent park facilities over time as population increases with residential growth and annexations.Given the anecdotal evidence of participation in youth and adult sport and recreational programs,it would appear that Kingman’s LOS should be at the higher end of this range. The availabilityof Hualapai Mountain Park (for camping, hiking, and picnicking) and the water sportopportunities at Lake Mead, Bullhead City, and Lake Havasu City also provides recreationalamenities that are not quantified in the City parks and recreational system but are outdoorrecreational venues for Kingman residents. Recent questionnaires and community surveys haverepeatedly shown that the Parks Department, facilities, and programs are the most popular andwell rated of all City functions.
Tables 4 and 5 give a breakdown of the LOS for parks in each NPA within the KingmanGeneral Plan Study Area and LOS by park type.
77

TABLE 4: PARK (LOS) BY NEIGHBORHOOD PLANNING AREA (NPA)
1I Park Type # Acreage Total Acreage
NPA I NEIGHBORHOOD PARK 4 8.84 50.84
rCOMMUNITY PARK 1 42
POOL I
NPA2 NEIGHBORHOOD PARK 2 18.38 18.38
NPA3 NEIGHBORHOOD PARK 3 14.18 14.18
NPA4 NEIGHBORHOOD PARK 2 6.00 46.00
COMMUNITY PARK 1 40.00
POOL 1 1
NPA5 0 0 0.00
NPA 6 COMMUNITY PARK 1 20 20.00
STUDY AREA 149.4
CITY 129.4
011 GPA LOS of 149.4 acres of park space per 55,913 resi eats = 2.67 acres of park space per 1,000 residents.2011 CityLOS of 129.4 acres of park space for 28,279 residents = 4.58 acres of park space per 1,000 residents.
TABLE 5: PARK (LOS) BY TYPE
•Neighborhood Park Community Park Pool #
Acreage Acreage
NPAI 8.84 42.00 1.00
NPA2 18.38 0.00 0.00
NPA3 14.18 0.00 0.00
NPA4 6.00 40.00 1.00
NPA 5 0.00 0.00 0.00
NPA6 0.00 20.00 0.00
G.P.A. 37.9 102.00 2.00
CITY 47.4 82.00 2.00
2000 General Plan Study Area: Neighborhood park LOS = 1.07 acres per 1,000 residents; Community park LOS = 2.31 acresper 1,000 residents; Pool LOS = 1 pooi per 17,742 residents.2003 City of Kingman: Neighborhood park LOS 1.67 acres per 1,000 residents; Community park LOS 3.60 acres per 1,000residents; Pool LOS = 1 pool per 11,375 residents.2011 City of Kingman: Neighborhood park LOS = 1.68-acres per 1,000 residents; Community park LOS = 2.9 acres per 1,000residents; Pool LOS I pool per 14,140 residents.
78

EXISTING RECREATION PROGRAMS
Current recreational programs offered by the City of Kingman include youth and adult sports,arts, exercise, and dance classes, aquatic programs, and specialty programs such as cooking, hamradio, and fishing. The department also organizes trips and excursions along with special eventssuch as the Easter egg hunt, mud mania, and parades. All of these programs are intended toserve the diverse population of the Kingman area. Programs are broken down into age groups,with activities planned for every group from toddlers to seniors. User fees are kept to theminimum needed to cover direct costs of the programs, to keep them as affordable and accessibleas possible.
EXISTING OPEN SPACE AND TRAIL SYSTEM
Currently, the City owns 3,731 acres of open space as outlined in Table 6. Based upon the 2002population estimate, the City of Kingman open space LOS is 169.25 acres per 1,000 people.Based upon the 2000 census, the Kingman General Plan Study Area open space LOS is 105.15acres per 1,000 people.
TABLE 6: EXISTING OPEN SPACE AND TRAIL SYSTEM
Area Size Improved Trails 5o1 0 :ities 1Cerbat Cliffs Golf 218 acres 18 hole golfCourse course
Cerbat Foothills 5,620 acres BLM Camp Beale Loop(City) Castle Rock Improved trailRecreation Area 2,073 acres City Badger Trail(BLM) Trail heads with(CFRA) (City+BLM) signage and
information
White Cliffs 100 acres Historic Rutted Wagon Cliff features forReserve (WCR) Trail repelling
Mohave Wash Trail 5-miles Concrete trail along Walleck RanchMohave Wash from Airway Park
to Northern Av
Hualapai Mountain 2300 acres Trails to various peaks Camp sites,Park picnic areas
Windy Point Cerbat Mtns on BLM Cherum Peak Trail CampgroundCampground Land
PLANNED AND PROGRAMMED PARKS, RECREATION, OPEN SPACE ANDTRAILS FACILITIES
PROGRAMMED PARK FACILITIES
Funding since 2007 has been severely limited and capital improvements for parks has been verylimited. A 1.65 acre neighborhood park on Sycamore Avenue is programmed. Moreneighborhood parks and a large 40-acre plus park are demanded but unfunded. A handicap
79

accessible playground was developed at Southside Park in 2010. A pedestrian crossing from thePowerhouse Visitors Center to Locomotive Park is funded and planned to be completed in 2013.The capital improvements projected in the Parks Recreation Open Space and Trails Plan hasbeen postponed until funding can be identified.
The Kingman Unified School District have a number of recreational facilities, but due to securityand maintenance cost issues, non-school related public access to these facilities is limited tosupervised programs use by the City Parks and Recreation Department.
The development of a large park that caiV consolidate soccer fields and be irrigated by treatedeffluent is proposed. Such a park would need to be located near the Hilltop WastewaterTreatment Plant so the extending of treated effluent water lines can be feasible. No such park isprogrammed at this time.
PROGRAMMED IMPROVEMENTS TO EXISTING PARKS
Table 8 below indicates improvements to existing parks that are programmed in next 10 years.
TABLE 8: PROGRAMMED IMPROVEMENTS TO EXISTING PARKS
Park Name Park Type NPA Recommended Time Line- Improvements
Southside Community I Additional playground equipment, PlaygroundPark improved parking area, picnic equipment has
areas, turf and trees, tennis, been installed;basketball, and volleyball courts, remaining
BMX bike course. improvementsby 2020.
Centennial Community 4 Additional playground equipment By 2018Park
Neil Butler Community 6 Turf, trees, irrigation, playground No annexationPark* equipment, picnic areas, sport therefore no
courts and fields. improvementsplanned.
* If and when this area is annexed into the City of Kingman.
PLANNED NEW PARK FACILITIES
Table 9 indicates new park facilities that are planned to be completed in the next 5-10+ years.The proposed park sites on the map in Figure 1 are intended to show the need for park spacewithin certain areas in various NPAs, and do not represent any specific property, parcel, or land.
80

TABLE 9: PLANNED NEW PARK FACILITIES
Area Park Type Size fl NPA Time Line
Greater Kingman Neighborhood Park 5-10 acres 5 By 2020Addition area
Kingman Camelback Neighborhood Park 5-10 acres 6 By 2023area
Lake Mohave Country Neighborhood Park 5-10 acres 6* By 2028Club Estates area
Kingman Park Community Park 40-50 acres 3 By 2023Estates area
Cerbat Cliffs Golf Neighborhood Park 5-10 acres 2 By 2028Course area
Shangri-La Estates Neighborhood Park 5-10 acres 4 By 2028area
Vista BellalParkway Neighborhood Park 5-10 acres 5 By 2028area
Sunhaven Homesites Neighborhood Park 5-10 acres 6* By 2028area
New Kingman Neighborhood Park 5-10 acres 6* By 2028Addition Unit # 10area
New Kingman Neighborhood Park 5-10 acres 6* By 2028Addition Unit # 9 area
* If and when this area is annexed by the City of Kingman.
PLAY LOTS
No play lots are shown on the programmed or planned park facilities tables. However, MonsoonPark, which is the drainage basin in the East Golden Gate Improvement at the northwest cornerof Eastern and Southern Avenue is used as a park and is open to the public in non-floodwayaccumulation periods, which is about 360 days a year. Soccer practice, ice block sledding, watersliding (if a garden hose from a neighboring property is extended). This area can be furtherdeveloped with some trees. Play lots, in general, are a kind of small pocket park that is intendedto fill in the gaps between neighborhood parks. The maintenance cost of small pocket parks arehigh due to mobilization costs of maintenance equipment and personnel and often discouragedby park maintenance personnel. Other partners including service organizations and private sectorbusinesses can be involved in the establishment of play lots. It is recommended that public
81

hearings and other forms of citizen input are held prior to the creation of a play lot to ensurestrong neighborhood support and commitment to the project.
PLANNED RECREATION PROGRAMS
Future demand for recreation programs is difficult to predict. While existing programs may havea long history of support and involvement, the formulation of new programs is a difficultprocess. Some broad demographic information may be useful for helping define areas of futureinterest in recreation programs. Population will continue to grow, both through migration andannexations. Migration will be the more important of these factors because many residents ofthe unincorporated areas of the City already participate in our recreation programs at the samecost as city residents. The Kingman General Plan Study area grew by approximately 1.2-percentper year between 2000 and 2010.
While youth and adult sports, physical fitness, and travel programs will always have their placein recreational planning, specialty programs for school aged children and seniors may have ahigher demand in the future. Examples of these specialized programs include before and afterschool activities for youth and craft and computer classes for retirees.
The City has two swimming pools. The downtown pool has a wading pool for young children,and is popular to families. The Centennial Park pool is an “Olympic” style of pool with a numberof maintenance issues. Both pools are very expensive to operate and maintain. Nevertheless, thepoois are very popular amongst the citizenry. The construction of a water park facility wouldbetter meet the desires of the community for water recreational activity. However, there are nocapital funds available to replace either pool and construct a water park.
PLANNED OPEN SPACE ACQUISITION
The acquisition of open space will continue in the Cerbat Foothills Recreation Area (CFRA) andthe White Cliffs Recreation Area. Other areas with potential for open space reserves wouldinclude the Bull Mountain area in Kingman Camelback, and the Slaughterhouse Canyon area ofHualapai Mountain Road. Portions of State Trust Section 36, T.22N., R.17W., and all of StateTrust Section 2, T.21N. R.17W., should be considered for open space preservation under theArizona Preserve Initiative program contained in Growing Smarter legislation. In addition,portions of BLM lands in Sections 23, 24, 25, 26, 29 and 30, T.21N., R.16W., as well as Sections26 and 35 in T.22N., R.17W., may be considered for preservation as well.
PLANNED TRAIL IMPROVEMENTS
The City, in conjunction with the BLM, will continue to plan and develop multiple use trails inthe CFRA, based upon the management agreement signed by both entities. Trails should also beextended from the CFRA into the developed portion of the City in the area of Canyon Shadows.Trails are also needed in the White Cliffs Reserve Area. These trail systems could ultimately belinked in with the Mohave Wash trail project and other multiple use paths proposed in theStockton Hill Road/I-40 area.
82

The connection of the CFRA trails to the urban paths of the Mohave Wash and other areaprojects would create a regional trail system that could extend from the Hilltop wastewatertreatment plant northeast of Kingman, to Golden Valley to the west of Kingman, approximately15 miles. This type of trail and path system links open space areas and assures future access forthe citizens of Kingman. This system will also connect to developed park sites, creating linearparks along transportation, utility and drainage corridors. Park sites will have amenities for trailusers, such as parking, restrooms, drinking fountains, and shade, serving trail-heads.
The entire existing programmed and planned trail system shown in Figure 2 extendsapproximately 40 miles. The proposed trail locations shown in Figure 2 are intended to representthe general location of proposed trails and do not represent any specific property, parcel, or land.
PROGRAMMED AND PLANNED PARK FACILITIES FOR THE YEAR 2013
Since the General Plan was adopted in 2003. If all the programmed and planned new parkfacilities called out in this plan were completed in ten years, which would be 2013, the parkacreage would be as shown in Table 10. The Level of Service for each park type in 2013 isindicated in Table 11.
TABLE 10: YEAR 2013 PARK ACREAGE BY GENERAL PLANNEIGHBORHOOD PLANNING AREA (NPA)
Park Type # Acreage Total Acreage
NPA I NEIGHBORHOOD PARK 4 8.84 50.84
COMMUNITY PARK 1 42
POOL 1
NPA 2 NEIGHBORHOOD PARK 3 23.38-28.38 23.38-28.38
NPA3 PLAY LOT 1 2.00
NEIGHBORHOOD PARK 2 5.68
COMMUNITY PARK 1 40-50 47.68-57.68
NPA4 NEIGHBORHOOD PARK 4 12.65-1 7.65
COMMUNITY PARK 1 40.00 52.65-57.65
POOL 1 1.00
NPA5 NEIGHBORHOOD PARK 1 5.00-10.00 5.00-10.00
NPA6 NEIGHBORHOOD PARK 2 10.00-20.00
COMMUNITY PARK 1 20.00 30.00-40.00
G. P. A. 209.55-244.55
CITY 171.55-214.55
Year 2011 G.P.A. LOS of 209.55-244.55 acres of park space per 55,913 residents = 3.75-4.37 acres of park space per 1,000 residents.
Year 2011 Citywide LOS of 171.55-214.55 cc. of park space for 28,279 = 6.07-7.59 cc. of park space per 1,000.
83

The growth rate is expected to continue to grow at 1.2 percent annually. The park system is notable to handle current demand and the problem will only become more intense as the communitygrows. With continued reduction of State shared revenues and the reluctance to increase localtaxes, the City will continue to experiences pressure to develop more park facilities. Utilizationof land, such as drainageways like Mohave Wash is a partial option, but the capital costs todevelop these areas and the operational costs to maintain additional park facilities continues toplague the City under its current revenue structure. Citizen support is needed to increase therevenue structure for the parks and recreation system.
The 2000 Parks Recreation Open Space Trails Plan was based on the assumption that theKingman area would growth at a four percent growth rate from 2000 to 2013. The area actuallygrew at an annual rate of 1.2-percent. Regardless, the parks, recreation, open space and trailsneeds continue to exist because the City was unable to fund its parks system in proportion to the1 .2-percent growth rate. Capital improvements planned within a 10-year timeframe from 2000,are now projected to be in a 15-year timeframe beginning in 2013.
TABLE 11: YEAR 2028 PARK (LOS) BY PARK TYPE
Neighborhood Play Lot Community Pool #Park Acreage Acreage Park Acreage
NPAI 8.84 0.00 42.00 1.00
NPA2 23.38-28.38 0.00 0.00 0.00
NPA3 5.68 2.00 40.00-50.00 1.00
NPA4 12.65-17.65 0.00 40.00 1.00
NPA5 5.00-10.00 0.00 0.00 0.00
NPA6 10.00-20.00 0.00 20.00 0.00
PLAN 65.55-90.55 2.00 142.00-152.00 3.00AREA (GPA)
CITY 60.55-80.55 2.00 122.00-132.00 3.00Year 2028 GPA play lot LOS 0.03 acres per 1,000 residents.Year 2028 GPA neighborhood park LOS = 1.11-1.53 acres per 1,000 residents.Year 2028 GPA community park LOS = 2.40-2.57 acres per 1,000 residents.Year 2028 GPA pool LOS = 1 pool per 19,694 residents.Year 2028 City play lot LOS =0.05 acres per 1,000 residentsYear 2028 City neighborhood park LOS = 1.65-2.20 acres per 1,000 residents.Year 2028 City community park LOS = 3.33-3.60 acres per 1,000 residents.Year 2028 City pooi LOS = 1 pooi per 12,226 residents.
84

MAINTENANCE
New park facilities will incorporate low-maintenance features to address maintenance andvandalism issues from the onset. Signage will be low maintenance and protected fromvandalism. Low water use plants will be used, along with drip irrigation systems. All buildings,by design, will be a low maintenance issue for the City of Kingman Parks Department. Concreteblock buildings may be stained instead of painted which penetrates the porous block andeliminates the need for annual painting. The blocks may also be sealed with an anti-graffitiresistant material. Ground surfaces around buildings will be poured in place concrete instead ofasphaltic mixtures, this leads to an extremely low maintenance walkway that requires no periodicresurfacing. Low water use plumbing fixtures will be stainless steel, which is resistant tovandalism.
Fencing repair, trail maintenance, sign maintenance, and litter control are all maintenance issuesassociated with open space areas. Other trail amenities including benches, mile markers, bikeracks, and hitching posts may also require periodic maintenance. Due to the remoteness ofportions of our hiking trails, there is potential for vandalism. As a rule, vandalism decreases inpopular and frequently used open space areas and trails. Our existing trail system appears to bepopular, and vandalism has not been a major issue. However, vandalism and regularmaintenance should be considered as our trail system expands.
SAFETY AND SECURITY
Local safety and law enforcement is an important concern during the design and construction ofany new park projects. Police and Fire staff is involved from the beginning to review designplans for any new park along with individual elements of the proposed park. Based on pastexperience and the expertise of the designers along with our Parks, Police, and Fire staff, we areable to address safety, first-aid, and law enforcement problems before, rather than after theyoccur.
Any future park site plan will incorporate safety features such as separating sports areas frompicnic and playground areas. Parks will also be designed to allow emergency vehicle access.Security lighting will be designed into any restroom buildings. In general, park design will allowfor an unobstructed visibility of the area. This visual openness will enhance the safety of theusers of the facility, as well as aiding Police and Park personnel in monitoring activities withinthe park, thus reducing the potential for vandalism or other criminal activity. Vandalismresistant materials will be used in restroom buildings including stainless steel plumbing fixtures,and block construction. Buildings will have public telephone access for emergency response.
Safety and security in open space areas and on trails is also an important issue. Aside fromcriminal activity, emergency medical responses may be required due to heat, exposure, injury, orsnake bite. Our urban, improved path system will be patrolled by the Police Department’s bikepatrol. In the more remote open space reserves, police patrol will be less frequent. Officers willcheck trail head location from time to time. The Mohave County Sheriff’s Office has ahelicopter and search and rescue team.
85

PROJECT COSTS
Sample costs for neighborhood park design and development are shown in Table 12. The cost ofacquiring park space varies widely, and is based on appraised value which considers contributingfactors such as access, infrastructure, location, and size. Park space acquisition can be costly becausesites with good amenities are also attractive for other forms of development. Many of our existingpark sites have characteristics such as drainage patterns that would make them less desirable todevelop as other uses. The costs of recreational programs vary widely, with more expensiveactivities necessitating higher user fees. Like park sites, open space acquisition is also based onappraised valuation. Generally, open space areas should be cheaper than park space. Theseproperties probably won’t have the access, infrastructure, and location that would make it attractivefor other types of development. The total cost of recent open space acquisitions have ranged from$500.00 to $2,500.00 per acre. Recent experiences with trail development indicate that one mile oftrail costs approximately $ 11,000.00 for construction labor. Other costs including a vehicle,gasoline, and trail-head amenities like signage and benches are not included in this figure.
TABLE 12: SAMPLE PARK DEVELOPMENT COSTS
Project Scope Items Number of Units Unit Cost Total Item Cost
Curb & Sidewalk 500 L.F. $ 33.17 $ 16,750.00
Driveway & Parking Lot 1 L.S. $ 32,500.00 $ 32,500.00
Restroom Building 480 S.F. $ 104.00 $ 50,000.00
Ramada 400 S.F. $ 62.50 $ 25,000.00
Multi-Use Court 4,700 S.F. $ 5.32 $ 25,000.00
Playground Equipment 1 L.S. $ 12,000.00 $ 12,000.00
Barbeque Grills 3 $ 350.00 $ 1,050.00
Picnic Tables 6 $ 650.00 $ 3,900.00
Horse Shoe Pits 2 $ 1,000.00 $ 2,000.00
Landscape(trees, shrubs, 1 L.S. $ 115,000.00 $ 115,000.00decomposed granite, and turf)
Irrigation I L.S. $ 40,000.00 $ 40,000.00
Mobilization 1 L.S. $ 7,500.00 $ 7,500.00
Clear & Grub 1 L.S. $ 3,500.00 $ 3,500.00
Construction Administration 1 L.S. $ 50,000.00 $ 50,000.00
Design 1 L.S. $ 40,000.00 $ 40,000.00
TOTAL $ 424,200.00
L.F. = lineal feet; L.S. = lump sum; S.F. = square feet
86

FUNDING AND ACQUISITION SOURCES
Funding for parks, recreation, open space, and trails can come by various means. Following aremeans to acquire and a parks system:
DONATIONS. At times property owners are willing to donate land and monies for park andopen space development. These donations come on a sporadic basis and at times the land offeredfor donation are not conducive to park development.
LAND TRANSFER. At times another governmental agency has property that it is willing totransfer to a local government for park development. For example, the Arizona Department ofTransportation has provided land to the City of Kingman for park and trail development.
EXACTION. The judicial decisions in land use cases have made it clear that the governmentsmust demonstrate a rational nexus to exact land for parks and open space. There must be a“rough proportionality” to the impact of the development in relation to the amount of landexacted. Small developments only allow small amounts of land that often are not useful orfunctional for a parks system. Large developments can provide sufficient land for aneighborhood park, but much of the development in Kingman is small in scale.
GRANTS. There are various grant programs through the State and Federal governments as wellas private foundations that provide monies to acquire and construct park lands. The City has beensuccessful in securing such grants to build trails and playgrounds.
BONDING. The City could go to the voters for a general obligation bond for fund parkimprovements and park land development.
GENERAL FUND BUDGETING. If the City were to have sufficient monies through itsexisting revenue sources, monies could be budgeted for park land acquisition and development.
87

88
•%$....
•‘..•
t.•.•••.••.••••:.••‘.-
I•.
•.••I.y.•
•I••.•.‘r•!‘r.!•.,t%!_t.Ii.•.•••
•.j••:‘•••;.•.:—.‘,:••I•••••••.•:••—•••
—I—
—hi..

CHAPTER 8COST OF DEVELOPMENT ELEMENT
INTRODUCTION
The Cost of Development Element is one of the elements required by the Arizona RevisedStatutes. The Cost of Development Element should be used in conjunction with the otherelements of the Kingman General Plan 2030 Update to guide the physical development of theCity. This element includes policies and strategies that the City may use to require developmentto pay its “fair share” compensation toward the cost of additional public service needs generatedby new development.
The Cost ofDevelopment Element includes:
A.) A component that identifies various mechanisms that can be used to fundadditional public services necessary to serve new development, including, but notlimited to: bonding, special taxing districts, development fees, in lieu fees, facilityconstruction, dedications, and service privatization.
B.) A component that identifies policies to ensure that any mechanisms adopted bythe City of Kingman under this element result in a beneficial use to thedevelopment and bear a reasonable relationship to the burden imposed on the Cityto provide the additional public services.
FUNDING MECHANISMS
In order to achieve Kingman’s goal of meeting the needs of our growing community, the Citymust continue to expand public infrastructure and facilitate services. It is important that the Cityestablish specific policies, plans and strategies that can be implemented with community supportto address financial needs and achieve stated community goals.
With continued growth, Kingman has made efforts to fund increases in the number of police andfire personnel, and other employees, services and facilities. City facilities and services arefunded through the general fund and some special grants. The general fund is funded throughsales tax revenues, which are the largest source of revenue, and other population-based revenuesfrom the State or through payment for City services. Sales tax revenue tends to be unpredictabledue to fluctuating economic conditions such as employment rates, stock market changes, andtourism levels.
89

A significant amount of funding for the City of Kingman comes from State Shared Revenues.Historically, instead of the local governments collecting monies for road improvements, it wasagreed amongst the State of Arizona and local governments that the State would collect HighwayUser Revenue Funds and share with local governments. Due to State of Arizona budgetshortfalls, the distribution of these funds to local governments has been significantly reduced sothe State would not have to increase its taxation of the taxpayers in the State and leave such aburden to the local governments.
The City of Kingman does not levy a property tax on its residents and depends on State sharerevenues, sales tax, user fees, and grants to fund its operations and capital improvements. Thereduction in sales tax revenues and State shared revenues has significantly reduced the City’scapital improvements program.
OVERVIEW OF FUNDING MECHANISMS
Under Arizona statutes, there are a number of options available to Kingman to fundinfrastructure and public facilities that are necessary to service new development. An overviewof these mechanisms follows:
Community Facifities DistrictsCommunity Facility Districts (CFD) may be fonned by cities or towns, but not counties. Theymay be used for specific public improvements including roadways, water and sewer, pedestrianways and malls, landscaping, lighting systems, traffic control, public buildings and sites, schoolsand sites, parks and sites, and public recreational facilities. Community Facility Districts mustrely on the revenue generated by the property tax generated in the district and cannot turn to theCity’s general fund if there is a shortfall in revenue. This source of funding is often used when alarge commercial development is anticipated that will generate sufficient revenues to fund thepublic infrastructure funded by the CFD.
Improvement DistrictsImprovement Districts may be formed by cities for projects that provide specific communitybenefit such as roadways, water, sewer, streetlights and parking facilities. While counties mayform an improvement district to establish and maintain a park or recreation area for the benefit ofthe property within the district, the statutory list of improvements financed and constructed by amunicipal improvement district does not include recreational facilities. In Kingmanimprovement districts have been used extensively to make capital improvements in oldersubdivisions. The use of improvement districts has proven to be a highly successful method ofpromoting residential infill in Kingman, although subject to some controversy regarding thenumber of lots placed on the market at one time. It should be noted that Arizona case law hasnot supported school improvements as part of municipal improvement districts. Decliningproperty values have resulted in numerous defaults in improvement district payments, whichhave caused the City to absorb defaulted costs and auction property in an attempt to recoup thedefaulted assessments.
90

Development AgreementsDevelopment agreements are permitted under A.R.S. 9-500.5 for municipalities. Developmentagreements permit contractual arrangements between the City and property owner(s) regulatingthe permitted uses, density, maximum height, and other aspects of the land subject to theagreement. Advantages of development agreements are that they are voluntary and, therefore,mutually agreeable to all parties involved in the negotiations. Also, they can enable the City toattain planning goals at minimal or without costs.
Development Impact FeesThe Arizona State legislature in 1982 passed specific legislation permitting cities and counties toimpose development impact fees on landowners in a “benefit area” to offset costs incurred by themunicipalities in providing necessary infrastructure needs and public services for newdevelopment. This state law requires documentation of projects to be financed by developmentimpact fees prior to their levy and collection, and that the monies collected are actuallycommitted within five years to a project of “direct benefit” to the development which paid thefees. In addition, the amount of development impact fees must bear a reasonable relationship tothe burden imposed upon the municipality to provide additional necessary public services to thedevelopment. (A.R.S. § 9-463.05(B) 4) A development should receive a beneficial use from theresults of the fees.
Kingman implemented a development impact fee program with the passage of Ordinance #1529on March 6, 2006; this ordinance became effective July 1, 2006. This program collected moniesto pay capital improvements through a development investment fee program. This programassessed development investment fees on building permits depending on the impact the use ofthe structure would have on the public infrastructure. The impacts were determined by a reportknown as the “Revenue and Fee Study, General Fund Fees and Charges, Final Report, October2005”, which was prepared by Red Oak Consulting, a division of Malcolm Pimie, Inc. Thisreport assessed the impact that growth would have on stormwater facilities, general governmentfacilities, parks and recreation facilities, police facilities, fire protection and suppressionfacilities, water infrastructure, sewer facilities, and streets and transportation infrastructure. Themonies were used to benefit the developments from which the fees were collected. The CityCouncil determined that the area of benefit was the City as a whole. The development investmentfees were placed in a separate fund and accounted for separately. The monies, with the accruedinterest were used only for the purposes authorized. The development investment fees were paidwhen building/construction permits were issued. Credits toward development investment feeswere granted when there was a required dedication of public sites and improvements provided bythe developer for which the fee is assessed. The development investment fees were required toand did bear a reasonable relationship to the burden of providing additional necessary publicservices to the development; and be assessed in a nondiscriminatory manner.
The Arizona Legislature continued to modify the development fee legislation (Arizona RevisedStatutes §9-463.05) to the point that with the passage of Senate Bill #1 525 in 2011 caused theCity Council repealed the development investment fee program, with the exception of thewastewater impact fee, effective January 1, 2012 (Ordinance #1723).
91

DedicationsA dedication is a conveyance of land by a private owner in the nature of a gift or grant and theacceptance of that land by a public entity. Streets in a subdivided development are usuallyacquired through a dedication to the public of the property comprising the streets. Otherdedications may include land for parks and recreational facilities, school sites, bike paths, orlocal transit facilities.
ExactionsAn exaction is a payment or dedication made by a developer for the right to proceed with aproject requiring government approval. They can be in the form of a fee, the dedication ofpublic land, the construction or maintenance of public infrastructure, or the provision of publicservices. The purpose of the exaction must be directly related to the need created by thedevelopment. In addition, its amount must be proportional to the cost of the improvement.Exaction cannot be administratively imposed but must be authorized by City Council legislativeaction. With the elimination of the Development Investment Fee Program, except forwastewater impact fee, an exaction program may be viewed as a means to secure land for publicfacilities that the proposed development’s impact will demand. Park land, site for public safetyfacilities, and stormwater facilities are examples of facilities that land will be needed. Anexaction must be proportional to the impact. Therefore when a development takes place in smallincrements, exacting sufficient land to develop an adequate sized park and other public facilityrequires negotiation with the property owner.
Franchise TaxThe franchise tax is based on the gross sales of the local utility companies that serve Kingmancustomers. Those that currently pay the franchise tax are: Unisource Electric (2%), UnisourceGas (2%), and Suddenlink Cable (5%). The revenue raised from franchise fees could beearmarked to fund capital projects but is normally used for General Fund operations. FrontierCommunications is not charged a franchise fee but rather its customers pay a sales tax on itsservices.
General Obligation BondsGeneral obligation bonds are a flexible financing option for the City, spreading the benefits andburdens of the fund uniformly throughout the community and can be used for almost any capitalpurpose. This often includes cost intensive capital improvements such as roads, parks, and sewerfacilities and equipment. As of 2013, the City of Kingman had no outstanding general obligationbonds.
General obligation bonds are somewhat restrictive however, because voter approval is requiredto authorize the issuance of bonds. This can be time consuming and costly. Additionally,because costs are spread uniformly throughout the community, infrastructure to support newdevelopment may be unfairly subsidized by existing development.
92

Motor Vehicle In-Lieu RevenueMotor vehicle license taxes are collected by the state. The City receives its share of the vehiclelicense tax collected based upon its population in relationship to the total incorporated populationof the county. Historically, this revenue source has been highly erratic and susceptible toeconomic change, and legislature whim.
Permit FeesRevenues from permit fees include fees collected from building permits, zoning fees and avariety of other programs. Normally these are not earmarked but fund operations. These feesgenerally do not cover the costs of the services provided.
Revenue BondsRevenue bonds are issued by a municipality and backed by a dedicated revenue stream.Improvements to existing sewer facilities are often made utilizing revenue bonds because there isa steady revenue stream from the utility users to attract bond buyers. Revenue bonds do notrequire voter approval and the constitutional debt cap do not apply to the issuance of revenuebonds. Municipalities with population of 75,000 or less may issue revenue bonds for utilitiesand recreational facilities, which include swimming pools, parks, playgrounds, municipal golfcourses, and ball parks.
State-Shared Sales Tax and Income Tax RevenuesRevenue includes the state sales tax and income tax collection, which are shared with cities andtowns, based upon population. Cities and towns share in a portion of the 6.85-percent sales taxcollected by the state. Fifty percent is retained by the state, 40 percent is designated for schoolsand the remaining 10 percent is allocated to cities and towns.
Cities and towns in Arizona are prohibited from levying an income tax, but are entitled to 15percent of state income tax collected from the previous two years.
The formula for distributing these taxes is based on the relation of the City’s population to thetotal state population. The State Department of Revenue collects, distributes funds, and providesrevenue forecasts to cities and towns for these revenue sources. State-Shared Revenues areextremely susceptible to Legislative budget whims. The State of Arizona has experienced budgetshortfalls and State Shared Revenue distribution to the local governments has been adverselyimpacted.
Specialty Industry TaxSpecialty industry taxes, such as bed taxes have been used to fund a variety of public servicesand facilities around the State of Arizona. Cities do not need legislative authorization or voterapproval to enact a specialty industry tax, while counties must have legislative authorization.Advantages to a specialty industry tax are that the local residents do not pay the tax and voterratification is not required. Kingman currently has a four-percent (4%) on bars, restaurants,cocktail lounges, and similar establishments where food and beverages are served, commonlyreferred as the restaurant and bar tax. Of this four-percent of “restaurant and bar” revenue, one
93

fourth of the revenues are dedicated to street repair and maintenance. On July 1, 2013, the Cityreduced this tax to three-percent (3%).
The City assesses a four-percent (4%) bed tax on lodging uses (Ordinance #1668). Half of therevenues traditionally funds Tourism Development Commission activities, although there is nomandate of this allocation. The remaining half of this revenue is to fund capital projects(Ordinance #1668).
Transaction Privilege (Sales) TaxThe Arizona transaction privilege tax is commonly referred to as a “sales tax”; however, the taxis on the privilege of doing business in Arizona and is not a true sales tax. This tax is levied onthe seller, not the purchaser. The seller may pass the burden of the tax on to the purchaser;however, the seller is ultimately liable to Arizona for the tax. Aside from the state tax rate, theCity may impose a transaction privilege or sales tax within its jurisdiction to fund the costs of avariety of public services. The City currently has a sales tax of two-percent. Starting June 1,2013, the State of Arizona reduced its transaction privilege tax rate from 6.85-percent to 5.85-percent. Beginning July 1, 2013, the City raised its sales tax rate by 0.5-percent to make theCity’s sales tax rate 2.5-percent.
Transportation RevenuesTransportation revenues include Highway User Revenue Fund (HURF - Gas tax) and LocalTransportation Assistance Funds (LTAF - State Lottery) and vehicle license taxes collected bythe state. A state constitutional restriction on use of the HURF required the funds to be usedsolely for street and highway purposes. LTAF is used to fund transit systems.
HURF revenues are distributed based on population and cities and towns participation in thelottery. The LTAF revenue sharing was capped in 1989 by the state legislature resulting in nogrowth in this source of revenue. The State of Arizona retained a significantly higher portion ofthese revenues to fund its transportation operations without raising taxation. This action left areduction in revenues to the local governments and therefore caused the City of Kingman toincrease sales taxes and specialty taxes to maintain its roads and to fund street improvements.
Transportation Enhancement FundsTransportation enhancement funds include grants such as ISTEA which may be used for inter-modal transportation development. These funds in recent years have been used in Kingman forsuch items as the Mohave Wash Enhancement Project, Beverly Avenue sidewalk improvementsand the Hualapai Mountain Road Enhancement Project.
User FeesUser fees are assessed for the specific use of a service or activity. An example is a fee chargedfor admission to a state or county park or fees charged for recreation facilities and programs. Auser fee can be employed to defray a portion or the entire cost of a project. The advantage of auser fee is that the person using the specific service incurs the charge. In Kingman user fees aremost associated with recreational activities. As a result of $55 millions upgrades to both
94

wastewater treatment facilities to meet Arizona Department of Environmental Quality standardsand also to meet present and future treatment capacity demands, wastewater utility rates haveincreased about 25-percent starting in January 1, 2012. Another increase of 25-percent waseffective beginning January 1, 2013. As more wastewater users connect to the wastewater systemthe base rate may decrease.
OTHER FUNDING OPTIONS
Certificate of ParticipationUnder this method of financing, private parties purchase Certificates of Participation (COP),which are the equivalent of tax-exempt bonds and represent an ownership interest in propertybelonging to a local government. The property is then leased back to the local government,which makes “lease” payments to the COP holders to cover the bond program. The City used aform of a COP during the Cerbat Cliffs Golf Course expansion in the mid 1 990s, but currentlydoes not have any Certificates of Participation. Mohave County used a COP for the GriffithArea water system.
Concurrency Requirements (Adequate Public Facilities)The pressures of growth and concern about urban sprawl have encouraged some communitiesand states to adopt “concurrency” ordinances. Concurrency ordinances are intended to ensurethat growth cannot occur in an area unless adequate public facilities are either in place, plannedor occur concurrent with proposed development. These programs have generally been adoptedgenerally in urban areas to prevent unacceptable declines in the provisions of services to existingresidents and to meet the demands of new residents. A key point is that, in its pure form,concurrency does not require that new development be paid for by developers, only that therequired improvements be made prior to or concurrent with the development. The question offinancing the improvements is related to impact fees and other funding mechanisms. The Stateof Florida has the most stringent State-wide requirements on “concurrency”.
Enterprise FundsEnterprise Funds include fees collected for City water, sewer, and sanitation services that areused to fund certain infrastructure expansion and capital improvements.
Other Funding MechanismsVarious funding mechanisms are available mostly in the form of loans and debt financing bondsthrough the state. These include the GADA and WIFA loans for various infrastructureimprovements as well as the Industrial Development Authority (IDA) and Municipal PropertyCorporation for municipal facilities.
Property TaxA property tax is a tax levied on land and improvements on a specific parcel of land. For manycommunities, it is their primary source of revenue. While Mohave County and all schooldistricts levy a primary property tax, which can be used to fund operating expenses. Mostrecently, the City of Kingman had a ballot proposition to consider a primary property tax in
95

November, 2007 that was turned down by the voters. Therefore, currently there is no cityprimary property tax. Cities can levy primary property taxes to fund maintenance and operationof municipal government services. Primary property taxes may not exceed the municipality’slevy limit. Costs associated with public infrastructure funding are funded by secondary propertytaxes, which are levied back to general obligation bonds issued by a municipality. Secondaryproperty taxes are not subject to the levy limit. However, the municipality may not issue generalobligation bonds in excess of its constitutionally set debt cap. Thus, while municipalities maynot set a primary property tax or create a new property tax over its levy limit, it can, once itreceives voter authorization to issue general obligation bonds, levy property taxes that are notsubject to the levy limit as necessary to cover the bond obligation.
CURRENT CONDITIONS
The City of Kingman relies primarily on sale tax, state shared revenue and various fees to fundoperations. A primary property tax was levied by the City in the 1970s, but was discontinued.The total General Fund budget for fiscal year 2012-2013 is $25,740,010, an increase ofapproximately $1 .033 millions from the previous fiscal year’s estimated budget.
Local revenues include the two-percent sales tax, four percent room tax, two-percent restaurantand bar tax, utility franchise fees, business license fees, parks and recreation fees, buildingpermit and inspection fees, and police and fire service charges. These fees represent revenue of$14,423,000 or 67.66-percent of the General Fund revenue sources for Kingman. The localprivilege tax (sales tax) is Kingman ‘ s single largest source of revenue and is obtained from the 2percent tax on retail and other sales, excluding food. Half of the room tax is used by the TourismDevelopment Commission to fund various projects designed to enhance tourism and theeconomic development of the Kingman area. The City utilizes the franchise fees and businesslicense fees for General Fund operations.
State-shared revenue sources include the state sales tax, income tax, and auto lieu tax, which areshared with cities and towns based upon a formula which relates the City’s population to the totalstate population. The State Department of Revenue collects, distributes sales and income taxfunds, and provides revenue forecasts to cities and towns for these income sources. Kingmanreceives a portion of the auto lieu tax collected by each County based upon its relationship to thetotal incorporated portion of the county. In fiscal year 2012-2013 the state-shared revenue wasbudgeted at $5,160,000, an increase of approximately $633000 from the previous fiscal year’sestimated budget.
A number of special revenue funds in the City’s budget are used for a wide variety of purposes.The Arizona Department of Revenue also collects and distributes transportation revenuesincluding the highway user revenue tax (HURF - gas tax) and local transportation assistancefunds (LTAF - State Lottery). A state constitutional restriction on the use of the HURF andLTAF requires the funds to be solely used for street and highway purposes. HURF revenues aredistributed based on population and cities and towns participation in the State Lottery. TheLTAF revenue sharing was capped in 1989 by the state legislature resulting in no growth in this
96
source of revenue. The fiscal year 2012-2013 budget estimated an 8.3% decrease in state-sharedHURF revenue and LTAF revenue as compared to the previous fiscal year. Kingman usesHURF and the lottery funds for various street maintenance purposes and street and sidewalkimprovements.
Other special revenue funds include Grant Funds for various CDBG projects, capitalimprovements such as the railroad depot, and trails and park improvements, the ImprovementDistrict Bond Repayment Fund, Benefits Reserve Fund, and the Transit System Fund.
Kingman’s Enterprise Funds is comprised of Water Funds, Wastewater Funds and the SanitationFund. The Water and Wastewater Operating Funds revenues are primarily from residential andcommercial water and sewer service fees as well as water meter connection fees. The City alsocollects water expansion fees to help fund various water system expansion projects. TheColorado River Water Fund provides funding for a number of well and water transmissionprojects. The wastewater plant expansion was funded through the Wastewater InfrastructureFinance Authority of Arizona and through the only remaining development investment fee in theCity of Kingman. The sewerage collection system line repair and replacements were fundedwith sewer use fee revenues and expansion is funded by developers and grants. Finally, theSanitation Operating Fund collects revenues from fees that all water customers pay on a monthlybasis. The fees are used for personnel, supplies and service and capital expenses associated withsanitation services.
Capital improvements have been funded largely through room tax revenues and grants. Therevenues collected for flood control purposes, which included rights-of-way for drainagecorridors which are funded through the Mohave County Flood Control District property taxes.
97

--
-6
4’
‘-4-
4’-
--
‘.
V--
-4-‘-
.2-.2
-j
--
“‘
•‘
-,
-4-’
4’;
--
4;
-
“C‘
-‘-
-;-
--
--
Go
_---
-‘,-
_-*
.-
.-
-‘
--
--
*--
--.---‘-
--
-‘._-_.
6
“H:
-4’
--
---
4__.
--4
-%
-‘
-:.-
--
—-
---
—5
44
4’
--S
‘-
-

CHAPTER 9ENVIRONMENTAL PLANNING
ELEMENTINTRODUCTION
The Environmental Planning Element is one of the elements required by the Arizona RevisedStatutes. This element is required to contain analysis, policies and strategies to addressanticipated effects, if any, of plan elements on air quality, water quality and natural resourcesassociated with proposed development under the General Plan. The policies and strategies to bedeveloped under this element shall be designed to have community-wide applicability and shallnot require an additional environmental impact statement or similar analysis beyond therequirements of state and federal law.
MAJOR ISSUES
AIR QUALITY ISSUES
The City of Kingman and the surrounding areas within the Kingman General Plan Study Areahave experienced steady, sustained growth for over the past 25-years. In 1990, the populationwithin the City of Kingman was 13,769, and by the year 2000 the population had risen to 20,069;an average annual increase of 3.84. The 2010 census for Kingman was 28,068, an annual growthrate of 3.41-percent for this 10-year period and with the 2012 population estimate of 28,335.Over the previous 30 year period, the average growth rate was 2.44-perecnt. The NewKingmanlButler CDP, which includes much of the area north of Kingman that lies within theGeneral Plan Study area, had a population of 11,627 in 1990. This population rose to 14,810 in2000; an average annual increase of 2.45-percent. In 2010, this area had a population of 22,764.The entire General Plan Study Area is, therefore, estimated to have had a population in the year2010 of 62,236. This would mean the Study Area as a whole experienced about a 5.78-percentannual population growth between 2000 and 2010.
As the population has grown, automobile traffic and construction have increased as well in thearea. Anecdotal evidence points to automobiles and construction sites as primary sources of airpollution in the Kingman area. Dust, by far, appears to be the main pollutant. This appears to becaused primarily by increased vehicular traffic, particularly on unpaved roads in the area, as wellas from construction sites in which properties have been clear-graded prior to the constructionphase. A secondary source of air pollution appears to be from regional forest and brush fireswhich can send smoke into the Kingman area from as far away as Southern California. Ingeneral, however, air quality remains good in the Kingman area and is assisted by frequentstrong prevailing winds.
99

WATER QUALITY ISSUES
The City of Kingman supplies water throughout the Kingman General Plan Study area. The arearelies entirely on groundwater as there are no surface water sources. In the year 2000, the City’smunicipal water system included 15 active well sites and an above-ground water storage capacityof 10 million gallons of water stored in 10 storage tanks. The source of this groundwater lies intwo basins: the Upper Hualapai Basin and the Sacramento Basin.
The effect of any point and non-point pollution sources on this valuable groundwater source iscritically important to the continued well-being of residents and to future growth of the area.Most of the potential pollution to the groundwater would be expected from non-point sourcessuch as roadway runoff Chemical analysis of wells in the Kingman Water System arecompleted frequently and annual consumer confidence reports regarding these tests are sent tothe public and are available from the City Water Department.
NATURAL RESOURCE AND ENVIRONMENTAL ISSUES
The City of Kingman lies between the Cerbat and Hualapai Mountain ranges at an elevationranging from about 3,300 feet in the downtown area to over 3,800 feet in Hualapai Foothillsarea. Elevations within the Kingman General Plan Study area range from near 3,000 feet in thesouthwestern portion to over 5,000 feet near the southeast corner. The high desert climate ischaracterized by generally dry weather, frequent sunny days and good visibility. The areaexperiences warm summers, mild springs and falls and cool winters with frequent strongprevailing winds primarily from the southwest and northeast. There are infrequent rains in theform of thunderstorms mainly between July and September and lighter showers and occasionalsnow mainly between November and March.
The Kingman area lies in a transition area between the Mohave Desert to the northwest and theSonoran Desert to the southeast. Plant communities of both deserts appear in the Kingman areaincluding creosote, mesquite, cholla, yucca, prickly pear, and other desert scrub and grasses.Wildlife in the area is that typically found in similar desert areas including desert tortoises,various snake species, coyotes, rabbits, skunks, deer, and quail.
The Kingman General Plan Study area is dominated by five soil types including: ParajitoGravelly Sandy Loam, Tres Hermanos, House Mountain Cerbat Rock Outcrop, Bucklebar SandyLoam, and Cherum-Hayhook. The Parajito Gravelly Sandy Loam and Cherum-Hayhook soiltypes are best suited for urban development as these soils are deep and well drained, in areas of0-3% slopes with a slight risk of water erosion. The House Mountain Cerbat Rock Outcrop soiltype is poorly suited to urban development as this soil is very shallow but well drained, in areasof 10-35% slopes with a moderate risk of water erosion. The main development limitations arethe steep slopes and shallow depth to bedrock which affects the use of septic tank absorptionfields.
100

The Kingman General Plan Study area lies within two drainage basins. The Mohave Channelbasin has a drainage area of 168 square miles and extends to the Hualapai Mountains on thesoutheast and the Cerbat Mountains on the west. This part of the much larger Hualapai Valleybasin which is 1,820 square miles in size. The Johnston Canyon basin has a drainage area of 12square miles which includes the developed downtown area. This basin is part of the largerSacramento Valley basin which covers about 1,400 square miles in western Arizona.
Portions of the Kingman area lie within several flood zones as identified by the 2009 FEMAFlood Insurance Rate Maps. Certain areas have been identified as frequently subject to floodingin the Mohave Channel basin including Fairgrounds Boulevard, Bank Street, Stockton Hill Road,Sunrise and Western Avenue. Areas subject to flooding in the Johnston Canyon basin includeFirst Street and Andy Devine, Eighth Street and the railroad underpass, Sixth Street south of therailroad and the Kingman High South Campus area. Risks of flash flooding and erosion clearlyexist in the Kingman area, particularly in steep slope areas.
THE IMAGE OF KINGMAN, ARIZONA
Kingman’s image has been described in the Kingman General Plan 1990-2010 and Kin manGeneral Plan 2020 with certain environmental and physical qualities which include:
Open Space Feeling: Non-confining, expansive, uncrowded.
Views: Mountains, buttes, unobstructed, sense of place.
Climate: Mild winters, warm summers, seasonal gusting winds
Sky: Bright, clear, blue, cloudless
Sounds: Quiet, tranquil
Development: Low density, compact Downtown, single story.
Heritage: Railroad, mining, ranching, Native American, spirit of thewest.
These elements combine to form Kingman’s own unique image. They have influenced andcontinue to affect Kingman’s development patterns. Integrated planning and foresight can beused to protect and enhance the very qualities that make up Kingman’s identity.
IDENTIFIED MITIGATION MEASURES
There are a number of existing policies and ordinances which may be used to mitigate problemsand enhance air quality, water quality and natural resources associated with development withinthe Kingman General Plan Study Area.
101

AIR AND WATER QUALITY MITIGATION MEASURES
Some policies and ordinances available to the City of Kingman to mitigate damage to air andwater quality include: Providing opportunities for alternative means of transportation beyond theuse of the automobile which causes air pollution. Non-polluting transportation methods includewalking and bicycling, while the use of transit can reduce the number of vehicles on the road,thus reducing the number of potential pollution sources. The City can also use existingordinances and policies to reduce dust pollution from such sources as unpaved roads and parkinglots, construction sites and clear graded areas. Water quality can be maintained by continuing tofrequently monitor well sites and identifying methods to prevent non-point pollution sources.
NATURAL RESOURCE PROTECTION MEASURES
Methods to protect the natural resources as well as provide for the wise development of the areainclude: Enforcement of the City’s Hillside Ordinance which restricts grading in areas of steepslopes which generally have poor soil conditions for development. Continue to implement theKingman Master Drainage Plan which is designed to protect development from flood hazards,erosion, and nuisances. Provide methods to conserve existing resources such as water andenergy. Educate the community concerning environmental issues such as the need to reducesolid waste streams and decrease the problems of littering in the area.
METHODS TO ENHANCE KINGMAN’S IMAGE AND ENVIRONMENT
The positive images of Kingman, as described in the current General Plan, can be threatened bynew development and by the thoughtlessness of those already in the area. There are a number ofmitigation measures available to the City that, when enforced, can help maintain a positive imageof the area as well as enhance the environment. The City’s Public Nuisance and PropertyMaintenance Ordinance and recent Anti-Noise Ordinance are designed to mitigate nuisancessuch as poorly kept property and loud sounds that can interfere with the tranquility andenjoyment of one’s own property. The Outdoor Lighting Code is designed to maintain darknight skies in Kingman through the use of light shielding and banning of certain lightingmethods. Light pollution is the bane of both professional and amateur astronomers and anyoneelse who enjoys viewing the stars at night. Finally, the City’s Underground Utility Ordinance isdesigned to require underground utility connections for new development in order to reduce or atleast not allow new unsightly poles and overhead wires that can obstruct and degrade the naturalmountain views of the area.
102

APPENDIX
KINGMAN AREA TRANSPORTATIONSTUDY EXECUTIVE SUMMARY
103

*

,;i•km 4
.
.
— EXECii]WSU MMRY
-km-‘f.
— Key-Harn— -- and AssociaS Inc.
w

Kingman AreaTransportationStudy Update
ADOT MPD Task Assignment 14-10PGTD 0448
Contract # T08-49-U0001
EXECUTIVE SUMMARY
Prepared by’
Kimley-Hornand Associates, Inc.
In assoc,tion with:Ayres Associates Inc.KDA Creative
Prepared for’ARIZONA DEPARTMENT OF TRANSPORTA TIONCITY OF KINGMANMOHA VE COUNTY
ADOT
p’r 9-3Z-)I
February 2011091374035

— Kimley-Hom— and Associates, Inc.
4OOT
I INTRODUCTIONThe Arizona Department of Transportation (ADOT), in cooperation with the City of Kingman andMohave County, initiated a study to update the 2005 Kingman Area Transportation Study (KATS)utilizing the Planning Assistance for Rural Areas (PARA) program. The purpose of the PARA program isto assist counties, cities, towns, and tribal communities in addressing a broad range of multimodaltransportation planning issues.
The principal purpose of this study is to update the 2005 KATS. The study will result in a plan oftransportation improvements for 5-year (short-range), 10-year (mid-range), and 20-year (long-range)planning horizons. The recommendations are multimodal, considering roadways, non-motorizedtransportation modes (bicycles and pedestrians), and transit components.
This document, the Kingman Area Transportation Study Update Executive Summary, is a companion tothe Kingman Area Transportation Study Update Final Report. It provides a brief summary of current andfuture conditions, transportation needs and issues, recommended improvements, and the implementationplan. More detailed information on each topic can be found in the Final Report.
The study area encompasses the entire City of Kingman (City) plus portions of unincorporated MohaveCounty (County), as shown in Figure 1. This study area is significantly larger than what was included inthe 2005 KATS, having been expanded from 59 square miles to 165 square miles.
2 CURRENT CONDITIONSThis chapter summarizes data obtained on current conditions to help identify current needs anddeficiencies of the existing transportation network.
2.1 Land UsesAn understanding of current land uses is important for modeling travel characteristics. Land useinformation is converted to population and employment data for use in the travel demand model.Typically, population produces trips while employment attracts trips in the travel demand model.
The study area is currently comprised of various land uses, including commercial, industrial, residential,and public land uses. Major traffic generators in the study area include the Kingman Airport andIndustrial Park, Kingman Regional Medical Center, Hualapai Mountain Medical Center, governmentservices and commercial businesses in the downtown area, and the shopping areas along Stockton HillRoad north of Detroit Avenue.
Public lands are also present within the study area. Public land uses/ownership within the study areainclude: City, County, State, and Federal government facilities, the Cerbat Foothills Recreation Area(owned by the Bureau of Land Management and the City), State Trust land (owned by the Arizona StateLand Department, or ASLD), parks, open space, and schools.
The 2010 population estimates for the 2005 KATS study area were obtained from the ArizonaDepartment of Commerce. The population within the expanded portion of the study area was developedby estimating the number of housing units factored by the average household size for the City ofKingman from the 2000 census. The resulting study area population estimate for 2010 is 52,049. Acomparison of 2000 population estimates and 2010 population estimates is provided in Table 1.
091374035 Kingman Area Transportation Study UpdateFebruary 2011 1 Executive Summary

Khnley-Homand Assadates, hic.
091374035Februaxv 2011
Figure 1: StudyArea
Legend
Sea Boundwy
Klngman City Limits
Roadways
Kingman Arcu Transportation Study tJpdtnExecutive Swnrnaxy

and Assacias, Inc.
400T
Table 1. 2000 and 2010 Study Area Population
2000-2010 AnnualPortion of Study Area 2000 Population 2010 Population Growth Rate
Population within the City limits 20,069 31,722 4.68%
Population within the adjacent 14,810 17,875 1.90%unincorporated land
Population within the expanded portionN/A 2,452 N/Aof The study area
Total 34,879 52,049
Sources: 2000 Census, Arizona Department of Commerce
The employment types in the Kingman area include government, medical, manufacturing, and retail.Employment data for 2010 was estimated using a ratio of employment to population of 0.38. This is thesame ratio that was used in the 2005 KATS. The resulting 2010 employment estimate for the study areais 19,779.
2.2 RoadwaysThe existing roadway network in the study area is composed of an interstate highway, a U.S. highway,two state highways, an arterial street system, and collector and local streets. This study focuses on all ofthese categories with the exception of local streets.
2.2.1 Traffic Volumes
Traffic count data was obtained to document the volume of traffic on study area roadways. Daily trafficvolume data from 2008, 2009, and 2010 on selected roadway segments was provided by the City, County,and ADOT and is displayed in Figure 2. Peak period intersection movement volumes were collected at17 locations.
2.2.2 Traffic Levels of Service
Roadway traffic operations are defined and categorized by the amount of delay experienced by an averagedriver. The operations are categorized by a grading system called level of service (LOS), which has aletter designation ranging from A (no delay) to F (severe congestion). These levels are visually depictedin Figure 3.
LOS is generally defmed as follows:
• LOS A represents free flow.• LOS B represents reasonably free flow, but the presence of other users in the traffic stream begins to
be noticeable.• LOS C represents stable flow. The operation of individual users is somewhat affected by interactions
with others in the traffic stream.• LOS D represents high-density but stable flow. The operation of individual users is significantly
affected by interactions with others in the traffic stream.• LOS E represents unstable flow, meaning operating conditions are at or near the capacity level. The
operation of individual users is heavily affected by interactions with others in the traffic stream.• LOS F represents forced or breakdown flow, meaning operating conditions have exceeded the
capacity level. The operation of individual users is severely affected by interactions with others in thetraffic stream.
091374035 Kingman Area Transportation Study UpdateFebruary 2011 3 Executive Summary

‘9 Kisiley-Homr and Associates, fre
091374035Fubruan 2011
MilesNote: Traffic counts are in the thousands (000’s)All counts are 2009 counts unless otherwise noted by the symbols below.“= 2008 Counts*
= 2010 Counts= 2010 Model Estimates
Figure 2: Current Daily Traffic Volume Counts
Legend
Study Area Boundary
Klngman City Limits
Roadways
)Cingman Area Transportation Study UpdateExecutive Stanmajy
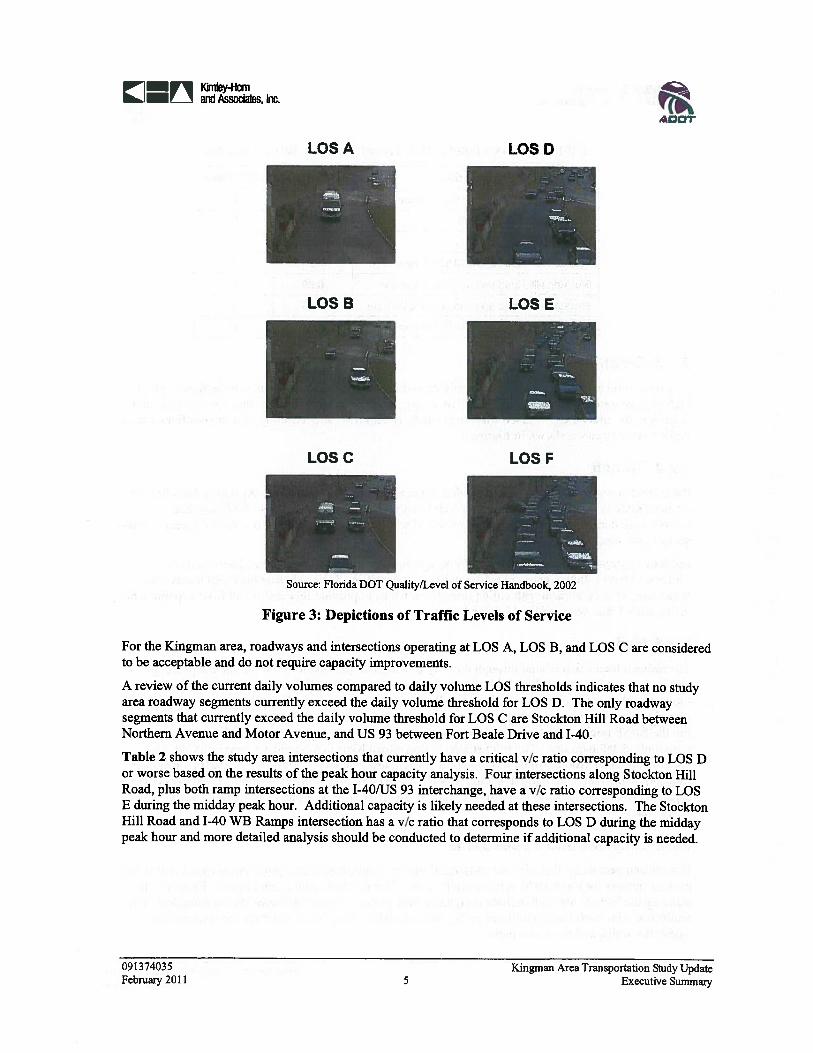
1V’1 Kimy-HcrnJ— and Associas, c.
LOSA
LOSB
LOSC
—
LOSD
LOSF
,ooT
Source: Florida DOT Quality/Level of Service Handbook, 2002
Figure 3: Depictions of Traffic Levels of Service
For the Kingman area, roadways and intersections operating at LOS A, LOS B, and LOS C are consideredto be acceptable and do not require capacity improvements.
A review of the current daily volumes compared to daily volume LOS thresholds indicates that no studyarea roadway segments currently exceed the daily volume threshold for LOS D. The only roadwaysegments that currently exceed the daily volume threshold for LOS C are Stockton Hill Road betweenNorthern Avenue and Motor Avenue, and US 93 between Fort Beale Drive and 1-40.
Table 2 shows the study area intersections that currently have a critical v/c ratio corresponding to LOS Dor worse based on the results of the peak hour capacity analysis. Four intersections along Stockton HillRoad, plus both ramp intersections at the 1-40/US 93 interchange, have a v/c ratio corresponding to LOSE during the midday peak hour. Additional capacity is likely needed at these intersections. The StocktonHill Road and 1-40 WB Ramps intersection has a v/c ratio that corresponds to LOS D during the middaypeak hour and more detailed analysis should be conducted to determine if additional capacity is needed.
LOSE
091374035February 2011
Kingman Area Transportation Study UpdateExecutive Summary5

IIIfl aid Associates, c.Kimley-Hom
400T
Table 2. Intersections with Current Need for Improvements
Intersection VIC Ratio LOS Value
Stockton Hill Road and Airway Avenue 0.96 E
1-40 EB Ramps and US 93 0.92 E
-40 WB Ramps and US 93 0.90 E
Stockton Hill Road and 1-40 EB Ramps 0.90 E
Stockton Hill Road and Sycamore Avenue 0.89 E
Stockton Hill Road and Andy Devine Avenue 0.86 E
Stockton Hill Road and 1-40 WB Ramps 0.83 D
2.2.3 Crash Analysis
A review of recent crash history was completed and the roadway segments and intersections with thehighest crash rates were identified. In the five-year period from 2004 to 2008, there were a total of 4,218crashes in the study area. The ten study area roadway segments and ten study area intersections with thehighest crash rates are shown in Figure 4.
2.2.4 Transit
Public transit services are currently provided in the Kingman area through the Kingman Area RegionalTransit (KART) system. KART operates four fixed routes on an hourly basis. With advancereservations, curb-to-curb service is also provided within %-mile of the fixed routes to the general public,seniors, and disabled persons.
Specialized transit providers operate in the Kingman and Mohave County area. These include theMohave Mental Health Center, which provides transportation services to support client needs, andWestCare, which contracts with child protective services to provide services to and from appointments,visits, school, and work within Mohave County.
2.2.5 Rail
The railroad tracks that extend through the City of Kingman provide for both freight and passengerservices. According to the Federal Railroad Administration (FRA) Office of Safety Analysis, up to 81trains pass through Kingman each day. The Burlington Northem Santa Fe Railway Company (BNSF)provides freight services and Amtrak provides passenger services in Kingman. Both service providersuse the BNSF tracks, which run from Los Angeles to Chicago as part of the BNSF Transcontranscontinental main line. The train station in downtown Kingman provides a stop for Amtrak’s“Southwest Chief’ route, which has one train in each direction daily. In fiscal year 2010, the annualridership at the Kingman Amtrak station was 10,160 persons according to Amtrak. There are six grade-separated roadway crossings and three at-grade roadway crossings of the mainline railroad tracks in thestudy area.
2.2.6 Bicycles and Pedestrians
Bicycle and pedestrian facilities are an integral part of a multimodal transportation network in that theyprovide options for travel (which is especially critical for travelers who cannot drive). Elements thatmake up the bicycle network include designated bike routes, striped bike lanes, paved shoulders alongroadways, wide curb lanes, multi-use paths, and sidewalks. Pedestrian networks are comprised ofsidewalks, trails, and multi-use paths.
091374035 Kingman Area Transportation Study UpdateFebruary 2011 6 Executive Summary

‘1—V Ktnley-Hom..JLJ ant Associss, c.
Figure 4: Roadway Segments and Intersections with fligheat Crash Rates
Legend
Study Area Boundary
Klngman City Limits
Roadways
High Crash Sment
P High Crash Intersection
091374035February 2011
Kiogman Area Transportation Study UpdateExecu4ive Swaunary

400T
2.2.7 Kingman Airport
The Kingman Airport is located five miles north of 1-40 along SR 66 adjacent to the main BNSF railroadtracks. The Kingman Airport encompasses nearly 3,000 acres. Airport facilities include two intersectingrunways (6,831 and 6,725 feet long), two helipads, several taxiways, a 2,640 square foot passengerterminal, 21 hangar facilities, and several parking aprons.
According to the 2006 Kingman Airport Master Plan, the total number of aircraft based at the KingmanAirport is approximately 305. Commercial air service is provided by Great Lakes Airlines, with serviceto Las Vegas, Nevada and Farmington, New Mexico.
The Kingman Airport currently has approximately 55,000 annual aircraft operations. Aircraft operationsconsist of:
• 60% local general aviation• 37% transient general aviation• 2% commercial• l%airtaxi• <1%military
3 FUTURE CONDITIONSThis chapter summarizes the anticipated future conditions for the Kingman area transportation network.The horizon year for this study is 2030.
3.1 Land UsesFuture commercial land uses are expected to be located in the same areas as existing commercial landuses, namely along Stockton Hill Road, Andy Devine Avenue, Bank Street, Armour Avenue, AirwayAvenue, Northern Avenue, and in the downtown area along Beale Street. The area east of Andy DevineAvenue is expected to see significant increases in commercial land use near the proposed KingmanCrossing Boulevard and Rancho Santa Fe Parkway traffic interchanges on 1-40 when the interchanges arebuilt.
Future industrial land uses will follow the same pattern as existing industrial land uses, and occur alongBank Street and Armour Avenue and at the Kingman Airport and Industrial Park.
Residential developments are anticipated to replace vacant land primarily on the northern and easternedges of the City limits. Residential areas closer to the downtown area are anticipated to see increaseddensities over time as infill development and redevelopment occurs.
Most of the public land use/ownership within the study area is anticipated to remain unchanged, exceptthe State Trust lands, which could be sold by ASLD to developers.
3.2 Population and EmploymentThe 2030 population for the study area is estimated to be 77,363. This represents a compound annualgrowth rate of 2.0% compared to the 2010 population. The 2030 population estimate is comprised ofthree components:
• The population within the City limits• The population within the adjacent unincorporated land• The population within the expanded portion of the study area
091374035 Kingman Area Transportation Study UpdateFebruary 2011 8 Executive Summary

Ldates, Inc.
600T
Table 3 compares the 2010 and 2030 population estimates for the three components of the study areapopulation.
Table 3. 2010 and 2030 Study Area Population
2010-2030 AnnualPortion of Study Area 2010 Population 2030 Population Growth Rate
Population within the City limits 31,722 50,872 2.39%
Population within the adjacent 17,87522,911 1.25%unincorporated land
Population within the expanded portion2,452 3,580 1.91%of the study area
Total 34,879 77,363 2.00%
Sources: 2000 Census, Arizona Department of Commerce
Employment data for 2030 was estimated using the same 0.38 ratio of employment to population that wasused to estimate 2010 employment, resulting in an estimated 2030 study area employment total of 29,397.
3.3 Traffic Volume ForecastsA travel demand model was developed for the Kingman area to provide a tool for estimating future trafficvolumes. The model utilizes population and employment data, typical vehicle trip generationcharacteristics, and roadway network information such as number of through lanes and speed limits toestimate traffic volumes on the roadway network. The model estimates traffic volumes by determiningthe number of vehicle trips produced and attracted by the various land uses and assigning those trips tothe adjacent roadway network.
A 2010 baseline year model was developed using the 2010 population and employment data. The 2010volumes generated by the model were compared to the available historical traffic count data and modelparameters were adjusted until the 2010 model volumes were similar to the historical counts. After the2010 conditions model was calibrated, a 2030 horizon year baseline model was developed using the 2030population and employment data. The 2030 volumes generated by the model were reviewed forreasonableness and minor adjustments were made as needed. Figure 5 shows the projected baseline 2030study area traffic volumes.
3.4 Roadway Levels of ServiceFuture roadway needs were identified by comparing the projected baseline 2030 daily traffic volumes todaily volume LOS thresholds to determine which roadways are approaching their maximum capacity.Roadway segments with existing daily volumes below the maximum daily volume threshold for LOS Clikely do not need additional through capacity, while roadway segments with existing daily volumesabove the maximum daily volume threshold for LOS D will probably need additional through capacity.For roadway segments with existing daily volumes between the maximum daily volume thresholds forLOS C and LOS D, more detailed analysis should be conducted to evaluate intersection geometry, signaltiming, and number and spacing of driveways to determine if additional through capacity is needed.
3.5 Public TransitFuture public transit services in the study area are anticipated to be provided by K.ART. There are no“committed” expansion projects for additional KART routes or new public transit facilities such as bus
091374035 Kingman Area Transportation Study UpdateFebmary 2011 9 Executive Summary
.
“oar
bays and commuter park-and-ride lots. In fact, if the recent decline in available public transit fundingcontinues, KART has plans to further reduce service hours.
3,6 RailRailroad traffic is anticipated to increase in the future as population and employment increase in theUnited States. The City has plans to provide several additional grade-separated roadway crossings of theraifroad tracks but funding has not been secured for any of these crossings.
The City has had preliminary discussions about establishing railroad “quiet zones” in accordance withFRA requirements at the three downtown Kingman at-grade crossings. When a quiet zone is established,trains are not permitted to blow their horns within the quiet zone except in emergencies.
There has been discussion and planning at the national level regarding high-speed passenger rail. High-speed rail travel is generally economically competitive with highway and air travel between cities that are100 to 600 miles apart. According to the 2010 Arizona Statewide Rail Framework Study, there is greatpotential to connect the cities of Phoenix and Las Vegas with a high-speed rail corridor, and the likelyroute would pass through the Kingman area.
3.6.1 Bicycles and PedestriansAt the national level, there is emphasis on complying with the Americans with Disabilities Act (ADA)and providing more bicycle and pedestrian facilities along roadways to create “complete streets”.“Complete streets” are designed to function for all users to safely and effectively move along and across a“complete street” (see www.coinpletestreets.org).
Elements of a complete street include sidewalks, bike lanes (or wide paved shoulders), special bus lanes,comfortable and accessible transit stops, frequent crossing opportunities, median islands, accessiblepedestrian signals, curb extensions, and more. A complete street in a rural area may have differentelements, but should achieve the same goal.
3.6.2 Kingman AirportThe 2006 Kingman Airport Master Plan recommends constructing a new terminal building, several newtaxiways, and an extension of Runway 3-21. The master plan also recommends reserving the lands southand east of the airport along the edge of airport property for potential industrial uses.
091374035 Kingman Area Transportation Study UpdateFebruary 2011 10 Executive Summary

FVI Kteiley-Hsm-JL and Associates, Inc.
Figure 5 Projected Baseline 2030 Daily Traffic Volumes
Legend
StudyAxeaBoundaiy
Klngman City Limits
Roadways
091374035Febrocov 2011
Kingman Area Transportalion Study UpdaseExecutive Swarnrwy

V1 Küi*Homr_ id Assocs, hic.
4 IDENTIFIED CURRENT AND FUTURE NEEDSThe identified transportation system needs result from a variety of factors, including roadway congestion,high crash areas, physical barriers such as 1-40 and the railroad, traffic control devices, land developmentand growth projections, gaps in bicycle and pedestrian facilities, and inadequate transit service. As a firststep in determining alternatives and solutions, issue areas and deficiencies were documented.
4.1 Existing and Future Capacity DeficienciesCapacity deficiencies were evaluated for intersections and roadway segments using a LOS C thresholdbased on existing traffic count data and 2030 traffic forecasts. The roadway segments with future LOS Dor worse are shown in Figure 6. In addition to the intersections noted previously in Table 2 with existingLOS D or LOS E, the major intersections within the identified capacity-deficient roadway segments mayneed additional capacity improvements to provide acceptable intersection traffic operations through 2030.Future traffic signals may also be warranted at some of the intersections within the identified capacity-deficient roadway segments.
4.2 SafetyThe ten high-crash rate study area roadway segments intersections identified previously in Figure 4 needto be evaluated to determine if crash patterns can be identified that are susceptible to correction bypotential safety countermeasures.
4.3 AccessThe railroad and 1-40 are transportation corridors that have created physical barriers for othertransportation facilities and restrict access — including emergency access — to various parts of the region.There are a limited number of crossings of these facilities, and in the case of the railroad, some of thecrossings are at-grade crossings. As a result, the choice of travel routes is limited.
4.4 Public Comments/TAC InputComments were solicited from the public during the formal public meetings and from the TAC followingthe analysis of existing and future conditions. The highlights of the comments are summarized below.
• Need safe bicycle facilities along existing roadways• Improve local transit system• Relieve congestion on north-south corridors• Identify right-of-way needs early• Improve business access points on Stockton Hill Road• Relieve congestion on Stockton Hill Road and West Beale (truck stop area)• Provide right-turn lane from West Beale to EB 1-40• There is a lack of facilities and a need for alternative modes• Need access management• Develop strategies to reduce auto trips• Get the residents to pass a City property tax• Securing funding for improvements is critical• Support land use policies that de-emphasize auto use — emphasize system management• Consider roundabouts instead of signals• Need additional interchanges and railroad crossings
091374035 Kingman Area Transportation Study UpdateFebruary 2011 12 Executive Summary

—V Kteey-Homand Associates. Inc.
Figure 6: Baseline 2030 Roadway Segments with LOS I) or LOS E
ooor
091374035Febmare 2011
Legend
I Study Area Boundary
Klngman City Limits
2030 Level of Service (LOS)
LOS C or Better
LOS 0
LOSE or Worse
Kingmae Aeca Transportadon Study UpdateExecutive Summasy13

—V1 Key-Hom..i— r__i and Associas, Inc.
iOOT
4.5 Accessibility and Land DevelopmentGood access and availability of services can provide a direct economic benefit. Currently, the majority ofland north of 1-40 and east of the railroad is vacant. Existing access to and from this area is limited toEastern Street and Airway Avenue. Additional access will increase the development potential of thisarea. Additionally, the Kingman Airport Authority has indicated the need for additional airport access inorder to be able to attract new businesses.
4.6 TransitNew and stable funding sources are needed to replace the recent loss of state funding for public transitoperations and to ensure the long-term viability of KART. Bus pullouts are desired, as are “completestreets” cross-sections that better accommodate transit operations. As population and employment growand sustainable transportation becomes a bigger issue, expansion of KART’s routes and an increase inservice frequency will likely be needed.
4.7 RailMore grade-separated crossings are needed to improve mobility across the railroad tracks. To betterpromote livability and sustainability, particularly in the downtown area, the City should pursue theestablishment of railroad quiet zones.
The City should monitor the development of a high-speed rail line between Phoenix and Las Vegas andpromote the advantages of a stop in Kingman.
4.8 Bicycles and PedestriansAs population and employment grow and sustainable transportation becomes the standard, additionalbicycle and pedestrian facilities such as bike lanes, wide curb lanes, paved shoulders, and sidewalks willbe needed. There is a need for a clearly-defined, continuous bicycle and pedestrian network.
“Complete streets” cross-sections should be developed to better accommodate bicycle and pedestriantravel. Grade-separated crossings of major roadways may be needed at select locations to better promotesafety for bicyclists and pedestrians.
Mohave County is pursuing a Safe Routes to School grant to improve bicycle and pedestrian facilities andtravel near Manzanita Elementary School. Other school sites in the region would benefit from similarSafe Routes to School grants.
49 Kingman AirportTo accommodate anticipated growth in aviation operations, a new terminal building, several newtaxiways, and an extension of Runway 3-21 are needed.
5 IMPROVEMENT PLANThe recommended improvement plan is a multimodal plan that will provide a regional transportationsystem to meet the needs of the region for the next 20 years. The recommended plan is summarized bymode followed by recommendations for implementation.
091374035 Kingman Area Transportation Study UpdateFebruary 2011 14 Executive Summary

— KHomand Associates, Inc.
,oor
5.1 RoadwaysThe following recommended roadway improvements are grouped in categories by type of improvement.Whenever possible, these roadway improvement projects should incorporate “complete streets” conceptsthat accommodate multimodal travel and not just automobiles.
A 2030 travel forecasting model run that incorporates the recommended roadway improvement projectswas prepared. Only one roadway segment — Stockton Hill Road from 1-40 to Airway Avenue — isexpected to operate at LOS D when all the roadway improvements are constructed. All other roadwaysare expected to operate at LOS C or better with the recommended improvements.
5.1.1 Intersection Improvements• Stockton Hill Road and Airway Avenue• Stockton Hill Road and Gordon Drive• Stockton Hill Road/Hualapai Mountain Road and Andy Devine Avenue• Bank Street and Northern Avenue• SR 66/Andy Devine Avenue and Armour Avenue• Andy Devine Avenue and 4th Street
5.1.2 Traffic Signals
Intersections currently controlled by traffic signals should be monitored to ensure that traffic signal timingand phasing is appropriate for traffic conditions at the intersections and revised as needed.
Unsignalized intersections that experience congestion, high crash rates, or major changes in trafficpatterns should be studied to determine if traffic signalization may be warranted.
5.1.3 New/Improved Two-Lane Roadways• Glen Road: Airway Avenue to Gordon Drive (in current City Capital Improvement Program (CIP))• Central Street: Hualapai Mountain Road to Airfield Avenue• Seneca Street: Hualapai Mountain Road to Southern Avenue• Cherokee Street: Cheyenne Avenue to Airfield Avenue• Cheyenne Avenue: Seneca Street to Cherokee Street• Dakota Avenue: Central Street to Cherokee Street• Airfield Avenue: Eastern Avenue to Cherokee Street• Castle Rock Road: Thompson Avenue to Grace Neal Parkway• Prospector Street: Thompson Avenue to Grace Neal Parkway• Western Avenue: Beverly Avenue to Gordon Drive• Anson Smith Road/White Cliffs Road: Stockton Hill Road to 1St Street• Fort Beale Drive: Anson Smith Road to US 93• Southern Avenue: Eastern Street to Rancho Santa Fe Parkway (in current City CIP)• Rancho Santa Fe Parkway: Hualapai Mountain Road to Louise Avenue (in current City CIP)• Rancho Santa Fe Parkway: Airway Avenue to Industrial Boulevard (in current City CIP)• Airway Avenue: Prospector Street to Rancho Santa Fe Parkway• Industrial Boulevard: Rancho Santa Fe Parkway to Mohave Airport Drive• Slaughter House Canyon Road: Mission Boulevard to Topeka Street (in current City CIP)
091374035 Kingman Area Transportation Study UpdateFebruary 2011 15 Executive Summary

— Khey-Hcnii— and Associas, Inc.
5.1.4 Widen to or New Four Lanes• Airway Avenue: Western Avenue to Stockton Hill Road• Rancho Santa Fe Parkway: Louise Avenue to Airway Avenue• Hualapai Mountain Road: Fripps Ranch Road to Seneca Street• Gordon Drive: Stockton Hill Road to Bank Street• Stockton Hill Road: Northern Avenue to Grace Neal Parkway• Airway Avenue: Sage Street to Kingman Crossing Boulevard• Harrison Street/Willow Road: Andy Devine Avenue to Airway Avenue• Eastern Street: Airway Avenue to Hualapai Mountain Road• Kingman Crossing Boulevard: 1-40 to Airway Avenue• Kingman Crossing Boulevard: 1-40 to Airfield Avenue• Kingman Crossing Boulevard: Airfield Avenue to Southern Avenue• Beverly Avenue: Stockton Hill Road to Bank Street• Airway Avenue: Kingrnan Crossing Boulevard to Rancho Santa Fe Parkway• Grace Neal Parkway: Stockton Hill Road to SR 66• Santa Rosa Drive: Kingman Crossing Boulevard to Rancho Santa Fe Parkway
5.1.5 Add Median to Four-Lane Roadway• Stockton Hill Road: Airway Avenue to Gordon Drive• Andy Devine Avenue/SR 66: Detroit Avenue to Airway Avenue
5.1.6 Widen to Six Lanes• Stockton Hill Road: Detroit Avenue to Airway Avenue• Stockton Hill Road: Airway Avenue to Northern Avenue• Stockton Hill Road: Andy Devine Avenue to Detroit Avenue• Andy Devine Avenue/SR 66: 1-40 to Gordon Drive• 1-40: US 93 to Stockton Hill Road• Hualapai Mountain Road: Andy Devine Avenue to Eastern Street
5.1.7 New Connection across 1-40• Fairgrounds Boulevard/Burbank Street
5.1.8 Railroad Crossings/Improvements• Topeka Street (eastbound tracks)• Airfield Avenue• Railroad Quiet Zone
5.1.9 Freeway Interchange Improvements• 1-40/US 93/Beale Street• 1-40 and Stockton Hill Road
5.1.10 New Freeway Interchanges• 1-40 and Rancho Santa Fe Parkway• 1-40 and Kingman Crossing Boulevard
091374035 Kingman Area Transportation Study UpdateFebruary 2011 16 Executive Summary

— Kimley-Hom— and Associas, hic.
,‘oDT
5.2 TransitThe focus of the transit recommendations is to improve the experience of riders and manage systemgrowth in a way that attracts new ridership. Recommended transit improvements include increasedfrequency, enhanced accessibility, rider comfort and protection, and new routes. Improvements can beincremental, then evaluated and adjusted according to their level of success. The following improvementsare recommended for the transit system.
5.2.1 30-Minute HeadwaysImprove the frequency on all existing KART routes to 30-minute headways between buses during thepeak periods
5.2.2 New KART Routes• Seneca Street/Kingman Crossing Boulevard: Hualapai Mountain Road to Airway Avenue• Gordon Drive: Stockton Hill Road to Castle Rock Road• Kino Avenue: Stockton Hill Road to Bank Street• Northern Avenue: Stockton Hill Road to Castle Rock Road• Southern Avenue: Railroad Street to Cherokee Street• Airport employment area
5.2.3 Bus Pull-Outs and Shelters• Provide bus pull-outs and shelters on all routes
5.2.4 New Transit Transfer Center• Identif’ location for a new transit transfer center
5.2.5 Passenger Rail• Be an active participant in the discussion for continued Amtrak service and for a high-speed rail line
between Phoenix and Las Vegas that includes a stop in Kingman
5.3 Non-MotorizedWhile most people use vehicles andlor transit for travel, almost every trip has a walking component. It isalso important to recognize that some portions of the population rely on non-motorized means becausethey cannot or choose not to use vehicles. Most new urban street design and construction projects includefacilities for bicycles and pedestrians. The following design elements should be considered to help create“complete streets”.
• Provide continuous sidewalks and bicycle lanes• Provide comfortable pedestrian and bicycle access to shopping, schools, and other activity centers• Provide pedestrian facilities that meet ADA requirements
Specific non-motorized improvement recommendations include the following.
5.3.1 Add Bicycle and Pedestrian Facilities• Harrison Street/Willow Road: Andy Devine Avenue to Gordon Drive• Airway Avenue: Stockton Hill Road to Andy Devine Avenue• Gordon Drive: Stockton Hill Road to Andy Devine Avenue
091374035 Kingman Area Transportation Study UpdateFebruary 2011 17 Executive Summary

Kimley-Hom— and Assodates, Inc.
.400T
• Beverly Avenue: Willow Road to Bank Street• Bank Street: Beverly Avenue to Northern Avenue• Hualapai Mountain Road: Andy Devine Avenue to Seneca Street• Northern Avenue: Stockton Hill Road to Bank Street• Willow Road: Gordon Drive to Northern Avenue
5.3.2 New Multi-Use Pathway• Eastern Pathway: Hualapai Mountain Road to Airway Avenue (Hualapai Mountain Road to Louise
Avenue is included in the current City CIP)
5.3.3 ADA Improvements• New sidewalk ramps• Provide unobstructed sidewalk• Shorter street crossings using curb “bulb-outs”• ADA-compliant signal equipment
5.3.4 Safe Routes to School• Pursue Safe Routes to School funding for bicycle and pedestrian improvements near schools
5g.5 Traffic Signals• Provide countdown pedestrian signal heads in accordance with the latest version of the Manual on
Uniform Traffic Control Devices (MUTCD)
5.4 Safety• Coordinate with the Western Arizona Council of Governments (WACOG) to identify possible federal
funding sources to address the high-crash locations in the region.
5,5 Functional Classification RevisionsA review of the current functional classification of area roadways indicates that the proportion ofcollector roadways is higher than the FHWA recommendation. The following are recommended changesfrom urban collector classification to urban minor arterial classification. These changes must be reviewedwith WACOG and submitted to ADOT.
• Airway Avenue: Western Avenue to Rancho Santa Fe Parkway• Gordon Drive: Stockton Hill Road to SR 66/Andy Devine Avenue• Northern Avenue: Stockton Hill Road to Castle Rock Road• Harrison Street/Willow Road: Andy Devine Avenue to Airway Avenue• Bank Street: Airway Avenue to Northern Avenue• Hualapai Mountain Road: Andy Devine Avenue to Seneca Street
6 IMPLEMENTATIONAn implementation plan was developed to prioritize the recommended improvement projects into short-range (2011-2015), mid-range (2016-2020), and long-range (2021-2030) timeframes. Specificimprovements recommended in each implementation timeframe are listed in Table 4 by mode. The costestimate in 2011 dollars is $26.6 million for the short-range timeframe, $141.4 million for the mid-rangetimeframe, and $221.5 million for the long-range timeframe, for a total plan cost of $3 89.5 million.
091374035 Kingman Area Transportation Study UpdateFebruary 2011 18 Executive Summary

.
,ooT
The actual order of implementation will be based on a variety of factors, including funding availability,development activity, traffic patterns, and private participation. The need for improvements should be reevaluated each year as part of the various implementing agencies’ budget processes or as needed ifconditions and travel patterns change significantly.
The overall transportation improvement plan, combining the short-range, mid-range, and long-rangerecommended improvements, is presented in Figure 7.
6.1 RevenueDue to the recent economic conditions, the traditional transportation revenue sources have been reducedor temporarily eliminated. Highway User Revenue Fund (I{URF) and general fund revenue have beenreduced as a result of lower sales tax collection and reduced mileage. The State legislature has stoppeddistribution of the Local Transportation Assistance Fund (LTAF) to cities. Federal funding is stillavailable, but Kingman typically must compete with other agencies to obtain it. Developer contributions(e.g., to dedicate roadway right-of-way and construct the half-street improvements) are expected tocontinue as new development occurs.
Because projected revenues are significantly less than the estimated costs of the recommendedimprovements, the City, the County, and ADOT will need to secure additional revenue sources if therecommended improvements are to be constructed within the recommended timeframes.
6.2 Title W ImpactsThe U.S. Department of Transportation regulations related to disadvantaged, or Title VI, populations (i.e.,minority, low-income, elderly) state that in determining the site or location of transportation facilities,selection cannot be made with the purpose or effect of excluding persons from, denying them the benefitsof, or subjecting them to discrimination under any program to which this regulation applies. According tothe regulations, a project cannot be implemented that will cause disproportionately high and adverseimpacts to disadvantaged populations.
The Kingman Area Transportation Study Update provides a long-range multi-modal plan to improve theoverall transportation system of the region and benefit the region as a whole. Recommendedimprovement projects were not selected based on the population that would be impacted, but rather wereselected to address an identified transportation need. More detailed analysis will be needed for individualprojects that are federally-funded to ensure that there are no disproportionately high and adverse impactsto disadvantaged populations.
091374035 Kingman Area Transportation Study UpdateFebruary 2011 19 Executive Summary

Krney-Homand Associates, Inc.
Table 4: Implementation Plan
Cost (thousand $)Short Mid Long
Project Location Improvement Descnption Range Range RangeShort-Range Roadway Improvements
Airfield Avenue Design Concept Report for railroad grade separation 500
Airway Avenue: Western Avenue to Stockton Hill Road Widen to four lanes 1,000
Andy Devine Avenue & 4th Street Safety improvements 250
Andy Devine Avenue/SR 66: Detroit Avenue to Airway Avenue Raised median 250
Downtown at-grade railroad crossings Quiet zone improvements and establishment 350
Glen Road: Airway Avenue to Gordon Drive New two-lane collector 2,000
Gordon Drive: Stockton Hill Road to Bank Street Widen to four lanes 6,000
1-40/US 93 TI Design Concept and Environmental Study for system TI 500
SR 66/Andy Devine Avenue & Armour Avenue Safety improvements 250
Stockton Hill Road: Andy Devine Avenue to Northern Avenue Design Concept Report 500
Stockton Hill Road & Airway Avenue Intersection widening/safety improvements 2,500
Stockton Hill Road & Gordon Drive Intersection widening/safety improvements 2,500
Stockton Hill Road/Hualapai Mountain Road & Andy Devine Avenue Intersection widening/safety improvements 2,500
Stockton Hill Road: Airway Avenue to Gordon Drive Raised median 250
Topeka Street Design Concept Report for railroad grade separation 500
Western Avenue: Beverly Avenue to Gordon Drive Improved two-lane collector 3,000
Short-Range Transit Improvements
KART blue route Provide 30-minute headways during peak periods 500*
KART blue route Add bus pull-outs and shelters 1,000
Short-Range Non-Motonzed Improvements
Airway Avenue: Stockton Hill Road to Andy Devine Avenue Add bike facilities 500
Beverly Avenue: Harrison Street to Bank Street Add bike and pedestrian facilities 250
Downtown sidewalks ADA-related improvements 1,000
Eastern Pathway: Hualapai Mountain Road to Louise Avenue Multi-use path 200
Harrison Street/Willow Road: Andy Devine Avenue to Gordon Drive Add bike and pedestrian facilities 625
Safe routes to school Various locations 150
Subtotal_Short-Range_Improvements_Cost* $26,575
091374035 Kingtnan Area Transportation Study UpdateFebruary 2011 20 Executive Summary

fl arid Associates, Inc.
Cost (thousandShort Mid Long
Project Location Improvement Description Range Range RangeMid-Range Roadway Improvements
Airfield Avenue: Seneca Street to Kingman Crossing Boulevard New two-lane collector 1,000Airfield Avenue Railroad grade separation 10,000Airway Avenue: Prospector Street to Rancho Santa Fe Parkway New two-lane collector 2,000Airway Avenue: Sage Street to Kingman Crossing Boulevard Widen to four lanes 2,000Central Street: Hualapai Mountain Road to Airfield Avenue New/improved two-lane collector 4,000Fairgrounds Boulevard at 1-40 Design Concept Report for grade separation 500Harrison Street/Willow Road: Andy Devine Avenue to Airway Widen to four lanes 10 000AvenueHualapai Mountain Road: Fripps Ranch Road to Seneca Street Widen to four lanes 4,400
Hualapai Mountain Road: Andy Devine Avenue to Eastern Street Design Concept Report 250
1-40: US 93 to Stockton Hill Road Design Concept Report 500
1-40/Stockton Hill Road TI improvements Design Concept Report 500
1-40/US 93 TI Construct interim improvements 10,000
I—40/Kingman Crossing Boulevard TI Construct new interchange 25,000
1-40/Rancho Santa Fe Parkway TI Construct new interchange 25,000
Industrial Boulevard: Rancho Santa Fe Parkway to Mohave Airport Improved two-lane collector 3,000DriveKingman Crossing Boulevard: 1-40 to Airway Avenue New four-lane arterial 3,000
Kingman Crossing Boulevard: 1-40 to Airfield Avenue New four-lane arterial 800
Rancho Santa Fe Parkway: Hualapai Mountain Road to Louise New two-lane collector 5,000AvenueRancho Santa Fe Parkway: Airway Avenue to Industrial Boulevard New two-lane collector 5,000
Rancho Santa Fe Parkway: Louise Avenue to Airway Avenue New four-lane arterial 6,000
Southern Avenue: Eastern Street to Rancho Santa Fe Parkway New two-lane collector 6,000
SR 66/Andy Devine Avenue: 1-40 to Gordon Drive Design Concept Report 500
Stockton Hill Road: Detroit Avenue to Airway Avenue Widen to six lanes 3,500
Topeka Street Railroad grade separation 10,000
091374035 Kingman Area Transportation Study UpdateFebruary 2011 21 Executive Summaiy
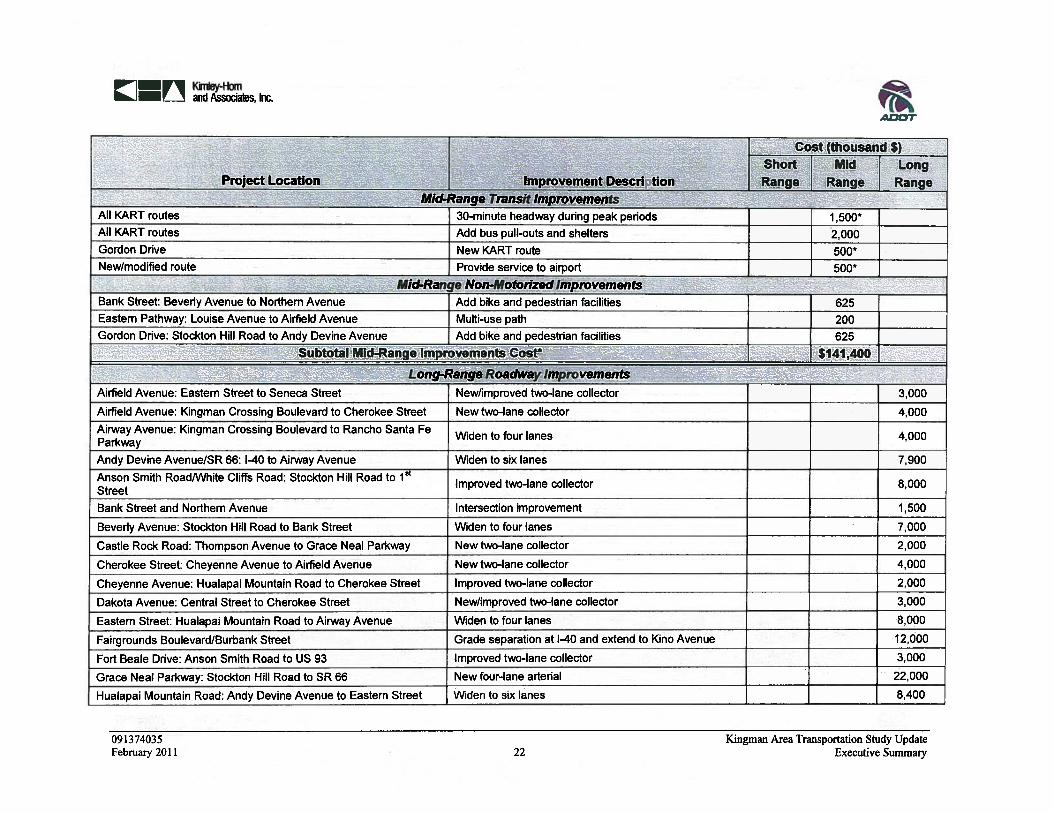
Key-Homand Associates, Inc.
AOOT
Cost (thousand $)Short Mid Long
Project Location Improvement Description Range Range RangeMid-Range Transit Improvements
All KART routes 30-minute headway during peak periods 1,500*
All KART routes Add bus pull-outs and shelters 2,000Gordon Drive New KART route 500*
New/modified route Provide service to airport 500*
Mid-Range Non-Motorized Improvements -
Bank Street: Beverly Avenue to Northern Avenue Add bike and pedestrian facilities 625Eastern Pathway: Louise Avenue to Airfield Avenue Multi-use path 200Gordon Drive: Stockton Hill Road to Andy Devine Avenue Add bike and pedestrian facilities 625
Subtotal Mid-Range Improvements Cosr $141,400
Long-Range Roadway Improvements
Airfield Avenue: Eastern Street to Seneca Street New/improved two-lane collector 3,000
Airfield Avenue: Kingman Crossing Boulevard to Cherokee Street New two-lane collector 4,000
Airway Avenue: Kingman Crossing Boulevard to Rancho Santa FeParkway
Widen to four lanes 4,000
Andy Devine Avenue/SR 66: 1-40 to Airway Avenue Widen to six lanes 7,900
Anson Smith Road/White Cliffs Road: Stockton Hill Road to 1*1Improved two-lane collector 8,000
Street
Bank Street and Northern Avenue Intersection improvement 1,500
Beverly Avenue: Stockton Hill Road to Bank Street Widen to four lanes 7,000
Castle Rock Road: Thompson Avenue to Grace Neal Parkway New two-lane collector 2,000
Cherokee Street: Cheyenne Avenue to Airfield Avenue New two-lane collector 4,000
Cheyenne Avenue: Hualapai Mountain Road to Cherokee Street Improved two-lane collector 2,000
Dakota Avenue: Central Street to Cherokee Street New/improved two-lane collector 3,000
Eastern Street: Hualapal Mountain Road to Airway Avenue Widen to four lanes 8,000
Fairgrounds Boulevard/Burbank Street Grade separation at 1-40 and extend to Kino Avenue 12,000
Fort Beale Drive: Anson Smith Road to US 93 Improved two-lane collector 3,000
Grace Neal Parkway: Stockton Hill Road to SR 66 New four-lane arterial 22,000
Hualapai Mountain Road: Andy Devine Avenue to Eastern Street Widen to six lanes 8,400
091374035 Kingrnan Area Transportation Study UpdateFebruary 2011 22 Executive Summary

Kimley-Ilomarid Associates, Inc.
Cost (thousand $)Short Mid Long
Project Location Improvement Description Range Range RangeLong-Range Roadway Improvements
1-40/Stockton Hill Road TI Reconstruct TI/safety improvements 20,000
1-40: US 93 to Stockton Hill Road Widen to six lanes 12,000
1-40/US 93 TI Construct system interchange improvements 50,000
Kingman Crossing Boulevard: Airfield Avenue to Southern Avenue New four-lane arterial 3,200
Prospector Street: Thompson Avenue to Grace Neal Parkway New two-lane collector 2,000
Santa Rosa Drive: Kingman Crossing Boulevard to Rancho SantaFe Parkwa New four-lane arterial 6,000
Seneca Street: Hualapai Mountain Road to Southern Avenue Improved two-lane collector 2,500
SR 66/Andy Devine Avenue: Airway Avenue to Gordon Drive Widen to six lanes 4,250
Stockton Hill Road: Northern Avenue to Jagerson Avenue Widen to four lanes 6,000
Stockton Hill Road: Airway Avenue to Northern Avenue Widen to six lanes 7,000
Stockton Hill Road: Andy Devine Avenue to Detroit Avenue Widen to six lanes 4,400
Long-Range Transit Improvements
All KART routes Add bus pull-outs and shelters 2,000
Kino Avenue New KART route 500*
Northern Avenue New KART route 500*
Seneca StreetlKingman Crossing Boulevard New KART route 500*
Southern Avenue New KART route 500*
Transit transfer center New facility 1,000
Long-Range Non-Motorized Improvements
Eastern Pathway: Airfield Avenue to Airway Avenue Multi-use path 200
Hualapai Mountain Road: Andy Devine Avenue to Seneca Street Add bike and pedestrian facilities 500
Northern Avenue: Stockton Hill Road to Bank Street Add bike and pedestrian facilities 375
Willow Road: Gordon Drive to Northern Avenue Add bike and pedestrian facilities 250
Subtotal_Long-Range_Improvements_Cost* $221,475
Total Plan Cosr $389,450*annual operating cost, not included in the total plan cost
091374035 Kingman Area Transportation Study UpdateFebruary 2011 23 Executive Summary

V1 Kimby-Homand Associatru, Inc.
Additional Projects — Short RangeStudies
__________________________________________
DesIgn Concept ReportAirtield Avenue railroad grade separationTopeka Street railroad grade separation-405)993 TI
Stecidan Hit Roadi Andy Devise Avenue to Nottlrero Avenue- Odd zone improvements at downtown railroad crossingsTransit
Provide 30-monte frequency durIng peak perIodst<ART blue route
-Add bus pail-nuts and staegers(ART blue route
Non-Motorized- Add bike facitnies
AfrwayAonrrue: Stockton Hit Road to Andy Devkre Avenue-Add b9ce and pedestrian fadlbes
Beverly Avenue: Harrison Street to Bank StreetHarrioun StreClNvdiow Road: Andy Device Avenue In Gordon Drloe
-ADA-relaldd improvementsDowntown sidewalks
-Mutboen pathEaslern Pathway: t-tuatapal Mountain Road to Louise Avenue
- Safe Routes to schoolnkrivuv Iscatiune
AdditIonal Projects — Mid RangeStudies- Deulgo Cuvcept Report
Foirgroooda Bouleuard grade separation at 1-40Hualapal Mountain Road: Andy Device Avenue to Eastern Streel-40: US 93 to Stocbtos HIt Road1-40/Stockton Hilt Road TI ImprovementsSR ltd/Andy DevIse Avenue: 1-40 to Gordon Drive
TOenail- Provide 30-minute frequency during peak periods
At <ART rotrteo-Add bus pblt.ordn and uhetern
Alt t<ARTrorrten- New KART route
Gordon DriveSeroice to airport
Nov-Motorized- Add bike nod pedeotriao tauttitirn
Bunk Street: Beverly Avenue to Northern AvenueGordon Drive: Stockton NIl Road to Andy Devise Avenue
- MIlE-use pathEastern Pathway: Louloe Anenue toAinlteid Avenue
Additional Projecro — Long RangeTransit-Add ban pull-nuts and shelters
All <ART routes-New KARTroute
KIss AvenueNorthern AvenueSeoesa Street!tongrnarl Crooning BoulevardSouthern Avenue
- Hew tranoit tronofer centerNov-Motor/zed-Add hike and pedestrian tocilities
Huotapai Mountain Rand: Andy Devlne Avenue to Seneca StreetNorthern Avenue: Stockton i-ill Road to Bunk StreetViMow Road: Garden DrIve to Northern Avenue
- Multi-hoe pathEastern Pathway: Alrtletd Avenue to Airway Avenue
Figure 7: Improvement Plan
091374035 Kingmun Area Transportaliou Study Update
February 2011 Execotivr Summary
Legend
Study Area Boundary
Kingman City Limits
• — Short-range Roadway Projects
• — Mid-range Roadway Prolects
• — Long-range Roadway Projects
Roadways
24