Embed Size (px)
Citation preview

8/10/2019 MBA 253 Sensitivity and Scenario Analysis 2012-13
http://slidepdf.com/reader/full/mba-253-sensitivity-and-scenario-analysis-2012-13 1/25
Sensitivity and Scenario
Analysis
8/10/2019 MBA 253 Sensitivity and Scenario Analysis 2012-13
http://slidepdf.com/reader/full/mba-253-sensitivity-and-scenario-analysis-2012-13 2/25
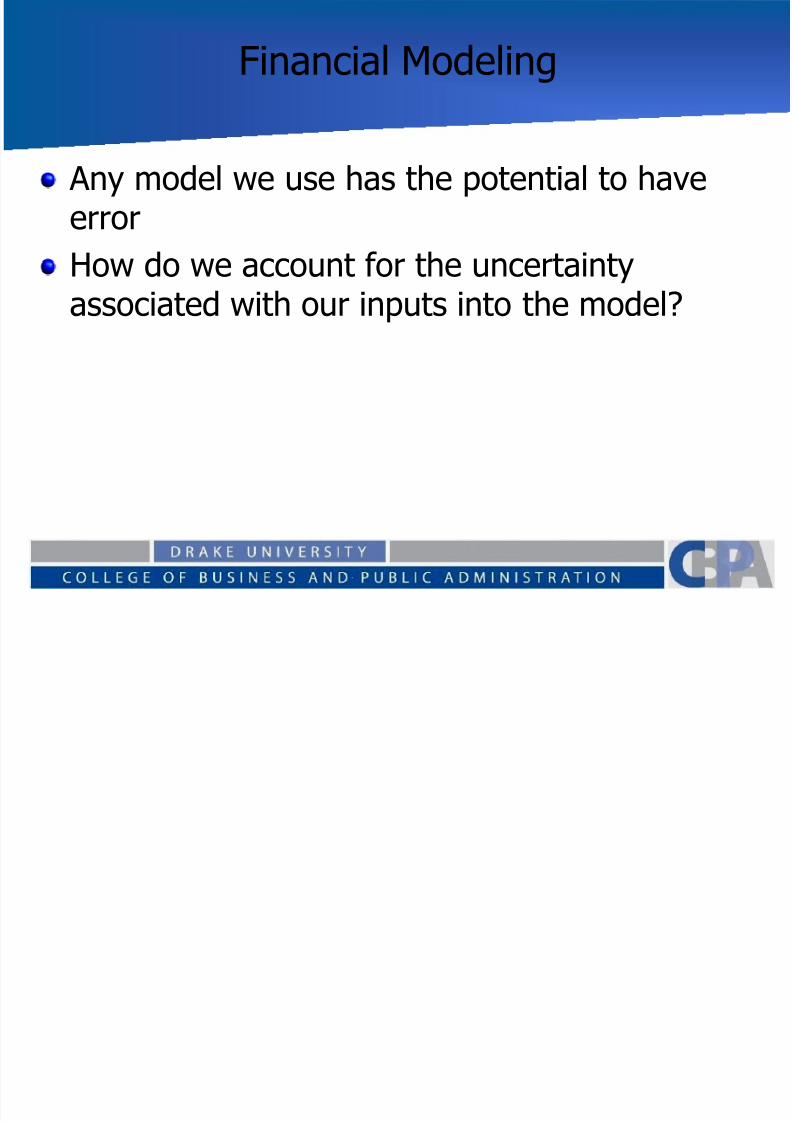
Financial Modeling
Any model we use has the potential to haveerror
How do we account for the uncertaintyassociated with our inputs into the model?
8/10/2019 MBA 253 Sensitivity and Scenario Analysis 2012-13
http://slidepdf.com/reader/full/mba-253-sensitivity-and-scenario-analysis-2012-13 3/25
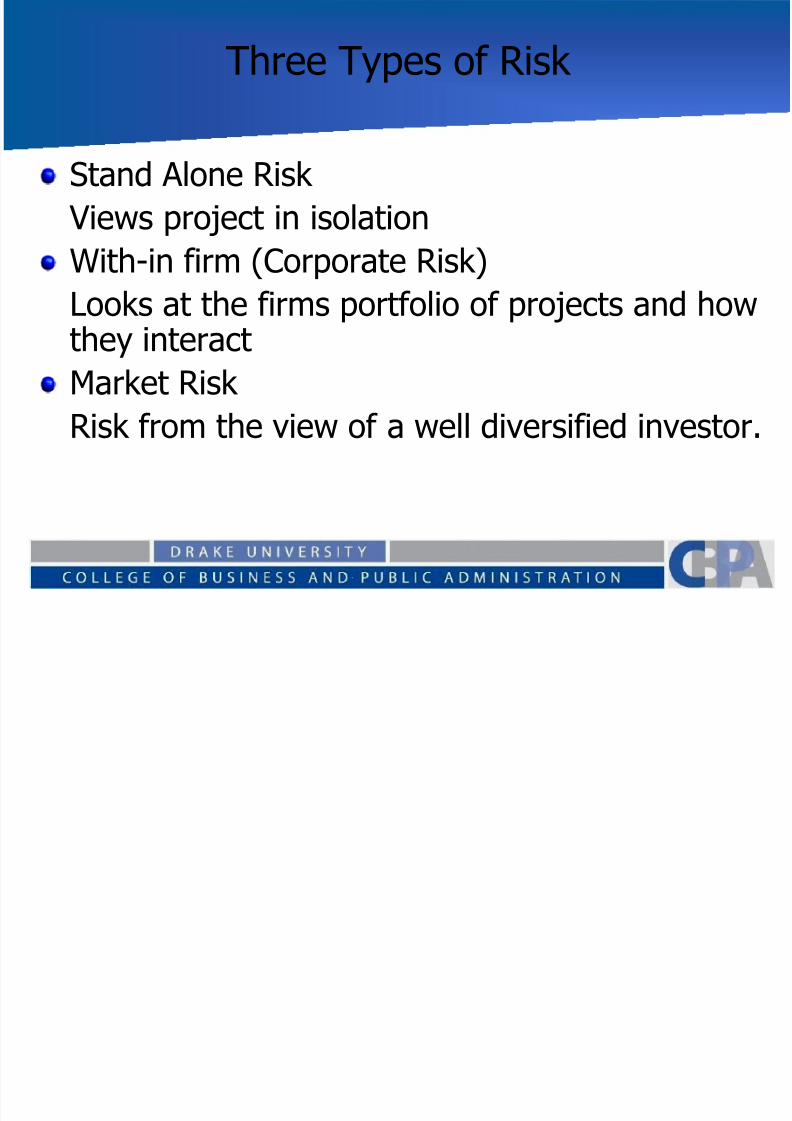
Three Types of Risk
Stand Alone Risk
Views project in isolation
With-in firm (Corporate Risk)Looks at the firms portfolio of projects and howthey interact
Market Risk
Risk from the view of a well diversified investor.
8/10/2019 MBA 253 Sensitivity and Scenario Analysis 2012-13
http://slidepdf.com/reader/full/mba-253-sensitivity-and-scenario-analysis-2012-13 4/25
Definitions
Risk
Exposure to a chance of injury or loss
ProbabilityThe likelihood an event occurs
Risk vs. Uncertainty
Risk – the probability of the outcome is known
Uncertainty – includes judgment concerning theprobability
8/10/2019 MBA 253 Sensitivity and Scenario Analysis 2012-13
http://slidepdf.com/reader/full/mba-253-sensitivity-and-scenario-analysis-2012-13 5/25
Definitions and Terms Continued
Objective Prob –can measure prob. precisely
Subjective Prob. – Includes judgment or
opinion Variation Risk – We want to look at a rangeof possible outcomes

8/10/2019 MBA 253 Sensitivity and Scenario Analysis 2012-13
http://slidepdf.com/reader/full/mba-253-sensitivity-and-scenario-analysis-2012-13 6/25
Issues in Risk Measurement
1. Stand Alone Risk is the easiest to measure
2. Market Risk is the most important to the shareholder
3. To evaluate risk you need three things
i. Standard deviation of the projects forecastedreturns
ii. Correlation of the projects forecasted returns withthe firms other assets
iii. Correlation of the projects forecasted returns withthe market

8/10/2019 MBA 253 Sensitivity and Scenario Analysis 2012-13
http://slidepdf.com/reader/full/mba-253-sensitivity-and-scenario-analysis-2012-13 7/25
Issues in Risk Management con’t
4. Using the numbers in 3) you can find the corporatebeta and market beta coefficient (equal to ((s/s)r)
5. Most projects have a + correlation with otherprojects and a coefficient < 1
6. Most projects are positively correlated with themarket with coefficient < 1
7. Corporate risk should also be examined1. More important to small business
2. Investors may look at things other than market risk
3. Firm Stability is important to creditors, suppliers etc
8/10/2019 MBA 253 Sensitivity and Scenario Analysis 2012-13
http://slidepdf.com/reader/full/mba-253-sensitivity-and-scenario-analysis-2012-13 8/25
Stand Alone Risk (Review)
The easiest approach to measuring stand alonerisk is to use the standard deviation of theprojects returns.
Just like security analysis you need to be carefullooking at only standard deviation – don’t forgetcoefficient of variation
8/10/2019 MBA 253 Sensitivity and Scenario Analysis 2012-13
http://slidepdf.com/reader/full/mba-253-sensitivity-and-scenario-analysis-2012-13 9/25
Measuring Stand Alone Risk
Sensitivity Analysis
Scenario Analysis
Monte Carlo Simulation

8/10/2019 MBA 253 Sensitivity and Scenario Analysis 2012-13
http://slidepdf.com/reader/full/mba-253-sensitivity-and-scenario-analysis-2012-13 10/25
Sensitivity Analysis
Looks at the change in your decision variablewhen one input changes.
Examples:what happens to the value of a project if salesare 10% higher than expected.
What happens to the cost of capital if the riskfree rate increases.
8/10/2019 MBA 253 Sensitivity and Scenario Analysis 2012-13
http://slidepdf.com/reader/full/mba-253-sensitivity-and-scenario-analysis-2012-13 11/25
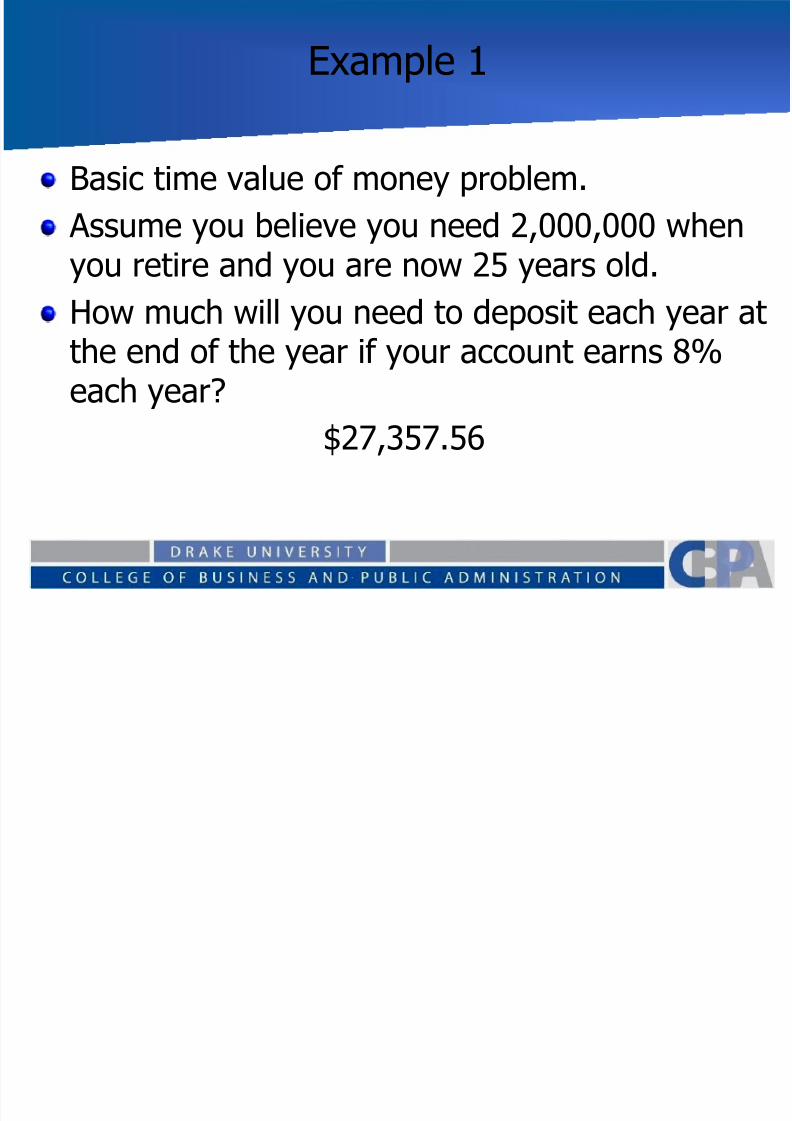
Example 1
Basic time value of money problem.
Assume you believe you need 2,000,000 when
you retire and you are now 25 years old.How much will you need to deposit each year atthe end of the year if your account earns 8%each year?
$27,357.56

8/10/2019 MBA 253 Sensitivity and Scenario Analysis 2012-13
http://slidepdf.com/reader/full/mba-253-sensitivity-and-scenario-analysis-2012-13 12/25
Example 1 Change ONLYExpected return
What if your estimated rate of return is of by 10% of thebase (What if your account earns 8.8% each year?Or 7.2% each year)?
Rate Payment
7.2% $24,322.44
8% $27,357.56
8.8% $30,724.44
8/10/2019 MBA 253 Sensitivity and Scenario Analysis 2012-13
http://slidepdf.com/reader/full/mba-253-sensitivity-and-scenario-analysis-2012-13 13/25
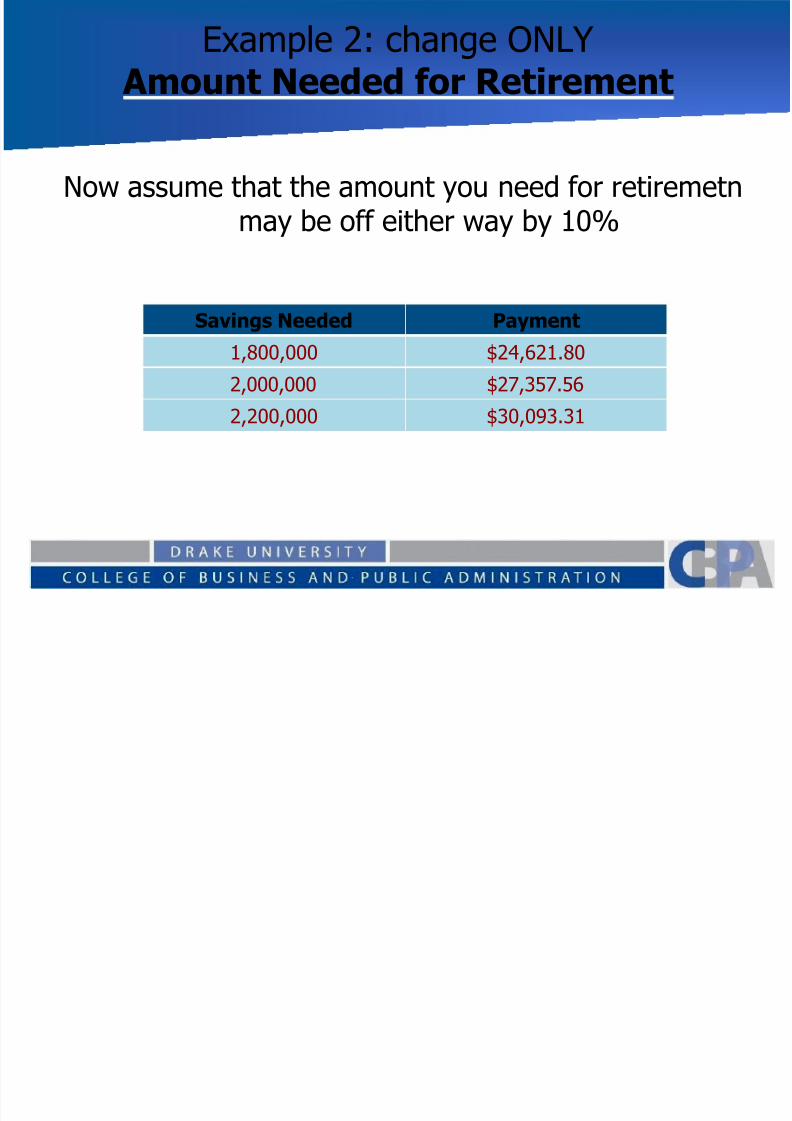
Example 2: change ONLY Amount Needed for Retirement
Now assume that the amount you need for retiremetnmay be off either way by 10%
Savings Needed Payment
1,800,000 $24,621.80
2,000,000 $27,357.56
2,200,000 $30,093.31
8/10/2019 MBA 253 Sensitivity and Scenario Analysis 2012-13
http://slidepdf.com/reader/full/mba-253-sensitivity-and-scenario-analysis-2012-13 14/25
Sensitivity Analysis
Usually the results are represented in a tablewhere the response of the decision variable tochanges in more than one individual variableare reported.
Then you can compare across variables to seewhich one has the largest impact on your
decision
8/10/2019 MBA 253 Sensitivity and Scenario Analysis 2012-13
http://slidepdf.com/reader/full/mba-253-sensitivity-and-scenario-analysis-2012-13 15/25
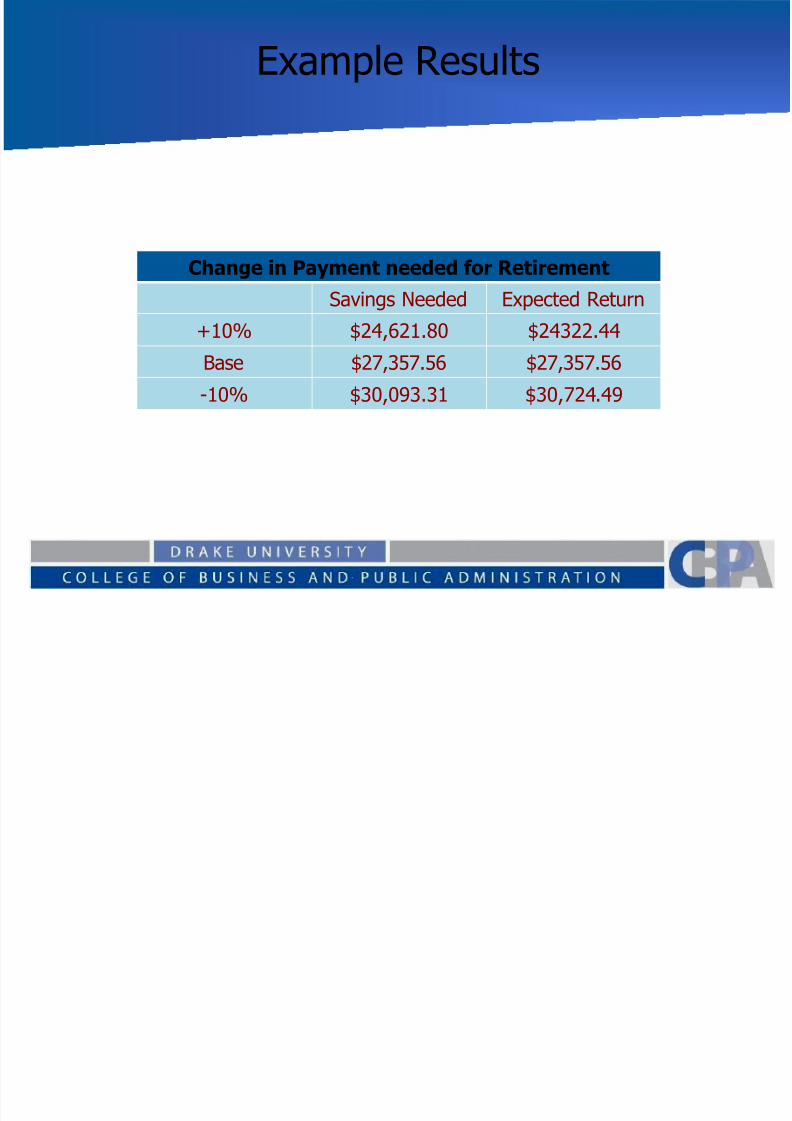
Example Results
Change in Payment needed for RetirementSavings Needed Expected Return
+10% $24,621.80 $24322.44
Base $27,357.56 $27,357.56
-10% $30,093.31 $30,724.49
8/10/2019 MBA 253 Sensitivity and Scenario Analysis 2012-13
http://slidepdf.com/reader/full/mba-253-sensitivity-and-scenario-analysis-2012-13 16/25
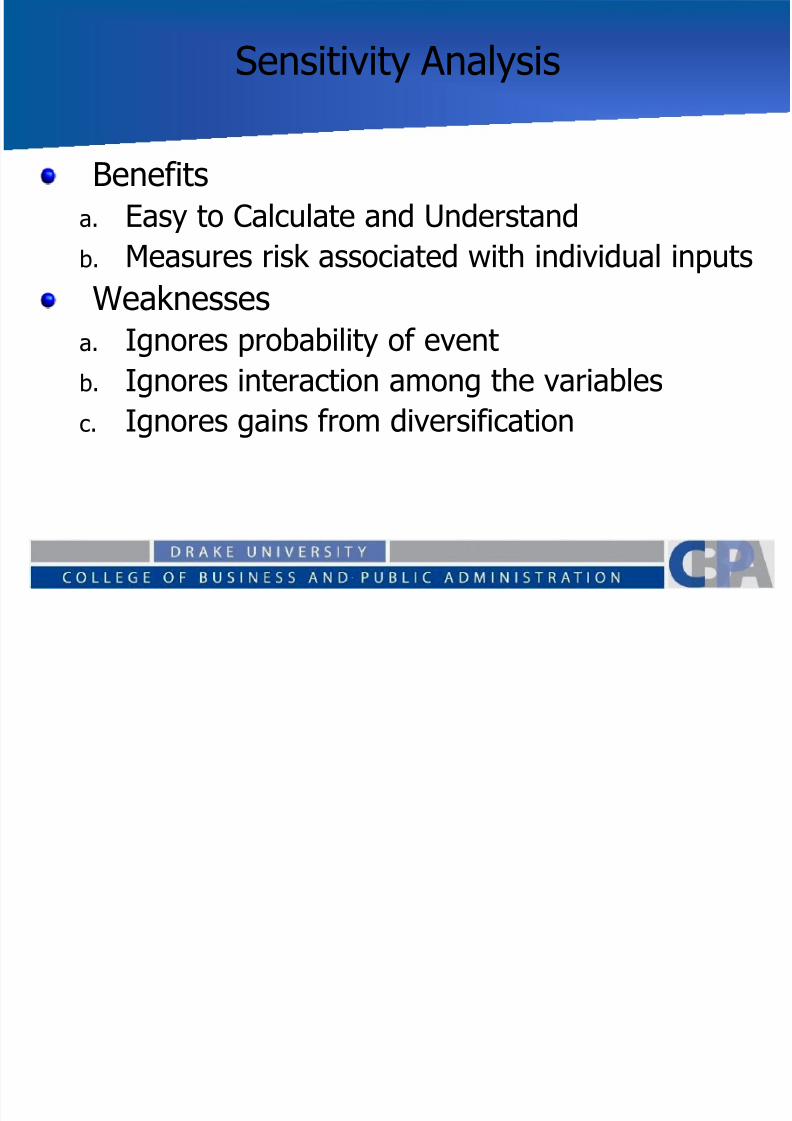
Sensitivity Analysis
Benefits
a. Easy to Calculate and Understand
b. Measures risk associated with individual inputs
Weaknesses
a. Ignores probability of event
b. Ignores interaction among the variables
c. Ignores gains from diversification

8/10/2019 MBA 253 Sensitivity and Scenario Analysis 2012-13
http://slidepdf.com/reader/full/mba-253-sensitivity-and-scenario-analysis-2012-13 17/25
Scenario Analysis
Differences from Sensitivity Analysis
Allows you to change more than one variable ata time
Look at a group of scenarios (best case, basecase, and worst case) for example worst case – what if all variables change against us by 20%….
Includes probability estimates of each scenario
8/10/2019 MBA 253 Sensitivity and Scenario Analysis 2012-13
http://slidepdf.com/reader/full/mba-253-sensitivity-and-scenario-analysis-2012-13 18/25
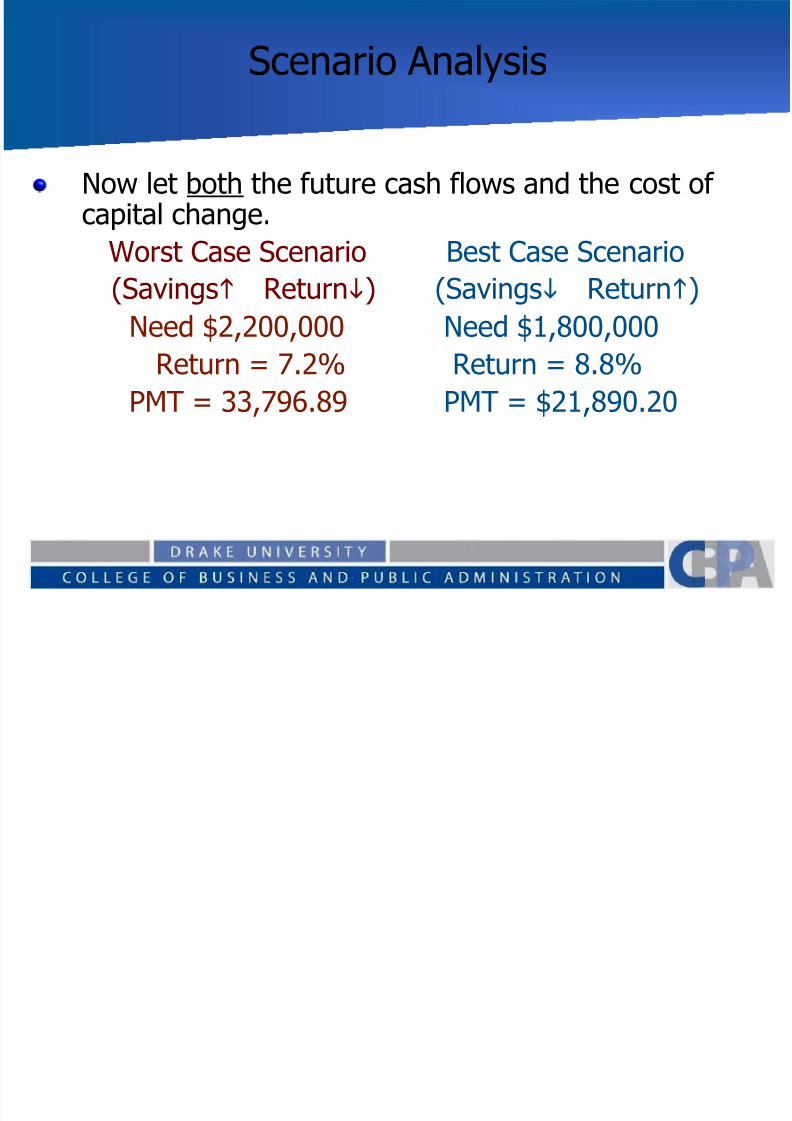
Scenario Analysis
Now let both the future cash flows and the cost ofcapital change.
Worst Case Scenario Best Case Scenario
(Savingsh Returni) (Savingsi Returnh)
Need $2,200,000 Need $1,800,000
Return = 7.2% Return = 8.8%
PMT = 33,796.89 PMT = $21,890.20

8/10/2019 MBA 253 Sensitivity and Scenario Analysis 2012-13
http://slidepdf.com/reader/full/mba-253-sensitivity-and-scenario-analysis-2012-13 19/25
Scenario Analysis
Given the NPV and Probability you can findthe expected NPV and standard deviation
Scenario NPV Prob. NPV(Prob)Worst $33,796.89 .33 $11,265.63
Base $27357.56 .33 $ 9,119.17
Best $21,890.20 .33 $ 7,296.73Expected NPV $27,681.55
Standard Deviation $ 5,959.95

8/10/2019 MBA 253 Sensitivity and Scenario Analysis 2012-13
http://slidepdf.com/reader/full/mba-253-sensitivity-and-scenario-analysis-2012-13 20/25
Interpreting the Results
The project has an expected return on4204.94 with standard deviation of 741.38
This implies a 68 % confidence interval of(3463.56 to 4946.32) a large range ofpossible outcomes
The coefficient of variation would be .1763
(you are accepting .1763 units of risk foreach unit of return)
8/10/2019 MBA 253 Sensitivity and Scenario Analysis 2012-13
http://slidepdf.com/reader/full/mba-253-sensitivity-and-scenario-analysis-2012-13 21/25
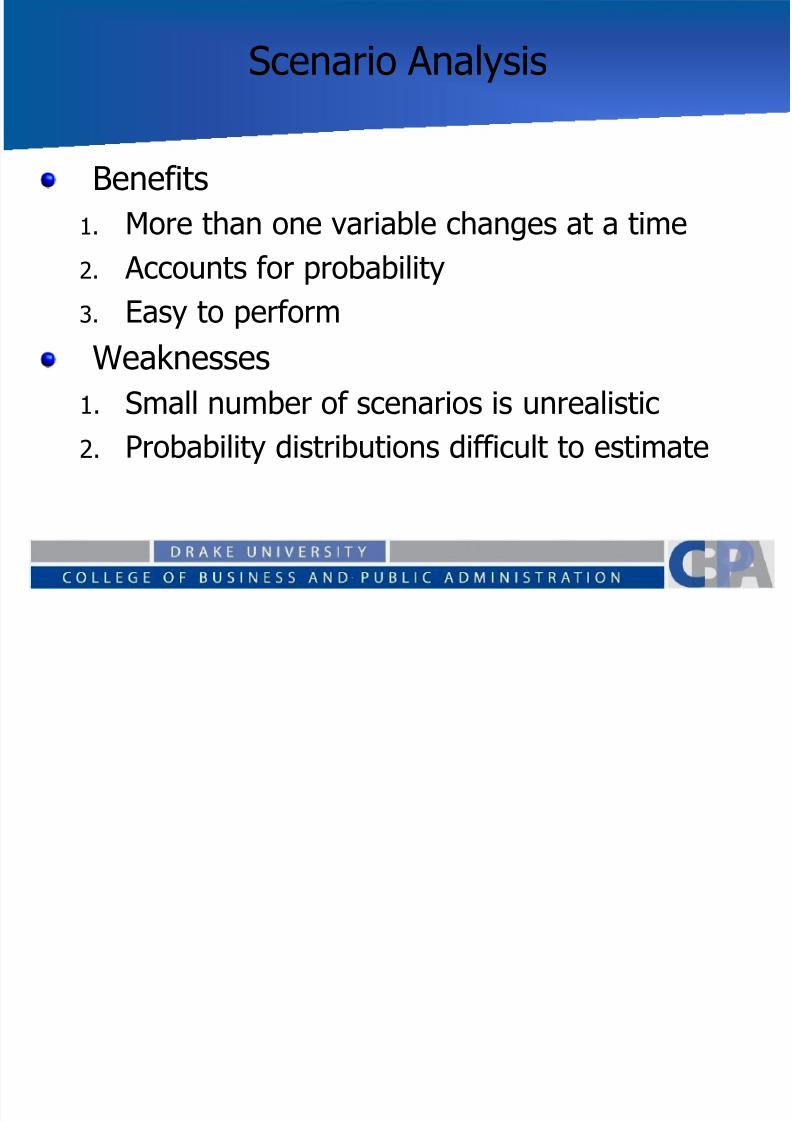
Scenario Analysis
Benefits
1. More than one variable changes at a time
2. Accounts for probability3. Easy to perform
Weaknesses
1. Small number of scenarios is unrealistic2. Probability distributions difficult to estimate

8/10/2019 MBA 253 Sensitivity and Scenario Analysis 2012-13
http://slidepdf.com/reader/full/mba-253-sensitivity-and-scenario-analysis-2012-13 22/25
Monte Carlo Simulation
A more advanced form of scenario analysis
Utilizes the computer to make random choices
for each variable input then calculate theexpected return and standard deviation

8/10/2019 MBA 253 Sensitivity and Scenario Analysis 2012-13
http://slidepdf.com/reader/full/mba-253-sensitivity-and-scenario-analysis-2012-13 23/25
Mont Carlo Simulation
1. Construct a model of the firms cash flows andNPV’s
2. Specify a probability distribution for each
uncertain variable (characterized by mean andstandard dev) and correlation among variables.
3. Allow computer to select a random draw form thedistribution for each variable
4. Calculate NPV (this is one scenario).5. Repeat 3) an 4) (10,000 or 100,000 times) equal
chance of each scenario –Calculate expected NPVand standard deviation.

8/10/2019 MBA 253 Sensitivity and Scenario Analysis 2012-13
http://slidepdf.com/reader/full/mba-253-sensitivity-and-scenario-analysis-2012-13 24/25
Monte Carlo Simulation
Benefits
1. More realistic selection of variables
2. Easy to understand resultsWeaknesses
1. Only as good as probability estimate andcorrelation of variables

8/10/2019 MBA 253 Sensitivity and Scenario Analysis 2012-13
http://slidepdf.com/reader/full/mba-253-sensitivity-and-scenario-analysis-2012-13 25/25
Quick Review
Sensitivity Analysis Scenario Analysis andMonte Carlo Simulation were all used tomeasure stand alone risk
Each is designed to provide more informationabout the uncertainty associated with theproject – they do not provide a clear cut
decision rule.