Embed Size (px)
Citation preview


MC Project No. 14001058G
City of Atlantic City Planning Board
Herbert Ushewokunze VII, Chairperson
Judah Dorrington, Vice Chairperson
Mayor Don Guardian
Kaleem Shabazz, Councilmember
Mohammad Rasheed
Chief Henry White
Dennis Konzelman
Steven L. Young
Mea Solomon
Master Plan Committee:
Herbert Ushewokunzee
Steve Young
Judah Dorrington
Dennis Konzelman
This document was funded by the Post Sandy Planning Grant funds.

City of Atlantic City Master Plan Reexamination Report
April 2016
Table of Contents
Introduction .............................................................................................................................1
Atlantic City Physical Layout ..................................................................................................2
Atlantic City Economic Background .......................................................................................2
Demographic Profile of Atlantic City ......................................................................................4
Total Population ......................................................................................................................4
Population Density ..................................................................................................................5
Household and Family Size .....................................................................................................6
Racial Composition ............................................................................................................... 10
Income ....................................................................................................................................6
Age of Housing Stock ........................................................................................................... 13
Educational Attainment ......................................................................................................... 10
Summary of Demographic Observations ............................................................................... 14
Citywide Cohort Analysis ..................................................................................................... 15
Economic Profile of Atlantic City ......................................................................................... 17
Employment ...................................................................................................................... 17
.......................................................................................................................................... 21
.......................................................................................................................................... 21
Real Estate Market ............................................................................................................ 23
.............................................................................................................................................. 25
Land Use Profile of Atlantic City .......................................................................................... 25
Reexamination of the 2008 Master Plan ................................................................................ 27
CRDA Tourism District ........................................................................................................ 31
Strengths, Weaknesses, Opportunities, Threats ................................................................. 31
Summary of Findings ........................................................................................................... 33
Goals, Objectives and Recommendations of the 2016 Re-Examination.................................. 34
Land Use ........................................................................................................................... 34
Housing ............................................................................................................................ 35
Economic Plan.................................................................................................................. 37
Circulation ........................................................................................................................ 39
Open Space and Recreation ............................................................................................. 40

Conservation .................................................................................................................... 41
Historic Preservation ....................................................................................................... 42
Community Facilities ....................................................................................................... 42
Utilities Services .............................................................................................................. 43
Recycling .......................................................................................................................... 43
Resiliency Plan Element ...................................................................................................... 44
Resiliency Planning.............................................................................................................. 44
Design Standards Recommendations ..................................................................................... 44
Sea Level Rise and the Future of Infrastructure ................................................................. 46
Green Infrastructure Elements: .......................................................................................... 50
Design Standards ................................................................................................................... 50
Design Criteria and Applications ....................................................................................... 51
Methodology ..................................................................................................................... 52
Resiliency as an Economic Development Strategy ............................................................. 53
Consistency with Other Plans .............................................................................................. 55
1 | P a g e
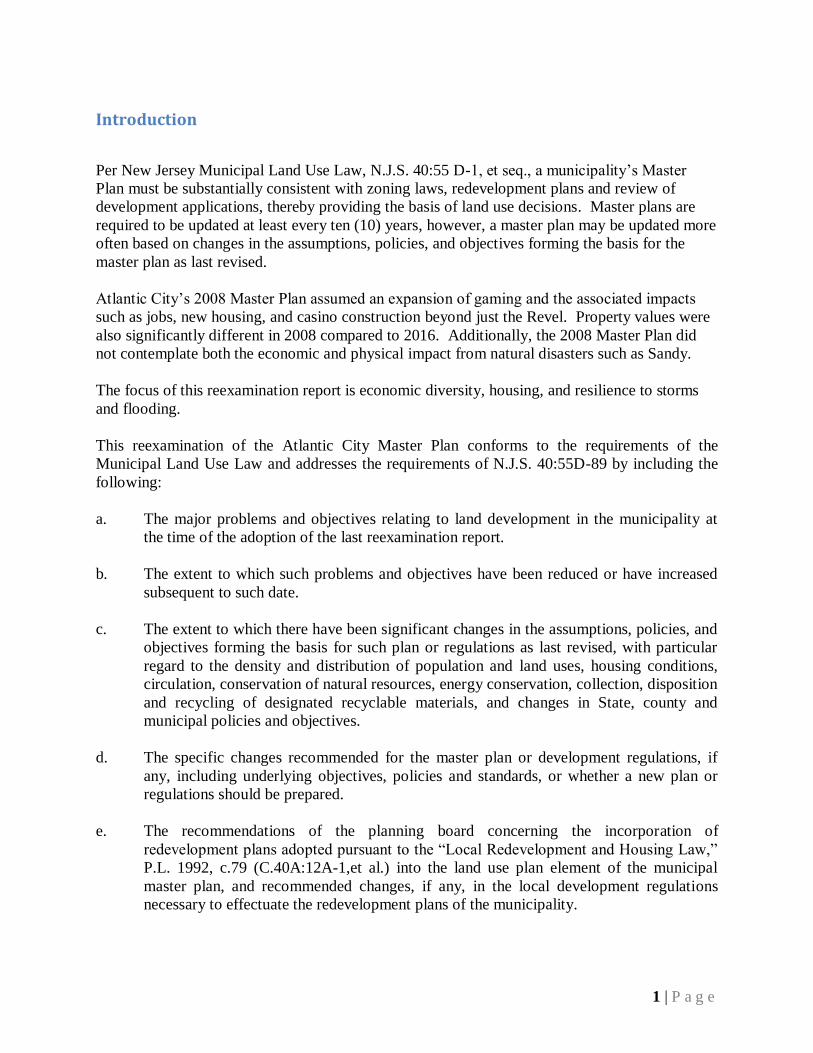
Introduction
Per New Jersey Municipal Land Use Law, N.J.S. 40:55 D-1, et seq., a municipality’s Master
Plan must be substantially consistent with zoning laws, redevelopment plans and review of
development applications, thereby providing the basis of land use decisions. Master plans are
required to be updated at least every ten (10) years, however, a master plan may be updated more
often based on changes in the assumptions, policies, and objectives forming the basis for the
master plan as last revised.
Atlantic City’s 2008 Master Plan assumed an expansion of gaming and the associated impacts
such as jobs, new housing, and casino construction beyond just the Revel. Property values were
also significantly different in 2008 compared to 2016. Additionally, the 2008 Master Plan did
not contemplate both the economic and physical impact from natural disasters such as Sandy.
The focus of this reexamination report is economic diversity, housing, and resilience to storms
and flooding.
This reexamination of the Atlantic City Master Plan conforms to the requirements of the
Municipal Land Use Law and addresses the requirements of N.J.S. 40:55D-89 by including the
following:
a. The major problems and objectives relating to land development in the municipality at
the time of the adoption of the last reexamination report.
b. The extent to which such problems and objectives have been reduced or have increased
subsequent to such date.
c. The extent to which there have been significant changes in the assumptions, policies, and
objectives forming the basis for such plan or regulations as last revised, with particular
regard to the density and distribution of population and land uses, housing conditions,
circulation, conservation of natural resources, energy conservation, collection, disposition
and recycling of designated recyclable materials, and changes in State, county and
municipal policies and objectives.
d. The specific changes recommended for the master plan or development regulations, if
any, including underlying objectives, policies and standards, or whether a new plan or
regulations should be prepared.
e. The recommendations of the planning board concerning the incorporation of
redevelopment plans adopted pursuant to the “Local Redevelopment and Housing Law,”
P.L. 1992, c.79 (C.40A:12A-1,et al.) into the land use plan element of the municipal
master plan, and recommended changes, if any, in the local development regulations
necessary to effectuate the redevelopment plans of the municipality.

2 | P a g e
This reexamination report serves as a reexamination of the Atlantic City Master Plan dated
September 2008.
Before embarking on the statutorily required elements of the Master Plan Reexamination it is
informative to present a brief overview of the conditions that existed in 2008 when the Master
Plan was adopted in comparison to today. The most recent available data on demographic,
economic and land use conditions in comparison to 2008 will be presented before addressing the
five required elements of a Reexamination Report.
Atlantic City Physical Layout
The City of Atlantic City is a both an urban center and seaside resort community, consisting of a
total of 10,067 acres in area of which approximately 2,624 acres are developable lands, the
remaining acreage consisting of water (3,079 acres) wetlands (3,708 acres) and roads/rights-of-
way (656 acres).
The most unique characteristic of the City is its approximately 3.4 mile long sand beach, which
is lined by an approximately 60 feet/40 feet/20 feet wide (depending on location) boardwalk. The
City is laid out in a grid system of city blocks with an average dimension of 350 feet by 550 feet,
which incorporates public parks and open spaces. Public infrastructure, including both water and
sewer systems, are well integrated into the grid system.
Atlantic City Economic Background
From the 1880s to 1940s, Atlantic City was a major east coast vacation resort. In the 1920s, it
was considered the premier tryout town for theatrical productions headed for Broadway and
beyond. In the 1950s, as air travel to vacation spots in Florida and the Caribbean became more
widely available, Atlantic City’s popularity as a resort destination began to decline. By the
1960s, the City was beset with the economic and social problems common to many larger urban
centers at the time.
In 1976, the “Atlantic City Gamble” was launched when New Jersey voters approved a
referendum legalizing gambling in Atlantic City but not elsewhere in the State. The first casino,
Resorts International, opened in 1978. Other casinos were soon added along the Boardwalk and
later in the Marina District, for a total of eleven (11) by 2008 (a twelfth casino was opened in
2012.) The number of annual visitors had grown from 700,000 in 1978, to over 35 million.
The 2008 Master Plan noted that:
“The strength of the existing economic infrastructure should not be
overlooked; in 2007, the City’s tax base had skyrocketed from $316 million
in 1976 to almost $7 billion. The positive impact on Atlantic City has been
realized in revitalized neighborhoods, new housing projects and public
service facilities and economic, social and cultural programs.”

3 | P a g e
The 2008 Master Plan noted further that:
“The promised economic benefits of gaming to the City, although slow to
materialize, have now begun to bear fruit. The eleven (11) casinos that are
now operating in Atlantic City achieve a higher gaming “win” (and overall
revenues) than all the casinos along the Las Vegas strip combined. Plans for
a twelfth casino (speculated to be promoted by Morgan Stanley/Revel
Entertainment) have been announced as well as a new thirteenth casino to
replace the recently demolished Sands Casino. Existing casino properties
such as Harrah’s, Borgata and Trump Taj Mahal are in the midst of major
expansions including increased gaming space, additional hotel rooms,
entertainment, and retail space.”
The 2008 Master Plan goes on to state that:
“The City’s historic neighborhoods such as Bungalow Park, Chelsea,
Chelsea Heights, Ducktown, the Inlet, Venice Park, and Westside continue
to flourish in varying degrees. From 2005 to 2006, Atlantic City had the
highest percentage increase (25.9%) in average home value in the United
States while most of the country showed little or no home value appreciation
during this same time period. With this continued economic expansion,
Atlantic City is being marketed as “hot and exciting...and the cool place to
be.” It is beginning to be recognized as a place with not only casino gaming,
but also spas, world-class entertainment, nightlife, fine dining, beautiful
ocean beaches, a world-famous Boardwalk, golf amenities, amusements,
fishing, water sports, and a variety of shopping venues. The geography,
economics, and timing are finally beginning to align for the City.”
Through the 2000’s, the gaming industry continued to monopolize the City’s economy, however
competition from neighboring states began to have an effect in 2010. Casino revenue began
dropping, jobs were lost, and the City’s assessed value of property decreased significantly.
Specifically, between 2007 and 2015,
casino revenue decreased from $5.2 billion to $2.5 billion
four of the twelve casinos closed, and two declared bankruptcy
approximately 2,000 casino employees lost their jobs
assessed value dropped from $22 billion to $7 billion in 2015.
Furthering the economic devastation was Superstorm Sandy, which came ashore in Atlantic City
on Monday, October 29, 2012 and produced storm surge and wave erosion of historic
proportions. This major coastline altering event was perhaps the most destructive storm in New
Jersey history. As Sandy reached landfall the storm surge raised water levels along the inlet and
back-bays of Atlantic City causing significant damage. The report “Storm Damage Mitigation
Project” dated November 21, 2012 and prepared by CRDA and the City of Atlantic City,
estimated damages in Atlantic City at $75.2 million including losses to public buildings, beaches
and boardwalk, housing and loss of convention business revenue.

4 | P a g e
Demographic Profile of Atlantic City
The 2008 Master Plan included a demographic profile of the City by Ward based on the 2000
Census. With the availability of the 2010 Census it is informative to compare demographic
changes in the City between 2000 and 2010 (updated information is not available on an annual
basis as the American Community Survey conducted by the Census Bureau only provides
minimal annual projections for communities with a population of 65,000 or greater).
Total Population
Atlantic City’s total population in 2000 was 40,517 falling to 39,510 in 2010. The 2013 estimate
by the U.S. Census Bureau was 39,551. The population comparison by Ward is shown below. It
can be seen that Wards 1, 2, and 3 all lost population between 2000 and 2010 while Wards 4 and
6 remained essentially the same and Ward 5 increased in population.

5 | P a g e
Population Density
Population density in Atlantic City varies from 6,368 persons per square mile in Ward 2 up to
14,451 persons per square mile in Ward 6. Consistent with the population totals, the density
declined in Wards 1, 2 and 3 between 2000 and 2010; while Wards 4 and 6 remained essentially
the same and Ward 5 increased in density.
6415
64
65
6433
6395
7723
7086
5085
5986
6195
6394
8837
7081
0
1,000
2,000
3,000
4,000
5,000
6,000
7,000
8,000
9,000
10,000
1 2 3 4 5 6
Ward
Total Population
2000
2010

6 | P a g e
Income
Income data by Ward is not available for the 2010 census. However, income data is available by
Ward for the 2000 Census which indicated that the 6th
Ward had the highest per capita income at
$19,340 while the 2nd
Ward had the lowest at $11,328. Median household and per capita income
rates are available for the City as a whole in 2010. The chart below shows the median household
and per capita income for Atlantic City in comparison to Atlantic County and the United States
in both 2000 and 2010. The data indicates that both the household and per capita income in
Atlantic City lags behind both the County and the United States. All three jurisdictions showed
an increase in both income categories between 2000 and 2010. In 2010 the per capita increase in
Atlantic City was $18,610 while it was $27,391 in the County and $28,155 in the United States.

7 | P a g e
Income and Poverty in 2014 per U.S. Census

8 | P a g e
Persons in Poverty in 2014 per U.S. Census
Household and Family Size
Average household size varied from a low of 2.14 persons per household in Ward 3 up to 2.90
persons per household in Ward 4 in 2000. In 2010 Ward 3 continued to have the lowest average
population per household at 2.11 persons per household and Ward 5 had the highest average
population per household at 3.00 persons. Ward 4 had the second highest average population per
household in 2010. Wards 1, 2 and 3 all decreased in the average size of households between
2000 and 2010 while Wards 4, 5 and 6 all had increases in the average household size between
2000 and 2010 with the largest increase in Ward 5 at +13.6%.
0.00%
5.00%
10.00%
15.00%
20.00%
25.00%
30.00%
35.00%
40.00%
County
US New Jersey Atlantic Atlantic City
Persons in Poverty

9 | P a g e
The chart below compares the average household size in Atlantic City with the average
household size in Atlantic County and the United States. While the average household size in
Atlantic County is similar to that of the United States as a whole, the average household size in
Atlantic City is less than either although the average household size in Atlantic City has been
increasing since 1990 while that of the County and U.S. has decreased since 1990.
Average family size was fairly consistent across all six Wards in 2000 with the difference
between highest and lowest only about 8%. In 2010 however, there was a larger difference with
2.2
2 2.39
2.14
2.9
2.64
2.6
2.09
2.23
2.11
2.94
3.00
2.65
0.00
0.50
1.00
1.50
2.00
2.50
3.00
3.50
1 2 3 4 5 6
Ward
Average Household Size
2000
2010

10 | P a g e
Ward 4 (the highest) having a 25% greater average family size than Ward 3 which was the
lowest. The average family size decreased between 2000 and 2010 in all Wards except Ward 4
which increased, although at a modest 5%.
Educational Attainment
Educational attainment data by Ward is another census item available for 2000 but not for 2010.
The chart below shows the 2000 levels of educational attainment.
The chart demonstrates that the 2nd
Ward has the highest percentage of people aged 25 years and
over without a high school diploma. The 2nd
Ward also has the lowest percentage of the
population with a Bachelor’s or advanced degree. Approximately 20% of the population in each
Ward has some college credit; however, the 5th
Ward has the greatest percent of population with
a Bachelor’s degree and the second highest percentage of people with an advanced degree. The
1st Ward has the lowest percentage of people without a high school diploma, and has the highest
percentage of people with an advanced degree. In general, the educational attainment levels in
Atlantic City are lower than in the County or United States.

11 | P a g e
Racial Composition
There exists a difference in the distribution of races between the different Wards of the City as
evidenced in figures following. The differences are more or less consistent in both 2000 and
2010. The 6th Ward has the greatest concentration of white residents; comprising more than 40%
of its total population in 2010 (it was more than 50% in 2000). The 5th
and 6th
Wards have a
higher percentage of white residents and a very low percentage of black residents. It is worth
noting that the 5th and 6
th Wards also have the largest Asian populations when compared to the
other Wards. The remaining four Wards, on the other hand, have greater percentages of Black/
African American residents and a significantly decreased percentage of white population.
0%
5%
10%
15%
20%
25%
30%
35%
40%
Educational Attainment Comparison (2000)
2000 United States
2000 Atlantic County
2000 Atlantic City
2010 United States
2010 Atlantic County
2010 Atlantic City

12 | P a g e
0%
20%
40%
60%
80%
100%
1 2 3 4 5 6
Ward
Racial Composition (2000)
White Black or African American
American Indian and Alaska Native Asian
Native Hawaiian and Other Pacific Islander Other race
Two or More Races

13 | P a g e
Age of Housing Stock
The age of housing stock is not available for the 2010 Census by Ward, but it was available for
the 2000 Census. The chart below shows the age of housing stock as of 2000. The chart
illustrates that the 1st Ward has the highest percentage of new housing stock whereas the 6
th
Ward has a very low percentage of new housing. More than 60% of the housing units in the 4th,
5th and 6
th Wards were built before 1960. On the other hand, more than 60% of the housing units
in the 1st and 2
nd Wards were constructed after the year 1960. The 1
st Ward also has the highest
percentage of housing units built between 1980 and 2000.
A comparison of the median year that housing was built is shown in the below chart for Atlantic
City, Atlantic County and the United States. It can be seen that the median age of the housing
structures in Atlantic City is considerably older than that of the County or United States.
0%
20%
40%
60%
80%
100%
1 2 3 4 5 6
Ward
Age of Housing (2000)
Built 2000 or later
Built 1980 to 1999
Built 1960 to 1979
Built 1940 to 1959
Built 1939 or earlier

14 | P a g e
Summary of Demographic Observations
Atlantic City’s population level is essentially stagnant. There was a decline of approximately
1,000 residents between 2000 and 2010 but the U.S. Census Bureau estimates the 2013
population to be essentially the same as 2010. Within the City, the 5th
Ward has the highest total
population and the 6th
Ward has the highest population density. Atlantic County also
experienced a population decline between 2000 and 2010.
The City’s household size has increased in the past decade, but it is still less than the County or
the nation. The 1st and the 3
rd Wards have fairly low average household and family sizes,
specifically when compared to the other Wards and to the City averages.

15 | P a g e
The National per capita and median household incomes as well as the County and the City
figures increased between 2000 and 2010 after dropping between 1990 and 2000 for the County
and City. The City’s median household income is significantly lower than that of the County
and the nation.
The City has a greater stock of older housing compared to the County and the Nation, but this
decline is gradually declining; a majority of the older structures in the City are located in the 5th
and 6th
Wards.
The educational attainment of the City’s population has improved over the past decade, but falls
significantly short of the National and County rates. Within the City, the 2nd
Ward has the lowest
high school diploma and college degree education levels.
Citywide Cohort Analysis
In an effort to better understand the overall City demographic and population shifts, a cohort
retention analysis was completed. The purpose of this analysis is to look at the population of the
City in a given census year (2000) and, using trending analysis, predict the movement of the
population cohorts (age groups) for the next 10 years. These numbers are then compared to the
“actual” population change over ten years using the U.S. Census information. The analysis
provides an indication of population gain/loss by cohort, or age group.
Ideally the “predicted” population would match the actual population; however mitigating
factors impact the results. Factors such as in-migration and out-migration are often based on
9.71%
-1.98% -2.37% -4.00%
-2.00%
0.00%
2.00%
4.00%
6.00%
8.00%
10.00%
12.00%
Population Growth Rate (2000-2010)
US
Atlantic County
Atlantic City

16 | P a g e
quality of life issues in a community. For example, if a municipality shows a loss in the 35-54
age cohorts, the area is losing significant economic buying power as this age range is the most
important economic force in the economy. The loss of those residents in the 25-44 age cohorts
could also indicate the desire to move to areas with better quality schools, as this age group tends
to be in the “child raising years.” While every municipality varies, the best situation is that a city
is retaining its key demographic age cohorts and attracting new residents as well.
The following figures illustrate the cohort retention analysis for Atlantic City. In this case, the
“expected” or predicted population for those residents aged 15-24 was less than actually realized.
This may be a sign of Atlantic City’s strong economic need for entry level workers in these age
cohorts; however, the City did not retain those residents in the age 25-44 cohorts, which may
indicate that once they had children they opted to move to a less urban environment in search of
a better school district. Interestingly, there was a fairly strong increase in the 45-54, 55-59 and
60-64 age cohorts. In the previous 10 years (2000-2010) there was only a nominal increase in
these age cohorts.
The loss of the population cohorts over the age of 65 is typical of most urban areas, although the
decrease between 2000 and 2010 was not as significant as between 1990 and 2000.

17 | P a g e
Economic Profile of Atlantic City
Employment
Private sector employment has fallen in Atlantic City since 2008 with the biggest drop in
Accommodation and Food Services as can be expected due to the problems in the casino
industry. Employment data from the 2007 and 2012 Economic Census is reproduced below. It
can been seen that employment level in Accommodation and Food Services declined from
47,392 employees in 2007 to 38,593 employees in 2012. Also notable is the decline in Real
Estate, Rental and Leasing which fell from 739 employees in 2007 to 475 employees in 2012
emblematic of the lackluster activity in real estate. It should be noted that the 2012 data which is
the latest U.S. Census Bureau Economic Census predates Superstorm Sandy and the recent rash
of casino closings.

18 | P a g e
Unemployment remains higher in Atlantic City than in the State or Nation. According to the U.S.
Bureau of Labor Statistics as of June 2015 the unemployment rate in the Atlantic City area was
8.8% as compared to 6.1% for the State and 5.5% for the U.S. This is an improvement however
over May 2012 when unemployment in Atlantic City was at 16.2% as compared to the State
unemployment rate of 9.1% and the U.S. rate of 8.2%.
NAICS Code Description Establishments
Sales Receipts or
Shipments (1,000)
Annual Payroll
(1,000)
Paid
Employees
42 Wholesale Trade 13 70,865 8,700 355
44-45 Retail Trade 316 554,035 59,451 2,692
51 Information 5 X 853 33
53 Real Estate, Rental and Leasing 63 139,386 20,654 739
54 Professional, Scientific, and Technical Services 71 111,139 54,757 610
56 Administrative, Support, Waste Management and
Remediation Services 35 28,639 18,550 790
61 Education Services 1 D D 0-19
62 Health Care and Social Assistance 87 249,950 120,299 2,702
71 Arts, Entertainment and Recreation 20 17,109 4,399 148
72 Accommodation and Food Services 238 5,602,533 1,368,996 47,392
81 Other Services (Except Public Administration) 78 80,475 23,931 1,003
D-Withheld to avoid disclosing data for individual
companies; data included in higher level totals.
Source: U.S. Census Bureau, 2007 Economic Census, 2007
Economic Census of Island Areas, and 2007 Nonemployer
Statistics.
Atlantic City Economic Statistics - 2007
NAICS Code Description Establishments
Sales Receipts or
Shipments (1,000)
Annual Payroll
(1,000) Paid Employees
22 Utilities 8 Q 7,476 91
31-33 Manufacturing 6 D 960 54
42 Wholesale Trade 12 95,779 11,982 388
44-45 Retail Trade 330 641,008 61,111 3,060
53 Real Estate, Rental and Leasing 47 111,175 15,807 475
72 Accommodation and Food Services 228 3,539,066 1,154,835 38,593
D-Withheld to avoid disclosing data for individual companies; data included in higher level totals.
Q- Revenue not collected at this level of detail for multiestablishment firms.Source: U.S. Census Bureau, 2012 Economic
Census of the United States
Atlantic City Economic Statistics - 2012

19 | P a g e

20 | P a g e

21 | P a g e

22 | P a g e

23 | P a g e
Real Estate Market
Just as real estate values were higher in Atlantic City during the mid-2000s, the drop has been
more precipitous. The significant decrease in values of the casinos has had a massive effect,
with the ratable base dropping from over $20 billion in 2008 to $6.5 billion in 2016.
The table below compares the change in tax ratables between 2008 and 2016. The assessed
property value overall has declined significantly in that time period with all property types
(residential, commercial, vacant and apartments) sharing in the decline.
Change in Tax Ratables
Number of Parcels
2008 2014 %
Change 2008
2016
Vacant 2,365 2,229 -6% $1,490,690,697 $415,929,500
Residential 11,036 10,952 -1% $3,114,539,426 $1,685,997,740
Commercial 1,771 1,645 -7% $17,415,239,503 $4,251,201,600
Industrial 11 9 -18% $8,944,705 $4,972,800
Apartments 182 170 -7% $321,524,267 $151,651,000
Total 15,365 15,005 -2% $22,350,938,597 $6,509,752,640
Market Value Analysis In April 2015, a Market Value Analysis was completed by The Reinvestment Fund. The Market
Value Analysis is a tool designed to assist the private market and government officials to identify
and understand the various elements of local real estate markets. Specifically, it maps conditions
that cause demand and distress in the housing market, and color code neighborhoods to help
local officials and private investors can more precisely craft intervention strategies in weak
markets and support sustainable growth in stronger market segments. The darker colors are the
stronger markets.

24 | P a g e

25 | P a g e
Land Use Profile of Atlantic City
The Land Use Plan element of a community Master Plan is generally perceived to be the key
element of the Master Plan. The Land Use Plan serves as the foundation and basis for the Zoning
Ordinance. Indeed, the significance of the Land Use Plan Element is noted by the Municipal
Land Use Law which states that a Master Plan shall generally comprise of at least a statement of
objectives, principals, assumptions, policies and standards and a land use plan element with other
elements being optional. Generally the Land Use Plan is to show the existing and proposed
location of uses of land in the future. In the case of Atlantic City which has been fully developed
for many years, the future land use pattern can be anticipated to replicate the existing land use
pattern for the most part save for possible areas of redevelopment.
A comparison between the amount of different land use types in 2008 and currently can be had
through either a review of property tax classifications from the tax assessor’s office of Land
Use/Land Cover data from NJDEP based on aerial photos. It was not possible to exactly compare
2008 data with today since the tax assessor’s property tax classification data only goes back to
2011 and 2014 represents the last update. The NJDEP Land Use/Land Cover data was only
available for the years 2007 and 2012. Tables representing both methodologies follow:

26 | P a g e
Property Tax Classification - Number of Acres
Class 2011 2014 Change %
Change Residential 373.49 371.52 (1.97) (0.53%) Apartment 50.13 50.39 0.26 0.52% Commercial 574.06 569.43 (4.63) (0.81%) Industrial 5.72 5.72 0.00 0.00%
Vacant 1,329.23 1,289.46 (39.77) (2.99%) School 80.85 80.85 0.00 0.00% Public Land 2,874.20 2,894.29 20.10 0.70% Church 29.78 28.91 (0.87) (2.93%) Other Tax Exempt 1,153.07 1,158.23 5.17 0.45% Unknown Classification 3,677.09 3,698.81 21.72 0.59%
Total 10,147.61 10,147.61 - -
Land Use / Land Cover - Number of Acres
2007 2012 Change % Change
Beaches 51.19 64.01 12.82 25.05% Barren Land 25.31 75.15 49.84 196.96% Forest 79.28 64.40 (14.88) (18.77%) Residential 885.12 881.93 (3.18) (0.36%) Commercial 808.15 818.62 10.47 1.30% Military 10.01 10.01 0.00 0.00% Industrial 29.08 28.17 (0.91) (3.13%) Transportation/Utilities/Communications 427.09 429.87 2.78 0.65% Airport 27.85 27.85 0.00 0.00% Recreational Land 94.67 94.65 (0.02) (0.02%)
Athletic Field 25.57 25.47 (0.10) (0.40%) Stadium/Theater/Cultural Center/Zoo 30.32 30.32 0.00 0.00% Mixed Urban Land 35.73 33.00 (2.73) (7.65%) Other Urban Land 403.92 361.68 (42.24) (10.46%) Water 3,553.25 3,585.39 32.13 0.90% Wetlands 3,692.67 3,648.69 (43.98) (1.19%) Total 10,179.21 10,179.21 - -
A review of the above tables show there has been very little change in land use over the years.
This is particularly true for the property tax classifications where the largest percentage increases
were for public land +0.70% and apartments +0.52%. The largest percentage decreases were for
vacant land -2.99% and church property - 2.93%. In terms of actual acreage all changes were

27 | P a g e
nominal. For instance the decrease in vacant land was only 39.77 acres and the increase in public
land was 20.10 acres.
The Land Use/Land Cover analysis shows greatest increases to be for barren land at +196.96%
(49.84 acres) and beaches at +25.05% (12.82 acres). Note that the beach figure was pre-
Superstorm Sandy and may have decreased since. The largest decreases in Land Use/Land Cover
were for forest -18.77% (14.88 acres) and other urban land -10.46% (42.24 acres).
Reexamination of the 2008 Master Plan
a. The major problems and objectives relating to land development as stated in the 2008 Master
Plan.
The following major problems relating to land development and objectives to address them
can be summarized as follows from the 2008 Master Plan:
Problems
Lack of a diversified economy.
Transportation accessibility and traffic problems.
Age of infrastructure (water, sanitary sewer, electric and gas systems).
Objectives
Provide opportunities for the continued growth of the City’s resorts and casinos while
using land use planning to diversify its tourism economy and meet the needs of local
residents.
Redevelop Bader Field as a signature site and viable community asset.
Encourage the redevelopment/revitalization of existing neighborhoods and provide
pedestrian and bicycle connections between them.
Encourage development in the Central Business District.
Protect the City’s natural resources.
Provide adequate capacity for future growth on access roads to Atlantic City.
Minimize impacts of traffic on Atlantic City residents and businesses.
Plan strategies for diversification of the City’s economy.
Encourage urban design and establish design criteria and performance standards that
improve the quality of development within the City.
Promote and reinforce the City as a desirable residential location.
Promote academic uses to attract new economic development opportunities.
Preserve and maintain the existing utility infrastructure and take advantage of best
available technology for sewage treatment and stormwater management.
b. The extent to which such problems and objectives have been reduced or have increased since
2008.
The main problem related to land development identified in the 2008 Master Plan is the lack
of a diversified economy. The lack of a diversified economy enhanced the economic impact

28 | P a g e
of the great recession in Atlantic City. The City was affected to a greater extent than the
County, State or Nation by the recession since casinos, the main economic driver in the City,
rely on patrons with disposable income. Disposable income was hard to come by for most
individuals during the recession. In the post-recession years casinos opened in the adjacent
States of New York and Pennsylvania drawing customers away from Atlantic City. As a
result, the need for a diversified economy is more apparent today than in 2008.
Although there has been a significant reduction in traffic due to the closing of four casinos,
there has been little or no improvement in transportation accessibility to Atlantic City. The
Circulation Plan goals and objectives in the 2008 Master Plan have not been addressed,
leaving the City with the similar transportation and traffic problems as in 2008. In particular,
improved and more frequent rail service, and more direct transportation from New York City
should be addressed. There should be a discussion within the Planning Board about an
evaluation and prioritization of transportation problems and improvements. This will assist
with the application for funding moving forward.
Some of the infrastructure issues have been addressed since 2008. South Jersey Gas has
completed a wide spread upgrading of their lines accompanied by repaving of effected
streets. Important streets such as Pacific Avenue and Arctic Avenue have been repaved in
recent years, but there is an acknowledgement that storm water infrastructure must now be
included in the discussion. The City has taken aggressive measures to drain storm water and
improve resilience from storms and flooding, but additional improvements are needed.
Regarding the major objectives relating to land development from 2008 each objective is
repeated below followed by a brief discussion of the current status.
Provide opportunities for the continued growth of the City’s resorts and casinos
while using land use planning to diversify its tourism economy and meet the needs
of local residents.
Land use planning to diversify the tourism offerings and tourism economy is of utmost
importance as is the objective to meet the needs of local residents.
Redevelop Bader Field as a signature site and viable community asset.
The redevelopment of Bader Field has been an objective for many years. This is an objective
that has been addressed recently with the adoption of the Bader Field redevelopment plan and
active discussions and executed lease (pending State approval) for a sports complex on the
site.
Encourage the redevelopment/revitalization of existing neighborhoods and provide
pedestrian and bicycle connections between them.
The encouragement of the redevelopment/revitalization of existing neighborhoods continues
to be an objective that has not been fully addressed. Certain neighborhoods such as Northeast
Inlet have seen revitalization or redevelopment but overall this is a continuing objective. The

29 | P a g e
provision of enhanced pedestrian and bicycle access between neighborhoods is an objective
that was advanced further in the bicycle and pedestrian master plan study by Michael Baker
Associates. The City’s first bicycle lanes were completed in March 2016 along Maryland
Avenue. The City has received a grant and is currently completing design of the Inlet Bike
Loop.
Encourage development in the Central Business District.
The objective to encourage development in the Central Business District is ongoing and has
been met with some success since 2008. Examples of development that has occurred since
2008 include the recently opened Bass Pro Shops.
The City and Main Street Atlantic City organization is working with Atlantic Avenue
merchants to improve business. The Atlantic Avenue Streetscape project (under
construction) and pedestrian improvements will enhance the CBD.
Protect the City’s natural resources.
Protecting the City’s natural resources is an objective that has received greater emphasis
since Superstorm Sandy. The preservation of salt marshes is essential to help attenuate the
impacts of storm surges such as that experienced with Sandy. The City has been working
with NJDEP for continued protection of Green Acres lands.
Provide adequate capacity for future growth on access roads to Atlantic City.
Capacity has not been increased on access roads to Atlantic City. In 2008 the primary
concern was to improve access and increase capacity to accommodate the additional growth
in the casino industry that was anticipated at that time. That growth has not occurred but in
the meantime the impact of Superstorm Sandy has made the improvement of access a safety
concern more so than a concern to accommodate growth. The most significant concern is
flooding of roads.
The improvement of the capacity and storm proofing on Albany Avenue/Route 40/322 was
rated as a high community need in the Bader Field Post Disaster Recovery Project Matrix,
and there have been ongoing discussions about improvements to the West End Avenue
intersection with Albany Avenue. The Army Corps of Engineers has included this area
within the Chelsea Heights project they are presently conducting.
Minimize impacts of traffic on Atlantic City residents and businesses.
Efforts have been made to minimize the impacts of traffic on Atlantic City residents and
businesses including the Chelsea Heights / Bader corridor, but more can be done.
Plan strategies for diversification of the City’s economy.

30 | P a g e
The planning of strategies for diversification of the City’s economy is an area of
concentration for the City. Education and medical uses, along with increased convention and
conference activities and diversifying the toursism attractiosn will likely serve the foundation
of a new economy.
Atlantic County Economic Development Plan was completed in 2015 stated: “Much of
Atlantic County’s difficulty stems from two issues: the lack of any significant industry
cluster activity other than tourism and gaming, and the lack of a regional economic
development organization to brand and market the area and aggressively recruit new
companies. To address these and other issues, Atlantic County must adopt a regional
approach to economic development.”
Encourage urban design and establish design criteria and performance standards
that improve the quality of development within the City.
Urban design initiatives undertaken since 2008 includes funding from the CRDA to improve
the facades of properties along Atlantic Avenue and the Boardwalk. Facades of several
casinos have also been improved. Aesthetic improvements to the Boardwalk are also
ongoing.
Promote and reinforce the City as a desirable residential location.
Bringing attention to the assets of the City, including the well-established neighborhoods, is a
City initiative that is resulting in renewed interest. Increased taxes are off-set by purchase
prices lower than surrounding areas. First time homebuyer programs are enticing new
teachers and police officers to buy homes in the City. Over 300 units of new rental housing
are improving the aesthetics of the neighborhoods and occupying formerly vacant and
blighted land.
Promote academic uses to attract new economic development opportunities.
The involvement of Stockton University and Atlantic Cape Community College in the City
has expanded since 2008, and there is recent interest by Rowan to establish a Medical
School. The City needs to continue to encourage and expand academic uses in the City
moving forward.
Preserve and maintain the existing utility infrastructure and take advantage of best
available technology for sewage treatment and stormwater management.
The preservation and maintenance of the utility infrastructure continues to be a priority
especially in light of the impacts from Superstorm Sandy.
c. The extent to which there have been significant changes in the assumptions, policies, and
objectives forming the basis for the Master Plan or development regulations as last revised.
31 | P a g e
There have been very significant changes in the assumptions forming the basis for the Master
Plan between 2008 and today. The key assumptions in 2008 upon which the Master Plan was
based were that the City was embarking on a growth spurt in casinos and the economic base
was strong and growing. Unforeseen was the competition from out-of-state casinos and the
great recession which started at the end of 2008. Both of these have had major impacts on the
casino industry in Atlantic City. The economic downturn was compounded by the arrival of
Superstorm Sandy in October 2012. The economic and demographic impacts the City has
absorbed since 2008 are chronicled elsewhere in this document.
Although the assumptions on which the Master Plan are based have changed many of the
policies and objectives of the 2008 Master Plan remain valid today. Some of the objectives
have risen to greater significance as a result of Superstorm Sandy and the contraction of
casino industry.
Objectives from the City’s 2008 Master Plan which were impacted by or made more relevant
by the advent of Superstorm Sandy and its effects on the City fall into the area of Circulation,
Conservation, Community Facilities and Utilities. There are many other objectives in the
Master Plan that are essential to the rebirth of the City going forward but the following
objectives in particular take on added importance when considering storm preparedness and
undertaking planning for future storm events.
CRDA Tourism District
In 2011, the Casino Reinvestment Act was amended to give authority over land use in the
Tourism District to the Casino Reinvestment Development Authority (CRDA). The Tourism
District is an area encompassing the Resort Commercial (casino) district as well as City-owned
land such as Bader Field and Gardner’s Basin. The 2012 Tourism District Master Plan, dated
February 1, 2012, provides recommendations regarding the future land use of the District,
including the establishment of new districts. The recommendations of the Tourism District
Master Plan include changes to the existing zoning such as boardwalk, beach and Central
Business District, but also propose new districts including a Ducktown Arts District and the
Lighthouse District (Southeast Inlet).
Strengths, Weaknesses, Opportunities, Threats
The following SWOT analysis was discussed throughout the Master Plan process.
Strengths:
Free Beach w/ Shower Stations
Boardwalk
Beach Events

32 | P a g e
Gardner’s Basin Maritime Park
Bader Field
Dune System with Stormwater Mitigation
Growing Reputation as a World Class Food City
Cultural Diversity and Civic Pride
The Walk Outlet Stores
Transportation Options
Low Cost of Home Ownership
Stockton University
Atlantic Community College
AtlanticCare
Casino Entertainment / Gaming / Restaurants
Atlantic City Convention Center / Boardwalk Hall and Casino Meeting Spaces
Growing arts community
Access to AC International Airport
Weaknesses:
Casino Closures and vacant zones on Boardwalk and Pacific Avenues
Lack of a Diversified Economy
High rate of foreclosures
Declining middle class
High unemployment
Safety perception
Maintenance concerns of abandoned properties and vacant lots
Boardwalk in need of improvement and retail diversity
Property tax increases
Aging condition of housing
Vacant surface lots
Inconsistent and dim street lighting throughout the City
Inconsistent facade appearances and upkeep
Lack of large food store located within the City
Illegal conversions of single family homes to multi-family homes, increasing density
Opportunities:
Build on resurgence of City life
Strengthen neighborhoods
Establishing a variety of districts throughout City and “brand” them
Pedestrian and bike friendly
Rebranding as a leader in environmental and sustainability initiatives

33 | P a g e
Increase code enforcement efforts
City’s rich history
Arts district
Public-private partnerships
Beach and water-based activities
Improve transportation
Changing perception
Infrastructure improvements
Streetscape improvements
Non-gaming attractions
Second home market
Threats:
• North Jersey casinos and their effect on the City’s gaming industry
• Storms and flooding
Summary of Findings
Reexamination of the 2008 Master Plan and review of the many planning documents prepared
before and since reveals there are overriding themes that must be recognized and addressed:
The economy needs diversification. Education and medical uses, increased conventions
and conferences, and expanded tourism attractions can provide the basis.
Housing stock needs to be upgraded. Homeownership, both primary and second homes,
needs to increase.
The waterfront is underutilized. Public access to the waterfront needs to be improved.
Pedestrian trails should be located along the bayfront and activities such as kayak and
boat rentals, boat launches and fishing areas added.
Tourism offerings should be expanded to make Atlantic City more family-oriented.
Atlantic City’s economy and tourism is intricately tied to the County and region and
cooperative marketing and promotion to investors is critical.
Better connections between the Boardwalk and the shopping district are needed and an
improved retail mix should be explored for the Boardwalk.
The City needs to attract new residents and keep residents, in particular 25-40 year olds,
who will invest in the community.
An analysis of community vulnerability to natural disasters has been prepared and a
series of resiliency goals and objectives developed. The mitigation projects listed in the
Storm Damage Mitigation Project Report dated November 21, 2012 should be carried
out.
The existing 2008 Master Plan has good information and strengths, and the 2016 Re-
examination has been conducted to address any perceived weaknesses and to update the
objectives based upon the changing economics and environment of the City. Therefore,

34 | P a g e
it would be recommended to adopt these modifications to the Master Plan, and not
rewrite a new document at this time.
Atlantic City’s atypical demographics and job market significantly influences the housing
need, including:
The household income level of $30,000 is approximately half of the county, state and
nation
Jobs are disproportionately low paying service industry jobs, and employment
opportunities have decreased significantly since 1990
The number of renters compared to homeownership is two and a half times the
average, at 70% renters and 30% homeowners in the City
Multifamily dwellings are the predominant housing type, with 30% of the housing
type buildings with 20 units or more
The housing is aged, 59% built prior to 1970, and 44% built prior to 1960.
Many residents are paying a significant amount of their income towards housing;
35% on more on housing costs
Housing rentals and ownership have been subsidized out of necessity. The number of
units that have previously or currently receiving subsidy is extremely high. In
addition, there are a multitude of social service agencies that also provide subsidized
housing to seniors, disabled residents, and at risk individuals.
Non-subsidized (market rate) housing is reasonably priced in the City, as demanded
by the average household income. This makes it difficult for re-investment by
property owners. Overall, the existing housing stock has an average date of
construction of 1952 as of 2010, and generally has not been maintained up to code.
This has created a need for demolition and/or rehabilitation of existing housing units.
Goals, Objectives and Recommendations of the 2016 Re-Examination
The following are the results of the review of the Objectives revised by Maser Consulting and
reviewed and modified with the Planning Board Post Sandy Planning Committee Members and
Planning Department that involve the following recommended changes to the goals and
objectives from the 2008 Master Plan.
Land Use
Provide a balance of land uses and development patterns while maintaining the character and
grid pattern of the community.

35 | P a g e
Goals, Objectives and Recommendations
Encourage redevelopment on under-utilized and vacant properties throughout the City.
Create an inventory of properties; use ordinances such as Abandoned Properties and
Foreclosure Registration; target high flood vulnerability properties for conservation and
open space; aggressively foreclose and facilitate redevelopment; adopt redevelopment
plans to provide incentives.
Encourage the comprehensive redevelopment of large areas of vacant lands within the
Downtown area and along the beach, boardwalk, inlet and bay areas through
Redevelopment. Specifically: the Southeast Inlet; the Downtown/Midtown beach blocks
between South Carolina and MLK and the Boardwalk and Pacific Avenue; large lots
along Absecon Inlet at Atlantic and Melrose Avenues.
Continue to establish strong pedestrian, bus and bicycle linkages between destinations,
public transportation, employment and residential areas, such as the newly completed
Maryland Avenue bike lanes connecting the Marina District towards the Inlet.
Implement the recommendations of the 2013 Bike and Pedestrian Plan.
Demolish or reconstruct substandard properties in the City, particularly highly visible
and/or those affecting neighborhoods’ quality of life using aggressive code enforcement
and condemnation when necessary.
Provide for adequate parking to serve established residential and commercial areas
Create attractive and well-served neighborhoods with a mix of housing types, to provide
a high quality of life for residents.
Strengthen and improve City-wide and neighborhood commercial districts as centers of
employment, shopping, services, entertainment and education.
Incorporate the Redevelopment Plans into zoning by creating new districts, such as
Gateway education.
Create new districts that reflect goals or themes, including Beach Resort, Lighthouse
District, Ducktown Arts, Green Energy, music history (Kentucky Avenue jazz).
Update the zoning ordinance to reflect changes and adaptations caused by responses to
the hurricane, such as, the raising of residential properties
Encourage and require public art as a redevelopment tool
Adopt design standards for streetscape improvement compatible to City neighborhoods
Housing
Preserve, protect and ensure the availability of decent, safe and adequate housing units of
different types, sizes, and price ranges through new and compatible infill residential
development in appropriate locations to meet the needs of current and future residents. This
report recommends strategies to create a wider variety of housing types that are reasonably
priced for the market. This is expected to result in a more balanced economic base to support
the local economy, benefitting all residents.
Vacation/second homes, live/work lofts, casino and healthcare workforce housing, single and
duplex residential on vacant lots, and owners’ and renters’ apartments above stores, are
recommended to diversify the housing options and costs. The encouragement and possible
36 | P a g e
subsidy through land donations, tax abatements or low interest construction loans or
mortgages can be considered to jump start interest in the Atlantic City housing market by
households that can help to balance the economy.
Market rate and home ownership should be prioritized.
This is especially in light of over 350 newly constructed or planned affordable rental
apartments funded in part by Sandy Multifamily Funds, administered by the New Jersey
Housing Mortgage Finance Agency. Although Sandy victims receive priority, complicated
paperwork, and strict credit and background checks have created a disconnect with those
intended to be served by the program. Therefore, funding of those units by the State has
resulted in an increase in affordable households and rental units in the City, contrary to the
housing goals of the City. The City has taken the initiative to hold a housing event to ensure
Sandy victims receive priority along with targeting substandard Sandy damaged housing for
demolition.
A discussion of housing must acknowledge the excessive and disproportionate number of
low paying service industry jobs that make it difficult for the housing stock to be renovated
and replaced. A correlation also exists between educational opportunities, well-paying jobs,
and decent housing stock. Any effort to develop higher paying jobs in the City, and improve
education, would contribute to the demand for housing by a variety of income levels.
The Planning Board also recommended expanded housing options for seniors, including new
housing developments and age in place facilities. The City is considering providing land for
senior housing.
Goals, Objectives and Recommendations
Clear blighted and substandard housing throughout the City. Prioritize those units and
structures that are non-FEMA compliant, vacant, abandoned, foreclosed, or create a
public nuisance.
Encourage for sale home construction, including second homes, on vacant lands in both
resort commercial areas and neighborhoods.
Discourage and end use of rooming house-style hotels in resort commercial areas to serve
as permanent housing.
Use occupancy limit regulations to identify and end overcrowding.
Increase home ownership opportunities through improved access to mortgage financing,
first time homebuyer programs, and production of reasonably priced for-sale housing.
Provide support for the encouragement of aging in place mechanisms that will allow for
seniors to remain in their homes.
Raise attached housing at one time rather than piecemeal. This will address appearance,
setbacks and access issues, structural stability, creation of shadowing and repurposing of
ground floor spaces.

37 | P a g e
In conjunction with existing non-profit organizations within the City, address existing
special needs housing, including the homeless, disabled, persons with AIDS/HIV, people
with substance abuse and / or mental health challenges, and people returning or re-
entering the community post-incarceration.
Solicit a variety of housing types and prices to attract of balanced mix of households and
income levels.
Encourage the use of mechanisms such as payment in lieu of taxes to assist with new
construction and improvements.
Encourage appropriate infill development and look at the relationships to present zoning
codes.
Encourage the second home ownership market in the city.
Encourage the development of residential dwellings on 2nd
floors above commercial
properties where currently vacant units exist.
Explore creative and non-conventional methods such as Community Land Trust (CLT) to
mitigate anticipated workforce housing shortages in the City.
Rehabilitation of existing sub-standard or vacant units, particularly above stores on
Atlantic Avenue and those with architectural or cultural significance
Demolition of units and housing structures that are outdated for the market and beyond
repair
Partner with casinos and healthcare employers to provide workforce housing options
Encourage artist work/live lofts by identifying properties for rehab
Homestead Program to donate deteriorated homes and abandoned lots under public
ownership to residents that will build a home and live there
Adopt zoning that reduces vacant land based on speculation; provides incentives for
live/work uses; and allows for increased density for diverse housing such as micro-units.
Economic Plan
Provide a vibrant and diverse economic environment which will protect and enhance the long
term economic and social interests of present and future residents in order to maintain and
improve the City's overall quality of life.
Goals, Objectives and Recommendations
Support existing businesses by facilitating development approvals; advertising new
business opportunities locally first; and City use of local vendors whenever possible.

38 | P a g e
Continue to re-brand the City to reflect a more diverse destination, including conferences
and conventions, and events such as concerts
Continue to develop education and medical industries, green, sustainable, and resilient
infrastructure and brand the City accordingly.
Pursue additional commercial uses that provide a diversification of the economy and
jobs. Focus on jobs that are consistent with the work force but work towards higher
paying jobs.
Coordinate economic development efforts with the region and State efforts, including the
Atlantic County Economic Development office and NJ Economic Development
Authority.
Leverage economic development incentives such as the Grow New Jersey program that
gives added benefits to Atlantic City as a “Garden State Growth Zone”
Use Payment in Lieu of Taxes (property) to encourage projects that create jobs and long
term increased value to areas.
Promote the continued redevelopment of the Central Business District as a mixed-use
pedestrian-oriented core with a concentration of commercial and residential uses in close
proximity to mass transit.
Create an attractive physical and economic environment to bring back professional
services such as medical professionals, engineers and lawyers to locate within the City.
Provide a business friendly environment that encourages opportunities for existing
businesses and local contractors to succeed by providing a supportive environment for
those wishing to grow or expand.
Provide access and information on new small and low interest loans available to local
businesses, such as the City’s 108 loan program that leverages CDBG funds.
Support the arts and culture of the City by focusing on historic connections and
leveraging the existing entertainment market to provide opportunities for local artists.
Require public art as part of site plan requirements and redevelopment plans.
Work with the Atlantic City Convention and Visitors Authority, Chamber of Commerce
and other similar agencies to promote destination tourism, business and leisure trip
packages and beach related tourism.
Develop an up to date comprehensive Capital Improvement Plan for the City to
modernize facilities.
Transforming Atlantic City into a hub for resilience and climate change research,
training, policymaking and implementation.
Improve the Community Rating System for the City
Support the implementation of the Atlantic County Economic Development Strategy and
Action Plan that identified the following leverageable assets:
•Airport and airspace opportunities
•Federal Aviation Administration (FAA) and UAV testing sites
•Other Federal programs and facilities
•Stockton University and Atlantic Cape Community College

39 | P a g e
•Stockton Aviation Research and Technology Park
•Proximity to major markets (30 million consumers)
•Atlantic City Development Corporation’s Stockton-South Jersey Gas project
•Environmental amenities
•Quaint communities with tourist appeal
•Development, redevelopment, and repurposing opportunities
•Affordable home prices
•Global connectivity
•Casino Reinvestment Development Authority
The top target industries identified in the Atlantic County Economic Development Strategy
and Action Plan include:
Aerospace and Aviation
Life Sciences
Tourism
Specialty Manufacturing
Entrepreneurial Business Services.
In addition, “Emerging Life Sciences Eco Niche” was identified. The action plan stated that
“Studies conducted by Princeton University and the U.S. Environmental Protection Agency have
identified the Mid-Atlantic region and Coastal New Jersey in particular to be a critical area of
impact for coming sea level rise. Global architecture firm Perkins+Will has issued a detailed
proposal and is spearheading an effort to establish Atlantic City as an international research hub
for climate change and coastal resiliency (with the potential for) repurposing vacant casinos as
housing for scientists and lab centers for universities. Burgeoning political support and Princeton
interest are giving the idea viability.” The City is currently working with Stockton and Rowan
Universities to locate a coastal research center in the City.
The City’s role as industries such as aviation develop elsewhere in the County, is to continue to
be a destination for those living and working in the area. In addition, young professionals
(millenials) have demonstrated a desire to live in urban centers, and with new market rental
housing planned or under construction, there will be an opportunity to attract young
professionals as residents.
Circulation
The City’s streets have been designed with vehicles as the priority, however, as an urban
environment and beach community, residents and visitors also walk and bike. In addition, many
residents are elderly or disabled, have children, and take public transit. Increased bike and
pedestrian safety is a top priority. Several areas within the City, particularly on Atlantic Avenue
around the Walk shopping area, and on Pacific in the casino area, have been identified by the
South Jersey Transportation Planning Organization as extremely high accident sites. In
particular, four of the top ten sites in South Jersey are in Atlantic City.
The City’s overall goal is to provide a safe, effective and energy efficient multimodal
transportation system by increasing mobility, reducing dependency on single-occupancy

40 | P a g e
vehicles, protecting roadway capacity, decreasing air emissions and enhancing the aesthetic
qualities of the streets and gateways.
Goals, Objectives and Recommendations
Implement recommendations of the 2013 Bike and Pedestrian Plan.
Increase pedestrian and bike safety through pronounced crosswalks, appropriate signal
timing, bulb-outs, medians, striping, and other improvements.
Enhance and improve street signs within the City for general navigation and wayfinding
to important City destinations.
Enhance connections within the City between and among residential neighborhoods,
community resources, the Central Business District, the casinos, and the region, through
the use of public transit system, walking and alternative modes of transportation.
Revitalize or create identifiable, pedestrian-oriented neighborhood areas with focal
points, mixed-use centers, and employment areas that are linked with each other.
Promote the creation of a multi-modal transportation system and hub that enhances local
circulation, increases regional access and encourages alternatives to driving, such as,
mass transit and bicycle/pedestrian facilities.
Develop a comprehensive bicycle and integrated jogging trail and sidewalk system along
the back bay connecting the residential neighborhoods in the City.
Encourage the growth and expansion of specialized transit services to meet the needs of
the elderly, disabled, schoolchildren, and other transportation dependent groups.
Require that traffic-calming techniques be implemented where needed to create a
pedestrian friendly street environment, control vehicle speed and reduce the number of
vehicles cutting through residential neighborhoods.
Encourage public safety with the implementation of the recommendations of the Bicycle
and Pedestrian Master Plan, in particular for high traffic areas, such as Atlantic Avenue
CBD.
Create a parking division or utility to provide a more comprehensive, efficient and user
friendly parking strategy throughout the City.
Open Space and Recreation
To promote participation in diverse, interesting, and high quality recreational and leisure
opportunities in safe, modern, and well-maintained parks and facilities for both the residents and
visitors.
Goals, Objectives and Recommendations
Preserve and enhance the existing system of parks and recreation facilities.

41 | P a g e
Promote further development and expansion of parks and recreational facilities to meet
neighborhood and community needs.
Develop and promote open space and recreation opportunities along primary circulation
corridors through a network of “green urban trails”, particularly along the waterfront.
Promote recreational activities along the back bay and consider partnerships with private
property owners to provide access for canoeing and viewing wildlife and waterborne
transportation.
Investigate opportunities for water sports to be provided access in the back bay and beach
areas, to facilitate their development within the City.
Consider the creation of neighborhood oriented "pocket" parks in locations that are not
currently afforded close access to existing park facilities.
Improve and expand the cultural, non-athletic, and recreational opportunities for residents
of all ages within the community.
Preserve and protect open space areas that have scenic views and/or important historical,
cultural significance and exceptional ecological value.
Initiate the development of a community/recreation center for people of all ages in the
CBD to increase activity.
Create linkages between existing parks and open space areas to residential neighborhoods
and commercial centers where possible, to form a network of open spaces.
Create attractive gateways at the principal and secondary entrances into the City through
upgraded land uses, streetscape improvements and signage.
Encourage the use of standards, such as, “Safety by design” that seek to design out
environmental health and safety risks for recreation during design development.
Provide and encourage opportunities for RV and camping access within Atlantic City in
specially designated areas.
Conservation
Preserve environmentally sensitive land along natural features such as waterways, wetlands,
beaches, unique ecology and prime wildlife habitats.
Goals, Objectives and Recommendations
Promote environmentally sensitive and green design solutions for all development
particularly adjacent to wetland areas.
Pursue long term plans and agreements with State and Federal agencies for securing
funding for beach replenishment and preservation of wetland areas, as an important part
of preserving Atlantic City’s resources and coastline
Require developers to utilize low impact development techniques to minimize impacts to
and minimize destruction of the natural environment and natural drainage systems.

42 | P a g e
Encourage new construction in the City to utilize low impact development techniques and
to meet the requirements of LEED (Leadership in Energy Efficient Design) guidelines.
Historic Preservation
Encourage historic preservation in order to maintain the City's unique character, protect existing
historic resources and complement economic development efforts.
Goals, Objectives and Recommendations
Establish a historic preservation entity within the City administration.
Acknowledge the importance of historic resources in providing a link to the past,
preserving the City's unique character, enhancing the appearance of neighborhoods and
the casinos, and promoting economic development and tourism.
Discourage the unnecessary demolition or significant alteration of historic
structures/buildings.
Encourage the preservation of historic landmarks designated in the National Historic
Register.
Encourage and explore incentives to assist with the proper maintenance of facades and
local historically notable structures.
Work with the City's Arts Commission to develop programs and incentives for arts and
cultural promotions.
Promote the understanding and appreciation of the City's heritage and historic value in
local schools and other regional education centers.
Community Facilities
Provide community facilities through timely and efficient provision of community services that
meet the needs of all City residents and businesses.
Goals, Objectives and Recommendations
Maintain and upgrade the existing system of community facilities in order to provide
high level of public services and to accommodate growth as well as the changing needs
of the population.
Provide community services which address all demographic sectors of the population
(e.g. schools, day care facilities, recreation facilities, senior centers).
Coordinate with the Board of Education to investigate the joint use of schools as
community centers, wherever feasible.
Maintain and upgrade existing emergency service facilities, especially those facilities
which are aging or obsolete.

43 | P a g e
Use community facilities to create and maintain a sense of place by enhancing public
areas with quality designs and pedestrian friendly landscapes that link to commercial,
cultural, and educational resources.
Utilities Services
Provide adequate infrastructure including sanitary sewer, water and storm water drainage to
service the needs of all residents and businesses without adverse impact upon the environment.
Goals, Objectives and Recommendations
Recommend that the city conduct a comprehensive review of Infrastructure and Utility
upgrades that have been completed in the last years. There have been numerous utility
upgrades conducted by local utilities, such as, South Jersey Gas that have replaced as
much as 40% of the high pressure lines throughout the city. These improvements and
others such as repaving need to be updated on the City GIS system.
Employ regional strategies to facilitate redevelopment, particularly with large-scale
public infrastructure such as water quality and waste management issues.
Address new and redevelopment project needs, as well as mitigating existing flooding
and water quality issues within the City.
Require new developments to locate all utilities underground.
Maintain criteria for zero increase in water runoff from new developments.
Promote the preservation and protection of water supply facilities and water resources by
controlling flood discharges, stream erosion, and runoff pollution.
Recycling
Continue to promote recycling in order to protect the environment.
Continue to promote recycling to reduce the solid waste stream and increase the reuse of
natural resources.
Encourage the use of “green” practices and materials in local construction and
development projects.

44 | P a g e
Resiliency Plan Element
The concept of resiliency has become part of common conversation ever since New Jersey was
hit first by the winds and rain of Tropical Storm Irene in 2011and then coastal New Jersey was
hit 14 months later by the winds and unprecedented surge of Superstorm Sandy. Emergency
readiness was sorely tested and stressed in these two major storm events and vulnerability to
flooding, the lack of redundancy in the power network and gaps in our ability to communicate in
a disaster were all exposed to varying degrees from Cape May to the northern tidal rivers
(Hudson, Hackensack, etc.). The Post Sandy Recovery Grant Program, funded by USHUD and
administered in New Jersey by the NJDCA, recognized that local master planning prior to Sandy
had not addressed the concept of resiliency, nor was there ever a need to examine the statutory
master plan elements such as Land Use, Circulation, Housing, Utilities, Open Space &
Recreation, Economic Development, etc., through the lens of resiliency. Sandy forever changed
the way that towns that it impacted will view their future.
Resiliency Planning
Resiliency planning can be summarized in four basic steps:
1. Generate awareness of coastal risk;
2. Assess coastal risks and opportunities;
3. Identify options or choices for addressing priority risks and vulnerabilities (short term); and-
4. Develop and implement an action plan to put selected options or choices into place (long
term).
The Atlantic City Strategic Recovery Planning Report (SRPR) summarized the vulnerability
within the City’s neighborhoods and the neighborhood plans for Chelsea Heights, Bader Field,
Back Bay Neighborhood and the North East Inlet/Gardner’s Basin provide specific detail
regarding vulnerability for those neighborhoods. Because Atlantic City is a barrier island and is
therefore typical of an area developed on top of what was once a natural dune system, the
elevations are generally higher closer to the ocean and lower closer to the back bays. The ocean
side of the island is exposed to a surge from a northeast winds, while the back bays rise up from
tides hemmed in by the east winds and flood the lower elevations. These conditions occur with
every northeast storm, which occur multiple times per year. They become catastrophic when
there are surges of the size that Sandy created.
Design Standards Recommendations
After reviewing the R-2 Zone’s bulk standards, the following recommendations should be
considered by the City for the R-2 Zone:
Amend the front yard setbacks.
Homes are presently required to have a 15 foot front yard and a 25 foot rear yard. However, lot
depth varies within the neighborhood from 40 to 100 feet. Therefore, a lot that is only 40 feet

45 | P a g e
deep cannot meet the rear or front yard setback requirement. In fact, a lot that is 60 feet deep
would only be able to construct a house that is 20 feet deep, which is impractical.
Front yard setbacks within the neighborhood vary from as little as 5 feet to 20 feet. It is
recommended that the City consider reducing the minimum requirement for the front yard from
15 feet to 5 or 10 feet to provide homeowners more flexibility.
Amend the side yard setbacks.
Lot width varies greatly from 20 to 120 feet. Presently the code requires a 12/5 ratio in that one
yard to be minimum of 5 feet wide and the two side yards combined must be 12 feet wide. A lot
that is only 20 feet wide would only allow for an 8 foot wide home and a 30 foot wide lot would
be restricted to a home that is 18 feet wide.
Two options are presented for the City’s consideration. The first is reducing the side yard
setbacks for lots with a width less than 40 feet. A sliding scale could be provided to offer
homeowners looking to rebuild with variance-free options. Lots between 31 and 39.9 feet (in
width) could be permitted side yard setbacks of 4 feet each, for a total of 8 feet. Lots between 20
and 30.9 feet could be permitted a side yard setback of 0 and 3 feet, for a total of 3 feet. (This
condition exists presently within Chelsea Heights.)
The second option for the City’s consideration is a development concept called “zero-lot line”.
A zero-lot line home essentially places the home on the side yard line, allowing for a generous
side yard that functions as the home’s outdoor space in conjunction with the rear yard. On lots
narrower than 40 feet, the zero-lot line concept provides one useable side yard instead of two
useless side yards. The wall of the home that sits on the property line typically has no windows
and acts as a privacy wall, so neighbors are not staring into one another’s windows. This
alternative would provide more flexibility to owners of undersized lots (less than 40 feet wide)
and produce usable side yards instead of useless slivers. Potential amendments to the side yard
parameters could include:

46 | P a g e
Lots between 20 and 30.9 feet (in width) – 0 and 5 feet, for a total of 5 feet
Lots between 31 and 39.9 feet – 0 and 8 feet, for a total of 8 feet
Lots between 40 and 49.9 feet – 0 and 12 feet, for a total of 12 feet
Lots between 50 and 59.9 feet – 0 and 16 feet, for a total of 16 feet
Revise the maximum principal building coverage.
There are lots within the Chelsea Heights neighborhood, which are only 20 feet wide and 50 feet
deep. When applying the 35% maximum principal building coverage to the lot, the owner would
only be able to construct a 350 square foot first floor. This would essentially translate to three
rooms that are approximately 10 feet by 11 feet each. Furthermore, existing on-the-ground
conditions reveal that undersized lots contain homes that cover much more than 35% of the lot
area.
It is recommended that the City consider allowing lots under a certain size (perhaps lots less than
3,000 square feet) a larger maximum principal building coverage, for example, 50% or 55%.
This would allow a lot that is 20 feet by 50 feet to construct a home that has a first floor with 500
or 550 square feet.
Minimum lot area – 3,000 square feet
Minimum lot width – 40 feet
Minimum front yard setback – 15 feet
Minimum side yard setback, each – 12 feet and 5 feet
Minimum rear yard setback – 25 feet
Maximum principal building coverage 35%
Maximum height – 35 feet
The City has already taken strides to revise definitions to assist homeowners who are rebuilding.
In order to assist the residents and provide them with more development options and less
variance obstacles, the R-2 Zone’s bulk standards should be amended.
General Appearance from Street:
Every effort should be made to provide designs for the new elevations that will work within the
context of the existing lot lines and setbacks to enhance the overall character of the
neighborhood. These would include stairs coming across the front of the property instead of
extending into the front yard setbacks.
Sea Level Rise and the Future of Infrastructure
Sea Level Rise
The Neighborhood Plans for all of Post Sandy Planning areas (Northeast Inlet, Bader Field,
Chelsea Heights and Back Bay) have all been developed to deal with the immediate needs of the
neighborhood, as well as to anticipate measures for improving the resiliency of existing and
future development to future storm events. However, it is important to recognize that the
evidence for the phenomenon of sea level rise, combined with the subsidence that is occurring

47 | P a g e
along the New Jersey coastline is compelling and that Superstorm Sandy may have been a
precursor of more frequent and possibly more severe storm events to come in the future, which
coupled with a rising sea level, even if only measured in inches, may make the existing neighborhood
pattern unsustainable in the most vulnerable areas.
The North Atlantic Coast Comprehensive Study (NACCS) was released in January, 2015. The
NACCS was commissioned by Congress in the Disaster Relief Appropriations Act of 2013. It
examined present and future flood risks in a 10-state area from New Hampshire to Virginia.1 "In
New Jersey, coastal storm risk is managed along the Atlantic Ocean coast by a number of
Federal coastal storm risk management projects … However, the low-lying areas of tidal rivers,
back bays, and Delaware Bay coasts have a limited number of coastal storm risk management
projects."2
This Re-Examination Plan notes that the areas identified in the figures below show the potential
impact made by the 2 foot of Sea Level Rise, 3 foot Sea Level Rise, and a 4 foot Sea Level Rise
which somewhat correlates to the City mapping indicating repetitive loss properties in Figure 4.
The Rebuild by Design study done by Princeton University for Chelsea Heights indicated that,
since 1992, the tide gauge reading for Atlantic City showed a 3.3 mm/year sea level rise, but that
the average over the past 100 years (century average) was 4.1 mm per year.3 At the more rapid
rate of 4.1 mm of sea rise per year, it would take 149.25 years to reach the 2 foot level shown in
Figure 3.
1 www.njspotlight.com, “Attention Must Be Paid to Bayside Flooding at Jersey Shore, Reports Army Corps”, by Scott Gurian, January 30, 2015. 2 IBID.
3 “Atlantic City Sea Level Rise Rate Below Average Since 1992”, by Steven Goddard, December 19, 2014, https://stevengoddard.wordpress.com

48 | P a g e
Figure 1: Map of Atlantic City from www.climatecentral.org showing the impact of a 2 foot rise on storm surge when combined with a high tide such as occurred during Superstorm Sandy.
Figure 2: Map of Atlantic City from www.climatecentral.org showing the impact of a 3 foot rise on storm surge when
combined with a high tide such as occurred during Superstorm Sandy.

49 | P a g e
Figure 4: The yellow dots on the map above indicate repetitive loss properties and the red dots indicate severe repetitive loss
properties.
Figure 3: Map of Atlantic City from www.climatecentral.org showing the impact of a 4 foot rise on storm surge when combined with a high tide such as occurred during Superstorm Sandy.

50 | P a g e
Green Infrastructure Elements: While the city has been moving forward on the shore protection measures associated with a
number of infrastructure and planning projects, such as, extending the boardwalk and new
seawall from Oriental Avenue to Gardner’s Basin, taking actions to continue to adhere to FEMA
BFE requirements for new construction, especially residential buildings, and elevating roads and
improving stormwater management facilities, the resiliency of the city in the longer term will
need to continue to plan for improvements to address potential climate related changes.
A part of this has been efforts to define and expand the standards for Green Infrastructure
improvements within urbanized areas. Below is an outline of the ideas and standards being
presently used:
Design Standards
As is common in most shore towns when it rains, the volume of stormwater falling on exposed
impervious surfaces and running into gutters and eventually storm inlets overwhelms the piping
system in the short term. As a result, some of this stormwater gets built up in the streets and
leads to localized flooding with this being exacerbated by tidal influences on the water levels.
One of the major goals of the developing stormwater management concepts throughout the areas
is an attempt to retain and / or infiltrate the first 1” inch of rainfall in the immediate area where
this water falls. This can be achieved by numerous methods by integrating green streets concepts
into the redesign of urban corridors and spaces, and to improve infrastructure sustainability and
assist the regional utility authority in their attempt to reduce peak stormwater flows into the
system. This includes using a variety of applications from, underground storage to green roof
structures, to divert and reduce the volume of stormwater flowing initially into the system.
As stated earlier; the intent is that the Plan will retain rather than increase stormwater from the
site, lessening site and localized flood conditions; with remediation of the site to the extent
necessary to reduce stormwater runoff and mitigate against flooding by incorporating green
infrastructure, as well as, vegetation to the greatest extent, within and around the development
including along sidewalks, rooftop gardens, green roofs and walls, decks, and in the courtyards
and open spaces.
The first step is to investigate the ability of the area to support stormwater management
initiatives and techniques in conjunction with the improvements associated with redevelopment.
This provides an approach that incorporates Green Street Design standards that can be fully
integrated with the redesign of an entire area of the city.
The planning process must include an evaluation of the existing sewer utilities throughout the
designated area, and an evaluation of the grounds ability to store or ultimately to infiltrate runoff
within the existing Right of Ways and adjacent properties. The use of Test Borings and
percolation testing should be done within any project area to determine both the current
conditions of the subgrade material and the potential to provide storage and infiltration.
The existing conditions in many areas designated for redevelopment have little to no ability of
the subgrade to provide significant storage volumes and or infiltration. Therefore, most systems

51 | P a g e
to be designed will need to provide storage volumes through methods such as green roof
applications and surface and subsurface storage systems in cisterns or stone trenches capable of
slow release of stormwater to be used for gray watering purposes or back into the system at non-
peak flow times.
The following are general design criteria to be used to determine the volumes to be addressed,
and the ability of an area to support Green Infrastructure and to provide for effective stormwater
management.
Design Criteria and Applications
The Stormwater Management systems usually include different applications providing
infiltration, evapotranspiration and storage and slow release. Some examples of successfully
completed applications include:
Raingardens: diverting water, usually from a paved corridor, to a planted low area that allows for
storage and infiltration. The systems we have designed have an overflow system to the existing
utility as a relief and are designed with native plant species.
Bioswales: directing water through a graded and planted swale usually adjacent to a roadway as
a method to attenuate runoff and promote infiltration. The plantings are designed to promote
evapotranspiration and are usually native species that require less long term maintenance and can
withstand wet conditions.
Stormwater Trenches: capturing an initial, 1" concentration of stormwater prior to entrance to a
combined sewer system. This involves the introduction of green inlets upstream to redirect the
stormwater to a series of underground stone storage trenches. The trenches are either for
infiltration if possible or storage with slow release if not possible. This application can be used
in conjunction with planters and street trees.
Pervious surfacing: Porous concrete and pervious asphalt have been used in a range of
applications, notably for surfacing of basketball courts and walking trails within recreation
sites. This has evolved to development of pervious streets with stepped and terraced
underground storage and slotted inlets. The idea of pervious surfacing within streets is now
being developed to use as a gutter collection system and for cross walk areas that can infiltrate
and redirect surface runoff.
Other ADA accessible porous surfacing can be used throughout the city, including safety
surfacing in playground areas and the use of stone binder materials over stone base. Each of
these applications provides stormwater storage as part of the design to handle runoff on site.
Individual Infiltration Units: The design and development of individual infiltration units was
created to provide point diversion of curb line runoff, and to provide a means of collection and
infiltration. Each unit is placed along the curb in relation to an adjacent street tree and planting
area and the runoff is captured and fed to the root system below.

52 | P a g e
Native Basin Plantings: Stormwater management basins have been developed with the intention
of capturing runoff and providing an effective means of infiltration. In most cases this involves
the use of native wetland seeding and plantings that are particularly adapted to promoting
infiltration.
Methodology
Present design standards encourage the introduction of sustainable Best Practices as to how best
to intercept an initial 1” to 1 ½” of rainfall and divert it to an alternative drain system that can
infiltrate and/or store the potential runoff. Most approaches use a blend of Best Practices such as
the installation of green roof systems, porous and pervious surface systems, rain gardens
incorporated into parking lots and dedicated open space areas and bioswales integrated into
streetscape designs. These practices all intercept stormwater prior to it reaching the existing
inlets and storm systems, many of which back up during moon high tides in the lowest lying
areas.
Green Infrastructure strategies should include the introduction of Green Inlets, which can capture
stormwater from roads and parking lots for distribution to a trench stone or other manufactured
drain system, such as, storm crates, upstream of existing City Inlets (which are connected to the
citywide storm system), to divert and intercept runoff.
Resiliency Action Plan
The Action Plan for Resiliency for Atlantic City combines short-term actions for protecting
buildings through elevation, which occurs through the aggregated decisions of multiple property
owners in a neighborhood, with moderate term actions that might involve gradual upgrading of
infrastructure with Green Infrastructure best practices and long term actions that anticipate the
eventual impacts of Sea Level Rise (elevating streets, raising bulkheads and protecting
shorelines).
A set of specific Actions follow below:
Work with federal and state agencies to regularly update the City floodplain maps, with first
priority being areas that are mapped as 100-year floodplain without base flood elevation
established.
Limit new development in the floodplain.
Promote uses, such as open space easements, natural areas, and recreational open space to
reduce impervious surfaces in floodplains.
Work to acquire properties in the lowest lying portions of the 100-year floodplain, and return
them to a natural state.
Reevaluate the effectiveness of the current floodplain protection regulations.
Discourage the location of new homes and roadways in the "V" or wave velocity zone and
the 100-year floodplain.
Work with the county to complete a hazard mitigation plan for flooding, wildfire, and other
natural hazards.
Develop and implement a post-disaster recovery and reconstruction plan to facilitate
recovery and to reduce exposure to future disasters.

53 | P a g e
Consider code changes that will limit impervious surfaces.
Develop a sea level rise response strategy (a two foot freeboard requirement for properties
exposed to flooding has been approved and discourage further shoreline hardening).
Utilize the Community Vulnerability Assessment Tool, Risk and Vulnerability Assessment
Tool, Hazard Assessment Tool, and HAZUS-MH to identify potential hazards, risks, and
vulnerabilities and keep mapping information on file.
Ensure the public is aware of any changes to FEMA's flood maps as they are updated and
adopted as well as if those updates result in changes to the Township's building requirements.
Participate in the Community Rating System (CRS). The Community Rating System (CRS)
is a FEMA program, designed to reward communities for taking steps to reduce flooding
risk. These activities and elements include public information, mapping, regulation, flood
damage reduction, and warning arid response initiatives. Actions under these categories are
eligible for points that are added up to designate where the community is "rated" according to
class rankings of 10 through 1.
Work to become designated as a Storm Ready Community by the National Weather Service.
The National Weather Service has created a community preparedness program to assist
towns as they develop plans for a wide variety of severe weather events. This program
provides guidance on hazardous weather identification, warning systems, and creating -
public readiness.
Complete City GIS mapping of utilities, including stormwater management design.
Resiliency as an Economic Development Strategy Atlantic City has been hit hard by the combined impact of the economic competition in the
gaming industry and the damage from Superstorm Sandy. New strategies to diversify the
economy through the redevelopment of Bader Field (Bader Field Neighborhood Plan) and the
North East Inlet/Gardner’s Basin (North East Inlet/Gardner’s Basin Neighborhood Plan) have
been incorporated into this Master Plan Reexamination/Update.
Another strategy that has emerged from the Post Sandy Recovery Planning efforts of the City is
the idea transforming Atlantic City into a hub for resilience and climate change research,
training, policymaking and implementation.
Storms and flooding are significantly impacting coastal communities worldwide and billions of
dollars will be spent on this growth industry. Creative solutions for coastal resilience will be
necessary in near future. Atlantic City is perfectly positioned to be in the forefront based on its
central location along the east coast, its conference space and hotel rooms, its vulnerability to
storms and flooding, and its unique coastal urban environment. Most importantly, the City and
partners are focused on pursuing new economies that provide higher paying jobs, educational
opportunities, and innovative branding for the region.
The economic losses caused by natural disasters have increased from an average of about $50
billion a year in the 1980s, to just under $200 billion over the last decade. Climate change and
rapid urbanization will only keep pushing costs upwards. It is estimated that average global
flood losses will increase nine-fold by 2050, from $6 billion per year in 2005 to $52 billion a

54 | P a g e
year. This forecast only takes into account socio-economic factors, such as growing population
and property values. Add in the risks from sea-level rise and sinking land, and global flood
damage for large coastal cities could cost $1 trillion a year if cities don’t take steps to adapt.
Natural hazards continue to cause significant loss of life and have significant social and
economic consequences. There is significant research and development underway to create tools
and mechanisms to assess, reduce, and manage risk, covering a vast array of legislative,
regulatory, policy, planning, institutional, financial, and capacity-building instruments.
Moreover, there is increasing public awareness and investment to strengthen disaster resilience at
all levels of society as a critical component of efforts to achieve sustainable socioeconomic
development and poverty reduction.
Climate change continues to make media headlines with the outcome of the UN global climate
change talks (COP21) in Paris last December. The result of these negotiations was a legally
binding global agreement on greenhouse gas emissions. Based on advance commitments from
the US, China, Europe and India, government will implement stricter emissions targets. As every
challenge is also an opportunity this coming regulation creates substantial investments in climate
change solutions.
The emergence of numerous clean energy technologies is accelerating and moving to
mainstream, unsubsidized markets as their costs continue to fall rapidly. For example, global
solar installations have skyrocketed as prices have dropped by more than 75 percent in recent
years. Lithium ion batteries for storing electricity and LED lighting which uses significantly less
electricity are also developing quickly and gaining wider adoption. Microgrids and off grid
power systems are becoming more prevalent.
Atlantic City is one of the few urban, barrier islands in the region making it a tremendous
laboratory for resiliency and sea level rise research and development. The City is vulnerable to
higher sea levels and storm events. The City has launched an ambitious plan with initiatives in
green infrastructure to providing economic opportunity. Atlantic City is in close proximity to
ocean/marine life, strong medical facilities, low real estate cost makes Atlantic City an ideal
location. In addition, Stockton University and Rowan University are both committed to building
campuses in Atlantic City. NJIT, Princeton University, Rutgers University, Columbia University,
University of Pennsylvania, National Fish and Wildlife Foundation, US Economic Development
Agency, US Army Corps of Engineers, USEPA, FEMA, NJ Economic Development Authority,
NJ Board of Public Utilities, NJ Department of Community Affairs, NJ Department of
Transportation, NJ Department of Environmental Protection, and The Rockefeller Foundation
have all invested in resiliency research and development in Atlantic City.
The Master Plan recommends that Redevelopment areas are designated to encourage private
(largely taxpaying) research and development facilities dedicated to improving resiliency that
would form economic synergy with Stockton and other research and educational institutions that
could emerge in the City in the future.
Phase I, currently underway, involves educational institutions to locate in Atlantic City.
Specifically, build on the recently approved Stockton City campus to establish a branch of the

55 | P a g e
Stockton Coastal Research Center. Additionally, the Rowan Environmental Engineering
Program is a natural fit based on their focus on resilience.
Concurrently, the City and other agencies will continue to pursue funding and implement
demonstration projects which showcase latest storm and flooding solutions and structures, such
as the innovative design of the Inlet Boardwalk and Seawall and the Gardner’s Basin Living
Shoreline projects.
Phase II could included engaging local convention and conference organizers to attract meetings,
conferences, and trainings focused on coastal resilience. Continued effort could be made to
recruit other university coastal research programs to create satellite programs in Atlantic City:
NJIT, Rutgers, Princeton, and Stevens Institute of Technology for example.
Consistency with Other Plans
This master plan reexamination is consistent with the State’s smart growth principals of
developing within areas of existing infrastructure. In addition, the plan is consistent with
surrounding jurisdictions and the County.