Embed Size (px)
Citation preview
Report to the Legislature: MCAS Support Programs – Fiscal Year 2012 AddendumThis report is an addendum to the Fiscal Year 2012 (FY12) report that was submitted to the legislature in 2012. This addendum provides more complete statistics now available, including post-program MCAS results, funded through state budget line item 7061-9404.
April 2014
Massachusetts Department of Elementary and Secondary Education75 Pleasant Street, Malden, MA 02148-4906Phone 781-338-3000 TTY: N.E.T. Relay 800-439-2370www.doe.mass.edu
This document was prepared by the Massachusetts Department of Elementary and Secondary Education
Mitchell D. Chester, Ed.D.Commissioner
Board of Elementary and Secondary Education MembersMs. Maura Banta, Chair, Melrose
Ms. Harneen Chernow, Vice Chair, Jamaica PlainMr. Daniel Brogan, Chair, Student Advisory Council, Dennis
Dr. Vanessa Calderón-Rosado, MiltonMs. Karen Daniels, Milton
Ms. Ruth Kaplan, BrooklineDr. Matthew Malone, Secretary of Education, Roslindale
Mr. James O’S., Morton, SpringfieldDr. Pendred E. Noyce, Weston
Mr. David Roach, Sutton
Mitchell D. Chester, Ed.D., Commissioner and Secretary to the Board
The Massachusetts Department of Elementary and Secondary Education, an affirmative action employer, is committed to ensuring that all of its programs and facilities are accessible to all members of the public.
We do not discriminate on the basis of age, color, disability, national origin, race, religion, sex, gender identity, or sexual orientation.
Inquiries regarding the Department’s compliance with Title IX and other civil rights laws may be directed to the Human Resources Director, 75 Pleasant St., Malden, MA 02148-4906. Phone: 781-338-6105.
© 2014 Massachusetts Department of Elementary and Secondary EducationPermission is hereby granted to copy any or all parts of this document for non-commercial educational purposes. Please
credit the “Massachusetts Department of Elementary and Secondary Education.”
This document printed on recycled paper
Massachusetts Department of Elementary and Secondary Education75 Pleasant Street, Malden, MA 02148-4906
Phone 781-338-3000 TTY: N.E.T. Relay 800-439-2370www.doe.mass.edu
Massachusetts Department ofElementary & Secondary Education75 Pleasant Street, Malden, Massachusetts 02148-4906 Telephone: (781) 338-3000
TTY: N.E.T. Relay 1-800-439-2370
April 2014
Dear Members of the General Court:
I am pleased to submit this Report to the Legislature: MCAS Support Programs Fiscal year 2012 (FY12) Addendum pursuant to Chapter 68 of the Acts of 2011, line-item 7061-9404, in collaboration with the Department of Higher Education. This addendum supplements the initial FY12 report and provides more complete statistics including post program MCAS results.
FY12 MCAS Support Programs were primarily designed for students who had not yet passed one or more of the MCAS tests required for high school graduation: English Language Arts (ELA), Mathematics, and Science and Technology/Engineering (STE). During the 2011-2012 school year and the following summer, 475 Department-funded MCAS support programs served approximately 16,700 of the 162,500 eligible students from grades 8-12 and post-12th grade (classes of 2003-2016). Only 10 percent of those eligible for services were able to participate due to the amount of funding available. More than 87 percent of students served through this line item participated in programs funded through 364 school district allocation grants. The additional 13 percent of students were served through 4 types of competitive grants awarded to districts, community colleges, One Stop Career Centers, and other partners such as Regional Workforce Investment Boards (WIBs).
When compared with eligible students who did not participate in these MCAS support programs, participants were 1.7 times (31 percentage points) more likely to pass the grade 10 ELA and Mathematics MCAS tests. As can be seen in this report, this difference held true when looking at students by class year as well as by selected populations: special education, low income, and English language learner (ELL). As one example, when looking at students designated as ELL who participated in MCAS Support Programs, 60 percent of them scored at least 220 (Needs Improvement – the minimum score required to earn a Competency Determination) on their post-program ELA and/or Mathematics MCAS test(s), as compared to only 28 percent of ELL students who were eligible for, but not served by, the programs. As another example, for students with special education status, the analogous comparison is 73 percent for program participants, versus 44 percent for eligible non-participants.
Student eligibility for MCAS Support Programs expanded during FY08-FY10 to include students in grades 8-12 who scored Needs Improvement (level two) on their most recent ELA and/or Mathematics MCAS tests, and also to include students in grades 8-12 who scored Warning/Failing (level one) on their most recent STE MCAS. This was in addition to the eligible students in grades 8-12 and post-12th graders who scored Warning/Failing on their most recent ELA and Mathematics test(s). As a result of these collective changes, the number of eligible
students and young adults increased by more than 85 percent from 88,000 in FY07 to nearly 163,000 in FY12.
As you will see in the details of this report, this grant program continues to serve students in need of additional supports to attain their Competency Determination. The Board of Elementary and Secondary Education views this as a priority that addresses proficiency gaps and promotes and supports student, school, and district success. I thank you for your ongoing commitment to funding MCAS support for students to enable them to meet the Competency Determination. I am available if you have questions or would like to discuss this further.
Please feel free to contact me if you have questions.
Sincerely,
Mitchell D. Chester, Ed.D.Commissioner of Elementary and Secondary Education

Table of Contents
Introduction....................................................................................................................1Student Eligibility..........................................................................................................1
Student Participation....................................................................................................2
Findings........................................................................................................................3
Class Year....................................................................................................................3
Selected Populations: Special Education, Low-Income, English Language Learners..3
FY12 MCAS Support Program Descriptions................................................................4Allocation Grants..........................................................................................................4
Competitive Grants.......................................................................................................4
FY12 MCAS Support Program Data Results................................................................6High School Students and Post 12th Graders..............................................................6
Data by Program Type.................................................................................................7
Details by Class Year.................................................................................................11
Additional Selected Population Information................................................................13
Overall Percentage Passing the 10th Grade Level ELA and Mathematics MCAS Test/Retest: Served Versus Eligible but Not Served..................................................15
APPENDIX A: FY12 MCAS Support Program Highlights..........................................16
APPENDIX B: Entities Funded for FY12 MCAS Support Programs through Line Item 7061-9404..............................................................................................................17
APPENDIX C: Additional Information on Data Used in Report................................24
APPENDIX D: Full Language for Chapter 68 of the Acts of 2011, Line Items 7061-9404 and 7027-0019......................................................................................................26
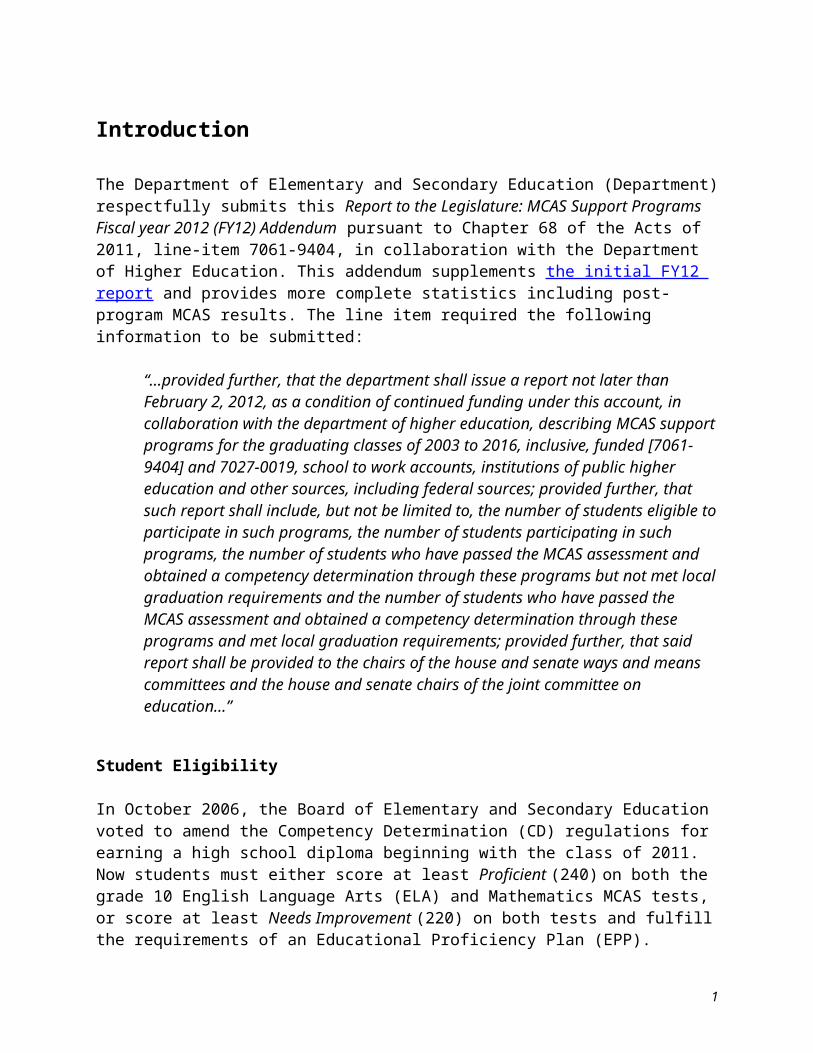
Introduction
The Department of Elementary and Secondary Education (Department) respectfully submits this Report to the Legislature: MCAS Support Programs Fiscal year 2012 (FY12) Addendum pursuant to Chapter 68 of the Acts of 2011, line-item 7061-9404, in collaboration with the Department of Higher Education. This addendum supplements the initial FY12 report and provides more complete statistics including post-program MCAS results. The line item required the following information to be submitted:
“…provided further, that the department shall issue a report not later than February 2, 2012, as a condition of continued funding under this account, in collaboration with the department of higher education, describing MCAS support programs for the graduating classes of 2003 to 2016, inclusive, funded [7061-9404] and 7027-0019, school to work accounts, institutions of public higher education and other sources, including federal sources; provided further, that such report shall include, but not be limited to, the number of students eligible to participate in such programs, the number of students participating in such programs, the number of students who have passed the MCAS assessment and obtained a competency determination through these programs but not met local graduation requirements and the number of students who have passed the MCAS assessment and obtained a competency determination through these programs and met local graduation requirements; provided further, that said report shall be provided to the chairs of the house and senate ways and means committees and the house and senate chairs of the joint committee on education…”
Student Eligibility
In October 2006, the Board of Elementary and Secondary Education voted to amend the Competency Determination (CD) regulations for earning a high school diploma beginning with the class of 2011. Now students must either score at least Proficient (240) on both the grade 10 English Language Arts (ELA) and Mathematics MCAS tests, or score at least Needs Improvement (220) on both tests and fulfill the requirements of an Educational Proficiency Plan (EPP). Additionally, students must also now score at least Needs Improvement on one of the four high school Science and Technology/Engineering (STE) MCAS tests. For more details see http://www.doe.mass.edu/mcas/graduation.html.
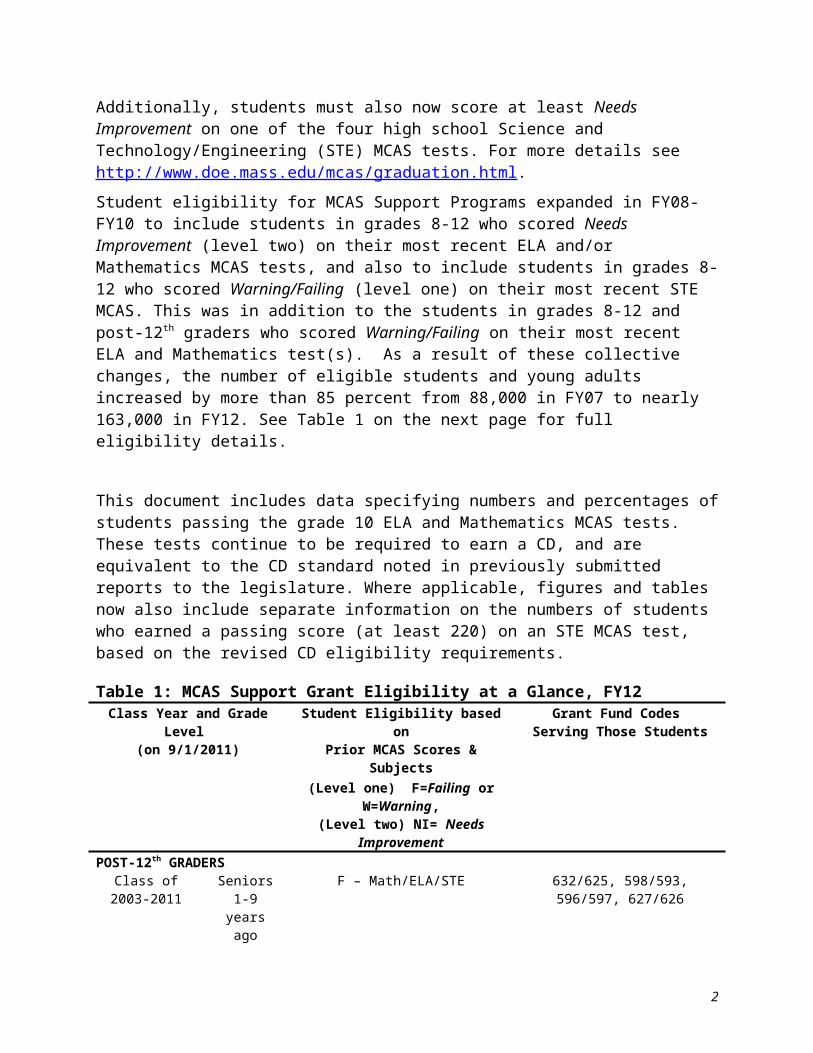
Student eligibility for MCAS Support Programs expanded in FY08-FY10 to include students in grades 8-12 who scored Needs Improvement (level two) on their most recent ELA and/or Mathematics MCAS tests, and also to include students in grades 8-12 who scored Warning/Failing (level one) on their most recent STE MCAS. This was in addition to the students in grades 8-12 and post-12th graders who scored Warning/Failing on their most recent ELA and Mathematics test(s). As a result of these collective changes, the number of eligible students and young adults increased by more than 85 percent from 88,000 in FY07 to nearly 163,000 in FY12. See Table 1 on the next page for full eligibility details.
1

This document includes data specifying numbers and percentages of students passing the grade 10 ELA and Mathematics MCAS tests. These tests continue to be required to earn a CD, and are equivalent to the CD standard noted in previously submitted reports to the legislature. Where applicable, figures and tables now also include separate information on the numbers of students who earned a passing score (at least 220) on an STE MCAS test, based on the revised CD eligibility requirements.
Table 1: MCAS Support Grant Eligibility at a Glance, FY12Class Year and Grade Level
(on 9/1/2011)Student Eligibility based on
Prior MCAS Scores & Subjects Grant Fund Codes
Serving Those Students(Level one) F=Failing or W=Warning, (Level two) NI= Needs Improvement
POST-12th GRADERSClass of 2003-2011 Seniors 1-9
years agoF – Math/ELA/STE 632/625, 598/593, 596/597, 627/626
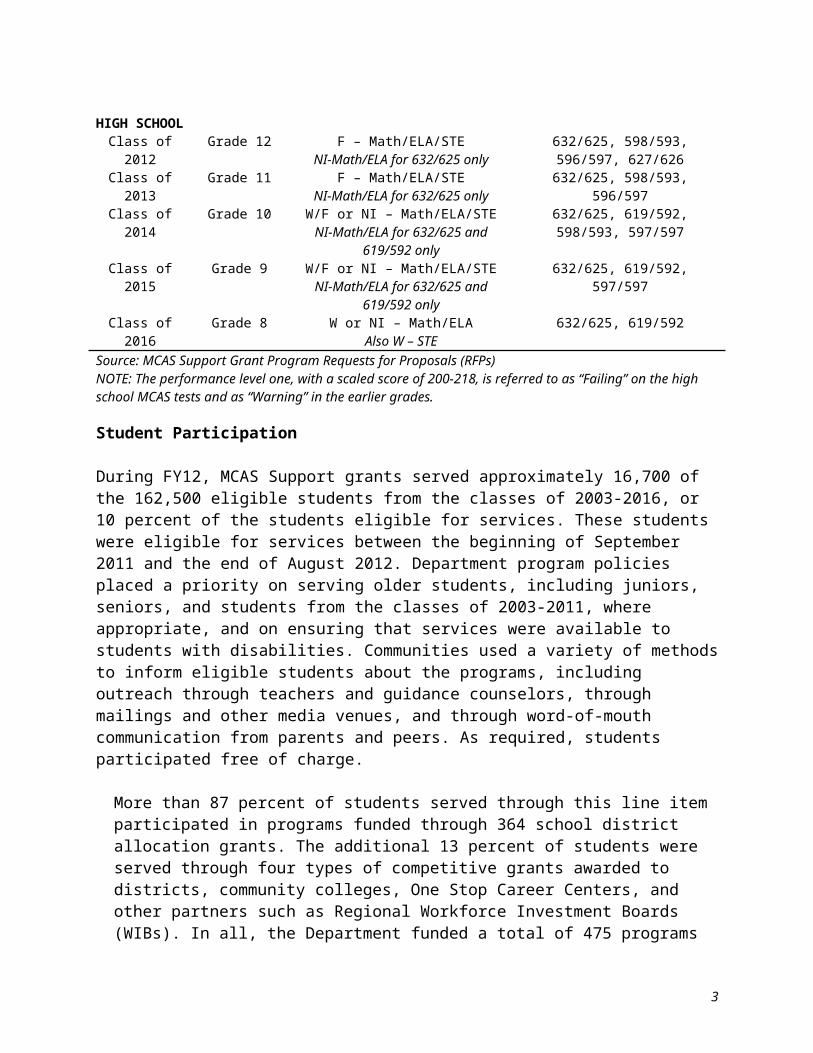
HIGH SCHOOLClass of 2012 Grade 12 F – Math/ELA/STE
NI-Math/ELA for 632/625 only632/625, 598/593, 596/597, 627/626
Class of 2013 Grade 11 F – Math/ELA/STENI-Math/ELA for 632/625 only
632/625, 598/593, 596/597
Class of 2014 Grade 10 W/F or NI – Math/ELA/STENI-Math/ELA for 632/625 and 619/592 only
632/625, 619/592, 598/593, 597/597
Class of 2015 Grade 9 W/F or NI – Math/ELA/STENI-Math/ELA for 632/625 and 619/592 only
632/625, 619/592, 597/597
Class of 2016 Grade 8 W or NI – Math/ELAAlso W – STE
632/625, 619/592
Source: MCAS Support Grant Program Requests for Proposals (RFPs) NOTE: The performance level one, with a scaled score of 200-218, is referred to as “Failing” on the high school MCAS tests and as “Warning” in the earlier grades.
Student Participation
During FY12, MCAS Support grants served approximately 16,700 of the 162,500 eligible students from the classes of 2003-2016, or 10 percent of the students eligible for services. These students were eligible for services between the beginning of September 2011 and the end of August 2012. Department program policies placed a priority on serving older students, including juniors, seniors, and students from the classes of 2003-2011, where appropriate, and on ensuring that services were available to students with disabilities. Communities used a variety of methods to inform eligible students about the programs, including outreach through teachers and guidance counselors, through mailings and other media venues, and through word-of-mouth communication from parents and peers. As required, students participated free of charge.
More than 87 percent of students served through this line item participated in programs funded through 364 school district allocation grants. The additional 13 percent of students were served through four types of competitive grants awarded to districts, community colleges, One Stop Career Centers, and other partners such as Regional Workforce Investment Boards (WIBs). In all, the Department funded a total of 475 programs during the 2011-2012 school year and the following summer. See Tables 2 and 3 (on pages 6-7) and Appendix B (on page 17-23) for full details.
2
Findings
The data presented illustrate that students served by FY12 MCAS Support Programs met the ELA and Mathematics MCAS testing requirement at substantially higher rates than their peers who did not participate in these programs. In FY12, eligible students who participated in Department-funded MCAS Support Programs were 1.7 times (31 percentage points) more likely to have met the ELA and Mathematics MCAS testing requirements by November 2012 (after the program) than eligible students who did not participate. This rate difference also held true when looking at students by class year as well as by selected populations. See pages 13-15 for more details.
Class Year
When differentiating the eligible population by class year, data for the classes of 2003-2014 show that a greater percentage of participants in MCAS Support Programs, as compared to non-participants, passed the grade 10 ELA and Mathematics MCAS tests or retests by the November 2011 retest as compared to non-participants. The actual percentage point difference between participants and non-participants ranged from 13 percentage points for 10th and 11th graders (class of 2013 and 2014) to 24 percentage points for 12th graders (class of 2012). See Figure 5 on page 13 and Appendix A on page 16 for full details.
Post-12th graders are often the most challenging to serve because the vast majority of these participants have taken and failed the MCAS numerous times and because many face academic and other challenges that are barriers to earning a CD. These factors may account for the lower passing rates among this group of young adults as compared to students who are still in high school. Despite these challenges, participating post 12th graders passed at a rate that was 15 percentage points higher than their eligible but non-participating peers who also took an MCAS test in the same time period. See Figure 5 (page 13) and Appendix A (page 16) for full details.
Selected Populations: Special Education, Low-Income, English Language Learners
Special education students, students from low-income families, and students designated as English language learners (ELL) were more likely to be eligible for MCAS Support Programs. In FY12, for example, 17 percent of all students enrolled compared to 33 percent of all students eligible for MCAS Support Programs had a special education distinction. Additionally, 35 percent of all students compared to 50 percent of eligible students were from low-income families, and 7 percent of all students compared to 9 percent of students eligible were ELLs. See Table 7 on page 14 for more detail.
Students served in the classes of 2003-2014 from these selected populations appear to benefit considerably from their participation in MCAS Support Programs, which suggests that these programs are likely to contribute to reducing the proficiency gap. For example, special education students who participated in MCAS Support Programs passed the grade 10 ELA and Mathematics MCAS tests by the November 2012 MCAS retest at a rate of 73 percent, as compared to 44 percent of eligible special education students who did not participate. For students from low-income families, 70 percent passed compared with 46 percent of eligible non-participants during the same time period. For students who were English language learners, the
3
associated passing percentages were 60 percent for program participants and 28 percent for non-participants. See Figure 6 on page 15 and Appendix A on page 16 for more detail.
4
FY12 MCAS Support Program Descriptions
In total, the Department funded 475 programs during the 2011-2012 school year and the summer of 2012. Approximately 87 percent of students served through MCAS Support grants participated in programs funded through 364 school district allocation grants. Allocation grants were awarded to all applicants who met the criteria specified in the Funding Opportunity Request for Proposals (RFP). The additional 13 percent of students were served through four types of competitive grants awarded to school districts, higher education institutions, One Stop Career Centers, and other partners such as Private Industry Councils and Regional Workforce Investment Boards. Competitive grants were awarded to only the applicants who best met the criteria specified in the Funding Opportunity RFPs.
Allocation Grants
For School Districts and Approved Private Special Education Schools/Collaboratives – Fund Codes 632/625
The purpose of this program was to provide academic support services in ELA, mathematics, and/or STE needed to meet the CD for eligible students in the classes of 2003-2016. Programs provided intensive, small-group or one-to-one, engaging instruction that addressed gaps in participants’ knowledge and basic skills.
Competitive GrantsCollaborative Partnerships for Students Success (CPSS) – Fund Codes 619/592
The purpose of this program was to develop Collaborative Partnerships for Student Success (CPSS) to supplement existing district resources. Goals included:
a. Serving as a part of a comprehensive intervention process to help students in grades 8-10 to be able to meet and exceed the CD standards on their initial try in the spring of grade 10;
b. Increasing student and family awareness on the value of their high school experience in relation to future opportunities through the development of preliminary career/college plans (and other means);
c. Increasing school district and community partners' ability to provide school year and summer academic support in ELA, mathematics, and/or STE to students eligible for these services; and
d. Developing or enhancing CPSS products such as curricula, learning activities, or other tools to help increase college and career readiness.
Work and Learning Programs – Fund Codes 596/597
The purpose of this program was to provide quality innovative and intensive instruction in ELA and mathematics through work and learning programs for students in grades 9-12 and post-12th graders (classes of 2003-2015) who had not yet earned their CD. Work and learning models typically combined academic instruction at the workplace with structured internships for participating students. Academic content was taught through the lens of a "real world" context to help engage students in their learning and raise achievement levels, while simultaneously giving them academic, technical/technological, and job skills necessary for success.
5
Higher Education Institutions and Partners – Fund Codes 598/593
The purpose of this program was to provide academic instruction in ELA and mathematics, as well as support services, to enable students grades 10-12 and post-12th graders (classes of 2003-2014) to continue to pursue a CD while providing pathways to further education. Programs provided intensive, small-group or one-to-one, engaging instruction that addressed gaps in participants’ knowledge and basic skills. Support services varied from program to program, but included internships, working and learning opportunities, access to select college classes, guidance and information related to attending college, and other efforts that helped students become career and college ready. Grant recipients included community colleges that partnered with high schools, local businesses, community-based organizations, internal college organizations or programs, and/or others that provided services for participating students such as One Stop Career Center and Work and Learning Initiative grant recipients.
One Stop Career Center Initiative – Fund Codes 627/626
The purpose of these grants, given to regions supporting One Stop Career Centers, was to provide students with access to the unique academic, employment, and career needs of 12th graders and post-12th graders (classes of 2003-2012) who needed further remediation to attain the skills necessary to earn their CD. Grant recipients provided individualized support to students to help them find and be able to participate in remediation services in ELA and mathematics, as well as job and apprenticeship training and employment, and GED preparation.
6
FY12 MCAS Support Program Data Results
High School Students and Post 12th Graders
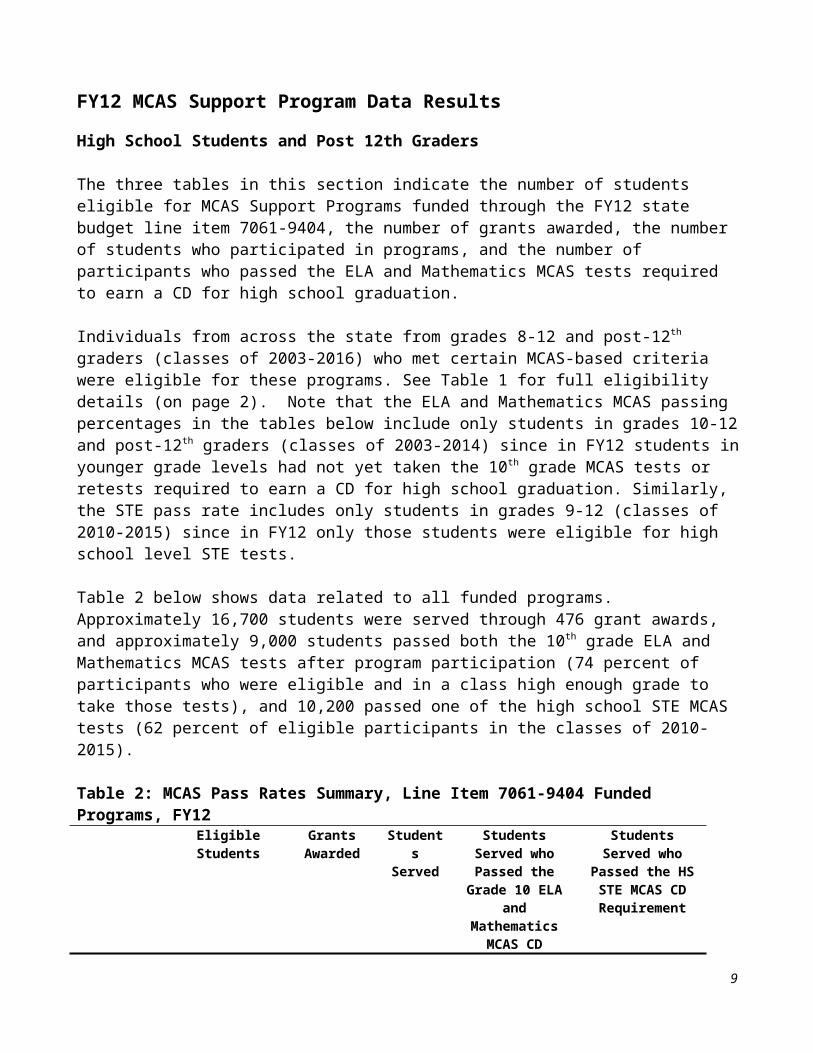
The three tables in this section indicate the number of students eligible for MCAS Support Programs funded through the FY12 state budget line item 7061-9404, the number of grants awarded, the number of students who participated in programs, and the number of participants who passed the ELA and Mathematics MCAS tests required to earn a CD for high school graduation.
Individuals from across the state from grades 8-12 and post-12th graders (classes of 2003-2016) who met certain MCAS-based criteria were eligible for these programs. See Table 1 for full eligibility details (on page 2). Note that the ELA and Mathematics MCAS passing percentages in the tables below include only students in grades 10-12 and post-12th graders (classes of 2003-2014) since in FY12 students in younger grade levels had not yet taken the 10th grade MCAS tests or retests required to earn a CD for high school graduation. Similarly, the STE pass rate includes only students in grades 9-12 (classes of 2010-2015) since in FY12 only those students were eligible for high school level STE tests.
Table 2 below shows data related to all funded programs. Approximately 16,700 students were served through 476 grant awards, and approximately 9,000 students passed both the 10th grade ELA and Mathematics MCAS tests after program participation (74 percent of participants who were eligible and in a class high enough grade to take those tests), and 10,200 passed one of the high school STE MCAS tests (62 percent of eligible participants in the classes of 2010-2015).
Table 2: MCAS Pass Rates Summary, Line Item 7061-9404 Funded Programs, FY12Eligible Students Grants
AwardedStudents Served
Students Served who Passed the Grade 10
ELA and Mathematics MCAS CD
Requirement
Students Served who Passed the HS STE
MCAS CD Requirement
TOTALS FOR ALL PROGRAMS(unduplicated)
162,515(87,928 in
classes of ’03-‘14)
475(More than one
to some entities)
16,675(10% of eligible)
9,045(74% of eligible
students served in the classes of ’03-’14)
10,179 (62% of eligible
students served in the classes of ’10-‘15)
Source: Student Information Management System and grant recipient reports.Note: Unduplicated totals indicate the number of individual students served in multiple programs, so that students who participated in more than one program were not counted more than once.
Table 3 on the next page offers additional details by grant program. As can be seen, school districts and approved private special education schools and collaboratives (through the Allocation grant program) served the largest number of students (approximately 14,500). Students served by Higher Education institutions were not enrolled in the college but were served by MCAS Support Programs run by them. The 509 students served by higher education institutions included 448 students served through the Higher Education focused grant program as well as 108 (61 unduplicated) that were served through the Work and Learning grant program. It is also worth noting that 95 of the students served by the One Stop Career Centers Initiative were referred to community colleges for MCAS Support services.
7
Table 3: All Line Item 7061-9404 Funded Programs by Grant Program, FY12 Eligible
StudentsGrants
AwardedStudents Served
Students Served Who Passed
Grade 10 ELA and Mathematics MCAS Required
for a CD(*classes of '03-14)
Students Served Who Passed HS STE MCAS CD Requirement
(**classes of ’03-15)
Allocation Grants for Districts & Approved Private Special Education Schools and Collaboratives
162,515 364 14,517 8,342 9,558
Collaborative Partnerships for Student Success (CPSS) Grants^
108,601 39 609 96 78
Higher Education Institution Grants 26,147 20 509 274 284One Stop Career Center Initiative^^ 9,535 20 1,105 291 198Work and Learning Grants 17,410 32 592 337 336
Source: Student Information Management System and grant recipient reports.Notes: ^The number who passed in the CPSS grants is low because that grant program mostly targeted grades 8-9 and those students were too young to take the 10th grade test that year. Additionally, although 9th graders who took an STE exam are included in the totals, not all 9th graders take an STE exam. ^^The number of students served for One Stop Career Centers may be an overestimated unduplicated count due to some students missing SASIDs. The One Stop Career Center numbers passing MCAS, however, are underestimated, due to those students missing SASIDS not being counted. NA=not applicable as those programs could not serve students in that subject in FY12. *Percentage noted only includes students in applicable class years (’03-14). ** Percentage noted only includes students in applicable class years (’03-15) and includes students who received STE waiver.
The data in Table 4 provides information about the number of class of 2012 students served who met local graduation requirements during the reporting period. The data is based on what was reported to the Department by districts through the Student Information Management System (SIMS) in June 2012 and October 2012, the last two reported enrollment periods for class of 2012 students who participated in FY12 MCAS Support Programs. However, this available data is limited for a number of reasons. Since SIMS does not collect data for students who are no longer enrolled in high school (classes of 2003-2011 students), the Department cannot determine if post-12th graders have met local graduation requirements. Districts have the option of awarding a Certificate of Attainment (CA) to students who have met local graduation requirements, but have not yet earned a CD. Furthermore, not all districts award CAs, and those that do are not required to report how many they award to the Department.
Table 4: Class of 2012 Students and Local Graduation Requirements, FY12Number of students who passed the 10th grade level ELA and Mathematics MCAS tests required for a CD
Number of students who passed the 10th grade level ELA and Mathematics MCAS tests required for a CD and met local graduation requirements
960
948
Number of students who earned a CA in FY12 376
Source: Student Information Management System and grant recipient reports.
Data by Program Type
This section of the report separates instruction-focused MCAS Support Programs from the One Stop Career Center initiative as a result of the different ways in which data was collected; data by subject area, time of program, instructional model, and school type does not apply for One Stop Career Center programs.
8
Instruction-Focused MCAS Support Grant Programs: Highlights
Data is collected on students served1 through Allocation grants to districts/approved special education schools and collaboratives as well as on students served through competitive grants to high schools for Collaborative Partnerships for Student Success, Higher Education Institution grants, and grants to districts/partners for Work and Learning programs. Highlights include:
Four hundred fifty-six (456) programs offered by districts, high schools, community colleges, and partnering organizations served 15,817 students in the classes of 2003-2016 (10 percent of those eligible).
Eighty-four (84) percent in ELA programs, 80 percent of students in mathematics programs, and 71 percent in STE who took that subject’s high school MCAS test or retest after participation in an MCAS Support Program earned a score of at least Needs Improvement. See Figure 1 for details by program type (pages 9).
Among students who scored Needs Improvement on the MCAS prior to participation, a total of 71 percent in ELA and 84 percent in Mathematics scored Proficient or Advanced on that test following the program. See Figure 2 for additional details (page 9).
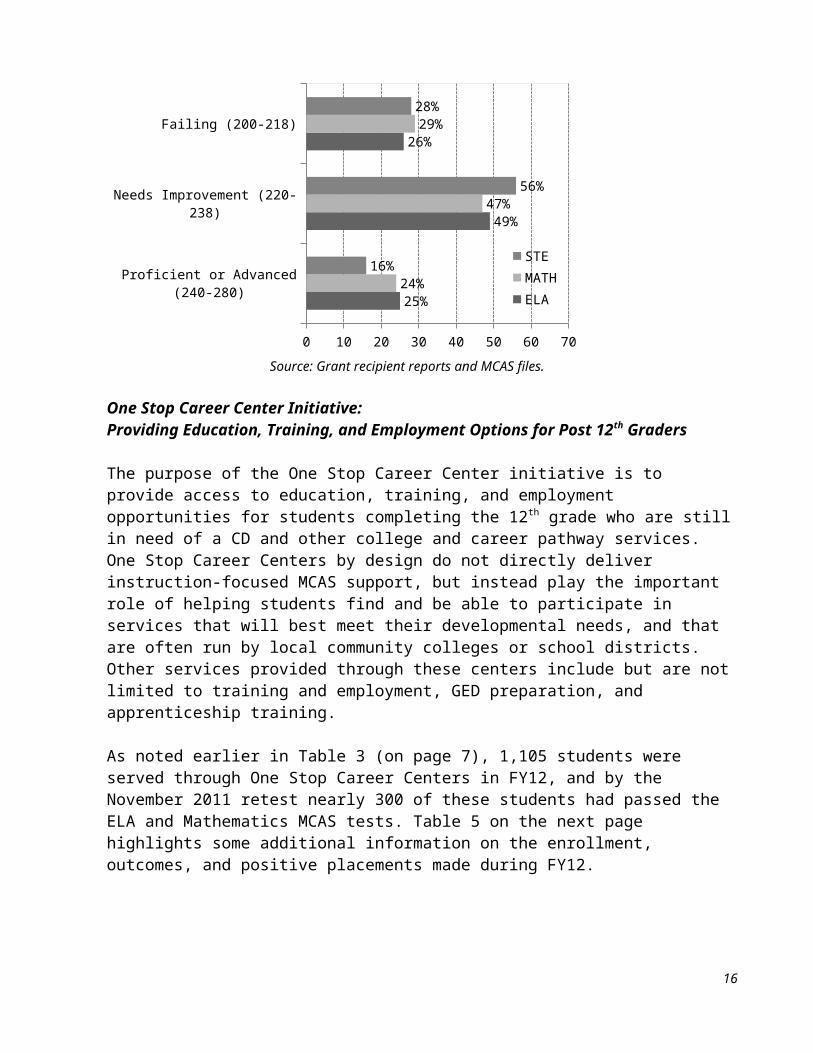
Among students who scored Warning/Failing on the MCAS before entering an ELA program, 25 percent scored Proficient or Advanced following the program. For participants in mathematics and STE programs, the percentage whose scores improved from Warning/Failing pre-program to Proficient or Advanced post-program was 24 and 16 percent, respectively. See Figure 3 for additional details (page 10).
Thirty-six (36) percent of participating students were served in programs that took place before/after-school or evenings, 30 percent during the summer, 29 percent during the school day, and 5 percent during school weekends or vacations.
Fifty-five (55) percent of participating students were served in mathematics, 26 percent in ELA, and approximately 19 percent in STE.
Sixty-two (62) percent of students served received small group instruction (teacher to student ratios of 1:6-10), 25 percent smallest group instruction (1:2-5), 4 percent individual instruction (1:1), and the remaining 9 percent an “other” instructional model.
Instruction-Focused MCAS Support Grant Programs: Post Program MCAS Results
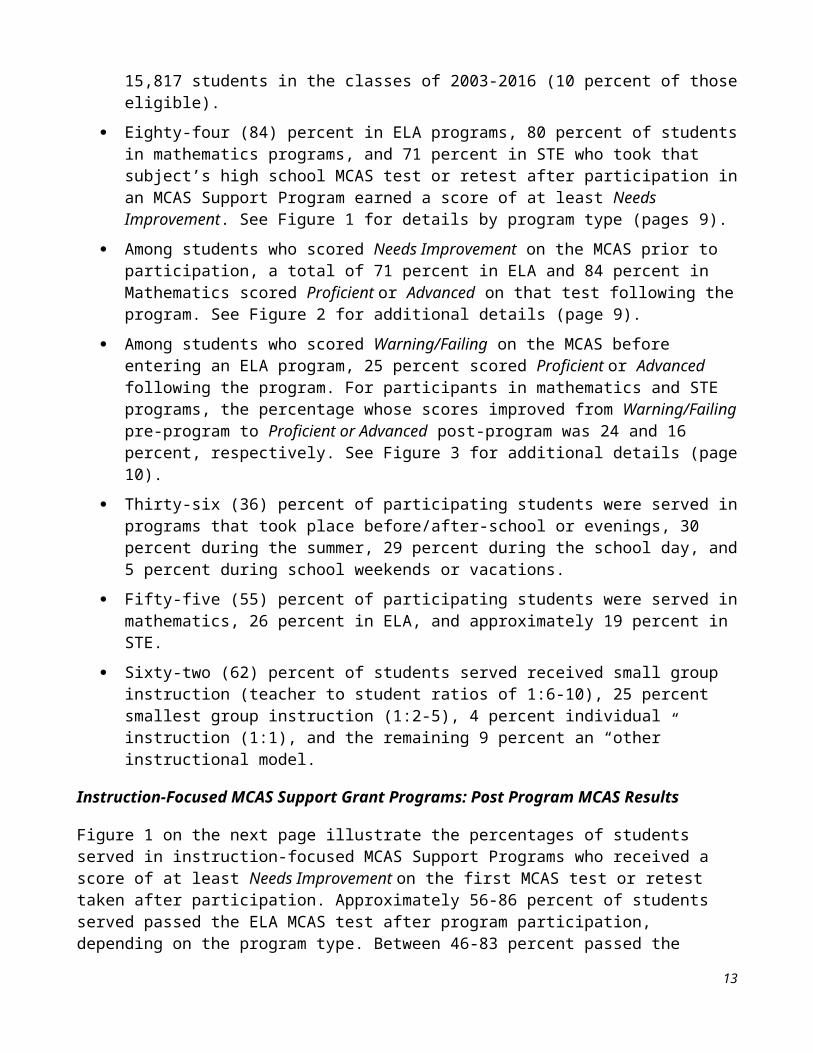
Figure 1 on the next page illustrate the percentages of students served in instruction-focused MCAS Support Programs who received a score of at least Needs Improvement on the first MCAS test or retest taken after participation. Approximately 56-86 percent of students served passed the ELA MCAS test after program participation, depending on the program type. Between 46-83 percent passed the Mathematics MCAS test post-program and 64-72 percent passed the STE MCAS test.
Figure 1: Percentage of MCAS Support Program Participants Scoring at least 220 on Subsequent ELA, Mathematics, STE MCAS Test or Retest in FY12 (for ELA, Math: Classes ’03-’14, for *STE: Classes ’10-’15)
1 Because of the way data is collected for instruction-focused programs, "student" in this section actually refers to record. A student may have more than one record if served in more than one program (e.g., a student may have been served both in an ELA and/or mathematics program run during the school and/or after school).
9
Work and Learning
Higher Ed
Allocation
0% 10% 20% 30% 40% 50% 60% 70% 80% 90% 100%
58%
58%
86%
48%
46%
83%
64%
65%
72%
STEMATH
ELA
Source: Grant recipient reports and MCAS files. Note: CPSS not included due to N < 30 and *STE does not include classes of 2003-2009 due to the waiver.
During FY12, MCAS Support grant programs served an unduplicated total of 2,807 students in ELA and 4,485 in mathematics that scored in the Needs Improvement category prior to the program. Of these, 963 participants in ELA and 2,018 in mathematics took the grade 10 MCAS test after participation, and Figure 2 below shows the post-program performance level for those participants. Overall, 71 percent of students served in ELA and 84 percent served in mathematics scored in the Proficient or Advanced categories.
Figure 2: MCAS Support Programs: Post Program MCAS Performance Levels for Students with Preliminary Scores of Needs Improvement in FY12 (Class of ’13)
Proficient or Advanced (240-280)
Needs Improvement (220-238)
Failing (200-218)
0 10 20 30 40 50 60 70 80 90
71%
28%
<1%
84%
15%
<1%
MATHELA
Source: Grant recipient reports and MCAS files.Note: STE not applicable at the Needs Improvement level, as only Warning/Failing level students were eligible. Only class of 2013 is included because they are the only ones who could meet both relevant criteria: 1) score Needs Improvement pre-program and 2) take the 10th grade MCAS test or retest by November 2012.
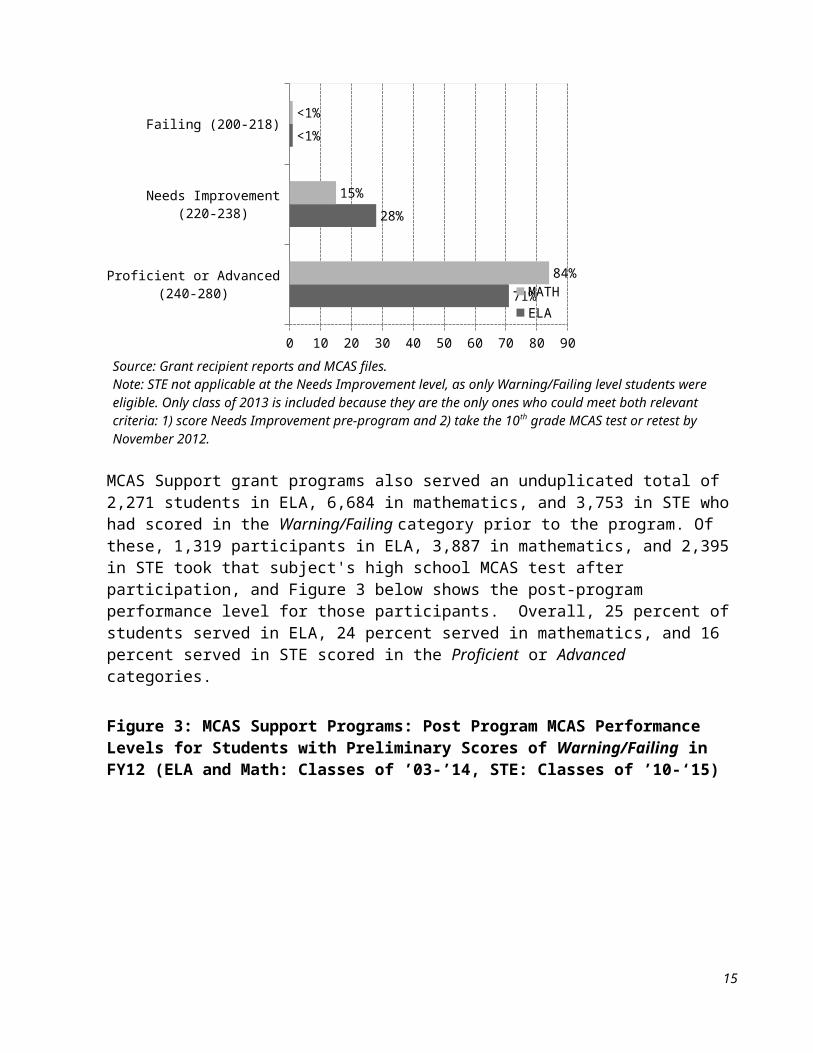
MCAS Support grant programs also served an unduplicated total of 2,271 students in ELA, 6,684 in mathematics, and 3,753 in STE who had scored in the Warning/Failing category prior to the
10
program. Of these, 1,319 participants in ELA, 3,887 in mathematics, and 2,395 in STE took that subject's high school MCAS test after participation, and Figure 3 below shows the post-program performance level for those participants. Overall, 25 percent of students served in ELA, 24 percent served in mathematics, and 16 percent served in STE scored in the Proficient or Advanced categories.
Figure 3: MCAS Support Programs: Post Program MCAS Performance Levels for Students with Preliminary Scores of Warning/Failing in FY12 (ELA and Math: Classes of ’03-’14, STE: Classes of ’10-‘15)
Proficient or Advanced (240-280)
Needs Improvement (220-238)
Failing (200-218)
0 10 20 30 40 50 60 70
25%
49%
26%
24%
47%
29%
16%
56%
28%
STE
MATHELA
Source: Grant recipient reports and MCAS files.
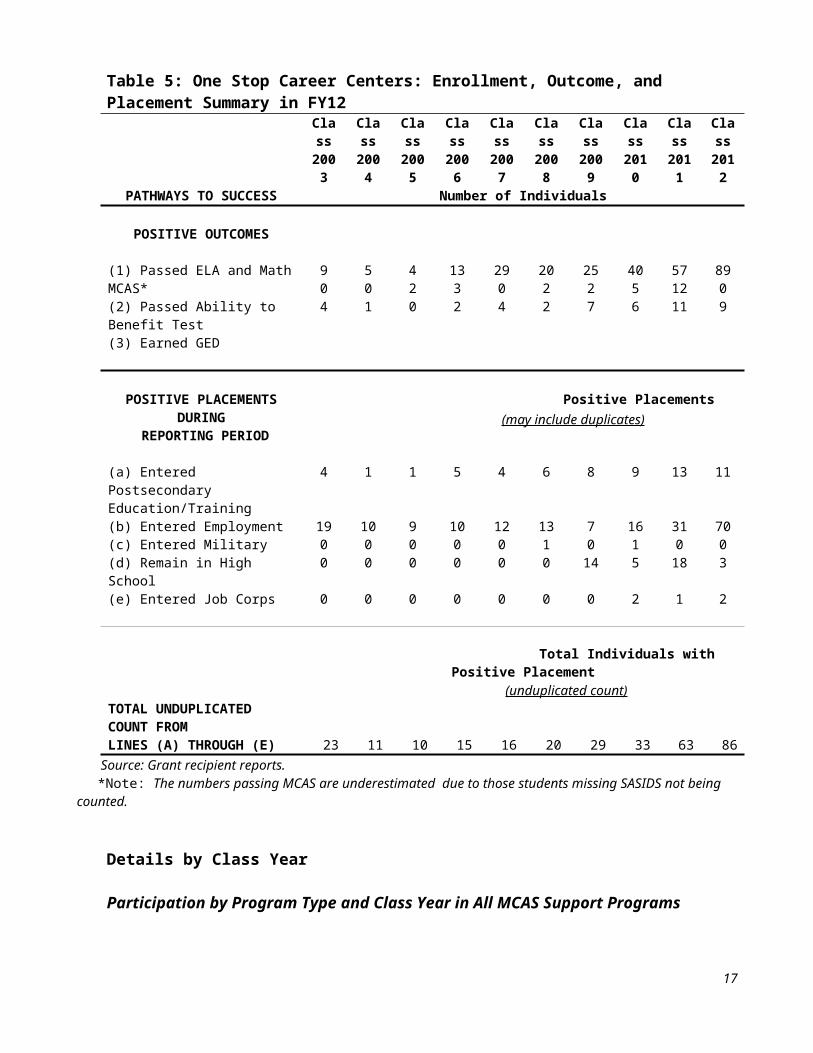
One Stop Career Center Initiative: Providing Education, Training, and Employment Options for Post 12th Graders
The purpose of the One Stop Career Center initiative is to provide access to education, training, and employment opportunities for students completing the 12th grade who are still in need of a CD and other college and career pathway services. One Stop Career Centers by design do not directly deliver instruction-focused MCAS support, but instead play the important role of helping students find and be able to participate in services that will best meet their developmental needs, and that are often run by local community colleges or school districts. Other services provided through these centers include but are not limited to training and employment, GED preparation, and apprenticeship training.
As noted earlier in Table 3 (on page 7), 1,105 students were served through One Stop Career Centers in FY12, and by the November 2011 retest nearly 300 of these students had passed the ELA and Mathematics MCAS tests. Table 5 on the next page highlights some additional information on the enrollment, outcomes, and positive placements made during FY12.
11
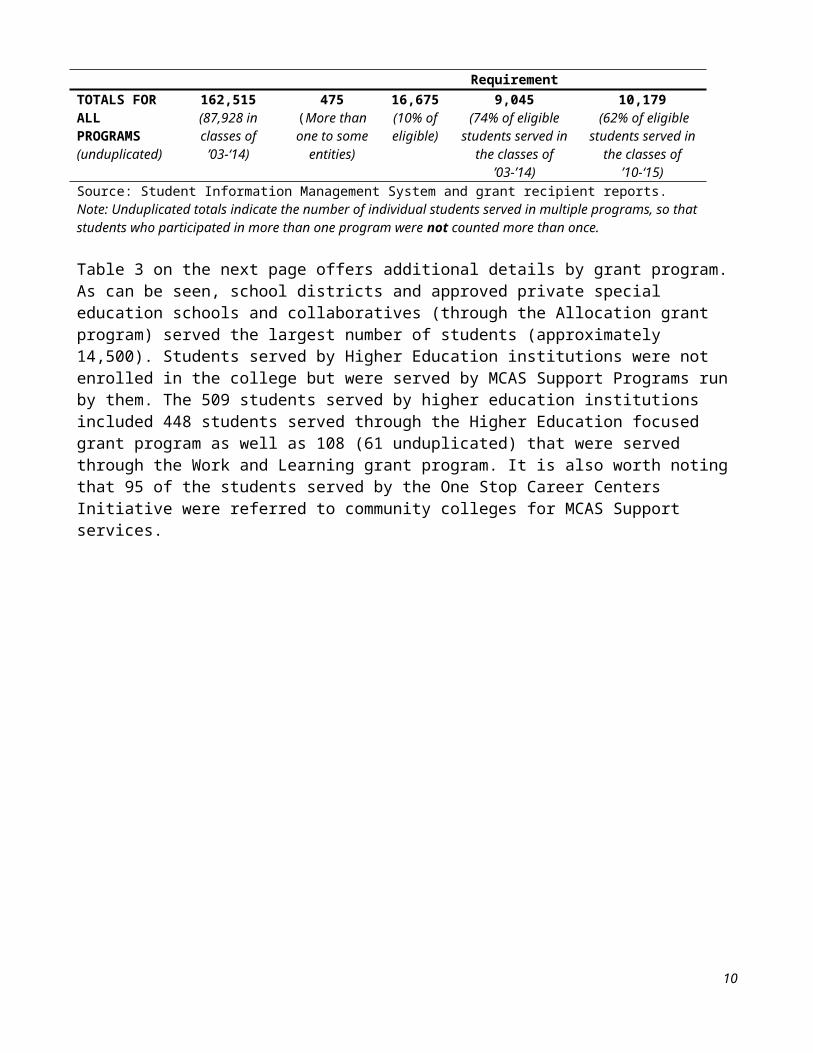
Table 5: One Stop Career Centers: Enrollment, Outcome, and Placement Summary in FY12 Class
2003Class 2004
Class 2005
Class 2006
Class 2007
Class 2008
Class 2009
Class 2010
Class2011
Class2012
PATHWAYS TO SUCCESS Number of Individuals
POSITIVE OUTCOMES
(1) Passed ELA and Math MCAS*(2) Passed Ability to Benefit Test(3) Earned GED
904
501
420
1332
2904
2022
2527
4056
571211
8909
POSITIVE PLACEMENTS DURING REPORTING PERIOD
Positive Placements
(may include duplicates)
(a) Entered Postsecondary Education/Training
4 1 1 5 4 6 8 9 13 11
(b) Entered Employment 19 10 9 10 12 13 7 16 31 70(c) Entered Military 0 0 0 0 0 1 0 1 0 0(d) Remain in High School 0 0 0 0 0 0 14 5 18 3(e) Entered Job Corps 0 0 0 0 0 0 0 2 1 2
Total Individuals with Positive Placement
(unduplicated count)TOTAL UNDUPLICATED COUNT FROMLINES (A) THROUGH (E) 23 11 10 15 16 20 29 33 63 86
Source: Grant recipient reports. *Note: The numbers passing MCAS are underestimated due to those students missing SASIDS not being counted.
Details by Class Year
Participation by Program Type and Class Year in All MCAS Support Programs
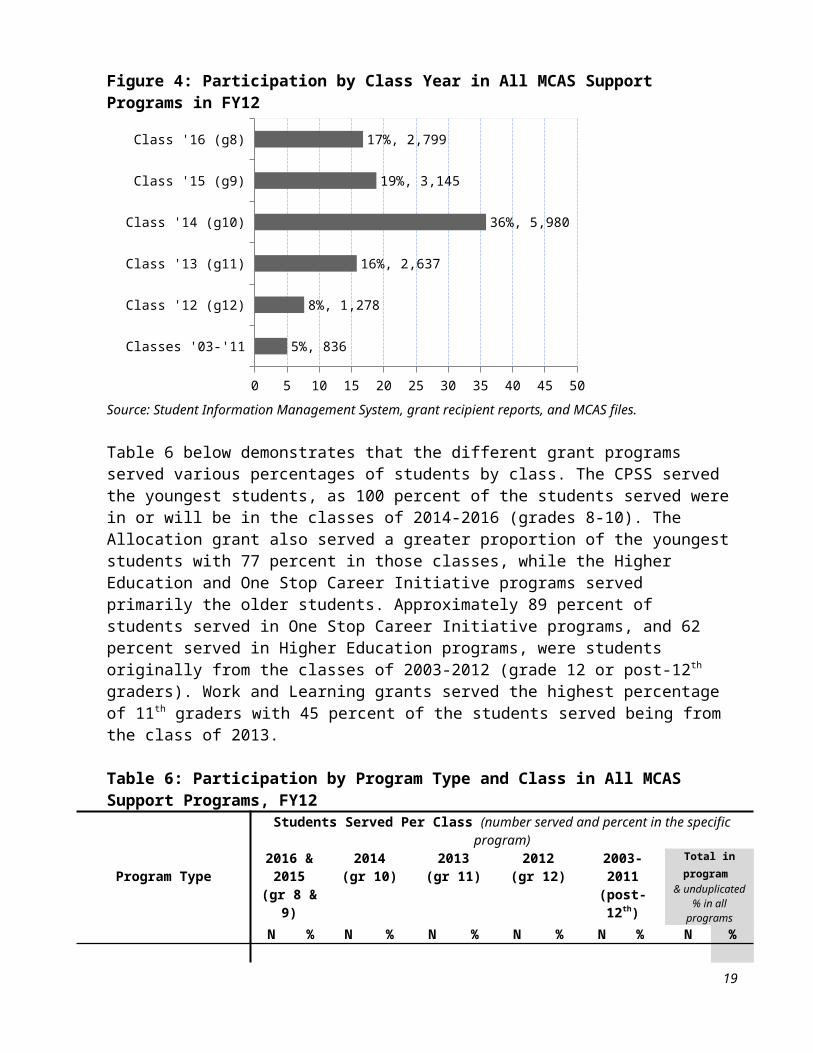
The majority of students served (78 percent) in MCAS Support Programs were from grades 9-12. As can be seen in Figure 4 on the next page, approximately 36 percent of students served were 10th
graders (class of 2014). Almost one-fifth (19 percent) of students served were 9th graders (class of 2015). Other students served included, 12th graders from the class of 2012 (8 percent), 8th graders from the class of 2016 (17 percent) and post-12th graders from the classes of 2003-2011 (5 percent). Collectively, programs were able to serve 16,675 students, which is approximately 10 percent of all eligible students.
12
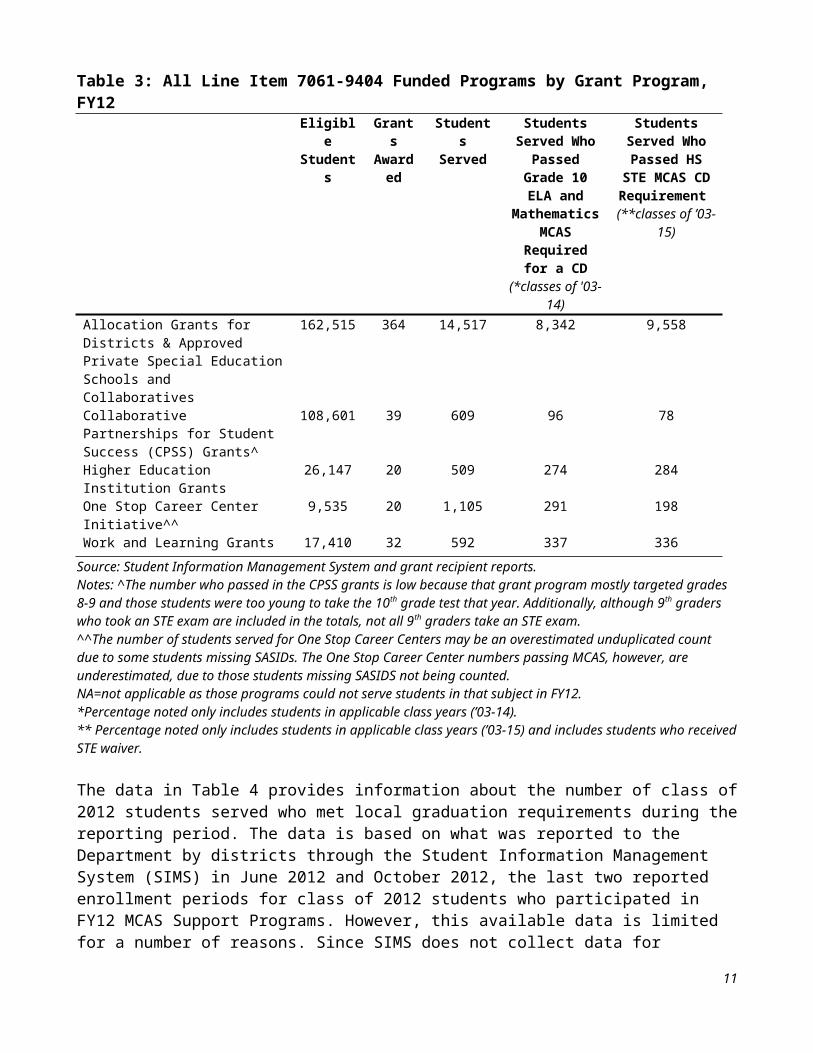
Figure 4: Participation by Class Year in All MCAS Support Programs in FY12
Classes '03-'11
Class '12 (g12)
Class '13 (g11)
Class '14 (g10)
Class '15 (g9)
Class '16 (g8)
0 5 10 15 20 25 30 35 40 45 50
5%, 836
8%, 1,278
16%, 2,637
36%, 5,980
19%, 3,145
17%, 2,799
Source: Student Information Management System, grant recipient reports, and MCAS files.
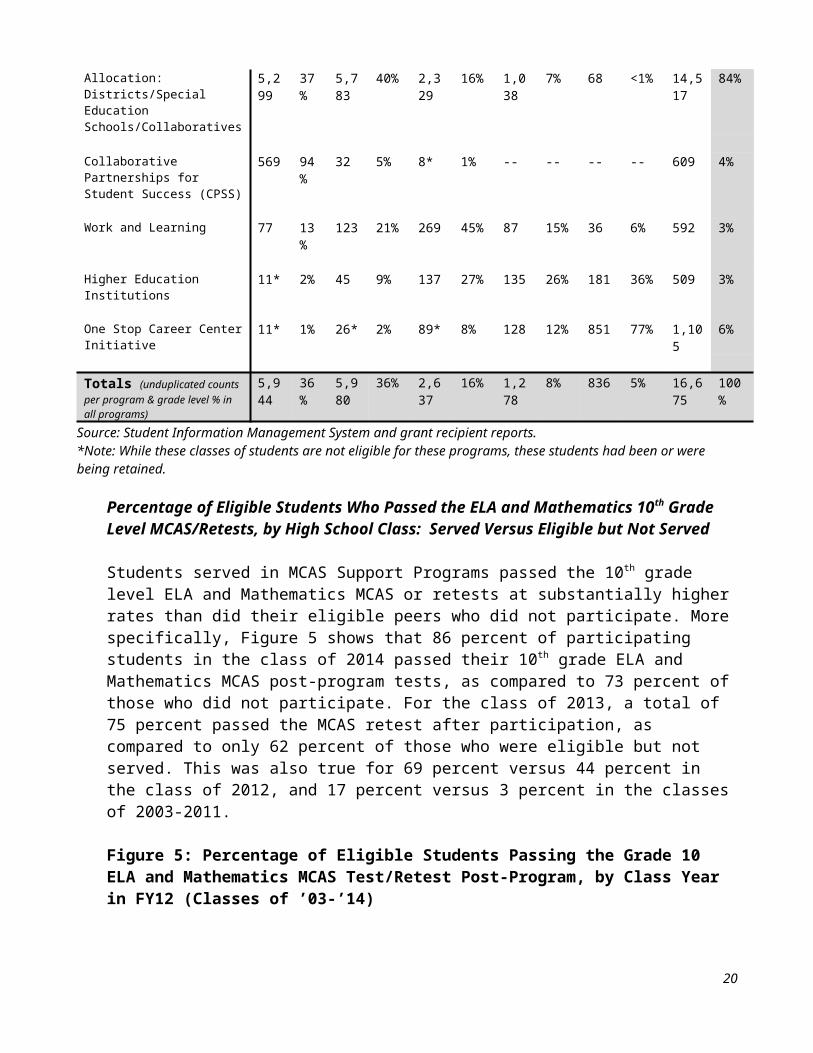
Table 6 below demonstrates that the different grant programs served various percentages of students by class. The CPSS served the youngest students, as 100 percent of the students served were in or will be in the classes of 2014-2016 (grades 8-10). The Allocation grant also served a greater proportion of the youngest students with 77 percent in those classes, while the Higher Education and One Stop Career Initiative programs served primarily the older students. Approximately 89 percent of students served in One Stop Career Initiative programs, and 62 percent served in Higher Education programs, were students originally from the classes of 2003-2012 (grade 12 or post-12th graders). Work and Learning grants served the highest percentage of 11th graders with 45 percent of the students served being from the class of 2013.
Table 6: Participation by Program Type and Class in All MCAS Support Programs, FY12Students Served Per Class (number served and percent in the specific program)
Program Type2016 & 2015
(gr 8 & 9)2014
(gr 10)2013
(gr 11)2012
(gr 12)2003-2011 (post-12th)
Total in program & unduplicated %
in all programs N % N % N % N % N % N %
Allocation: Districts/Special Education Schools/Collaboratives
5,299 37% 5,783 40% 2,329 16% 1,038 7% 68 <1% 14,517
84%
Collaborative Partnerships for Student Success (CPSS)
569 94% 32 5% 8* 1% -- -- -- -- 609 4%
Work and Learning 77 13% 123 21% 269 45% 87 15% 36 6% 592 3%
Higher Education Institutions 11* 2% 45 9% 137 27% 135 26% 181 36% 509 3%
One Stop Career Center Initiative 11* 1% 26* 2% 89* 8% 128 12% 851 77% 1,105 6%
Totals (unduplicated counts per program & grade level % in all programs)
5,944 36% 5,980 36% 2,637 16% 1,278 8% 836 5% 16,675
100%
Source: Student Information Management System and grant recipient reports.*Note: While these classes of students are not eligible for these programs, these students had been or were being retained.
13
Percentage of Eligible Students Who Passed the ELA and Mathematics 10th Grade Level MCAS/Retests, by High School Class: Served Versus Eligible but Not Served
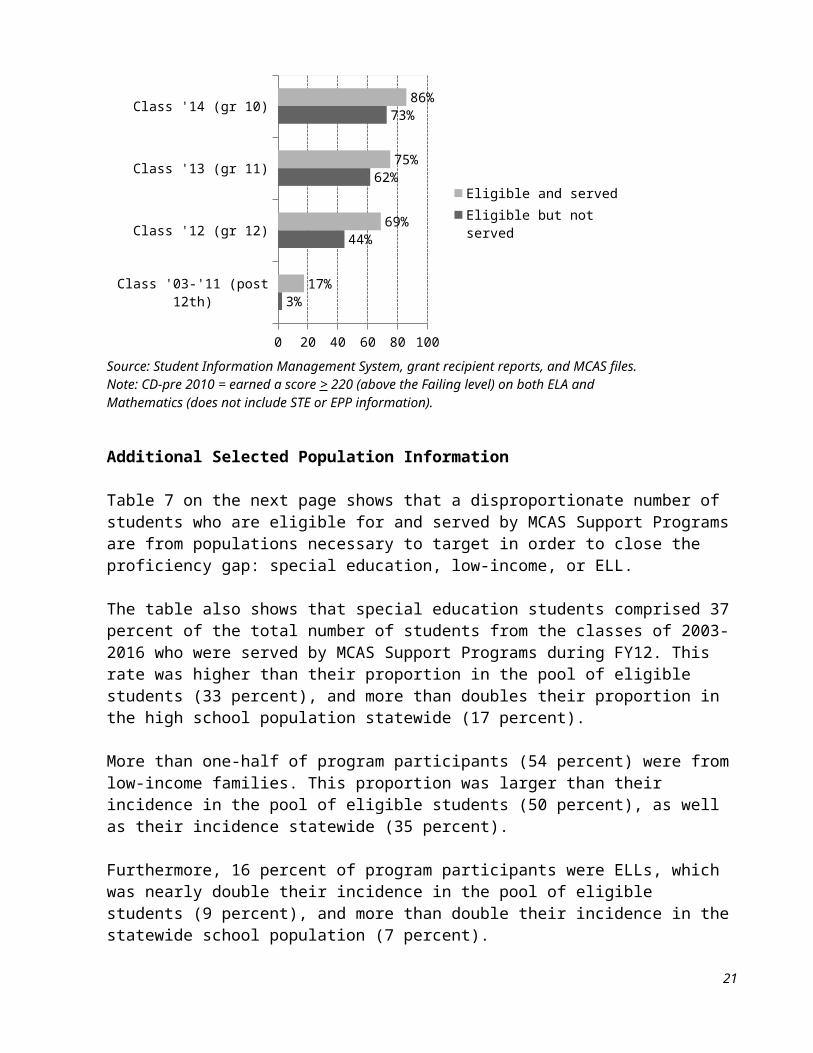
Students served in MCAS Support Programs passed the 10th grade level ELA and Mathematics MCAS or retests at substantially higher rates than did their eligible peers who did not participate. More specifically, Figure 5 shows that 86 percent of participating students in the class of 2014 passed their 10th grade ELA and Mathematics MCAS post-program tests, as compared to 73 percent of those who did not participate. For the class of 2013, a total of 75 percent passed the MCAS retest after participation, as compared to only 62 percent of those who were eligible but not served. This was also true for 69 percent versus 44 percent in the class of 2012, and 17 percent versus 3 percent in the classes of 2003-2011.
Figure 5: Percentage of Eligible Students Passing the Grade 10 ELA and Mathematics MCAS Test/Retest Post-Program, by Class Year in FY12 (Classes of ’03-’14)
Class '03-'11 (post 12th)
Class '12 (gr 12)
Class '13 (gr 11)
Class '14 (gr 10)
0 10 20 30 40 50 60 70 80 90 100
3%
44%
62%
73%
17%
69%
75%
86%
Eligible and servedEligible but not served
Source: Student Information Management System, grant recipient reports, and MCAS files.Note: CD-pre 2010 = earned a score > 220 (above the Failing level) on both ELA and Mathematics (does not include STE or EPP information).
Additional Selected Population Information
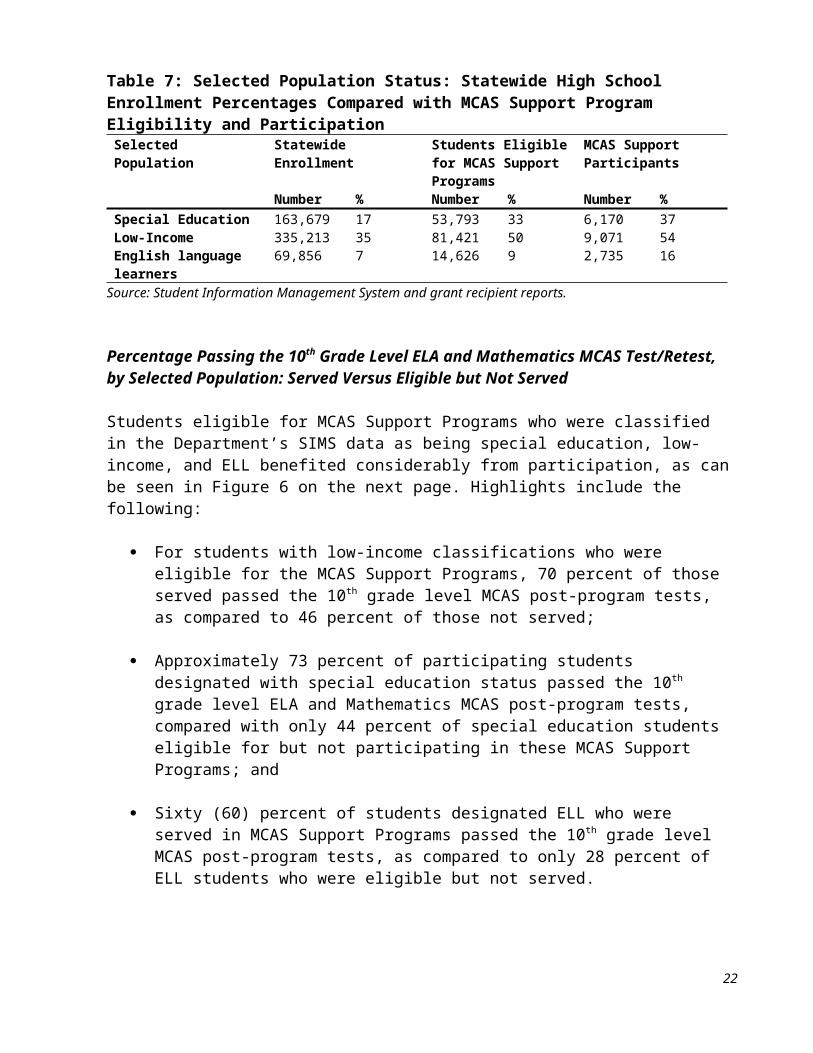
Table 7 on the next page shows that a disproportionate number of students who are eligible for and served by MCAS Support Programs are from populations necessary to target in order to close the proficiency gap: special education, low-income, or ELL.
The table also shows that special education students comprised 37 percent of the total number of students from the classes of 2003-2016 who were served by MCAS Support Programs during FY12. This rate was higher than their proportion in the pool of eligible students (33 percent), and more than doubles their proportion in the high school population statewide (17 percent).
More than one-half of program participants (54 percent) were from low-income families. This proportion was larger than their incidence in the pool of eligible students (50 percent), as well as their incidence statewide (35 percent).
14
Furthermore, 16 percent of program participants were ELLs, which was nearly double their incidence in the pool of eligible students (9 percent), and more than double their incidence in the statewide school population (7 percent).
Table 7: Selected Population Status: Statewide High School Enrollment Percentages Compared with MCAS Support Program Eligibility and Participation
Selected Population Statewide Enrollment Students Eligible for MCAS Support Programs
MCAS Support Participants
Number % Number % Number %Special Education 163,679 17 53,793 33 6,170 37Low-Income 335,213 35 81,421 50 9,071 54English language learners 69,856 7 14,626 9 2,735 16
Source: Student Information Management System and grant recipient reports.
Percentage Passing the 10th Grade Level ELA and Mathematics MCAS Test/Retest, by Selected Population: Served Versus Eligible but Not Served
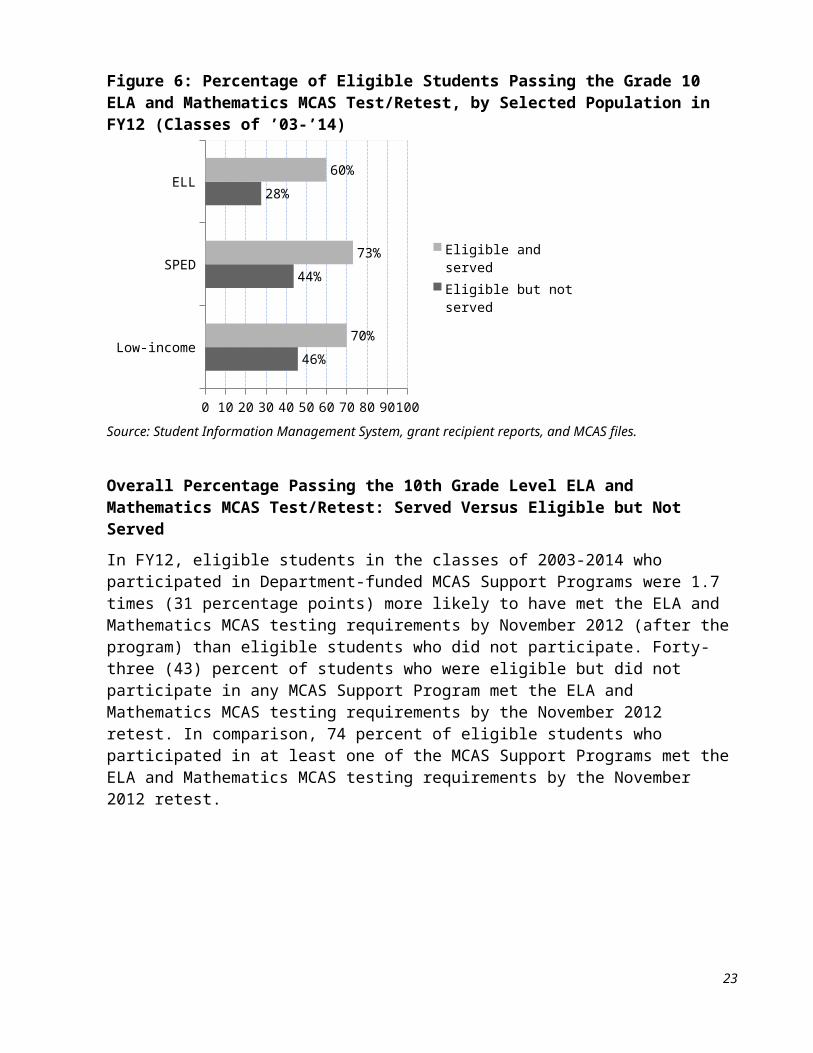
Students eligible for MCAS Support Programs who were classified in the Department’s SIMS data as being special education, low-income, and ELL benefited considerably from participation, as can be seen in Figure 6 on the next page. Highlights include the following:
For students with low-income classifications who were eligible for the MCAS Support Programs, 70 percent of those served passed the 10th grade level MCAS post-program tests, as compared to 46 percent of those not served;
Approximately 73 percent of participating students designated with special education status passed the 10th grade level ELA and Mathematics MCAS post-program tests, compared with only 44 percent of special education students eligible for but not participating in these MCAS Support Programs; and
Sixty (60) percent of students designated ELL who were served in MCAS Support Programs passed the 10th grade level MCAS post-program tests, as compared to only 28 percent of ELL students who were eligible but not served.
15
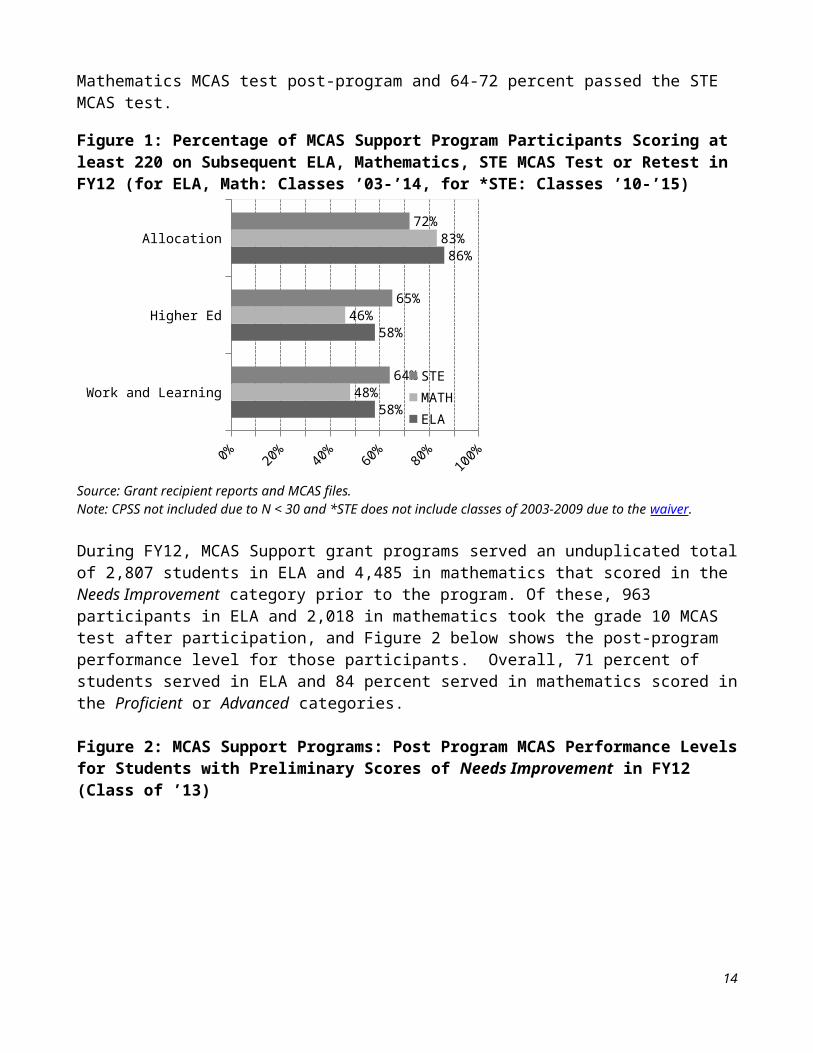
Figure 6: Percentage of Eligible Students Passing the Grade 10 ELA and Mathematics MCAS Test/Retest, by Selected Population in FY12 (Classes of ’03-’14)
Low-income
SPED
ELL
0 10 20 30 40 50 60 70 80 90 100
46%
44%
28%
70%
73%
60%
Eligible and servedEligible but not served
Source: Student Information Management System, grant recipient reports, and MCAS files.
Overall Percentage Passing the 10th Grade Level ELA and Mathematics MCAS Test/Retest: Served Versus Eligible but Not ServedIn FY12, eligible students in the classes of 2003-2014 who participated in Department-funded MCAS Support Programs were 1.7 times (31 percentage points) more likely to have met the ELA and Mathematics MCAS testing requirements by November 2012 (after the program) than eligible students who did not participate. Forty-three (43) percent of students who were eligible but did not participate in any MCAS Support Program met the ELA and Mathematics MCAS testing requirements by the November 2012 retest. In comparison, 74 percent of eligible students who participated in at least one of the MCAS Support Programs met the ELA and Mathematics MCAS testing requirements by the November 2012 retest.
For additional information on programs or this report, visit the Academic Support website http://www.doe.mass.edu/as or contact
the Learning Support Services or College and Career Readiness Units [email protected] or 781-338-3010.
16
APPENDIX A: FY12 MCAS Support Program Highlights
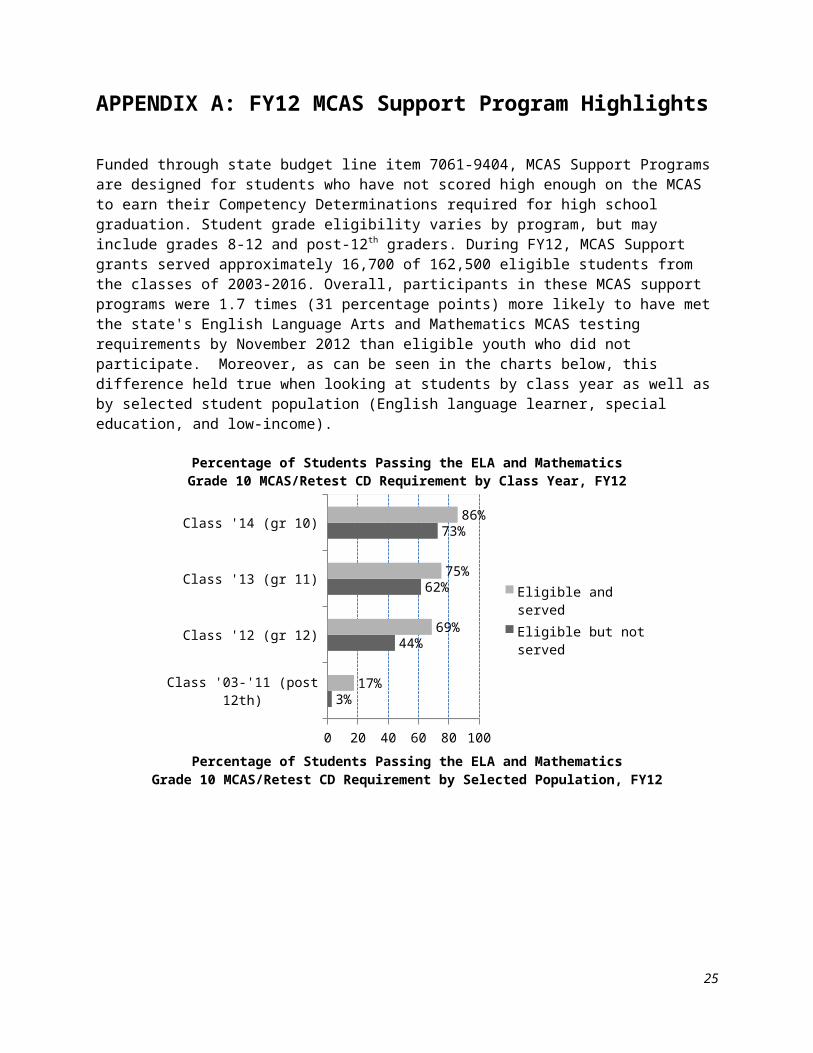
Funded through state budget line item 7061-9404, MCAS Support Programs are designed for students who have not scored high enough on the MCAS to earn their Competency Determinations required for high school graduation. Student grade eligibility varies by program, but may include grades 8-12 and post-12th graders. During FY12, MCAS Support grants served approximately 16,700 of 162,500 eligible students from the classes of 2003-2016. Overall, participants in these MCAS support programs were 1.7 times (31 percentage points) more likely to have met the state's English Language Arts and Mathematics MCAS testing requirements by November 2012 than eligible youth who did not participate. Moreover, as can be seen in the charts below, this difference held true when looking at students by class year as well as by selected student population (English language learner, special education, and low-income).
Percentage of Students Passing the ELA and Mathematics Grade 10 MCAS/Retest CD Requirement by Class Year, FY12
Class '03-'11 (post 12th)
Class '12 (gr 12)
Class '13 (gr 11)
Class '14 (gr 10)
0 10 20 30 40 50 60 70 80 90 100
3%
44%
62%
73%
17%
69%
75%
86%
Eligible and servedEligible but not served
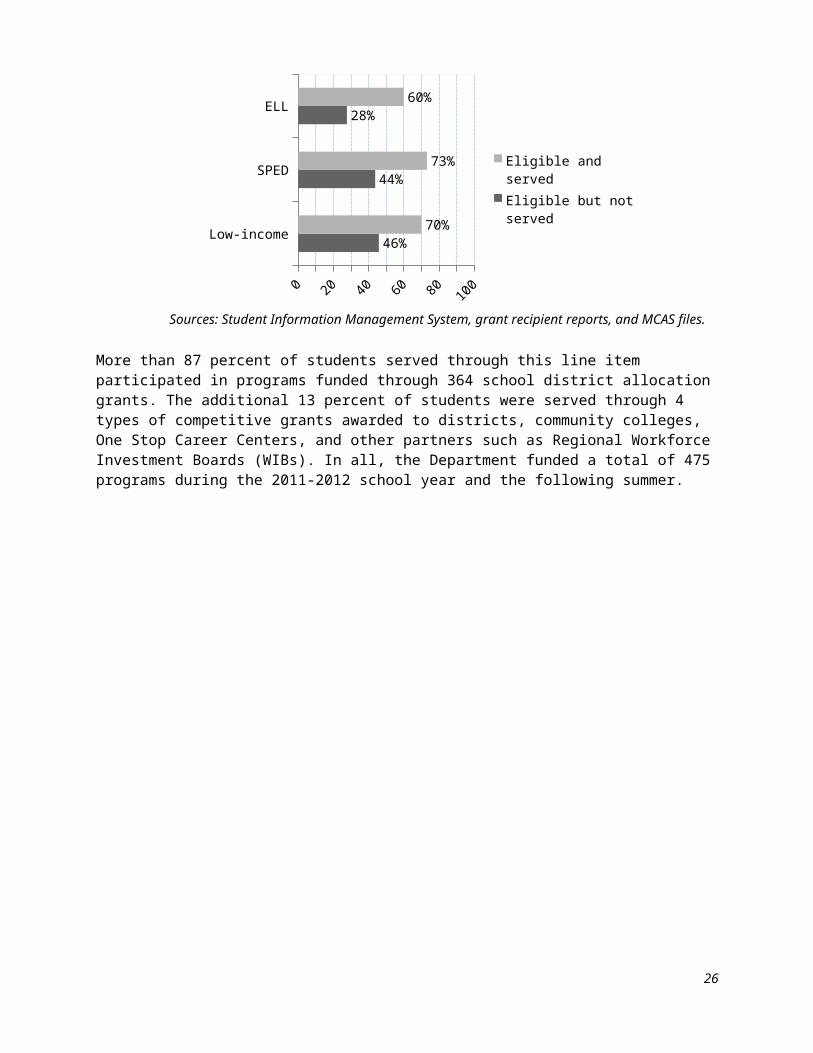
Percentage of Students Passing the ELA and Mathematics Grade 10 MCAS/Retest CD Requirement by Selected Population, FY12
Low-income
SPED
ELL
0 10 20 30 40 50 60 70 80 90 100
46%
44%
28%
70%
73%
60%
Eligible and servedEligible but not served
Sources: Student Information Management System, grant recipient reports, and MCAS files.
More than 87 percent of students served through this line item participated in programs funded through 364 school district allocation grants. The additional 13 percent of students were served through 4 types of competitive grants awarded to districts, community colleges, One Stop Career Centers, and other partners
17
such as Regional Workforce Investment Boards (WIBs). In all, the Department funded a total of 475 programs during the 2011-2012 school year and the following summer.
18
APPENDIX B: Entities Funded for FY12 MCAS Support Programs through Line Item 7061-9404
Allocation Grants to Districts and Approved Private Special Education Schools and Collaboratives (364 grant awards)
SCHOOL YEAR PROGRAMS (2011-2012): Abington Cape Cod Regional Vocational TechnicalActon-Boxborough CarverAdams-Cheshire Central BerkshireAgawam ChathamAmesbury ChelmsfordAndover ChelseaArlington ChicopeeAshburnham-Westminster City on a Hill Charter Public (District)Ashland ClintonAssabet Valley Regional Vocational Technical CohassetAthol-Royalston Collaborative for Educational ServicesAttleboro Community Care ServicesAuburn Compass SchoolAvon DanversBarnstable DartmouthBedford DedhamBellingham Dennis-YarmouthBelmont Dighton-RehobothBerkshire Hills DouglasBeverly Dover-SherbornBillerica DracutBlackstone Valley Regional Vocational Technical Dudley-Charlton Blackstone-Millville DuxburyBlue Hills Regional Vocational Technical East BridgewaterBoston East LongmeadowBourne EasthamptonBraintree EastonBridgewater-Raynham Edward M. Kennedy Academy for Health Careers Bristol County Agricultural Essex Agricultural TechnicalBristol-Plymouth Regional Vocational Technical EverettBrockton Fall RiverBrookline FalmouthBurlington FitchburgCambridge Foxborough
19
Framingham Lowell Middlesex Academy Charter (District)
20
Francis W. Parker Charter Essential (District) Lower Pioneer Valley Educational CollaborativeFranklin LudlowFreetown-Lakeville LunenburgGateway LynnGeorgetown LynnfieldGill-Montague MaldenGlobal Learning Charter Public (District) MarbleheadGloucester MarlboroughGrafton MarshfieldGranby Martha's Vineyard Charter (District)Greater Fall River Regional Vocational Technical MasconometGreater Lawrence Regional Vocational Technical MashpeeGreater Lowell Regional Vocational Technical MaynardGreater New Bedford Regional Vocational Technical MedfieldGreenfield MedfordGroton-Dunstable MedwayHampden-Wilbraham MelroseHampshire MethuenHanover MiddleboroughHarvard MilfordHatfield MillburyHaverhill MillisHingham MiltonHolbrook Minuteman Regional Vocational TechnicalHolliston MonsonHolyoke Mount GreylockHopedale NantucketHopkinton NarragansettHudson Nashoba Valley Regional Vocational TechnicalHull NatickLABBB Collaborative NausetLawrence NeedhamLearning Prep School (Little People's School Inc.) New BedfordLee NewburyportLeicester NewtonLenox North AdamsLexington North AndoverLincoln-Sudbury North AttleboroughLittleton North BrookfieldLongmeadow North Central Charter Essential (District)Lowell North Middlesex
North Reading Springfield
21
North Shore Regional Vocational Technical St Vincent's SchoolNorthampton StonehamNorthampton-Smith Vocational Agricultural StoughtonNorthboro-Southboro Sturgis Charter Public (District)Northbridge SwampscottNorton SwanseaNorwell TantasquaNorwood TauntonOld Colony Regional Vocational Technical TewksburyPalmer Tri County Regional Vocational TechnicalPeabody TritonPembroke TyngsboroughPioneer Valley UxbridgePittsfield WachusettPlymouth WakefieldQuabbin WalpoleQuincy WalthamRalph C Mahar WarehamRandolph WatertownReading WaylandRevere Wayside Academy SchoolRockland WebsterSabis International Charter (District) WellesleySalem West BoylstonSaugus West SpringfieldScituate WestfieldSeekonk WestfordSharon WestonShawsheen Valley Regional Vocational Technical WestportShrewsbury WeymouthSomerset-Berkley Whitman-HansonSomerville Whittier Regional Vocational TechnicalSouth Hadley WilmingtonSouth Middlesex Regional Vocational Technical WinchendonSouthbridge WinchesterSouthern Berkshire WoburnSouthwick-Tolland WorcesterSpencer-E Brookfield
SUMMER 2012 PROGRAMS:
22
Advanced Math and Science Academy Charter (District) GloucesterAmesbury GraftonAmherst-Pelham Greater Lawrence Regional Vocational TechnicalAndover Greater New Bedford Regional Vocational TechnicalAssabet Valley Regional Vocational Technical GreenfieldAthol-Royalston Groton-DunstableAttleboro HatfieldAyer-Shirley HolyokeBerlin-Boylston HudsonBoston HullBoston Collegiate Charter (District) King PhilipBoston Day and Evening Academy Charter (District) KIPP Academy Lynn Charter (District)Braintree LawrenceBridgewater-Raynham LeicesterBristol-Plymouth Regional Vocational Technical LenoxBrockton LeominsterCambridge LongmeadowCanton LowellCarver LunenburgCentral Berkshire MaldenChelmsford Marthas VineyardChicopee MasconometClinton MashpeeCommunity Care Services MedfordDartmouth MiddleboroughDennis-Yarmouth MiltonDevereux School Mohawk TrailDighton-Rehoboth Montachusett Regional Vocational TechnicalDouglas Mount GreylockDover-Sherborn New BedfordDracut New Leadership Charter (District)Dudley-Charlton Reg Norfolk County AgriculturalEaston North AndoverEverett North MiddlesexFramingham North ReadingFranklin Northampton-Smith Vocational AgriculturalFreetown-Lakeville Northboro-SouthboroFrontier Northeast Metropolitan Regional Vocational TechnicalGardner NortonGateway Old Colony Regional Vocational TechnicalGlobal Learning Charter Public (District) Oxford
Palmer South Shore Charter Public (District)
23
Pathfinder Regional Vocational Technical SouthbridgePeabody Southeastern Regional Vocational TechnicalPembroke Spencer-E BrookfieldPentucket SpringfieldPhoenix Charter Academy (District) St Vincent's SchoolPioneer Valley Performing Arts Charter Public (District) TantasquaPittsfield TauntonProvincetown TewksburyQuabbin Tri County Regional Vocational TechnicalQuincy Upper Cape Cod Regional Vocational TechnicalRandolph UxbridgeREADS Collaborative WalpoleRevere WalthamRockland WareSaugus WarehamSeekonk West BoylstonShawsheen Valley Regional Vocational Technical WestfieldShore Educational Collaborative WestportSilver Lake WeymouthSo Worcester County Regional Vocational Technical Whittier Regional Vocational TechnicalSomerset-Berkley WinchendonSomerville WinchesterSouth Coast Educational Collaborative-Swansea WinthropSouth Hadley WoburnSouth Middlesex Regional Vocational Technical Worcester
Competitive Grants for Collaborative Partnerships for Student Success –CPSS (39 grant awards)
SCHOOL YEAR (2011-2012):Everett Public SchoolsFall River Public SchoolsFitchburg Public SchoolsFramingham Public SchoolsGreater Lowell Technical School (Tyngsborough)Holyoke Public SchoolsLowell Public SchoolsMalden Public SchoolsNewton Public SchoolsNorth Adams Public Schools
Northbridge Public SchoolsQuincy Public SchoolsRandolph Public SchoolsSalem Public SchoolsSomerville Public SchoolsTewksbury Public SchoolsUpper Cape Cod Regional Vocational School (Bourne)Wareham Public SchoolsWestport Public SchoolsWorcester Public Schools
24
SUMMER 2012:Everett Public SchoolsFall River Public SchoolsFitchburg Public SchoolsFramingham Public SchoolsGreater Lowell Technical School (Tyngsborough)Holyoke Public SchoolsLowell Public SchoolsMalden Public SchoolsNewton Public SchoolsNorth Adams Public SchoolsNorthbridge Public SchoolsQuincy Public SchoolsRandolph Public SchoolsSalem Public SchoolsSomerville Public SchoolsTewksbury Public SchoolsUpper Cape Cod Regional Vocational School (Bourne)Wareham Public SchoolsWestport Public SchoolsWorcester Public Schools
Competitive Grants for Work and Learning Programs (32 grant awards)
SCHOOL YEAR (2011-2012):Athol-Royalston Regional School DistrictBoston Private Industry CouncilBristol Community College (Fall River)Bristol Workforce Investment Board (Fall River)Brockton Public SchoolsCollaborative for Educational Services (Easthampton)Community Care ServicesFall River Public SchoolsGreater New Bedford Workforce Investment BoardHolyoke Community CollegeMount Wachusett Community College (Gardner)New Bedford Regional Vocational Technical High SchoolNorth Shore Education Consortium (Beverly)Pittsfield Public SchoolsRandolph Public SchoolsTaunton Area School to Career, Inc.Worcester Public Schools
25
26
SUMMER 2012:Attleboro Public SchoolsBoston Private Industry CouncilBristol Workforce Investment Board (Fall River)Brockton Public SchoolsChelsea Public SchoolsCollaborative for Educational Services (Northampton)Community Care Services, Inc. (Taunton)Greater New Bedford Regional Vocational Technical High SchoolGreater New Bedford Workforce Investment BoardHolyoke Community CollegePittsfield Public SchoolsRandolph Public SchoolsRegional Employment Board of Hampden County, Inc. (Springfield)Taunton Area School to Career, Inc.Worcester Public Schools
Competitive Grants for Higher Education Institutions (20 grant awards)
SCHOOL YEAR (2011-2012) and SUMMER 2012:Bristol Community College Bunker Hill Community College Holyoke Community College Massasoit Community College Middlesex Community College Mount Wachusett Community College North Shore Community College Quinsigamond Community CollegeRoxbury Community College Springfield Technical Community College
Competitive Grants for One Stop Career Centers (20 grant awards)
SCHOOL YEAR (2010-2011) AND SUMMER 2011Boston Private Industry Council (3 One Stop Career Centers)Bristol Workforce Investment Board (Fall River)City of Worcester/Workforce CentralEmployment Links, Inc. (Leominster)Franklin/Hampshire Employment and Training (Northampton)Greater New Bedford Workforce Investment BoardLawrence Department of Training and DevelopmentMiddlesex Community College (Bedford)Regional Employment Board of Hampden County (Springfield) (2 One Stop Career Centers)University of Massachusetts Donahue Institute/Career Works
27
APPENDIX C: Additional Information on Data Used in Report
ELIGIBILITY
Students eligible for these programs included individuals across the state from the classes of 2003-2016 (grade 8 through post-12th graders) who scored Warning/Failing (level one) on the 10th grade level MCAS ELA and/or Mathematics MCAS test or retests, or on the 7 or 8th grade ELA and/or Mathematics MCAS tests (for students who had not yet taken the 10th grade level tests). Class of 2012-2016 students (grades 8-12) who scored Needs Improvement (level two) on their most recent ELA or Mathematics MCAS were also eligible for services, as were students in grades 8-12 who scored Warning/Failing on their most recent Science and Technology/Engineering (STE) MCAS test. Class year eligibility varied by grant program.
In this report, student eligibility numbers were primarily determined from information provided by the Department’s Student Assessment unit. The number of students in the classes of 2003-2016 reported to be eligible for MCAS Support Programs in FY12 was based on the “Current HS CD File captured on December 7, 2011, and “Historical HS CD File” captured on June 2, 2011, which included MCAS results through June 2011. For students in the class of 2016 (grade 8), eligibility was based on the “2011 MCAS megafile” captured on October 3, 2011.
The numbers listed under the competitive grant programs were limited to the eligible students in the districts served by the organizations awarded grants. Students were not included in eligibility counts if they were no longer in the system, as indicated by their status distinctions in data collected from districts in June 2011 through SIMS. Students eliminated from eligibility included those who graduated with a Competency Determination, permanent exclusions, drop outs, and deceased students.
LOCAL GRADUATION REQUIREMENTS / CERTIFICATE OF ATTAINMENT
The number of students reported as meeting local graduation requirements and earning Certificates of Attainment (CA) was based on data reported by districts through SIMS in June 2012 and October 2012. Any student who may have graduated with a CD or CA after this time was not included. Moreover, students who were no longer enrolled in high school (from the classes of 2003-2011) were not included in SIMS during FY12. As a result, for these post-12th grade students, it could not be determined if they had met local graduation requirements or not.
NOTE: A CA is what districts have the option of awarding to students who have met local graduation requirements but have not yet earned a CD. Not all districts award Certificates of Attainment.
28
MCAS SUPPORT PROGRAM DATA COLLECTION
Entities receiving any of the MCAS Support Program grants were required to submit student level data to the Department on all school year and summer participants. Data collected on each individual served included SASID number; first, last, and middle name; class year; and school. All grantees except those in the One Stop Career Center Initiative, also submitted information on each student served detailing the number of hours of service, the instructional model, and the student’s participation status.
COMPETENCY DETERMINATION AND MCAS COMPARISON DATA
Information noting who passed the 10th grade ELA and Mathematics and 9th/10th grade STE MCAS after program participation was based on testing data that included data through the November 2012 retest from the file "Historical High School CD File" captured on March 20, 2013. To determine passing rates of students served versus students not served, MCAS information from this February file was merged with all student information submitted via the MCAS Support Data Collection and also with information on students in the eligibility file described in the first section of this Appendix C. Only students in the classes of 2003-2014 who had not already earned a score at or above 220 on both the 10th grade level ELA and Mathematics MCAS were included in the post-program MCAS comparisons, as students from the classes of 2015-2016 were not yet in a high enough grade to have taken (and passed) those MCAS tests.
POST 12th GRADERS
This report considered students to be “post 12th graders” if they completed grade 12 before September 2011; it did not include the students who completed 12th grade during FY12. Class year data was based off of the last year in which they were reported in SIMS as grade 12. For students who dropped out and/or never enrolled in grade 12 (because they were retained in previous grade) the class year was estimated based on their last year in grade 9, 10, or 11.
SELECTED POPULATION DATA
Selected population data (e.g., special education, low-income, and English language learner status) was based on SIMS data from the October 2012 collection. Students were considered to be low-income if SIMS identified their family as qualifying for school lunches at a free or reduced price. SIMS data used was from June 2003 for students in the class of 2003, from June 2004 for students in the class of 2004, from June 2005 for students in the class of 2005, from June 2006 for students in class of 2006, from June 2007 for students in the class of 2007, from June 2008 for students in class of 2008, from June 209 for class of 2009, from June 2010 for class of 2010, from June 2011 for class of 2011, from June 2012 for class of 2013, and from October 2012 for students in the classes of 2013-2016. Statewide enrollment percentages were based on the 2011-2012 Statewide Enrollment Selected Populations Profiles page: http://profiles.doe.mass.edu/state_report/selectedpopulations.aspx?mode=district&year=2012&Continue.x=8&Continue.y=7
29
APPENDIX D: Full Language for Chapter 68 of the Acts of 2011, Line Items 7061-9404 and 7027-0019
7061-9404 MCAS LOW-SCORING STUDENT SUPPORTFor grants to cities, towns and regional school districts to provide targeted remediation programs for students in the classes of 2003 to 2016, inclusive, scoring in level 1 or 2 on the Massachusetts comprehensive assessment system, MCAS, exam established by the board of elementary and secondary education pursuant to the provisions of sections 1D and 1I of said chapter 69 of the General Laws; provided, that the department and districts shall ensure that services are available to students with disabilities; provided further, that in awarding remediation funds, preference may be given to schools and districts at risk of or determined to be under-performing in accordance with said sections 1J and 1K of said chapter 69; provided further, that the purpose of this program shall be to improve students' performance on the MCAS exam through replication of services and educational strategies with proven results as determined by the department of elementary and secondary education; provided further, that such programs shall supplement currently funded local, state and federal programs at the school or district; provided further, that funds shall be expended for a competitive grant program to fund academic support and college transition services to be implemented in fiscal year 2012, and operated by public institutions of higher learning or by public-private partnerships in the commonwealth, for students in the graduating classes of 2003 to 2014, inclusive, who may have completed all other high school requirements but have not yet obtained a competency determination as defined in said section 1D of said chapter 69 as measured by the MCAS assessment instrument authorized by said section 1I of said chapter 69, but who are working to pass the English, math, and Science, Technology, and Engineering MCAS tests, obtain a competency determination and earn a high school diploma; provided further, that for the purpose of the programs, appropriated funds may be expended through August 31, 2012, to allow for summer remediation programs; provided further, that not less than $200,000 shall be expended for JFY Networks for the purposes of enhancing student performance and addressing achievement gaps through the use of instructional software, teacher training, and support; provided further, that funds shall be expended for competitive grants to fund Pathways programs targeting students in the graduating classes of 2003-2015, instituted by local school districts, public institutions of higher education and qualified public and private educational services organizations and One Stop Career Centers including, but not limited to, school-to-work connecting activities, creating worksite learning experiences for students as an extension of the classroom, outreach programs for students who will need post-twelfth grade remediation to attain the skills necessary to pass MCAS and counseling programs to educate parents and high school students on post-twelfth grade remediation options; provided further, that funds shall be expended for a competitive grant program, guidelines for which shall be developed by the department of elementary and secondary education, for intensive remediation programs in communities with students in the graduating classes of 2003 to 2016, inclusive, who have not obtained a competency determination or have scored in levels 1 or 2 on either the English or math MCAS exams or level 1 on Science, Technology and Engineering MCAS; provided further, that the department of elementary and secondary education may give preference for such assistance to those districts with a high percentage of high school students scoring in level 1 on the MCAS exam in English, math and Science, Technology and Engineering; provided further, that eligible applicants shall
30
include individual high schools, and those institutions which shall have partnered with a high school or group of high schools; provided further, that no district shall receive a grant from this appropriation until the district submits to the department of elementary and secondary education a comprehensive district plan pursuant to the provisions of said section 1I of said chapter 69, to improve performance of all student populations including, but not limited to, students with disabilities; provided further, that any evaluation will examine the likelihood and efficiency of replication of these programs and practices in school districts with a large percentage of English language learners; provided further, that these funds may be expended for professional development related to these programs; provided further, that the department shall issue a report not later than February 2, 2012, as a condition of continued funding under this account, in collaboration with the department of higher education, describing MCAS support programs for the graduating classes of 2003 to 2016, inclusive, funded by [7061-9404] and 7027-0019, school to work accounts, institutions of public higher education and other sources, including federal sources; provided further, that such report shall include, but not be limited to, the number of students eligible to participate in such programs, the number of students participating in such programs, the number of students who have passed the MCAS assessment and obtained a competency determination through these programs but not met local graduation requirements and the number of students who have passed the MCAS assessment and obtained a competency determination through these programs and met local graduation requirements; provided further, that said report shall be provided to the chairs of the house and senate ways and means committees and the house and senate chairs of the joint committee on education; provided further, that any grant funds distributed from this item to a city, town or regional school district shall be deposited with the treasurer of such city, town or regional school district and held in a separate account and shall be expended by the school committee of such city, town or regional school district without further appropriation, notwithstanding any general or special law to the contrary; and provided further, that no funds shall be expended for personnel costs. $9,575,175
7027-0019 SCHOOL-TO-CAREER CONNECTING ACTIVITIES For school-to-career connecting activities; provided, that notwithstanding any general or special law to the contrary, the board of elementary and secondary education, in cooperation with the department of workforce development and the state workforce investment board, may establish and support a public-private partnership to link high school students with economic and learning opportunities on the job as part of the school-to-work transition program; provided further, that such program may include the award of matching grants to workforce investment boards or other local public-private partnerships involving local community job commitments and work site learning opportunities for students; provided further, that the grants shall require at least a 200 [percent] match in wages for the students from private sector participants; provided further, that the program shall include, but not be limited to, a provision that business leaders commit resources to pay salaries, to provide mentoring and instruction on the job and to work closely with teachers; provided further, that public funds shall assume the costs of connecting schools and businesses to ensure that students serve productively on the job; and provided further, that no funds shall be expended for personnel costs, prior appropriation continued. $750,000*
*A supplemental appropriation, Chapter 9 of the Acts of 2011, made an additional $2,000,000 available for 7027-0019 that was used during fiscal year 2012 as well.
31