Embed Size (px)
Citation preview
MC/INF/278 Original: English 20 October 2005
NINETIETH SESSION ___________________________________________________________________________
HUMAN RESOURCES REPORT

MC/INF/278 Page i
CONTENTS
Page I. INTRODUCTION ….……………………………………….………..……… 1 II. SELECTION AND RECRUITMENT PRACTICES…………………….… 1
Recruitment ….………..…………….……………………………………… 1 Staffing tools ………….…………….……………………………………… 1 Secondments …..…………………………………………………………… 1 Internship Programme ……..………………..……………………………… 2 Associate Experts ……..……………………………………………….…… 2
III. CURRENT PRACTICES AND RECENT DEVELOPMENTS IN WORKING CONDITIONS ………………………………………….……… 2
Harmonization of conditions of service for General Service Field Staff….... 2 Transfer of Compensation Plan and Migrants’ Insurance claims processing to Manila………….…………………………………...……… 3
IV. OCCUPATIONAL HEALTH ………………….………………….………… 3 V. HUMAN RESOURCES MANAGEMENT SYSTEM (PRISM) ……...…... 4 VI. STAFF DEVELOPMENT AND LEARNING…..…….……….…………… 5 VII. PERFORMANCE DEVELOPMENT SYSTEM ……………….………… 5 VIII. JOB CLASSIFICATION ………..……………………….………………… 6 IX. STAFF RELATIONS ….……..……………………………………………… 6 ANNEX - Statistical Overview

MC/INF/278 Page 1
HUMAN RESOURCES REPORT I. INTRODUCTION 1. The number of staff employed by the Organization and the number of offices and locations around the world continued to grow significantly in the past year. Total staff numbered 4,945 at the end of June 2005, representing an increase of 20 per cent in the last year (compared with 15 per cent the previous year). The number of Field locations increased from 208 to 248 during the same period. 2. Highlights of Human Resources Management (HRM) activities this year were the continuation and consolidation of human resources functions delocalized to Manila and the work carried out in relation to the new human resources management system, Processes and Resources, Integrated Systems Management (PRISM), which will not only replace the old payroll system (SIGAGIP) but will enhance the entire HRM reporting and management process as of 1 January 2006. The new system is being introduced pursuant to the recommendations of the External Auditors. II. SELECTION AND RECRUITMENT PRACTICES Recruitment 3. The Staffing Unit (STU) conducted a thorough review of the recruitment process for General Service Staff in Geneva and Professional Staff worldwide, with the aim of shortening the time between a vacancy notice being issued and the post being occupied. The implementation of the resulting action points started in July 2005. By way of follow-up and ongoing improvement, STU will conduct annual or topic-specific surveys of the processes and services provided so as to ensure a quality client-oriented approach. Staffing tools 4. During the year, there was a substantial increase in the number of short-term vacancy notices and recruitments on short-term contracts. This was due to the implementation of several emergency and post-conflict operations, especially the out-of-country voting projects and in tsunami-affected countries, Sudan and Afghanistan. In response to the growing demand for highly specialized staff, the IOM emergency roster of qualified candidates was redesigned and updated as a more comprehensive database that allows for more efficient, rapid and focused searches. The roster is expected to be further enhanced and developed when PRISM is introduced next year. STU has also reinforced and is expanding its emergency recruitment network with various specialized registers such as CANADEM, RedR and Mango. Secondments 5. The loan of staff has continued to enhance cooperation with other organizations and provide opportunities for training and mentoring of IOM staff. Since July 2004, 12 staff members have been seconded to IOM by the Swiss Agency for Development and Cooperation, the Danish Refugee Council, the Norwegian Refugee Council, the Swedish International Development Cooperation Agency, the United States Departments of State and of Homeland

MC/INF/278 Page 2
Security and the German Ministry of the Interior/Federal Agency for Migration and Refugees. The seconded staff made an important contribution to the successful implementation of IOM’s post-conflict operations in several regions. IOM, for its part, has seconded four staff members to OCHA, UNDP, the United Nations Joint Logistics Centre and the World Bank respectively. Internship Programme 6. In order to increase the number of qualified interns, IOM is concluding more agreements with universities and institutions, such as the University of Pisa, Duke University and Fletcher University. Universities which already have agreements with IOM are also proposing to expand existing programmes, one example being the Spring Internship Programme of Georgetown University Law Center. The Internship Programme is proving to be a steady and valuable source of support for the Organization and its pool of expertise. Associate Experts 7. In early 2005, 16 Associate Experts were deployed within IOM. By the end of the year, nine of the 16 positions involved will be situated in Missions and MRFs in Africa, which attracts interest from donor countries. Administrative procedures are being finalized for seven newly appointed Associate Experts, who will be travelling to their duty stations between mid-October and mid-November 2005, bringing the total number to 23. IOM was able to retain four Associate Experts during the reporting period. Contributions for this programme currently come from seven Member States (Belgium, Germany, Italy, Japan, the Netherlands, Sweden and the United States of America) and from the Organisation Internationale de la Francophonie, but negotiations have been conducted to attract new Member States and thus to afford other young professionals the opportunity to start their international careers. In line with ECOSOC resolution 849 (XXXII), the Associate Experts are given an opportunity to gain experience in the field of international cooperation under the leadership of senior IOM professionals and by means of a structured learning experience. They are usually assigned to IOM Missions in developing countries and work on projects in all IOM service areas, thus contributing to the economic and social advancement of least developed countries. 8. In April 2004 the IOM Statistical Report on the Associate Expert Programme, covering the period from 2001 to 2003, was presented at the meeting of National Recruitment Services and United Nations Organizations on Associate Expert/Junior Professional Officer/Associate Professional Officer programmes held in Copenhagen. The Report revealed that IOM retained over 70 per cent of its Associate Experts, one of the highest rates among receiving agencies. It was the first in a series that will be issued regularly in response to a request from donor countries. III. CURRENT PRACTICES AND RECENT DEVELOPMENTS IN WORKING
CONDITIONS Harmonization of conditions of service for General Service Field Staff 9. The Manila Human Resources Operations Unit (MHRO) was established in March 2005 and has incorporated the Field Personnel Unit (FPU), which had already been delocalized from Headquarters.

MC/INF/278 Page 3 10. Conditions of service continued to be harmonized in all Field Missions during the reporting period. Staff Regulations and Rules (SRRs) were implemented in three new Missions, and updated in another four in order to bring them closer to “standard conditions”. The Medical Service Plan (MSP) was introduced in six and the Provident Fund in four additional Missions. The total number of participants in the MSP increased by 318 in one year: 285 are new participants in the six Missions that joined during the period and the remainder represent increased participation in the Missions where the MSP was already available. 11. By harmonizing conditions of service, the Organization is meeting its commitment to streamline social security coverage and other human resources practices, and to promote equal treatment/non-discriminatory policy. The aim is to lower the number of grievances and reduce the costs associated with the administration and maintenance of different systems across the Organization. Transfer of Compensation Plan and Migrants’ Insurance claims processing to Manila 12. Following the delocalization of Health Insurance and MSP claims processing, claims processing for the Compensation Plan (related to occupational accidents and illnesses) and Migrants’ Insurance was also transferred to Manila. The Compensation Plan has been administered in Manila since January 2005, with essential support being provided to all Missions. The insurance bulletin describing the Plan’s benefits and administration was updated and re-issued in December 2004 to reflect the latest changes. This allowed for streamlined service delivery to the staff members benefiting from the Plan. IV. OCCUPATIONAL HEALTH 13. The Occupational Health Unit (OHU), which now reports to HRM, is responsible for promoting the health of IOM staff worldwide. The Organization’s increasing involvement in humanitarian crises has exposed staff to additional health risks and high levels of stress. Some examples in this reporting period are the Darfur and the tsunami emergencies. 14. In view of the growing number of IOM staff worldwide, OHU decided to delocalize some of its activities to Manila. Thanks to the Medical Officer employed in Manila since 2002 and to his recently appointed administrative assistant (2004), OHU was able to respond more quickly worldwide. 15. During this period, OHU continued its endeavours to ensure best practices (fitness to work, travel briefing, medical clearance for insurance transfer, emergency evacuations) for IOM staff worldwide. The long-term aim being to optimize staff health, additional efforts were made to ensure respect for policies and actions relating to non-communicable diseases (smoke-free offices, alcohol-related issues, road safety and ergonomics). Standard medical examinations were improved so as to detect potential health problems early. 16. OHU and the Migration Health Department conducted a joint enquiry concerning HIV/AIDS awareness. As a result, OHU provided HIV/AIDS prevention supplies to those Missions encountering difficulties in obtaining them locally. It also provided PEP (Post Exposure Preventive) kits where they were needed for immediate use and where staff is at particular risk given the nature of the work (mass immunization campaigns and medical testing).
MC/INF/278 Page 4
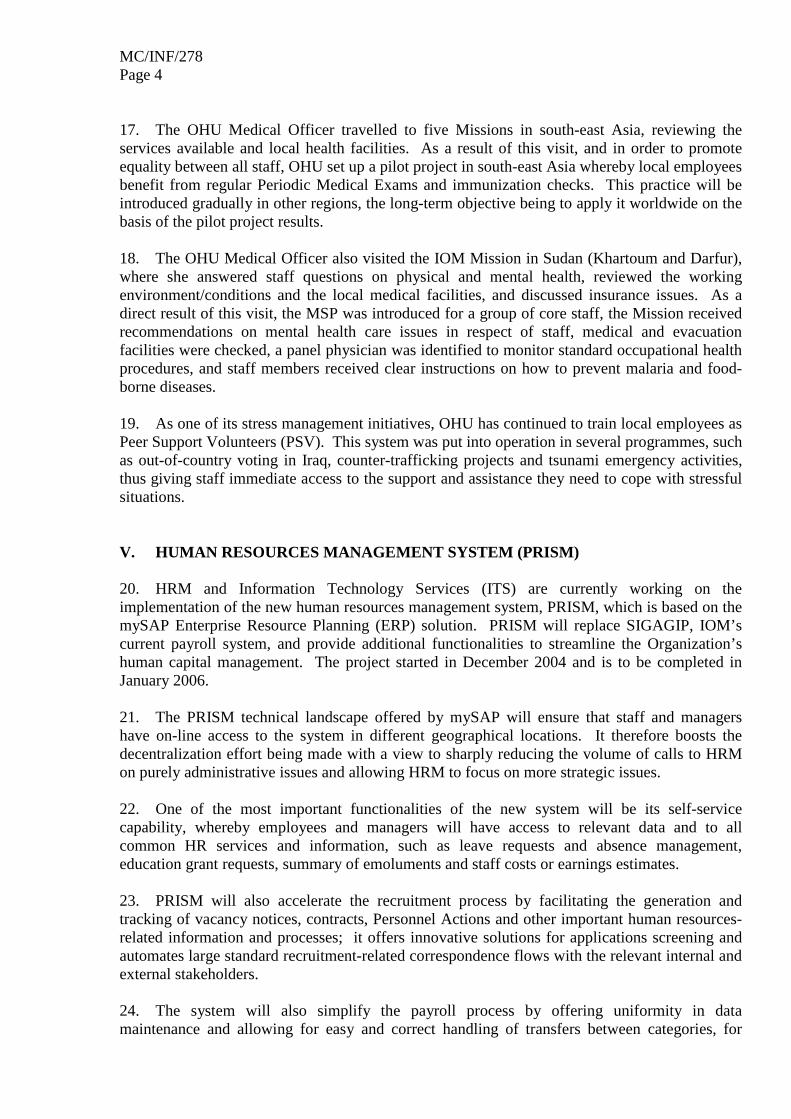
17. The OHU Medical Officer travelled to five Missions in south-east Asia, reviewing the services available and local health facilities. As a result of this visit, and in order to promote equality between all staff, OHU set up a pilot project in south-east Asia whereby local employees benefit from regular Periodic Medical Exams and immunization checks. This practice will be introduced gradually in other regions, the long-term objective being to apply it worldwide on the basis of the pilot project results. 18. The OHU Medical Officer also visited the IOM Mission in Sudan (Khartoum and Darfur), where she answered staff questions on physical and mental health, reviewed the working environment/conditions and the local medical facilities, and discussed insurance issues. As a direct result of this visit, the MSP was introduced for a group of core staff, the Mission received recommendations on mental health care issues in respect of staff, medical and evacuation facilities were checked, a panel physician was identified to monitor standard occupational health procedures, and staff members received clear instructions on how to prevent malaria and food-borne diseases. 19. As one of its stress management initiatives, OHU has continued to train local employees as Peer Support Volunteers (PSV). This system was put into operation in several programmes, such as out-of-country voting in Iraq, counter-trafficking projects and tsunami emergency activities, thus giving staff immediate access to the support and assistance they need to cope with stressful situations. V. HUMAN RESOURCES MANAGEMENT SYSTEM (PRISM) 20. HRM and Information Technology Services (ITS) are currently working on the implementation of the new human resources management system, PRISM, which is based on the mySAP Enterprise Resource Planning (ERP) solution. PRISM will replace SIGAGIP, IOM’s current payroll system, and provide additional functionalities to streamline the Organization’s human capital management. The project started in December 2004 and is to be completed in January 2006. 21. The PRISM technical landscape offered by mySAP will ensure that staff and managers have on-line access to the system in different geographical locations. It therefore boosts the decentralization effort being made with a view to sharply reducing the volume of calls to HRM on purely administrative issues and allowing HRM to focus on more strategic issues. 22. One of the most important functionalities of the new system will be its self-service capability, whereby employees and managers will have access to relevant data and to all common HR services and information, such as leave requests and absence management, education grant requests, summary of emoluments and staff costs or earnings estimates. 23. PRISM will also accelerate the recruitment process by facilitating the generation and tracking of vacancy notices, contracts, Personnel Actions and other important human resources-related information and processes; it offers innovative solutions for applications screening and automates large standard recruitment-related correspondence flows with the relevant internal and external stakeholders. 24. The system will also simplify the payroll process by offering uniformity in data maintenance and allowing for easy and correct handling of transfers between categories, for

MC/INF/278 Page 5 example promotion from the General Service to Professional category, or from a Field to a Headquarters position or Professional post. 25. During 2006 and 2007 the system will gradually be extended to cover local staff in the Field. VI. STAFF DEVELOPMENT AND LEARNING 26. The Staff Development and Learning Unit (SDL) continues to provide targeted learning opportunities for the effective professional development of IOM staff. 27. SDL actively supports the decentralization of training expertise in the areas of project development, resource management and specialized migration topics. A series of training-of-trainers events was organized in the first half of 2005 on these topics for colleagues both in IOM Field Missions and at Headquarters. As a direct consequence, specialized training events were organized at local level by the new IOM trainers. 28. SDL initiated the production of a specialized training and certification package for project managers due to appear in the first half of 2006. The new package will be mandatory for all staff with the title of Project/Programme Developer/Manager, and is intended to enhance their management of IOM programmes (design, development and implementation of projects). 29. A revised and interactive version is being produced of IOM’s Induction CD-Rom. Newcomers and IOM colleagues changing functions or locations will be requested to go through the specific module and provide HRM with a copy of the certificate that is automatically generated upon completion of the process. The improvements in the induction system will shorten the adaptation period for new staff members. 30. SDL continues to provide the specialized curriculum development and training expertise needed to design specialized learning tools in the field of migration management, such as the Training Programme on Countering Irregular Migration and Smuggling. VII. PERFORMANCE DEVELOPMENT SYSTEM 31. With the support of SDL, the Administration has embarked on a series of regional training-of-trainers workshops aimed at introducing the new Performance Development System (PDS) and ensuring proper understanding of the process and system in all Missions and Headquarters departments. 32. The Administration plans to launch the PDS as of January 2006. The system is expected to deliver on important HRM strategic goals by serving as a tool for the assessment and development of staff members’ competencies and preparing them to take on new functions aligned to the needs of the Organization and its stakeholders. PDS will ensure synergy between various HRM processes and validate career development, succession planning and other investments in staff development.

MC/INF/278 Page 6
VIII. JOB CLASSIFICATION 33. Between 1 July 2004 and 30 June 2005, 13 positions (12 officials and 1 employee) were rated and two desk audits were carried out. IX. STAFF RELATIONS 34. The Administration met with representatives of the Staff Association Committee (SAC) within the JASAC (Joint Administration/Staff Association Committee) to discuss matters of common interest. Cooperation between the Administration and the SAC continued through the SDL Steering Committee and various other consultative processes. 35. Between 1 July 2004 and 30 June 2005, the Appointments and Postings Board, in which the Staff Association participates, held 10 meetings and discussed and made recommendations on 82 items. The Director General approved the recommendations in all cases. 36. Concerning staff grievances, between 1 July 2004 and 30 June 2005 four appeals were received by the Joint Administrative Review Board (JARB); no appeals were lodged with the ILO Administrative Tribunal.

MC/INF/278 Annex - English only Page 1
Annex
Statistical Overview
IOM STAFF COMPOSITION ………………………………………………………………………….. 2 1. IOM field locations, 2001-2005 ……………………………………………………..……….. 2 2. IOM staffing trends, 2001-2005 …………………………………………………………….... 2 3. Staff by category, location and gender, June 2005 ……………………………………...……. 2 4. Officials - distribution by gender and grade, 2001-2005 ……………………………….…….. 3 5. Evolution of the representation of women among officials, 2001-2005 ……………………… 3 6. Officials by country of nationality and grade, June 2005 …………………………………….. 4 7. Officials - grade distribution and gender, June 2005 …………………………….…………... 5 8. Headquarters employees by country of nationality and gender, June 2005 ………………….. 6 9. Field employees by country of nationality and gender, June 2005 ………………………….… 6
RECRUITMENT AND SELECTION ………………………………………………………………….. 8 10. Vacancy notices issued for officials, 2001-June 2005 ……………………………………….. 8 11. Officials appointed through vacancy notices, 2001-June 2005 ……………………………… 8 12. Officials appointed through vacancy notices by gender, 2001-June 2005 …………………… 9 13. Mobility of internal staff, 2001-June 2005.…………………………………………………… 9 14. Officials appointed through vacancy notices by country of nationality, 2001-June 2005.…… 9 15. Vacancy notices issued for employees at Headquarters, 2001-June 2005 …….……………... 11 16. Summary of temporary recruitment and selection, 2001-June 2005………………………….. 11
ALTERNATIVE STAFFING RESOURCES …………………………………………………….…... 12
17. Associate Experts by nationality, 2001-June 2005…………………………………………… 12
OTHER CATEGORIES ……………………………………………………………………………….. 12 18. Interns by gender and duty station, July 2004-June 2005………………...………….………. 12
STAFF DEVELOPMENT AND LEARNING ………………………………………………..……… 14 19. Staff development and learning activities, 2001-June 2005………………………………….. 14 20. Staff trained by gender, 2001-June 2005 …………………………………………………….. 14 21. Staff trained by location, 2001-June 2005 …………………………………………………… 14 22. Staff trained by category, 2001-June 2005 ………………………………………………….. 15 23. Staff trained by areas of training and development activity ………………………………… 15

MC/INF/278 Annex - English only Page 2
IOM STAFF COMPOSITION
1. IOM field locations, 2001-2005 2. IOM staffing1 trends, 2001-2005
151 165 182208
248
0
50
100
150
200
250
2001 2002 2003 2004 2005
0
1000
2000
3000
4000
5000
2001 2002 2003 2004 2005
Officials Employees Total
3. Staff by category, location and gender, June 2005
Headquarters Field Category
Women Men Women Men Total
Officials 2 66 59 131 226 482
Officials, short-term 10 3 55 71 139
Employees 2 112 49 1044 1299 2 504
Employees, short-term 13 9 531 1131 1 684
National Officers 0 0 56 64 120
Associate Experts 4 0 9 3 16
TOTAL 205 120 1 826 2 794 4 945
1 Staff members holding a short-term contract included. 2 Unless otherwise specified in this report, all data refers to staff members holding a regular or one-year contract or having been
with the Organization for more than 12 months. The Director General, Deputy Director General, consultants, Associate Experts, interns and staff on special leave without pay are excluded.

MC/INF/278 Annex - English only Page 3
4. Officials - distribution by gender and grade, 2001-2005
Grade Dec. 2001
Dec. 2002
Dec. 2003
Dec. 2004
June 2005
% of women
35.3% 38.1% 39.3% 40.0% 40.9%
Out of the above percentages women were distributed within grades as follows:
P5 and above 10.5% 9.9% 9.4% 8.9% 10.1%
P3-P4 56.4% 48.7% 47.0% 48.6% 46.7%
P1-P2 27.4% 36.2% 40.3% 38.6% 38.6%
PU 5.7% 5.2% 3.3% 3.9% 4.6%
Total 100.0% 100.0% 100.0% 100.0% 100.0% Total number
of women 124 152 181 179 197
% of men
64.7% 61.9% 60.7% 60.0% 59.1%
Out of the above percentages men were distributed within grades as follows:
P5 and above 20.3% 22.3% 21.9% 22.3% 20.7%
P3-P4 59.5% 55.9% 56.3% 53.9% 54.7%
P1-P2 15.8% 18.2% 17.2% 20.1% 21.4%
PU 4.4% 3.6% 4.6% 3.7% 3.2%
Total 100.0% 100.0% 100.0% 100.0% 100.0%
Total number of men
227 247 279 269 285
5. Evolution of the representation of women among officials, 2001-2005
(Percentage of women in a grade compared to the total staff in that grade)
Grade Dec. 2001
Dec. 2002
Dec. 2003
Dec. 2004
June 2005
D2 0.0% 0.0% 0.0% 0.0% 0.0%
D1 22.2% 27.8% 31.3% 25.0% 31.8%
P5 22.5% 20.0% 20.3% 21.1% 24.1%
P4 36.0% 39.5% 36.6% 33.0% 30.9%
P3 32.8% 32.1% 34.2% 40.6% 41.1%
P2 48.2% 52.1% 58.6% 51.6% 54.1%
P1 50.0% 62.1% 64.7% 71.4% 60.7%
PU 41.2% 47.1% 31.6% 41.2% 50.0% Total % of
women 35.3% 38.1% 39.3% 40.0% 40.9%
Total officials 351 399 460 448 482

MC/INF/278 Annex - English only Page 4
6. Officials by country of nationality and grade, June 2005
Country of nationality Grades TOTAL D2 D1 P5 P4 P3 P2 P1 PU Afghanistan 1 1 2 4 Albania 1 1 2 Algeria 1 1 Argentina 1 1 2 Australia 1 1 9 4 4 3 22 Austria 1 2 1 4 Azerbaijan 1 1 Bangladesh 1 1 Belgium 1 1 2 4 2 10 Bolivia 1 1 2 Bosnia and Herzegovina 1 3 4 Brazil 1 1 2 Burkina Faso 1 1 Canada 1 5 2 11 3 22 Cape Verde 1 1 Chile 1 1 Colombia 2 2 Costa Rica 1 1 3 1 6 Côte d’Ivoire 1 1 2 Croatia 3 3 1 7 Czech Republic 1 1 Denmark 2 2 Egypt 1 1 Finland 1 1 1 3 France 4 4 7 3 1 1 20 Georgia 1 2 1 4 Germany 6 2 7 3 5 1 24 Greece 1 1 2 Guatemala 1 1 Honduras 1 1 Hungary 2 1 3 Iran (Islamic Republic of) 1 1 1 3 Ireland 1 1 2 Israel 1 1 2 Italy 3 5 8 7 4 1 1 29 Japan 1 1 1 3 1 1 8 Jordan 1 2 2 5 Kazakhstan 2 1 3 Kenya 3 2 2 7 Latvia 1 1 Liberia 1 1 Lithuania 1 1 Morocco 1 1 Netherlands 1 1 2 2 1 1 1 9 New Zealand 2 1 1 4 Nicaragua 1 1 2 Norway 1 1 Pakistan 1 1 2

MC/INF/278 Annex - English only Page 5
6. Officials by country of nationality and grade, June 2005 (cont.)
Country of nationality Grades TOTAL D2 D1 P5 P4 P3 P2 P1 PU Panama 1 1 Peru 2 1 3 Philippines 3 8 7 1 19 Poland 1 1 2 Portugal 1 1 2 4 Republic of Korea 1 1 Romania 1 2 3 6 Senegal 2 2 Serbia and Montenegro 3 8 5 16 South Africa 1 2 1 4 Sri Lanka 1 1 2 Sudan 1 1 Sweden 3 6 1 10 Switzerland 1 1 2 5 4 1 1 15 Thailand 1 4 2 7 Turkey 1 1 Uganda 1 1 Ukraine 1 2 3 United Kingdom of Great
Britain and Northern Ireland 1 1 5 7 5 1 20
United Republic of Tanzania 1 1
United States of America 4 14 16 21 14 4 5 78 Uruguay 1 3 1 1 6 Venezuela (Bolivarian
Republic of) 1 1 Zimbabwe 1 1 Non-Member States 1 3 6 10 11 5 1 37 TOTAL 3 22 54 97 151 109 28 18 482
Number of represented Member States 72 Member State nationals currently employed on short-term contracts: Democratic Republic of the Congo (1), Haiti (1), Mali (1) and Slovakia (1).
7. Officials - grade distribution and gender, June 2005
0%
20%
40%
60%
80%
100%
M 3 15 41 67 89 50 11 9
F 7 13 30 62 59 17 9
D2 D1 P5 P4 P3 P2 P1 PU
MC/INF/278 Annex - English only Page 6
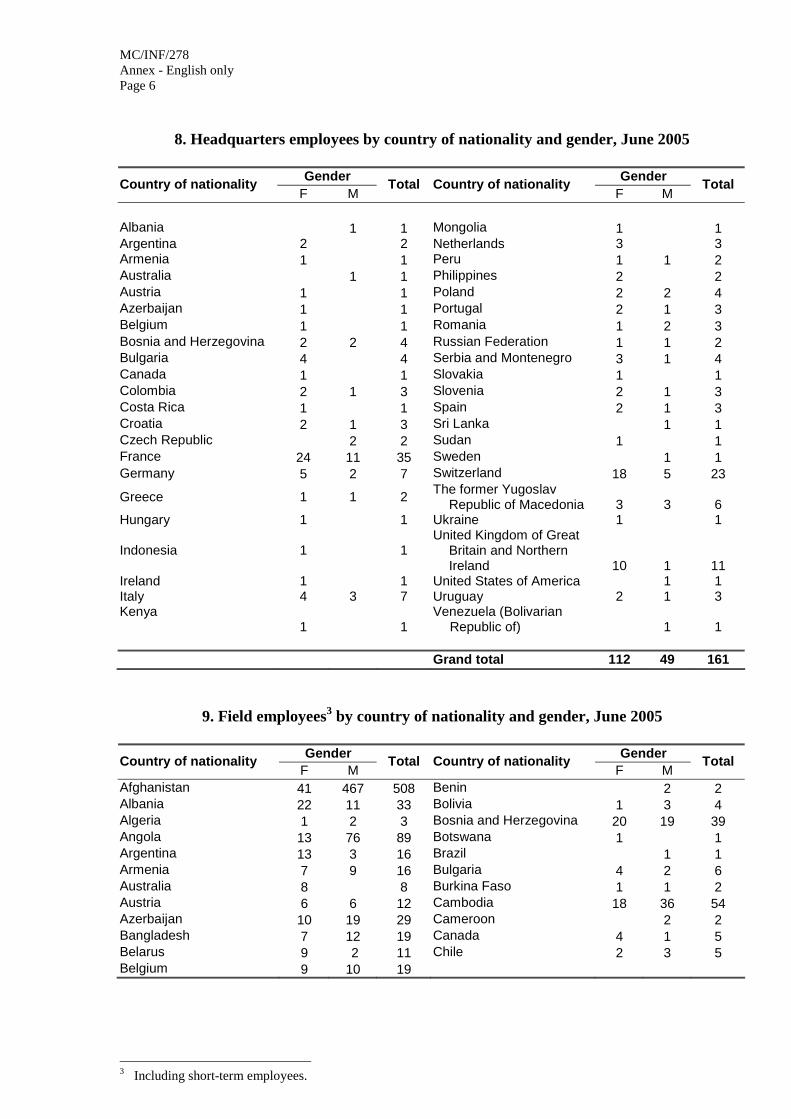
8. Headquarters employees by country of nationality and gender, June 2005
Gender Gender Country of nationality
F M Total Country of nationality
F M Total
Albania 1 1 Mongolia 1 1 Argentina 2 2 Netherlands 3 3 Armenia 1 1 Peru 1 1 2 Australia 1 1 Philippines 2 2 Austria 1 1 Poland 2 2 4 Azerbaijan 1 1 Portugal 2 1 3 Belgium 1 1 Romania 1 2 3 Bosnia and Herzegovina 2 2 4 Russian Federation 1 1 2 Bulgaria 4 4 Serbia and Montenegro 3 1 4 Canada 1 1 Slovakia 1 1 Colombia 2 1 3 Slovenia 2 1 3 Costa Rica 1 1 Spain 2 1 3 Croatia 2 1 3 Sri Lanka 1 1 Czech Republic 2 2 Sudan 1 1 France 24 11 35 Sweden 1 1 Germany 5 2 7 Switzerland 18 5 23
Greece 1 1 2 The former Yugoslav
Republic of Macedonia 3 3 6 Hungary 1 1 Ukraine 1 1
Indonesia 1 1 United Kingdom of Great
Britain and Northern Ireland 10 1 11
Ireland 1 1 United States of America 1 1 Italy 4 3 7 Uruguay 2 1 3 Kenya
1 1 Venezuela (Bolivarian
Republic of) 1 1 Grand total 112 49 161
9. Field employees3 by country of nationality and gender, June 2005
Gender Gender Country of nationality
F M Total Country of nationality
F M Total
Afghanistan 41 467 508 Benin 2 2 Albania 22 11 33 Bolivia 1 3 4 Algeria 1 2 3 Bosnia and Herzegovina 20 19 39 Angola 13 76 89 Botswana 1 1 Argentina 13 3 16 Brazil 1 1 Armenia 7 9 16 Bulgaria 4 2 6 Australia 8 8 Burkina Faso 1 1 2 Austria 6 6 12 Cambodia 18 36 54 Azerbaijan 10 19 29 Cameroon 2 2 Bangladesh 7 12 19 Canada 4 1 5 Belarus 9 2 11 Chile 2 3 5 Belgium 9 10 19
3 Including short-term employees.

MC/INF/278 Annex - English only Page 7
9. Field employees by country of nationality and gender, June 2005 (cont.)
Gender Gender Country of nationality
F M Total Country of nationality
F M Total
China 1 1 Lithuania 3 1 4 China, Hong Kong Special
Administrative Region 3 3 Mali 4 4
Colombia 123 94 217 Mauritania 1 1 Congo 1 1 Mexico 3 4 7 Costa Rica 17 9 26 Mongolia 1 1 2 Côte d’Ivoire 10 18 28 Morocco 1 1 Croatia 10 7 17 Mozambique 1 1 Cuba 3 3 Myanmar 1 1 Czech Republic 7 1 8 Nauru 10 30 40 Democratic Republic of
the Congo 1 12 13 Netherlands 33 27 60
Denmark 1 1 2 New Zealand 1 1 2 Dominican Republic 2 3 5 Nicaragua 3 3 Ecuador 26 29 55 Nigeria 2 2 4 Egypt 21 17 38 Norway 6 3 9 El Salvador 2 4 6 Pakistan 5 20 25 Eritrea 1 1 Peru 5 11 16 Ethiopia 15 22 37 Philippines 56 37 93 Fiji 1 1 Poland 18 5 23 Finland 6 6 12 Portugal 4 3 7 France 4 2 6 Republic of Korea 1 1 Gambia 1 1 2 Republic of Moldova 13 13 26 Georgia 11 7 18 Romania 16 8 24 Germany 31 14 45 Russian Federation 138 61 199 Ghana 19 18 37 Sao Tome and Principe 1 1 Greece 9 7 16 Senegal 8 12 20 Guatemala 10 22 32 Serbia and Montenegro 34 34 68 Guinea 8 17 25 Kosovo 23 44 67 Guinea-Bissau 7 14 21 Sierra Leone 4 10 14 Haiti 9 19 28 Slovakia 11 1 12 Honduras 4 1 5 Slovenia 3 2 5 Hungary 8 4 12 Somalia 3 2 5 India 5 3 8 South Africa 12 11 23 Indonesia 96 350 446 Spain 5 3 8 Iran (Islamic Republic of) 6 9 15 Sri Lanka 23 150 173 Iraq 8 17 25 Sudan 26 86 112 Ireland 8 8 Swaziland 1 1 Italy 28 12 40 Sweden 3 1 4 Jamaica 1 1 Switzerland 2 1 3 Japan 2 2 Syrian Arab Republic 3 5 8 Jordan 14 25 39 Tajikistan 12 22 34 Kazakhstan 16 3 19 Thailand 57 31 88
Kenya 92 127 219 The former Yugoslav
Republic of Macedonia 25 9 34
Kyrgyzstan 6 7 13 Timor-Leste 3 23 26 Latvia 2 1 3 Togo 1 1 Lebanon 2 2 Tunisia 2 4 6 Liberia 15 27 42 Turkey 5 6 11

MC/INF/278 Annex - English only Page 8 9. Field employees by country of nationality and gender, June 2005 (cont.) Turkmenistan 2 3 5 Uruguay 2 1 3 Tuvalu 1 1 Uzbekistan 2 2
Uganda 7 11 18
Venezuela (Bolivarian Republic of) 2 2
Ukraine 30 15 45 Viet Nam 49 21 70 United Kingdom of Great Britain and
Northern Ireland 17 18 35 Yemen 1 1 2
United Republic of Tanzania
2 4 6 Zambia 20 51 71
United States of America 38 38 76 Zimbabwe 10 15 25 Grand total 1 631 2 494 4 125
RECRUITMENT AND SELECTION 10. Vacancy notices issued for officials, 2001-June 2005
Vacancy notices issued 2001 2002 2003 2004 June 2005
Total number of vacancy notices issued 87 68 73 56 29 Headquarters positions 33 17 14 8 10 Field positions 54 51 59 48 19 Advertised internally only 58 48 57 42 18 Headquarters positions 13 7 6 6 3 Field positions 45 41 51 36 15 Advertised internally and externally 29 20 16 14 11 Headquarters positions 20 10 8 2 7 Field positions 9 10 8 12 4
11. Officials appointed through vacancy notices4, 2001-June 2005
2001 2002 2003 2004 June 2005
Vacancies filled internally 61 42 45 36 16 Headquarters 17 14 7 4 5 Field 44 28 38 32 11 Vacancies filled externally 18 9 7 5 1 Headquarters 11 6 5 1 1 Field 7 3 2 4 0
Cancelled / reissued 9 21 23 10 5 Pending 5 7
Total 88 72 75 56 29
4 The total number of officials is different from the total number of vacancy notices issued because some vacancy
notices were issued for more than one position or may have been filled by more than one official on a part-time basis.

MC/INF/278 Annex - English only Page 9
12. Officials appointed through vacancy notices by gender, 2001-June 2005
2001 2002 2003 2004 June 2005
Officials appointed at Headquarters 28 20 12 5 6 Of which women 16 13 8 4 4 Officials appointed in the Field 51 31 40 36 11 Of which women 20 8 10 16 6 Total number of officials appointed 79 51 52 41 17 Of which women recruited externally 9 3 4 2 0 Of which former General Service staff 10 9 3 2 4 Of which women 4 7 2 2 4 Percentage of women appointed 45.6% 41.2% 34.6% 48.8% 58.8%
13. Mobility of internal staff, 2001-June 2005
2001 2002 2003 2004 June 2005
From Headquarters to the Field 3 4 2 2 1 From the Field to Headquarters 8 5 2 1 0 From the Field to the Field 19 17 18 23 7 Reassignment within same duty
station 31 16 23 10 8
Total 61 42 45 36 16
14. Officials appointed through vacancy notices by country of nationality, 2001-June 2005
Nationality 2001 2002 2003 2004 June 2005
Albania 1 1 Argentina 2 2 Australia 2 4 3 2 1 Austria 1 Bangladesh 1 Belarus 5 1 Belgium 2 2 1 Bosnia and Herzegovina 1 1 Brazil 1 Burkina Faso 1 1 Canada 3 4 1 2 1 Cape Verde 1 Chile 2 Colombia 1 Costa Rica 2 1 Croatia 1 2 1 Czech Republic 1 Denmark 1
5 Observer State.

MC/INF/278 Annex - English only Page 10 14. Officials appointed through vacancy notices by country of nationality, 2001-June 2005
(cont.)
Nationality 2001 2002 2003 2004 June 2005
Finland 1 France 5 1 2 1 2 Georgia 1 Germany 2 5 3 3 Ghana 5 1 1 Greece 1 Hungary 1 India 5 1 3 1 Ireland 1 1 Israel 1 1 Italy 6 3 4 3 2 Japan 2 2 Kazakhstan 2 1 Kenya 1 3 1 Liberia 1 Lithuania 1 Morocco 1 Mozambique 5 1 1 Netherlands 1 1 1 New Zealand 2 Norway 1 Pakistan 1 Panama 1 Peru 1 1 Philippines 5 2 1 1 1 Poland 1 1 Portugal 1 1 1 Romania 1 1 1 1 Russian Federation 5 1 Senegal 1 Serbia and Montenegro 1 1 1 South Africa 1 2 1 Spain 5 1 1 1 Sweden 1 3 Switzerland 3 1 1 4 Thailand 1 The former Yugoslav Republic of Macedonia 5 1 1 1 Turkey 1 Ukraine 1 1 United Kingdom of Great Britain and Northern Ireland 4 3 2 2 United States of America 18 6 8 4 Uruguay 1 2 Total 79 51 52 41 17 Number of nationalities 34 29 28 26 14
5 Observer State.

MC/INF/278 Annex - English only Page 11
15. Vacancy notices issued for employees at Headquarters, 2001-June 2005
Vacancy notices issued 2001 2002 2003 2004 June 2005
Total number of vacancy notices issued 33 20 10 7 2 Advertised internally only 18 10 5 7 2 Advertised internally and externally 15 10 5 0 0 Total number of corresponding positions 36 31 13 9 2
Vacancies filled internally 18 19 6 9 2
Employees from Headquarters 14 13 5 9 2 Employees from the Field 4 6 1 0 0
Vacancies filled externally 8 11 6 0 0 Cancelled/reissued 10 1 1 0 0
16. Summary of temporary recruitment and selection, 2001-June 2005
2001 2002 2003 2004 June
2005
For officials
Number of temporary vacancy notices issued 6 18 44 56 41 Number of temporary positions filled 148 219 142 162 122
Of which for emergency and post-conflict operations 87 114 83 88 75
For employees at Headquarters
Number of temporary vacancy notices issued 4 16 6 22 2 Number of temporary positions filled 41 76 67 29 1

MC/INF/278 Annex - English only Page 12
ALTERNATIVE STAFFING RESOURCES 17. Associate Experts by nationality, 2001-June 20056
2001 2002 2003 2004 June
2005 Armenia 1 1 17 Belgium 1 1 1 1 Denmark 2 Germany 1 1 3 2 Italy 3 3 1 3 2 Japan 2 3 3 3 1 Morocco 1 1 18 Netherlands 3 2 5 4 4 Niger 1 19 Republic of Korea 1 Sweden 6 6 4 4 4 Switzerland 1 1 1 United States of
America 1 2 2 3 1
Total 20 20 20 24 16
OTHER CATEGORIES 18. Interns by gender and duty station, July 2004 - June 2005
Duty station Women Men Total
Headquarters 40 18 58 Office of the Director General 2 2 4 Accounting - 1 1 Claims Programmes 2 7 9 Donor Relations 1 - 1 Emergency and Post-Conflict 3 1 4 External Relations 3 - 3 Facilitated Migration 2 - 2 Human Resources Management 1 - 1 Information Technology 2 - 2 International Migration Law and Legal Affairs 3 1 4 Media and Public Information 2 - 2 Migration Health 3 - 3 Migration Management 4 2 6 Migration Policy, Research and Communications 9 3 12 Occupational Health 1 - 1 Staff Development and Learning 2 - 2 Treasury - 1 1
6 Includes Associate Experts present for only part of the year. 7 Funded by the Government of the Netherlands. 8 Funded by the Government of Belgium. 9 Funded by Organisation Internationale de la Francophonie.

MC/INF/278 Annex - English only Page 13
18. Interns by gender and duty station, July 2004 - June 2005 (cont.)
Duty station Women Men Total
Field 79 44 123 Addis Ababa 4 - 4 Ankara 7 - 7 Bangkok - 2 2 Bern 3 2 5 Bogota 1 4 5 Brussels 6 3 9 Budapest 3 - 3 Cape Town 1 - 1 Chisinau 12 6 18 Colombo 1 - 1 Cucuta - 2 2 Dhaka 1 1 2 Dushanbe 1 - 1 Hanoi 1 - 1 Helsinki 3 2 5 Jakarta 1 - 1 Kiev - 1 1 Lisbon 1 1 2 London 1 1 2 Lusaka - 1 1 Madrid 1 - 1 Manila 1 - 1 Nairobi 1 1 2 Nakhichevan - 2 2 Phnom Penh 1 1 2 Popayan 2 - 2 Pretoria 2 - 2 Rome 5 2 7 San José 1 - 1 Santiago 2 4 6 Sarajevo 2 - 2 Tirana 2 - 2 Vienna 7 6 13 Washington 5 2 7
TOTAL 119 62 181

MC/INF/278 Annex - English only Page 14
STAFF DEVELOPMENT AND LEARNING
19. Staff development and learning activities, 2001-June 2005
2001 2002 2003 2004 June 2005
Learning activities organized and/or
financed by SDL or implemented in coordination with SDL
88
80
86
114
53
Total staff members 2 742 3 411 3 689 4 038 4 945
Staff members trained 611 548 980 83210 47211
Percentage of staff trained 22.3% 16.1% 26.0% 20.6% 9.5%
20. Staff trained by gender, 2001-June 2005
358 313530 493
304
253235
450339
168
0
200
400
600
800
1000
2001 2002 2003 2004 Jun-05
Female Male
21. Staff trained by location, 2001-June 2005
394 348
554662
335
217200
426 170
137
0
200
400
600
800
1000
2001 2002 2003 2004 Jun-05
Field HQ
10 In addition to this, 537 IOM staff members benefited from e-Learning opportunities in 2004. Course themes
include Information Technology, Business, Finance and Management. 11 In addition to this, 277 IOM staff members benefited from e-Learning opportunities in January–June 2005.
Course themes include Information Technology, Business, Finance and Management.

MC/INF/278 Annex - English only Page 15
22. Staff trained by category, 2001-June 2005
434
314343
300
423 434
43
100
165
225190 207
5884
123
0
100
200
300
400
500
2001 2002 2003 2004 Jun-05
Officials Employees Ungraded
23. Staff trained by areas of training and development activity
Main Areas 2004 % of total trained June 2005 % of total
trained
Administration and Management 304 36.5% 227 48.1%
Communication Skills 66 7.9% 64 13.6%
Chiefs of Mission 5 0.6% 7 1.5%
Information Technology 37 4.4% 23 4.9%
Language Courses 108 13.0% 45 9.5%
Migration Health 11 1.3% 12 2.5%
Migration and Emergency Management 118 14.2% 53 11.2%
Movement Management 44 5.3% 8 1.7%
Others (Induction, Report Writing) 13 1.6% - -
Project Development 83 10.0% 24 5.1%
Security 30 3.6% 9 1.9%
Stress Management 13 1.6% - - TOTAL 832 100% 472 100%