Embed Size (px)
Citation preview
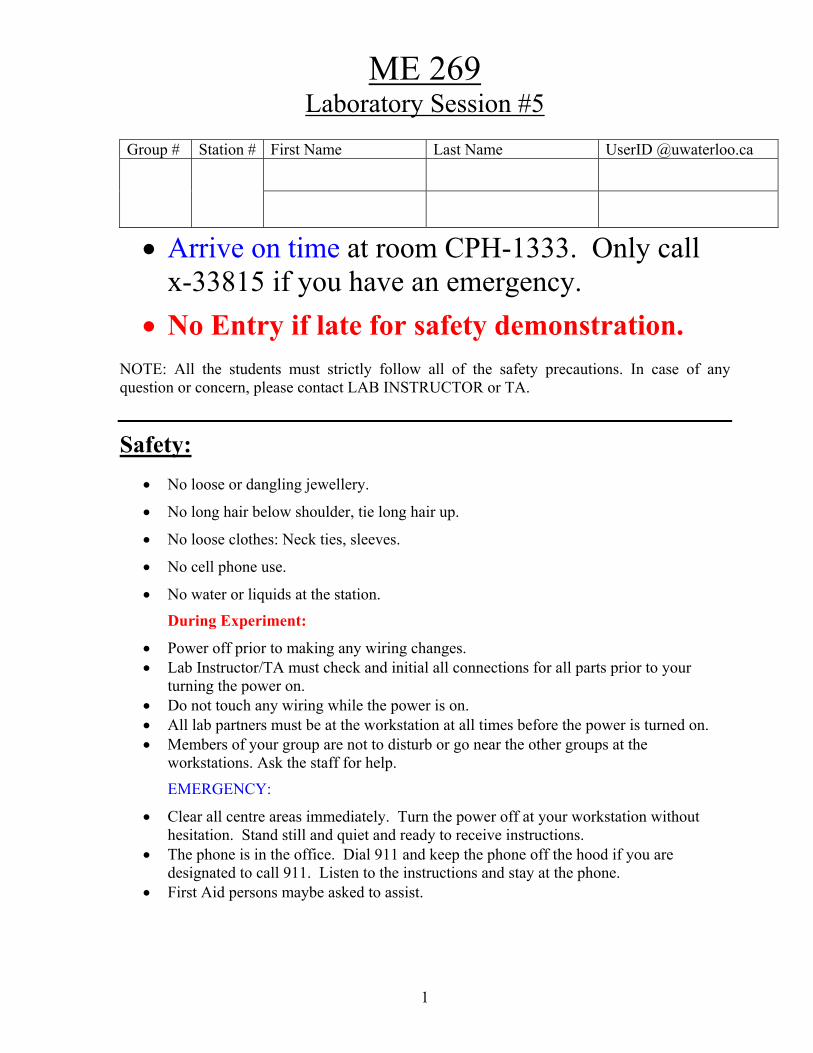
1
ME 269 Laboratory Session #5
Group # Station # First Name Last Name UserID @uwaterloo.ca
• Arrive on time at room CPH-1333. Only call x-33815 if you have an emergency.
• No Entry if late for safety demonstration. NOTE: All the students must strictly follow all of the safety precautions. In case of any question or concern, please contact LAB INSTRUCTOR or TA.
Safety: • No loose or dangling jewellery.
• No long hair below shoulder, tie long hair up.
• No loose clothes: Neck ties, sleeves.
• No cell phone use.
• No water or liquids at the station.
During Experiment:
• Power off prior to making any wiring changes. • Lab Instructor/TA must check and initial all connections for all parts prior to your
turning the power on. • Do not touch any wiring while the power is on. • All lab partners must be at the workstation at all times before the power is turned on. • Members of your group are not to disturb or go near the other groups at the
workstations. Ask the staff for help.
EMERGENCY:
• Clear all centre areas immediately. Turn the power off at your workstation without hesitation. Stand still and quiet and ready to receive instructions.
• The phone is in the office. Dial 911 and keep the phone off the hood if you are designated to call 911. Listen to the instructions and stay at the phone.
• First Aid persons maybe asked to assist.

2
Wiring Hints:
• In this session you will be wiring most of the circuits yourselves. You need to follow definite wiring formats.
• Use ‘RED’ colour wires starting from ‘live/hot’ terminal of the source to one end of the element/device (i.e. resistor/inductor/capacitor/coil/transformer winding).
• Use ‘BLACK’ colour wires starting from ‘neutral/return’ terminal of the source to the other end of the element/device (i.e. resistor/inductor/capacitor/coil/transformer winding).
• Ammeter and current coil connections must be in series with the element/device.
• Voltmeter and voltage coil connections must be in parallel with the element/device.
• Make all series connections first and then parallel connections. Pre-lab calculations: Take to the laboratory • Note the nameplate details of the transformer in Table #1. The nameplate details of
the transformer are given in to calculate I1 (A) (i.e. row #2 in Table #3) and I2
(A) (i.e.
row #2 in Table #4). Note that I1 and I2 are to be calculated on the high voltage side.
• Show the TA/Lab instructor to get approval in the laboratory. Table #1 Nameplate Details of the Transformer
Parameter
Hammond Model 25-F Value
Rated Output 1000 VA
Voltage of HV winding 208 volts
Voltage of LV winding 120 volts
Frequency 60 Hz
Type of Transformer Shell
No. of Phases 1

3
Part 1: Single –Phase Transformers
Pictures:
Picture #1 Equipment set up
Picture #2 Auto-transformer – Single phase– VARIAC -- two models

4
Picture #3 Digital Multi-meter – Fluke model 8050 The current jack has been taped over.
Picture #4 Transformer unit under test Picture #5 Load Side Circuit Breaker Box

5
Test#1: Open circuit test
Preparing experiment: 1. Note that on top of the transformer in Picture #4, H1 and H2 stand for High-Voltage
winding terminals and X1 and X2 stand for Low-Voltage winding terminals.
2. Make connections as per the circuit diagram of Figure #1. Picture #1
3. The single phase auto-transformer (VARIAC) is shown in Picture #2. Ensure that the
VARIAC dial is set to zero before turning the power on or off.
4. The digital multi-meter shown in Picture #3 is to be used as a voltmeter. It has a current
jack, which has been covered to prevent damage due to an incorrect connection. The
voltage function AC and 200-volt range must be selected.
5. Watt-meter settings: Voltage range – above 200V, Current range – above 1A
6. Find the Multiplication Factor as given below
MF = (Voltage range X Current range)/FSD of the scale you read = _____
Procedure: Conducting experiment
7. Make sure the 1-Ø circuit breaker on the power panel for the autotransformer receptacle.
8. Make sure that the 1-Ф variable autotransformer is kept in ZERO position initially.
9. Ask the Lab Instructor/TA to check your Figure #1 and to check
the connections before you turn the power on.
10. Turn the power on after getting clearance from Lab Instructor/TA.
11. Adjust the autotransformer to the values specified in the Table#2 and record I1, V2 and Pcore
for each voltage step.
12. Set the autotransformer to zero position. Turn the power off. Remove the connections.
vc
InputTerminals
H2
Transformer
cc
1-phase
I1
1-phase
X2
X1 H1
VaribleAutotransformer
V2W1
1-phase
V1120 V60 Hz
Figure#1: Circuit diagram for conducting open circuit test.

6
Open Circuit Test Report --Test Results:
1. Plot the input voltage, V1, versus the no load input current, I1. Use I1 as the horizontal coordinate. Attach the plot to this report with full annotation. Use Excel or GNUplot.
2. Plot the core loss, Pcore, versus the input voltage, V1. Use V1 as the horizontal
coordinate. Attach the plot to this report with full annotation. Use Excel or GNUplot.
3. Calculate the equivalent circuit parameters from this test.
4. What are the power losses that occur in the open circuit test? How can they be reduced?
Do you think these losses will change from no-load to full-load? Explain. 5. Which losses are negligible in this test and why?
6. What will happen to the transformer if double the rated voltage is applied to the winding?
Hint: Think about saturation of the core and current in the windings.
Think about the effect of the power to be dissipated internally.

7
Test#2: Short circuit test Preparing experiment:
1. Make connections as per the circuit diagram in Figure# 2.
2. The values for current (I1) at different percentages of the rated current (I1) have been
calculated on the ‘High Voltage’ side and entered in Table#3. The rated value of I1 has
been calculated based on the nameplate details.
3. Watt-meter settings: Voltage range – below 60V, Current range – above 5A
4. Find the Multiplication Factor as given below
MF = (Voltage range X Current range)/FSD of the scale you read = _____
Procedure -- Conducting experiment:
5. Make sure that the 1-Ф variable autotransformer (VARIAC) is kept in ZERO position
initially.
6. Ask the Lab Instructor/TA to check your Figure #2 and
the connections.
7. Turn the power on after getting clearance from Lab Instructor/TA.
8. Caution! Do not move the Variac knob fast. 9. Slowly vary the 1-Ф autotransformer (VARIAC) to obtain the current close enough
to the calculated values in the Table #3. Large current variations should be avoided.
10. Record V1, I1 and Pcopper for each “% of rated I1 current” calculated.
11. Set the autotransformer to zero position. Turn the power off.
12. Remove the connections.
vc
InputTerminals
H2
Transformer
cc
1-phase
I1
1-phase
X2
X1H1
VaribleAutotransformer
W1
1-phase
V1120 V60 Hz
Figure#2: Circuit diagram for conducting short circuit test.

8
Short Circuit Test Report -- Test Results:
1. Calculate the equivalent circuit parameters from this test.
2. Draw the approximate equivalent circuit of a 1-Ф transformer referred to “Low Voltage”
side and indicate the model values obtained from open circuit (OC) test and short circuit (SC) test.
3. What are the power losses that occur in the short circuit test? How can they be reduced? Do
you think these losses will change from no-load to full-load? Explain. 4. Which losses are negligible in this test and why? 5. What will happen to the transformer if the rated voltage is applied to the winding during
short circuit test?
6. What will happen to the transformer, if a DC voltage is applied to the primary winding?
9
Test#3: Load test. Preparing experiment:
1. Make connections as per the circuit diagram in Figure #3. Picture #5 shows the circuit
breaker box for the load.
2. The values for current (I2) at different percentages of the rated current (I2) have been
calculated on the ‘High Voltage’ side and entered in Table#4. The rated value of I2 has
been calculated based on the nameplate details.
3. Watt-meter settings:
For primary: Voltage range – above 200V, Current range – above 10A
For secondary: Voltage range – above 200V, Current range – above 5A
4. Find the Multiplication Factors as given below
MF1 = (Voltage range X Current range)/FSD of the scale you read = _____
MF2 = (Voltage range X Current range)/FSD of the scale you read = _____
Procedure -- Conducting experiment:
5. The 1-Ф variable autotransformer used is shown in Picture #2.
6. Make sure that the 1-Ф variable autotransformer is kept in ZERO position initially.
Make sure all the switches in the load bank are in OFF position.
7. Ask the Lab Instructor/TA to check the connections.
8. Turn the power on after getting clearance from Lab Instructor/TA.
9. Vary the VARIAC SLOWLY until V2 reads 208V at no load.
10. Make no further voltage adjustments.
11. Apply the load in steps to cause I2 to obtain the current close enough to the calculated
values in the Table #4.
12. Record the measured values for I2, V2, I1, V1 and Pin in each step in Table#4.
13. Adjust the I2 and V2 to their rated values by operating switches on the load bank and the
1-phase autotransformer. No need to worry about the other values.
14. Record I2, V2, Pout, I1, V1 and Pin in Table#5.
15. Remove the load at once by turning-off the load side circuit breaker.
16. Record I2, V2, Pout, I1, V1 and Pin in Table#5.

10
17. Turn off all the switches on the load bank. Set the autotransformer to the zero position.
Turn the power off. Calculate the efficiency and regulation in Table#5A & Table#5B
and show them to LI/TA.
18. Remove the connections, tidy up the workstation and sign out with the Lab Instructor.
W2
VaribleAutotransformer
H2
Load
W1
X1
LoadTerminals
vc vc
1-phase
V1 V2
CB
I1 I2H1
120 V60 Hz
InputTerminals
1-phase cc
Transformer
cc
X2
Figure 3 Load Testing Schematic
Load Test Report -- Test Results:
1. Calculate and complete Table#6. Show sample calculations for Pout and %Efficiency.
2. Plot the load current I2, versus the % efficiency. Use load current I2 as the horizontal coordinate. Attach the plot to this report with full annotation. Use Excel or GNUplot.
3. Plot the load current I2, versus the V2. Use load current I2 as the horizontal coordinate. Attach the plot to this report with full annotation. Use Excel or GNUplot.
4. What are the performance parameters used to judge a transformer (to see whether it is a good or a bad transformer)?
5. Explain why the secondary terminal voltage is decreased with an increase in the load current.
6. What is the purpose of transformer in long-distance power transmission?
7. What do you understand from the term ‘Electrical Isolation’? What is the advantage of electrical isolation?

11
Tables:
Note:
1. * represents rated value. 2. In the example given below, the slanted entry is for the V/I ranges of the watt-meter.
Example: V/I range
240 10 The 240 volt range and the 10 amp range are indicated.
Table#2 Open circuit test
V1 (V) 0 25 40 65 85 100 120* 125 135
I1 (A) LI/TA Initial
V2 (V)
Pcore (W) □
V/I range
Table#3 Short circuit test
% of rated I1 0 25 40 65 85 100* I1
(A) -- (Expected) LI/TA Initial
I1 (A) -- (Measured)
V1 (V)
Pcopper (W) #
V/I range
Table#4: Load test: R load is varied by using the load bank connected in single phase.
% of rated I2 0 25 40 65 85 100
I2 (A)
(Expected)
LI/TA Initial
I2 (A) (Measured) H1-H2
I1 (A) X1-X2
V1 (V)
V2 (V)
Pin (W) □
V/I range
12
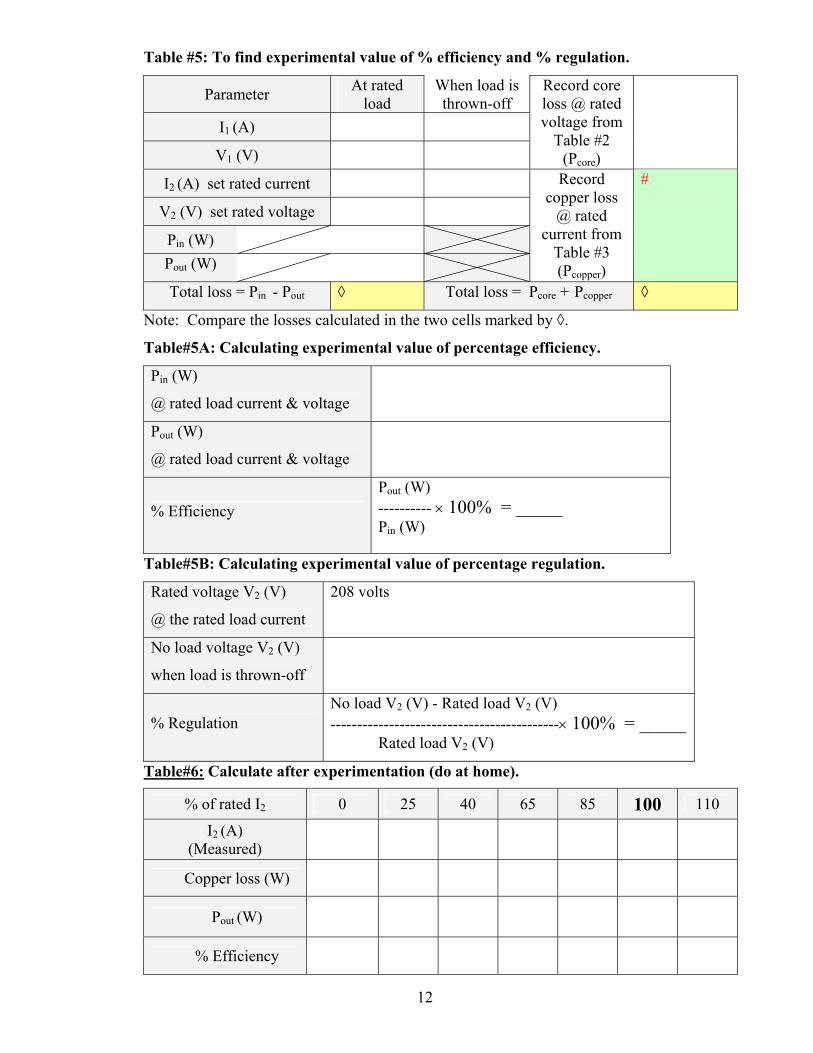
Table #5: To find experimental value of % efficiency and % regulation.
Parameter At rated load
When load is thrown-off
I1 (A)
V1 (V)
Record core loss @ rated voltage from
Table #2 (Pcore)
I2 (A) set rated current
V2 (V) set rated voltage
Pin (W)
Pout (W)
Record copper loss
@ rated current from
Table #3 (Pcopper)
#
Total loss = Pin - Pout ◊ Total loss = Pcore + Pcopper ◊
Note: Compare the losses calculated in the two cells marked by ◊.
Table#5A: Calculating experimental value of percentage efficiency.
Pin (W)
@ rated load current & voltage
Pout (W)
@ rated load current & voltage
% Efficiency Pout (W) ---------- × 100% = _____ Pin (W)
Table#5B: Calculating experimental value of percentage regulation.
Rated voltage V2 (V)
@ the rated load current
208 volts
No load voltage V2 (V)
when load is thrown-off
% Regulation No load V2 (V) - Rated load V2 (V) -------------------------------------------× 100% = _____
Rated load V2 (V)
Table#6: Calculate after experimentation (do at home).
% of rated I2 0 25 40 65 85 100 110
I2 (A) (Measured)
Copper loss (W)
Pout (W)
% Efficiency

13