Embed Size (px)
Citation preview

Measurement and Fault-Measurement and Fault-Finding Using MAGGIE and Finding Using MAGGIE and
PIPES.PIPES.
Presented at the HENP SIGPresented at the HENP SIGInternet2 Members Meeting, Indianapolis, Internet2 Members Meeting, Indianapolis,
October 2003.October 2003.
Measurement and Fault-Measurement and Fault-Finding Using MAGGIE and Finding Using MAGGIE and
PIPES.PIPES.
Presented at the HENP SIGPresented at the HENP SIGInternet2 Members Meeting, Indianapolis, Internet2 Members Meeting, Indianapolis,
October 2003.October 2003.
Paola Grosso (SLAC) andPaola Grosso (SLAC) and
Warren Matthews (GA Tech)Warren Matthews (GA Tech)
Internet2 Members Meeting, Indianapolis, October 2003.
2
BackgroundBackground
• There are a large number of tools There are a large number of tools available to help diagnose available to help diagnose network problems.network problems.
• Many networks have a network Many networks have a network monitoring project, often with a monitoring project, often with a web page showing graphs.web page showing graphs.

Internet2 Members Meeting, Indianapolis, October 2003.
3
Toward a monitoring Toward a monitoring InfrastructureInfrastructure
• Grid tools and data intensive science Grid tools and data intensive science require a cross-domain monitoring require a cross-domain monitoring infrastructure with standardized infrastructure with standardized publishing.publishing.– Resource BrokersResource Brokers– DoE science communityDoE science community
• Monitoring InfrastructureMonitoring Infrastructure– IEPM-BW and MAGGIE (SLAC and DoE)IEPM-BW and MAGGIE (SLAC and DoE)– AMI and PIPES (Internet2)AMI and PIPES (Internet2)
Internet2 Members Meeting, Indianapolis, October 2003.
4
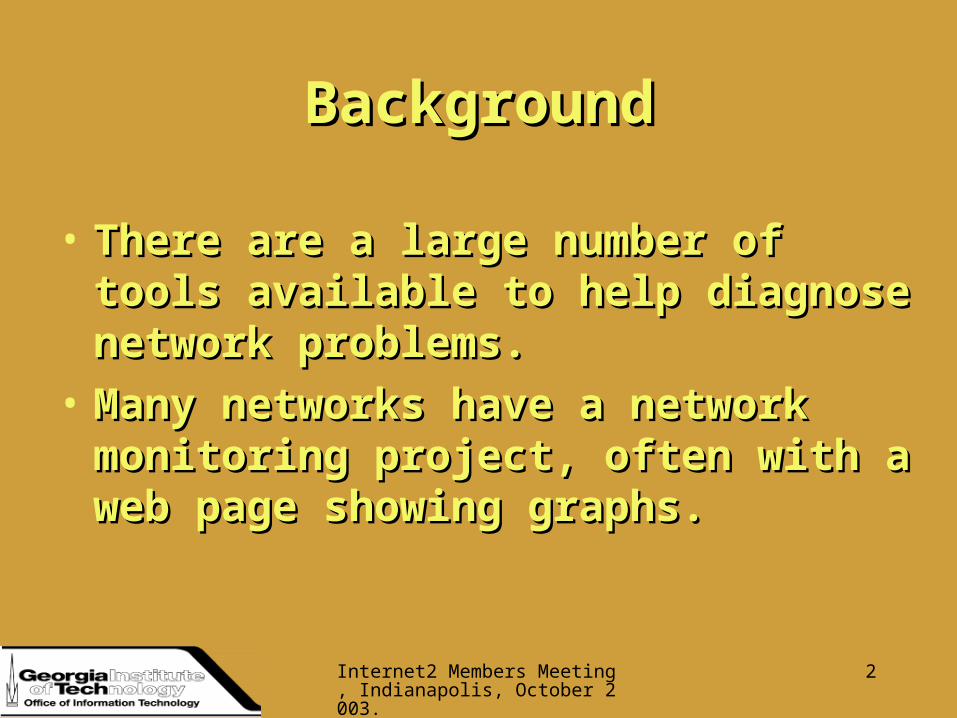
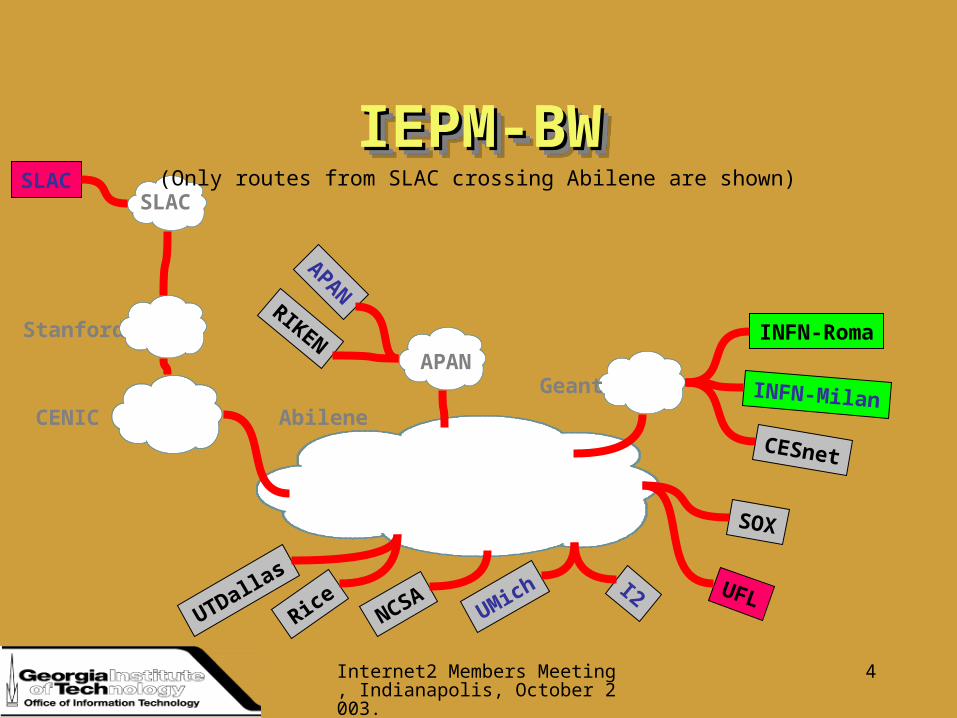
IEPM-BWIEPM-BWIEPM-BWIEPM-BWSLAC
Stanford
CENIC Abilene
SLAC
SNVHSTN
SEA
ATL
CLVIPLS
NY
RiceUTDallas
NCSAUMich I2
SOX
UFL
APANRIKEN INFN-Roma
INFN-Milan
CESnet
APANGeant
(Only routes from SLAC crossing Abilene are shown)
Internet2 Members Meeting, Indianapolis, October 2003.
5
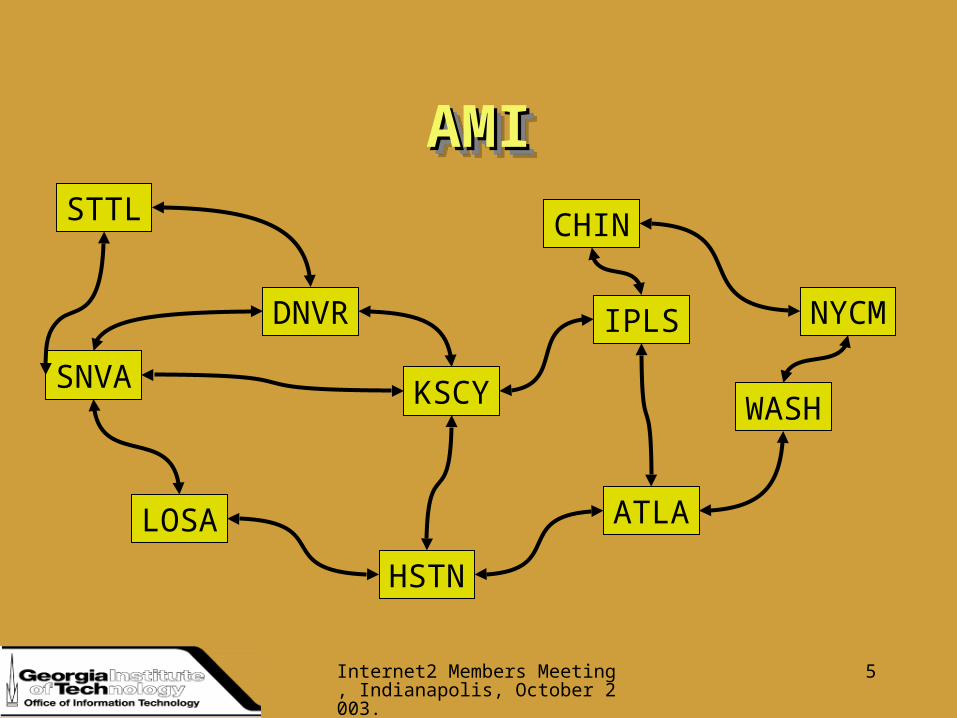
AMIAMIAMIAMISTTL
SNVA
LOSA
NYCM
WASH
ATLA
CHIN
IPLS
KSCY
DNVR
HSTN
Internet2 Members Meeting, Indianapolis, October 2003.
6
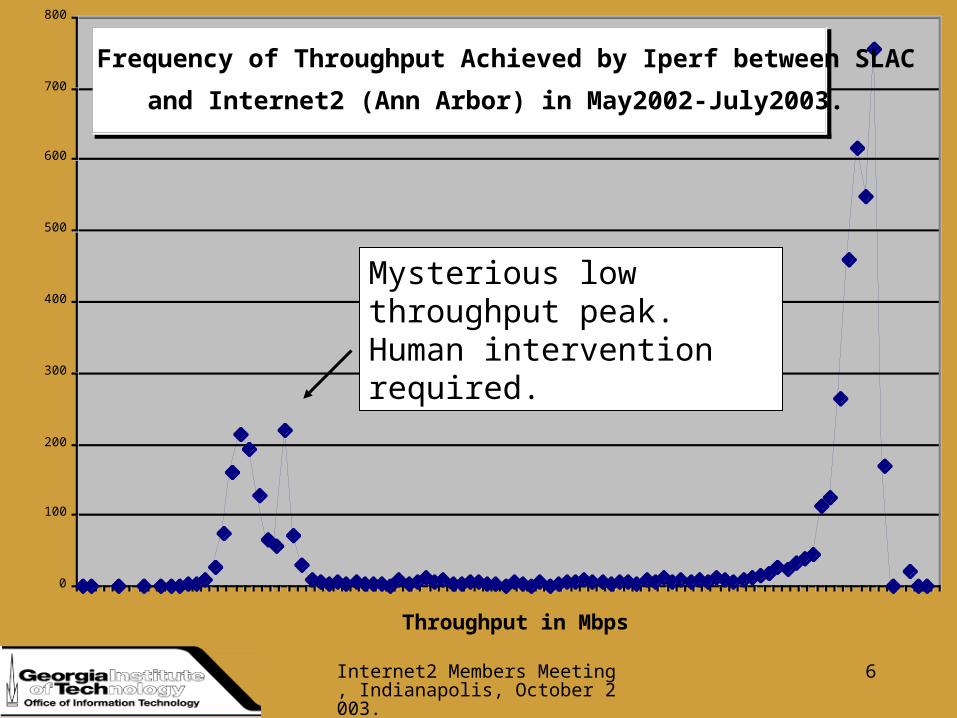
Frequency of Throughput Achieved by Iperf between SLAC
and Internet2 (Ann Arbor) in May2002-July2003.
0
100
200
300
400
500
600
700
800
3 6 9 12 15 18 21 24 27 30 33 36 39 42 45 48 51 54 57 60 63 66 69 72 75 78 81 84 87 90 93 96 99
Throughput in Mbps
Frequency
Mysterious low throughput peak. Human intervention required.
Internet2 Members Meeting, Indianapolis, October 2003.
7
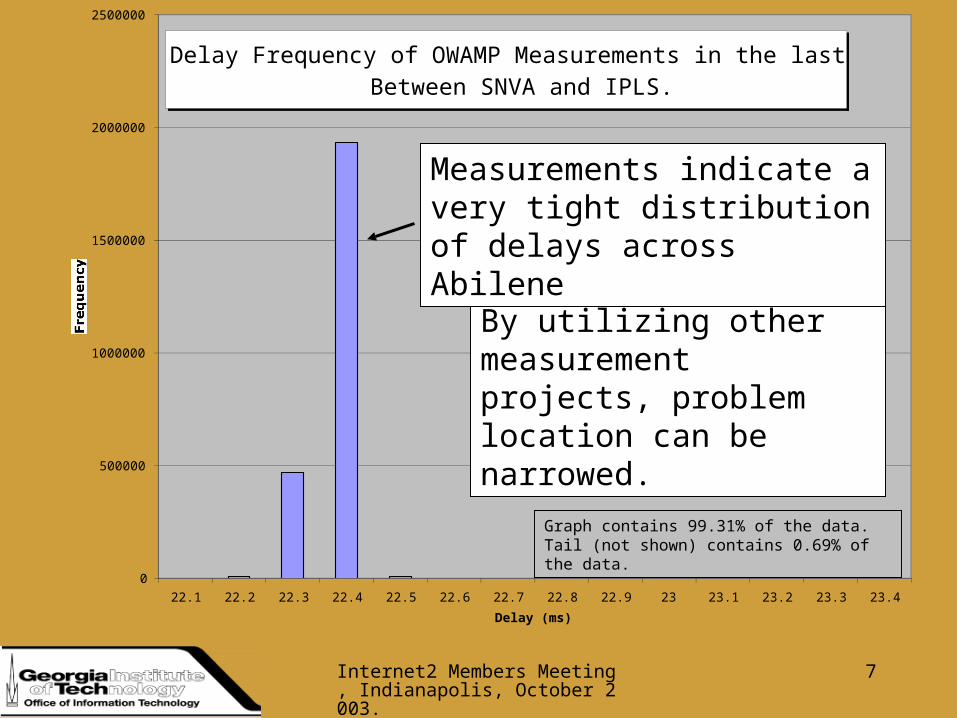
Delay Frequency of OWAMP Measurements in the last 30 days Between SNVA and IPLS.
0
500000
1000000
1500000
2000000
2500000
22.1 22.2 22.3 22.4 22.5 22.6 22.7 22.8 22.9 23 23.1 23.2 23.3 23.4
Delay (ms)
Frequency
Graph contains 99.31% of the data. Tail (not shown) contains 0.69% of the data.
By utilizing other measurement projects, problem location can be narrowed.
Measurements indicate a very tight distribution of delays across Abilene

Internet2 Members Meeting, Indianapolis, October 2003.
8
PublishingPublishingPublishingPublishing
• Unfeasible to look at (possibly Unfeasible to look at (possibly hundreds) of graphs.hundreds) of graphs.
• Publish the data in standard wayPublish the data in standard way• W3C Web Service, GGF OGSI Grid W3C Web Service, GGF OGSI Grid
ServiceService– Currently XMLRPC and SOAP serversCurrently XMLRPC and SOAP servers
Internet2 Members Meeting, Indianapolis, October 2003.
9
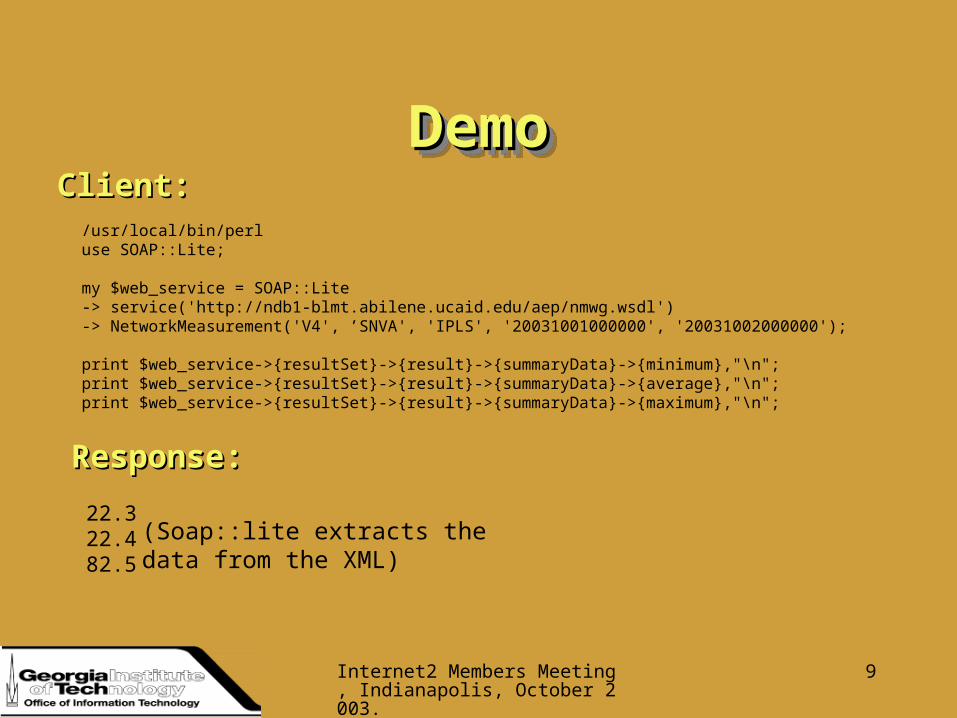
DemoDemoDemoDemo
/usr/local/bin/perluse SOAP::Lite;
my $web_service = SOAP::Lite -> service('http://ndb1-blmt.abilene.ucaid.edu/aep/nmwg.wsdl') -> NetworkMeasurement('V4', ’SNVA', 'IPLS', '20031001000000', '20031002000000');
print $web_service->{resultSet}->{result}->{summaryData}->{minimum},"\n";print $web_service->{resultSet}->{result}->{summaryData}->{average},"\n";print $web_service->{resultSet}->{result}->{summaryData}->{maximum},"\n";
22.322.482.5
(Soap::lite extracts the data from the XML)
Client:Client:
Response:Response:
Internet2 Members Meeting, Indianapolis, October 2003.
10
VisualizationVisualizationVisualizationVisualization
• Numerous tools are being developed to Numerous tools are being developed to assist with visualizing measurements assist with visualizing measurements – Monalisa, Advisor, Internet Detective, Monalisa, Advisor, Internet Detective,
AnemosAnemos• Some will leverage 3rd party Some will leverage 3rd party
measurements via web servicesmeasurements via web services
Internet2 Members Meeting, Indianapolis, October 2003.
11
Fault FindingFault FindingFault FindingFault Finding
• Tools will (or should) provide some Tools will (or should) provide some automated fault-finding as a starting automated fault-finding as a starting point for human interventionpoint for human intervention
• Use techniques such as Tony Use techniques such as Tony McGregor’s plateau concept for AMP McGregor’s plateau concept for AMP and RIPE-TT rolling average to and RIPE-TT rolling average to determine unusual behaviour.determine unusual behaviour.
• Write to logWrite to log
Internet2 Members Meeting, Indianapolis, October 2003.
12
Trouble DetectionTrouble DetectionTrouble DetectionTrouble Detection
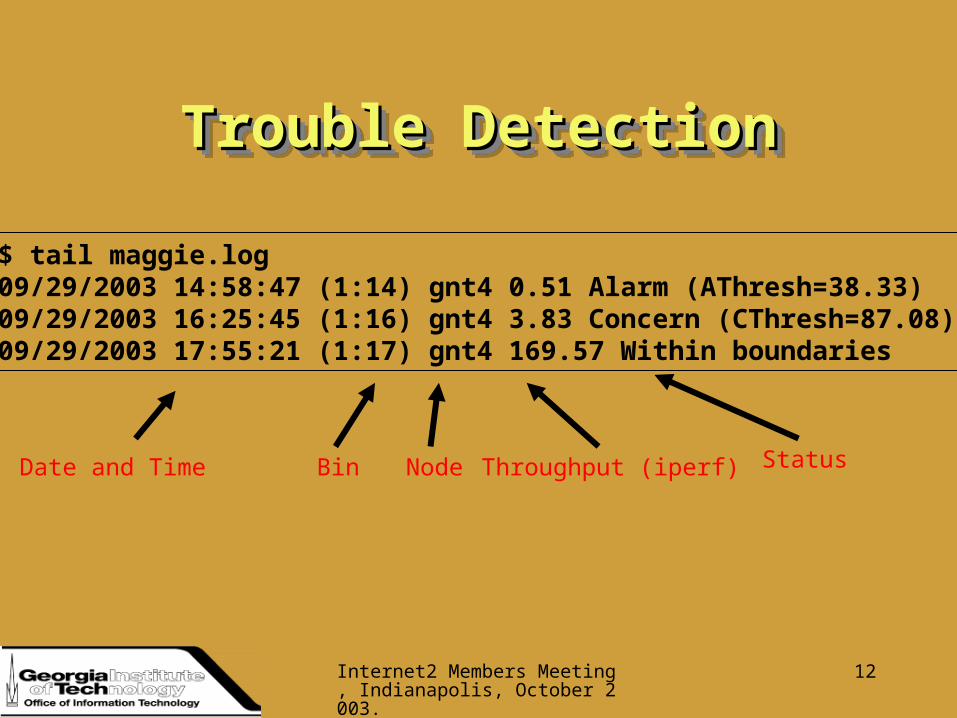
$ tail maggie.log09/29/2003 14:58:47 (1:14) gnt4 0.51 Alarm (AThresh=38.33)09/29/2003 16:25:45 (1:16) gnt4 3.83 Concern (CThresh=87.08)09/29/2003 17:55:21 (1:17) gnt4 169.57 Within boundaries
Date and Time Bin Node Throughput (iperf) Status
Internet2 Members Meeting, Indianapolis, October 2003.
13
Net RATNet RATNet RATNet RAT
• In addition to quantitative In addition to quantitative measurements from ping, iperf etcmeasurements from ping, iperf etc
• NetRAT will provide qualitative NetRAT will provide qualitative classification of nodes, hops and classification of nodes, hops and routes.routes.
• Cross-referencing data will identify Cross-referencing data will identify hotspots (hop.performance = “poor”).hotspots (hop.performance = “poor”).

Internet2 Members Meeting, Indianapolis, October 2003.
14
SummarySummarySummarySummary
• Sites, Networks, Grids must interoperate Sites, Networks, Grids must interoperate to meet the needs of modern science to meet the needs of modern science and demanding applications.and demanding applications.
• A Monitoring Infrastructure consisting of A Monitoring Infrastructure consisting of measurements from many projects measurements from many projects published in standard ways is required.published in standard ways is required.
Internet2 Members Meeting, Indianapolis, October 2003.
15
LinksLinksLinksLinks• IEPM Home Page• Internet2 e2epi and PIPES home page• OWAMP dataOWAMP data• GGF NMWGGGF NMWG• Monalisa, Advisor, Internet Detective, AnemosMonalisa, Advisor, Internet Detective, Anemos• AMP Event DetectionAMP Event Detection