Embed Size (px)
Citation preview
Measurement and targets Final report of the Task Group on Measurement and Targets
Review of social determinants of health and the health divide in the WHO European Region

Measurement and targets Final report of the Task Group on Measurement and Targets
Review of social determinants of health and the health divide in the WHO European Region
Task group members
Martin Bobak University College London
United Kingdom
Claudia Stein WHORegionalOfficeforEurope
Address requests about publications of the WHORegionalOfficeforEuropeto:
Publications WHO Regional Office for Europe UN City, Marmorvej 51 DK-2100 Copenhagen Ø Denmark
Alternatively, complete an online request form for documentation, health information, or for permission to quote or translate, ontheRegionalOfficewebsite (http://www.euro.who.int/pubrequest).
© World Health Organization 2016
Please note that the recommendations contained within this report are not recommendations by WHO but rather represent external expert guidance.
Allrightsreserved.TheRegionalOffice for Europe of the World Health Organization welcomes requests for permission to reproduce or translate its publications, inpartorinfull.
The designations employed and the presentation of the material in this publication do not imply the expression of any opinion whatsoever on the part of the World Health Organization concerning the legal status of any country, territory, city or area or of its authorities, or concerning the delimitation ofitsfrontiersorboundaries.Dottedlinesonmaps represent approximate border lines for whichtheremaynotyetbefullagreement.
Thementionofspecificcompaniesorofcertain manufacturers’ products does not imply that they are endorsed or recommended by the World Health Organization in preference to others of a similar nature that are not mentioned.Errorsandomissionsexcepted, the names of proprietary products are distinguishedbyinitialcapitalletters.
All reasonable precautions have been taken by the World Health Organization to verify theinformationcontainedinthispublication.However, the published material is being distributed without warranty of any kind, either expressorimplied.Theresponsibilityfortheinterpretation and use of the material lies with thereader.InnoeventshalltheWorldHealthOrganization be liable for damages arising fromitsuse.Theviewsexpressedbyauthors,editors, or expert groups do not necessarily represent the decisions or the stated policy oftheWorldHealthOrganization.
Textediting: DavidBreuer
Bookdesignandcoverdesign: Christophe Lanoux John McGill
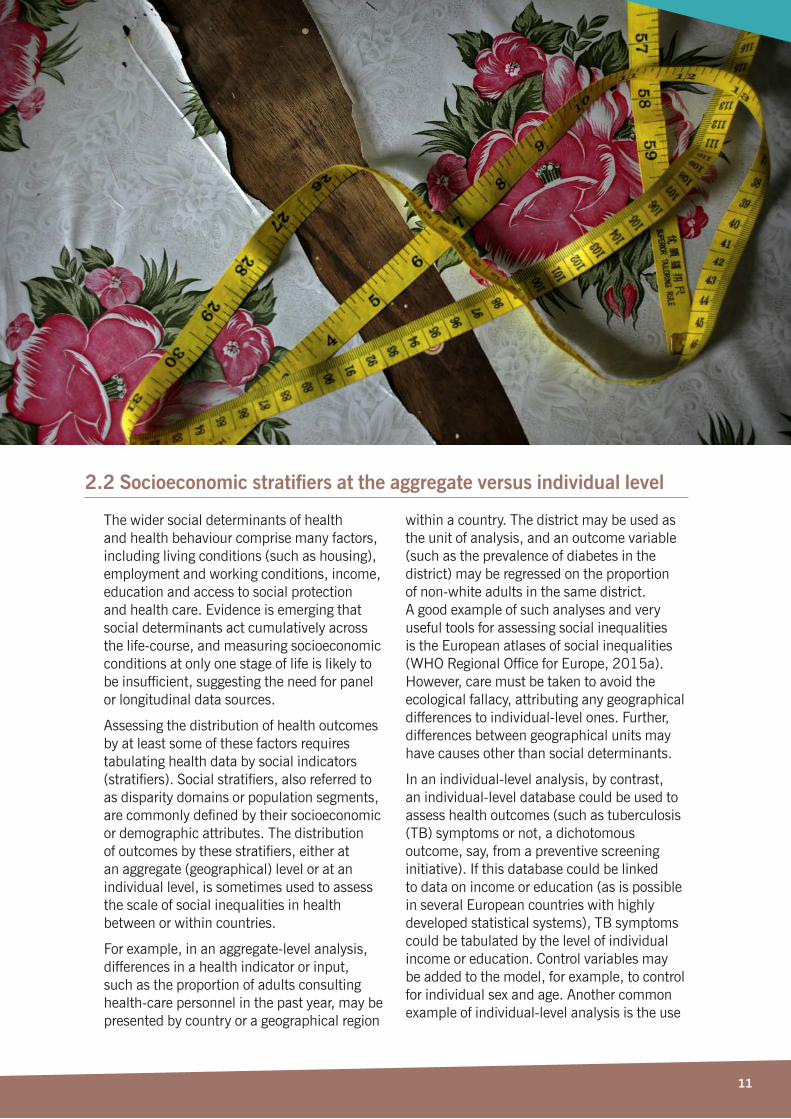
Photocredits: Cover:GuyMartin/PanosPictures Page8:TimSmith/PanosPictures Page11:AbbieTrayler-Smith/PanosPictures Page23:ChrisStowers/PanosPictures
Contents
Task Group members...........................................................................4
Executive summary.............................................................................5
1 Introduction........................................................................................7 1.1 Incomeasakeyresource...............................................................7 1.2TermsofreferencefortheTaskGroupandexpectedoutcomes............7 1.3Reportstructure............................................................................8
2 Key indicators of health and social inequalities......................................9 2.1Commonlyusedindicators.............................................................9 2.2Socioeconomicstratifiersattheaggregateversusindividuallevel......11
3 Data sources and availability in the WHO European Region..................13 3.1Vitalregistration..........................................................................14 3.2Populationcensus.......................................................................15 3.3Otherroutinedata.......................................................................16 3.4Nationalsurveys.........................................................................16 3.5Non-quantitativeandadhocassessments......................................17
4 Recommendations for using existing data............................................19 4.1 Improveormaintainroutinedatacollectionsystems........................19 4.2Plethoraofdatabutlackofsystematicanalysisandreporting..........19 4.3Linkedversusunlinkeddata.........................................................20 4.4Barrierstomonitoringsocialdeterminantsand health inequalities... 21
5 Recommendations for future data collection........................................22 5.1Ensureaminimalsetofvariables..................................................22 5.2Encourageindividual-datalinkage.................................................22 5.3Multinationalsurveys(expansiontowardsnon-EUcountries)............23
6 Target setting....................................................................................24 6.1Useofindicatorsandtargets........................................................24 6.2TargetsettinginHealth2020.......................................................25 6.3Methodsforsettingtargets...........................................................26
7 Overall recommendations of the task group.........................................29 7.1Recommendationsonsettingtargetsfortopictaskgroups...............29 7.2Recommendationsonmonitoringhealthinequalities.......................29
References.......................................................................................30
Annex 1...........................................................................................33
4
Task Group members
Co-chairs
Martin Bobak University College London United Kingdom
Claudia Stein WHORegionalOfficeforEurope
Members
Anton Kunst Academic Medical Centre Amsterdam Netherlands
Michael Murphy LondonSchoolofEconomics United Kingdom
Michal Myck Centre for Economic Analysis CenEA Szczecin Poland and GermanInstituteforEconomicResearchBerlin Germany
Selma Sogoric AndrijaStamparSchoolofPublicHealthZagreb Croatia
5
Background and objectives
Dataonthedistributionofhealth,risk factors and determinants within and between populations are crucial to monitor inequities andinequalitiesinhealth.Monitoringdifferentials between population subgroups across a range of different domains of health is essential to assess the scale of the problem, identify vulnerable groups, set targets and evaluatepolicies.Thisreportsummarizes theworkofthecross-cuttingTaskGroup onMeasurementandTargets.Thetermsofreferenceofthegroupincludedthefollowing:to review the key indicators of health status
and principal dimensions of social determinants of health; sources of data on health outcomes and their social determinants in the WHO European Region; overview of the availability (and, where possible, thequality)ofspecificdataonhealthoutcomes and social determinants across the WHO European Region; make recommendations for future data collection regarding both health outcomes and measures of social determinants of health; and reviewing the recommendations made byothertaskgroups.
Availability of data for monitoring of health inequalities
Across the WHO European Region, the availability and quality of various types ofdatavaryconsiderably.Regardinghealthoutcomes,mortality-basedindicators(such asall-causemortality,cause-specificmortality,infantandchildmortalityandlifeexpectancy)are available in all countries, although the completeness and coding of the causes of deathmayvary.Indicatorsofnon-fatalhealthconditions and risk factors, although highly desirable, are less widely available, depending on the existence of representative sample health surveys or functional systems of population health registries, neither of which areavailableinsomeEuropeancountries.
Dataonsocialdeterminantsofhealthandsocioeconomicstratifiersareoftenretrievedfrom routine statistical data collection and, where available, from health surveys (thereportliststhemostimportantsurveys).However, in many countries routine data do not allow linkage with other health or mortality data other than at the aggregate geographicallevel.Inadditiontothesequantitative data, approaches based on health needs assessment, rapid appraisal and qualitativeandconsensus-buildingtechniqueshave been increasingly used in the policy formulationprocess.
Setting targets
Dataareessentialtosettargets(goals)forimprovement, both at the level of outcome (suchasmortality)andprocess(such as increasing expenditure or introducing legislation).TheHealth2020target-settingprocessadoptedtheSMARTcriteria,which
stipulatesthattargetsshouldbespecific,measurable, achievable, relevant and timely.Targetscanbebothqualitativeandquantitative, but they need to be measurable; thisrequiresadequatedata.
Executive summary

Barriers to monitoring social determinants and health inequalities
The primary challenge to setting targets and monitoring progress on social inequalities in health and, more broadly, social determinants of health, within and between countries in the WHO European Region, is the lack of reliable and standardized data, especially in countries in central and eastern Europe and the former USSR.Otherissues,withvariousdegreesof
importance in different parts of the Region, include:lackofdatathatallowlinkedanalysesof mortality (numerator data are linked with thedenominatorusingindividualidentifiers);restricted access to existing data because of legal or bureaucratic barriers; lack of national funding;andinsufficientcapacityandexpertisetoanalyseandinterpretdata.
Recommendations
The Task Group has made several recommendations.
First, it is essential to maintain and improve routine data collection and to ensure that at leastbasicsocioeconomicdataarecollected.WHO, in collaboration with partners, including theEUandOECD,candefineaminimumsetofvariablestobecollected.Suchdatashouldallow monitoring of both social determinants of health (operating at different stages of the life-course)andofsocialdifferencesinhealthoutcomes and should allow meaningful comparisons both between countries and withincountries.
Second,thereshouldberegularperiodicanalyses and reports assessing trends in social determinants of health and changes ininequalitiesovertime.Ifdataonindividual-level measures of social position are not available,analysescouldusearea-leveldata.
Third,evenintheabsenceofaWHO-recommended minimal dataset, countries should not discontinue collecting data allowing assessment of health inequalities if suchdataarecurrentlycollected.Forexample,some countries in the Region have recently
removed information on educational status fromdeathcertificates.Atpresent,itis no longer possible to assess educational differencesinmortalityinthesecountries.
Fourth, while at present mortality data are more likely to be available for monitoring of inequalities, we encourage the adoption of a standardized national health survey protocol (suchastheEuropeanHealthInterviewSurvey)inallcountriesintheRegion.Wealsoencourage careful consideration of sample sizes for national health surveys, so that the surveyshavesufficientstatisticalpower not only for assessment of current social differentials but also for monitoring of changes in social differentials in health over time (identifying interaction between time and socialstratifiers).
Finally, there should be investment in, and encouragement for, building the capacity for monitoring of social determinants and healthinequalities.Especiallyintheeasternparts of the WHO European Region, expertise in social epidemiology and statistical methods should be developed by providing training andinternationallinks.
6
1.1 Introduction
The regular measurement of health outcomes at the population level provides the information needed to distribute resources andtoplanhealth-relatedinterventions.Monitoring health outcomes between various population groups – at the subpopulation level–isnecessarytoensurethatthebenefitsof interventions are fairly distributed to promotealongandhealthylifeforall.
Monitoring health and risk factors at the level of whole populations is important but isnotsufficient.Inaccordancewiththerecommendations of the Commission on SocialDeterminantsofHealth(2008a), the World Health Assembly advanced health equity as a priority by passing a resolution on reducing health inequities through action on the social determinants of health (World HealthAssembly,2009).Itisnotonlythehealth of whole populations that matters – data on the distribution of health, risk factors
and determinants within populations are crucial to monitor inequities and inequalities intheseindicators.Monitoringtrenddifferentials between population subgroups across a range of different domains of healthisasubstantialexercise.Thereis no consensus as to what is the best measure of health inequalities, and the result of a monitoring programme will be affected by the choice of the measures and the extent to which consistent, timely and accurate dataforpopulationsubgroupsareavailable.
To identify and address health inequities intheMemberStatesoftheWHOEuropeanRegion,theWHORegionalOfficefor Europe commissioned a review of social determinants of health and the health divide in the WHO European Region to strengthen efforts(Jakab,2010).Thisreportsummarizes theworkofthecross-cuttingTaskGroup onMeasurementandTargets.
1.2 Terms of reference for the Task Group and expected outcomes
Any targets are meaningful only if there is some way of measuring progress that is directly relevant to the responsible agency andwiderstakeholders.However,therearelarge differences between the countries in the WHO European Region in the availability and quality of data on health outcomes, common proximal risk factors and on their (moredistant)socialdeterminants.The overall focus of this report is on the availability of data that would make setting targets and assessing progress feasible, especially in countries with less well developed datacollectionandreportingsystems.Nevertheless,therearealsochallenges in countries with better developed systems, suchasdecliningresponseratesinsurveys.
Morespecifically,theTaskGroupsetoutto dothefollowingtasks:
ll to propose a grid of the key indicators of health status and principal dimensions of social determinants of health to serve as guidance for the following;
ll to provide an overview of availability, sources and usefulness of data on health outcomes and their social determinants in the WHO European Region, including both routinely collected data reported toWHO,theEuropeanUnion(EU) and other international organizations and ad hoc studies with internationally comparable methods;
ll to identify gaps and make recommendations for future data collection regarding both health outcomes and measures of social determinants of health; and
ll toreviewthereportsbyspecifictopic groups and to assess the appropriateness and quality of the data used in the reports of topic groups, the quality of evidence reviewed by the reports, how the evidence is evaluated, the appropriateness of the conclusions and recommendations and to ensure that the proposed targets are appropriate,giventheavailability(orlack)ofsuitabledata.
7
1 Introduction

1.3 Report structure
Thereporthasthefollowingstructure. Inthesecondsection,wedescribethepotential indicators of health status, risk factors and socioeconomic factors that can serve for monitoring of socioeconomic inequalitiesbetweenandwithincountries. Inthethirdsection,wereviewthesources and availability of data in the WHO European Region.Inthefourthsection,wediscuss the uses of existing data, including
analysis and reporting and barriers to usingthem.Inthefifthsection,wemakerecommendations as to new data collection that would enhance considerably the monitoringcapacityintheEuropeanRegion.Finally, we review the recommendations ofspecifictaskgroupsanddiscussthelinkagewithothertask-settingeffortsunderwayin theWHOEuropeanRegion.
8
9
2.1 Commonly used indicators
Health status, social inequalities and social determinants may not always be measured directly; several indicators have therefore been proposed in different areas ofpublichealth.Therearemanylistsofhealth indicators, including standard lists of global indicators (such as the WHO Global HealthObservatory(GHO)andtheWHOGlobalBurdenofDisease(GBD);MillenniumDevelopmentGoals(MDG)andSustainableDevelopmentGoals(SDG);indicatorsfor theEuropean(ormostlyEuropean)Region,such as WHO European Health for All (WHO-HFA),EuropeanCommunityHealthIndicators(ECHI),OECDHealthData and Eurostat indicators of the health and long-termcarestrand.Thereisalreadysubstantial harmonization between these indicatorsandtheirmeta-data,andlinkswillfurther be strengthened between the United Nations,WHO,Eurostat,theOECDandother international organizations involved inhealthinformation.SurveyprogrammesincludeDemographicandHealthSurveys(DHS),UNICEF’sMultipleIndicatorClusterSurveys(MICS),WHO’sWorldHealth Survey(WHS)andtheWorldBank’sLivingStandardsMeasurementStudy(LSMS).More localized studies such as the European UnionStatisticsonIncomeandLivingConditions(EU-SILC)andEuropeanSocialSurvey(ESS)alsogeneratestandardhealthindicatorsandmeta-datathatarebecomingincreasinglyharmonized.Annex1provideslinkstothelistofhealthindicatorsources.
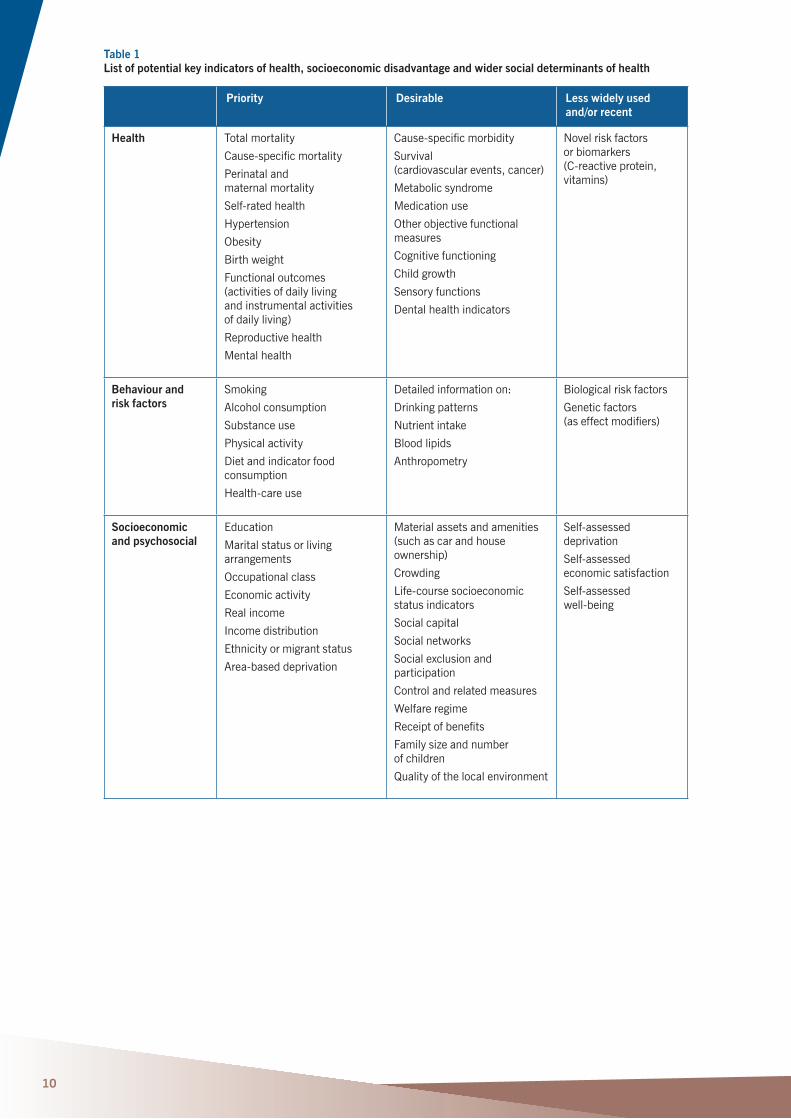
Table 1 summarizes the most commonly used indicators of health status, lifestyle risk factors and social and psychosocial risk factors that may be useful in studying and monitoringofsocialinequalitiesofhealth.
Each of these indicators was further classifiedintothreecategoriesinterms of their priority and feasibility for monitoring healthinequalities–first,thoseofthehighest priority; second, those that are desirable but unlikely to be widely available; andfinally,thosethatmaybepromising but are currently unavailable in most countriesand/orinsufficientlyvalidated.Sections4and5ofthisreportrevisittheissueofpriorityordesirability.Indicatorsofsocioeconomic status are both indicators per sebutarealsocommonlyusedasstratifiersfor health outcomes (used to assess the extentofsocialinequalitiesinhealth).
Mortality-basedindicators(all-causemortality,cause-specificmortality,infant andchildmortalityandlifeexpectancy) have always been the most common, mainly because they are available for the whole population and often at the subnational level by age and sex only in all countries with functioning vital registration systems and because they largely represent objective events.Indicatorsofnonfatalhealthconditions and risk factors, although highly desirable, depend on the availability of representative sample health surveys or functional systems of population health registries, neither of which are available inmanyEuropeancountries.Dataonsocioeconomic factors (and less so on psychosocialfactors)areoftenavailable from routine statistical data collection (andfromhealthsurveys);however,routinedata typically do not allow linkage with other health or mortality data other than at the aggregate geographical level, and even in this case the aggregation may be atarelativelyhighgeographicallevel.
2 Key indicators of health and social inequalities
10
Table 1 List of potential key indicators of health, socioeconomic disadvantage and wider social determinants of health
Priority Desirable Less widely used and/or recent
Health Total mortality
Cause-specificmortality
Perinatal and maternal mortality
Self-ratedhealth
Hypertension
Obesity
Birthweight
Functional outcomes (activities of daily living and instrumental activities ofdailyliving)
Reproductive health
Mental health
Cause-specificmorbidity
Survival (cardiovascularevents,cancer)
Metabolic syndrome
Medication use
Other objective functional measures
Cognitive functioning
Child growth
Sensoryfunctions
Dentalhealthindicators
Novelriskfactors or biomarkers (C-reactiveprotein,vitamins)
Behaviour and risk factors
Smoking
Alcohol consumption
Substanceuse
Physical activity
Dietandindicatorfoodconsumption
Health-careuse
Detailedinformationon:
Drinkingpatterns
Nutrientintake
Bloodlipids
Anthropometry
Biologicalriskfactors
Genetic factors (aseffectmodifiers)
Socioeconomic and psychosocial
Education
Marital status or living arrangements
Occupational class
Economic activity
Real income
Incomedistribution
Ethnicity or migrant status
Area-baseddeprivation
Material assets and amenities (such as car and house ownership)
Crowding
Life-coursesocioeconomicstatus indicators
Socialcapital
Socialnetworks
Socialexclusionandparticipation
Control and related measures
Welfare regime
Receiptofbenefits
Family size and number of children
Quality of the local environment
Self-assesseddeprivation
Self-assessed economic satisfaction
Self-assessed well-being
2.2 Socioeconomic stratifiers at the aggregate versus individual level
The wider social determinants of health and health behaviour comprise many factors, includinglivingconditions(suchashousing),employment and working conditions, income, education and access to social protection andhealthcare.Evidenceisemergingthatsocial determinants act cumulatively across thelife-course,andmeasuringsocioeconomicconditions at only one stage of life is likely to beinsufficient,suggestingtheneedforpanelorlongitudinaldatasources.
Assessing the distribution of health outcomes by at least some of these factors requires tabulating health data by social indicators (stratifiers).Socialstratifiers,alsoreferredtoas disparity domains or population segments, arecommonlydefinedbytheirsocioeconomicordemographicattributes.Thedistribution ofoutcomesbythesestratifiers,eitherat anaggregate(geographical)leveloratanindividual level, is sometimes used to assess the scale of social inequalities in health betweenorwithincountries.
Forexample,inanaggregate-levelanalysis,differences in a health indicator or input, such as the proportion of adults consulting health-carepersonnelinthepastyear,maybepresented by country or a geographical region
withinacountry.Thedistrictmaybeusedasthe unit of analysis, and an outcome variable (such as the prevalence of diabetes in the district)mayberegressedontheproportion ofnon-whiteadultsinthesamedistrict. A good example of such analyses and very useful tools for assessing social inequalities is the European atlases of social inequalities (WHORegionalOfficeforEurope,2015a).However, care must be taken to avoid the ecological fallacy, attributing any geographical differencestoindividual-levelones.Further,differences between geographical units may havecausesotherthansocialdeterminants.
Inanindividual-levelanalysis,bycontrast, anindividual-leveldatabasecouldbeusedtoassess health outcomes (such as tuberculosis (TB)symptomsornot,adichotomousoutcome, say, from a preventive screening initiative).Ifthisdatabasecouldbelinked to data on income or education (as is possible in several European countries with highly developedstatisticalsystems),TBsymptomscould be tabulated by the level of individual incomeoreducation.Controlvariablesmay be added to the model, for example, to control forindividualsexandage.Anothercommonexampleofindividual-levelanalysisistheuse
11
ofindividual-levelsurveys,suchastheEuropeanHealthInterviewSurvey,torelatehealth and social characteristics, such as smoking or drinking, with educational achievement.
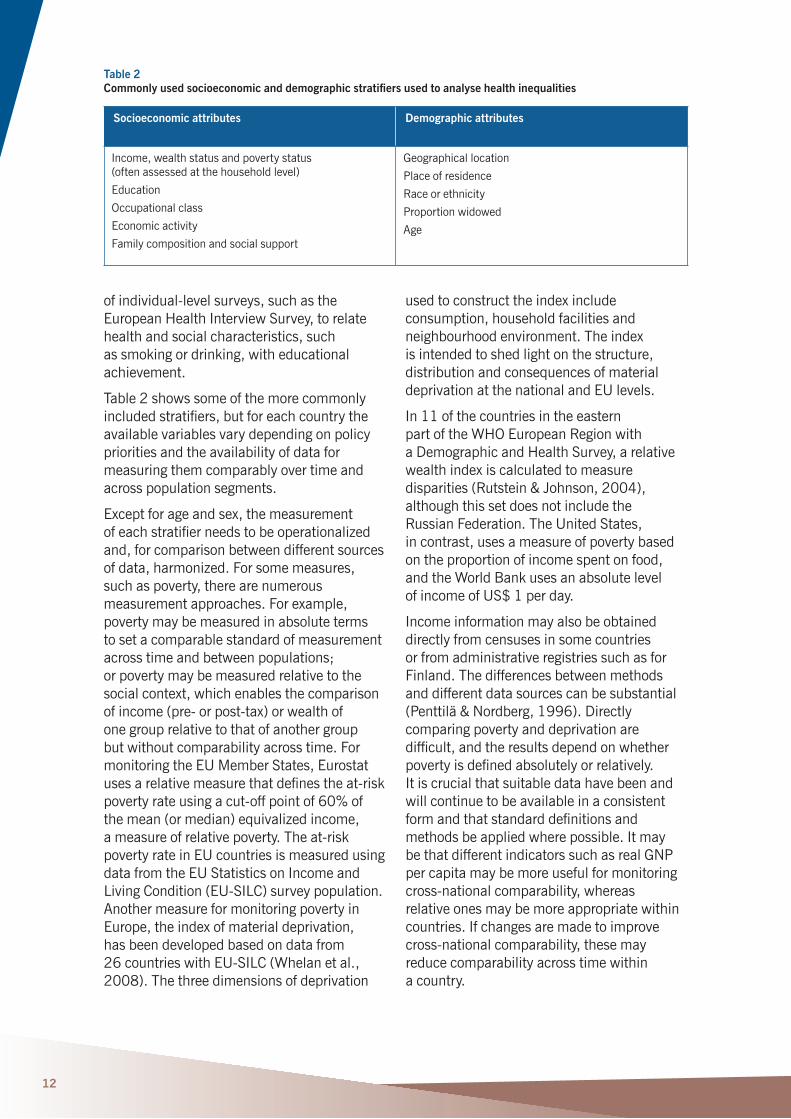
Table 2 shows some of the more commonly includedstratifiers,butforeachcountrytheavailable variables vary depending on policy priorities and the availability of data for measuring them comparably over time and acrosspopulationsegments.
Except for age and sex, the measurement ofeachstratifierneedstobeoperationalizedand, for comparison between different sources ofdata,harmonized.Forsomemeasures,such as poverty, there are numerous measurementapproaches.Forexample,poverty may be measured in absolute terms to set a comparable standard of measurement across time and between populations; or poverty may be measured relative to the social context, which enables the comparison ofincome(pre-orpost-tax)orwealthof one group relative to that of another group butwithoutcomparabilityacrosstime.FormonitoringtheEUMemberStates,Eurostatusesarelativemeasurethatdefinestheat-riskpovertyrateusingacut-offpointof60%of themean(ormedian)equivalizedincome, ameasureofrelativepoverty.Theat-riskpoverty rate in EU countries is measured using datafromtheEUStatisticsonIncomeandLivingCondition(EU-SILC)surveypopulation.Another measure for monitoring poverty in Europe, the index of material deprivation, has been developed based on data from 26countrieswithEU-SILC(Whelanetal.,2008).Thethreedimensionsofdeprivation
used to construct the index include consumption, household facilities and neighbourhoodenvironment.Theindex is intended to shed light on the structure, distribution and consequences of material deprivationatthenationalandEUlevels.
In11ofthecountriesintheeastern part of the WHO European Region with aDemographicandHealthSurvey,arelativewealth index is calculated to measure disparities(Rutstein&Johnson,2004),although this set does not include the RussianFederation.TheUnitedStates, in contrast, uses a measure of poverty based on the proportion of income spent on food, andtheWorldBankusesanabsolutelevel ofincomeofUS$1perday.
Incomeinformationmayalsobeobtaineddirectly from censuses in some countries or from administrative registries such as for Finland.Thedifferencesbetweenmethodsand different data sources can be substantial (Penttilä&Nordberg,1996).Directlycomparing poverty and deprivation are difficult,andtheresultsdependonwhetherpovertyisdefinedabsolutelyorrelatively. Itiscrucialthatsuitabledatahavebeenandwill continue to be available in a consistent formandthatstandarddefinitionsandmethodsbeappliedwherepossible.Itmay bethatdifferentindicatorssuchasrealGNPper capita may be more useful for monitoring cross-nationalcomparability,whereas relative ones may be more appropriate within countries.Ifchangesaremadetoimprovecross-nationalcomparability,thesemayreduce comparability across time within acountry.
12
Table 2 Commonly used socioeconomic and demographic stratifiers used to analyse health inequalities
Socioeconomic attributes Demographic attributes
Income,wealthstatusandpovertystatus (oftenassessedatthehouseholdlevel)
Education
Occupational class
Economic activity
Family composition and social support
Geographical location
Place of residence
Race or ethnicity
Proportion widowed
Age
13
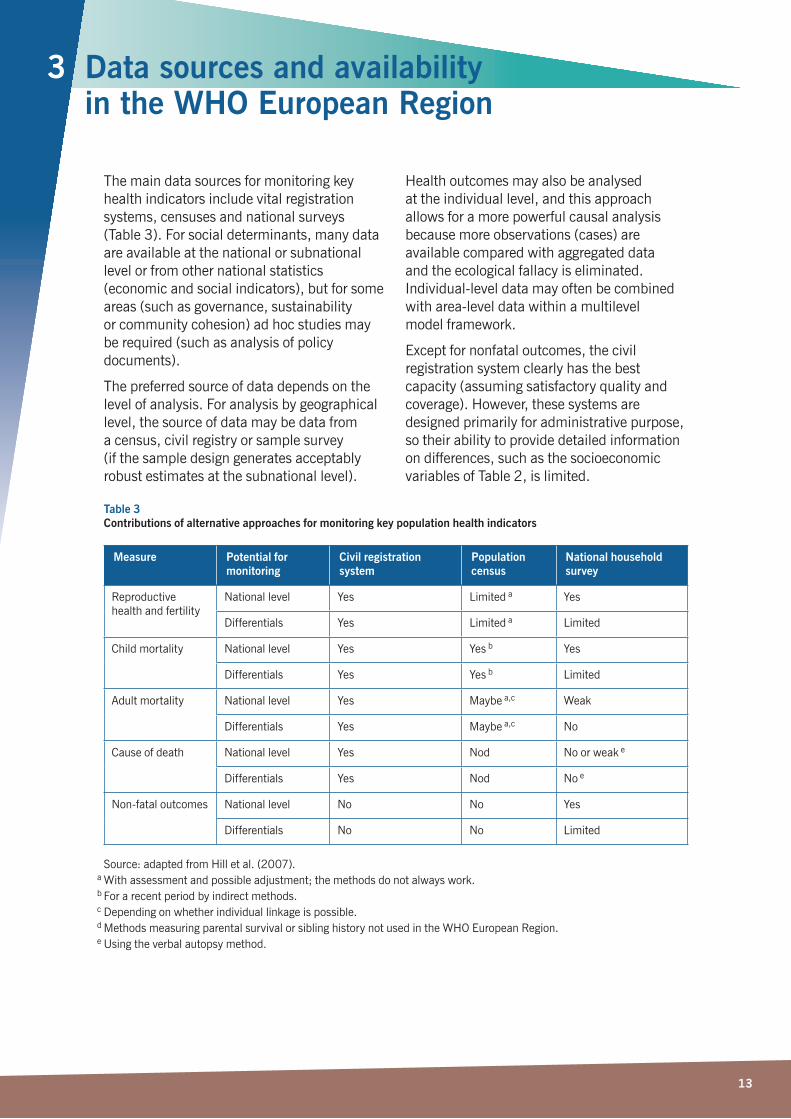
The main data sources for monitoring key health indicators include vital registration systems, censuses and national surveys (Table3).Forsocialdeterminants,manydataare available at the national or subnational level or from other national statistics (economicandsocialindicators),butforsomeareas (such as governance, sustainability orcommunitycohesion)adhocstudiesmaybe required (such as analysis of policy documents).
The preferred source of data depends on the levelofanalysis.Foranalysisbygeographicallevel, the source of data may be data from a census, civil registry or sample survey (if the sample design generates acceptably robustestimatesatthesubnationallevel).
Health outcomes may also be analysed at the individual level, and this approach allows for a more powerful causal analysis becausemoreobservations(cases)areavailable compared with aggregated data andtheecologicalfallacyiseliminated.Individual-leveldatamayoftenbecombinedwitharea-leveldatawithinamultilevel modelframework.
Except for nonfatal outcomes, the civil registration system clearly has the best capacity (assuming satisfactory quality and coverage).However,thesesystemsaredesigned primarily for administrative purpose, so their ability to provide detailed information on differences, such as the socioeconomic variablesofTable2,islimited.
3 Data sources and availability in the WHO European Region
Table 3 Contributions of alternative approaches for monitoring key population health indicators
Source:adaptedfromHilletal.(2007).a Withassessmentandpossibleadjustment;themethodsdonotalwayswork.b Forarecentperiodbyindirectmethods.c Dependingonwhetherindividuallinkageispossible.d MethodsmeasuringparentalsurvivalorsiblinghistorynotusedintheWHOEuropeanRegion.e Usingtheverbalautopsymethod.
Measure Potential for monitoring
Civil registration system
Population census
National household survey
Reproductive health and fertility
Nationallevel Yes Limited a Yes
Differentials Yes Limited a Limited
Child mortality Nationallevel Yes Yes b Yes
Differentials Yes Yes b Limited
Adult mortality Nationallevel Yes Maybe a,c Weak
Differentials Yes Maybe a,c No
Cause of death Nationallevel Yes Nod Noorweak e
Differentials Yes Nod No e
Non-fataloutcomes Nationallevel No No Yes
Differentials No No Limited
14
Nationalpopulationsurveysarestrong on measuring nonfatal outcomes and risk factors and thus complement the information fromthevitalregistrationsystem.Surveys are clearly useful for identifying differences inlevelsbetweensubgroupsand/orforidentifyingnational-levelchangessometimesrequiringaggregatingdatafromseveralyears.Insomecases,largesurveyshavebeenusedto detect changes over time when the changes and groups involved were large (such as smoking inequalities among women in the 1990s).However,thedegreeofprecisionrequired for monitoring subgroup differences
in targets means that they usually cannot be reliably tracked with typical sample survey sizes.Nevertheless,regularsurveysareone of the few data sources on health inequalities availabletodocumentchangeovertime.
The data from censuses are the weakest for monitoring health indicators, but censuses provides important geographical and social stratifiers,thedenominatorsforpeopleat riskandpossiblysamplingframesforsurveys.Insomecountries,censusdatamaybe linked with vital registries and possibly other data to provide both more detailed androbustestimates.
3.1 Vital registration
Informationonthedistributionofbirths,deaths and causes of death is fundamental in monitoring regional health and population changes.Awellfunctioningcivilregistrationsystem produces a complete enumeration of vital events at the regional and local levels and is therefore important for monitoring ofsometypesofhealthinequalities.Aseriesof articles in The Lancet in 2007, “Who counts?”, serves to highlight the importance of civil registration systems – as permanent, compulsory, continuous and universal reporting systems – as the best source ofvitalstatistics(AbouZahretal.,2007; Hilletal.,2007;Mahapatraetal.,2007;Seteletal.,2007).Virtuallyallofthemortalityindicators, but not nonfatal outcomes, use vitalregistrationdatadirectlyformonitoring.Vitalregistrationdatamaybeanalysedwithoutadditionaldata,suchascause-specificdistributionsofdeath(cause-specificdeath as the numerator and total number ofdeathsinaspecificageandsexcategory asthedenominator)orinfantmortality (the total number of infant deaths as the numerator and the total number of live birthsasthedenominator).
However, the quality of socioeconomic stratifiers,whenavailable,islikelytobelowsince such information is typically not a high priorityinsuchsystems.Mostmortalityindicators,suchasage-andsex-specific
mortality rates and life expectancy by region, use vital registration, with estimates for thenumberofpeopleatrisk(denominator).These are usually obtained from the census or updates to the most recent census together with migration estimates, which are often problematic, especially at the subnationallevel.
The extent to which these mortality rates may be subjected to equity analysis depends onwhetherthesamestratifiersarecollected invitalregistrationandinthecensus.However, there are several caveats to such analyses.First,theinformationinthecensusmay not correspond with the mortality data, and second, using the numerator and the denominator from separate sources, while a logical approach in theory, can lead tobiasedresults(seeSection4).
Dataondeaths,includingcauseofdeathbyage and sex, are submitted to WHO annually, andtheinformationisfreelyavailableonline.OECDandEUcountriesalsocollectthese data annually and have harmonized their reporting periods with WHO to reduce the reporting burden on countries (World Health Organization,2015a;WHORegionalOffice forEurope,2015b,c).
The potential for monitoring disparities in mortality outcomes with vital registration data, whereappropriatestratifiersareavailable,
15
requires that accurate data be collected, which may be problematic to establish unless reporting is largely complete (close to 100%coverage)andunbiased.OneoftheissuescomplicatingaEurope-widemonitoringsystem is the differences in the completeness of mortality registration between countries; the estimated completeness of death registrationiscloseto100%inwesternEuropean countries but lower in some but not all countries in the eastern part of the WHOEuropeanRegion.Regardingthepotential biases, it should be established, usually from specialists in the country who are most familiar with coverage issues, whether unreported deaths are disproportionately highamongspecificpopulationgroups(suchas Roma, unemployed people, remote areas
orreligioussects).Ifsuchdataarereported,the issue of potential bias should be documented and, if the data are used, a correction made for the analysis (also clearlydocumented).
The accuracy of cause of death reporting also needs to be established (Mahapatra etal.,2007;Mathersetal.,2005).WHO has recently developed useful tools that can be used to assess the quality of data from vitalregistrationsystems(AbouZahretal.,2010;WorldHealthOrganization,2015b). Inaddition,thenationalburdenofdiseasetoolkit(WorldHealthOrganization,2015c)provides numerous templates to assess accuracy and completeness as well as to calculate various measures of burden of disease(WorldHealthOrganization,2015c).
3.2 Population census
A census, a complete enumeration of the population, provides a rich source of demographic and socioeconomic data for the entire population at the national and subnational levels once every 10 years or so.Thecensusalsoprovidesacost-effectiveopportunity to collect data for estimating fertility and mortality rates at the national andsubnationallevels.Sincethelatest census data is usually some years out of date, estimates should be updated regularly by anofficialbody,todisseminateupdated age and sex structure estimates that can be used as denominators (number of people atrisk),mainlyforgeographicallybasedinequityanalyses.
Many countries in Europe now use an alternative to the traditional, direct enumerationtoconductacensus.Forexample, continuously updated population registries were being used in 2011 in 20 of27EUcountries(Valente,2010).Sixcountries take their census solely based on information in population registries (Austria,Denmark,Finland,theNetherlands,NorwayandSweden);theothersusing
population registries complement data in registries with further information from enumerationorfromsurveys.Althoughmostcountries in the eastern part of the European RegionaswellasIreland,Luxembourg,Portugal and the United Kingdom continue to conduct the traditional census enumeration every 10 years, there is a trend towards movingtoregistry-basedmethods.
Linking census data and other data at an aggregate level such as geographical area, either for estimating rates or for analysing relationships between summary measures (such as from administrative data on breast examinationcoveragewiththemediansalary),requires that the data sets relate to the same geographicalunitinthesamedistrict.Thesame applies for other subpopulation analyses suchasoccupationalgroup.Thecensusenumeration area is commonly the smallest territorial unit and is often used as a primary or secondary sampling unit in probabilistic samples for household surveys, and it can also serve as the smallest geographical unit at which health and social characteristics can belinked(usingaggregatedata).
16
3.3 Other routine data
Other routinely collected data are available at the country level (such as economic parameters, social statistics and education data).Regardinghealth,potentiallyvaluableroutinely collected information includes the hospital discharge data, some of which are available via WHO, such as the European Health for All database (WHO Regional OfficeforEurope,2015b).
Forcross-nationalcomparisons,thereareseveral international datasets of indicators ofdevelopmentsuchastheWorldDataBank(WorldBank,2015),whichconsistsofmorethan1000series,andtheUnitedNations(2015)setofsocialindicators.ThebestknownsetistheannualUnitedNationsDevelopmentProgramme(2015)HumanDevelopmentIndex(HDI).TheHDIcombinesinformation on income, adult literacy and
school enrolment and has associated indicators sets such as the Gender EmpowermentMeasure(GEM),the Gender-relatedDevelopmentIndex(GDI) andtheHumanPovertyIndex(HPI).Suchdata are readily available over time in internationally comparable form, but they arenotpublishedatthesubnationallevel.
The availability of subnational data will vary from country to country, but it is important that data be available using common geographical and socioeconomic classificationssothemaximuminformationcanbeobtained.TheWHOEuropean Equity in Health project, for example, provides atlases of several conditions and socioeconomic parameters at the national and subnational levels (WHO Regional OfficeforEurope,2015d).
3.4 National surveys
Surveysareanincreasinglyimportantsourceof data on population health and social inequalities in health, especially on outcomes andsocioeconomicstratifiersthatarenotcaptured in national vital registration systems (O’Donnell,2009).Unfortunately,manyEuropean countries do not have reliable specialized national health surveys, mainly because of the high cost and logistical requirementsofconductingsuchstudies. Inaddition,repeatedcomparablesurveys are required to monitor changes over time andtoassesstheeffectsofpolicies.
There are other challenges and biases related to collecting and analysing these types ofdata.Aquestionnaireinstrumentthatwillproduce valid and reliable estimates is one challenge.Evenresponsestobasicquestionsonself-reportedhealthvarysubstantiallyacross population subgroups and countries, makingmeaningfulcomparisonsdifficult.Another challenge is to design a nationally representative sample that provides valid data atthesubnationalleveland/orforpopulationsegments.Thisisdifficult,partlybecauseresponse rates are rapidly declining all over Europe.Forexample,intheongoingstudyonglobal ageing and adult health (World Health
Organization,2015d)conductingsurveys oftheolderpopulationinFinlandandSpain,theresponseratesarebetween45%and60%.Thisisnotatypicalofotherrisk-factorsurveysconductedrecentlyinthesecountries.With almost half the subjects invited not participating, substantial selection bias isverylikely.Especiallyforbehaviourperceived as socially undesirable (heavy drinking,substancemisuseandsmoking),surveys are likely to underestimate the real prevalence, because of both reporting bias (respondersoftenunderreportsuchbehaviour)and selection bias (the people engaged inhigh-riskbehaviourarelesslikelytoparticipate).Similarly,themostmarginalizedgroups (materially deprived, low education, unemployedpeopleandhomelesspeople) are underrepresented in such surveys, and thismaybiastheextentofsocialinequalities.For biomarker data, response rates are considerablelower;intheHealthSurvey for England, response rates for a fasting bloodsamplewerelessthan10%insomeethnicgroups.
As mentioned above, national population health surveys are most useful for monitoring inequalities in nonfatal health outcomes or in risk factors such as differential

17
patternsofsmoking.However,dependingonthe purpose of the study, the characteristics of the chosen indicator and the size of the sample, a given indicator may or may not be measurable with acceptable precision atthesubnationallevelor/andforpopulationsegments since changes over time rather thanabsolutelevelswillbeofspecialinterest.When even a large survey is broken down intoage-,sex-andeducation-specificstrata,the numbers of events in each of the strata maybetoosmallforrobusttrendanalysis.
The main focus of this report is on monitoringhealthinequalities.Forthispurpose,wellconductedcross-sectionalstudies in representative samples are sufficient.However,forformulatingpolicy,understanding the causal associations and causalchainsisalsoimportant.Forsuchaetiological purposes, longitudinal studies with repeated measurements of the same individualsareoftenneeded.Therearesomesuch large nationally representative studies
inEurope(suchasSHARE,ELSAandECHP),but these studies are much less common and not available in many countries of the WHOEuropeanRegion.
Annex 1 provides a list and brief description ofmulti-countrysurveyprojectsinEuropeancountries.Inadditiontotheseprojects,thereare numerous national or regional health surveys that have been conducted in many European countries that are not included in this list (such as regional health surveys conductedregularlyinSpain).Therearefurther surveys that do not have health as the primary focus, but may contribute limited health-relatedinformationor,morelikely,conditions within population segments, such as regular income or household budget surveys.Aconvenientresourcetocheckforothernon-healthsurveysistheInternationalHouseholdSurveyNetworkcentralsurveycatalogue(http://surveynetwork.org/home/?q=activities/catalog/surveys).
3.5 Non-quantitative and ad hoc assessments
The main data sources for monitoring of key health indicators (vital registration system, censusandnationalsurveys)areoftennotsufficientforhealthplanning,especiallyat thelocallevels.Traditionalquantitativeandaggregated data do not include community input(opinionandattitude)andparticipation.Duringthepasttwodecades,programmessuch as the WHO European Healthy Cities Network(WHORegionalOfficeforEurope,2015e)suggestedthathealthneedsassessment had to be reoriented from pure monitoring towards identifying and solving community health problems and encouraged usingappliedresearchforsuch.Theintroductionofqualitativeandconsensus-building techniques in the policy formulation process can improve mutual understanding andcollaborationamongpolicystakeholders:politicians, administration, public health professionalsandcommunities.
Partnership with communities (to which much lipserviceisoftenpaid)iscrucialformoreefficientpracticesinassessinghealthneeds.Community input will help to develop better understanding of existing problems and their determinants and to assist in assessing the
adequacy of existing health resources established(putinplace)toaddresshealthneeds.Duringthepasttwodecades,varioustypesofparticipatory,subgroup-oriented,qualitative methods have been developed, buttheyremainunderused.
A good example is the rapid appraisal to assess community health needs used bytheCroatianHealthyCitiesNetwork. This method combined three information sources:(1)theexistingquantitativehealthindicators,(2)participants’essaysand (3)participantobservations.Combined withatwo-dayconsensusconference,thisapproachenablescities:
ll to assess health in the city and serve as thebaseforcreatingthecityhealthprofile;
ll to select priority areas for the healthy city project;
ll to establish the working groups on priority areas; and
llbuilding on the previous steps, to contribute to the development of a city action plan forhealth.

18
The advantages of this method are that itisrapid(canbedoneinaveryshorttime),inexpensive,scientific,sensitive,participatory(involvingallmajorinterestparties:politicians,expertsandcitizens)andable to produce immediate action and to sustain gainedbenefits.
From 1996 to 2011, the rapid appraisal wasappliedin12Croatiancities.The methodprovidedascientificallybasedaccountofhealthineachcityandidentifiedtargetsforthefuturebyusinghealth-related measures and citizens’ observations about thecommunity,itsproblemsandpotential.The academic credibility of the described method was strengthened by establishing strict selection rules for participants and panels and by the process of triangulation of information sources (essays, observations andcollectedquantitativeindicators)andresearchers(expertsofdifferentbackgrounds:public health, epidemiology and medical informationscience).
Rapid appraisal can also be used in assessing the effect of an intervention in a short period of time (within a time frame of 1–5 years fromthebeginningoftheintervention) bymeasuringseveralaspectsofsuccess:
ll effect on the political environment (macroenvironment)–assessmentoftheachieved degree of change in the political environment;
ll effect on a project user – an individual, a group, a community, within the meaning ofempoweringusersandinfluencinghealth;
ll effect on a project manager – an organizationorinstitution:anassociation orgroup(microenvironment);and
llmonitoring the effectiveness of the implementationprocessofanintervention.
A naturalistic approach, purposeful and chain sampling, key informant techniques and policy analysis have also been introduced intohealthneedsassessment.Oneoftheadvantages is that it can provide the views of thehard-to-reachorunderservedsegments ofthepopulation.Qualitativedatacollectedthrough interviews, observation or focus groups provide a rich and detailed description, emphasizing the context in which the experience occurs and enabling insight into and deep understanding of a process, which isnotpossiblebyusingothermethods.
Animportantbenefitfromtheuseofqualitative analytical approaches and participatory methods is greater participation in planning and managing the resources for health from the municipal and regional level tothenationallevel.Thecombineduse of both qualitative and quantitative methods is particularly useful, because qualitative analysis provides a corrective mechanism informulatinghealthpolicy.
19
4 Recommendations for using existing data
An important challenge to setting targets and monitoring progress on social inequalities in health and, more broadly, social determinants of health, within and between countries in the WHO European Region is a lack of reliable and standardized data, especially in countries
intheeasternpartoftheRegion.Inaddition to lack of availability of reliable data, there is also the issue of the variable capacity to analyse and interpret the existing information acrosstheRegion.
4.1 Improve or maintain routine data collection systems
As described in previous sections, vital registration systems vary greatly between countries.Thecompletenessofdeathregistrationmayvaryfromaslowas75%to100%,andtheconsistencyofcause-of-deathcodingmayalsovarysubstantially.Equallyimportant is the variation between countries inlinkingthehealth-relatedindicatorswithsocioeconomicstratifiers.Inmostcountries,someaggregate-levellinkageofhealth-relatedoutcomes and other data is possible at the geographical level but less commonly with non-geographicalstratifiers(suchasusinginformation on education from death certificatesinthenumeratorandeducationaldatafromcensusesinthedenominator).Individual-levellinkageofhealth-relatedorsocioeconomic characteristics at the individual level (such as education or unemployment byethnicity)fromvarioussourcesisnotpossibleinmanycountries.
Itisimportanttoensurethatatleastsomesocioeconomicstratifiers(suchaseducation)be available in different types of data collection(vitalregistrationandcensus)in a consistent form for each country to ensure that at least minimal sets of comparable analyses of social inequalities in health can be done in a many countries as possible without compromising the ability to make avalidtrendcomparisonwithinthecountry. Itiscrucialthatcountriesthatcurrently collectsomesocioeconomicstratifiersas part of vital registration (such as education ondeathcertificates)notdiscontinue thispractice.Forexample,inLatviaand the Russian Federation, the question about education was omitted from death records; as a consequence, using this key source to monitor educational inequality in these countriesinthefuturewillbeimpossible.
4.2 Plethora of data but lack of systematic analysis and reporting
Incontrast,countriesinsomepartsoftheEuropeanRegionmayhavetoomanydata.For example, most of the indicator lists mentionedinSection3haveabout100indicators.Cross-countrycomparisons of these indicators are certainly valuable to identify disparities between countries at the national level, but monitoring most of these indicators from an equity perspective is not realistic,particularlywithineachcountry.Onthe other hand, comprehensive indicators that combine mortality and morbidity indicators in asingleoutcome,suchasdisability-adjustedlife-yearsordisability-freelifeexpectancy,often do not have a clear link to changes in riskfactorsortopolicyinitiatives.
Similarly,theincreasingnumberofsurveysdoes not necessarily add to or improve theevidencebase.Conductinganationallyrepresentative survey is a complex operation, and even with a good design, the survey could still produce data of low quality if the execution is not adequate or if people refuse toparticipate.
Therefore,oneofthefirststepsinsystematically monitoring health equity is to set priorities and select a reduced set of operational indicators (operational means the ability to analyse health indicators by geographicalorsocioeconomicstratifiers). The choice of equity indicators depends on
20
different aspects such as methodological quality, data availability, added burden if new or altered data collection is needed and the politicalimportanceoftheindicatortopic.Where survey data are used, the following should be considered (Commission on SocialDeterminantsofHealth,2008b):
ll representativeness – based on a probabilistic sample designed to be statistically representative of the population segment of interest;
ll statisticalpower–thesampleissufficientlylarge to obtain health outcomes with
acceptable precision for the population segment and to monitor trends over time;
lldata quality and methods – the questionnaireinstrumentandfieldworkfacilitates reliable and valid results;
ll consistency and comparability of data collection – the method of data collection allows for comparisons over time and across areas or countries;
ll georeferencing – necessary for data linking with other sources at subnational levels; and
ll the frequency with which surveys are conducted–atleasteveryfiveyears,dependingontheindicatorbeingmeasured.
4.3 Linked versus unlinked data
InmanycountriesintheWHOEuropeanRegion, studies of sociodemographic and socioeconomic inequalities in health have to relyinpartoncross-sectionalcensus-unlinkeddata; “unlinked” means that information on socioeconomic status was provided separately forthenumerator(mortalityrecords)anddenominator(census).Despiteextensive use of unlinked data in studies on social inequalities in mortality in the absence of alternatives, there has been a consensus thatthesefindingsmaybebiased(Kunst etal.,1998,2004;Lévy&Vallin,1981;Shkolnikovetal.,2007;Vallin,1980).Thebias originates from a discrepancy between the sources of establishing numerator (death records)anddenominator(censusrecords);hence the term numerator–denominator bias.Thenumerator–denominatorbias occurs because the information provided by individualsinthe(mainlystatisticallydriven)census may differ substantially from the corresponding information provided after death by a proxy informant via (mainly administrativelydriven)registration.
This bias may cause substantial distortions insocialgroup-specificmortalityestimatesbased on unlinked data that can lead to misleading estimates of the magnitude (or evendirection)ofsocialinequalityinmortality(Kunstetal.,1998,2004;Vallin,1980).
Anin-depthmatchingstudycomparing death and census record data on education in Lithuaniafoundverysignificantmisreporting
of education in death records for both menandwomen(Shkolnikovetal.,2007).The reporting bias originated from both overstatement and understatement of education in death records, leading to substantial overstatement of inequality inmortalitybyeducationinthecensus-unlinkeddata.
Among socioeconomic variables, occupation isprobablythemostcommonlyusedindicator.Significantmisreportingofoccupationin death records, compared with census, has been reported from many countries – England andWales,theUnitedStatesandFrance.Similarbiashasbeenreportedforstudies of ethnic differences in mortality from several countries.ArecentstudyinLithuania,forexample, found that mortality rate ratios in unlinked data showed mortality in the Russian and “other” groups to be lower than in Lithuanians,whereasthecensus-linkeddataledtooppositeresults(Jasilionisetal.,2011).
Biaseddatawillnotnecessarilyproduce biased estimates of change as long as the bias remains constant, but care needs to be exercised.Dataqualitystudiessuggestthatnumerator–denominator bias in unlinked data by occupation may take different directions and affect the estimates of the magnitude ofinequalityindifferentways(Kunstetal.,1998;Leinsaluetal.,2009).Forexample, the numerator–denominator bias tended to result in underestimation of the mortality differential by occupation in France, whereas it
21
was responsible for overestimation of the same differentialinEngland&Wales(Kunstetal.,1998).Kunstetal.(2004)alsodemonstratedhowdeficienciesinunlinkeddatamaylead to wrong conclusions about the directions oftrendsinmortalityinequalitybyoccupation.
Insummary,theevidenceisconsistentinthefindingthatthenumerator–denominatorbiasaffects the estimates of mortality differentials
byvarioussocioeconomicstratifiers.Thedirection of the bias is not always identical, but the bottom line is that unlinked data may provide imprecise and potential misleading estimates of the magnitude and possibly trendsininequalities.Itisthereforedesirabletouse,wherepossible,linkeddata.TheEurothine project provides useful information oncountrieswheresuchdataareavailable.
4.4 Barriers to monitoring social determinants and health inequalities
The primary barrier to analysing and monitoring health inequalities and social determinants of health in the WHO European Regionistheavailabilityofdata.Eachcountryhas at least some data (such as at the geographicallevel)but,giventhediversity of the WHO European Region, the types ofavailabledatadifferconsiderably.
However, even when data exist, there are several secondary barriers to their effective use.Ingeneral,someoftheissuesdescribedbelow are more pertinent in the eastern part oftheRegion(Bobak,2009).
First, access to data for nongovernmental bodies is often restricted while government institutions may not have the capacity to analysedataoninequalities.Thiscanarise fortworeasons.First,insomecountriesaggregate(geographical)dataarenotbeingmadeavailable.Thisisprobablyrelatedtothefact that assessing and monitoring inequalities in health and social determinants of health is not perceived as important, often because thereisnotraditionforthis.Second,fordataprotection reasons, data containing individual identifiersthatallowlinkagebetweenregistries (such as population and cancer registries)arevirtuallyinaccessibleinsomecountries.Someofthereasonsrelatetodataprotectionandconfidentialitylaws(althoughlegislation alone may not be the primary issue, as linkage studies are routinely doneinScandinaviancountrieswithout anyproblems).
Second,especiallyinthecountriesintheeastern part of the Region, there is lack of national funding and, occasionally, dependence on international funders to conduct health surveys, including studies of determinantsofhealthandhealthinequalities.
Although many such studies are extremely valuable, this also means that these studies are usually not coordinated within countries becausethefundingisoftenshort-term andfromanoutsideentity.Fundingfromdonors or outside research groups often requires focus on particular research topics that drive the sample and questionnaire design and the timing, resulting in survey information that may be either duplicated ornotcomparablewithothersurveys. Inaddition,disproportionateinvestmentinsurvey information risks not putting enough attention and investment into strengthening routine data sources, such as civil registration, administrative data from health facilities and surveillance systems and developing populationregistries.
Finally, an important barrier to monitoring social inequalities in health in some countries is the lack of research infrastructure and expertise, especially in some of the countries intheeasternpartoftheRegion.Theresearchbase in demography, epidemiology, sociology and related disciplines is often small, and few researchers have experience with designing population-basedstudies.Amajorissue isinsufficientexpertiseinstatisticalanalysis ofhealth-relateddata,evenifdataexist.Developinglocalresearchcapacitythroughinternational collaboration and formal and informal training is an important prerequisite for studying and monitoring social determinantsofhealth.
However, as health inequalities emerge as an important topic, some countries may perceive the need to monitor these inequalities, and these secondary barriers willberemoved.
22
5 Recommendations for future data collection
As described above, both target setting and monitoring require measurable indicators of health, health behaviour, biological risk factors, socioeconomic and psychosocial factorsandwidersocialdeterminants. Inmanycountries,dataonawideset
of indicators are already being collected, oftenperiodically.Inmanyothercountries,however, data are often not available or notreliable.Itismainlythissecondgroup ofcountriesthatneedsguidance.
5.1 Ensure a minimal set of variables
Itisunrealistictoexpectthatcountrieswithsparse data would be able to collect data onverylonglistsofindicators.Amorelimitedbut more focused list of measurements is likely to be more successful, both for routine datacollectionsandforhealthsurveys.
Regarding vital statistics, in addition to ensuring completeness and reliability of cause-of-deathascertainment,itisessentialthat the data be collected in a way that allows classificationby(1)geographicalunitand (2)atleastsomesocioeconomicstratifier,suchasoccupationoreducation.Itis equally important that data on numerators (censusesandpopulationregistries)can be broken down by the same geographical andsocioeconomiccode.
Regarding health surveys, expanding existing survey programmes conducted periodically inlargepartsofEurope(EHISinparticular, butpotentiallyalsoEHES,SILC,SHAREetc.)to the countries in the eastern part of the Region would be extremely valuable, since this would provide information directly comparableacrosscountries.Itwouldbeequally valuable if a consensus can be reached on a minimal set of measurements (health, riskfactors,socialdeterminants)thatcan beincludedinneworadhocsurveys.
An important issue is access to data; it is highly desirable that data be available to the public or, at least, to institutions responsible formonitoringhealthinequality.
5.2 Encourage individual-data linkage
The association between health and social determinants is sometimes assessed at theecological(aggregate)level,anapproachpronetoecologicalfallacy.Unlinkeddata are also often used but, as shown above, this approach can lead to the numerator–denominator bias and produce unreliable results.Sincemost(notall)European
countrieshaveindividualIDnumbers, linking data at the individual level should be technically possible in large parts oftheRegion.Insomeinstances,the main obstacle is data protection legislation, aproblemthatcanbesolved.Inotherinstances, data collection may need to be expandedtoincludetheindividualIDnumber.
23
5.3 Multinational surveys (expansion towards non-EU countries)
Multinational surveys are conducted regularly in countries in the western part of the Region; these are mostly lacking intheeasternpartoftheRegion.Thisiscompounded by the fact that these countries also often lack the infrastructure to collect high-qualityroutinedata.Demographic andHealthSurveysandMultipleIndicatorClusterSurveysarecarriedoutatcertainintervals but usually restrict themselves tospecificcausesofmortalityandmorbidity.
A potential option that merits further exploration is the surveys conducted regularly (attimesannually)byGallupInternational.Gallup’sWorldPollconductsself-reportedhealthandwell-beingsurveysinalmost all countries of the world, and its infrastructure may be used for the purpose of collecting newinformationinspecificareas.The WHORegionalOfficeforEuropehasopeneddiscussions with Gallup Europe to explore thispossibilityfurther.
24
6 Target setting
Atargetcanbedefinedasadesiredgoal. The desired goal is health improvement at the outcome level, and outcome targets would be drafted in these terms of, for example, reductionsinmortalityormorbidity.Inaddition, where improvements in health at the outcome level can be linked to processes oroutputs,withadequatescientificevidence,targets can legitimately be drafted in input, process or output terms, including increases in public health expenditure or introduction oflegislationfosteringpublichealth.
Inthinkingabouttheroleoftargets, some consideration needs to be given to the principles of performance measurement and accountability.InthecaseofaEuropeanstudy, this discussion is complicated, since in this case accountability can only be collectivelytoandbetweenMemberStates. Ifcitizenscollectivelyaretheultimateprincipal in a complex accountability chain, we should ask how well the policy and the systemsservethesecitizens.
6.1 Use of indicators and targets
The use of indicators.Oneofthedifficulties isfindingtheappropriatemixofindicators thatcanvalidlyandreliablyreflectprogresstowardsstrategicgoals.Inhealthpolicy, the time lags between policy interventions and their impact on health status as well as the difficultiesofattributinganimpacttospecificpolicy interventions have usually encouraged the use of process or output indicators over outcomeindicators.
The coherence of process, output and outcome indicators lie at the centre of measuringprogresstowardsthetargets.Allneed to be measured as long as the causal link cannotbeascertained.Allneedtoevolvein adynamicfashionasthelinkisbeingtested:for example, when process indicators improve, is there an improvement in outcome indicators thatcanbeidentifiedwiththeaction?
The use of targets. Historically in the EuropeanRegion,targetswerefirstsuggestedaspartofthefirstcommonhealthpolicy: the European strategy for attaining Health forAll.TheEuropeanstrategycalledforformulatingspecificregionaltargetstosupporttheimplementationofthestrategy.Aptlydescribed as a “wonderful blend of today’s realitiesandtomorrow’sdreams”,38specificregionaltargetswereadoptedatthethirty-fourth session of the WHO Regional Committee for Europe in Copenhagen in September1984togetherwith65regionalindicatorstomonitorandassessprogress. The European Health for All policy and targets
were updated in 1991 and the Regional Committee adopted a renewed policy, Health21:healthforallinthe21stcentury, in1998.
More generally, targets have been associated with reductionist views of system behaviour and performance as well as with mechanisms ofhierarchicalthinkingandcontrol.However,the present literature on health systems increasingly considers these as complex systems characterized by complexity and uncertainty, and targets may contribute to improve the clarity of expectations, motivate performance and improve accountability inthiscontext.
Targets should be adaptable and dynamically assessed, in the context that policy implementation is a heuristic processthatisneverdefinitivelycompleted. A crucial theoretical consideration concerns theavailabilityofdata.Alltargetsforhealthdepend for their utility on the availability of comparable data of reasonable quality andreliability.Inpractice,thisisoftenakeyconstraint.Thisconsiderationneedstobe kept clearly in mind for the Health 2020 targets, either for European regional or country use.However,experienceintheEuropeanRegion has shown that setting targets and indicators can be a huge motivating factor in countries collecting and incorporating in their routine information systems the necessary data to inform public health policy even wheresuchdatadidnotexistinthepast.
25
There are some positive elements in assessing theutilityoftargets.Thesecanbesummarizedasfollows.
llTargets, such as the Millennium DevelopmentGoalsorSustainableDevelopmentGoals,canbeverysuccessfulin raising awareness and facilitating politicalandorganizationalsupport.
llTargetscanreflectascientificviewonthefuture, in terms of achievable improvements inpopulationhealth.
llTargets can provide a learning experience forstakeholders.
llTargets can be seen as a tool for strengthening accountability and communication.
llTargetscanprovideamapforpartners.
llTargets can serve as a reference point for day-to-dayaction.
llTargetscanprovidemotivationforaction.
However, using targets also has some potentialnegativecharacteristics.
llTargetscanbedifficulttoalignwithstrategy.
llThere is a risk that priority will be given to targets that can be measured easily (whatcanbemeasuredgetsdone).
llTargets are liable to bureaucratic capture:elementsoftheorganizationalbureaucracy justify their existence in terms of a target, and every element wantsone.
llTargets are subject to the law of diminishing returns:achievingthelastfewpercentagepoints of a target may be very resource demanding.
llTargetsmaybeassociatedwithgaming:managingthetargetratherthanthetask.
llTargets may be seen as burdensome and demotivating if the targets are too many or toocomplex.
llTargets are often expressed in terms of averages, such as the Millennium DevelopmentGoalsorSustainableDevelopmentGoals,hidingdistributiveorequity issues that are fundamental for the reviewofsocialdeterminantsofhealth.
TargetsshouldbeSMART:
ll specific
llmeasurable
ll achievable
ll relevant
ll timely.
Specifictargetsaremorelikelytobeaccomplished than general goals; hence targetsmustbeclearandunambiguous. Inordertoarriveatmeasurabletargets,concrete criteria for measuring progress mustbeestablished.Fortargetstobeachievable, they must be realistic and set againstadefinedtimescale.Targetsareconsidered relevant when they represent objectives towards which the policy is abletowork.Targetsmustbegrounded in a time frame, preferably with deadlines, eveniftheyarelikelytobesymbolic.
Every target should represent real progress andcanbequalitativeorquantitative. TheSMARTobjectivesshouldapplytobothqualitativeandquantitativetargets.Targetscan be set for inputs, processes, outputs aswellasoutcomes.
6.2 Target setting in Health 2020
Amajortarget-settinginitiativewastaken in relation to the new European health policy, Health2020.TheEuropeanreviewofsocialdeterminants of health and the health divide provides the evidence base for and underpins Health 2020; it should therefore not duplicate butlinkwiththistarget-settingeffort. Targets for Health 2020 were developed in consultationwithWHOMemberStates.
One of the main approaches characterizing Health 2020 is that of tackling the social determinants of health and inequalities inhealth.Recentreviewsofthesocialdeterminants of health indicate the importance of focusing on early childhood development; hence consideration might begiventoatargetrelatedtothis.Given the importance of income and education
26
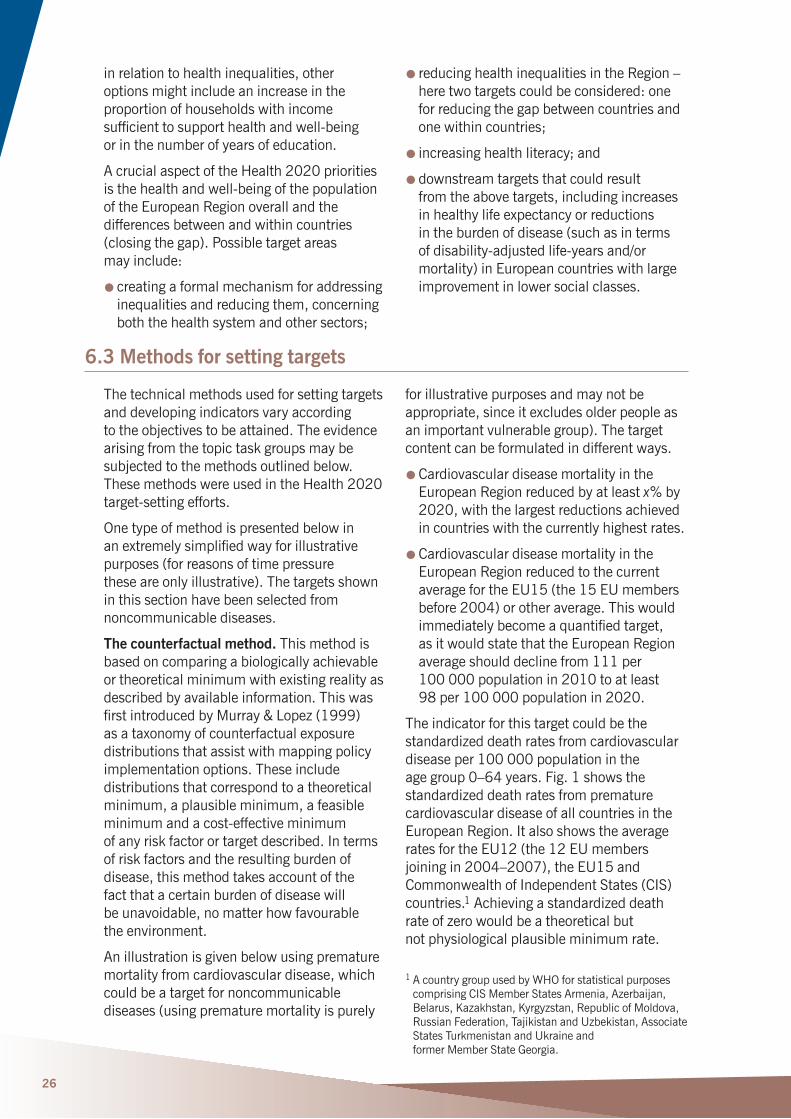
in relation to health inequalities, other options might include an increase in the proportion of households with income sufficienttosupporthealthandwell-being orinthenumberofyearsofeducation.
A crucial aspect of the Health 2020 priorities isthehealthandwell-beingofthepopulationof the European Region overall and the differences between and within countries (closingthegap).Possibletargetareas mayinclude:
ll creating a formal mechanism for addressing inequalities and reducing them, concerning both the health system and other sectors;
ll reducing health inequalities in the Region – heretwotargetscouldbeconsidered:one for reducing the gap between countries and one within countries;
ll increasing health literacy; and
lldownstream targets that could result from the above targets, including increases in healthy life expectancy or reductions in the burden of disease (such as in terms ofdisability-adjustedlife-yearsand/ormortality)inEuropeancountrieswithlargeimprovementinlowersocialclasses.
6.3 Methods for setting targets
The technical methods used for setting targets and developing indicators vary according totheobjectivestobeattained.Theevidencearising from the topic task groups may be subjectedtothemethodsoutlinedbelow.These methods were used in the Health 2020 target-settingefforts.
One type of method is presented below in anextremelysimplifiedwayforillustrativepurposes (for reasons of time pressure theseareonlyillustrative).Thetargetsshownin this section have been selected from noncommunicablediseases.
The counterfactual method. This method is based on comparing a biologically achievable or theoretical minimum with existing reality as describedbyavailableinformation.ThiswasfirstintroducedbyMurray&Lopez(1999) as a taxonomy of counterfactual exposure distributions that assist with mapping policy implementationoptions.Theseincludedistributions that correspond to a theoretical minimum, a plausible minimum, a feasible minimumandacost-effectiveminimum ofanyriskfactorortargetdescribed.Intermsof risk factors and the resulting burden of disease, this method takes account of the fact that a certain burden of disease will be unavoidable, no matter how favourable theenvironment.
An illustration is given below using premature mortality from cardiovascular disease, which could be a target for noncommunicable diseases (using premature mortality is purely
for illustrative purposes and may not be appropriate, since it excludes older people as animportantvulnerablegroup).Thetargetcontentcanbeformulatedindifferentways.
llCardiovascular disease mortality in the European Region reduced by at least x%by2020, with the largest reductions achieved incountrieswiththecurrentlyhighestrates.
llCardiovascular disease mortality in the European Region reduced to the current average for the EU15 (the 15 EU members before2004)orotheraverage.Thiswouldimmediatelybecomeaquantifiedtarget, as it would state that the European Region average should decline from 111 per 100 000 population in 2010 to at least 98per100000populationin2020.
The indicator for this target could be the standardized death rates from cardiovascular disease per 100 000 population in the agegroup0–64years.Fig.1showsthestandardized death rates from premature cardiovascular disease of all countries in the EuropeanRegion.Italsoshowstheaveragerates for the EU12 (the 12 EU members joiningin2004–2007),theEU15andCommonwealthofIndependentStates(CIS)countries.1 Achieving a standardized death rate of zero would be a theoretical but notphysiologicalplausibleminimumrate.
1 A country group used by WHO for statistical purposes comprisingCISMemberStatesArmenia,Azerbaijan,Belarus,Kazakhstan,Kyrgyzstan,RepublicofMoldova,Russian Federation, Tajikistan and Uzbekistan, Associate StatesTurkmenistanandUkraineand formerMemberStateGeorgia.

27
Itcouldbearguedthat,giventherightenvironment and conditions, all countries in Europe should be able to attain the lowest rate(inthiscase,theratesofIsrael),sinceit isalreadyabiologicalreality,henceplausible.Alternatively, it could be argued that countries with the highest rates should be able to attain the average of either the whole region, EU12, EU15orCIScountriesasdefinitelyafeasibleminimum.Debatingacost-effectiveminimumrequires further information from intervention studies.Thestandard(thecounterfactual)against which progress will be compared and the target will be set would be chosen through expert opinion, consensus or other methods (describedfurtherbelow).
Thedifferencebetweenthehighest-rateandthelowest-ratecountryinFig.1ismorethan10-fold(assumingdeathsareconsistentlycoded).Thedifferencebetweenthehighestrate and the EU12 average, for example, is 2.5-fold.Dependingonwhichrateisused as the counterfactual or target rate, the percentagereductionofthetargetwouldvary.Alternatively, the positive reverse of mortality or life expectancy can be used; the highest life expectancy in the Region can be used as counterfactual for regional comparisons, thusdescribinghealthratherthanmortality.
Quantifying this sensibly requires further steps.Theseareoutlinedbelow.Numerousfactors determine the differences in rates, butanimportantoneisoverallmortality: lowratesofcause-specificmortalitymay onlyreflecthighratesofcompetingmortalityfromotheravoidablecauses.
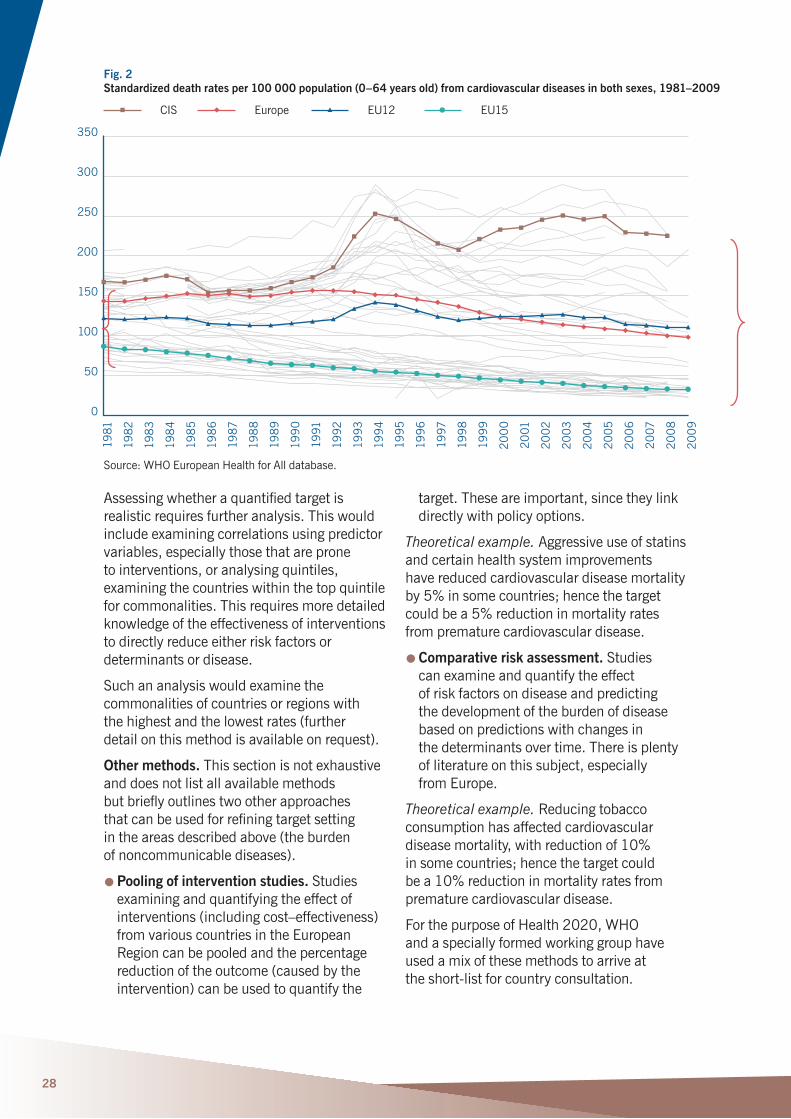
Trend analysis. Another illustration in cardiovascular disease mortality demonstrates how trends in rates can be used to arrive at atarget,thistimeininequalities.Fig.2showshow premature mortality from cardiovascular disease has changed over time in the EuropeanRegion.Itdemonstrates,amongother things, that the differences in rates between different parts of the Region have increased over time, especially in the past 20years.Thismayleadtotheformulation of a target of reducing the inequalities in cardiovascular disease mortality within the European Region by x%.Theindicatorwould be the proportional difference in cardiovascular disease mortality between the countries with the highest and the lowestrates.Alternatively,thetargetcould be to reduce the differential of cardiovascular diseasemortalitybetweenCIScountries and the EU average by x%,butmanyoptionsareavailable.
Fig. 1 Standardized death rates per 100 000 population for cardiovascular disease in both sexes aged 0–64 years,
latest available year
Source:WHOEuropeanHealthforAlldatabase.
300
250
200
150
100
50
00
273
Tur
kmen
ista
n 2
51 R
ussi
an F
eder
atio
n 2
27 K
azak
hsta
n 2
26C
IS
Eur
ope
EU
12
EU
15
22
2 U
krai
ne 2
08
Kyr
gyst
an
111
98
33
24 N
orw
ay 2
4 S
wit
zerl
and
24 S
an M
arin
no 2
3 Ic
elan
d 2
3 Is
rael
Cost-effective?
Feasible
Plausible
0=Theoretical
28
Assessingwhetheraquantifiedtargetisrealisticrequiresfurtheranalysis.Thiswouldinclude examining correlations using predictor variables, especially those that are prone to interventions, or analysing quintiles, examining the countries within the top quintile forcommonalities.Thisrequiresmoredetailedknowledge of the effectiveness of interventions to directly reduce either risk factors or determinantsordisease.
Suchananalysiswouldexaminethecommonalities of countries or regions with the highest and the lowest rates (further detailonthismethodisavailableonrequest).
Other methods. This section is not exhaustive and does not list all available methods butbrieflyoutlinestwootherapproaches thatcanbeusedforrefiningtargetsetting in the areas described above (the burden ofnoncommunicablediseases).
llPooling of intervention studies.Studiesexamining and quantifying the effect of interventions(includingcost–effectiveness)from various countries in the European Region can be pooled and the percentage reduction of the outcome (caused by the intervention)canbeusedtoquantifythe
target.Theseareimportant,sincetheylinkdirectlywithpolicyoptions.
Theoretical example. Aggressive use of statins and certain health system improvements have reduced cardiovascular disease mortality by5%insomecountries;hencethetargetcouldbea5%reductioninmortalityratesfromprematurecardiovasculardisease.
llComparative risk assessment.Studies can examine and quantify the effect of risk factors on disease and predicting the development of the burden of disease based on predictions with changes in thedeterminantsovertime.Thereisplentyof literature on this subject, especially fromEurope.
Theoretical example. Reducing tobacco consumption has affected cardiovascular diseasemortality,withreductionof10% in some countries; hence the target could bea10%reductioninmortalityratesfromprematurecardiovasculardisease.
For the purpose of Health 2020, WHO and a specially formed working group have used a mix of these methods to arrive at theshort-listforcountryconsultation.
Fig. 2 Standardized death rates per 100 000 population (0–64 years old) from cardiovascular diseases in both sexes, 1981–2009
Source:WHOEuropeanHealthforAlldatabase.
350
300
250
200
150
100
50
0
1981
198
2
198
3
198
4
198
5
198
6
1987
198
8
1989
199
0
1991
1992
1993
199
4
1995
199
6
1997
199
8
199
9
200
0
2001
2002
200
3
200
4
2005
200
6
2007
200
8
200
9
CIS Europe EU12 EU15
29
7.1 Recommendations on setting targets for topic task groups
Topic task groups have produced a wide range of recommendations, but many are not easily translated into measurable targets.Mostrecommendationshavebeeninspirational, and others have not been formulatedinsufficientdetailtoenablespecificandmeasurabletargets.
InSection5,wedescribedthetargetsetting in the new European health policy, Health
2020.Thepolicyincludestwohigh-leveltargets per area in addition to potential subtargets.Foreachtargetandsubtarget, anindicatorhasbeenidentifiedthatmust not only be measurable but also data or information must be available, and social determinants of health are an important partofthepolicyanditstargets.
7.2 Recommendations on monitoring health inequalities
Our task group has made several recommendations regarding data collection andmonitoringintheWHOEuropeanRegion.
First, it is essential to maintain and improve routine data collections and to ensure that at leastbasicsocioeconomicdataarecollected.WHO,incollaborationwithEU,candefine a minimum set of variables to be collected inastandardizedway.Suchdatashould allow monitoring of both social determinants of health (operating at different stages of the lifecourse)andofsocialdifferentialsinhealthoutcomes and should allow meaningful comparisons both between countries and withincountries.
Second,thereshouldberegularperiodicanalysis and reports assessing trends in social determinants of health and changes ininequalitiesovertime.Wheredataonindividual level measures of social position arenotavailable,analysescouldusearea-leveldata.
Third, even in the absence of a centrally recommended minimal dataset, countries should not discontinue collecting data enabling assessment of health inequalities,
ifsuchdataarecurrentlycollected.Forexample, some countries in the Region have recently removed information on educational statusfromdeathcertificates.Assessingeducational differentials in mortality in these countriesisnolongerpossible.
Fourth, although mortality data are more likely to be available for monitoring inequalities, we encourage all countries in the Region to adopt a standardized national health survey protocol (such as the European Health InterviewSurvey).Wealsoencouragecountries to carefully consider sample sizes for national health surveys, so that the surveys havesufficientstatisticalpowernotonlyforassessing current social differentials but also for monitoring changes in social differentials in health over time (studying interaction betweentimeandsocialstratifiers).
Finally, building the capacity for monitoring social determinants and health inequalities shouldbeinvestedinandencouraged.Especially in the eastern part of the WHO European Region, expertise in social epidemiology and statistical methods should be developed by providing training andinternationallinks.
Overall recommendations of the task group
30
References
AbouZahr C, Cleland J, Coullare F, Macfarlane S,NotzonF,SetelPetal.(2007).Thewayforward.Lancet.370:1791–9.
AbouZahr C, Mikkelsen L, Rampatige R, Lopez A(2010).Mortalitystatistics:atooltoenhanceunderstandingandimprovequality.Brisbane:SchoolofPopulationHealth,UniversityofQueensland(http://www.uq.edu.au/hishub/docs/WP_13.pdf,accessed30November2015).
BobakM(2006).CEEcountries.Dataandmethodologicalissues.Eurohealth.15:14–6.
CommissiononSocialDeterminantsofHealth(2008a).Closingthegapinageneration:healthequity through action on the social determinants ofhealth.FinalreportoftheCommissiononSocialDeterminantsofHealth.Geneva:WorldHealthOrganization(http://www.who.int/social_determinants/thecommission/finalreport/en/index.html,accessed30November2015).
CommissiononSocialDeterminantsofHealth(2008b).Socialdeterminantsofhealth:monitoring,research,andtraining.In:Closingthegapinageneration:healthequitythroughactiononthesocialdeterminantsofhealth.FinalreportoftheCommissiononSocialDeterminantsofHealth.Geneva:WorldHealthOrganization:178–92(http://www.who.int/social_determinants/final_report/csdh_finalreport_2008.pdf,accessed30November2015).
HillK,LopezA,ShibuyaK,JhaP(2007). Interimmeasuresformeetingneedsforhealthsectordata:births,deaths,andcausesofdeath.Lancet.370:1726–35.
JakabZ(2010).MessagefromtheWHORegionalDirectorforEurope:addressinghealthinequities.EurJPublicHealth.20:479.
JasilionisD,Stank-unieneV,AmbrozaitieneD,JdanovDA,ShkolnikovVM(2012).EthnicmortalitydifferentialsinLithuania:contradictoryevidencefromcensus-linkedandunlinkedmortalityestimates.JEpidemiolCommunityHealth.66:e7.
KunstAE,GroenhofF,BorganJ-K,CostaG,DesplanquesG,FaggianoFetal.(1998).Socio-economicinequalitiesinmortality:methodological problems illustrated with three examplesfromEurope.RevEpidemiolSantePublique.46:467–79.
KunstAE,BosV,SantanaP,ValkonenT,MackenbachJP,AndersenOetal.(2004).Monitoring of trends in socioeconomic inequalitiesinmortality:experiencesfromaEuropeanproject.DemographicResearch.SpecialCollection2:229–54.
LeinsaluM,StirbuI,VågeröD,KaledieneR,KovácsK,WojtyniakBetal.(2009).Educational inequalities in mortality in four EasternEuropeancountries:divergenceintrendsduringthepost-communisttransitionfrom1990to2000.IntJEpidemiol. 38:512–25.
LévyC,VallinJ(1981).Lamortalitéparcatégoriessocioprofessionnelles:unessaidecalculdirect.Population.36(4–5):938–46.
MahapatraP,ShibuyaK,LopezA,CoullareF,NotzonF,RaoCetal.(2007).Civilregistrationsystemsandvitalstatistics:successesandmissedopportunities.Lancet.370:1653–63.
MathersC,MaFatD,InoueM,ChalapatiR,LopezA.(2005).Countingthedeadandwhattheydiedfrom:anassessmentoftheglobalstatusofcauseofdeathdata.BulleWorldHealthOrgan.83:171–7.
MurphyM,BobakM,NicholsonA,RoseR,MarmotM(2006).Thewideninggapinmortality by educational level in the Russian Federation,1980–2001.AmJPublicHealth.96:1293–9.
MurrayCJL,LopezAD(1999).Onthecomparablequantificationofhealthrisks:lessonsfromtheglobalburdenofdisease.Epidemiology.10:594–605.
O’DonnellO(2009).MeasuringhealthinequalitiesinEurope.Methodologicalissues intheanalysisofsurveydata.Eurohealth.15:10–14.

31
PenttiläI,NordbergL(1996).Objectiveandsubjective measures of poverty in the European Communityhouseholdpanel.Helsinki:StatisticsFinland(http://www.stat.fi/isi99/proceedings/arkisto/varasto/nord0702.pdf,accessed30November2015).
RutsteinSO,JohnsonK(2004).TheDHSwealthindex.Calverton(MD):ORCMacro (DHSComparativeReportsNo.6;http://www.measuredhs.com/pubs/pdf/CR6/CR6.pdf,accessed30November2015).
SetelP,MacfarlaneS,SzreterS,MikkelsenL,JhaP,StoutSetal.(2007).Ascandalofinvisibility:makingeveryonecountbycountingeveryone.Lancet.370:1569–77.
ShkolnikovVM,JasilionisD,AndreevEM,JdanovDA,StankunieneV,AmbrozaitieneD(2007).Linkedversusunlinkedestimates of mortality and length of life by education and maritalstatus:evidencefromthefirstrecordlinkagestudyinLithuania.SocSciMed.64:1392–1406.
UnitedNations(2015).Socialindicators[onlinedatabase].NewYork:UnitedNations(http://unstats.un.org/unsd/demographic/products/socind/default.htm,accessed30November2015).
UnitedNationsDevelopmentProgramme(2015).Humandevelopmentreports:data.NewYork:UnitedNationsDevelopmentProgramme(http://hdr.undp.org/en/data,accessed,accessed30November2015).
ValenteP(2010).CensustakinginEurope:How are populations counted in 2010? Popul Soc.467(http://www.ined.fr/fichier/t_publication/1506/publi_pdf2_pesa467.pdf,accessed30November2015).
VallinJ(1980).Socio-economicdeterminantsofmortalityinindustrializedcountries.PopulationBulletinoftheUnitedNations.13:26–41.
WhelanCT,NolanB,MaitreB.(2008).Measuring material deprivation in the enlargedEuropeanUnion.Dublin: EconomicandSocialResearchInstitute (https://www.esri.ie/publications/measuring-material-deprivation-in-the-enlarged-eu,accessed30November2015).
WHORegionalOfficeforEurope(2015a).Atlasesofsocialinequalities[website].Copenhagen:WHORegionalOfficeforEurope(http://www.euro.who.int/en/what-we-do/data-and-evidence/equity-in-health/interactive-atlases/atlases-of-social-inequalities,accessed30November2015).
WHORegionalOfficeforEurope(2015b).HealthforAlldatabase[onlinedatabase].Copenhagen:WHORegionalOfficeforEurope(http://www.euro.who.int/en/what-we-do/data-and-evidence/databases/european- health-for-all-database-hfa-db2,accessed 31October2015).
WHORegionalOfficeforEurope(2015c).Health for All mortality database [online database].Copenhagen:WHORegionalOfficeforEurope(http://data.euro.who.int/hfamdb,accessed31October2015).
WHORegionalOfficeforEurope(2015d).Equityinhealthproject[website].Copenhagen:WHORegionalOfficeforEurope(http://www.euro.who.int/en/what-we-do/data-and-evidence/equity-in-health,accessed30November2015).
WHORegionalOfficeforEurope(2015e). WHOEuropeanHealthyCitiesNetwork[website].Copenhagen:WHORegionalOfficeforEurope(http://www.euro.who.int/en/ what-we-do/health-topics/environment-and-health/urban-health/activities/healthy-cities/who-european-healthy-cities-network, accessed30November2015).
WorldBank(2015).WorldDataBank[onlinedatabase].Washington(DC):WorldBank(http://databank.worldbank.org/data/home.aspx,accessed30November2015).
WorldHealthAssembly(2009).Reducinghealth inequities through action on the socialdeterminantsofhealth.ResolutionWHA62.14,22May2009.Geneva:WorldHealthOrganization(http://apps.who.int/ gb/ebwha/pdf_files/A62/A62_R14-en.pdf,accessed30November2015).
WorldHealthOrganization(2015a).WorldHealthOrganizationStatisticalInformationSystem(WHOSIS)mortalitydatabase[onlinedatabase].Geneva:WorldHealthOrganization(http://www.who.int/whosis/mort/download/en/index.html,accessed31October2015).

32
WorldHealthOrganization(2015b).Analysingmortalitylevelsandcauses-of- death(ANACoD).Geneva:WorldHealthOrganization(http://www.who.int/healthinfo/anacod/en,accessed30November2015).
WorldHealthOrganization(2015c). WHOnationalburdenofdiseasetoolkit.Geneva:WorldHealthOrganization (http://www.who.int/healthinfo/global_burden_disease/tools_nbd_toolkit/en/index.html,accessed30November2015).
WorldHealthOrganization(2015d). WHO study on global ageing and adult health(SAGE)[website].Geneva:WorldHealthOrganization(http://www.who.int/healthinfo/systems/sage/en/index.html,accessed30November2015).
33
Annex 1 Multicountry national survey projects
Demographic and Health Surveys.a Since1984,theDemographicandHealthSurveysprogrammeoftheUnitedStatesAgencyforInternationalDevelopmenthascollected, analysed and disseminated and representativedataonpopulation,health,HIVand nutrition through more than 260 surveys inmorethan90countries(http://measuredhs.com).
English Longitudinal Study of Ageing. TheEnglishLongitudinalStudyofAgeing isthefirststudyintheUnitedKingdom to study the full range of topics necessary to understand the economic, social, mental andhealthelementsoftheageingprocess.The aim, targeting a population of people older than 50 years, is to explore the unfolding dynamic relationships between health, functioning, social networks and economic position(http://www.ifs.org.uk/elsa).
European Health Examination Survey.a A representative survey including core measurements such as height, weight, waist circumference, blood pressure, total andHDL-cholesterol,fastingglucoseorHbA1c.ItcomplementstheEuropeanHealthInterviewSurvey.Thefirstnationalhealthexamination survey in Europe was carried outinthelate1950sandearly1960s. The number of surveys increased from the 1970s to the 1990s, and since 2000 there has been an increasing number of new national health examination surveys (http://www.ehes.info/index.html).
European Health Interview Survey.a TheEuropeanHealthInterviewSurvey wasdevelopedbetween2003and2006. Itcomprisesfourmodulesonhealthstatus,health care, determinants of health and backgroundvariables.AnewregulationonCommunity statistics on public health and healthandsafetyatwork(EC)No1338/2008was signed by the European Parliament and theCouncilon16December2008.Thisregulation is the framework for the European HealthInterviewSurveydatacollection.
Within the context of this framework regulation,aspecificImplementingmeasureforwaveIIwillbedeveloped(http://epp.eurostat.ec.europa.eu/cache/ITY_SDDS/en/hlth_ehis_esms.htm).
European Health Risk Monitoring.a The project aims to develop indicators and measures for coordinated, standardized nationalpopulationriskfactorsurveys.Suchsurveys are intended to gather information on major chronic disease risk factors, related behaviour and determinants to serve and evaluate disease prevention and health promotion efforts in individual countries andattheEuropeanlevel(http://www.ktl.fi/publications/ehrm/product1/title.htm).
EU – Statistics on Income and Living Conditions.a Thisisamulti-purposesurveywithincomeandsocialinclusionasacore.Itcontains a small module on health, including three questions on general health status and four questionsontheunmetneedsofhealthcare.The results of the main indicators from this survey are available in the Eurostat database (http://epp.eurostat.ec.europa.eu/cache/ITY_SDDS/en/hlth_status_silc_esms.htm).
Generations and Gender Surveys.a These are part of the Generations and GenderProgrammeoftheUnitedNationsEconomic Commission for Europe, which are panel surveys of a representative sampleofthe18-to79-year-oldresidentpopulationin19countries.Thesurveycollects information on gender relationships, household composition and housing, residential mobility, public and private transfers, social networks, education, health,contraceptionandinfertility.Healthquestionsincludeself-reportedhealth, well-being,locusofcontrolandreceiptandprovisionofcare(http://www.ggp-i.org).
34
Global Ageing and Adult Health. Longitudinal survey on health and ageing among people 50 years and older in the Russian Federation (and several other non-Europeancountries)(http://www.who.int/healthinfo/systems/sage/en/index.html).
Household Living Conditions Survey.a TheLivingStandardsMeasurementStudy isaresearchprojectinitiatedin1980. Itisaresponsetoaperceivedneedforpolicy-relevantdatathatwouldallow policy-makerstomovebeyondsimplymeasuring rates of unemployment, povertyandhealth-careuse,forexample, to understanding the determinants of theseobservedsocialsectoroutcomes. The programme is designed to assist policy-makersintheireffortstoidentify how policies could be designed and improved to positively affect outcomes in health, education, economic activities, housingandutilities,etc.(http://iresearch.worldbank.org/lsms/lsmssurveyFinder.html)
Multinational monitoring of trends and determinants in cardiovascular disease (MONICA).Thiswasa10-yearprojectconducted during the 1990s to monitor trends in cardiovascular diseases around the world and to relate these to risk factor changesinthepopulationovera10-yearperiod(http://www.ktl.fi/monica).
Multiple Indicator Cluster Survey.a UNICEFimplementsthissurvey everyfiveyearstoassessthesituation ofwomenandchildren.Thesurveys contain demographic information but not necessarily health information (http://www.childinfo.org/mics.html).
New Democracy Barometer surveys in eastern Europe. TheCenterfortheStudyofPublicPolicy at University of Aberdeen conducted over100surveysinpost-communistcountries since 1991, throughout the 1990s(http://www.abdn.ac.uk/cspp/catalog13_0.shtml).
Reproductive Health Survey. From the 1980s until the present, the UnitedStatesCentersforDiseaseControlandPrevention,undertheMEASURECDCproject, has assisted countries throughout the world in developing, implementing and analysing national reproductive health surveysthatprovidepopulation-based dataaboutreproductivehealthindicators.Countries use data from these surveys to evaluate programmes and interventions, assess reproductive health status and developpolicy(http://www.cdc.gov/reproductivehealth/surveys/ SurveyCountries.htm).
Survey of Health, Ageing and Retirement in Europe. Variousresearchcompaniesinthe European research community conduct this 2-yearpanelsurveytargetingindividualsaged50yearsandolder.Itprovidesdata on health, socioeconomic status and social and family networks of more than 45000individuals.Assuch,itresponds to a communication by the European Commission advocating “[examining] the possibilityofestablishing,inco-operationwithMemberStates,aEuropeanLongitudinalAgeingSurvey” (http://www.share-project.org).
World Health Survey.a WHO compiles baseline information on the health of populations and on the outcomes associated with the investment in health systems and baseline evidence on how healthsystemsarecurrentlyfunctioning. Itprovidesthepotentialtomonitorinputs,functionsandoutcomes(http://www.who.int/healthinfo/survey/en).
a Ongoing survey programmes that measure aspects ofhealth:theyareusuallynationallyrepresentativewithcomparabledataoveryearsandbetweencountries.

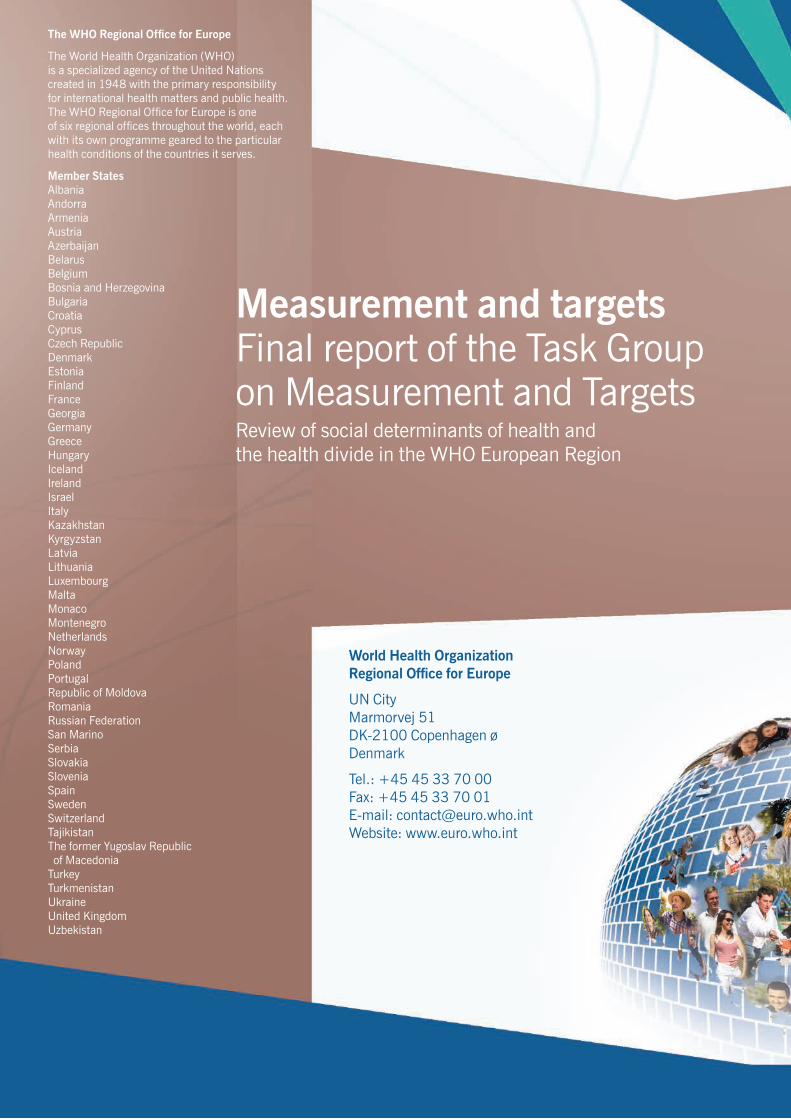
World Health Organization Regional Office for Europe
UNCity Marmorvej 51 DK-2100Copenhagenø Denmark
Tel.:+4545337000 Fax:+4545337001 E-mail:[email protected] Website:www.euro.who.int
The WHO Regional Office for Europe
TheWorldHealthOrganization(WHO) isaspecializedagencyoftheUnitedNationscreated in 1948 with the primary responsibility forinternationalhealthmattersandpublichealth.TheWHORegionalOfficeforEuropeisone ofsixregionalofficesthroughouttheworld,eachwith its own programme geared to the particular healthconditionsofthecountriesitserves.
Member States Albania Andorra Armenia Austria Azerbaijan Belarus Belgium BosniaandHerzegovina Bulgaria Croatia Cyprus Czech Republic Denmark Estonia Finland France Georgia Germany Greece Hungary Iceland Ireland Israel Italy Kazakhstan Kyrgyzstan Latvia Lithuania Luxembourg Malta Monaco Montenegro Netherlands Norway Poland Portugal Republic of Moldova Romania Russian Federation SanMarino Serbia Slovakia Slovenia Spain Sweden Switzerland Tajikistan The former Yugoslav Republic of Macedonia Turkey Turkmenistan Ukraine United Kingdom Uzbekistan
Measurement and targets Final report of the Task Group on Measurement and Targets
Review of social determinants of health and the health divide in the WHO European Region