Embed Size (px)
Citation preview

8Measurement of individual and population
energetics of marine mammals
Sara J. Iverson, Carol E. Sparling, Terrie M. Williams,
Shelley L.C. Lang, and W. Don Bowen
8.1 Introduction
The overriding currency of all animal life is energy. Animals have evolved strategiesof energy acquisition and use, but these strategies also experience tradeoffsbetween energy allocated to maintenance, activities, growth, and reproductionand are central to our understanding of life histories and fitness. Thus ‘energetics’—the study of the metabolic requirements, energy use, and output of animals—underpins many areas of physiology, ecology, evolutionary, and population biology,and even ecosystem dynamics.
Marine mammals pose many challenges for the study, interpretation, and com-parison of individual and population energetics. For instance, the ability to studycaptive animals is often restricted to a few of the smaller marine mammal species.Although opportunities in the wild may be greater, there remain serious limits toour abilities to study species in remote locations (e.g. polar bears, Ursus maritimus, inthe high arctic), in unstable habitats (e.g. ice-associated pinnipeds in the Bering andChukchi Seas), or due to endangered status (e.g. monk seals, Monachus spp.,southern sea otters, Enhydra lutris nereis, and vaquita, Phocoena sinus). As a group,cetaceans pose further difficulties because of their limited accessibility and largesize. Adaptive insulation (blubber) is important in temperature management (Iverson2009a) and the presence of this comparatively inert tissue can add complexity tothe issue of defining the metabolically relevant body mass in marine mammals.Conversely, the sea otter (which does not have blubber) and some fur seals aresmall species with little internal insulation that rely mainly on thick pelage and thestrategy of using heat generated from continual activity, and specific dynamic action(SDA) from frequent feeding, to offset thermoregulatory costs (Costa and Kooy-man 1984; Mostman-Liwanag et al. 2009).
Marine Mammal Ecology and Conservation / 08-Boyd-Ch08 page 165 7:55pm OUP CORRECTED PROOF – Finals, 5/7/2010, SPi

Fig. 8.1 Pathways of energy (E) acquisition and use in animals, illustrating the
components that are generally measurable and form the basis for existing methods used
for determining aspects of animal energetics. SDA occurs as a summed consequence of
digestion and absorption processes, including synthesis of nitrogenous wastes to be
exported in urine. Thus, although SDA occurs along the whole process, because its term
is subtracted from ME to obtain NE, it is depicted as arising after ME. Digestible E (DE) is
referred to as apparent DE because faeces contain both metabolic and undigested
nitrogen. Ultimate E use can be divided into three major types of physiological work—
biosynthesis, membrane transport, and external mechanical work—but are here divided
into the three general categories of summed costs which are most pertinent to evaluating
whole animal energetic budgets. ‘Respiration’ refers to the entire mitochondrial oxidative
catabolic pathway, which includes the Krebs‘ citric acid cycle, electron transport chain,
and oxidative phosphorylation, and results in the complete oxidation of fuels. The
amount of adenosine triphosphate (ATP) produced from oxidative (aerobic) metabolism
is about 19-fold greater than that produced during anaerobic glycolysis alone, and is
thus represented by the larger font size under respiration. During anaerobic glycolysis,
Marine Mammal Ecology and Conservation / 08-Boyd-Ch08 page 166 7:55pm OUP CORRECTED PROOF – Finals, 5/7/2010, SPi
166 j Measurement of individual and population energetics

Measurement and interpretation of ‘maintenance metabolism’ (i.e. BMR, SMR, seeBox 8.1) also remains problematic for marine mammals. The rigorous conditionsrequired for determining BMR are quite difficult to achieve for living marine mam-mals (including how ‘resting’ is even defined, as marine mammals can rest whilecompletely submerged at depth and breath-holding, while floating at the surfaceintermittently breathing, and while lying on solid substrate in air). Overall, interpret-ation of BMR is complicated by how we define body mass, by the reliance of manyspecies on extended periods of fasting, by characteristic apnoea and bradycardia whensubmerged, and by the fact that metabolic rate (MR) while actively divingmay actuallybe lower thanMRmeasured under criteria specified for BMR (e.g. Sparling and Fedak2004). Boyd (2002a) rejected the idea that BMR, as classically defined for terrestrialmammals, can be realistically quantified in marine mammals. Additionally, the extentto which marine mammals use oxidative versus anaerobic metabolism (Fig. 8.1), andmanage lactate production, especially under conditions of pushing physiological limitswhile diving (e.g. Kooyman et al. 1980), also warrant further study.
8.1.1 Definitions
All animals must exchange energy with their environment. The process begins inanimals with energy input through the ingestion of food (fats, proteins, andcarbohydrates), followed by digestion (chemical and enzymatic degradation offoodstuffs) and cellular absorption of the smaller energy-containing organic mol-ecules produced, such as fatty acids and glycerol, amino acids, nucleotides, andmonosaccharides. At several early points following ingestion, energy is lost fromthe animal—some directly to the faeces (undigested material) and some, afterabsorption, to the urine (e.g. waste metabolites) (see Fig. 8.1). The remainder ofthe absorbed energy-containing molecules comprises metabolizable energy (ME).However, the processing costs of both digestion and absorption result in someadditional energy being expended and lost as heat (SDA, see Fig. 8.1). Theremaining net energy (NE) is what the animal has to use for all physiologicalprocesses. Some of this NE is stored directly into tissues as fuel reserves, primarilyas fats and proteins, with limited storage of carbohydrate as glycogen. Theremainder undergoes catabolism, which comprises the cellular processes thatharvest chemical free energy. During catabolism some energy is lost as heat tothe surroundings, while the rest is used primarily to generate and store ATP, the
Fig. 8.1 (continued)
ATP is regenerated in the absence of O2 through the reduction of pyruvate to lactic
acid (lactate), which not only contains a large potential E source ‘locked’ in the
incompletely oxidized compound, but requires sufficient O2 to get rid of it (that is,
metabolize it via the respiration pathway) and, until such time, the animal incurs an ‘O2
debt’ during which it may be debilitated from further activity.
Marine Mammal Ecology and Conservation / 08-Boyd-Ch08 page 167 7:55pm OUP CORRECTED PROOF – Finals, 5/7/2010, SPi
8.1 Introduction j 167
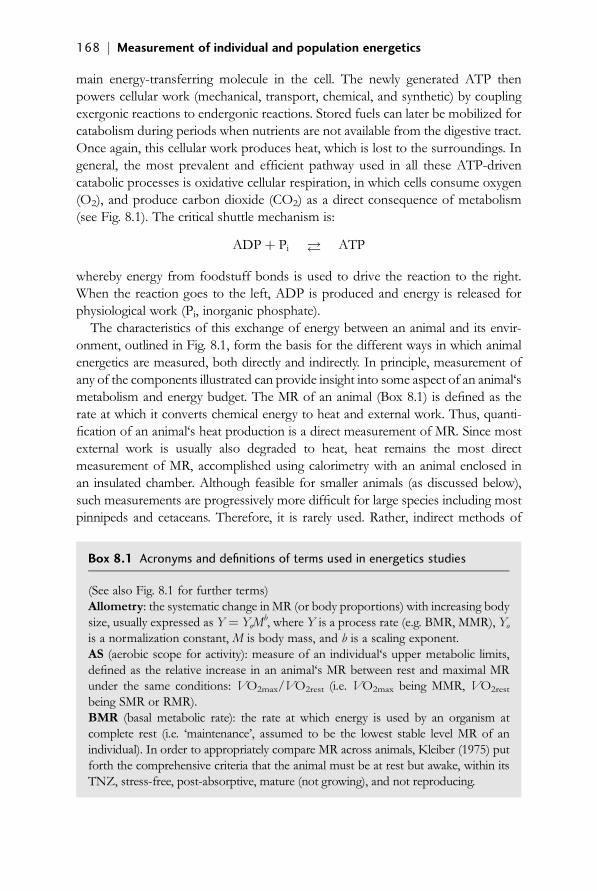
main energy-transferring molecule in the cell. The newly generated ATP thenpowers cellular work (mechanical, transport, chemical, and synthetic) by couplingexergonic reactions to endergonic reactions. Stored fuels can later be mobilized forcatabolism during periods when nutrients are not available from the digestive tract.Once again, this cellular work produces heat, which is lost to the surroundings. Ingeneral, the most prevalent and efficient pathway used in all these ATP-drivencatabolic processes is oxidative cellular respiration, in which cells consume oxygen(O2), and produce carbon dioxide (CO2) as a direct consequence of metabolism(see Fig. 8.1). The critical shuttle mechanism is:
ADPþ Pi ! ATP
whereby energy from foodstuff bonds is used to drive the reaction to the right.When the reaction goes to the left, ADP is produced and energy is released forphysiological work (Pi, inorganic phosphate).
The characteristics of this exchange of energy between an animal and its envir-onment, outlined in Fig. 8.1, form the basis for the different ways in which animalenergetics are measured, both directly and indirectly. In principle, measurement ofany of the components illustrated can provide insight into some aspect of an animal‘smetabolism and energy budget. The MR of an animal (Box 8.1) is defined as therate at which it converts chemical energy to heat and external work. Thus, quanti-fication of an animal‘s heat production is a direct measurement of MR. Since mostexternal work is usually also degraded to heat, heat remains the most directmeasurement of MR, accomplished using calorimetry with an animal enclosed inan insulated chamber. Although feasible for smaller animals (as discussed below),such measurements are progressively more difficult for large species including mostpinnipeds and cetaceans. Therefore, it is rarely used. Rather, indirect methods of
Box 8.1 Acronyms and definitions of terms used in energetics studies
(See also Fig. 8.1 for further terms)Allometry: the systematic change in MR (or body proportions) with increasing bodysize, usually expressed as Y ¼ YoM
b, where Y is a process rate (e.g. BMR, MMR), Yois a normalization constant, M is body mass, and b is a scaling exponent.AS (aerobic scope for activity): measure of an individual‘s upper metabolic limits,defined as the relative increase in an animal‘s MR between rest and maximal MRunder the same conditions: VO2max/VO2rest (i.e. VO2max being MMR, VO2rest
being SMR or RMR).BMR (basal metabolic rate): the rate at which energy is used by an organism atcomplete rest (i.e. ‘maintenance’, assumed to be the lowest stable level MR of anindividual). In order to appropriately compare MR across animals, Kleiber (1975) putforth the comprehensive criteria that the animal must be at rest but awake, within itsTNZ, stress-free, post-absorptive, mature (not growing), and not reproducing.
Marine Mammal Ecology and Conservation / 08-Boyd-Ch08 page 168 7:55pm OUP CORRECTED PROOF – Finals, 5/7/2010, SPi
168 j Measurement of individual and population energetics

measuring metabolism, although in principle accompanied by greater uncertaintiesor errors, in reality provide better information on how an animal uses energy undernatural or varying conditions. Measurements of O2 consumption, CO2 production,water (H2O) turnover, food energy intake, nutrient and energy balance, fuel storageand subsequent mobilization, tissue growth, synthetic products (e.g. fetus, milk), aswell as lactate production (see Fig. 8.1), can all provide valuable insights into animalenergetics (see also definitions in Box 8.1).
8.2 Measurement of metabolism
This section details some of the methods available for the estimation of MR ofmarine mammals.
EE (energy expenditure): the rate of energy consumption per unit time.FMR (field metabolic rate): the rate of metabolism that includes the total cost of allactivities of a free-living animal.MMR (maximal metabolic rate): the rate of metabolism at maximal activity andmuscle work. May involve both aerobic and anaerobic biochemical pathways.MR (metabolic rate): the rate of energy consumption by an organism, which is therate of its conversion of chemical energy to heat and external work. This is measuredin calories (cal) as units of heat (the energy required to raise 1 g of water from14.5 8C to 15.5 8C) or in joules ( J) as units of work (the work done to move 1 kgthrough 1 m), and expressed per unit time as a rate (1 J¼ 1 kg . m2
. s�2). Joules arenow the standard international (SI) unit of energy measure, but can be readilyinterconverted with calories: 1 cal ¼ 4.184 J.RMR (resting metabolic rate): the MR when at rest, but otherwise not strictlymeeting all criteria for Kleiber‘s BMR (e.g. when an animal is still digesting food).RQ (respiratory quotient): the ratio of the volume of CO2 produced to the volume ofO2 consumed during aerobic catabolism. The range of respiratory quotients for animalsin energy balance varies with the substrate being metabolized. Fat and carbohydratecatabolism have an RQ of 0.71 and 1.00, respectively. Protein has an RQ of 0.8–0.9,depending on the amino acids being catabolized. RQ (measured at cells) is sometimescalled the respiratory exchange ratio (RER, measured at respiratory organs).SDA (specific dynamic action): the increase in metabolic rate as a result of digestionand absorption processes. The magnitude and duration of SDA varies with the sizeand composition of the meal. (Also called the heat increment of feeding, HIF.)SMR (standard metabolic rate): synonymous with BMR, but SMR refers to meas-urement at a standard temperature.TNZ (thermal neutral zone): the range of external temperatures at which ananimal‘s requirements for metabolic heat production are at minimum. Above thiszone energy must be expended to keep cool, and below more metabolic energy mustbe used for heat production.VO2max: maximum rate of O2 consumption of an individual; a measure of aerobiccapacity.
Marine Mammal Ecology and Conservation / 08-Boyd-Ch08 page 169 7:55pm OUP CORRECTED PROOF – Finals, 5/7/2010, SPi
8.2 Measurement of metabolism j 169

8.2.1 Direct calorimetry
Quantification of energy released as heat over a given period is the most directmethod of measuring MR. Direct calorimetry is performed by placing an animal ina sealed insulated chamber or calorimeter and measuring the heat given up to thecirculating air and to water flowing through the chamber walls (e.g. McLean andTobin 1987; Walsberg and Hoffman 2005). In practice, direct calorimetry iscumbersome and calorimeters are expensive and difficult to maintain. Hence,direct calorimetry is rarely used, especially for large animals, and has not beenused in marine mammals. Furthermore, it is impossible to measure the energeticcost of specific activities of wild animals in their natural environment using directcalorimetry. An alternative to direct calorimetry is the minimum heat loss method,which uses physical measurements of heat transfer across the blubber and bodysurface to infer total heat loss, but it is based on assumptions that are likelyinappropriate (reviewed in Boyd 2002a).
8.2.2 Respirometry (measurement of gas exchange)
MRs of animals can be estimated indirectly from the measurement of othervariables related to energy utilization, such as O2 consumption and energybalance (e.g. see Fig. 8.1). ‘Indirect calorimetry’, although in principle representingany indirect method, most often refers to the measurement of rates of gasexchange (where VO
2¼ O2 consumption, VCO
2¼ CO2 production) and the
translation of these quantities into a heat or work equivalent. Because steady-statemetabolism consumes O2 and produces CO2 in known amounts (see Fig. 8.1)depending on the type(s) of food molecules being catabolized (i.e. the RQ, Box8.1), their measurement can be used as an indirect assessment of MR. Respiro-metry refers to the measurement of these gases. Most relevant for use in marinemammals is open-flow (or open-circuit) respirometry, where air is pumpedthrough a metabolic chamber at a rate that constantly replenishes the O2 depletedby the animal while removing the CO2 and water vapour produced by the animal(e.g. Renouf and Gales 1994; Boily and Lavigne 1995; Sparling et al. 2006) (Fig. 8.2and Box 8.2).
There have been several innovative approaches to adopting this technique foruse on marine mammals, which take advantage of the fact that they perform manyactivities underwater yet must return to the surface to breathe. This constraint hasenabled researchers to quantify themetabolic costs of swimming and diving in bothcaptive and free-ranging animals. Thus, open-flow respirometry has been appliedto sea otters diving in a simulated environment (Yeates et al. 2007), otters andpinnipeds swimming in flumes (Davis et al. 1985; Fedak et al. 1988; T.M. Williams1989), and exercising cetaceans (Worthy et al. 1987; T.M. Williams et al. 1993).Examples for free-ranging marine mammals include an isolated ice-hole modeldeveloped in the Antarctic for the study of Weddell seals (Leptonychotes weddellii,Kooyman et al. 1973; T.M. Williams et al. 2004), an open-ocean Steller sea lion
Marine Mammal Ecology and Conservation / 08-Boyd-Ch08 page 170 7:55pm OUP CORRECTED PROOF – Finals, 5/7/2010, SPi
170 j Measurement of individual and population energetics

Fig. 8.2 Killer whale (Orcinus orca) resting in a metabolic hood for open-flow
respirometry. Note that the water surface provides an airtight seal with the hood,
thus creating a respirometer for the animal. Hoses connect to a vacuum pump that
provides air into the hood at 500 L per minute and samples to the gas analysers.
For this and other species studied, the air flow rate must be high enough that the
animal is never in danger of being hypoxic, yet low enough so that the amount of
O2 consumed (VO2) by the animal can be detected with precision, ideally between
20 and 21% O2. Expired air from this open-circuit respirometer is continuously
sampled by gas analysers for determination of the fractional concentration of O2
and CO2, which is recorded with a laptop computer. Calculation of the rates of
VO2 or VCO2is reliant on knowledge of flow rates into and out of the chamber
or hood, plus the fractional concentrations of the gas mixtures in and out of the
system. The exact equation used also depends on where the flow meter is relative
to the chamber and on whether or not water vapour and CO2 are present or
removed from the air stream prior to analysis (see Withers et al. (1977) for a
general discussion, and Fedak et al. (1981) for details regarding marine mammal
respirometry). Energy expenditure (EE) can be calculated from measured VO2 using
the energy equivalent of O2. The simplest method is to assign a mean energy
equivalent for O2 of 4.83 kcal per litre of O2. However, this value will vary with the
substrate being oxidized (from 4.73 at an RQ of 0.71 to 5.04 at an RQ of 1).
In the absence of a measured RQ, one can assume an RQ based on diet. The
equation of Weir (1949) allows the calculation of EE if both O2 and CO2 are
measured: EE (kcal/day) ¼ VO2(3.9)þ VCO2(1.1). (Photo courtesy of Terrie M.
Williams.)
Marine Mammal Ecology and Conservation / 08-Boyd-Ch08 page 171 7:55pm OUP CORRECTED PROOF – Finals, 5/7/2010, SPi
8.2 Measurement of metabolism j 171

(Eumetopias jubatus) laboratory (Hastie et al. 2007), and a combined respirometry/simulated foraging approach (Sparling et al. 2007).
The size of some marine mammals, especially the larger odontocetes andmysticete whales, prevents the use of many of the open-flow respirometry methodsdescribed in the preceding section. Instead, expired gases may be collected as thewhale breathes into a non-permeable bag or balloon. This has been done success-fully for trained killer whales (Kriete 1995), as well as grey whales (Eschrichtiusrobustus) in captivity (Sumich 2001) and in open water (Sumich 1983). A cautionarynote when attempting this method concerns the assurance of normal breathingpatterns by the subject. Forced exhalations due to obstruction of the blowhole orindividual animal responses can result in elevated end-tidal gas levels, which lead toan overestimation of MR ( T.M. Williams, personal observation).
Despite the difficulties, there are several advantages for using respirometrymethods for energy assessments. Most importantly, this technique allows the detailedquantification of energy costs related to specific activities. Thus, the effects oftemperature regulation, exercise, digestion, age, body size, at-sea behaviours, moult-ing, pregnancy, and lactation among others can be evaluated. In addition, if both O2
consumption and CO2 production are measured, then the RQ (see Box 8.1) can becalculated, which provides information about the fuel being metabolized. If only O2
consumption is measured (common in marine mammal studies) then information onthe fuel substrate used is needed to translateVO2 into actual EE (i.e. RQ in Box 8.1and Fig. 8.2 legend). Furthermore, some calculation techniques are relatively insensi-tive to variations in RQ (Fedak 1986) in cases where onlyVO2 is known.
The disadvantages of respirometry are that the measurement of gas exchange canbe used in few situations, and results must be carefully interpreted in light of theexperimental design. In general, the behavioural repertoire of captive marine mam-mals relative to their wild counterparts cannot be reproduced; this is especiallyapparent for costs related to interactions between animals. Perhaps, most importantfor marine mammal energetics is the difficulty of measuring a true diving MR. Open-flow respirometry can only measure gas exchange while the animal is at the watersurface. Partitioning the submergence and surfaceMRpost dive is complicated at best.During the surface interval, MRs will include the O2 consumed for surface resting aswell as for recovery from the previous dive and for replenishing O2 stores forsubsequent dives. Different analytical approaches have been used to solve thisproblem. The simplest is where theVO2 taken up during a surface period is assumedto have been consumed over the entire previous dive plus the surface recovery period;this is expressed as diving MR, but it does not attempt to partition between O2
consumption while submerged versus at the surface (Castellini et al. 1992; Reed et al.1994; Sparling and Fedak 2004). Another approach is to first measure the RMR(generally determined at the onset of the trial) and then calculate the diving O2
consumption from the post-dive O2 uptake minus the volume of O2 equivalent totheRMR (Hurley andCosta 2001; T.M. Williams et al. 2004a;Hastie et al. 2007). If the
Marine Mammal Ecology and Conservation / 08-Boyd-Ch08 page 172 7:55pm OUP CORRECTED PROOF – Finals, 5/7/2010, SPi
172 j Measurement of individual and population energetics

latter approach is used, it is important that the resting VO2 during the post-diverecovery period is equivalent to the pre-dive restingVO2. Also, there is the problem ofdelayed metabolic responses and recovery in diving marine mammals. Sparling et al.(2007) provided evidence supporting the hypothesis that diving seals can defer themetabolic costs of digestion until after periods of active foraging, and therebymaximize the O2 available for extending the duration of dives. This highlights theimportance of the timescale over whichmeasurements are made. If diving animals aredeferring the metabolic costs of certain processes then it is crucial that any studyattempting to quantify energetic costs does so over an appropriate period of time .
8.2.3 Doubly labelled water (DLW) and isotope dilution
Doubly labelled water (DLW)
Gas exchange can also be measured indirectly using radio- or stable-isotopes ofhydrogen and oxygen. Thorough accounts of the theory, history, techniques andadvantages and disadvantages of the DLW technique have been published(Speakman 1997; Butler et al. 2004). This technique involves quantitatively dosingweighed animals with either deuterium- or tritium-labelled water (2H2O or 3H2O,respectively) and isotopic O2 (
18O), and then sampling the body water (usuallyblood, but also urine or saliva) after complete isotope distribution (equilibration)throughout the body water pool. A blood sample may need to be collected beforeisotope administration to determine background levels, and is absolutely requiredif the individual has previously been dosed. In principle, the isotope mixture canbe administered intramuscularly (IM), intravenously (IV), intraperitoneally (IP),subcutaneously (SC), or orally (gastric intubation). During equilibration theanimal must not consume food or water. Equilibration can take about 1–6 h,depending on the species and body size, and this should be confirmed with eitherserial sampling to confirm a plateau in isotope concentration or waiting for theappropriate established maximum period. The animal is then released and laterrecaptured once, or in a series of recaptures, to collect a blood (or other) samplefor the measurement of subsequent isotope elimination over a specified period(days).
The decision to use 2H2O or 3H2O will depend largely on the size of the studyanimal and analytical methods available, and on regulations concerning the use ofradioisotopes (3H2O). Usually, 2H2O is most practical for individuals weighing lessthan about 130 kg, especially if infrared spectrometry is used for analysis (Oftedalet al. 1987b; Oftedal and Iverson 1987; Iverson et al. 1993); however, if analysedusing isotope-ratio mass spectrometry (e.g. Speakman 1997, 2001; Sparling et al.2006), 2H2O has been used in walrus (Odobenus rosmarus) weighing up to 1597 kg(Acquarone and Born 2007). 3H2O is used in relatively small quantities andanalysed using liquid scintillation spectrometry (e.g. Ortiz et al. 1978; Reilly andFedak 1990). Samples are analysed for 18O using isotope-ratio mass spectrometry(e.g. Speakman 1997, 2001; Sparling et al. 2006).
Marine Mammal Ecology and Conservation / 08-Boyd-Ch08 page 173 7:55pm OUP CORRECTED PROOF – Finals, 5/7/2010, SPi
8.2 Measurement of metabolism j 173

Isotope concentrationsmeasured at equilibration allow calculation of the body waterpool size (see Section 8.3.2). EE is inferred from estimated CO2 production, which iscalculated from the differential elimination of the hydrogen and oxygen isotopes (i.e.labels) from the body water pool (see Box 8.2). The oxygen isotope is eliminated fromthe body by continuous flux through the body of both water and expired CO2, but thehydrogen isotope is only eliminated by water flux. The difference between the twoelimination rates is correlated with CO2 production (Lifson et al. 1955). Multiplying thedifference in the gradients of the exponential declines in isotope enrichments over timeby the size of the body water pool gives a quantitative estimate of CO2 production.There are many complexities involved in correcting for differential distribution spacesof the labels and fractionation during elimination, involving a number of alternativecalculation methods (Speakman 1997). Sparling et al. (2008) found a good correspond-ence between DLW-derived estimates of daily EE and those measured using continu-ous open-flow respirometry, although unusually highMRs have been observed in somestudies (e.g. Boyd et al. 1995a). Several equations are available for calculating the rates ofCO2 production inDLW studies, varying between one- and two-poolmodels (separatecalculations for hydrogen body pool and oxygen body pool) and differing in thetreatment of fractionation effects. Sparling et al. (2007) described these differentapproaches and concluded that two-pool models, which use the measured dilutionspace ratio and include a correction for fractionation effects, are most appropriate formarine mammals. Speakman‘s model (1997; eqn 7.43 therein) was judged to be themost appropriate for future marine mammal studies (see Box 8.2).
The principal advantage of DLW is that it provides a measure of FMR, integratingthe costs of all activities over the measurement period. This is the most ecologicallyrelevant measure of metabolism. Although expensive, the costs of isotopes, inparticular 18O, have declined and developments in mass spectrometer technologyhave enabled labelling at lower dosages. Thus, DLW studies of marine mammal MRare now feasible for more species, but larger doses of isotope are still required for thesame level of precision and accuracy in larger animals. Methods are not well-suited tofree-ranging cetaceans or sirenians due to the general capture and restraint require-ments. Additionally, field studies can be logistically difficult, with the need torecapture the same animal within a relatively short, specified time window (e.g.about 7–10 days). Although this period is long compared to that needed fortechniques such as respirometry, there remain limits to the ecological relevance ofindividual measures of EEmade using DLW. However, useful estimates of FMR canbe gained for many species if field studies are carefully designed and executed atseveral times of the year. An important issue that is often overlooked in DLW studiesis that of generating measures of uncertainty in estimates of FMR. Large randomerrors can occur when using DLW to measure metabolism in individuals, so it isusually important to use grouped data when describing MR using DLW. A MonteCarlo simulation and bootstrapping approach incorporating uncertainty in inputparameters (e.g. analytical variability, measurement error in isotope injection volume)
Marine Mammal Ecology and Conservation / 08-Boyd-Ch08 page 174 7:55pm OUP CORRECTED PROOF – Finals, 5/7/2010, SPi
174 j Measurement of individual and population energetics

Box 8.2 Calculations of gas exchange in studies of metabolism
Respirometry
There are numerous configurations of open-flow respirometry systems andthe basic equations for calculating VO2 and CO2 vary depending on which isused. Generally in marine mammal studies, flow rate is measured downstreamof the chamber and a subsample of the flow is dried (using a chemical dryingagent) before going to the gas analysers—the equations below assume this isthe case.
. If CO2 is not measured and is absorbed after flow measurement but prior toO2 measurement, RQ has to be assumed and VO2 can be calculated asfollows:
VO2 ¼ (FiO2 � FeO2) � F=(1� FiO2 þ RQ � (FiO2 � FeO2) )
. If CO2 is measured:
VO2 ¼ F � ( (FiO2 � FeO2)þ FiO2 � (FiCO2 � FeCO2) )=(1� FiO2)
where Fi ¼ the fractional concentration of O2 or CO2 in incurrent air, Fe ¼ thefractional concentration in excurrent air, and F ¼ the rate of flow through chamber.
The above equations require the regular calibration of flow meters and gasanalysers. However, the following is a simple formula for use where extremeaccuracy is not required, RQ is assumed, gas is dried, and CO2 is absorbed beforethe gas analyser.
VO2 ¼ (0:2094VN2=0:8)(DC=DC�)
This involves using the nitrogen (N2) calibration technique of Fedak et al.(1981) where DC and DC* refer to the deflection of the O2 analyser duringmeasurement and calibration, respectively, and VN2 is the volume (or flowrate) of N2 used in the calibration. This has the advantage of eliminating theneed to calibrate the O2 analyser or measure the flow past the animal, thusproducing increased accuracy. This is also particularly useful for situations ofhigh ambient humidity as it is relatively insensitive to errors due to watervapour.
Doubly labelled water (DLW)
Sparling et al. (2008) suggested that the most appropriate calculation model formarine mammals was the double-pool model from Speakman (1997):
rCO2 ¼ (N=2:078)(ko � Rdilspace � kd)� 0:0062kd �N � Rdilspace
where: rCO2 ¼ rate of CO2 production; ko,d¼ rate of turnover of O2 and deuterium
Marine Mammal Ecology and Conservation / 08-Boyd-Ch08 page 175 7:55pm OUP CORRECTED PROOF – Finals, 5/7/2010, SPi
8.2 Measurement of metabolism j 175

has been used in previous studies using DLW to generate confidence limits forestimates of EE (Boyd et al. 1995a; Speakman 1995; Sparling et al. 2008).
Singly labelled water (SLW)
Hydrogen isotopes of water (2H2O or 3H2O) alone, can also be used to estimateMR, EE, and food intake and at a substantially lower cost for both label andanalyses. Quantitatively dosing an animal and sampling (again, usually blood) afterequilibration allows measurement of the dilution space and total body water pool,and from this total body energy can be estimated (see Sections 8.3.1 and 8.3.2).A second dose and equilibration after a specified period allows estimation ofchange in total body energy over the interval between doses. If the animal is fastingthroughout this interval, which occurs for routine periods in many marine mam-mals, this change equates directly to total EE. In addition, serial sampling of thebody pool after equilibration allows measurement of water flux over time, whichcan be used to estimate EE and energy/food intake, given knowledge about thefood type consumed and calculation of metabolic water production (MWP, seeSection 8.5.2, Box 8.3 for an estimation of milk intake; for food intake see theadaptation of this equation in Bowen et al. (2001) and Muelbert et al. (2003) whichaccounts for the digestible energy (DE) of prey).
8.2.4 Proxies for assessing energy expenditure (EE)—heartrate (fH) and stroking rate (fS)
The cryptic behaviours of most wild marine mammals make energetic assessmentsby respirometry and DLWmethods challenging. New tagging technologies coupledwith knowledge concerning the correlation between many physiological parametersand MR enable the use of proxies for free-ranging marine mammals. Depending onthe species and question to be evaluated, fH provides such a useful proxy. Understeady-state conditions, there is a good linear relationship between fH and MR inmost vertebrates studied to date (Butler et al. 2004). This is based on the relation-ship (Fick 1870) between VO2 and fH:
VO2 ¼ (CaO2 � CvO2) �VS � fH
(2H2O) isotopes; Rdilspace ¼ ratio of the two dilution spaces Nd/No; N ¼ body waterpool calculated asNoþ (Nd/Rdilspace)/2.
There are also equivalent equations when tritium (3H2O) is used as a label (seeSpeakman 1997). Tritium has the advantage of being easy to measure with greataccuracy and precision by detecting the beta particles it emits. However, thisradioactivity also means that there are safety implications, and hence require verystrict safety procedures for its use and disposal. A further disadvantage is theabsence of background levels of tritium—covariation in drifts in the backgroundlevels of 18O and deuterium tend to cancel each other out—this covariation cannotbe used to minimize error when using tritium.
Marine Mammal Ecology and Conservation / 08-Boyd-Ch08 page 176 7:55pm OUP CORRECTED PROOF – Finals, 5/7/2010, SPi
176 j Measurement of individual and population energetics

whereVS is the stroke volume of the heart and CaO2� CVO2 is the difference in O2
concentration between arterial and mixed venous blood. Although there are largevariations in fH due to diving activity, Fedak (1986) demonstrated a linear relationshipbetween VO2 and fH in a grey seal (Halichoerus grypus) if values were averaged overcomplete dive cycles. Similar results have been reported for Californian sea lions(Zalophus californianus), harbour seals (Phoca vitulina), and bottlenose dolphins (Tursiopstruncatus) (T.M. Williams et al. 1991, 1993; Butler et al. 1992; Boyd et al. 1995a).
The general configuration of an fH recording system consists of electrodes thatdetect the heart rate signal connected to a logger which stores the signal for laterprocessing. The logger may be directly attached to the electrodes or the signal maybe relayed via radiotelemetry to an externally mounted logging device. The fHsignal has been measured in marine mammals using the R-wave detector (mostcommonly used), the Holter monitor, and the digital electrocardiogram recorder(see Ponganis 2007 for a detailed review). Off-the-shelf tags (tested on free-ranging marine mammals) are currently manufactured by Wildlife Computers(Redmond WA) and UFI Technologies (Morro Bay, CA), using surface-mountedor implantable electrodes. Implantable electrodes require surgery and have beenknown to induce substantial inflammatory responses in some species (Green et al.2009). Artefacts due to muscle-generated electrical impulse must be avoided; theability to assure this will dictate the selection of an R-wave detector versus a digitalelectrocardiogram recorder. In the latter case, skeletal muscle artefacts can bescreened and corrected. Surface attachments will only last a finite amount of timeand it is also important to recognize that surface electrode attachments have afinite life, with the subsequent decay of fH signals leading to a falsely assumeddecrease in fH.
Butler et al. (2004) gives a detailed account of the advantages and disadvantagesof the use of fH to estimate MR. The greatest advantage of measuring fH is that itcan potentially provide estimates of EE of free-living animals at varying temporalscales. MR can be estimated for specific types of behaviour (Butler et al. 1992), withthe potential to examine longer term variation in the FMR of free-living individuals,as demonstrated in penguins (e.g. Green et al. 2005).
A difficulty of this method is that the relationship between fH and MR must beestablished for each species. Realistically, this can be achieved in the laboratory foronly a few marine mammals. Additionally, the fH/VO2 relationship may differunder conditions of digestion (McPhee et al. 2003) and extreme bradycardia (Boydet al. 1995a). Studies on birds have shown that the fH/VO2 relationship can varyunder differing conditions (e.g. exercise, feeding, thermoregulation) and thereforecalibration studies need to be tailored to the likely range of activities undertakenand conditions experienced by free-ranging animals (Green et al. 2006). As withmany other field methods like DLW, high levels of individual variation have beendemonstrated and need to be recognized when interpreting the data (Butler et al.1992; Boyd et al. 1995a; McPhee et al. 2003).
Marine Mammal Ecology and Conservation / 08-Boyd-Ch08 page 177 7:55pm OUP CORRECTED PROOF – Finals, 5/7/2010, SPi
8.2 Measurement of metabolism j 177

A comparatively new method for determining the energetic demands of free-ranging marine mammals involves the use of instrumentation to determine fS.Like heart beats, marine mammals expend energy for each individual swimmingstroke taken. With knowledge about the RMR of an animal, the cost ofindividual swimming strokes, and the number of strokes taken during specificactivities, it is possible to calculate the EE for discrete activities. Animal-bornecameras (Davis et al. 1999, 2001; Bowen et al. 2002) and 3-axis accelerometermicroprocessor tags (T.M. Williams et al. 2004a; R.P. Wilson, et al. 2006) havebeen used for recording individual strokes. Although a powerful method fordetailing the energetic cost of discrete activities including the energetic impactof living in different habitats, the fS method requires knowledge about the RMRand swimming metabolism of each species. Fortunately, with increased use ofthis method, stroke-cost libraries for marine mammals are being developedwhich will provide a database for converting fS data into an energetic demand(e.g. see T.M. Williams et al. 2008 for a comparison of locomotor costs inmarine and terrestrial mammals).
8.2.5 Proxies for assessing energy expenditure (EE)—allometry
The logistics of measuring the metabolism of marine mammals, especiallyunder free-ranging conditions, have instigated the use of allometry to predictboth short-term and long-term EE. A wide variety of predictive equations areavailable, but they are only as good as the data comprising them (see Table 9.1in Boyd 2002a for a compilation of marine mammal metabolic data). Ofparticular concern is the extrapolation of allometric regressions to includeexceptionally large marine mammals for which few data are available. Regard-less, the use of allometry can provide a starting point for predicting EE. Themain advantage of using allometry is that it is relatively simple and relies onlyon a measure (or estimate) of body mass. Estimates of metabolism usingallometry may be the closest one can get to measuring the MR of the largestcetaceans.
The allometric relationship between body mass and MR is one of the mostfrequently used energetic relationships. Among marine mammals:
BMR ¼ 1:93 mass0:87
in phocid seals resting submerged (Lavigne et al. 1986) and
FMR ¼ 30:43 mass0:524
in pinnipeds and cetaceans (Boyd 2002a), where MR is in watts and mass is in kg.Although some debate exists as to the exact value of the exponent for mammals
Marine Mammal Ecology and Conservation / 08-Boyd-Ch08 page 178 7:55pm OUP CORRECTED PROOF – Finals, 5/7/2010, SPi
178 j Measurement of individual and population energetics

MR is generally thought to be proportional to body mass raised to ¾ power. Thelink between allometric predictions of BMR and estimates of FMR is generally asingle multiplier. A general rule of thumb is that the RMR of marine mammalsaverages 2 times the predictions for terrestrial mammals based on Kleiber (1975),and that FMR is 3–4 times BMR (see Costa and Williams, 1999; Boyd 2002a).Exceptions do occur and include comparatively low resting MR for manatees, andcomparatively low FMR for deep-diving phocid seals.
The simplicity of using allometry to predict MR can be misleading, and may becomplicated in the case of marine mammals. The effects of varying amounts ofmetabolically inert blubber, especially for species that undergo large seasonalchanges in body composition, and uncertainties over the true scaling exponent(which may differ between marine and terrestrial species) will affect the applicabilityof generalized allometric regressions for individual species. Consequently, allome-try may be more applicable to the estimation of MR at the group or populationlevel than amongst individuals.
8.3 Estimating body composition
Body composition analysis divides body mass into components on the basis ofdiffering physical properties. The energy content and nature of the major constitu-ents of an animal‘s body (lipid, protein, and carbohydrate) can be used to estimatethe quantity of stored energy and the nutritional status of an individual, but it canalso be used to understand energy gain and expenditure, as well as nutrient utilizationduring fasting. Body mass is divided into fat and fat-free mass (FFM, sometimesreferred to as lean body mass). However, FFM is heterogeneous, including protein,water, and bone mineral. A number of approaches are available to estimate the bodycomposition of marine mammals, and the approach used depends largely on the sizeand type of animal and on the nature of the question being investigated.
8.3.1 Carcass analysis and the relationship between chemicalconstituents
The most direct method of estimating the energy content of an individual is by meansof bomb calorimetry of the whole carcass or, more frequently, of subsamples of thehomogenized carcass (e.g. Blaxter 1989; Estes et al. 1998). Given that stored carbo-hydrate is negligible in mammals, direct determination of the fat and protein contentof such subsamples (e.g. Oftedal et al. 1987b) can also be used to convert to bodyenergy equivalents using standard values for the energy density of fat (39.5 MJ/kg)and protein (23.5 MJ/kg) (Schmidt-Nielsen 1980; Worthy and Lavigne 1983). How-ever, the need to homogenize the entire carcass in a whole-body grinder generallylimits this approach to fairly small marine mammal species or juveniles.
Given the large size of marine mammals, dissection is more generally used toprepare the various body components (i.e. carcass, viscera, blubber, and skin) for
Marine Mammal Ecology and Conservation / 08-Boyd-Ch08 page 179 7:55pm OUP CORRECTED PROOF – Finals, 5/7/2010, SPi
8.3 Estimating body composition j 179

analysing separately by either bomb calorimetry or chemical analysis. Care must betaken to reduce evaporation and fluid loss during dissection and to correct forthese losses in the final calculations (e.g. Oftedal et al. 1989; Reilly and Fedak 1990;Arnould et al. 1996). Measurement of the total mass fraction of these bodycomponents combined with an estimate of their energy content, has been usedto study energy storage and depletion in pinnipeds, cetaceans, and polar bears (e.g.Bryden 1972; Lockyer et al. 1985; Bowen et al. 1992; Pond et al. 1992).
Chemical carcass analysis also provides the standard from which other methods ofmeasuring body composition (see Section 8.3.2) can be validated (e.g. Reilly and Fedak1990; R. Gales et al. 1994b; Arnould et al. 1996). That is, from the early empiricalstudies of Pace and Rathbun (1945), the composition of lean body mass or FFM inmature mammals is assumed to contain a relatively constant proportion of water(�73%) and protein (�20%). Thus, in principle in the two-compartment model, if thetotal body water (TBW) of an animal is known, from this FFM and thus total bodyprotein (TBP) content can be calculated, with the remainder of the body masscomprising total body fat (TBF). From these values, total body energy (TBE) can beestimated as above. Although this principle remains generally valid, the precise valuesfor the relationship betweenTBWand other body constituents have been re-examinedmany times and there is some evidence for species-specific relationships. For instance,Reilly and Fedak (1990) empirically established the relationships between body com-ponents and TBW in grey seals and derived the following predictive equations:
%TBF ¼ 105:1� 1:47(%TBW)
%TBP ¼ 0:42(%TBW)� 4:75
TBE (MJ) ¼ 40:8(body mass, kg)� 48:5(TBW, kg)� 0:4
These regression equations accounted for 95–99% of the observed variation ingross body components and have been widely used for pinnipeds, but may be bestapplied to other phocids. Species-specific equations have also been determined forharp seals (Phoca groenlandica, R. Gales et al. 1994a) and Antarctic fur seals (Arctoce-phalus gazella, Arnould et al. 1996). In the absence of species-specific data, applicationof the most appropriate equation for a given family or age-group is recommended.
8.3.2 Total body water (TBW) measurement
The most accurate method for non-destructively estimating body composition inmarine mammals is based on hydrogen isotope (2H2O or 3H2O) dilution todetermine TBW from the resulting isotope dilution space (Speakman 2001).Other body components and TBE can then be estimated from their empiricallyderived relationships with TBW (see Section 8.3.1). As with DLW and SLW (seeSection 8.2.3), knowing the amount of isotope administered, the isotope concen-tration at equilibration, and the body mass of the animal allows the dilution spaceto be calculated, which can then be converted to TBW. That is, while 2H2O or
Marine Mammal Ecology and Conservation / 08-Boyd-Ch08 page 180 7:55pm OUP CORRECTED PROOF – Finals, 5/7/2010, SPi
180 j Measurement of individual and population energetics

3H2O do mix almost entirely with TBW, a small fraction of isotope is lost torapidly exchangeable hydrogen atoms in organic constituents of the body and thusdilution space will slightly overestimate TBW (reviewed in Bowen and Iverson1998). A comparison of a number of studies on phocid and otariid pinnipeds, inwhich both dilution space (using either 2H2O or 3H2O) and carcass desiccationwere measured in the same individuals, revealed a single predictive regressionequation which fits all species and can be used to calculate TBW (Bowen andIverson 1998):
TBW ¼ 0:003þ 0:968 � (dilution space)
Using TBWand empirically derived equations (see Section 8.3.1), TBF, TBP, andTBE can then be calculated. A number of detailed descriptions of the field andanalytical methods, as well as calculation procedures used in hydrogen isotopedilution studies of body composition, are available in the literature and serve asuseful examples of specific procedures (e.g. Reilly and Fedak 1990; Iverson et al.1993; Arnould et al. 1996; Speakman 1997, 2001; Mellish et al. 1999; Sparling et al.2006; Acquarone and Born 2007; Hall and McConnell 2007).
8.3.3 Ultrasound
Imaging ultrasound is also used to measure blubber depth as an index of bodycondition. B-mode ultrasound comprises a linear array of transducers that simul-taneously scan a plane through the animal; this is viewed as a two-dimensionalimage on a screen from which measurements of internal structures can beobtained. Using a portable ultrasound scanner, blubber depth is measured at aseries of dorsal, lateral, and ventral points along the body of a sedated or restrainedanimal (e.g. Mellish et al. 2004). The blubber depth measurements are combinedwith measurements of length and girth taken at the same points along the body,and the animal is then modelled as a series of truncated cones from which volume(Vs) of each blubber section can be calculated:
Vs ¼ 1=3�h (2rxdx þ rxdy þ rydx þ 2rydy)þ d 2x þ dxdy þ d 2y
� �h i
where h is the length of each body cone, dx,y is blubber depth and rx,y is radius of theanimals at site x and y (see N.J. Gales and Burton 1987; McDonald et al. 2008). Thetotal volume of the blubber can be converted to total mass and fat using estimatesof blubber density and lipid content; FFM can then be estimated by subtraction(see Section 8.3.1). The method has been validated against carcass analysis andisotopic methods in several species of phocid seals (Slip et al. 1992; Worthy et al.1992; N.J. Gales and Burton 1994; Webb et al 1998; McDonald et al 2008) and hasmore recently been used in free-ranging bottlenose dolphins (Noren and Wells2009). To assess reduction in measurements taken, Hall and McConnell (2007)found that a single blubber depth measured at the dorsal midpoint between the
Marine Mammal Ecology and Conservation / 08-Boyd-Ch08 page 181 7:55pm OUP CORRECTED PROOF – Finals, 5/7/2010, SPi
8.3 Estimating body composition j 181

foreflippers was the best predictor (explaining 72.5% of variability) of total body fatin juvenile grey seals.
8.3.4 Bioelectrical impedance analysis (BIA)
Bioelectrical impedance analysis (BIA) was initially developed and validated as arapid and non-invasive means of estimating TBW and, thus, body composition, inhumans (see Lukaski 1987). It has since been adapted for use in domestic speciesand a wide range of free-ranging mammals. Predictive relationships between TBW(estimated by isotope dilution) and impedance measurements have been developedin grey seals (Bowen et al. 1999), but results in other pinniped species have been lesspromising. Tierney et al. (2001) found significant, positive relationships betweenTBW in southern elephant seals and BIA variables, but the level of accuracy wasinadequate for BIA to be more useful than the other methods. Similar results werereported in harbour seals (Bowen et al. 1998) and in female Antarctic fur seals(Arnould 1995).
BIA is based on the conduction of a known, low-level, alternating electric currentthrough an organism. Conductivity is related to water and electrolyte distribution.Because FFM contains most of the body water and electrolytes, conductivity isgreater in fat-free tissues than in fat and, therefore, the impedance of the electricalcurrent is dependent on the body composition of the organism (see Lukaski 1987for a review of the principles and equations). For each individual species a predictiverelationship between TBW (estimated either by carcass analysis or hydrogen isotopedilution) and impedance must be developed. Because electrode configuration andplacement on the body can have significant effects on both the magnitude andrepeatability of measurements (R. Gales et al. 1994b; Farley and Robbins 1994;Arnould 1995) they should be tested to ensure that (1) total body impedance isbeing measured and (2) that the measurements are reproducible. Complete proto-cols, including electrode configurations and placements have been described indetail for phocids (Gales et al. 1994b), otariids (Arnould 1995), polar bears (Farleyand Robbins 1994) and small carnivores (Pitt et al. 2006). Any movement of theanimal during measurement will significantly affect the repeatability of measure-ments and, thus, the best results are obtained from anaesthetized individuals (Farleyand Robbins 1994; Bowen et al 1999; Pitt et al. 2006). Although BIA is less accurateand precise than carcass analysis or hydrogen isotope dilution, it is relatively fast andnon-invasive and, therefore, may provide a valuable alternative for estimating meandifferences in TBWamong groups (Bowen et al. 1999). Thus, investigators will haveto weigh the merit of speed vs. cost and precision for a particular study.
8.3.5 Novel approaches to estimating body composition
Several novel approaches have been used to estimate body composition in marinemammals. One involves examining changes in the diving behaviour of sealsinstrumented with electronic data loggers. Elephant seals regularly perform dives
Marine Mammal Ecology and Conservation / 08-Boyd-Ch08 page 182 7:55pm OUP CORRECTED PROOF – Finals, 5/7/2010, SPi
182 j Measurement of individual and population energetics

during which they spend a large proportion of time drifting passively through thewater column (Crocker et al. 1996). The rate of drift depends on the buoyancy ofthe seal, which, in turn, depends on their body composition, with fatter sealsdrifting more slowly (Irvine et al. 2000). Biuw et al. (2003) used this observationto examine the theoretical relationships between drift rate and body composition,and carried out a sensitivity analysis to quantify uncertainty caused by varyingmodel parameters. Using data from Argos satellite tags in the model, they were ableto estimate the relative lipid content of individual seals to within about +2% ofthat estimated by hydrogen isotope dilution, and to estimate changes in bodycomposition by recording changes in the rate of drift during diving in foragingseals. This approach has recently been extended to changes in drift rate estimatedfrom changes in the swimming speed of diving elephant seals recorded by archivalelectronic tags (Thums et al. 2008a). Although drift dives have been recorded inboth northern and southern elephant seals and have recently been described inadult male New Zealand fur seals (Page et al. 2005b), it is not known howwidespread this type of behaviour is among marine mammals and, therefore,how general this approach to estimating body composition might be.
8.4 Energy balance analysis
Measurement of the chemical energy of food entering and leaving an animal‘s bodywill provide an indirect estimate of MR, referred to as analysis of energy or materialbalance. Since not all GE consumed by an animal is available for metabolism,estimates of DE, ME, and NE provide increasingly better representations of whatan animal actually has available for physiological work. If an animal is in a stablestate (i.e. maintaining its biomass and not shedding products, such as feathers, fur,fetus or milk), then subtracting FE and UE from GE (i.e. ME, Fig. 8.1) will be ameasure of its MR in an absorptive state (e.g. if resting, it will be a measure of RMR,Box 8.1). More complicated scenarios are introduced when the animal is not in asteady state, in which case all significant outputs of organic material (includingtissue growth) must be measured.
The principle of energy balance analysis is straightforward, but in practicerequires controlled feeding studies in captive situations and thus is restricted tothe smaller species of marine mammals. In addition, extended acclimation periodsof days are required to allow clearance of previous dietary regimes, and feedingstudy measurements must be taken over periods of at least 2–3 days or more toensure that average steady-state energy input and output can be measured (e.g.Keiver et al. 1984; Lawson et al. 1997; Trumble and Castellini 2005). Finally, giventhat the collection of urine is required for measuring ME (e.g. see Keiver et al. 1984;Ronald et al. 1984), methods are not well-suited to the study of marine mammalsin water and preclude measurement in cetaceans. Hence, even in pinnipeds, moststudies have assessed apparent DE only (reviewed in Costa and Williams 1999).
Marine Mammal Ecology and Conservation / 08-Boyd-Ch08 page 183 7:55pm OUP CORRECTED PROOF – Finals, 5/7/2010, SPi
8.4 Energy balance analysis j 183

Experimental approaches to energy balance studies and the estimation of DErequire the quantitative collection of faeces (uncontaminated by urine). This can bedone using either whole faecal collections (requiring collection of all faeces asso-ciated with the food consumed) or, more frequently, by feeding an indigestible inertdietary marker and comparing the changes in energy (or a given nutrient) andconcentration of the marker in the faeces relative to that in the food consumed(Kleiber 1975). Markers may be naturally occurring in the food or added manually,but should be non-absorbable, non-toxic, have no appreciable bulk, mix thor-oughly with digesta, and be accurately analysable. Examples of markers used inmarine mammal studies include chromium sesquioxide (Cr2O3), naturally occur-ring manganese (Mn2þ ), cobalt-ethylenediaminetetraacetic acid (Co-EDTA), sil-icon tubing pieces, dried kernal corn, unpopped popcorn, and dyed corncob grit (e.g. Keiver et al. 1984; Fadely et al. 1990; Mårtensson et al. 1994; Lawson et al. 1997;Rosen and Trites 2000; Trumble and Castellini 2005; Larkin et al. 2007). In currentpractice, the marker is usually fed just at the beginning of the tested diet trial andfaecal collection is begun at first appearance of the marker and continued for 24–72hours (e.g. Keiver et al. 1984; Trumble and Castellini 2005). Diet and faeces arecollected, homogenized, and analysed for total water, nitrogen, lipid, and energycontent by standard procedures and for marker concentration, according to themarker used (see above references for procedural details).
Energy and nutrient balance studies provide important insight into understand-ing animal MR, digestive efficiency, and food and energy requirements. Thesemethods also allow the assessment of differing nutrient and energy availability fromdifferent food or prey types. This is because diet quality, quantity, and digestive tractmorphology together determine the effectiveness of nutrient and energy extractionfrom food (e.g. Stevens and Hume 1995). For example, in seals fed differentspecies of fish, or diets of several fish species, digestive efficiency and nutrient/energy extraction differs with diet, meal size, and feeding regime (e.g. Rosen andTrites 2000; Trumble and Castellini 2005). Thus, inferences for evaluating MRfrom such studies should consider these effects.
8.5 Energetics of lactation
The ability of females to efficiently transfer milk energy to their neonates can havesignificant consequences for both maternal and offspring fitness. Understandingvariation in the patterns of energy transfer both within and among species requiresdetailed knowledge of both the proximate composition of the milk and the rate ofmilk production. Substantial individual variation among females in both milk com-position and milk output has been noted for a variety of free-ranging mammals (seeLang et al. 2009). Thus, when attempting to characterize these components fora species, care should be taken to ensure that a sufficient number of individualsare sampled to provide representative data. In addition, to produce accurate
Marine Mammal Ecology and Conservation / 08-Boyd-Ch08 page 184 7:55pm OUP CORRECTED PROOF – Finals, 5/7/2010, SPi
184 j Measurement of individual and population energetics

estimates of milk output and milk energy output of an individual, values for the milkcomponents of that individual should be used rather than the species averages (seeSection 8.5.2).
8.5.1 Milk composition
Sample collection
Milk composition can change substantially over the course of lactation (e.g. Oftedalet al. 1987a) and attendance bouts (e.g. Costa and Gentry 1986; Georges et al. 2001).Consequently, the timing of sampling is an important consideration. Exogenousoxytocin in IM doses of approx. 0.10–0.15 IU kg�1 in pinnipeds helps to initiatethe milk ejection reflex and facilitates milk collection. Because circulating levels ofoxytocin can remain elevated for several hours, a single dose is sufficient to achievecomplete evacuation (Mačuhová et al. 2004). Repeated doses of oxytocin can altermammary secretory processes and should be avoided (Oftedal 1984). Milk com-position does not appear to change with evacuation of the gland in pinnipeds(Oftedal et al. 1987a; Iverson et al. 1993), but the same may not be true forcetaceans, polar bears, and otters and thus requires confirmation.
For large and/or generally inaccessible species of marine mammals, obtainingmilk samples represents a significant challenge. Although post-mortem samplingmay be the only source for some species, it can be very difficult to obtain samplesthat are representative and uncontaminated (e.g. from blood; see Oftedal 1984,1997). Manual expression of milk from intact glands immediately post-mortem hasbeen successful in some species (Peaker and Goode 1978; Ponce de Leon 1984;Oftedal et al. 1988). However, due to the loss of the milk ejection reflex, completeevacuation of the gland is probably not possible. Milk samples obtained from thestomachs of neonates should never be used to estimate proximate composition, asthey will overestimate the water and carbohydrate content and underestimate thefat and protein content of the milk (Oftedal and Iverson 1995).
Samples should be kept frozen until analysed. To avoid exposing collectedsamples to repeated cycles of freezing and thawing for individual analyses, it isadvisable to aliquot fresh samples prior to freezing wherever possible. Thawedsamples should be homogenized before analysis.
Methods of analysis
The analysis of marine mammal milk samples follows standard methods for theanalysis of dry matter (water), protein, lipid and carbohydrate (reviewed in Oftedaland Iverson 1995). The gross energy (GE) content can be determined directlyusing bomb calorimetry, or accurately estimated using standard values for theenergy density of milk lipid and protein (see Box 8.3). Analyses should beperformed independently and in duplicate. Values for individual componentsshould never be calculated by subtraction (e.g. protein ¼ dry matter � [lipidþ
Marine Mammal Ecology and Conservation / 08-Boyd-Ch08 page 185 7:55pm OUP CORRECTED PROOF – Finals, 5/7/2010, SPi
8.5 Energetics of lactation j 185

carbohydrateþ ash] ), as this will compound errors in measurements. Carbohydrateand non-protein nitrogen are normally found in only trace amounts in the milks ofmarine mammals. However, because marine mammal milk can be very high in lipids,which contribute most of the GE, lipid analysis warrants special consideration.
The standard and most accurate method for the quantitative determination of milklipid content is the Roese–Gottlieb method (AOAC 2000). This is a gravimetricmethod which uses sequential diethyl ether and petroleum ether extractions afterpre-treatment of the sample with ammonium hydroxide to disrupt the milk fatglobules and break down the hydrophobic casein micelles. Any new method fordetermining milk fat content should be verified against the Roese–Gottlieb methodprior to use. The chloroform- and methanol-based Folch (Folch et al. 1957) and Blighand Dyer (1959) methods have also been used, but these methods are unsuitable forthe quantitative determination of total milk lipid content. Direct comparison of theFolch and Roese–Gottlieb methods demonstrates that the values obtained by Folch
Roese-Gottlieb: lipid content (%)30 35 40 45 50 55 60 65
Fol
ch: l
ipid
con
tent
(%
)
30
35
40
45
50
55
60
65
1:1
Fig. 8.3 Comparison of milk lipid content values obtained for 71 samples of grey seal
milk analysed by the Roese–Gottlieb method (AOAC 2000) and by a modified Folch
method (Folch et al. 1957; solvent to sample ratio increased from 20:1 to 50:1). Values
are averages of duplicate analyses. Differences among duplicates (data not shown)
were significantly less for the Roese–Gottlieb (0.14%) compared to the Folch (0.76%;
p < 0.001, paired t-test) method. Estimates of milk lipid content determined by
Roese–Gottlieb were significantly higher than those obtained by Folch (p < 0.001,
paired t-test), with the Folch method underestimating milk lipid content by an average of
5.1% and a maximum of 11.6% (S.L.C. Lang and S.J. Iverson, unpublished data).
Marine Mammal Ecology and Conservation / 08-Boyd-Ch08 page 186 7:55pm OUP CORRECTED PROOF – Finals, 5/7/2010, SPi
186 j Measurement of individual and population energetics

are more variable and are underestimated compared with the Roese–Gottlieb method,even when the solvent to sample ratio has been substantially increased (Fig. 8.3).There are similar problems with the Bligh and Dyer method (Iverson et al. 2001).
8.5.2 Milk output and milk energy output
Measurement of the rate of output by females (i.e. milk intake, MI, by the neonate)using either DLW or SLW techniques (see Section 8.2.3) has been previouslydescribed in detail by Oftedal and Iverson (1987). The daily total water intake(TWI) of the neonate(s) over the period of interest is estimated from the elimin-ation of labelled hydrogen from the body water pool of the neonate (see Section8.2.3, Box 8.3). MI is then calculated from either a measure of MWP and thewater content of the milk (DLW method) or from data on the proximate compos-ition of the milk and the rates of fat and protein deposition of the neonate(s),
Box 8.3 Calculations for estimation of milk energy output
Formula for determining the gross energy (GE) content of milks fromproximate composition
L ¼ lipid, CP ¼ crude protein, S ¼ sugar (i.e. carbohydrate):
GE(MJ kg�1) ¼ (39:3y �%L)þ (23:6y �%CP)þ (16:5z �%S)100
Alternatively, if non-protein nitrogen (NPN) has been determined (where TP¼ trueprotein):
GE(MJ kg�1) ¼ (39:3y �%L)þ (23:6y �%TP)þ (31:0z �%NPN)þ (16:5z �%S)100
Total water intake (TWI)
In a young, growing animal, changes in hydrogen isotope concentration over timereflect not only water loss and the intake of unlabelled water but also dilution as aresult of an increase in the size of the body water pool (Nagy and Costa 1980;Oftedal and Iverson 1987).
To account for the changing body water pool size, hydrogen isotope concentrations attime t (Ht) are first corrected (H�t ) for changing pool size according to the formula:
H�t ¼ Ht � (Nt=Ni)
where Nt is the pool size at time t and Ni is the initial pool size. Note that thecorrection for changing N requires that N be estimated for each time period, eitherby a repeated isotope administration or by interpolation from initial and final valuesfor N (e.g. Mellish et al. 1999).
The isotope fractional turnover rate (k) is then estimated as the slope of the linearregression of the natural logarithm of H�t on time elapsed since isotope administra-tion (see Oftedal et al. 1987b).
Marine Mammal Ecology and Conservation / 08-Boyd-Ch08 page 187 7:55pm OUP CORRECTED PROOF – Finals, 5/7/2010, SPi
8.5 Energetics of lactation j 187

which allow estimation of MWP (SLW method, see Box 8.3). Daily milk energyintake can then be calculated using the GE content of the milk. Because solid foodintake or the drinking of water by the neonate(s) will cause an overestimation of MI,this method is limited to the period that neonates are solely dependent on milk. Theoptimal frequency and number of recaptures of the neonate(s) for blood samplingover the period of study will depend on factors including suckling pattern andlactation duration, expected rate of water turnover (i.e. MI), patterns of change inthe proximate composition of the milk, ease of recapture, and the effects ofdisturbance on female–offspring interactions (e.g. Oftedal and Iverson 1987; Mellish
Total daily water intake (TWI), the sum of water loss (L) and water storage or gain(G), is then calculated as:
TWI ¼ L þG ¼ (k �N1=2)þ DN
where N1/2 is the pool size at the mid-point of the study period (assuming a linearchange in N with time) and DN is the daily change in N. Although changes in N maynot be exactly linear, an assumption of linearity will result in relatively small errorsunless N changes by more than 40% over the period of study (Nagy and Costa1980).
Daily milk intake (MI)
The TWI of the suckling neonate(s) includes both the intake of preformed water inmilk (MWI) and metabolic water production (MWP) from the catabolism of milkconstituents and/or body nutrient stores:
TWI ¼ MWIþMWP
If neonates have been given DLW (Section 8.2.3), MWP can be estimated fromMR and subtracted from TWI. Using the percent water content of the milk, MWIcan then be converted to MI.
For SLW (Section 8.2.3), MI is calculated from TWI using the daily fat (FD) andprotein (PD) deposition rates of the neonate over the sampling period, and data on thepercent water (WM), fat (FM), protein (PM), and sugar (SM) contents of themilk over thecorresponding period, and assuming that the oxidation of 1 g of fat, protein, andcarbohydrate yields approximately 1.07 g, 0.42 g, and 0.58 g of water, respectively(from Oftedal et al. 1987b):
MI ¼ 100� TWIþ (1:07 � FD)þ (0:42 � PD)WM þ (1:07 � FM)þ (0:42 � PM)þ (0:58 � SM)
If the values for WM, FM, PM, or SM change over the period of study, averagevalues should be calculated for these components.
y from Blaxter (1989), z from Perrin (1958).
Marine Mammal Ecology and Conservation / 08-Boyd-Ch08 page 188 7:55pm OUP CORRECTED PROOF – Finals, 5/7/2010, SPi
188 j Measurement of individual and population energetics

et al. 1999; Crocker et al. 2001). Milk output/intake cannot be inferred from sucklingbehaviour, as neither time spent suckling nor the duration of individual sucklingbouts accurately reflects milk intake (reviewed in Cameron 1998).
8.6 Population energetics
Up to this point, the focus of this chapter has been on estimating the energyrequirements, expenditures, and body composition of individuals. In this section,we extend this to estimating the energy requirements of populations. Populationenergetics is important in the study of prey consumption, which tends to be animportant input into models of ecosystem structure and functioning (e.g. Bundyet al. 2009). Population energetics is also important in the assessment of thevulnerability of populations to changes in prey availability and other threats.
The simplest approach to estimating the gross food or energy requirements of apopulation is to multiply the estimated ration of individuals by the total populationsize. However, the requirements of individuals will depend on the size, diet, andperhaps reproductive status of individuals and sex. Therefore, in practice, moreuseful estimates of population consumption are derived from representing both thepopulation and ration as vectors of numbers at each age and the correspondingage- or size-specific rations (Boyd 2002b).
Bioenergetic models typically estimate the gross energy requirements (GER) of apopulation as the sum of the energy requirements of individuals in the population,according to the following:
GER ¼X
a¼n
a¼0na(Pa þ (A � BMRa)=ME )
where a ¼ age, n ¼ oldest age, P is the energy used in production (growth), A is ametabolic multiplier to account for activity, BMR (see Box 8.1), and ME (seeFig. 8.1). This recognizes faecal and urinary losses (Efþ u) and loss associated withthe energy cost of digestion (ESDA). GER can be calculated on any timescaledepending on the resolution of the data and the purpose of the model. P isestimated from growth models (usually Gompertz or Richards models fitted tobody mass at age data, see Chapter 5). ME is estimated from empirical laboratorystudies (e.g. Ronald et al. 1984; Rosen and Trites 2000), BMR (in watts) formammals is estimated using the allometric equation (3.4 � body mass0.75, Kleiber1975) and the Amultiplier is estimated from empirical studies of MR in relation tovarious types of activity (e.g. Costa et al. 1989; Castellini et al. 1992; Sparling andFedak 2004). Again depending on the data and purpose of the model, Acan account for the proportion of time in and costs of different activities. Forexample, Winship and Trites (2003) used the formulation: A ¼ water � Awaterþ(1 � water) � Aland where water is the proportion of time spent in the water, Awater
is a multiplier of BMR for water, and Aland is the multiplier of BMR for land.
Marine Mammal Ecology and Conservation / 08-Boyd-Ch08 page 189 7:55pm OUP CORRECTED PROOF – Finals, 5/7/2010, SPi
8.6 Population energetics j 189

Using a multiplier in this way assumes that active MR is a constant multiplier ofBMR (i.e. that FMR scales in the same way as BMR).
Where the data will support a more complex representation, the (A � BMR) termmay be expressed with a season-specific estimate of FMR (or average daily MR,ADMR) (e.g. Trzcinski et al. 2006). GER may also be indexed for differencesamong sexes and for different periods (e.g. daily compared to seasonal require-ments). There are a number of useful examples of this general approach toestimating population GER (Olesiuk 1993; Hammond and Fedak 1994; Mohnand Bowen 1996; Nilssen et al. 2000; Winship et al. 2001; Boyd 2002b; Trzcinskiet al. 2006). In each case, the specifics of the models are tailored to the availabledata. For example, tracking data for grey seals indicate seasonal changes inpopulation distribution (Breed et al. 2006). These seasonal differences in distribu-tion can be easily incorporated into estimates of population consumption to betterreflect the predation rate on localized prey species (Trzcinski et al. 2006).
These models contain three types of errors. The first is measurement error,which is how well we measure input data. The second, process error, is how wellparameters of the model fit the data, and the third is model error, the relationshipsamong the processes in the model (Mohn 2009). To date, most models attempt toaccount for measurement and process error, but little attention has been given tohow different models affect estimates and inferences. Uncertainty tends to increasewith model complexity. For example, Trzcinski et al. (2006) estimated a coefficientof variation of 4–8% associated with an age-structured model of grey seal popu-lations dynamics, but when the energetics were added to the model the coefficientof variation increased to 30%. Modelling with fewer parameters reduces thisinaccuracy. However, a more complex model with increased demographic, spatial,and temporal resolution may provide greater insight as to how prey consumptionmay change as a result of changes in population size and structure and how it mayrespond to environmental variability.
Measurement error (variability in input parameters) is often incorporated inmodel estimates of state variables using Monte Carlo techniques to calculateconfidence intervals around the predicted values (Mohn and Bowen 1996;Hammill and Stenson 2000; Boyd 2002b; Winship and Trites 2003; Trzcinskiet al. 2006). All model inputs have an error distribution associated with thembased on their empirical standard errors or an estimate of the upper and lowerboundaries of plausible values for each variable. Running the model many timesby resampling from these distributions provides a distribution of estimates,which can be used to calculate confidence intervals and the coefficient ofvariation. Parameters with the most amount of uncertainty have wider rangesof possible values and thus contribute more to overall model uncertainty. Theimplications of uncertainty and bias in the input data on model estimates can beassessed by examining the sensitivity of model predictions to changes in eachparameter or group of parameters (Mohn and Bowen 1996; Boyd 2002b).
Marine Mammal Ecology and Conservation / 08-Boyd-Ch08 page 190 7:55pm OUP CORRECTED PROOF – Finals, 5/7/2010, SPi
190 j Measurement of individual and population energetics