Embed Size (px)
Citation preview
Perspective in Nutrition
478
Measurement of muscle mass in humans:validity of the 24-hour urinary creatininemethod1 � 2
Steven B Heymsfield,3 MD, Carlos Arteaga, MD, C4fford McManus, BS,
Janet Smith, MMSc, RD. and Steven Moffltt, PhD
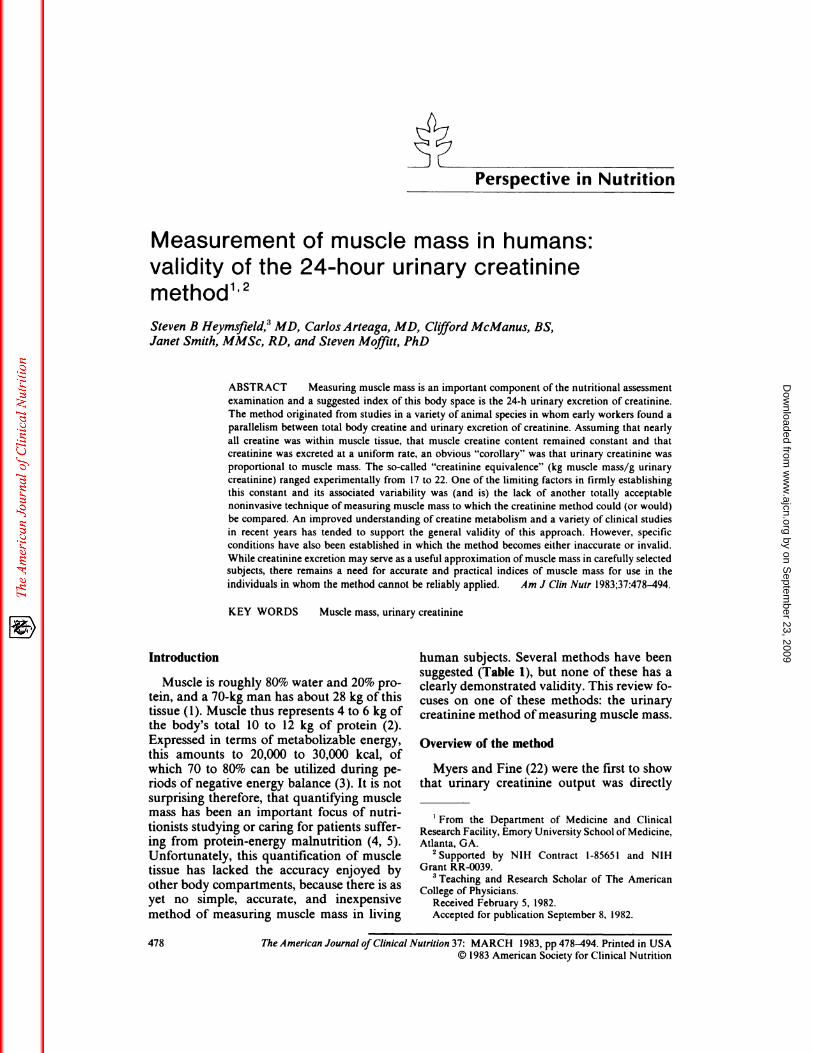
ABSTRACT Measuring muscle mass is an important component of the nutritional assessment
examination and a suggested index of this body space is the 24-h urinary excretion of creatininc.
The method originated from studies in a variety of animal species in whom early workers found a
parallelism between total body creatine and urinary excretion of creatinine. Assuming that nearly
all creatine was within muscle tissue, that muscle creatine content remained constant and that
creatinine was excreted at a uniform rate, an obvious “corollary” was that urinary creatinine was
proportional to muscle mass. The so-called “creatinine equivalence” (kg muscle mass/g urinary
creatinine) ranged experimentally from 17 to 22. One of the limiting factors in firmly establishing
this constant and its associated variability was (and is) the lack of another totally acceptable
noninvasive technique of measuring muscle mass to which the creatinine method could (or would)
be compared. An improved understanding of creatine metabolism and a variety of clinical studies
in recent years has tended to support the general validity of this approach. However, specific
conditions have also been established in which the method becomes either inaccurate or invalid.
While creatinine excretion may serve as a useful approximation of muscle mass in carefully selected
subjects, there remains a need for accurate and practical indices of muscle mass for use in the
individuals in whom the method cannot be reliably applied. Am J C/in Nutr 1983;37:478-494.
KEY WORDS Muscle mass, urinary creatinine
Introduction
Muscle is roughly 80% water and 20% pro-tein, and a 70-kg man has about 28 kg of thistissue (1). Muscle thus represents 4 to 6 kg ofthe body’s total 10 to 12 kg of protein (2).Expressed in terms of metabolizable energy,
this amounts to 20,000 to 30,000 kcal, ofwhich 70 to 80% can be utilized during pe-nods of negative energy balance (3). It is notsurprising therefore, that quantifying musclemass has been an important focus of nutri-
tionists studying or caring for patients suffer-ing from protein-energy malnutrition (4, 5).Unfortunately, this quantification of muscletissue has lacked the accuracy enjoyed by
other body compartments, because there is asyet no simple, accurate, and inexpensivemethod of measuring muscle mass in living
human subjects. Several methods have beensuggested (Table 1), but none of these has aclearly demonstrated validity. This review fo-cuses on one of these methods: the urinarycreatinine method of measuring muscle mass.
Overview of the method
Myers and Fine (22) were the first to show
that urinary creatinine output was directly
I From the Department of Medicine and Clinical
Research Facility, Emory University School of Medicine,
Atlanta, GA.2 Supported by NIH Contract 1-8565 1 and NIH
Grant RR-0039.3 Teaching and Research Scholar of The American
College of Physicians.
Received February 5, 1982.
Accepted for publication September 8, 1982.
The American Journal ofClinical Nutrition 37: MARCH 1983, pp 478-494. Printed in USA
© 1983 American Society for Clinical Nutrition
by on Septem
ber 23, 2009 w
ww
.ajcn.orgD
ownloaded from
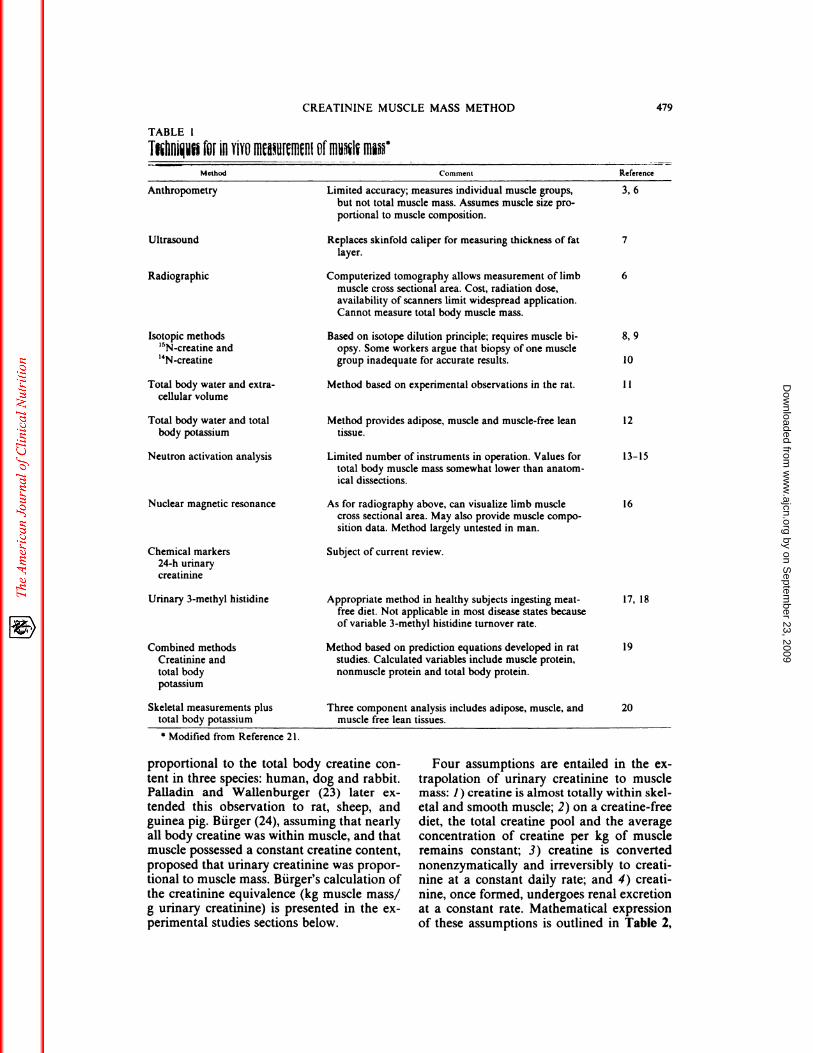
TABLE 1
Thliui�f�bEIll YIYtJM�U[�II1�HI Offfiu�1� I1��
Anthropometry
.‘-� � Method � -�- Comment l&e(erence
3, 6
Ultrasound
Radiographic
Isotopic methods
‘5N-creatinc and‘4Ncreatine
8, 9
10
CREATININE MUSCLE MASS METHOD 479
Limited accuracy; measures individual muscle groups,
but not total muscle mass. Assumes muscle size pro-
portional to muscle composition.
Replaces skinfold caliper for measuring thickness of fat 7
layer.
Computerized tomography allows measurement of limb 6
muscle cross sectional area. Cost, radiation dose,
availability of scanners limit widespread application.
Cannot measure total body muscle mass.
Based on isotope dilution principle; requires muscle bi-
opsy. Some workers argue that biopsy of one muscle
group inadequate for accurate results.
Total body water and extra-
cellular volume
Total body water and total
body potassium
Neutron activation analysis
Nuclear magnetic resonance
Chemical markers
24-h urinary
creatininc
Urinary 3-methyl histidinc
Combined methods
Creatininc andtotal body
potassium
Skeletal measurements plus
total body potassium
* Modified from Reference 21.
Method based on experimental observations in the rat.
Method provides adipose, muscle and muscle-free leantissue.
Limited number of instruments in operation. Values for
total body muscle mass somewhat lower than anatom-
ical dissections.
As for radiography above, can visualize limb musclecross sectional area. May also provide muscle compo-
sition data. Method largely untested in man.
Subject of current review.
Appropriate method in healthy subjects ingesting meat-
free diet. Not applicable in most disease states because
of variable 3-methyl histidine turnover rate.
Method based on prediction equations developed in ratstudies. Calculated variables include muscle protein,
nonmuscle protein and total body protein.
Three component analysis includes adipose, muscle, andmuscle free lean tissues.
11
12
13-15
16
17, 18
19
20
proportional to the total body creatine con-
tent in three species: human, dog and rabbit.Palladin and Wallenburger (23) later cx-tended this observation to rat, sheep, andguinea pig. BUrger (24), assuming that nearlyall body creatine was within muscle, and thatmuscle possessed a constant creatine content,
proposed that urinary creatinine was propor-tional to muscle mass. Burger’s calculation ofthe creatinine equivalence (kg muscle mass/g urinary creatinine) is presented in the cx-perimental studies sections below.
Four assumptions are entailed in the cx-trapolation of urinary creatinine to musclemass: 1) creatine is almost totally within skel-
etal and smooth muscle; 2) on a creatine-freediet, the total creatine pool and the averageconcentration of creatine per kg of muscleremains constant; 3) creatine is converted
nonenzymatically and irreversibly to creati-nine at a constant daily rate; and 4) creati-nine, once formed, undergoes renal excretionat a constant rate. Mathematical expressionof these assumptions is outlined in Table 2,
by on Septem
ber 23, 2009 w
ww
.ajcn.orgD
ownloaded from
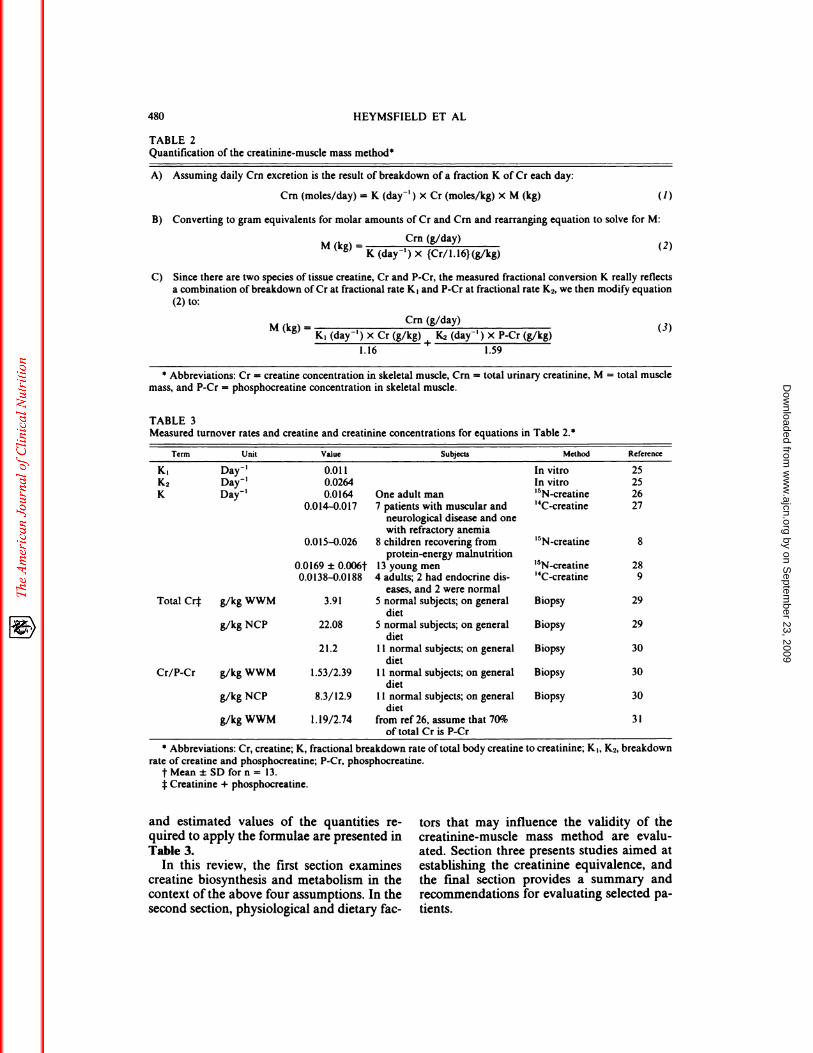
A) Assuming daily Cm excretion is the result of breakdown of a fraction K of Cr each day:
Cm (moles/day) = K (day� ) x Cr (moles/kg) x M (kg) (1)
B) Converting to gram equivalents for molar amounts of Cr and Cm and rearranging equation to solve for M:
M k - Cm (g/day) 2)( g) - K (day’ ) x {Cr/l. 16) (g/kg)
C) Since there are two species of tissue creatine, Cr and P-Cr, the measured fractional conversion K really reflects
a combination of breakdown of Cr at fractional rate and P-Cr at fractional rate K2, we then modify equation(2) to:
M (k ) - Cm (g/day) (3)g - K, (day’) X Cr (g/kg) � K� (day� ) x P-Cr (g/kg)
1.16 1.59
* Abbreviations: Cr = creatine concentration in skeletal muscle, Cm = total urinary creatinine, M = total muscle
mass, and P-Cr - phosphocreatine concentration in skeletal muscle.
480 HEYMSFIELD ET AL
TABLE 2
Quantification of the creatinine-muscle mass method*
TABLE 3Measured turnover rates and creatine and creatinine concentrations for equations in Table 2.
Term Unit Value Subjects Method Reference
K1K2K
Day’Day’Daf’
0.0110.02640.0164
0.014-0.017
0.015-0.026
0.0169 ± 0.006t
0.0138-0.0188
One adult man7 patients with muscular and
neurological disease and onewith refractory anemia
8 children recovering from
protein-energy malnutrition13 young men
4 adults; 2 had endocrine dis-
eases, and 2 were normal
In vitroIn vitro
‘5N-creatine
‘4C..��reatine
‘5N-creatine
‘5N-creatine
‘4C-creatinc
2525
26
27
8
289
Total Cr� g/kg WWM
g/kg NCP
3.91
22.08
21.2
5 normal subjects; on general
diet
5 normal subjects; on generaldiet
1 1 normal subjects; on general
diet
Biopsy
Biopsy
Biopsy
29
29
30
Cr/P-Cr g/kg WWM
g/kg NCP
g/kg WWM
1.53/2.39
8.3/12.9
1. 19/2.74
11 normal subjects; on general
diet
1 1 normal subjects; on generaldiet
from ref 26, assume that 70%of total Cr is P-Cr
Biopsy
Biopsy
30
30
31
* Abbreviations: Cr, creatine; K, fractional breakdown rate oftotal body creatine to creatinine; K,, K2, breakdown
rate of creatine and phosphocreatine; P-Cr, phosphocreatinc.
tMean±SDforn= 13.:1:Creatinine + phosphocreatine.
and estimated values of the quantities re-quired to apply the formulae are presented inTable 3.
In this review, the first section examinescreatine biosynthesis and metabolism in thecontext of the above four assumptions. In thesecond section, physiological and dietary fac-
tors that may influence the validity of thecreatinine-muscle mass method are evalu-ated. Section three presents studies aimed atestablishing the creatinine equivalence, andthe fmal section provides a summary andrecommendations for evaluating selected pa-tients.
by on Septem
ber 23, 2009 w
ww
.ajcn.orgD
ownloaded from
(1)
At�ns Glycins
?42
CNH+ H-lj-NH2
NH COOH
l�H2
�H2
112
H-C�NH�
cooH
E$�
NH2
CNH
NH
ENZYMES
1. g�cins �ns�au2. guanidinoscststsm.thyltransf.rss.
3. ctutin.kinsu
MW Al!
URINE
� �H2
,,-,-; NH - P1�OH)2 N-CH3 CREAT1NENHC CH2 �
��JLOS�E _� NHC\ � CREAT1NINE
-__=�zz�-=� L� CH2 �
CREATININE MUSCLE MA�� ME�T1-IOD 481
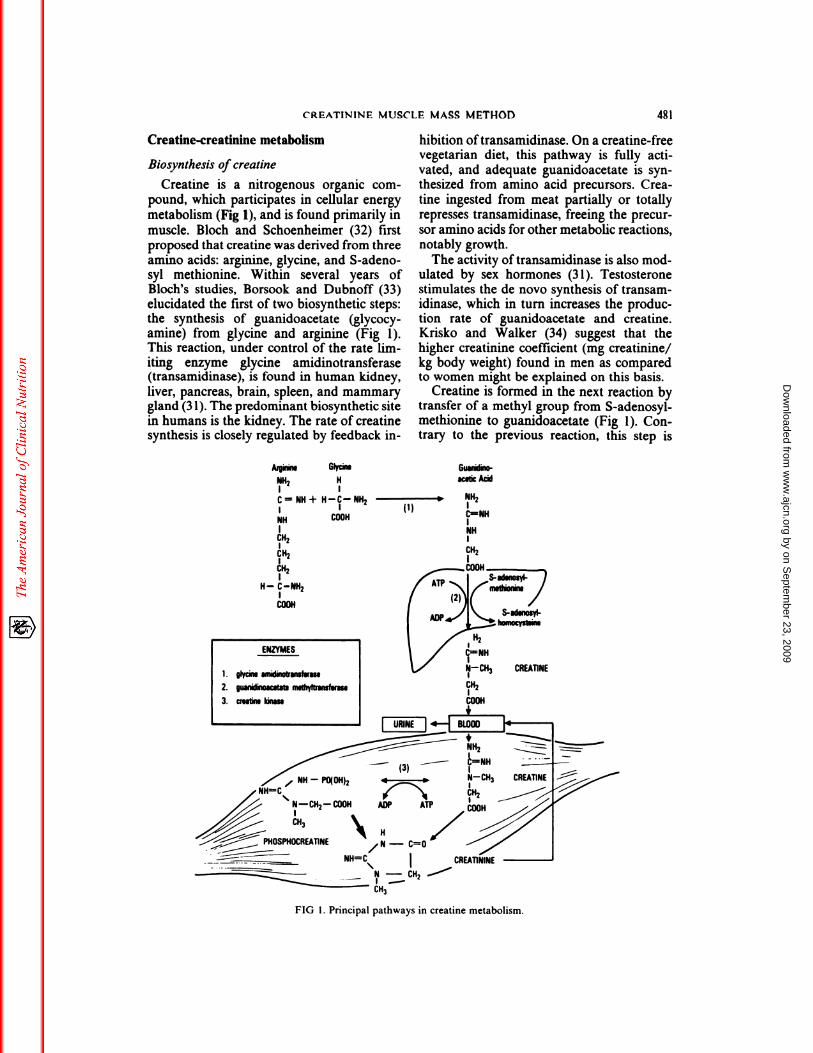
FIG 1 . Principal pathways in creatine metabolism.
Creatine-creatinine metabolism
Biosynthesis of creatine
Creatine is a nitrogenous organic com-
pound, which participates in cellular energy
metabolism (Fig 1), and is found primarily in
muscle. Bloch and Schoenheimer (32) firstproposed that creatine was derived from threeamino acids: arginine, glycine, and 5-adeno-syl methionine. Within several years ofBloch’s studies, Borsook and Dubnoff (33)elucidated the first of two biosynthetic steps:the synthesis of guanidoacetate (glycocy-amine) from glycine and arginine (Fig 1).This reaction, under control of the rate lim-iting enzyme glycine amidinotransferase(transamidinase), is found in human kidney,
liver, pancreas, brain, spleen, and mammarygland (31). The predominant biosynthetic site
in humans is the kidney. The rate of creatinesynthesis is closely regulated by feedback in-
hibition oftransamidinase. On a creatine-freevegetarian diet, this pathway is fully acti-
vated, and adequate guanidoacetate is syn-
thesized from amino acid precursors. Crea-
tine ingested from meat partially or totallyrepresses transamidinase, freeing the precur-sor amino acids for other metabolic reactions,notably growth.
The activity of transamidinase is also mod-ulated by sex hormones (3 1). Testosteronestimulates the de novo synthesis of transam-idinase, which in turn increases the produc-tion rate of guanidoacetate and creatine.Krisko and Walker (34) suggest that the
higher creatinine coefficient (mg creatinine/kg body weight) found in men as comparedto women might be explained on this basis.
Creatine is formed in the next reaction bytransfer of a methyl group from 5-adenosyl-methionine to guanidoacetate (Fig 1). Con-trary to the previous reaction, this step is
by on Septem
ber 23, 2009 w
ww
.ajcn.orgD
ownloaded from
482 HEYMSFIELD ET AL
irreversible, not rate limiting, and occurs pri-marily in liver tissue (31).
Synthesized creatine is released into thecirculation, where the next step is active up-
take against a concentration gradient by mus-dc and other tissues (3 1, 35). During the
transport process, creatine binds to a specificmembrane site which recognizes the formam-
idine moiety of the molecule. This activeuptake of creatine replaces about 2% of thetotal amount of creatine in muscle each day(3 1). The rate of creatine uptake is influenced
by at least three factors; the process is re-tarded by cooling and anaerobiosis and en-hanced by insulin (35).
About 98% of the total body creatine pool
(120 g in a 70 kg adult man) (36) is withinmuscle. This creatine pool is slowly saturable(37) and has a relatively slow daily turnoverrate of about 1.5 to 2% (37). Although the
creatine concentration per kg ofmuscle variesfrom muscle to muscle, the average concen-
tration is 3 to 5 g/kg of wet fat-free tissue(Table 3). The functions of muscle creatineare enumerated in Table 4.
Other tissues (brain, kidney, and liver) andfluids (blood and urine) contain measurableamounts ofcreatine. Because creatine in thesetissues represent only a small percentage ofthe total body creatine pool (<2%), their over-all contribution to creatine turnover is small.
Creatine uptake by muscle and other tis-sues is relatively complete, and blood levelsrarely exceed 0.3 mg/dl (25). Urinary lossesof creatine are usually neglible, unless bloodlevels become excessively high or renal tu-bular reabsorption is impaired.
Dehydration of creatine to creatinine
Early workers searched for the enzyme“creatase” or “creatinase” that converted
creatine to creatinine. Hahn and Meyer (38)
TABLE 4Functions of muscle creatine (3)
1) High energy intermediate in excitation-contraction
coupling:
Phosphocreatine + ADP 12 creatinc + ATP
Enzyme 1 is creatine phosphokinase, and enzyme 2
is creatine phosphorylase.
2) Modulate glycolysis.
3) Increase intracellular flux of potassium and phos-
phorous.4) Acts as a cofactor in muscle growth.
subsequently showed that creatine was con-verted to creatinine in liver and kidney cx-
tracts at the same rate as in a buffered phos-phate solution of the same pH. These inves-
tigators concluded that the creatine to creat-mine conversion was brought about purelyon a physiochemical basis. This irreversible
reaction is now firmly established. Withinmuscle, creatine exists in two forms: creatineand phosphocreatine (39). Creatine dehy-drates to creatinine at a rate of 1. 1% per day,while phosphocreatine conversion is 2.64%
per day (Table 3). Because urinary creatinineis derived from these two sources, the in vivomeasurement of creatine turnover rate pro-vides a value between 1. 1 and 2.64%.
Among healthy male subjects, a rather con-stant creatine turnover rate of 1.6 to 1.7% perday was obtained (Table 3) (26, 28, 40). How-
ever, the observed range of values between1.4 and 2.6% per day in children recoveringfrom protein-energy malnutrition (8) andadult patients (9, 27) (Table 3) would limitthe accuracy in predicting muscle mass from24-h urinary creatinine in these subjects. Be-
cause the creatine pool is large, small changesin turnover rate result in large differences in
daily urinary output of creatinine. For cx-ample, using the two turnover rates of 1.5 and2.6% in equation 2, and assigning a hypo-thetical creatinine excretion and muscle crea-tine concentration of 1.6 g/day and 3.9 g/kg,respectively, calculated muscle mass is 3 1.7 gand 18.3 kg, or a difference of42%. Assumingthat intracellular pH and temperature remainconstant, one explanation for differences increatine turnover rate between subjects is thenatural differences in the creatine to phos-phocreatine ratio.
Excretion of creatinine in the urine
Once formed, creatinine diffuses from thecell and ultimately appears in the urine afterglomerular filtration, and to a small extent,
tubular secretion (41). The effect of renalinsufficiency on creatinine excretion is dis-cussed in the next section.
Physiological and pathological conditionsthat modulate output of creatinine
Folin’s “law” (42) states that on a creatine-free diet, the output of creatinine is constantfrom day to day for each individual. Somevariability is, however, recognized in the
by on Septem
ber 23, 2009 w
ww
.ajcn.orgD
ownloaded from
derstood.
URINARYCREATININE
(mg/hr)70
60
50
40
30
20
10
00 8 16 0 8 16 0 � 16 24
CREATININE MUSCLE MASS METHOD 483
healthy subject; more importantly, some
pathoIo8�cal states can alter normal creati-
nine output.
Normal day to day variability
Normally, urinary creatinine excretion var-
ies daily, the causes of which are largelyunknown. The constancy of 24-h creatinine
excretion reported in the early Folin studies,and later reinforced by Rose (43), has been
repeatedly challenged through the years.
Careful studies in reliable subjects haveshown a daily variation from 4 to 8% in
creatinine excretion, which cannot be cx-plained by minor variations in physical activ-ity and diet (44, 45).
Exercise
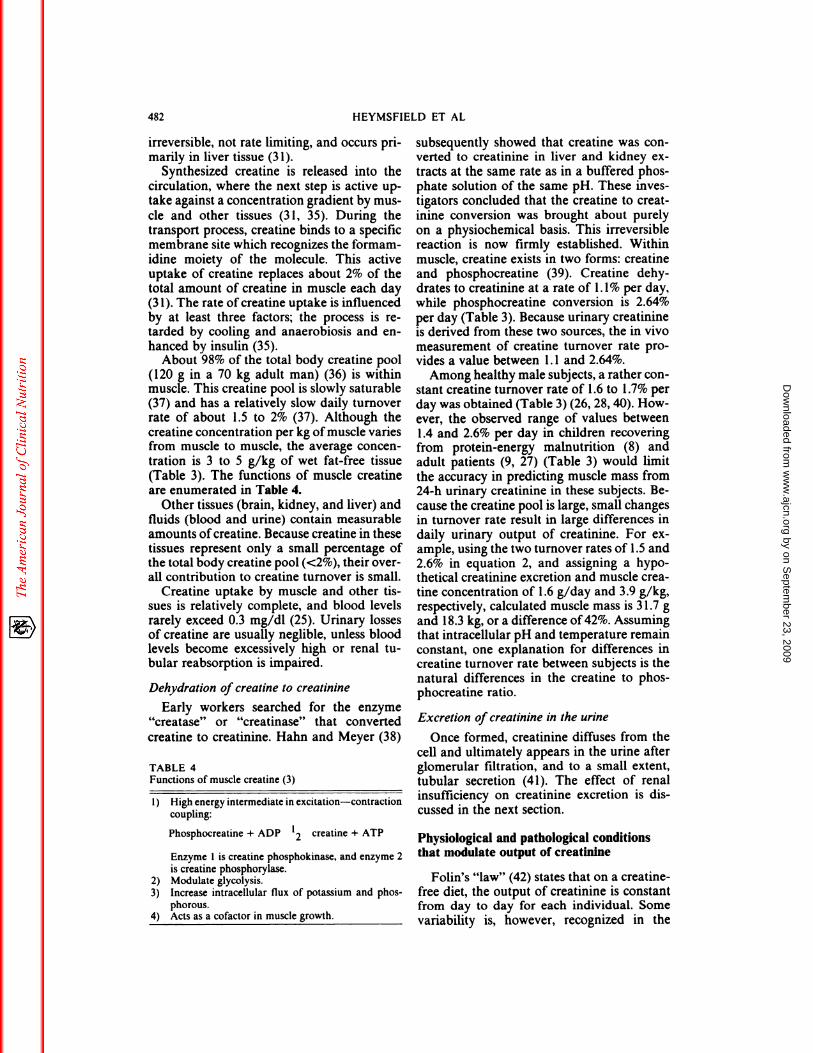
Extremely strenuous exercise can increaseurinary output of creatinine by 5 to 10% (46,47). Figure 2 demonstrates this effect in nor-mal subjects marching for 3 h at two different
speeds. The increase in daily creatinine out-
put was about 10%. The mechanism(s) ofthese exercise-induced changes in urinarycreatinine output are unknown.
Emotional stress
Creatinine excretion has been studied in awide variety of stressful conditions and psy-
!
.� �
� �
� a, � Q.w� �:�::�+9.4% i+1O.4%
HOURS
�- BASELINE ‘�4 EXERCISE -04- EXERCISE -�
3 Hour March 3 HourMarch2.9-3 MPH 3.1-4 MPH
FIG 2. Exercise-induced increase in creatininc excre-
tion. Figure 2 was prepared from the data presented inReference 47.
chiatric illnesses (48, 49). Scrimshaw et al (48)
con�luI#{232}A thid th� ��h!1Dy � �1 t�absolute amount) in creatinine output in-creases during stress, but the underlyingcause(s) of this phenomenon are poorly un-
Diet
Urinary creatinine excretion is influencedto some extent by three dietary constituents:
protein (50), creatine, and creatinine.Dietary protein is the main source of the
amino acid precursors of creatine. The activ-
ity of the first enzyme in creatine biosyn-thesis, transamidinase, is influenced by die-
tary protein intake (50, 5 1). For example,Van Pilsum (5 1) fed rats a protein-free dietfor 12 days, and found an 85% reduction intransamidinase activity. The level of proteinintake per se appears to have a small effecton urinary creatinine excretion (50, 52), but
few studies have rigorously examined thisrelation independently from other dietary
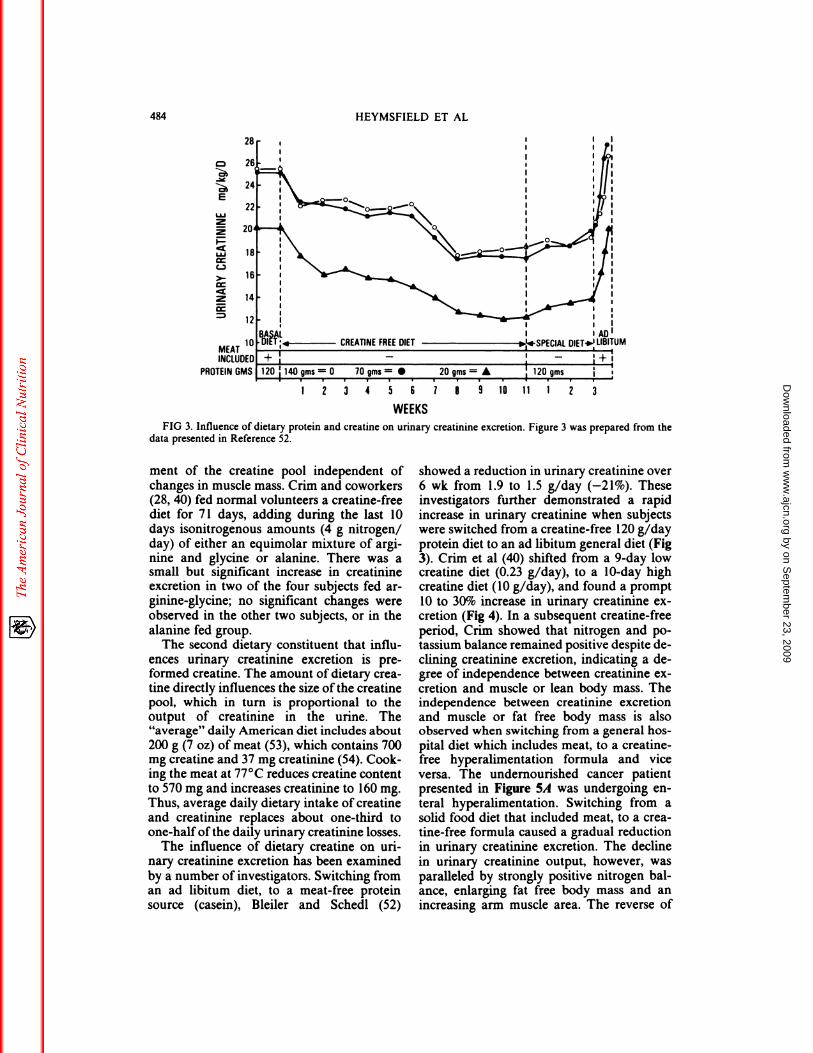
factors, notably creatine and creatinine.Bleiler and Schedl (52) studied six men who
ingested a natural food, 120-g protein diet(Fig 3). The meal contained the usual amountof dietary creatine. The six men were thendivided into three groups, and switched to acreatine-free diet; the two subjects in eachgroup received 140, 70, and 20 g of protein,respectively. Over 8 to 1 1 wk, urinary creati-nine excretion fell in each of the respective
groups by 26, 32, and 40%. The men werethen switched to another creatine-free 120-gprotein diet, and the creatinine excretion in-
creased over 3 wk in the three groups by 7.7,10, and 13%, respectively. The large reductionin creatinine excretion from the basal dietoccurred because the men were ingesting a
meat-free diet (discussed below), although
the total protein intake appears to have hadsome effect. An important consideration isthat the men on the 20-g protein diet wereprobably in negative nitrogen balance, andsome loss in muscle mass may have contrib-
uted to the larger decrease in urinary creati-
nine seen in this group.Feeding the two dietary amino acid pre-
cursors of creatine, arginine, and glycine, en-hances transamidinase activity and increasesurinary excretion of guanidoacetate. The ac-
tivation of transamidinase results in a higherrate ofcreatine production, as well as enlarge-
by on Septem
ber 23, 2009 w
ww
.ajcn.orgD
ownloaded from
28
CREATINE FREE DIET
120 140 qms = 0 10 gms 20 qms =
#{149}12 3 4 5 6 7 8 9 10 123
484 HEYMSFIELD ET AL
E
w2
2
w
C-,
>-
2
MEATINCLUC
PROTEIN GMS
WEEKSFIG 3. Influence of dietary protein and creatine on urinary creatinine excretion. Figure 3 was prepared from the
data presented in Reference 52.
ment of the creatine pool independent of
changes in muscle mass. Crim and coworkers(28, 40) fed normal volunteers a creatine-free
diet for 71 days, adding during the last 10days isonitrogenous amounts (4 g nitrogen!
day) of either an equimolar mixture of argi-nine and glycine or alanine. There was asmall but significant increase in creatinineexcretion in two of the four subjects fed ar-ginine-glycine; no significant changes wereobserved in the other two subjects, or in the
alanine fed group.The second dietary constituent that influ-
ences urinary creatinine excretion is pre-formed creatine. The amount of dietary crea-tine directly influences the size ofthe creatinepool, which in turn is proportional to theoutput of creatinine in the urine. The“average” daily American diet includes about200 g (7 oz) of meat (53), which contains 700mg creatine and 37 mg creatinine (54). Cook-ing the meat at 77#{176}Creduces creatine content
to 570 mg and increases creatinine to 160 mg.Thus, average daily dietary intake of creatine
and creatinine replaces about one-third toone-half of the daily urinary creatinine losses.
The influence of dietary creatine on uri-nary creatinine excretion has been examined
by a number of investigators. Switching froman ad libitum diet, to a meat-free proteinsource (casein), Bleiler and Schedl (52)
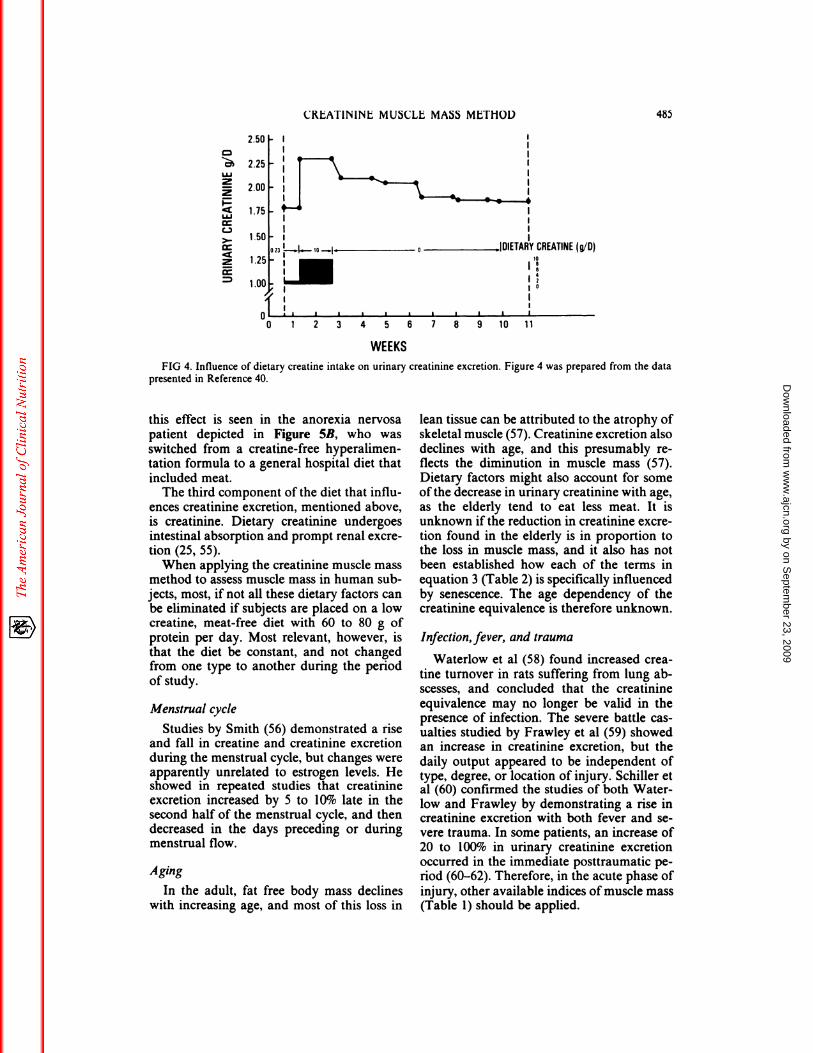
showed a reduction in urinary creatinine over6 wk from 1.9 to 1.5 g/day (-21%). Theseinvestigators further demonstrated a rapidincrease in urinary creatinine when subjectswere switched from a creatine-free 120 g!dayprotein diet to an ad libitum general diet (Fig3). Crim et al (40) shifted from a 9-day lowcreatine diet (0.23 g!day), to a 10-day highcreatine diet (10 g!day), and found a prompt10 to 30% increase in urinary creatmine cx-cretion (Fig 4). In a subsequent creatine-free
period, Crim showed that nitrogen and po-tassium balance remained positive despite de-dining creatinine excretion, indicating a de-gree of independence between creatmine cx-
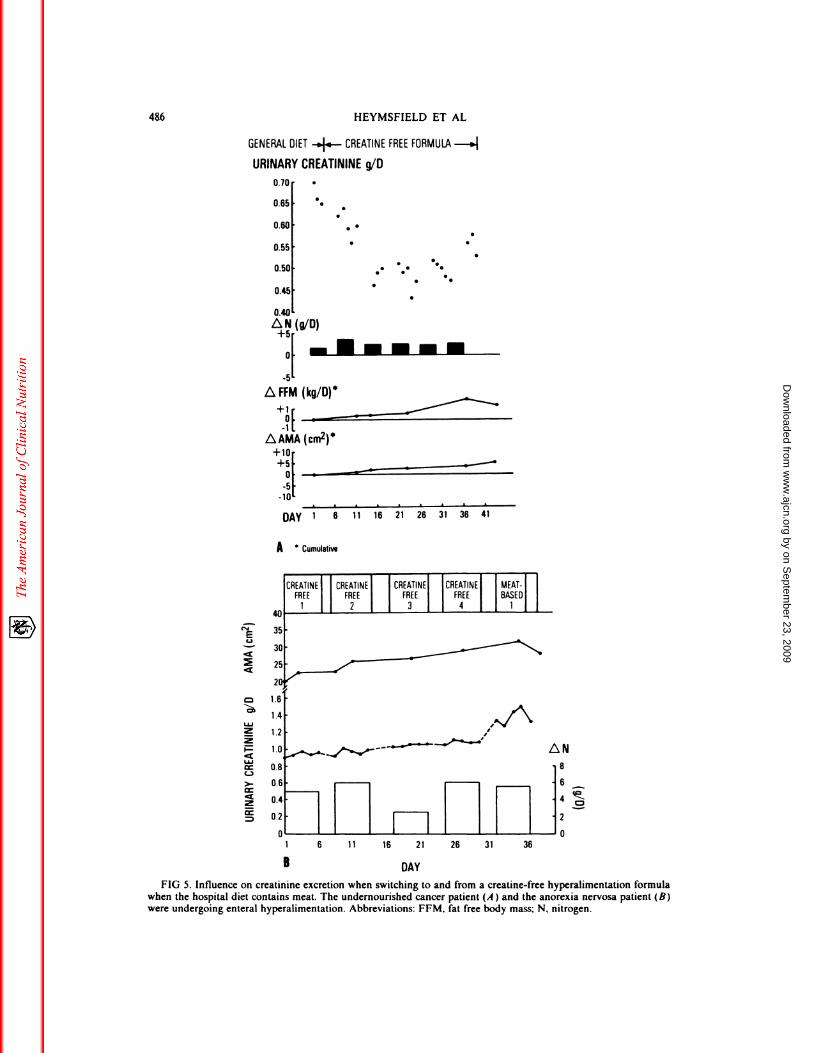
cretion and muscle or lean body mass. Theindependence between creatinine excretionand muscle or fat free body mass is alsoobserved when switching from a general hos-pital diet which includes meat, to a creatine-free hyperalimentation formula and viceversa. The undernourished cancer patientpresented in Figure 5A was undergoing en-teral hyperalimentation. Switching from asolid food diet that included meat, to a crea-tine-free formula caused a gradual reductionin urinary creatimne excretion. The declinein urinary creatinine output, however, was
paralleled by strongly positive nitrogen bat-ance, enlarging fat free body mass and anincreasing arm muscle area. The reverse of
by on Septem
ber 23, 2009 w
ww
.ajcn.orgD
ownloaded from
2.50
2.25
2.00
1.75
1.50
1.25(g/D)
1018
I 2
10
.1_
0 1 2 3 4 5 6 7 8 9 10 11
WEEKS
FIG 4. Influence of dietary creatine intake on urinary creatininc excretion. Figure 4 was prepared from the datapresented in Reference 40.
CRLATIN1NL MUSCLE MASS MLT1IOL) 485
LU22
LU
C-,>-
2
this effect is seen in the anorexia nervosapatient depicted in Figure 5B, who wasswitched from a creatine-free hyperalimen-tation formula to a general hospital diet that
included meat.The third component of the diet that influ-
ences creatinine excretion, mentioned above,
is creatinine. Dietary creatinine undergoesintestinal absorption and prompt renal excre-tion (25, 55).
When applying the creatinine muscle massmethod to assess muscle mass in human sub-jects, most, if not all these dietary factors canbe eliminated if subjects are placed on a lowcreatine, meat-free diet with 60 to 80 g ofprotein per day. Most relevant, however, is
that the diet be constant, and not changedfrom one type to another during the periodof study.
Menstrual cycle
Studies by Smith (56) demonstrated a riseand fall in creatine and creatinine excretionduring the menstrual cycle, but changes wereapparently unrelated to estrogen levels. Heshowed in repeated studies that creatinineexcretion increased by 5 to 10% late in thesecond half of the menstrual cycle, and thendecreased in the days preceding or duringmenstrual flow.
Aging
In the adult, fat free body mass declines
with increasing age, and most of this loss in
lean tissue can be attributed to the atrophy ofskeletal muscle (57). Creatinine excretion alsodeclines with age, and this presumably re-flects the diminution in muscle mass (57).Dietary factors might also account for someofthe decrease in urinary creatinine with age,as the elderly tend to eat less meat. It isunknown if the reduction in creatinine excre-tion found in the elderly is in proportion tothe loss in muscle mass, and it also has not
been established how each of the terms inequation 3 (Table 2) is specifically influencedby senescence. The age dependency of thecreatinine equivalence is therefore unknown.
Infection,fever, and trauma
Waterlow et al (58) found increased crea-
tine turnover in rats suffering from lung ab-scesses, and concluded that the creatinine
equivalence may no longer be valid in thepresence of infection. The severe battle cas-ualties studied by Frawley et at (59) showedan increase in creatinine excretion, but the
daily output appeared to be independent oftype, degree, or location of injury. Schiller etal (60) confirmed the studies of both Water-low and Frawley by demonstrating a rise increatinine excretion with both fever and Se-vere trauma. In some patients, an increase of
20 to 100% in urinary creatinine excretionoccurred in the immediate posttraumatic pe-riod (60-62). Therefore, in the acute phase of
injury, other available indices ofmuscle mass(Table 1) should be applied.
by on Septem
ber 23, 2009 w
ww
.ajcn.orgD
ownloaded from
1 6 11 16 21 26 31 36
B
486 HEYMSFIELD El AL
GENERAL DIET -4.-- CREATINE FREE FORMULA -#{248}.�
URINARY CREATININE g/O
r�iEL2
LU22
LU
C-)
>-
2
0.70
0.65
0.60
0.55
0.50
0.45
0.40
L�N(g/D)
+5’0F-s----
L�FFM (kg/D)
1(-1 1
L�AMA (cm�)*+10+51 -�
#{176}I‘- -�-#{149}---�---- S
-SI:-10
DAY 1 6 11 16 21
A Cumulative
26 31 36 41
DAY
FIG 5. Influence on creatininc excretion when switching to and from a creatine-free hyperalimcntation formulawhen the hospital diet contains meat. The undernourished cancer patient (A ) and the anorexia nervosa patient (B)were undergoing enteral hyperalimentation. Abbreviations: FFM, fat free body mass; N, nitrogen.
by on Septem
ber 23, 2009 w
ww
.ajcn.orgD
ownloaded from
CREATININE MUSCLE MASS METHOD 487
Renal disease
As glomerular filtration rate falls in chronicrenal failure, there is a decrease in the excre-
tion of creatinine. Goldman (63) noted thatthe reduced output of creatinine is especiallyapparent when serum creatinine exceeds 6
mg/dl. Noting that muscle mass was not sig-nificantly decreased, Goldman suggested thatthe low output was due either to reducedcreatinine production or an alternate excre-
tory pathway. Jones and Burnett (64) inves-
ligated the “creatinine deficit” in patientswith renal insufficiency, and found that 15.9
to 65.7% ofcreatinine formed in their subjectswas metabolized or excreted via extrarenal
routes. The studies of Mitch and coworkers(65, 66) also indicate metabolism rather than
excretion of creatinine. These workers iden-tified two pathways of creatimne catabolism;
a recycling of creatinine to creatine, and in-testinal degradation of creatinine to productsother than creatine. In advanced renal dis-
ease, therefore, the creatinine equivalencemethod should be avoided.
Section summary
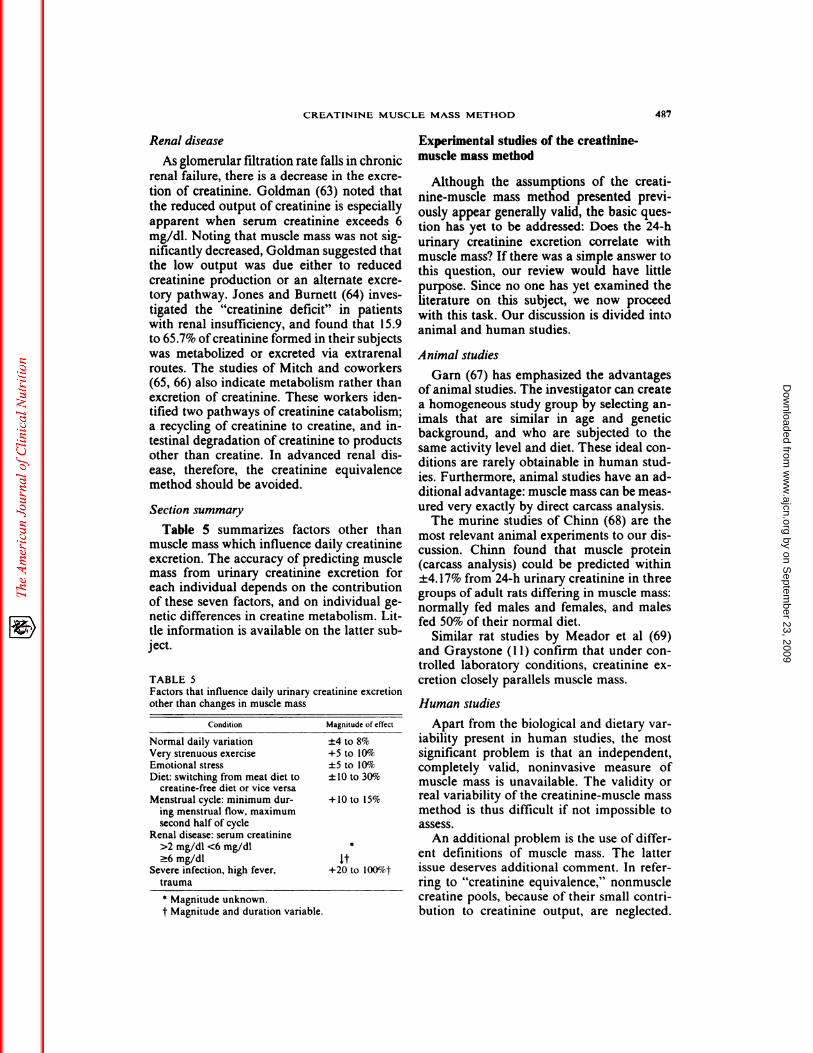
Table 5 summarizes factors other thanmuscle mass which influence daily creatinineexcretion. The accuracy of predicting musclemass from urinary creatinine excretion foreach individual depends on the contributionof these seven factors, and on individual ge-netic differences in creatine metabolism. Lit-tle information is available on the latter sub-ject.
TABLE 5
Factors that influence daily urinary crcatinine excretion
other than changes in muscle mass
Condition Magnitude of effect
Normal daily variation ±4 to 8%
Very strenuous exercise +5 to 10%Emotional stress ±5 to 10%Diet: switching from meat diet to ± 10 to 30%
creatine-free diet or vice versaMenstrual cycle: minimum dur- + 10 to 15%
ing menstrual flow, maximum
second half of cycleRenal disease: serum creatinine
>2 mg/dl <6 mg/dl S
�6 mg/dl �tSevere infection, high fever, +20 to l00%t
trauma
S Magnitude unknown.
t Magnitude and duration variable.
Experimental studies of the creatinine-muscle mass method
Although the assumptions of the creati-
nine-muscle mass method presented previ-ously appear generally valid, the basic ques-tion has yet to be addressed: Does the 24-hurinary creatinine excretion correlate withmuscle mass? If there was a simple answer tothis question, our review would have little
purpose. Since no one has yet examined theliterature on this subject, we now proceedwith this task. Our discussion is divided intoanimal and human studies.
Animal studies
Garn (67) has emphasized the advantagesof animal studies. The investigator can createa homogeneous study group by selecting an-imals that are similar in age and geneticbackground, and who are subjected to the
same activity level and diet. These ideal con-ditions are rarely obtainable in human stud-ies. Furthermore, animal studies have an ad-
ditional advantage: muscle mass can be meas-ured very exactly by direct carcass analysis.
The murine studies of Chinn (68) are the
most relevant animal experiments to our dis-cussion. Chinn found that muscle protein(carcass analysis) could be predicted within±4. 17% from 24-h urinary creatinine in threegroups of adult rats differing in muscle mass:normally fed males and females, and malesfed 50% of their normal diet.
Similar rat studies by Meador et al (69)and Graystone (1 1) confirm that under con-trotted laboratory conditions, creatinine cx-cretion closely parallels muscle mass.
Human studies
Apart from the biological and dietary var-iability present in human studies, the mostsignificant problem is that an independent,completely valid, noninvasive measure ofmuscle mass is unavailable. The validity orreal variability of the creatinine-muscle massmethod is thus difficult if not impossible toassess.
An additional problem is the use of differ-
ent definitions of muscle mass. The latterissue deserves additional comment. In refer-ring to “creatinine equivalence,” nonmusclecreatine pools, because of their small contri-bution to creatinine output, are neglected.
by on Septem
ber 23, 2009 w
ww
.ajcn.orgD
ownloaded from
488 HEYMSFIELD ET AL
For the most part, so are nonskeletal musclesources of creatmine, such as heart, uterus,aorta, and other tissues with smooth muscle.Generally, the creatine concentration in thesemuscles is less than striated skeletal muscle(25). In nearly all studies, the creatinine out-put is determined from values appropriate forskeletal muscle, thus introducing a probablesmall bias due to creatinine which originatesoutside skeletal muscle.
The units used to express the creatinineequivalence also differ among authors. Skel-etal muscle is composed of intra- and extra-cellular fluids and solids. Some, but not allworkers refer to fat-free wet muscle, which is2 to 5% less than whole wet muscle mass(WWM). Creatinine reflects the intracellularspace of muscle tissue, so in addition someinvestigators express results per kg of intra-
cellular or non-collagenous proteins (NCP).The creatinine equivalence is therefore pre-sented per kg WWM, per kg fat-free wetmuscle, and per kg NCP.
The fmal difference between the reviewedstudies was diet. The feeding programs weredescribed as creatine-free, low creatine, orgeneral diets.
Hunter (36), in his classic monograph oncreatine and creatinine, relates Burger’s (24)
calculation of the creatinine equivalence: “Anormal man of 63. 1 kg was assumed, on thebasis ofVierordt’s (70) figures, to possess 25.4kg of muscle. The creatine content of this
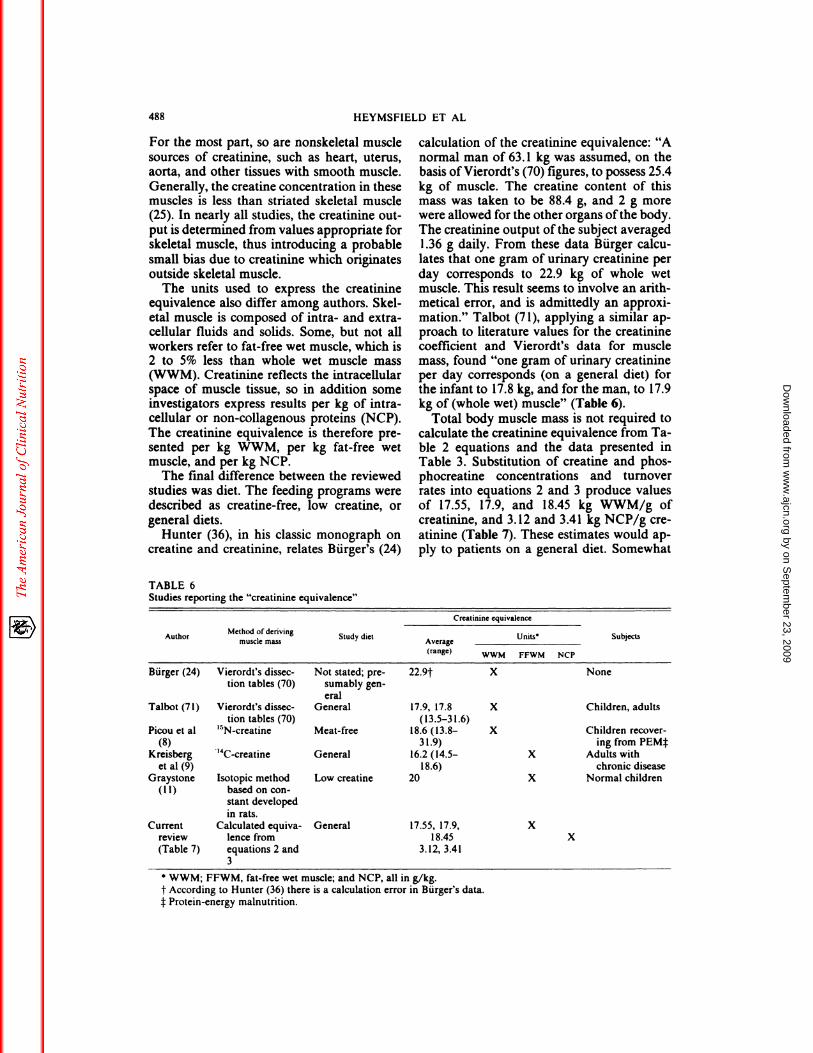
mass was taken to be 88.4 g, and 2 g morewere allowed for the other organs ofthe body.The creatinine output ofthe subject averagedI .36 g daily. From these data Burger calcu-lates that one gram of urinary creatinine perday corresponds to 22.9 kg of whole wetmuscle. This result seems to involve an arith-metical error, and is admittedly an approxi-mation.” Talbot (71), applying a similar ap-proach to literature values for the creatininecoefficient and Vierordt’s data for musclemass, found “one gram of urinary creatinineper day corresponds (on a general diet) forthe infant to 17.8 kg, and for the man, to 17.9kg of (whole wet) muscle” (Table 6).
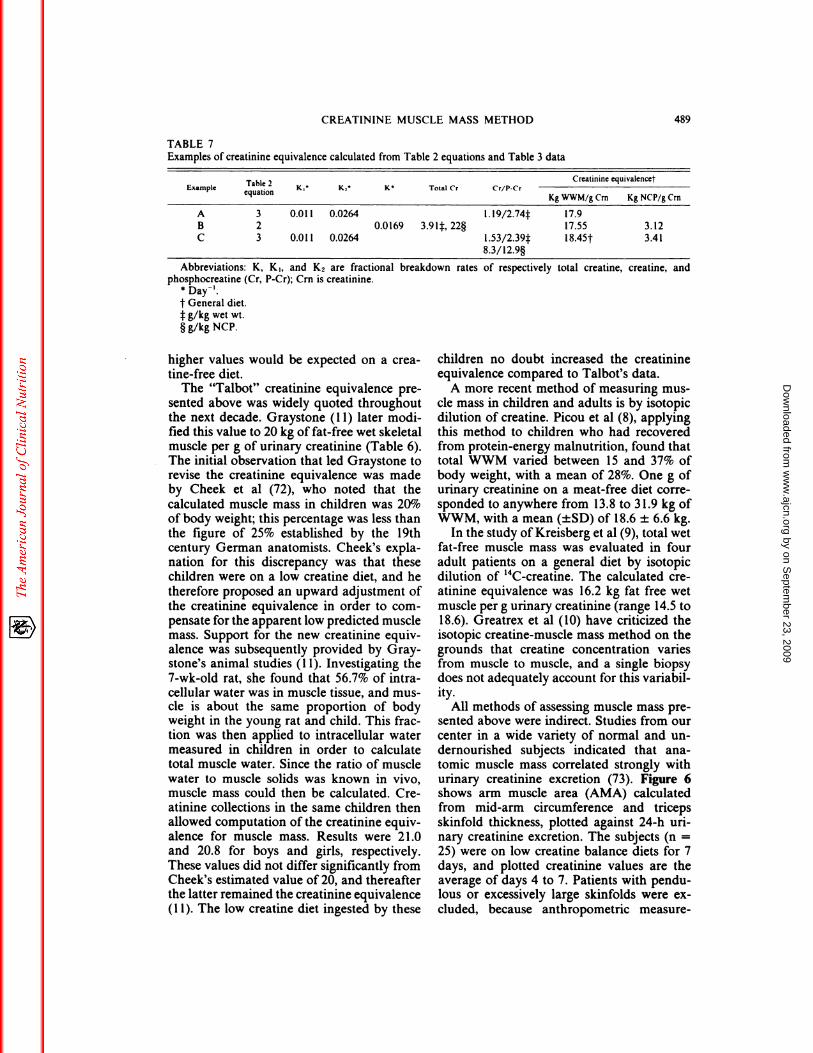
Total body muscle mass is not required tocalculate the creatinine equivalence from Ta-ble 2 equations and the data presented inTable 3. Substitution of creatine and phos-phocreatine concentrations and turnoverrates into equations 2 and 3 produce valuesof 17.55, 17.9, and 18.45 kg WWM!g ofcreatinine, and 3.12 and 3.41 kg NCP!g crc-atinine (Table 7). These estimates would ap-ply to patients on a general diet. Somewhat
TABLE 6Studies reporting the “creatinine equivalence”
AuthorMethod ofdertvong
muscle massStudy diet
Creatin inc equivalence
SubjectsAverage
Units’
(range)WWM FFWM NCP
Burger (24) Vierordt’s dissec-
tion tables (70)
Not stated; pre-
sumably gen-
eral
22.9t X None
Talbot (71)
Picou et a!
Vierordt’s dissec-
tion tables (70)
‘5Ncrcatine
General
Meat-free
17.9, 17.8
(13.5-3 1.6)18.6 (13.8-
X
X
Children, adults
Children recover-
(8)
Kreisberg ‘4C-creatine General
31.9)
16.2 (14.5- X
ing from PEMf
Adults with
et al (9) 18.6) chronic diseaseGraystone Isotopic method Low creatine 20 X Normal children
(11) basedoncon-stant developed
in rats.
Current Calculated equiva- General 17.55, 17.9, X
review lence from 18.45 X
(Table 7) equations 2 and
3
3.12, 3.41
S WWM; FFWM, fat-free wet muscle; and NCP, all in g/kg.
t According to Hunter (36) there is a calculation error in Burger’s data.1:Protein-energy malnutrition.
by on Septem
ber 23, 2009 w
ww
.ajcn.orgD
ownloaded from
CREATININE MUSCLE MASS METHOD 489
TABLE 7Examples of creatinine equivalence calculated from Table 2 equations and Table 3 data
ExampleTable 2
equationK’ K’ Total Cr Cr/P�Cr
Creatinine equivalencet
Kg WWM/g Cm Kg NCP/g Cm
A 3 0.011 0.0264 1.l9/2.74f 17.9
B 2 0.0169 3.91�,22� 17.55 3.12
C 3 0.011 0.0264 1.53/2.39�8.3/12.9�
18.45t 3.41
Abbreviations: K, , and K2 are fractional breakdown rates of respectively total creatinc, creatine, and
phosphocreatinc (Cr, P-Cr); Cm is creatininc.
S Day�.
t General diet.:1:g/kg wet wt.
§g/kgNCP.
higher values would be expected on a crea-tine-free diet.
The “Talbot” creatimne equivalence pre-sented above was widely quoted throughoutthe next decade. Graystone (1 1) later modi-fled this value to 20 kg of fat-free wet skeletalmuscle per g of urinary creatininc (Table 6).The initial observation that led Graystone to
revise the creatinine equivalence was madeby Cheek et al (72), who noted that the
calculated muscle mass in children was 20%of body weight; this percentage was less thanthe figure of 25% established by the 19thcentury German anatomists. Cheek’s expla-nation for this discrepancy was that thesechildren were on a low creatine diet, and he
therefore proposed an upward adjustment ofthe creatinine equivalence in order to com-pensate for the apparent low predicted musclemass. Support for the new creatinine equiv-alence was subsequently provided by Gray-stone’s animal studies (1 1). Investigating the7-wk-old rat, she found that 56.7% of intra-cellular water was in muscle tissue, and mus-dc is about the same proportion of bodyweight in the young rat and child. This frac-tion was then applied to intracellular watermeasured in children in order to calculatetotal muscle water. Since the ratio of musclewater to muscle solids was known in vivo,muscle mass could then be calculated. Crc-atinine collections in the same children thenallowed computation of the creatinine equiv-alence for muscle mass. Results were 21.0and 20.8 for boys and girls, respectively.These values did not differ significantly fromCheek’s estimated value of 20, and thereafterthe latter remained the creatinine equivalence(1 1). The low creatine diet ingested by these
children no doubt increased the creatinine
equivalence compared to Talbot’s data.A more recent method of measuring mus-
dc mass in children and adults is by isotopicdilution of creatine. Picou et al (8), applyingthis method to children who had recoveredfrom protein-energy malnutrition, found thattotal WWM varied between 15 and 37% ofbody weight, with a mean of 28%. One g ofurinary creatinine on a meat-free diet corre-sponded to anywhere from 13.8 to 3 1.9 kg ofWWM, with a mean (±SD) of 18.6 ± 6.6 kg.
In the study of Kreisberg et al (9), total wetfat-free muscle mass was evaluated in fouradult patients on a general diet by isotopicdilution of ‘4C-creatine. The calculated crc-
atinine equivalence was 16.2 kg fat free wetmuscle per g urinary creatinine (range 14.5 to1 8.6). Greatrex et at ( 10) have criticized theisotopic creatine-muscle mass method on thegrounds that creatine concentration variesfrom muscle to muscle, and a single biopsydoes not adequately account for this variabil-ity.
All methods of assessing muscle mass pre-sented above were indirect. Studies from our
center in a wide variety of normal and un-dernourished subjects indicated that ana-tomic muscle mass correlated strongly with
urinary creatinine excretion (73). Figure 6shows arm muscle area (AMA) calculatedfrom mid-arm circumference and tricepsskinfold thickness, plotted against 24-h uri-nary creatinine excretion. The subjects (n =
25) were on low creatine balance diets for 7
days, and plotted creatinine values are theaverage of days 4 to 7. Patients with pendu-bus or excessively large skinfolds were cx-
cluded, because anthropometric measure-
by on Septem
ber 23, 2009 w
ww
.ajcn.orgD
ownloaded from
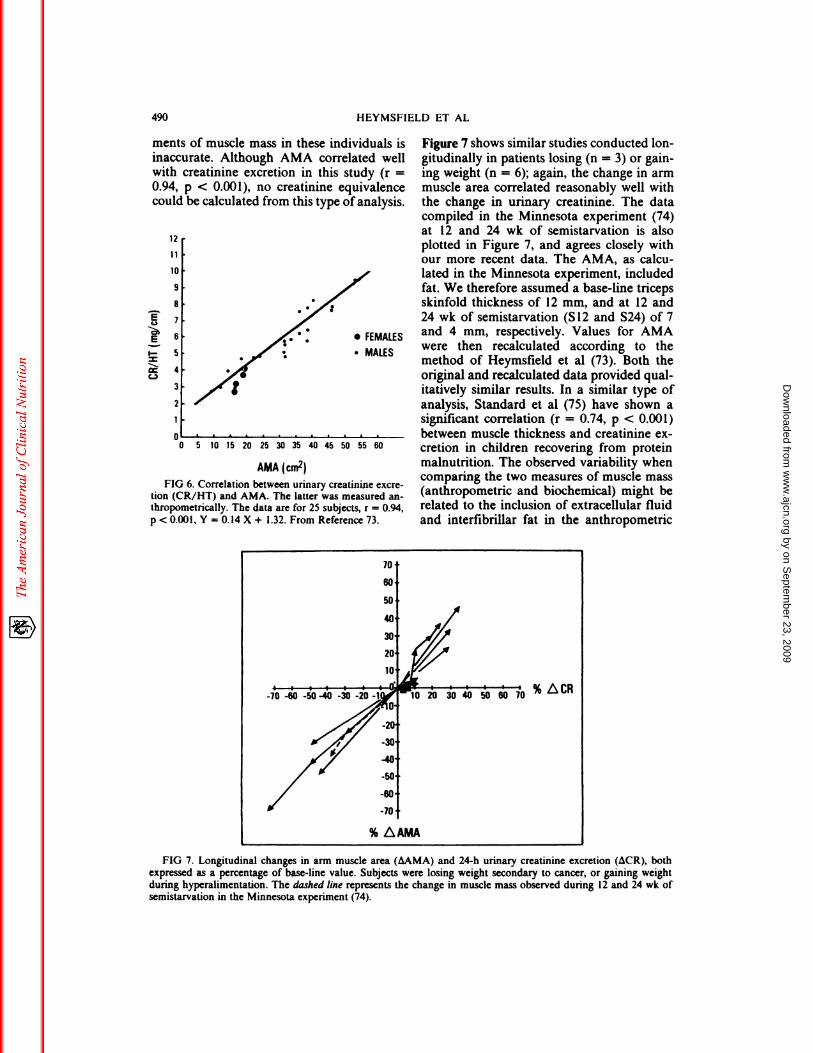
ments of muscle mass in these individuals is
inaccurate. Although AMA correlated wellwith creatinine excretion in this study (r =
0.94, p < 0.001), no creatinine equivalence
could be calculated from this type of analysis.
E
6.)
E
I-
C-,
7
6
5
4
3
2
_O 5 10 15 20 25 30 35 40 45 50 55 60
AMA (cm�)
FIG 6. Correlation between urinary creatinme cxcre-tion (CR/HI) and AMA. The latter was measured an-
thropometrically. The data are for 25 subjects, r = 0.94,
p < 0.001, Y = 0.14 X + 1.32. From Reference 73.
% L�CR
% t�IAMA
490 HEYMSFIELD El AL
12
11
10
9
8
Figure 7 shows similar studies conducted lon-gitudinally in patients losing (n = 3) or gain-
ing weight (n = 6); again, the change in armmuscle area correlated reasonably well withthe change in urinary creatinine. The datacompiled in the Minnesota experiment (74)at 12 and 24 wk of semistarvation is alsoplotted in Figure 7, and agrees closely withour more recent data. The AMA, as calcu-lated in the Minnesota experiment, includedfat. We therefore assumed a base-line tricepsskinfold thickness of 12 mm, and at 12 and24 wk of semistarvation (S 12 and 524) of 7
. FEMALES and 4 mm, respectively. Values for AMA
. MALES were then recalculated according to themethod of Heymsfleld et at (73). Both the
original and recalculated data provided qua!-itatively similar results. In a similar type of
analysis, Standard et a! (75) have shown asignificant correlation (r = 0.74, p < 0.001)
between muscle thickness and creatinine cx-cretion in children recovering from proteinmalnutrition. The observed variability whencomparing the two measures of muscle mass(anthropometric and biochemical) might berelated to the inclusion of extracellular fluid
and interfibrillar fat in the anthropometric
FIG 7. Longitudinal changes in arm muscle area (i�.AMA) and 24-h urinary creatinine excretion (i�CR), bothexpressed as a percentage of base-line value. Subjects were losing weight secondary to cancer, or gaining weightduring hyperaliinentation. The dashed line represents the change in muscle mass observed during 12 and 24 wk of
semistarvation in the Minnesota experiment (74).
by on Septem
ber 23, 2009 w
ww
.ajcn.orgD
ownloaded from
CREATININE MUSCLE MASS METHOD 491
method, the inaccuracies inherent in the an-
thropometric method (6, 73), and between
subject differences in diet and creatinc turn-
over rate.
From these human investigations it is con-
cluded that: 1 ) studies differed in diet, healthstatus of study subject, definition, andmethod of measuring muscle mass, 2) thecreatinine equivalence in humans is not de-
finitvely established, 3) even ifsuch an equiv-alence can be agreed upon, the SD aroundthis average tentatively appears quite large,
and 4) reliable estimates of the creatmineequivalence and associated variability will be
forthcoming only when a definitive methodof measuring muscle mass in vivo is available
to clinical investigators. Such methods arenow becoming available, but at the present
are limited to only a few centers (2, 16).Unlike muscle, lean body mass (LBM) can
be measured accurately in the clinical setting;because muscle is roughly 30 to 50% of LBM,many workers have focused on the correla-tion of creatinine with accurately and easilymeasured LBM (76-79).
When LBM is correlated with creatininc,there is almost universal agreement that thesetwo indices are closely related. Some varia-tion in the predictive value of this relation isfound by some authors, but the principaldifference appears to be the precision withwhich urine samples were collected, and thenumber of urines analyzed.
Why should a precise relation between crc-atinine and LBM be found in the abovementioned human studies, while so muchvariability is found in the studies relating
muscle mass directly to creatinine? Two pos-sible explanations are offered. The first is thatcreatinine excretion may be a more accuratereflection of the total creatine pool (muscleplus other soft lean tissues), rather than themuscle creatine pool. The small contribution
of nonskeletal muscle creatine to urinary crc-atinine has been discussed above. A second,and more likely explanation, is that LBM canbe measured more accurately and reproduc-ibly than muscle mass. A much larger numberof subjects have therefore been examined,and usually under much more carefully con-trolled dietary conditions. It would thereforeseem likely that a very carefully controlledstudy (diet, activity, absence of stress or dis-
ease, adequate number of urine collections)correlating creatinine with some as yet un-
developed or unverified accurate in vivomeasure of muscle mass would provide a
creatinine equivalence with minimum varia-
bility.
Conclusions and summary
The collective review of the literature al-lows us to draw the following conclusions.
1 ) If an individual consumes the sameamount of a constant composition diet, crc-atininc output in the urine is proportional to
muscle mass.
2) Changing from a meat diet to a creatine-free diet and vice versa causes readjustmentover time in the size of the creatine pool. The
result is a change in urinary creatinine excre-tion that is independent from changes in mus-dc mass. Diet therefore must remain reason-ably constant.
3) Other than dietary factors, the vanabi!-ity in the creatminc-musclc mass relationshipis due to normal daily variation in creatinineexcretion; variability is increased by severeemotional stress, by sampling during differentphases in the menstrual cycle, and by veryvigorous exercise. Collecting several consec-
utive 24-h specimens, and ensuring a mini-mum ofemotional stress and physical activitycan eliminate some of the variation in creat-inine excretion.
4) Severe renal insufficiency, acute infec-tion, or the early phases of major injury are
conditions in which creatinine output is notproportional to muscle mass. Quantifying
muscle mass in these patients should be ac-complished by other methods. A notableproblem however, is that not all of the meth-
ods listed in Table 1 are clinically available,and of those that are, most have limitationsthat also limit their accuracy.
5) The creatinine equivalence is roughly17 to 20 kg muscle per g of creatinine, butthe variability and precision of these esti-mates remain uncertain. The value is higher
on a creatine-free diet, and lower for a meatdiet. Converting creatinine to muscle massmay thus serve as an approximation, butshould not be considered a definitive ap-praisal of muscle mass.
6) In the evaluation of selected patients,
by on Septem
ber 23, 2009 w
ww
.ajcn.orgD
ownloaded from
492 HEYMSFIELD El AL
creatinine can be compared to serial samplescollected over time to establish trends (assum-ing diet remains fairly constant), or compared
directly to “standard” tables based on age,sex, stature, and diet (80, 81). The comparisonto reference tables provides an estimate of the
“percent of standard” muscle mass.
In summary, the use of urinary creatinineexcretion as an index of muscle mass is con-ceptually interesting, and the method mayprovide useful information in carefully se-lected subject groups. There remains, how-
ever, a large group of individuals in whomthe method cannot be reliably applied. Forexample, what set of reference values shouldbe used in the athlete who ingests an unusu-
ally large amount of meat in his!her diet, orin the cancer patient with reduced food (ic,creatine) intake secondary to anorexia? Howcan change in muscle mass in the latter pa-tient be accurately followed over time, whenfood intake may vary with exacerbation andremission of disease? There is little question
that the assumptions of the creatinine-musclemass method are invalid in the early phase ofinjury, and in the presence of fever and in-
fection. Since undernutrition and muscleatrophy are often found in patients in whomthe creatinine-muscle mass method is mac-curate, a priority research focus should be thedevelopment and validation of accurate andpractical methods of measuring muscle massin these individuals.
References
1. Behnke AR, Wilmore JH. Application ofthc variousfield methods. In: Evaluation and regulation of bodybuild and composition. Englewood Cliffs, NJ: Pren-
lice-Hall, mc, 1974:58-9.
2. Cohn SH, Sawitsky A, Vartsky D, Yasumura 5,Zanzi I, Ellis KJ. Body composition as measured by
in vivo activation analysis. In: Nutritional assess-
ment-present status, future directions and pros-pects. Columbus, OH: Ross Laboratories, 198 1:99-102.
3. Heymsfield SB, Stevens V, Noel R, ct al. Biochemi-
cal composition of muscle in normal and protein-
energy starved human subjects: relevance to anthro-pometric measurements. Am J Clin Nutr
1982;36: 131-42.4. Bistrian BR, Blackburn GL, Sherman M, Scrimshaw
NS. Therapeutic index of nutritional depletion in
hospitalized patients. Sum Gynecol Obstet
1975; 141:5 12-16.
5. Viteri FE, Alvarado J. The creatininc height index:
its use in the estimation of the degree of protein
depletion and repletion in protein calorie malnour-
ished children. Pediatrics 1970;46:696-706.
6. Heymsfield SB, Olafson RP, Kutner MH, Nixon
DW. A radiographic method ofquantifying protein-
energy undernutrition. Am J Clin Nutr 1979;32:693-
702.7. Stouffer JR, Westervelt MS. A review of ultrasonic
applications in animal science. J Clin Ultrasound
l976;5: 124-8.
8. Picou D, Reeds PJ, Jackson A, Poulter N. The
measurement of muscle mass in children using crea-
tine-”-N. Pediatr Res 1976; 10:184-8.9. Kreisberg RA, Bowdoin B, Meador CK. Measure-
ment of muscle mass in humans by isotopic dilution
ofcreatine-’4-C. J App! Physiol l970;28:264-7.10. Greatrex G, Morgan AP, Mcore FD. Evaluation of
muscle mass measurement by creatine-’4-C dilution
in the dog. Metabolism l972;21:757-60.
1 1. Graystone JE. Creatinine excretion during growth.
In: Cheek DB. Human growth: body composition
cell growth, energy and intelligence. Philadelphia,
PA: Lea & Febiger, l968;12: 182-97.12. Anderson EC. Three component body composition
analysis based on water determinations Ann NYAcad Sci 1963; 110:189-210.
13. Burkinshaw L, Hill GL, Morgan DB. Assessment of
the distribution of protein in the human body by invivo neutron activation analysis. Nuclear Activation
Techniques in the Life Sciences (Proc Symp Vienna,
1978). Vienna: LAEA, 1979:787-9.
14. Cohn SH, Vartsky D, Yasumura 5, et a!. Compart-
mental body composition based on total-body nitro-
gen, potassium, and calcium. Am J Physiol
1980;239:524-30.
15. Cohn SH, Cartenhaus W, Sawitsky A, et a!. Corn-
partmental body composition of cancer patients by
measurement of total body nitrogen, potassium, andwater. Metabolism 198 1;30:222-9.
16. Mallard J, Hutchinson JMS, Edelstein WA, Ling
CR, Foster MA, Johnson G. In vivo NMR imagery
in medicine. The Aberdeen approach, both NMR
physical and biological. Phil Trans R Soc Lond B
l980;280:5 19-33.
17. Lukaski H, Mendez J. Relationship between fat-freeweight and urinary 3-methyl histidine excretion in
man. Metabolism 1980;29:758-6l.
18. Lukaski HC, Mendez J, Buskirk ER, Cohn SH. A
comparison of methods of assessment of body corn-position including neutron activation analysis of to-
tal body nitrogen. Metabolism 198 1;30:777-82.19. Chinn KSK. Prediction of muscle and remaining
tissue protein in man. J AppI Physiol l967;23:713-715.
20. van Dobeln W. Estimation of muscle mass of the
human body from potassium-40 determinations.Medd Flygg Navalmed Namnd 1962; 11:1-4.
21. Heymsfield SB, McManus C, Smith J, Stevens V.Muscle mass: reliable indicator of protein calorie
malnutrition. Am J Clin Nutr l982;35:1 192-1199.
22. Myers VC, Fine Mi. The creatine content of muscleunder normal conditions: its relation to the urinary
creatinine. J Biol Chem 1913;14:9-26.
23. Palladin A, Wallenburger L. Contribution a l’ctude
de Ia formation de la creatine dans l’organismc
animal. Compt Rend Soc de Biol 1915:111-113.
24. Burger MZ. Bcitrage zum Krcatininstoffwechsel: I.Die Bedeutung des Kreatininkoefizienten f#{252}rdie
by on Septem
ber 23, 2009 w
ww
.ajcn.orgD
ownloaded from
CREATININE MUSCLE MASS METHOD 493
quantitative Bewertung der Muskulatur als K#{246}rpcr-
� II. Di� kf�litIh. �nausscheidung: die StOrungen des Muskelstoffwech-sels. Z Ges Exp Med l9l9;9:361-99.
25. Hunter A. The physiology ofcreatine and creatinine.
Physiol Rev 1922;2:586-626.
26. Hoberman HD, Sims EAH, Peters JH. Creatinc and
creatinine metabolism in the normal male adult
studied with the aid of isotopic nitrogen. J Biol
Chem 1948; 172:45-58.27. Fitch CD, Sinton DW. A study of crcatine mctabo-
lism in diseases causing muscle wasting. J Clin Invest
1964;43:444-52.28. Crim MC. Creatine metabolism in men: crcatine
pcol size and turnover in relation to creatine intake.J Nutr l976;106:37l-8l.
29. Baldwin D, Robinson PK, Zierler KL, Lilienthal JL.
Interrelations of magnesium, potassium, phospho-
rus, and creatinc in skeletal muscle of man. J Clin
Invest l952;3 1:850-8.
30. Vignos PH Jr, Warner JL. Glycogen, creatinc, and
high energy phosphate in human muscle disease. JLab Clin Med 1963;62:579-90.
3 1. Walker JB. Creatine: biosynthesis, regulation, and
function. Adv Enzymo! l979;50: 177-242.
32. Bloch K, Schoenheimer R. The biological precursorsofcrcatinc. J Biol Chem 1941;l38:167-91.
33. Borsook H, Dubnoff JW. The hydrolysis of phos-
phocreatine and the origin of urinary creatinine. JBiol Chem 1947;168:493-510.
34. Krisko I, Walker JB. Influence of sex hormones on
amidinotransferasc levels. Metabolic control of crca-
tine biosynthesis. Acta Endocrinol 1966;53:655-62.
35. Haugland RB, Chang DT. Insulin effect on crcatinetransport in skeletal muscle. Proc Soc Exp Biol Mcd
1975; 148:1-4.
36. Hunter A. Creatinc and creatininc, monographs on
biochemistry. New York, NY: Longmans, Green
and Co, Ltd, 1928.
37. Fitch CD, Lucy DD, Bomhofen JH, Dalrymple GV.
Creatine metabolism in skeletal muscle: creatinc ki-
netics in man. Neurology l968;l8:32-42.
38. Hahn A, Meyer G. On the mutual transformation ofcreatine and creatinine. Ztschr Biol 1928;78: 1 1 1-15.
39. Saks VA, Rosenshtraukh LV, Smirnov VN, Chazov
El. Role of crcatine phosphokinase in cellular func-
tion and metabolism. Can J Physiol Pharmocol1978;56:69 1-706.
40. Crim MC, Calloway DH, Margen S. Creatinc me-
tabolism in men: urinary creatine and creatinine
excretions with creatine feeding. J Nutr
1975; 105:428-38.
4 1 . Bjornsson ID. Use of serum creatinine concentra-tions to determine renal function. Clin Pharmaco-kinetics l979;4:200-22.
42. Folin OH. Laws governing the chemical compositionof urine. Am J Insanity l904;60:709-l0.
43. Rose WC. The metabolism of creatine and creati-
nine. Ann Rev Biochem 1933;2: 187-207.
44. Cryer PE, Sode J. Variation in urinary creatinineexcretion and its relationship to measurement of
urinary 17-hydroxy-corticosteroids. Clin Chem1970; 16:1012-15.
45. Greenblatt DJ, Rausil BJ, Harmatz JS, Smith 1W,
Duhme DW, Koch-Weser J. Variability of 24-hoururinary creatinine excretion by normal subjects. J
Clin Pharmacol l976;l6:32l-8.
4�. llo�� W. Uf�fiAf�k�liE�U1of #{233}f�ALIB#{234}Ah� �fe�li.nine associated with physical exertion and its rela-tionship to carbohydrate metabolism. Biochem J
l939;33: 1425-31.
47. Srivastava SS, Mani KV, Soni CM, Bhati J. Effect
ofmuscular exercises on urinary excretion of creatineand creatinine. Ind J Med Res 1957;55:953-60.
48. Scrimshaw NS, Habicht JP, Piche ML, Cholakos B,
Arroyave G. Protein metabolism of young men dur-
ing university examinations. Am J Clix Nutr
1966; 18:321-4.
49. Schottstaedt WW, Grace WJ, Wolff HG. Life situ-
ations, behavior, attitudes, emotions and renal excre-
tion of fluids and electrolytes: V. Variations in cx-
cretion of endogenous creatininc. J Psychosom Res
1956;1:292-8.
50. Lykken GI, Jacob RA, Munoz JM, Sandstead HH.A mathematical model of creatine metabolism innormal males-comparison between theory and cx-
periment. Am J Clin Nutr l980;33:2674-85.5 1. Van Pilsum JF. Creatin and creatine-P in normal
and protein depleted rats. J Biol Chem
1957;228: 145-8.
52. Bleiler RE, Schedl HP. Creatinine excretion: varia-
bility and relationships to diet and body size. J Lab
Clin Mcd l972;59:945-55.
53. USDA Nationwide Food Consumption Survey
1977-78, (preliminary report no 2). Washington, DC:
the Office of the Director, Science and Education
Administration, US Department of Agriculture,
Spring, 1977.
54. Macy RL Jr, Naumann HD, Bailey ME. Water-
soluble flavor and odor precursors of meat. 5. Influ-ence of heating on acid-extractable nonnucleotidechemical constituents ofbeef, lamb and pork. J Fcod
Sci 1970;35:83-7.
55. Shaffer P. The excretion of kreatinin and kreatin in
health and disease. Am J Physiol l908;23: 1-17.
56. Smith OW. Creati.nine excretion in women: datacollected in the course of urinalysis for female sex
hormones. J Clin Endocrinol l942;2: 1-12.57. Tomlinson BE, Walton JN, Rebeiz JJ. The effects of
aging and of cachexia upon skeletal muscle-a his-
topathological study. J Neurol Sci l969;9:32l-46.
58. Waterlow JC, Neale RJ, Rowe L, Palm I. Effect of
diet and infection on creatine turnover in the rat.
Am J Clin Nutr 1972;25:371-5.
59. Frawley JP, Aria CP, Howard JM. Muscle metabo-
lism and catabolism in combat casualties. Arch Surg
1955;7 1:612-16.
60. Schiller WR, Long CL, Blakemore WS. Creatininc
and nitrogen excretion in seriously ill and injured
patients. Surg Gynecol Obstet 1979; 149:561-6.
61 . Geiger JW, Long CL, Sills LM, Blakemore WS.
Creatine, creatinine, and urinary nitrogen excretion
in traumatized males. Fed Proc 198 l;40:852(abstr).
62. lhrclfall Ci, Stoner HM, Galasko CSB. Patterns in
the excretion of muscle markers after trauma and
orthopedic surgery. J Trauma 198 l;2l:140-7.
63. Goldman R. Creatinine excretion in renal failure.Proc Soc Exp Biol Mcd 1954;85:446-8.
64. Jones JD, Burnett PC. Creatinine metabolism inhumans with decreased renal function: creatininedeficit. Clin Chem 1974;20: 1204-12.
65. Mitch WE, Walser M. A proposed mechanism for
by on Septem
ber 23, 2009 w
ww
.ajcn.orgD
ownloaded from
494 HEYMSFIELD El AL
reduced creatininc excretion in severe chronic renal
failure. Nephron l978;21:248-54.66. Mitch WE, Collier VU, Walser M. Creatininc me-
tabolism in chronic renal failure. Clin Sci
1980;58:327-55.
67. Garn SM. Human biology and research in bodycomposition. Ann NY Acad Sci 1963;l 10:429-46.
68. Chinn KSK. Potassium and creatinine as indexes of
muscle and nonmusc!e protein in rats. J Nutrl966;90:323-30.
69. Meador CK, Kreisberg RA, Friday JP, et a!. Muscle
mass determination by isotopic dilution of creatine-
‘4-C. Metabolism 1968; 17:1104-8.70. Vierordt H. Date und labellen fur Mediziner. Ed 3.
Jena, Gustau Fischer 1906:36-43.71. Talbot NB. Measurement of obesity by the creati-
nine coefficient. Am J Dis Child 1938;55:42-50.72. Cheek DB, Brasel JA, Elliott D, Scott RE. Muscle
cell size and number in normal children and in
dwarfs (pituitary, cretins and primordial) before and
after treatment. Bull Johns Hopkins Hosp1966;1 19:46-62.
73. Heymsfield SB, McManus C, Smith J, Stevens V,Nixon DW. Anthropometric measurement of musclemass: revised equations for calculating bone-free
arm muscle area. Am J Clin Nutr 1982;36:680-90.
74. Keys AJ, Brozak A, Henschel 0, Michelson 0, lay-br HL. In: The biology of human starvation. Mm-
neapolis, MN: Minnesota Press 1950:130-60.75. Standard KL, Willis VG, Waterlow JC. Indirect
indicators of muscle mass in malnourished infants.
Am J Clin Nutr l959;7:271-9.
76. Muldowney FP, Crooks J, Bluhm NM. The relation-
ship of total exchangeable potassium and chloride tolean body mass, red cell mass and creatinine excre-
tion in man. J Clin Invest 1957;36:l375-81.
77. Edwards KDG, Whyte HM. Creatininc excretionand body composition. Chin Sci 1959;18:361-6.
78. Forbes GB, Bruining GJ. Urinary creatinine excre-tion and lean body mass. Am J Chin Nutrl976;29: 1359-66.
79. Miller Al, Blyth CS. Estimation of lean body massand body fat from basal oxygen consumption and
creatinine excretion. J Appl Physiol l952;5:73-8.
80. Blackburn GL, Bistrian BR, Maini BS, et al. Nutri-tional and metabolic assessment of the hospitalized
patient. JPEN 1977;l:l 1-22.
81. Turner WJ, Cohn S. Iota! body potassium and 24
hour-creatinine excretion in healthy males. ClinPharmacol Iher 1975; 18:405-12.
by on Septem
ber 23, 2009 w
ww
.ajcn.orgD
ownloaded from


![Home [ernaehrungsdenkwerkstatt.de]ernaehrungsdenkwerkstatt.de/fileadmin/user_upload/EDWText/TextEl… · data for the purpose of relating nutritional variables (risk factors as well](https://img.pdfslide.net/doc/110x75/5f5760affd68cb34bb582734/home-erna-erna-data-for-the-purpose-of-relating-nutritional-variables-risk-factors.jpg)


![Home [ernaehrungsdenkwerkstatt.de]](https://img.pdfslide.net/doc/110x75/62112c1178a1546a3110af55/home-erna-.jpg)