Embed Size (px)
Citation preview

1
Measurements of the anatomical distribution of
erythemal ultraviolet: a study comparing exposure
distribution to the site incidence of solar keratoses, basal
cell carcinoma and squamous cell carcinoma
Nathan Downs1 and Alfio Parisi
1
1 Faculty of Sciences, University of Southern Queensland, Toowoomba, 4350, Australia.
email [email protected], Fax: +617 46 312721, Tel: +617 46312727
Authors’ Accepted Manuscript Version of :
Downs, Nathan and Parisi, Alfio (2009) Measurements of the anatomical distribution
of erythemal ultraviolet: a study comparing exposure distribution to the site incidence
of solar keratoses, basal cell carcinoma and squamous cell carcinoma. Photochemical
and Photobiological Sciences, 8 (8). pp. 1195-1201. ISSN 1474-905X
Deposited in USQ ePrints in accordance with the copyright policy of the publisher
(Royal Society of Chemistry)

2
Abstract
Measurements of anatomical UV exposure distribution were made using miniaturized
polysulphone dosimeters over a four year period between 2005 and 2008 in Toowoomba,
Australia (28oS, 152
oE). Anatomical UV exposures were expressed relative to the horizontal
plane ambient UV. The UV exposures were compared with existing data detailing the
anatomical distribution of basal cell carcinoma (BCC), squamous cell carcinoma (SCC) and
Solar keratoses (SK). Surface UV exposures to unprotected skin surfaces have been presented
for each of the face, neck, arm, hand and leg assessing a total of 1453 body sites (2491
measurements). Measured exposures are presented for the human facial region to a resolution
of 5 mm. The median anatomical UV, expressed relative to the horizontal plane ambient UV
for each of the face, neck, forearm, hand and leg regions of the body varied from 26%, 23%,
13%, 30% and 12% respectively in the 0o-30
o SZA range; 39%, 36%, 17%, 35% and 23% in
the 30o-50
o SZA range; and 48%, 59%, 41%, 42% and 47% in the 50
o-80
o SZA range.
Detailed positions of UV exposure measured over the face, neck, arm, hand and leg were
more closely related to NMSC incidence data for the face and upper limbs. Further analysis
with existing facial BCC and SK density data did not however show a direct relationship with
the measured UV exposures highlighting the importance of other factors influencing the
causation and localisation of facial NMSC.
Keywords: Ultraviolet, erythema, non-melanoma skin cancer, polysulphone dosimetry.

3
Introduction
Non melanoma skin cancer (NMSC) is the most common type of cancer observed in fair
skinned populations1. Of the types of NMSC, basal cell carcinoma (BCC) occurs more
frequently, originating in the basal cell layer of the epidermis varying in depth from between
40 μm for the head, 50 μm for the arms and legs and 150 μm for the dorsal sides of the hand2.
Squamous cell carcinoma (SCC), affecting the stratified squamous epithelium occur
frequently to exposed areas of human skin. The incidence of SCC and BCC increases with
age3,4
and is strongly correlated in fair skinned populations living in low latitudes. Exposure
to ultraviolet (UV) radiation plays a causative role in the gene mutation of skin carcinomas5,
penetrating the dermal layer over the UVA waveband, reaching subcutaneous tissue6 and
affecting the epidermal layer in both the UVA and UVB wavebands. The ambient UV
incident upon skin surfaces of the human body is strongly dependent on geographical latitude,
having a significantly greater intensity in lower latitudes due to higher solar elevation. Low
geographical latitude and the predominately northern European ethnocentric origin of the
modern Australian population contribute to Australia having the largest incidence rates of
NMSC in the world, displaying a distinct latitudinal gradient7.
Like NMSC, actinic or solar keratoses (SK) are also commonly observed in fair skinned
populations that are exposed to high ambient levels of UV radiation such as those which
occur in Australia8,9
. These cutaneous legions have been noted to be more prevalent on sun
exposed regions of the body compared to BCC and SCC leading to SK being noted as
potentially better markers of sunlight exposure than the presence of skin cancers8. In addition
to SK forming in frequently sun exposed regions of the body, SCC have been linked to the
presence of pre-existing SK legions10
leading to their being recognised as either pre-cursors
to, or representative of the developmental stages of SCC11
. In this research, the published
facial distribution of SK12
incidence and BCC13
incidence was compared to measured facial
site UV exposure data in the 0o-30
o, 30
o-50
o and 50
o-80
o solar zenith angle (SZA) ranges. This
extends the work of previous research which has published NMSC site incidence data over
broader regions of the body and face.
In 1979, Diffey13
published measurements of UV exposure made at 40 facial locations on a
large fiberglass headform. These results were shown in comparison to detailed published
BCC facial site incidence data14
. Unlike the study of Diffey13
which utilised a mannequin
headform, studies of sun exposure measured to individuals have not been able to accurately
link measured exposures to the development of skin cancers due to the limited number of
body sites that can be assessed on living human subjects and the extended latency period

4
between an exposure event and the development of a cancer. Furthermore, whilst the
distribution of NMSC to the human body has been extensively documented including studies
conducted by Peal and Scott15
, Kricker et al.16
and Raasch17
, detailed NMSC site distributions
are often limited to broad regions of the body making direct comparisons between body
surface exposure and NMSC site incidence difficult.
The pattern in UV exposure received by specific body sites, being dependent upon SZA is
critical toward understanding frequency of incidence and anatomical distribution of NMSC
present in worldwide populations. The current study provides results on the UV exposure
distribution received by surfaces of the human body with variation in SZA to a spatial
resolution of between 5 mm and 20 mm to the face, neck, forearm, hand and leg. This
research extends previously detailed measurements of exposure recorded on the face over
three SZA ranges18
, where preliminary results were provided for a number of facial sites.
These earlier results for UV exposures over the human facial topography are extended in this
paper to provide detailed measurements of facial and body surface UV exposures made under
low and high cloud cover conditions. Measurements of UV surface exposures are further
compared with facial and body site NMSC and SK incidence data.
Methods
Exposure Ratio
Measurements of ultraviolet exposure were made using miniaturized polysulphone
dosimeters. The miniaturized dosimeters used in this research were chosen to be small and
flexible enough to be attached in large numbers to the complex surface topography of a life
sized mannequin model. Each miniaturized dosimeter was made using a flexible card frame
measuring approximately 10 mm by 15 mm with a clear circular aperture of 6 mm over which
polysulphone film of an approximate thickness of 40 μm was adhered. Pre- and post-
exposure measurements of polysulphone film absorbance were made at 330 nm using a
spectrophotometer (model 1601, Shimadzu Co., Kyoto, Japan) and subsequent exposures
were expressed relative to the horizontal plane exposure measured in proximity to the
mannequin. Here, the exposure measured at any site and expressed relative to the horizontal
plane exposure is given by:
hor
site
E
EER (1)
5
where ER is the exposure ratio of the UV exposure measured at any given body site, Esite, and
expressed relative to the horizontal plane exposure, Ehor. Both Esite and Ehor are the erythemal
UV exposures measured with the dosimeters for the exposure periods listed in Table 1 within
the SZA ranges 0o-30
o, 30
o-50
o and 50
o-80
o. For the SZA range 0
o-30
o, measurements were
made between November and March near solar noon, and varied for the SZA ranges 30o-50
o
and 50o-80
o depending on the calculated SZA position for the months April to October. The
ER was chosen as a valuable method of representing exposure to body surfaces relative
to the horizontal plane ambient as measurements from several experiments could be
combined with reasonable certainty. The erythemally effective exposures, E were
calculated using the representation19
:
)9( 23 AAAKE (2)
For which, ΔA is the change in polysulphone film absorbance measured at 330 nm and K is a
constant that is eliminated in the ratio, ER. The estimated uncertainty of the miniaturized
dosimeters due to variation in ΔA was determined for this research to be ± 7% (1 σ).
Uncertainty in the measured exposure ratio, ER is therefore taken to be in the order of 14%
for all measurements quoted here.
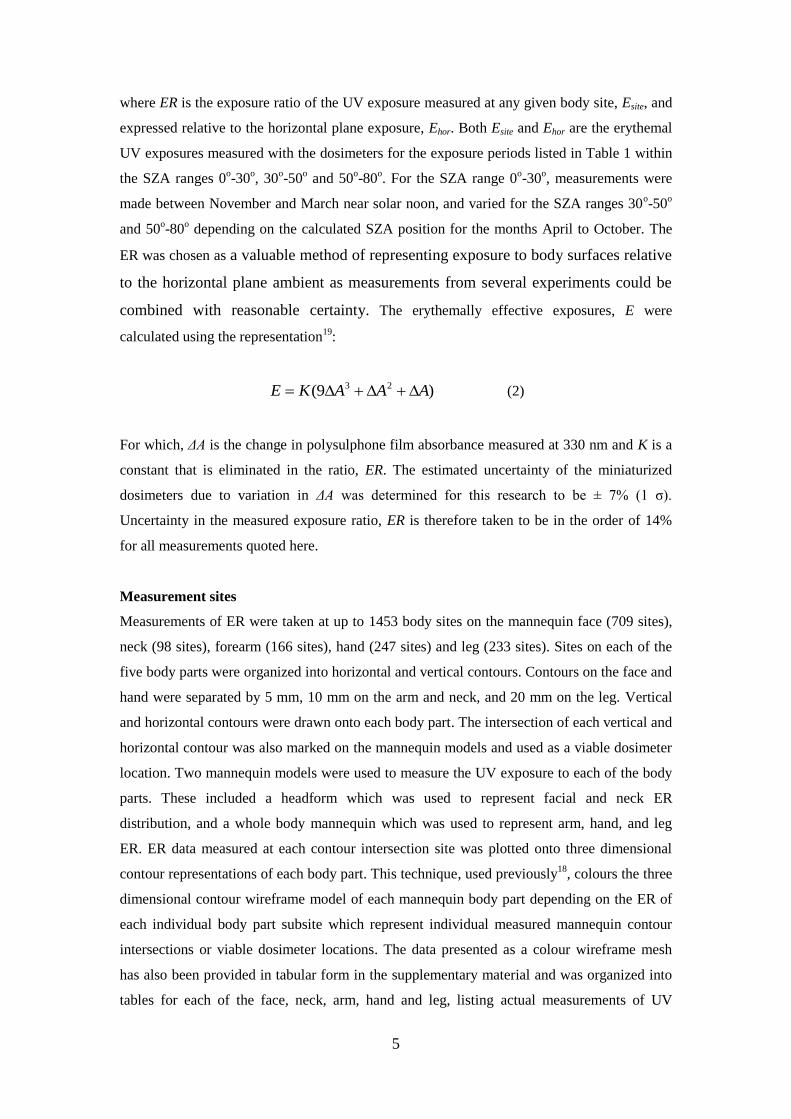
Measurement sites
Measurements of ER were taken at up to 1453 body sites on the mannequin face (709 sites),
neck (98 sites), forearm (166 sites), hand (247 sites) and leg (233 sites). Sites on each of the
five body parts were organized into horizontal and vertical contours. Contours on the face and
hand were separated by 5 mm, 10 mm on the arm and neck, and 20 mm on the leg. Vertical
and horizontal contours were drawn onto each body part. The intersection of each vertical and
horizontal contour was also marked on the mannequin models and used as a viable dosimeter
location. Two mannequin models were used to measure the UV exposure to each of the body
parts. These included a headform which was used to represent facial and neck ER
distribution, and a whole body mannequin which was used to represent arm, hand, and leg
ER. ER data measured at each contour intersection site was plotted onto three dimensional
contour representations of each body part. This technique, used previously18
, colours the three
dimensional contour wireframe model of each mannequin body part depending on the ER of
each individual body part subsite which represent individual measured mannequin contour
intersections or viable dosimeter locations. The data presented as a colour wireframe mesh
has also been provided in tabular form in the supplementary material and was organized into
tables for each of the face, neck, arm, hand and leg, listing actual measurements of UV

6
exposure relative to the horizontal plane ambient UV. Data presented in tables represent all of
the ER data collected in the 2005 to 2008 measurement period. Where no data is listed no
measurements have yet been taken for that subsite location. A Total of 2491 ER subsite
measurements were taken in the 2005 to 2008 measurement period. ER measurement dates,
SZA range, body part and cloud coverage for each exposure period are listed in Table 1.
Exposure times were limited to the SZA ranges given in the table for each experiment.
Typical exposure periods were 2 hours in duration.
Table 1. Date, SZA ranges and cloud cover experienced during mannequin body measurements
conducted in the period 2005 through to 2008.
Mannequin Measurement Location
Face Neck Arm Hand Leg
Date SZA
(o)
cloud
(okta)
Date SZA
(o)
cloud
(okta)
Date SZA
(o)
cloud
(okta)
Date
SZA
(o)
cloud
(okta)
Date SZA
(o)
cloud
(okta)
18 Feb 06 0-30 4 14 Nov 07 0-30 1-3 13 Dec 07 0-30 5-7 21 Nov 07 0-30 2-3 13 Nov 07 0-30 2
12 Mar 07 0-30 1 25 Jan 08 0-30 2-5 01 Feb 08 0-30 3-5 01 Feb 08 0-30 3-5 01 Feb 08 0-30 3-5
21 Feb 08 0-30 2-4 18 Dec 07 30-50 7-8 30 Apr 07 30-50 0 02 Apr 08 30-50 1-2 04 Mar 08 30-50 3-2
25 Jan 08 0-30 2-5 27 Aug 07 50-80 1 02 Apr 08 30-50 1-2 28 Aug 07 50-80 4-5 06 Aug 07 50-80 0
14 Nov 07 0-30 1-3 18 Jul 07 50-80 0 02 Aug 08 50-80 0
16 Sep 05 30-50 0 12 Jul 07 50-80 0
5 Oct 06 30-50 3
16 Oct 07 30-50 0
16 Oct 07 50-80 0
27 May 05 50-80 0
27 Aug 07 50-80 0
For the ER data presented in the supplementary tables, each column was taken to represent a
vertical contour on each mannequin body part including vertical contours that passed from the
forehead through to the front of the neck for the face model; the base of the skull to the lower
back of the neck for the neck model; the shoulder to the wrist for the arm model, the wrist to
the finger tips for the hand model, and the upper thigh to the ankle for the leg model.
Horizontal contours were represented as rows in each body part table and extended from the
centre of the face toward the ear for the face model; from the centre of the back of the neck to
the side of the neck for the neck model; and complete connected bands for the arm, hand and
leg models whereby the first horizontal contour represents a band located at the shoulder for
the arm; a complete band around the wrist for the hand model and a complete thigh band for
the leg model. Where more than one measurement has been recorded at a specific body part
subsite, mean ER is listed for that site location for the supplementary tables presented in this
research. ER measurements presented in the tables are the collected ER measured within each
SZA range and may therefore have been measured on different days under different
atmospheric conditions (Table 1). Uncertainties in ER were minimized by representing body
site exposure relative to the horizontal plane ambient UV. The data has been shown

7
collectively for the four year measurement period to minimize the number of exposure tables
that need to be presented in this work. Supplementary figures of the ER for each body part in
the SZA ranges 0o-30
o, 30
o-50
o and 50
o-80
o were constructed from tabular representations of
mean body site ER recorded in the 2005 to 2008 measurement period.
Both mannequins used in this study were placed on a rotating platform that completed
approximately two revolutions per minute. The rotating platform and mannequins were
placed in open environments which were located at least 30 m from the nearest buildings
inside the grounds of the University of Southern Queensland Toowoomba campus (28oS,
152oE). Measurements of the ER were made over a four year period between 2005 and 2008.
The measurement intervals were taken under low cloud cover conditions where possible
during periods when the SZA varied from 0o-30
o, 30
o-50
o and 50
o-80
o.
Incidence data
For this research, NMSC incidence data from two Australian studies were compared to the
median ER measured to the face, neck, arm, hand and leg mannequin models. Both of these
studies detailed BCC and SCC incidence rates based on either clinical or histological
diagnosis of either NMSC in their respective study populations. Body site incidence data for
both BCC and SCC were detailed for the face, neck, leg and upper limbs where the upper
limb groups included lesions diagnosed to the arms and hands together. Both study groups
presented NMSC incidence data collected in similar latitudes to the measured UV exposure
distributions presented in this research.
Detailed facial site UV exposures measured in this study were further compared to
histologically confirmed BCC incidences recorded by Brodkin14
as detailed by the exposure
comparison of Diffey et al.13
. This data set, excluding superficial type BCC were diagnosed in
the Oncology Section of the Skin and Cancer Unit, University Hospital, New York, and may
therefore differ in BCC distribution observed in an Australian population for which the
ambient UV environment is likely to be different to that which subjects diagnosed in the
Brodkin et al.14
study were exposed. This data set was however sufficiently detailed to make a
comparison to the current UV distribution exposure sets allowing for a comparison of 39
facial locations illustrated in the study conducted by Diffey et al.13
. The facial SK incidence
data compared in this study was sourced from published naevi and SK facial distributions12
.
Published SK data detailed in the Nguyen et al.12
study data was comprised of 79 adult
participants taking part in a field trial located in the Nambour region of Southern
Queensland20
. These participants were diagnosed by a medically qualified investigator as

8
having at least one SK located on the head or neck. The Nambour region is located within
approximately 200 km of the Toowoomba measurement site.
Results
Patterns in facial exposure
The face is not regularly protected by clothing as are other regions of the body that are
exposed to the ultraviolet environment. Correspondingly, non melanoma skin cancers are
highly prevalent on the face followed by other regions of the body that receive high solar UV
exposures including the arms, hands and legs15,16,17
. Within the human facial region, the nose,
ears and cheeks receive the highest proportions of ambient UV13,21
. Of these facial regions,
the nose often receives the greatest proportion of ambient UV over a large SZA range22,23,18
.
Supplementary tables 1(a), 1(b) and 1(c) list the erythemally effective ER measured to the
face under low cloud cover conditions for SZA ranges of 0o-30
o, 30
o-50
o and 50
o-80
o
respectively. The tables are organized into 18 vertical and 49 horizontal contours. A clear
increase of the exposure relative to the horizontal plane toward the lower proximities and
outer extremities of the face is evident in the data for lower solar elevations (larger SZA).
Patterns in body surface exposure
Table 2 represents the variation in measured ER for each of the body parts studied in this
research. The minimum, maximum, median and first and third interquartile ranges are listed
in the table. The highest measured exposure relative to the horizontal plane UV was received
by the face at the vertex in each SZA range. Of each of the face, neck, arm, hand and leg body
parts studied in the 0o-30
o SZA range, the dorsum of the hand received the highest exposure
relative to the horizontal plane UV, followed by the face, the back of the neck, the forearm
and legs.

9
Table 2. Exposure ratio statistics, expressed as a percentage of the horizontal plane ambient UV and
listed for the face, back of the neck, forearm, hand and leg in the SZA ranges 0o-30
o, 30
o-50
o and 50
o-
80o.
Face
0o-30
o 30
o-50
o 50
o-80
o
Range 1-100% 6-100% 0-100%
IQR 15-47% 24-58% 33-70%
Median 26% 39% 48%
Total measurements 391 154 229 Neck
0o-30
o 30
o-50
o 50
o-80
o
Range 4-67% 13-69% 19-86%
IQR 16-33% 30-44% 49-67%
Median 23% 36% 59%
Total measurements 170 44 23 Forearm
0o-30
o 30
o-50
o 50
o-80
o
Range 3-61% 0-55% 2-88%
IQR 5-29% 7-35% 21-57%
Median 13% 17% 41%
Total measurements 140 175 109 Hand 0
o-30
o 30
o-50
o 50
o-80
o
Range 1-76% 1-76% 0-84%
IQR 8-51% 12-57% 10-61%
Median 30% 35% 42%
Total measurements 264 119 82 Leg 0
o-30
o 30
o-50
o 50
o-80
o
Range 1-39% 4-52% 12-82%
IQR 9-16% 15-33% 37-57%
Median 12% 23% 47%
Total measurements 248 231 112
Exposures measured within the 0o-30
o SZA range received the strongest UV irradiance. This
is due to high solar elevation and reduced atmospheric absorption caused by incident sunlight
moving through a shorter atmospheric path than occurs at greater SZA. The measured pattern
of exposure would commonly be observed in sub-tropical to low latitudes during the summer
months either side of midday. At greater SZA ranges, the face and neck receive the highest
ER for the 30o-50
o and 50
o-80
o SZA ranges with the hand and leg receiving higher exposures
than the forearm. This is due to UV radiation incident in the greater SZA ranges having a
more significant influence on vertically orientated body surfaces.
Exposures to all body parts measured in this study showed an increase in ER with increasing
SZA range. Apart from the ER measured in the 0o-30
o SZA range for the back of the neck, all
body parts showed a further increase in the interquartile range of exposures. These findings

10
indicate that the UV exposure received over the body surface increases relative to the
horizontal plane exposure and affects a larger surface area of the body with increasing SZA.
While there is a clear spreading in the received exposure over a larger area with increasing
SZA, exposures measured in the high SZA ranges were received during periods of the day
that receive a lower UV irradiance. The lower ER measured at sites in the 0o-30
o SZA range
receive a significant level of the ambient UV due to the higher UV irradiances at these
smaller SZA. The measured ranges of exposure listed in Table 2 therefore provide an
indication of the proportions of each body part at risk of receiving high levels of solar UV
radiation. For populations located in sub-tropical to low latitudes that experience high solar
elevations, and subsequently all of the SZA ranges studied in this research, the areas of the
body surface that receive the highest UV exposure are those highlighted in the 0o-30
o SZA
range. The areas of the body that receive the highest UV exposure based on a comparison
between all studied SZA range distributions are therefore the vertex, the nose, the cheeks, the
top of the ear, the dorsa of the forearms and hand, the lower back of the neck located near the
shoulder, and the calf muscle region of the leg.
Comparison of measured exposure with sites of NMSC incidence
The anatomical distribution for histologically confirmed incidences of BCC and SCC
measured in Australian populations of sub-tropical and tropical latitude were compared to the
ER data measured in the 0o-30
o, 30
o-50
o and 50
o-80
o SZA range. The localisation of BCC and
SCC data were measured from electoral roll populations residing in Geraldton, Western
Australia16
and Townsville, Queensland17
. These two regional Australian cities are located in
latitudes of 29oS and 19
oS respectively and are therefore subject to the SZA ranges studied in
this research. The incidence of both BCC and SCC to the face and upper limbs were reported
in these two studies to be higher than the confirmed incidences to the neck and legs, regions
of the body that are better protected by clothing than the face and upper limbs, particularly in
warm climates, where often the forearms are not protected.
Generally, BCC incidence reported by Kricker et al.16
and Raasch et al.17
was most strongly
correlated to UV exposures measured in this research to the face, followed by the upper
limbs. Both of these studies further reported the greatest incidence of BCC to the legs
followed by the neck, however exposures measured in this research were higher to the neck
region followed by measurements made to the legs of the mannequin. The examined
incidences of SCC which were recorded in similar latitudes to the measured pattern of
exposure show a higher correlation with ER than the respective BCC incidence where the
facial incidence of this cancer was greater than the incidence to the upper limbs in the

11
Geraldton16
study and lower in the Townsville17
study. Here the facial incidence of SCC was
measured in Geraldton16
to be 58% and 57% (men and women respectively) and 19% in
Townsville17
and the incidence to the upper limbs was measured at 9% and 14% (men and
women) in Geladton16
and 49% in Townsville17
essentially demonstrating that approximately
half of the observed SCCs occurred to frequently exposed regions of the body. The patterns in
solar UV exposure affecting unprotected skin surfaces measured in this research may
therefore be found to be in better agreement with future studies relating the anatomical
distribution of SCC than BCC. A more detailed analysis of measured ER and subsite
incidence rates is however needed to determine associations between exposure and whole
body incidence of NMSC.
Comparisons with facial BCC and SK site incidence to UV exposure
Comparison between the facial distribution of UV exposure and the localisation of BCC
incidence has been reported previously13
. The facial distribution of BCC incidence has been
detailed by Brodkin et al.14
, Scrivener et al.24
and more recently by Richmond-Sinclair et al.25
in and Australian setting. These studies show high rates of BCC incidence to the nose.
Comparisons between the distribution of facial exposure and BCC incidence provide a
valuable insight into the causal nature of UV exposure and the aetiology of BCC as the face is
not often protected by clothing and receives a high proportion of the ambient UV. The
correlation between facial BCC tumour density14
and UV exposure examined by Diffey et
al.13
did not show a strong relationship. This was partly due to differences in latitude between
the two locations in which the data sets were collected. The facial UV exposure data recorded
in the current study within each of the 0o-30
o, 30
o-50
o and 50
o-80
o SZA ranges is presented in
figure 1. Comparisons made between the research of Diffey et al.13
and the current facial
exposure measurements show similarities that highlight the difficulty in establishing a
relationship between UV exposure and BCC tumour density. The data presented shows a
steady increase in BCC tumour density with increasing UV exposure ratio, however
consistent discontinuities in the comparison weaken the relationship with significantly higher
tumour densities occurring for example, under the nose, an area of the face that does not
receive a high proportion of the ambient UV.

12
Figure 1(a) Facial BCC tumour incidence14
and UV exposure in the SZA 0o-30
o.
Figure 1(b) Facial BCC tumour incidence14
and UV exposure in the SZA 30o-50
o.
Figure 1(c) Facial BCC tumour incidence
14 and UV exposure in the SZA 50
o-80
o.

13
The relationship between facial UV exposure and the distribution of SK, possible markers for
the later development of SCC8, were examined with respect to measured facial ER. Figure 2
compares the facial distribution of SK incidence measured in Nambour (Latitude 27o S)
12 with
the facial ER data measured here for each of the 0o-30
o, 30
o-50
o and 50
o-80
o SZA ranges.
Comparisons between this data set show that SK incidence increases with facial UV
exposure. The greatest incidence of observed SK for the Nambour study12
was found on the
cheek, followed by the ears and the nose. Each of these regions of the face receive a
consistently high UV exposure across each of the 0o-30
o, 30
o-50
o and 50
o-80
o SZA ranges.
However, as is evident in figure 2, it is difficult to establish a clear relationship between UV
exposure distribution and the incidence of SK.
Figure 2(a) Facial SK incidence
12 and UV exposure in the SZA 0
o-30
o.
Figure 2(b) Facial SK incidence
12 and UV exposure in the SZA 30
o-50
o.

14
Figure 2(c) Facial SK incidence12
and UV exposure in the SZA 50o-80
o.
Discussion
This research has presented detailed subsite information for facial exposures in the 0o-30
o,
30o-50
o and 50
o-80
o SZA ranges. Measurements of exposure were consistently high over the
scalp region of the facial mannequin model in each SZA range. Periorbital exposures tended
to be low across all SZA ranges although greater exposures were observed over the upper
cheek region with increasing SZA. Summary statistics were given for neck, arm, hand and leg
body models. It was determined that higher exposure occurred on body parts orientated more
closely toward the horizontal plane. These included the lower back of the neck toward the
shoulder region, the lower anterior of the forearm, the dorsa of the hand and the upper
anterior calf muscle region of the leg. Each of these subsites received a higher proportion of
the ambient UV with increasing SZA.
The incidence of SCC in men and women is lower than BCC7,16,17
. The proportion of SCC is
greater to the exposed surfaces of the upper limbs than BCC17,26
. This, in part is due to the
higher incidence rate of BCC localised on the body trunk, an area of the body not readily
exposed to solar UV, decreasing the relative proportion of BCC incidence to frequently
exposed body surfaces. Patterns in BCC incidence supported by the hypothesis that
intermittent exposures affect areas of the body not readily exposed to solar UV, may account
for BCC anatomical distributions that develop later in life as a result of earlier severe episodes
of sunburn. Chronic exposure to solar UV is more likely to establish a pattern in exposure
similar to that which has been measured in this research as it can reasonably be concluded

15
that chronic exposure to solar UV will affect unprotected skin surfaces of the body that
receive a higher solar UV exposure.
Nevertheless, the aetiological factors that influence the development of NMSC cannot be
directly related to the measured anatomical distribution of UV exposure alone. The relevance
of this particular point must be emphasised in relation to the currently presented erythemal
UV exposure distributions which were measured using upright mannequin subjects. The
current research cannot therefore account for situations including sunbathing or indeed all of
the exposure situations likely to be experienced within an individual’s lifetime. Additional
factors including variation in skin thickness above the basal layer, the presence of hair,
clothing, and personal outdoor lifestyle patterns will influence NMSC incidence rates and are
difficult to quantify with respect to comparisons made using mannequin subjects.
Existing data present in the literature detailing the measured distribution of solar UV exposure
to human subjects is limited by the total number of body sites that can be measured. An
approach that integrates detailed measurements of UV exposure distribution, such as the body
exposure sets provided here may improve interpolated estimates of whole body exposure
measured using human subjects which in turn may improve correlations made with the
anatomical distribution of NMSC incidence data. The measured patterns in UV exposure
presented in this research can be applied to a variety of SZA ranges providing a detailed data
set of UV exposures that may assist in future studies assessing the anatomical distribution of
melanoma and NMSC incidence.
Conclusions
Measurements of body surface UV exposure patterns have been presented with respect to
changing SZA. These measurements improve upon previously available data which is often
limited to fewer isolated body sites. The presented collection of measured UV exposure data
is of further importance in detailing the solar exposures that affect human skin surfaces which
are influenced by shading caused by the body itself and surface orientation with respect to the
diffuse skylight and the direct solar beam. A total of 2491 measurements of ER to the face,
neck, forearm, hand and leg have confirmed that exposures received by the face and back of
the neck are greater than exposures received by both the upper and lower limbs. Of each of
the studied body parts, the anatomical distribution of BCC and SCC is greatest to the face and
upper limbs, particularly the dorsum of the hand and forearm15,16,17,26
. Incidence rates of both

16
types of NMSC are particularly high at the nose14,15
and correlate with the facial ER
measurements taken in this research across all SZA ranges.
Acknowledgements
The authors would like to offer their sincere thanks to Professor Bruce Armstrong, School of
Public Health, University of Sydney and Dr Georgina Long, Sydney Melanoma Unit, for their
assistance in this research. One of the authors, Nathan Downs, received funding through an
Australian postgraduate award scholarship.
References
1. T.L. Diepgen and V. Mahler, The epidemiology of skin cancer, Br. J. Dermatol., 2002,
146(s61), 1-6.
2. E. Konishi and Y. Yoshizawa, Estimation of depth of basal cell layer of skin for radiation
protection, Radiat. Prot. Dosimet., 1985, 11(1), 29-33.
3. B.A. Raasch, P.G. Buettner and C.Garbe, Basel cell carcinoma: histological classification
and body-site distribution, Br. J. Dermatol. 155, 401-407.
4. M.P. Staples, M. Elwood, R.C. Burton, J.L. Williams, R. Marks and G.G. Giles, Non-
melanoma skin cancer in Australia: the 2002 national survey and trends since 1985, Med. J.
Aust., 2006, 184, 6-10.
5. F.R. deGruijl, Skin cancer and solar UV radiation, Eur. J. Cancer, 1999, 35(14), 2003-
2009.
6. J.A. Parrish, K.F. Jaenicke and R.R. Anderson, Erythema and melanogenesis action spectra
of normal human skin, Photochem. Photobiol. 1982, 36, 187-191.
7. M. Staples, R. Marks and G. Giles, Trends in the incidence of non-melanocytic skin cancer
(NMSC) treated in Australia 1985-1995: Are primary prevention programs starting to have an
effect? Int. J. Cancer, 1999, 78(2), 144-148 .
8. R. Marks, G. Rennie and T. Selwood, The relationship of basal cell carcinomas and
squamous cell carcinomas to solar keratoses, Arch. Dermatol., 1988, 124(7), 1039-1042.
9. C.A. Frost and A.C. Green, Epidemiology of soalr keratoses, Br. J. Detmatol., 1994,
131(4), 455-464.
10. R.Marks, D. Rennie and T.S. Selwood, Malignant transformation of solar keratosse to
squamous cell carcinoma, Lancet, 1988, 1(8589), 795-797.
11. J. Röwert-Huber, M.J. Patel, T. Forschner, C.Ulrich, J.Eberle, H. Kerl, W. Sterry and E.
Stockfleth, Actinic keratosis is an early in situ squamous cell carcinoma: a proposal for
reclassification, Br. J. Dermatol., 156, 8-12.
12. T.D. Nguyen, V. Siskind, L. Green, C. Frost and A. Green, Ultraviolet radiation,
melanocytic naevi and their dose-response relationship, Br. J. Dermatol., 1998, 137, 91-95.

17
13. B.L. Diffey, T.J. Tate and A. Davis, Solar dosimetry of the face: the relationship of
natural ultraviolet radiation exposure to basal cell carcinoma localisation, Phys. Med. Biol.,
1979, 24, 931-939.
14. R.H. Brodkin, A.W. Kopf and R. Andrade, Basal-cell epithelioma and elastosis: a
comparison of distribution, in The Biologic Effects of Ultraviolet Radiation: with Emphasis
on the Skin, ed. F. Urbach, Pergamon, New York, 1969, pp. 581-618.
15. D.K. Pearl and E.L. Scott, The anatomical distribution of skin cancers, Int. J. Epidemiol.,
1986, 15(4), 502-506.
16. A. Kricker, D.R. English, P.L. Randell, P.J. Heenan, C.D. Clay, T.A. Delaney and B.K.
Armstrong, Skin cancer in Geraldton, Western Australia: a survey of incidence and
prevalence, Med. J. Aust., 1990, 152(8), 399-407.
17. B. Raasch, R. Maclennan, I. Wronski and I. Robertson, Body site specific incidence of
basal and squamous cell carcinoma in an exposed population, Townsville, Australia, Mutat.
Res. Fundam. Mol. Mech. Mugag., 1998, 422, 101-106.
18. N.J. Downs and A.V. Parisi, Three dimensional visualisation of human facial exposure to
solar ultraviolet, Photochem. Photobiol. Sci., 2007, 6, 90-98.
19. B.L. Diffey, Ultraviolet radiation dosimetery with polysulphone film, in Radiation
Measurement in Photobiology ed. B.L. Diffey, Academic Press, London, 1989, pp. 135-159.
20. A. Green, D. Battistutta, V. Hart, D. Leslie, G. Marks, G. Williams, P. Gaffney, P.
Parsons, L. Hirst, C. Frost, E. Orrell, K. Durham and C. Lang, The Nambour skin cancer and
actinic eye disease prevention trial: design and baseline characteristics of participants,
Controlled Clin. Trials, 1994, 16, 512-522.
21. F. Urbach, Environmental risk factors for skin cancer, Recent Results Cancer Res., 1993,
128, 243-262.
22. M.G. Kimlin, A.V. Parisi and J.C.F. Wong, The facial distribution of erythemal ultraviolet
exposure in south east Queensland, Phys. Med. Biol., 1998, 43, 231-240.
23. N.J. Downs, M.G. Kimlin, A.V. Parisi and J.J. McGrath, Modelling human facial UV
exposure, Radiat. Prot. Aust., 2001, 17(3), 103-109.
24. Y. Scrivener, E. Grosshans and B. Cribier, Variation of basal cell carcinomas according to
gender, age, location and histopathological subtype, Br. J. Dermatol., 2002, 147, 41-47.
25. N.M. Richmond-Sinclair, N. Pandeya, R.S. Ware, R.E. Neal, G.M. Williams, J.C., van der
Pols and A.C Green, Incidence of basal cell carcinoma multiplicity and detailed anatomic
distribution: longitudinal study of an Australian population, J. Invest., Dermatol., 2009,
129(2), 323-328.
26. G.G. Giles, R. Marks and P. Foley, Incidence of non-melanocytic skin cancer treated in
Australia, Br. Med. J., 1988, 296(6614), 13–17.

18
Supplementary Information: Tables

19
Sup Table 1(a). Facial site exposure ratio measured between 2005 and 2008 and expressed as a percentage for the SZA range 0
o-30
o. ER ranges in the table show high exposed areas in red (ER: 75-100), mid exposed areas in blue (ER:25-74)
and low exposed areas uncloured (ER: 0-25).
Cv1 Cv2 Cv3 Cv4 Cv5 Cv6 Cv7
Cv8 Cv9 Cv10 Cv11 Cv12 Cv13 Cv14
Cv15 Cv16 Cv17 Cv18
Ch1 Ch2 Ch3 Ch4 Ch5 Ch6 Ch7 Ch8 Ch9 Ch10 Ch11 Ch12 Ch13 Ch14 Ch15 Ch16 Ch17 Ch18 Ch19 Ch20 Ch21 Ch22 Ch23 Ch24 Ch25 Ch26 Ch27 Ch28 Ch29 Ch30 Ch31 Ch32 Ch33 Ch34 Ch35 Ch36 Ch37 Ch38 Ch39 Ch40 Ch41 Ch42 Ch43 Ch44 Ch45 Ch46 Ch47 Ch48 Ch49
100 67 87 59 70 59 27 28 1
100 100 100 80 78 70 38 51 30 56 32 17 23 55 40 55 19 5 12 40 5 25 7 33 21 4 1
82 84 80 84 74 53 58 52 45 34 27 6 11 42 32 34 47 8 19 37 46 8 28 7 29 16 5 1 3 7 9
85 95 77 40 2
77 95 85 76 89 56 49 58 50 88 50 51 4 8 8 7 7 17 54 44 30 25 38 33 26 16 19 38 6 3 7 13 11
96 31 12 10 4
85 64 88 79 45 49 42 10 36 27 8 3 5 9 14
58 68 56 84 15 35 34 48 35 27 26 21 14 26 19 19 7 8 15 18
70 71 46 49 54 54 69 4 19 16 11 3
86 81 94 41 67 62 45 69 60 43 7 16 21 31 40 29 24 15 20 19 21 18 15 5 11 23 18 17
72 74 28 42 29 9 8 40 47 29 17 14 10 14 18 19 12 7
69 79 46 33 29 48 23 14 9 8 21 34 18 9 12 9 13 12 16 15 14 10 13 19 25 28 29 29
65 40 38 29 35 15 29 22 24 14 17 13 15
55 53 48 36 45 27 25 22 27 26 25 25 25 17 26 14 16 15 15 15 8 6
42 47 29 29 46 22 13 29 17 19 14 18 21 20 28 12
36 26 40 17 22 23 18 22 19 31 19 7 20 20 17 10
65 75 22 13 26 8
31 25 9

20
Sup Table 1(b). Facial site exposure ratio measured between 2005 and 2008 and expressed as a
percentage for the SZA range 30o-50
o. ER ranges in the table show high exposed areas in red (ER: 75-
100), mid exposed areas in blue (ER:25-74) and low exposed areas uncloured (ER: 0-25).
Cv1 Cv2 Cv3 Cv4 Cv5 Cv6 Cv7
Cv8 Cv9 Cv10 Cv11 Cv12 Cv13 Cv14
Cv15 Cv16 Cv17 Cv18
Ch1 Ch2 Ch3 Ch4 Ch5 Ch6 Ch7 Ch8 Ch9 Ch10 Ch11 Ch12 Ch13 Ch14 Ch15 Ch16 Ch17 Ch18 Ch19 Ch20 Ch21 Ch22 Ch23 Ch24 Ch25 Ch26 Ch27 Ch28 Ch29 Ch30 Ch31 Ch32 Ch33 Ch34 Ch35 Ch36 Ch37 Ch38 Ch39 Ch40 Ch41 Ch42 Ch43 Ch44 Ch45 Ch46 Ch47 Ch48 Ch49
100 71 65 62 66 69 66 35 38 82 98 56 9 31 67 12 50 11 54 34 8 8 12
66 16 47 44 16
69 97 69 61 45 27 46 36 16 35 8 37 18 35 17
70 48 53 45 16
70 54 57 39 41
100 100 90 79 58 77 82 12 13 21 33 83 51 39 54 40 31 26 42 38 13 24 25
70 63 64 55 60 57 49 9 16 37 58 49 34 30 24 19 21 14 8 11 21 26
75 59 58 19
66
75 47 52 18
57 56 10 32 33 37 26 44 43 38 22 20 21 15 18
88 70 53 51 29 40 42 48 42 60 36 47 32 32 25 6
46 46 33 32 28 17 31 30
32 20
20
24

21
Sup Table 1(c). Facial site exposure ratio measured between 2005 and 2008 and expressed as a
percentage for the SZA range 50o-80
o. ER ranges in the table show high exposed areas in red (ER: 75-
100), mid exposed areas in blue (ER:25-74) and low exposed areas uncloured (ER: 0-25).
Cv1 Cv2 Cv3 Cv4 Cv5 Cv6 Cv7
Cv8 Cv9 Cv10 Cv11 Cv12 Cv13 Cv14
Cv15 Cv16 Cv17 Cv18
Ch1 Ch2 Ch3 Ch4 Ch5 Ch6 Ch7 Ch8 Ch9 Ch10 Ch11 Ch12 Ch13 Ch14 Ch15 Ch16 Ch17 Ch18 Ch19 Ch20 Ch21 Ch22 Ch23 Ch24 Ch25 Ch26 Ch27 Ch28 Ch29 Ch30 Ch31 Ch32 Ch33 Ch34 Ch35 Ch36 Ch37 Ch38 Ch39 Ch40 Ch41 Ch42 Ch43 Ch44 Ch45 Ch46 Ch47 Ch48 Ch49
100 100 100 78 94 88 88 92 56 41 67 100 33 25 21 65 39 64 22 36 62 29 7 1 13 28
100 100 96 94 73 73 78 65 77 58 29 61 53 75 26 15 63 39 72 15 66 33 10 0 1 16
81 30 46
83 100
100
45 43
73 100 84 80 90 75 83 82 11 34 42 59 79 56 52 59 45 39 41 63 25 8 14 15 35
74 39 55 54 18 25 83 51 37 40 56 39 37 24
100 79 92 94 86 79 66 77 28 39 39 64 73 51 44 30 35 22 28 40 52
18 38 43 35 46 33
63 66 74 60 82 47 33 33 22 45 36 18
77 88 53 58 83 23 33 38 29 23 44 38 36 27 58 43
97 72 78 62 56 52 45 45 54 11 52 51 22 28 24 41
83 72 63 100 61 53 34 43 94 43 77 49 44 47 51 30 27 34 8
66 53 31 23 49 49 34
68 61 54 57 26 36 52 31 37
16 25
65 47 37

22
Sup Table 2(a). Site exposure ratio measured to the back of the neck and expressed as a percentage for
the SZA range 0o-30
o and cloud cover less than 4 oktas measured between 2005 and 2008. ER ranges
in the table show high exposed areas in red (ER: 75-100), mid exposed areas in blue (ER:25-74) and
low exposed areas uncloured (ER: 0-25).
Cv1 Cv2 Cv3 Cv4 Cv5 Cv6 Cv7
Cv8 Cv9
Ch1 Ch2 Ch3 Ch4 Ch5 Ch6 Ch7 Ch8 Ch9 Ch10 Ch11 Ch12 Ch13
6 10 13 14 20 19 20 21 17 20 23 19 24
6 9 14 18 15 17 18 22 22 22 23 20 28
17 20 28
7 12 14 17 20 21 17 23 21 29 32 26 20
16 24 23 26 34 18 39
8 12 12 15 19 19 23 27 32 32 37 30 34
50 52 38 36
50 48 40
Sup Table 2(b). Site exposure ratio measured to the back of the neck and expressed as a percentage for
the SZA range 30o-50
o and cloud cover greater than 4 oktas measured between 2005 and 2008. ER
ranges in the table show high exposed areas in red (ER: 75-100), mid exposed areas in blue (ER:25-74)
and low exposed areas uncloured (ER: 0-25).
Cv1 Cv2 Cv3 Cv4 Cv5 Cv6 Cv7
Cv8 Cv9
Ch1 Ch2 Ch3 Ch4 Ch5 Ch6 Ch7 Ch8 Ch9 Ch10 Ch11 Ch12 Ch13
14 21 24 32 38 33 56 35 37 33 40 43 38
13 21 23 30 35 37 33 32 38 44 30 69 42
13 16 23 27 32 35 35 47 44 44 40 42 44
62 49 59 48
53
Sup Table 2(c). Site exposure ratio measured to the back of the neck and expressed as a percentage for
the SZA range 50o-80
o and cloud cover less than 4 oktas measured between 2005 and 2008. ER ranges
in the table show high exposed areas in red (ER: 75-100), mid exposed areas in blue (ER:25-74) and
low exposed areas uncloured (ER: 0-25).
Cv1 Cv2 Cv3 Cv4 Cv5 Cv6 Cv7
Cv8 Cv9
Ch1 Ch2 Ch3 Ch4 Ch5 Ch6 Ch7 Ch8 Ch9 Ch10 Ch11 Ch12 Ch13
19 43 49 59 58 45 62
49 48 56 60
47 62 66 63 68
48 57 69 77 68
86 73

23
Sup Table 3(a). Site exposure ratio measured to the arm and expressed as a percentage for the SZA
range 0o-30
o and cloud cover less than 4 oktas measured between 2005 and 2008. ER ranges in the
table show high exposed areas in red (ER: 75-100), mid exposed areas in blue (ER:25-74) and low
exposed areas uncloured (ER: 0-25). Contours located on the anterior of the arm recorded the highest
exposures.
Cv1 Cv2 Cv3 Cv4 Cv5 Cv6 Cv7
Cv8 Cv9 Cv10 Cv11 Cv12 Cv13 Cv14
Cv15 Cv20 Cv21 Cv22 Cv23
Ch1 Ch2 Ch3 Ch4 Ch5 Ch6 Ch7 Ch8 Ch9 Ch10 Ch11 Ch12 Ch13 Ch14 Ch15 Ch16 Ch17 Ch18 Ch19 Ch20 Ch21 Ch22 Ch23 Ch24 Ch25 Ch26 Ch27 Ch28
18 25 13 12 8 6 5
9 43 23 19 13 10 9
6 43 38 29 19 19 13
7 31 39 30 27 29 23 18
21 54 61 54 38 31 30 29
5 23 49 60 36 40 41 43 35 27
20 35 37 40 44 43 39
15 31 32 42 36
13 20 27 23 25 40
8 17 23 21 22 23
13 17 19 13
8 13 11 10
4 8 6 6 5 5 7 8
3 5 4 3 4 3 4 4
3 3 4 4 4 6 4 3 3
3
4 3 3
5 8 9 6 5 5
9 13 10 7 7 6

24
Sup Table 3(b). Site exposure ratio measured to the arm and expressed as a percentage for the SZA
range 30o-50
o and cloud cover less than 4 oktas measured between 2005 and 2008. ER ranges in the
table show high exposed areas in red (ER: 75-100), mid exposed areas in blue (ER:25-74) and low
exposed areas uncloured (ER: 0-25). Measurements made underneath the shirt covering the shoulder
had an ER of 0. Contours located on the anterior of the arm recorded the highest exposures.
Cv1 Cv2 Cv3 Cv4 Cv5 Cv6 Cv7
Cv8 Cv9 Cv10 Cv11 Cv12 Cv13 Cv14
Cv15 Cv20 Cv21 Cv22 Cv23
Ch1 Ch2 Ch3 Ch4 Ch5 Ch6 Ch7 Ch8 Ch9 Ch10 Ch11 Ch12 Ch13 Ch14 Ch15 Ch16 Ch17 Ch18 Ch19 Ch20 Ch21 Ch22 Ch23 Ch24 Ch25 Ch26 Ch27 Ch28
0 0 0 10 18 22 18 17 7 8 4
0 1 28 25 23 17 20
0 0 1 20 30 29 19 33 29 20
1 8 44 51 40 41 33 24 23
0 0 0 0 0 7 38 49 46 43 45 48 42 39
0 5 31 47 33 45 49 42 47 39 30
0 0 0 9 14 13 39 45 49 37 37 45 19
0 8 24 40 46 43 35 55
0 1 7 11 25 29 36 34 41 17 38
0 0 0 4 6 25 28 32 22 28
5 17 25 20 17
0 0 0 0 5 9 22 16 14
5 11 13 10 9 7 11 11 15
0 0 2 3 7 5 5 3 4 4
0 3 4 4 3 6 7 6 5
0 0 0
6 7 6 6
0 0 3 8 15 8 6 2 7
1 13 14 10 9 8 8

25
Sup Table 3(c). Site exposure ratio measured to the arm and expressed as a percentage for the SZA
range 50o-80
o and cloud cover less than 4 oktas measured between 2005 and 2008. ER ranges in the
table show high exposed areas in red (ER: 75-100), mid exposed areas in blue (ER:25-74) and low
exposed areas uncloured (ER: 0-25). Contours located on the anterior of the arm recorded the highest
exposures.
Cv1 Cv2 Cv3 Cv4 Cv5 Cv6 Cv7
Cv8 Cv9 Cv10 Cv11 Cv12 Cv13 Cv14
Cv15 Cv20 Cv21 Cv22 Cv23
Ch1 Ch2 Ch3 Ch4 Ch5 Ch6 Ch7 Ch8 Ch9 Ch10 Ch11 Ch12 Ch13 Ch14 Ch15 Ch16 Ch17 Ch18 Ch19 Ch20 Ch21 Ch22 Ch23 Ch24 Ch25 Ch26 Ch27 Ch28
27 32 19 19 12 11
20 27 41 26 23 14 22
39 47 41 32
31 62 55 55 47 36 29
67 51 54 52 43
6 61 58 60 55 54 45
66 72 71 63 58 65
11 64 71 87 61 69 82 56
43 76 63 57 66
25 49 66 54 60 44
46 65 49 49
24 41 43 48
13 23 37 29 30 19 29 46
2 16 26 18 12 12 20 21
4 13 13
12
14 11
20 24 23 19

26
Sup Table 4(a). Site exposure ratio measured to the hand and expressed as a percentage for the SZA
range 0o-30
o and cloud cover less than 4 oktas measured between 2005 and 2008. ER ranges in the
table show high exposed areas in red (ER: 75-100), mid exposed areas in blue (ER:25-74) and low
exposed areas uncloured (ER: 0-25). The dorsa of the hand received the highest exposures. For this
research the mannequin hand was titlted from the arm’s longitudinal axis increasing the UV radiation
received due to the increased proportion of the hand oriented toward a horizontal plane.
Cv1 Cv2 Cv3 Cv4 Cv5 Cv6 Cv7
Cv8 Cv9 C10 C11 C12 C13 C14
C15 C16 C17 C18 C19 C20 C21 C22 C23
Ch1 Ch2 Ch3 Ch4 Ch5 Ch6 Ch7 Ch8 Ch9 C10 C11 C12 C13 C14 C15 C16 C17 C18 C19 C20
32
29 42 26
16 69 31 29 22 17
20 57 51 63 10
11 37 52 69 76 66 57 47 42 37 30 41 37 46 41
22 31 49 65 76 73 75 75 65 67 65 54 17
42 45 48 33 9 3
37 35 62 52 73 72 71 63 70 62 58 41 11 11 9
35 34 10
30 24 44 46 50 48 61 56 40 61 29 14 7 9
27 15 26 30 42 52 56 8 28
11 34 53 53 38 23
6
2 2
5 2 2
8 6 7 5 2 2 1 3 5
4 1
3 2 5 8
4 3 3 2 3
4 2 2 8
13 14 3 1
5 3 1
10 6 6 3
Sup Table 4(b). Site exposure ratio measured to the hand and expressed as a percentage for the SZA
range 30o-50
o and cloud cover less than 4 oktas measured between 2005 and 2008. ER ranges in the
table show high exposed areas in red (ER: 75-100), mid exposed areas in blue (ER:25-74) and low
exposed areas uncloured (ER: 0-25). The dorsa of the hand received the highest exposures. For this
research the mannequin hand was titlted from the arm’s longitudinal axis increasing the UV radiation
received due to the increased proportion of the hand oriented toward a horizontal plane.
Cv1 Cv2 Cv3 Cv4 Cv5 Cv6 Cv7
Cv8 Cv9 C10 C11 C12 C13 C14
C15 C16 C17 C18 C19 C20 C21 C22 C23
Ch1 Ch2 Ch3 Ch4 Ch5 Ch6 Ch7 Ch8 Ch9 C10 C11 C12 C13 C14 C15 C16 C17 C18 C19 C20
39
47 69 47
34 66 64 31 16
35 61 67 10
21 50 61 64 52 67 53 52 48 51 60 57
31 46 62 74 76 66 70 72 68 60 31
57 70 70 60 37 15
45 53 61 70 71 46 60 61 45 24 15 15
42 45 56 55 58 53 10 11
44 53 58 51 56 51 60 20 14
33 18 32 41 52 53 32
25 34 58 33
10
3 4
20 7 4
12 10 5 2 3 8
5 4
6 5 5 2 1 3 17
6 6 3
12 6 11 15
15 20 22 3
10 5
20 13 9

27
Sup Table 4(c). Site exposure ratio measured to the hand and expressed as a percentage for the SZA
range 50o-80
o and cloud cover greater than 4 oktas measured between 2005 and 2008. ER ranges in the
table show high exposed areas in red (ER: 75-100), mid exposed areas in blue (ER:25-74) and low
exposed areas uncloured (ER: 0-25). The dorsa of the hand received the highest exposures. For this
research the mannequin hand was titlted from the arm’s longitudinal axis increasing the UV radiation
received due to the increased proportion of the hand oriented toward a horizontal plane.
Cv1 Cv2 Cv3 Cv4 Cv5 Cv6 Cv7
Cv8 Cv9 C10 C11 C12 C13 C14
C15 C16 C17 C18 C19 C20 C21 C22 C23
Ch1 Ch2 Ch3 Ch4 Ch5 Ch6 Ch7 Ch8 Ch9 C10 C11 C12 C13 C14 C15 C16 C17 C18 C19 C20
42
67 31
58 70 10
58 53 52 40 76 65
60
57 84 75 73 60 58 68 72 60 67 34
60 71 7 20
71 80 42 66 78 62 77 73 61 36
60 53
45 68 58 59 56 63 53 60 8
41 27
35 34
17
0 5
17 0
17 0 2 15
3 7 0 0
0 12 26
3 7 10 0 0
6 20
39 0 3
41 20

28
Sup Table 5(a). Site exposure ratio measured to the leg and expressed as a percentage for the SZA
range 0o-30
o and cloud cover less than 4 oktas measured between 2005 and 2008. ER ranges in the
table show high exposed areas in red (ER: 75-100), mid exposed areas in blue (ER:25-74) and low
exposed areas uncloured (ER: 0-25). No exposures were measured to contours Cv0, Cv1 or Cv2 as
these were protected by the mannequin’s shorts which were worn during the measurement period.
Cv3 Cv4 Cv5 Cv6 Cv7
Cv8 Cv9 Cv10 Cv11 Cv12 Cv13 Cv14
Cv15
Ch1 Ch2 Ch3 Ch4 Ch5 Ch6 Ch7 Ch8 Ch9 Ch10 Ch11 Ch12 Ch13 Ch14 Ch15 Ch16 Ch17 Ch18 Ch19 Ch20 Ch21 Ch22 Ch23 Ch24 Ch25 Ch26 Ch27 Ch28 Ch29 Ch30 Ch31 Ch32 Ch33
0 1 6
0 3 6 8 11 13 15 14 20 23 21 20 20
0 2 4 8 12 15 19 19 23 20 21 20 19 16 16 15 13 15
1 2 4 6 10 14 17 19 19 21 20 19 18 16 18 15 15 16 16 17 18 14 14
1 3 4 5 8 11 15 18 19 16 16 14 14 14 14 15 15 15 17 17 16 17 16 19 24 16
7 6 9 10 11 10 9 9 10 9 10 7 12 12 14 13 16 17 24
6 6 5 5
9 22
0 0 7 10 10 8 8 7 6 7 9 9 11 9 8 7 6 7 7 6 8 8 8 7 9 10 10 9
0 0 0 12 13 10 8 6 6 8 7 8 8 10 9 10 8 10 9 9 10 9 10 11 11 10 10 11 10 10
0 0 0 13 16 15 11 7 6 8 9 9 9 9 9 9 9 9 10 10 9 10 11 10 11 12 12 16 13 12
0 0 0 9 13 12 11 11 13 15 16 14 13 12 12 11 10 8 11 11 12 13 14 13 12
0 0 0 1 7 9 19 17 15 15 13 16

29
Sup Table 5(b). Site exposure ratio measured to the leg and expressed as a percentage for the SZA
range 30o-50
o and cloud cover less than 4 oktas measured between 2005 and 2008. ER ranges in the
table show high exposed areas in red (ER: 75-100), mid exposed areas in blue (ER:25-74) and low
exposed areas uncloured (ER: 0-25). No exposures were measured to contours Cv0, Cv1 or Cv2 as
these were protected by the mannequin’s shorts which were worn during the measurement period.
Cv3 Cv4 Cv5 Cv6 Cv7
Cv8 Cv9 Cv10 Cv11 Cv12 Cv13 Cv14
Cv15
Ch1 Ch2 Ch3 Ch4 Ch5 Ch6 Ch7 Ch8 Ch9 Ch10 Ch11 Ch12 Ch13 Ch14 Ch15 Ch16 Ch17 Ch18 Ch19 Ch20 Ch21 Ch22 Ch23 Ch24 Ch25 Ch26 Ch27 Ch28 Ch29 Ch30 Ch31 Ch32 Ch33
6 13 21 25
4 11 15 22 28 34 37 52 43 44 37 33 39 36
5 9 13 18 29 33 34 29 45 44 47 39 32 32 27 29 34 21 32
6 8 13 15 21 18 29 38 31 38 36 44 28 32 31 35 31 28 38 38 32 26 33 26
4 9 12 13 20 25 38 43 38 42 33 33 36 33 30 34 35 45 41 48 39 36 36 37 39 43 44
17 21 23 25 31 25 21 22 23 23 22 27 28 35 30 40 35 46 41
13 11 11 10
18 35
14 16 17 17 14 14 11 13 10 12 18 14 14 14 13 12 11 11 14 11 13 16 13 15 15 16 14 15
20 22 22 20 17 10 12 13 13 12 15 14 14 14 14 13 15 14 16 15 15 16 18 17 18 19 21 19 14
17 25 28 26 25 24 22 21 21 21 21 21 21 20 15 16 16 17 18 19 24 19 23 25 23 23 22 28 25
37 38 22 44 44 42 43 48 46 40 36 35 22 26 27 26 23 29 32 29 33 26 25
9 19 30 29 30 42 45 31 35 33 33

30
Sup Table 5(c). Site exposure ratio measured to the leg and expressed as a percentage for the SZA
range 50o-80
o and cloud cover less than 4 oktas measured between 2005 and 2008. ER ranges in the
table show high exposed areas in red (ER: 75-100), mid exposed areas in blue (ER:25-74) and low
exposed areas uncloured (ER: 0-25). No exposures were measured to contours Cv0, Cv1 or Cv2 as
these were protected by the mannequin’s shorts which were worn during the measurement period.
Cv3 Cv4 Cv5 Cv6 Cv7
Cv8 Cv9 Cv10 Cv11 Cv12 Cv13 Cv14
Cv15
Ch1 Ch2 Ch3 Ch4 Ch5 Ch6 Ch7 Ch8 Ch9 Ch10 Ch11 Ch12 Ch13 Ch14 Ch15 Ch16 Ch17 Ch18 Ch19 Ch20 Ch21 Ch22 Ch23 Ch24 Ch25 Ch26 Ch27 Ch28 Ch29 Ch30 Ch31 Ch32 Ch33
43 50
35 45 63 62 64 71 62 60 43 62
42 38 15 70 42 62 70 75 53 59 60 53 56 55 46 49
35 36 41 58 65 59 59 51 58 54 51 52 51
12 19 22 40 58 65 55 52 46 56 40 45 44 51 57 57 60 58 53 61 50
33 36
24 32 34 24 27 39
37 25 25 25 27 33 24 33
47 50 51 37 31 35 27 41 45 32 26 42 49 41 40
36 56 40 61 57 42 37 53 45
51 38 77 48 47 52

31
Supplementary Information: Figures
Sup Figure 1. Horizontal (Ch) and vertical (Cv) facial contour assignments.

32
Sup Figure 2. Horizontal (Ch) and vertical (Cv) neck contour assignments.
Sup Figure 3. View of three dimensional arm surface from behind the shoulder. Contours marked Cv1
through Cv23 are oriented along the arm’s longitudinal axis. Anterior contours Cv1, Cv5 and Cv10 are
shown. Contours marked Ch10, Ch14 and Ch20 are also shown on the diagram. These contours formed
complete bands around the arm surface and were numbered from the shoulder (figure right) to the wrist
(figure left). Vertical and horizontal contour assignments were given for the arm in its natural position
when attached to the body mannequin such that banded contours are the horizontal contours in the
wireframe.
33
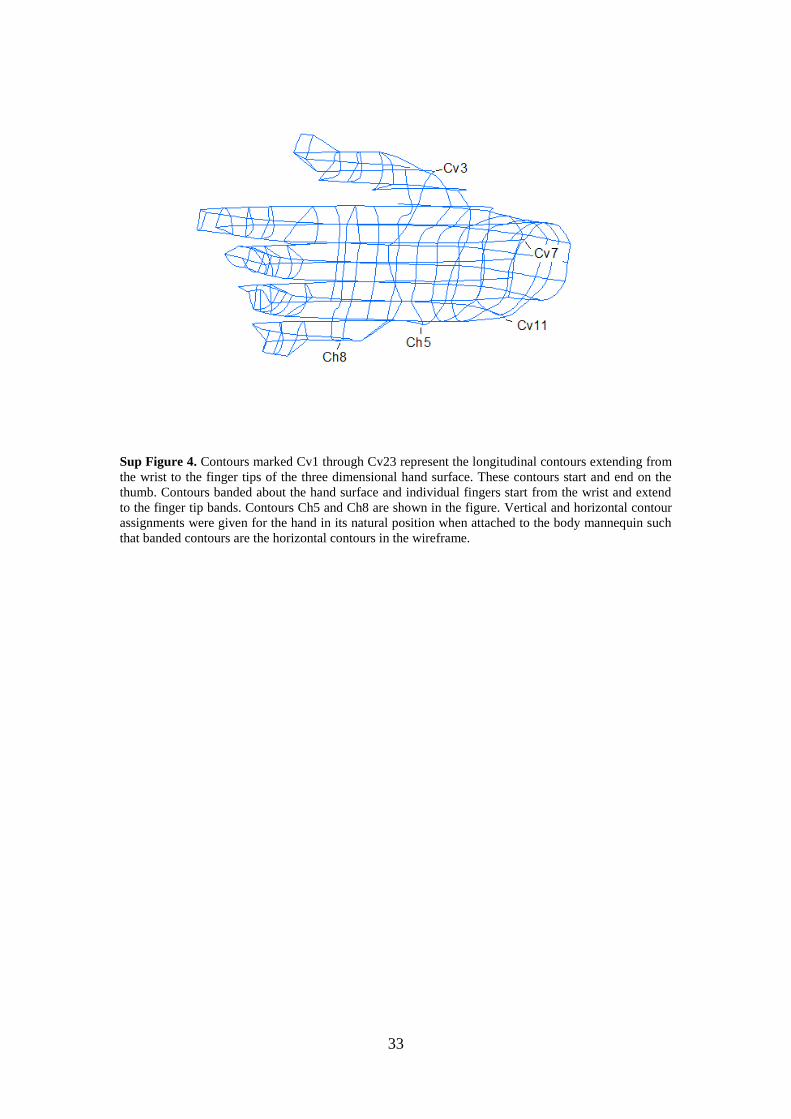
Sup Figure 4. Contours marked Cv1 through Cv23 represent the longitudinal contours extending from
the wrist to the finger tips of the three dimensional hand surface. These contours start and end on the
thumb. Contours banded about the hand surface and individual fingers start from the wrist and extend
to the finger tip bands. Contours Ch5 and Ch8 are shown in the figure. Vertical and horizontal contour
assignments were given for the hand in its natural position when attached to the body mannequin such
that banded contours are the horizontal contours in the wireframe.

34
Sup Figure 5. Longitudinal leg contours extending from the upper thigh to the ankle start at Cv0 and
end at Cv16. Contours Cv11 through Cv13 are shown in the figure for a forward facing view of the leg
model showing the knee positioned to the upper right. Banded contours Ch1, Ch10, Ch20 and Ch30
show the thigh to ankle order in which these contours were labeled.

35
Sup Figure 6. Facial ER measured under low cloud cover conditions over the 2005 to 2008 period. (a)
Facial ER measured in the SZA range 0o-30
o; (b) Facial ER measured in the SZA range 30
o-50
o; (c)
Facial ER measured in the SZA range 50o-80
o.
Sup Figure 7. ER measured to the back of the neck under low cloud cover conditions for SZA ranges
0o-30
o and 50
o-80
o and high cloud cover conditions in the SZA range 30
o-50
o measured over the 2005
to 2008 period. (a) Neck ER measured in the SZA range 0o-30
o; (b) Neck ER measured in the SZA
range 30o-50
o; (c) Neck ER measured in the SZA range 50
o-80
o. The greatest exposure was measured
on the lower region of the neck toward the shoulder.

36
Sup Figure 8. ER measured to the arm under low cloud cover conditions over the 2005 to 2008 period.
(a) Arm ER measured in the SZA range 0o-30
o; (b) Arm ER measured in the SZA range 30
o-50
o; (c)
Arm ER measured in the SZA range 50o-80
o. The anterior region of the lower forearm received the
greatest exposure. The shoulder of the mannequin arm was protected by the sleeves of a polo style
shirt.
Sup Figure 9. ER measured to the hand under low cloud cover conditions over the 2005 to 2008
period. (a) Hand ER measured in the SZA range 0o-30
o; (b) Hand ER measured in the SZA range 30
o-
50o; (c) Hand ER measured in the SZA range 50
o-80
o. The palm of the hand received negligible
exposures.

37
Sup Figure 10. ER measured to the leg under low cloud cover conditions over the 2005 to 2008
period. (a) Leg ER measured in the SZA range 0o-30
o; (b) Leg ER measured in the SZA range 30
o-50
o;
(c) Leg ER measured in the SZA range 50o-80
o. The greatest exposure was measured over the upper
anterior calf muscle region of the mannequin leg.