Embed Size (px)
Citation preview
1
Measurement, Prevalence and the Socio‐demographic Structure of
Non‐standard Employment: The Australian Case
Inga Lass and Mark Wooden
Melbourne Institute of Applied Economic and Social Research, University of Melbourne
Abstract
This paper provides an overview of the nature, measurement, prevalence, and socio‐demographic structure of non‐standard employment in Australia. Using the most recent data from the Household, Income and Labour Dynamics in Australia Survey (2001‐2015), the paper shows the heterogeneity of non‐standard employment, both with regard to job characteristics and the socio‐demographic structure of the respective workers. Yet, despite the variability across employment types, the results suggest that Australian non‐standard employment is primarily the realm of workers with reduced labour market chances and of those seeking to combine gainful employment with non‐work commitments. Furthermore, the analysis shows a relatively high degree of permeability between the different employment types, with casual employment primarily functioning as entry port into employment, and fixed‐term contracts and temporary agency work serving as bridges into standard employment.
Introduction
The principal aim of this paper is to provide insights into the nature, measurement, prevalence, and
socio‐demographic structure of non‐standard employment in Australia, where a ‘standard job’ is
defined as one where the worker is paid a wage or salary and is employed full‐time on a permanent
(or ongoing) basis.
At least three reasons render the Australian labour market a particularly interesting case. First, the
incidence of non‐standard employment is very high; according to the OECD (2015: 140), only two
OECD countries – the Netherlands and the Czech Republic – have a higher non‐standard
employment share. Second, the Australian labour market is relatively unique in both relying heavily
on casual employment, and in subjecting casual employment to a relatively high degree of
regulation. Third, OECD data suggest that Australia also has a relatively high share of involuntary
part‐time employment (OECD 2017).
This paper discusses issues regarding the definition and measurement of non‐standard employment
in Australia. Which types of employment arrangements make up the bundle of non‐standard
employment in Australia? What are their key features and how are they usually measured in official
2
statistics and surveys? How does Australia align with other countries in these respects? And what
characterises workers in the different employment types? After establishing how non‐standard
employment is to be defined and measured, the paper provides empirical evidence on: (i) the
prevalence of, and recent trends in, the overall share of non‐standard employment, as well as the
incidence of different types of non‐standard employment; (ii) the job characteristics of non‐standard
employment types; and (iii) the characteristics of workers within each non‐standard employment
type. Finally, we utilise the longitudinal nature of the key data source to examine transitions in and
out of different employment arrangements over time, thus providing evidence on whether non‐
standard employment in Australia is a long‐lasting or transitory experience.
Forms and measurement of non‐standard employment in Australia
Non‐standard employment, or what has been referred to elsewhere as “atypical work” (e.g., Addison
and Surfield 2009; Córdova 1986; Grip, Hoevenberg, and Willems 1997), “alternative work
arrangements” (e.g., Farber 1999; Polivka 1996), “precarious employment” (e.g., Rodgers 1989; Treu
1992) or “flexible employment / contracts” (e.g., Green and Heywood 2011; Guest 2004; Houseman
and Polivka 2000), is usually defined as any job that “differs from full‐time, permanent, wage and
salary employment” (Polivka and Nardone 1989: 10). This covers a very broad and disparate array of
employment arrangements, including self‐employment, part‐time work, and any job where there is
no commitment on the part of the employer to a long‐term relationship (e.g., fixed‐term contracts,
casual employment, and temporary agency work).
In Australia, as in most (if not all) other advanced industrial nations, the identification and
measurement of employment begins with the labour force framework developed by the
International Labour Organization (ILO). This framework, for example, underpins the measurement
of the labour force and its components in all of the surveys conducted by the Australian Bureau of
Statistics (ABS). In this framework, paid employment is based on the economic activity undertaken
by individuals during a one‐week reference period, with the basic prerequisite being just one hour of
paid work.1
It is then conventional to distinguish between different types of job holders based on the
relationship between the worker and the enterprise they work for; that is, between employees and
1 Persons who did not work during the reference week because they were temporarily absent (e.g., on leave) would be classified as employed. Very differently, persons who work without pay but in a family business or farm are also treated as employed.
3
the self‐employed. For consistency with national accounts data, however, and again following ILO
concepts, the ABS only treats owners of unincorporated businesses as self‐employed; owners of
incorporated businesses are treated as employees of their own business. While the legal status of a
business has implications for who is held responsible in the event of insolvency, it has no bearing on
the employment relationship – the owner of a firm is fundamentally different to other persons
employed in that firm, not least because of the power the owner has over hiring and firing decisions
and the allocation of tasks among workers. In this analysis, therefore, we treat all owner managers,
regardless of the legal status of their businesses, as self‐employed. There is a third category of
employed persons – contributing family workers – who do not fit neatly into either the employee or
self‐employed groups. Workers in this category clearly fit the definition of non‐standard
employment, but are relatively few in number.2
Within the employee group we next categorise workers into different groups according to the nature
of their employment contract. In Australia these take three main forms: (i) fixed‐term contracts; (ii)
casual employment; and (iii) permanent or ongoing contracts.3
Fixed‐term contracts are relatively straightforward to identify and cover all employment contracts
that specify a specific date or event when employment will be terminated. In Australia, fixed‐term
contracts generally come with the same entitlements as permanent contracts (e.g., with respect to
paid leave and paid holidays). Furthermore, fixed‐term contracts can usually not be terminated
before the stated expiry date.4
Far less straightforward is the identification of casual employment. While a dictionary definition
would suggest that casual employees are hired for very short periods, with each engagement of
work constituting a separate contract of employment (and indeed this is the definition most
consistent with common law; Brooks 1985), the reality is that many casual employees work regular
hours (see section on job characteristics) over very long periods (Wooden and Warren 2003).
Ultimately, the key defining feature of casual employment is the absence of any advance
commitment on the part of the employer to both the continuity of employment and the number of
days or hours to be worked (Creighton and Stewart 2010: 198). Thus it might appear difficult to
2 Less than 0.3% of the employed workforce in Australia are contributing family workers (see ABS, Labour Force, Australia, Detailed ‐ Electronic Delivery, Mar 2017 (ABS cat. no. 6291.0.55.001), Spreadsheet Table 08).
3 There is a fourth group of employees that does not fit neatly into these three categories – e.g., persons remunerated on a commission basis.
4 After passing the minimum employment period of 6 months (or 12 months in small businesses), fixed‐term contract workers have a general expectation of being employed until the accomplishment of the task or the date stated in the contract. However, early termination for reasons such as misconduct, breach of contract or poor performance is possible if the contract includes a respective clause.
4
distinguish between casual employees and permanent (or ongoing) employees given both essentially
have open‐ended employment contracts and only rarely are employment contracts truly permanent.
Casual employment in Australia, however, is the subject of extensive regulation. It is specifically
provided for in industry awards, which regulate most employer‐employee relationships in Australia.5
A feature of these awards is that casual employees are specifically singled out as not having any legal
entitlement to many forms of paid leave (notably annual leave and sick leave), paid public holidays,
minimum periods of notice of termination, or severance pay.6 At the same time, a long‐standing
feature of award regulation is the requirement of the payment of a substantial hourly wage
premium to casual workers, which helps to at least partly compensate for the loss of other benefits
(notably paid leave entitlements).7 Thus while there is no clear unambiguous definition of casual
employment that is applied in awards, most casual employees in Australia should be able to
recognise that they are employed on a casual basis. In this analysis we thus mainly rely on self‐
reported data to identify casual employees.
An alternative, and longer‐standing approach, is to infer casual employment status from survey data
on the receipt of paid annual and sick leave entitlements, with employees reporting receiving
neither paid annual leave nor paid sick leave entitlements being classified as casual workers. Use of
this approach was first suggested in an ABS publication (Australian Bureau of Statistics 1989), and
was central to the pioneering work of Dawkins and Norris (1990). While we would argue that use of
this measure was driven by the absence of any alternative data source providing a more direct
measure, it has subsequently been argued that this indirect type of measure is preferred, largely
because it is based on more objective criteria (Campbell and Burgess 2001). However, and as argued
in Wooden and Warren (2004: 281), survey data on access to leave entitlements is also subject to
reporting error. In particular, some respondents may confuse use of entitlements with access to
entitlements.
A third approach, and arguably the gold standard approach, to classifying employees by contract
type would be employer‐provided data. The ABS, for example, conducts an employer‐based Survey
of Employee Earnings and Hours on a biennial basis, and in recent years has begun collecting data on
whether the employees sampled at each selected business are employed on either a permanent /
5 Awards determine minimum pay rates and employment conditions, and are binding for all employers covered by that award – usually all employers within a specific industry group.
6 With the exception of severance pay, minimum standards for all of these employment conditions are also subject to legislated National Employment Standards (NES), and in all cases casual employment is singled out as an exception where the NES do not apply.
7 From July 2014 this premium became a standard 25% in all awards. Prior to that date there was considerable variation across awards, but with 20% widely recognised as the norm (Watson 2005).
5
fixed‐term or casual basis. Unfortunately, this data set is not very rich with only a handful of other
employee characteristics collected (sex, age, occupation, earnings and hours), fixed‐term contract
workers cannot be distinguished from permanent employees, some sectors of the workforce are
excluded (notably agriculture, forestry and fishing industries), and data on employee type are only
available since 2012.
Employees could also be classified according to whether or not they are employed through an
intermediary or agency. Such workers are generally thought of as having a non‐standard
employment relationship since the employing organisation is not the organisation for which the
labour services are performed. Given such positions are often the result of a short‐term need to
meet some temporary peak in demand or to cover absences of regular employees, many agency
workers will be employed on a fixed‐term or casual basis. Nevertheless, there is a minority of agency
workers (e.g., those with highly valuable but specialised skills) who are employed on an ongoing
contract with the agency. We also treat these workers as being in non‐standard jobs due to the
peculiar, tripartite nature of the employer‐employee relationship.
The final dimension we use to identify non‐standard employees is usual hours of work. That is,
among employees working on a permanent or ongoing basis we distinguish between full‐time and
part‐time workers. There is, however, no internationally accepted uniform definition of part‐time
work. Definitions used by official national statistics agencies, for example, vary in terms of the
weekly hours threshold (30 or 35 hours), whether usual or actual hours are used (or a combination
of both), and whether the hours cover all jobs or just the main job (Bastelaer, Lemaître, and
Marianna 1997). In Australia, for example, the ABS in its monthly Labour Force Survey defines part‐
time workers as employed persons “who usually worked less than 35 hours a week (in all jobs) and
either did so during the reference week, or were not at work in the reference week” (e.g., ABS 2017:
40). The reference to hours worked in all jobs, however, is problematic for identifying workers in
standard and non‐standard employment. Most obviously, there are persons holding multiple part‐
time jobs who will be classified as full‐time workers, and hence as being in standard employment,
when none of the jobs they hold meet the full‐time criterion. Further, use of a 35‐hour threshold is
arguably problematic for distinguishing between standard and non‐standard jobs given that the
standard full‐time work week norm in Australia, as specified in awards, is not much greater than this
– 38 hours. Indeed, in the National Employment Standards8, a 38‐hour week is defined as the
8 The National Employment Standards comprise ten minimum terms and conditions of employment in areas such as working hours, paid leave and termination. These standards apply to all workers in Australia, regardless of provisions in awards and enterprise agreements.
6
maximum weekly hours worked for a full‐time employee.9 We thus follow the preferred definition of
the OECD, and define a part‐time worker as any employed person who usually works less than 30
hours per week in their main job.10
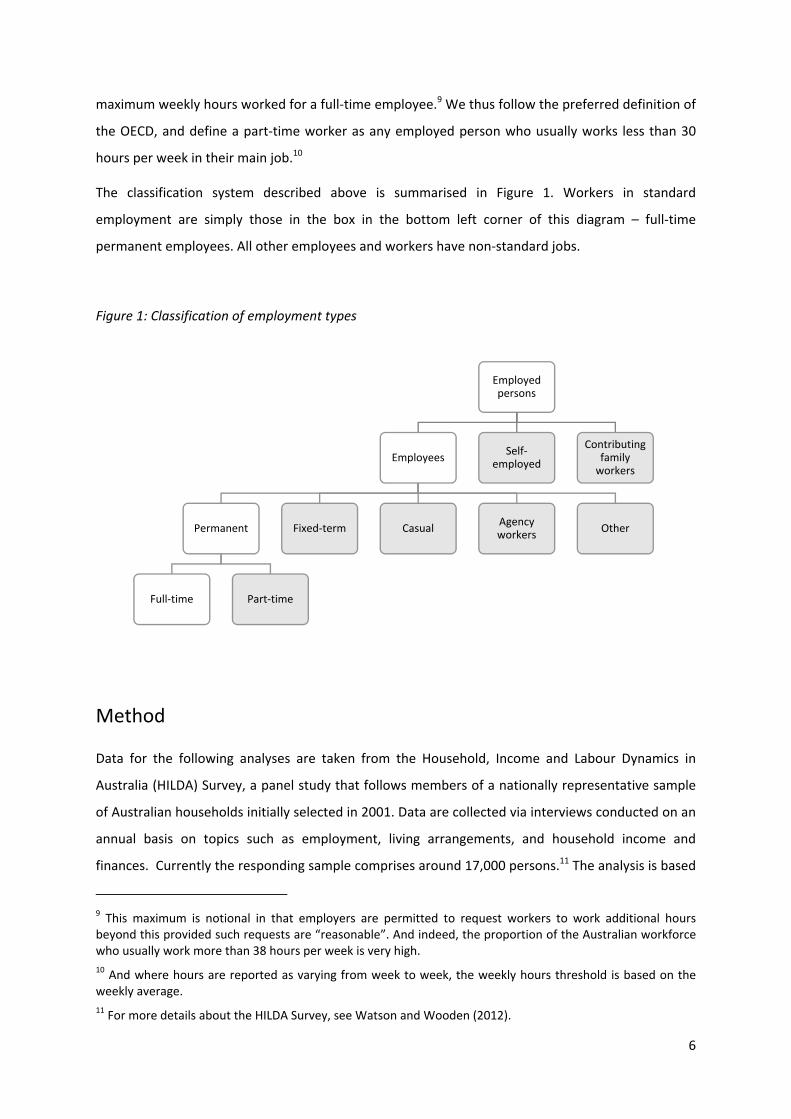
The classification system described above is summarised in Figure 1. Workers in standard
employment are simply those in the box in the bottom left corner of this diagram – full‐time
permanent employees. All other employees and workers have non‐standard jobs.
Figure 1: Classification of employment types
Method
Data for the following analyses are taken from the Household, Income and Labour Dynamics in
Australia (HILDA) Survey, a panel study that follows members of a nationally representative sample
of Australian households initially selected in 2001. Data are collected via interviews conducted on an
annual basis on topics such as employment, living arrangements, and household income and
finances. Currently the responding sample comprises around 17,000 persons.11 The analysis is based
9 This maximum is notional in that employers are permitted to request workers to work additional hours beyond this provided such requests are “reasonable”. And indeed, the proportion of the Australian workforce who usually work more than 38 hours per week is very high.
10 And where hours are reported as varying from week to week, the weekly hours threshold is based on the weekly average.
11 For more details about the HILDA Survey, see Watson and Wooden (2012).
Employed persons
Employees
Permanent
Full‐time Part‐time
Fixed‐term CasualAgency workers
Other
Self‐employed
Contributing family workers
7
on the first fifteen waves of data (2001 to 2015) and, reflecting the composition of the sample
interviewed, uses a sample of persons aged 15 years or older. In order to provide a full picture of
Australian labour market dynamics, including the employment behaviour of older workers, we do
not impose an upper age limit on our sample.
In a first step, we provide descriptive information on the changing prevalence of different
employment arrangements in Australia since the turn of the millennium. In a second and third step,
we describe and compare the job characteristics of the different employment types and the socio‐
demographic characteristics of the respective workers. In a final step, we look at labour market
dynamics by analysing the extent of transitions into and out of employment types.
As explained in the previous section, six different employment types are at the core of our analysis:
standard employment, permanent part‐time work, casual work, fixed‐term contracts, temporary
agency work, and self‐employment. We define standard employment as full‐time employment on a
permanent contract without the involvement of a temporary employment agency. In this context,
and in line with the OECD’s preferred specification, we define full‐time employment as 30 or more
usual weekly working hours in the main job.12 The permanency of the contract is derived from a
question asking respondents to choose from three different types of employment contracts: fixed‐
term, casual or permanent. As a fourth option, respondents can also state that they are employed
on “other” types of contract, with these cases assigned to a separate employment category “other”
(unless the respondents reported to work for a temporary employment agency, in which case they
are counted as agency workers). A separate question measures whether the respondents are
employed through a labour‐hire firm or temporary employment agency. Due to the relatively low
number of temporary agency workers, we group all agency workers into one category, regardless of
their type of contract or working hours. We create another category for self‐employment, which
comprises own account workers and the self‐employed. Unpaid family workers, in contrast, are
assigned to the “other” employment category.
In some analyses (e.g., of labour market transitions), we also include other labour market states (i.e.,
unemployment and being out of the labour force/economic inactivity). These labour force states are
based on the concepts recommended by the International Labour Organization. Within the group of
persons out of the labour force, we differentiate between persons who are retired and those who
are economically inactive for other reasons.
12 As we distinguish between standard workers and permanent part‐time workers, we have to discard observations from permanent workers with missing information on usual working hours in the main job (58 cases).
8
Trends in Non‐standard Employment in Australia
This section provides an overview of the changing prevalence of different employment
arrangements in Australia since the turn of the millennium. Based on weighted data from the HILDA
Survey, only around 48% of Australian workers were in a standard employment relationship in 2015
(see also Figure 1 below). Almost one in five workers (19%) was in casual employment, rendering
this the most prevalent form of non‐standard employment. The second most prevalent form was
self‐employment, with 14% of the workforce, followed by permanent part‐time work (9%)13, fixed‐
term contract employment (8%), and temporary agency work (2%). Only 0.6% of workers have
another type of employment arrangement.
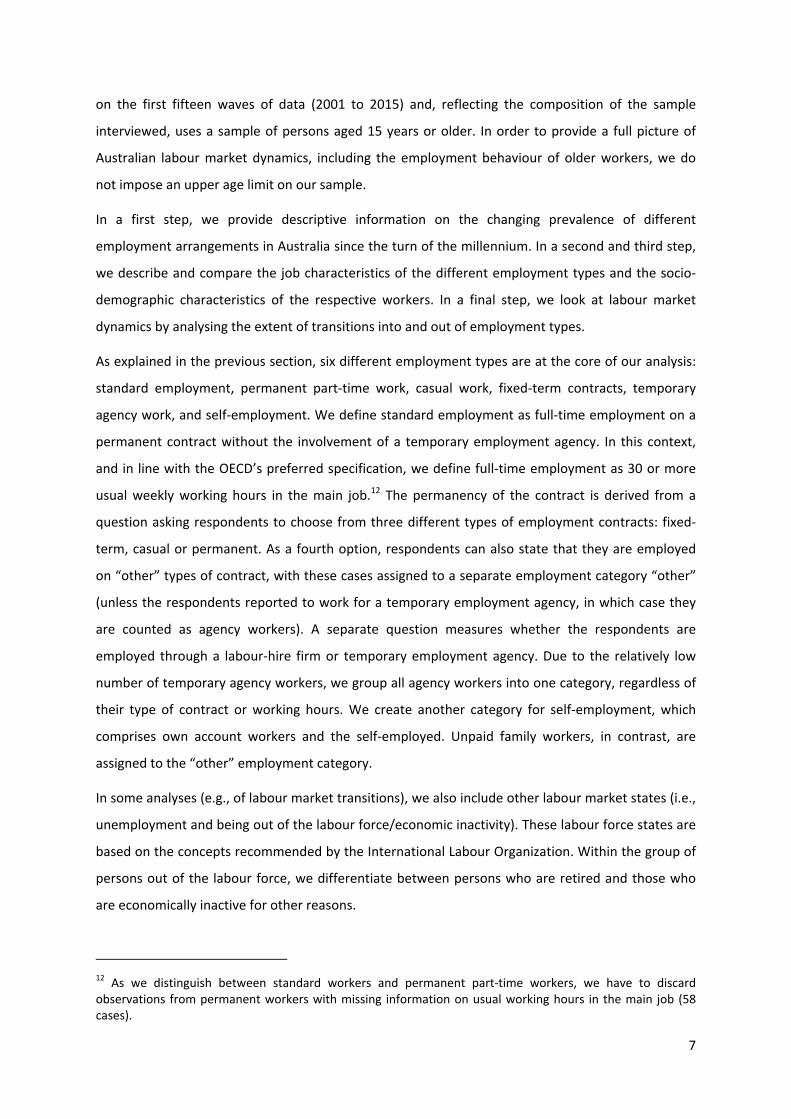
As mentioned, there are different ways of identifying casual contracts, which raises the question of
how sensitive the share of casual employment is to the measure and data source used. In this
context, Table 1 compares the prevalence of casual employment as a share of employees (i.e.,
excluding the self‐employed) according to the HILDA Survey and two ABS surveys. We can see that
the estimated share of casual employment does vary with both the measure used and the specific
survey. According to the HILDA Survey, the share of self‐classified casual employees was 23% in
2015, whereas the share of casuals when defined as workers without access to paid leave is
considerably higher (26%). The figures from the ABS Household Survey lie between the two HILDA
Survey figures, but the overall pattern – that there are more workers without access to paid leave
than there are workers who identify as casuals – is reflected here as well. The ABS employer survey
reports the lowest share of casuals (22% in 2014), which is surprising considering the share relates to
all jobs instead of just the main job (with casual jobs expected to be very prevalent among second
jobs). One explanation for this discrepancy might be the exclusion of the agricultural sector, in which
many casuals are employed, from this survey.
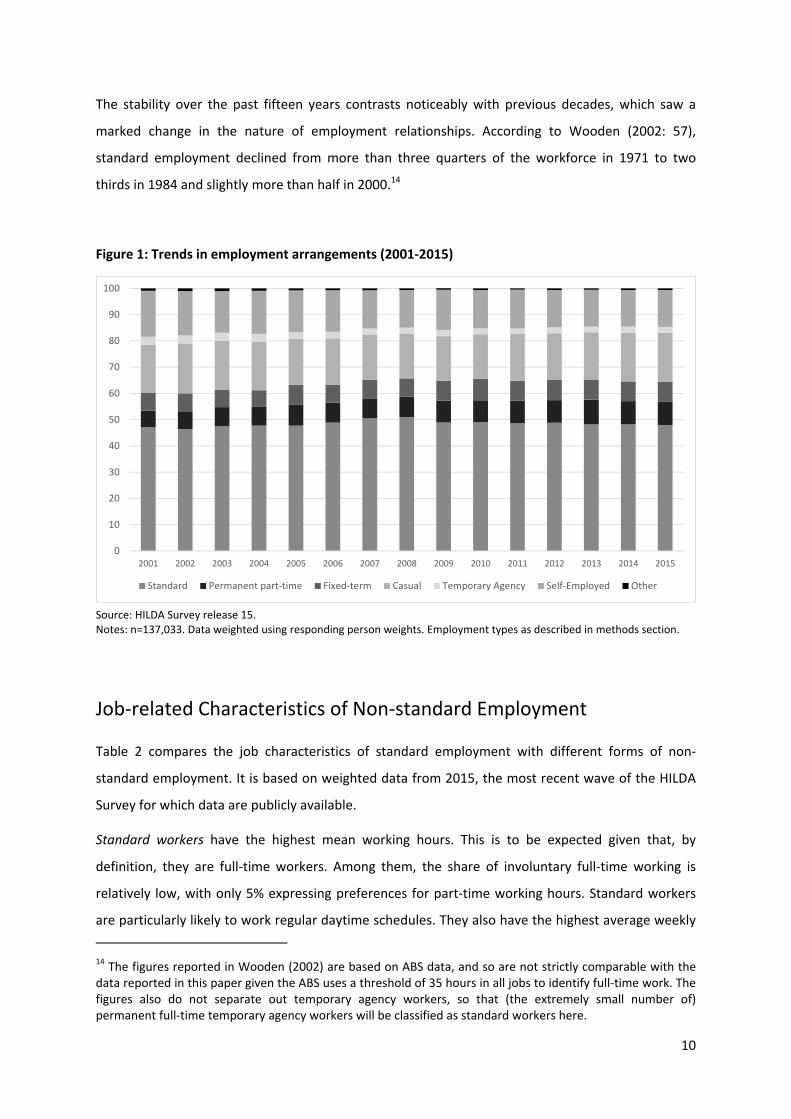
Figure 1 shows how the share of non‐standard employment and its composition by employment
type has evolved since the beginning of the millennium, again based on weighted data from the
HILDA Survey (release 15). In contrast to many other industrialised countries, the overall share of
non‐standard employment has remained rather stable during the past fifteen years in Australia,
hovering around 47 to 51%. The same is true for the share of most individual forms of non‐standard
employment. Only the share of permanent part‐time work has been increasing over this period
(from less than 6% in 2001 to 9% in 2015). The share of self‐employment, in contrast, has decreased
(from 18% in 2001 to 14% in 2015).
13 Using 35 instead of 30 weekly working hours as the threshold for full‐time work results in a considerably larger percentage of permanent part‐time workers (13%) and a smaller percentage of standard workers (44%).
9
Table 1: Estimates of casual employees as a proportion of all employees (excluding owner managers)
ABS employer survey
21.6
22.6
Employer classified
Employer
All jobs
May
Agriculture, forestry and
fishing
Permanen
t defen
ce forces
Private households
employing staff
ABS, Employee Earnings
and Hours, A
ustralia, M
ay
2014 (ABS cat. no. 6306.0).
63060DO001_201405:
Table 3.
ABS household survey
23.5
Self‐
classi‐
fied
Any responsible adult
Main job
August
ABS, Characteristics of Em
ploym
ent,
Australia (ABS cat. no. 6330.0).
24.1
24.3
25.1
No entitlements to paid
sick leave or paid annual
leave; Don’t know
responses treated
as no.
HILDA Survey
23.1
23.1
Self‐
classi‐
fied
Employee
Main job
Mainly August‐Decem
ber
HILDA Survey Release 15,
confiden
tialised
unit record data
file.
26.2
26.6
No entitlements to paid
sick leave or paid annual
leave; Don’t know
responses treated
as no.
Casual share (%
) 2014
Casual share (%
) 2015
Casual share (%
) 2016
Definition
Respondent
Coverage
Timing
Notable exclusions
Source
10
The stability over the past fifteen years contrasts noticeably with previous decades, which saw a
marked change in the nature of employment relationships. According to Wooden (2002: 57),
standard employment declined from more than three quarters of the workforce in 1971 to two
thirds in 1984 and slightly more than half in 2000.14
Figure 1: Trends in employment arrangements (2001‐2015)
Source: HILDA Survey release 15. Notes: n=137,033. Data weighted using responding person weights. Employment types as described in methods section.
Job‐related Characteristics of Non‐standard Employment
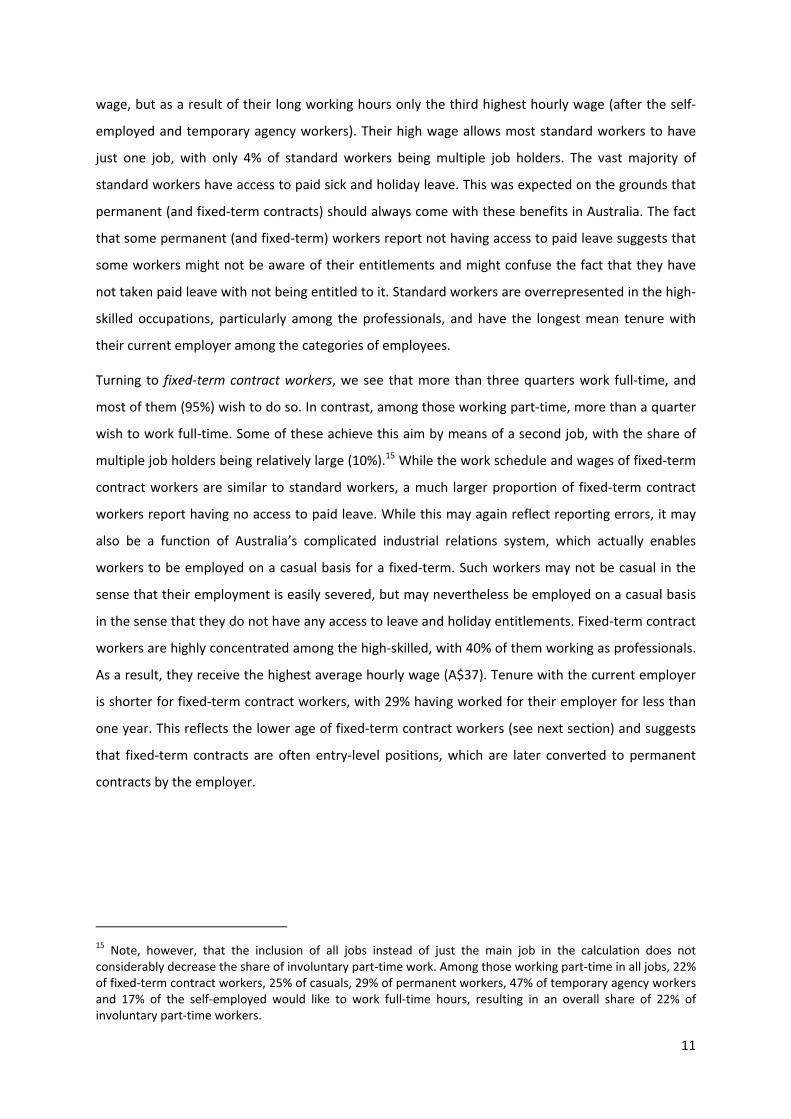
Table 2 compares the job characteristics of standard employment with different forms of non‐
standard employment. It is based on weighted data from 2015, the most recent wave of the HILDA
Survey for which data are publicly available.
Standard workers have the highest mean working hours. This is to be expected given that, by
definition, they are full‐time workers. Among them, the share of involuntary full‐time working is
relatively low, with only 5% expressing preferences for part‐time working hours. Standard workers
are particularly likely to work regular daytime schedules. They also have the highest average weekly
14 The figures reported in Wooden (2002) are based on ABS data, and so are not strictly comparable with the data reported in this paper given the ABS uses a threshold of 35 hours in all jobs to identify full‐time work. The figures also do not separate out temporary agency workers, so that (the extremely small number of) permanent full‐time temporary agency workers will be classified as standard workers here.
0
10
20
30
40
50
60
70
80
90
100
2001 2002 2003 2004 2005 2006 2007 2008 2009 2010 2011 2012 2013 2014 2015
Standard Permanent part‐time Fixed‐term Casual Temporary Agency Self‐Employed Other
11
wage, but as a result of their long working hours only the third highest hourly wage (after the self‐
employed and temporary agency workers). Their high wage allows most standard workers to have
just one job, with only 4% of standard workers being multiple job holders. The vast majority of
standard workers have access to paid sick and holiday leave. This was expected on the grounds that
permanent (and fixed‐term contracts) should always come with these benefits in Australia. The fact
that some permanent (and fixed‐term) workers report not having access to paid leave suggests that
some workers might not be aware of their entitlements and might confuse the fact that they have
not taken paid leave with not being entitled to it. Standard workers are overrepresented in the high‐
skilled occupations, particularly among the professionals, and have the longest mean tenure with
their current employer among the categories of employees.
Turning to fixed‐term contract workers, we see that more than three quarters work full‐time, and
most of them (95%) wish to do so. In contrast, among those working part‐time, more than a quarter
wish to work full‐time. Some of these achieve this aim by means of a second job, with the share of
multiple job holders being relatively large (10%).15 While the work schedule and wages of fixed‐term
contract workers are similar to standard workers, a much larger proportion of fixed‐term contract
workers report having no access to paid leave. While this may again reflect reporting errors, it may
also be a function of Australia’s complicated industrial relations system, which actually enables
workers to be employed on a casual basis for a fixed‐term. Such workers may not be casual in the
sense that their employment is easily severed, but may nevertheless be employed on a casual basis
in the sense that they do not have any access to leave and holiday entitlements. Fixed‐term contract
workers are highly concentrated among the high‐skilled, with 40% of them working as professionals.
As a result, they receive the highest average hourly wage (A$37). Tenure with the current employer
is shorter for fixed‐term contract workers, with 29% having worked for their employer for less than
one year. This reflects the lower age of fixed‐term contract workers (see next section) and suggests
that fixed‐term contracts are often entry‐level positions, which are later converted to permanent
contracts by the employer.
15 Note, however, that the inclusion of all jobs instead of just the main job in the calculation does not considerably decrease the share of involuntary part‐time work. Among those working part‐time in all jobs, 22% of fixed‐term contract workers, 25% of casuals, 29% of permanent workers, 47% of temporary agency workers and 17% of the self‐employed would like to work full‐time hours, resulting in an overall share of 22% of involuntary part‐time workers.
12
Table 2: Job‐related characteristics of non‐standard employment in % (2015)
STD FIX CAS PPT TA SE Total
Usual working hours (main job) Full‐time 100.0 78.7 26.6 0.0 76.3 73.8 71.5Voluntary 94.6 95.0 93.8 n.a. 95.8 93.3 94.4Involuntarya 5.4 5.0 6.2 n.a. (4.2) 6.7 5.6
Part‐time 0.0 21.4 73.4 100.0 23.7 26.2 28.5Voluntary n.a. 73.2 72.2 74.6 48.1 78.6 73.4Involuntary n.a. 26.8 27.8 25.4 52.0 21.5 26.6
Mean hours worked 42.3 37.5 20.7 19.8 35.9 38.1 35.2Current work schedule Regular daytime 81.6 82.4 60.4 69.9 79.4 68.2 74.7Regular evening/night 3.0 2.7 12.1 11.2 (1.9) 1.5 5.1Other schedulesb 15.4 15.0 27.5 19.0 18.7 30.4 20.2
Multiple jobs 4.4 9.5 12.4 14.9 9.1 8.4 7.9Wages Mean weekly wage (A$) c 1498 1357 510 601 1368 1408 1191Mean hourly wage (A$) c 35.2 36.9 24.8 30.4 36.3 41.8 33.2
Entitled to paid holiday/sick leave 97.8 87.3 4.6 90.0 19.3 n.a. 73.6d
Occupation Managers 15.7 10.5 2.0 4.0 (4.6) 29.0 13.3Professionals 27.2 40.3 9.1 24.8 21.6 22.6 23.8Technicians and trades 13.8 10.6 6.3 4.8 14.8 21.2 12.4Community and person. serv. 8.8 11.0 25.9 20.4 11.1 5.0 12.7Clerical and administrative 15.9 13.0 8.4 17.5 16.0 7.2 13.2Sales workers 5.4 8.5 21.1 15.0 (2.2) 2.5 8.9Machinery operators 7.8 2.9 8.0 (1.7) 12.4 4.0 6.5Labourers 5.5 3.2 19.3 11.7 17.5 8.7 9.2
Tenure with employer < 1 year 13.7 28.7 40.4 13.2 58.7 11.3 20.51 year 7.7 9.5 14.0 7.2 13.8 6.7 9.02‐4 years 25.3 28.5 28.6 27.2 14.6 17.2 25.05‐9 years 24.5 18.5 10.6 23.9 8.5 18.1 20.110‐14 years 12.3 7.2 3.4 12.4 (2.8) 13.8 10.215‐19 years 6.2 3.2 1.4 8.3 (0.8) 10.7 5.8
20 years or more 10.4 4.5 1.7 7.8 (0.7) 22.4 9.5Mean tenure (years) 7.8 4.9 2.8 7.3 1.9 11.7 6.8
n (unweighted) 5,342 839 2,003 981 214 1,574 10,953
Notes: STD: Standard employment; FIX: Fixed‐term contract employment; CAS: Casual employment; PPT: Permanent part‐time employment; TA: Temporary agency work; SE: Self‐employment. Data weighted using responding person weights. Values in brackets are estimates based on fewer than 20 cases. a Involuntary full‐time (part‐time) work defined as full‐time (part‐time) workers wanting to work part‐time (full‐time). While the current working hours relate to the main job, the working‐hours preferences relate to total working hours. b Other schedules comprise rotating shifts, split shifts, on call, irregular schedules and other schedules. c Calculation only includes workers with positive, non‐zero values on wages. Note that many self‐employed receive business income instead of wages or salaries or a combination of both. d Denominator excludes self‐employed.
13
The job characteristics of casual workers contrast starkly with those of standard workers. The vast
majority of casuals work part‐time, and among this group we see the largest share of involuntary
part‐time workers (28%). A sizeable minority of casuals (12%) obtain more hours by means of
another job. Casuals are also the least likely to work on a regular daytime schedule, suggesting these
workers are often used by employers to cover demands for labour at marginal times (evening/night)
as well as meeting more irregular demands. Despite being entitled to a pay loading, as described
above, casual employees not only have the lowest average weekly wage but also the lowest average
hourly wage. In large part this is a consequence of the low skill level of both the casual workers (see
next section) and the casual jobs: Casual employees are considerably overrepresented among sales
workers and labourers, where more than 40% of all casuals are concentrated. As was expected,
casual workers also differ from the other groups in terms of entitlements to paid holiday and paid
sick leave, with 95% of casual workers reporting not having access to paid leave. In line with the
short‐term nature of most casual contracts, casual employees have particularly short average job
tenures (2.8 years). In fact, 40% have worked for their employer for less than a year. Nevertheless, a
sizeable share of casuals (17%) report working for their current employer for five years or more.
Such evidence is consistent with arguments that a casual contract does not necessarily preclude a
long‐term employment relationship.
Permanent part‐time employees work part‐time hours by definition, resulting in the lowest average
weekly working hours of all groups considered here (20 hours). However, involuntary part‐time work
is relatively prevalent among this group, with a quarter of permanent part‐time workers wishing to
work full‐time hours. This results in permanent part‐time workers having the highest share of
multiple job holding (15%). Even though mean working hours are lower for permanent part‐time
workers than for casuals, both the weekly and the hourly wage are higher, suggesting that
permanent part‐time workers are both more highly qualified and take up more skilled jobs than
casuals. Indeed, professionals make up one quarter of the permanent part‐time workforce. This type
of employment is also very prevalent among community and personal services workers as well as
clerical and administrative workers. Like casual employees, permanent part‐time workers are
relatively more likely to be working shifts at the margin (evening/night) and more irregular work
schedules. Nevertheless, they are still more likely than casuals to be working a regular daytime shift.
Tenure with the current employer is relatively long and similar to that of standard workers,
suggesting that permanent contracts in general are primarily a feature of long‐serving employees.
Temporary agency workers mainly work full‐time, with the vast majority also wishing to do so. Yet,
among the part‐time workers, more than half wish to work full‐time. Agency workers relatively often
have regular daytime schedules, but many are also on other, more irregular or unusual schedules.
14
The weekly as well as hourly wages of temporary agency workers are relatively high, even though
agency workers are not particularly overrepresented among high‐skilled occupations. Indeed, a
relatively large share of agency workers works as labourers. While wages are relatively high, a
considerable proportion of agency workers (19%) do not have access to paid holiday or sick leave.
This reflects the fact that many agency workers are employed on casual contracts.16 Agency workers
have the shortest tenure of all groups, with 59% having worked for their employer for less than one
year.17
Among the self‐employed, who are mainly working full‐time, we find the second highest mean
working hours and the largest share of involuntary full‐time workers. Yet, there is also a relatively
large share of involuntary part‐time workers (22%). Self‐employed workers most frequently work on
other schedules than regular daytime, evening or night schedules. The self‐employed have the
highest average hourly wage, although it has to be noted that this only refers to the self‐employed
who receive a wage at all (as opposed to the majority of the self‐employed who receive business
income only). The high wage matches the fact that most self‐employed are found in the most skilled
occupational groups of managers, professionals, and technicians and trades workers. Most of the
self‐employed run long‐established businesses, with the reported mean job tenure being almost 12
years, and with only 11% having started their businesses within the past year.
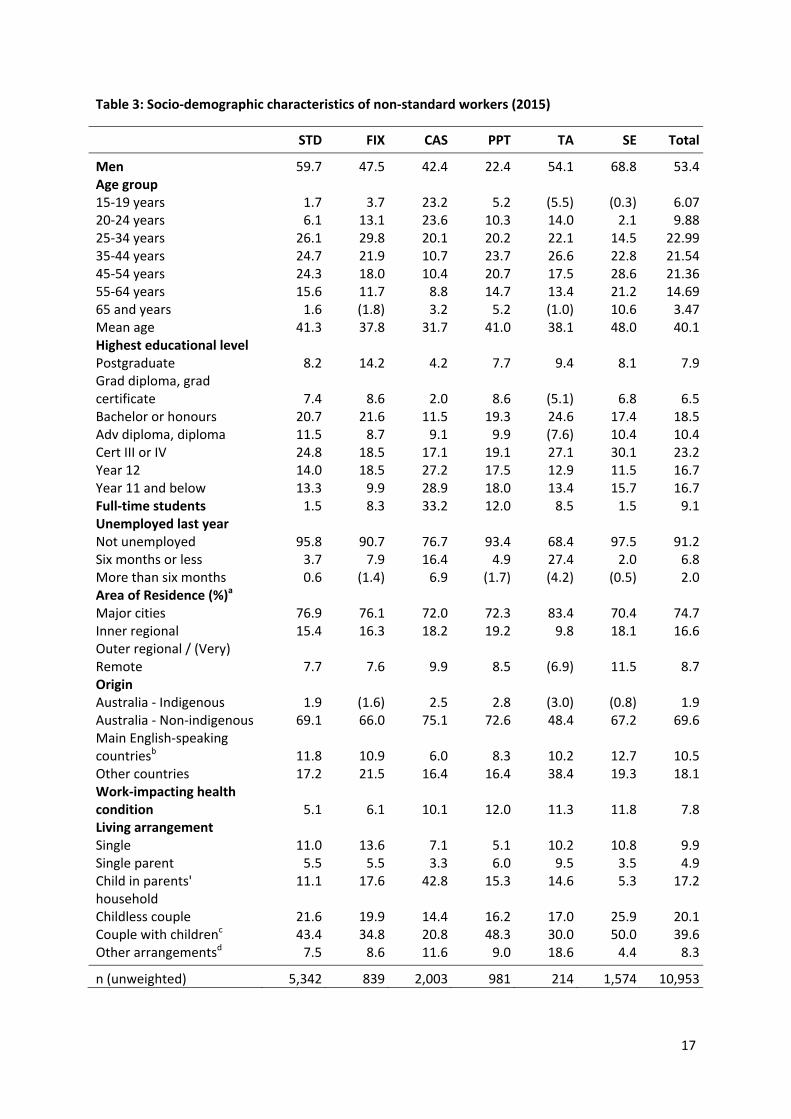
Socio‐demographic Structure of Non‐standard Workers
We now move on to look at the structural composition of workers in different employment
arrangements. In this context, Table 3 provides an overview of the different characteristics of
workers in each of the six employment types, again using weighted data from the 2015 round of the
HILDA Survey.
Looking at standard employment, we see that workers in this employment type are more likely to be
male and middle‐aged. Almost all of them (98%) have already left full‐time studies, and the vast
majority (96%) have not experienced a period of unemployment within the past year. The average
standard worker also appears to be relatively healthy, with only 5% having a work‐impacting health
16 In 2015, 49% of temporary agency workers in HILDA were on casual contracts, compared with 31% on fixed‐term and 19% on permanent contracts.
17 A complication arises from the tripartite relationship between temporary employment agency, host company and agency worker. Tenure with the current employer is obtained in the HILDA Survey by asking the following question: “And how long have you worked for your current employer?” Some agency workers might have given the time they have worked for the host company instead of the temporary employment agency (their actual employer), resulting in an understatement of tenure for temporary agency workers.
15
condition, compared to a workforce average of 8%. Standard workers more often than average live
together with a partner and children (43%), and this share is particularly large among male standard
workers (48% for men compared to 36% for women). This together with the particularly long
working hours of standard workers (see previous section) suggests that standard employment is
often found in the context of a gendered division of labour, where men, as breadwinners, focus on
full‐time employment and their partners shoulder more of the responsibility for housework and
childcare.
Women are overrepresented among fixed‐term contract workers, with 52% being female, compared
to 47% of the general workforce. This type of workers are also younger on average than standard
workers, with 30% of them concentrated in the 25‐ to 34‐year age group, suggesting that fixed‐term
contracts are often entry ports into employment, after which workers move on to a permanent
contract with the same or a different employer. Workers in this employment type are often highly
educated, which matches the fact that many of them work as professionals (see section above). The
high‐skill profile of fixed‐term contract jobs might also explain the relatively high prevalence of
persons born in non‐main English‐speaking countries in this form of employment: As a result of
Australia’s focus on skilled migration, this group of migrants is generally more highly qualified than
both Australian‐born workers and migrants from main English‐speaking countries.18 Fixed‐term
contract workers are furthermore overrepresented among those living in single‐person households
and underrepresented among couples with children, reflecting their lower age.
With regard to casual employment, the most striking difference with standard employment and all
other employment types is the workers’ relatively young age, with almost half of all casual
employees (47%) being younger than 25 years. Accordingly, they are also more likely to have a low
level of completed education, with one third of them still studying full‐time. Casual jobs are,
therefore, often used to wrap gainful employment around students’ timetables. Casual workers have
a relatively high female share of 57%, which reflects the high prevalence of casual employment in
female‐dominated occupations, especially community and personal service workers and sales
workers (see also previous sections) as well as the fact that women are generally more likely than
men to be working and studying full‐time simultaneously. As a consequence of their young age,
educational participation and low income, casuals are particularly likely to live with their parents
(43%) or in other arrangements (12%). Casuals are slightly more likely than other employees to be
18 This is partly due to special immigration regulations for workers from main English‐Speaking countries. For example, New Zealanders, who are the second largest group of main English‐Speaking migrants, have the right to work and live in Australia without the need to apply for a visa, resulting in a relatively low average educational level of New Zealand‐born migrants.
16
found outside the Major Cities (where they primarily work in agriculture, food services, construction
and transport). They furthermore have the highest share of non‐indigenous Australian‐born workers
(75%), which at least partly reflects the fact that, first, Australian‐born workers are overrepresented
among the youngest age group where a large share of casuals are found and, second, that casual
work is overwhelmingly part‐time (see previous section) and part‐time working hours are generally
less common among the overseas‐born groups. Casual employees are also relatively likely to have a
work‐limiting health condition, and many have experienced unemployment within the past year. A
considerable share (7%) have even spent more than half of the time unemployed in the past year.
These results suggest that casual jobs are often filled by workers with limited labour market chances.
Among the permanent part‐time workers, we see the lowest share of men of all employment types
considered (22%). In terms of living arrangements, this group of workers are very likely to live with
their partner and children (49%) and the least likely to live by themselves. These results reflect the
fact that part‐time work is often utilised (by women) to reconcile work and family commitments.
Permanent part‐time workers are also relatively likely to pursue full‐time studies, albeit the share is
well below that of casuals. Work‐impacting health conditions are relatively frequent among
permanent part‐time workers, most likely preventing some of them from working full‐time hours.
Like standard workers, most temporary agency workers are male, which can be attributed to their
high prevalence in male‐dominated industries such as Manufacturing and Construction. Agency
workers are furthermore clustered in the medium age range between 20 and 44 years. Overall, the
workers’ characteristics suggest a concentration of workers with reduced labour market chances
and/or reduced availability for the labour market in this employment type: Despite a relatively high
educational level (25% have a bachelor’s or honours degree and 9% a postgraduate qualification), a
particularly large share of agency workers (32%) has a recent history of unemployment, though
usually short‐lived. Agency workers are also more likely to be of indigenous origin (3%) or born in a
non‐main English‐speaking country (38%). Furthermore, they more often have a work‐limiting health
condition than standard workers. Agency workers often live without a partner; indeed, they have the
highest share of single parents (10%) and of those living in other arrangements (19%). Both the
health conditions and the single parenting suggest limited time availability and/or a higher need of
flexible schedules. Unlike all the other forms of non‐standard employment, temporary agency
workers are more likely to be found in the Major Cities (83%), possibly because most temporary
employment agencies are located in urban areas.
17
Table 3: Socio‐demographic characteristics of non‐standard workers (2015)
STD FIX CAS PPT TA SE Total
Men 59.7 47.5 42.4 22.4 54.1 68.8 53.4Age group 15‐19 years 1.7 3.7 23.2 5.2 (5.5) (0.3) 6.0720‐24 years 6.1 13.1 23.6 10.3 14.0 2.1 9.8825‐34 years 26.1 29.8 20.1 20.2 22.1 14.5 22.9935‐44 years 24.7 21.9 10.7 23.7 26.6 22.8 21.5445‐54 years 24.3 18.0 10.4 20.7 17.5 28.6 21.3655‐64 years 15.6 11.7 8.8 14.7 13.4 21.2 14.6965 and years 1.6 (1.8) 3.2 5.2 (1.0) 10.6 3.47Mean age 41.3 37.8 31.7 41.0 38.1 48.0 40.1Highest educational level Postgraduate 8.2 14.2 4.2 7.7 9.4 8.1 7.9Grad diploma, grad certificate 7.4 8.6 2.0 8.6 (5.1) 6.8 6.5Bachelor or honours 20.7 21.6 11.5 19.3 24.6 17.4 18.5Adv diploma, diploma 11.5 8.7 9.1 9.9 (7.6) 10.4 10.4Cert III or IV 24.8 18.5 17.1 19.1 27.1 30.1 23.2Year 12 14.0 18.5 27.2 17.5 12.9 11.5 16.7Year 11 and below 13.3 9.9 28.9 18.0 13.4 15.7 16.7Full‐time students 1.5 8.3 33.2 12.0 8.5 1.5 9.1Unemployed last year Not unemployed 95.8 90.7 76.7 93.4 68.4 97.5 91.2Six months or less 3.7 7.9 16.4 4.9 27.4 2.0 6.8More than six months 0.6 (1.4) 6.9 (1.7) (4.2) (0.5) 2.0Area of Residence (%)a Major cities 76.9 76.1 72.0 72.3 83.4 70.4 74.7Inner regional 15.4 16.3 18.2 19.2 9.8 18.1 16.6Outer regional / (Very) Remote 7.7 7.6 9.9 8.5 (6.9) 11.5 8.7Origin Australia ‐ Indigenous 1.9 (1.6) 2.5 2.8 (3.0) (0.8) 1.9Australia ‐ Non‐indigenous 69.1 66.0 75.1 72.6 48.4 67.2 69.6Main English‐speaking countriesb 11.8 10.9 6.0 8.3 10.2 12.7 10.5Other countries 17.2 21.5 16.4 16.4 38.4 19.3 18.1Work‐impacting health condition 5.1 6.1 10.1 12.0 11.3 11.8 7.8Living arrangement Single 11.0 13.6 7.1 5.1 10.2 10.8 9.9Single parent 5.5 5.5 3.3 6.0 9.5 3.5 4.9Child in parents' household
11.1 17.6 42.8 15.3 14.6 5.3 17.2
Childless couple 21.6 19.9 14.4 16.2 17.0 25.9 20.1Couple with childrenc 43.4 34.8 20.8 48.3 30.0 50.0 39.6Other arrangementsd 7.5 8.6 11.6 9.0 18.6 4.4 8.3
n (unweighted) 5,342 839 2,003 981 214 1,574 10,953
18
Notes: STD: Standard employment; FIX: Fixed‐term contract employment; CAS: Casual employment; PPT: Permanent part‐time employment; TA: Temporary agency work; SE: Self‐employment. Data weighted using cross‐sectional responding person weights. Values in brackets are estimates based on fewer than 20 cases. a Area of residence is based on the 2011 Australian Statistical Geography Standard (ASGS) Remoteness Structure. Major Cities comprise Sydney, Melbourne, Brisbane, Perth, Adelaide, Newcastle, Wollongong, Geelong, the central coast area of New South Wales as well as the Gold Coast and Sunshine Coast areas in Queensland. b The main English‐speaking countries comprise Canada, Ireland, New Zealand, South Africa, UK and USA. c All own children in the household are included, regardless of age or economic dependency. d Other arrangements comprise multi‐group households, multigenerational households, and persons living with distant relatives (i.e., not their partner, parents or children).
Finally, the self‐employed differ in many respects from standard workers and all other types of
employees. Like standard workers, the majority is male; yet the gender bias is much more
pronounced among the self‐employed (69%). Self‐employed workers are concentrated in the higher
age groups, starting from 35 years on, resulting in the highest average age among all employment
types (48 years). In terms of educational level, self‐employed workers often have a trade
qualification in the form of certificate III or IV (30%), which matches the relatively high prevalence of
self‐employed workers in technicians and trades occupations. The vast majority of self‐employed
workers have no recent unemployment history (98%), which matches the fact that many have run
their businesses for many years (see previous section). They are particularly likely to live outside the
Major Cities, where many of them work as farmers. Among the self‐employed, we also find a high
share of workers with a work‐limiting health condition (12%). Compared to all other employment
types, self‐employed workers most often live in partnerships with (50%) or without children (26%).
These results suggest that self‐employment provides workers with more autonomy over their work
schedule than wage and salary work, rendering it easier to reconcile employment with family
responsibilities or health restrictions.
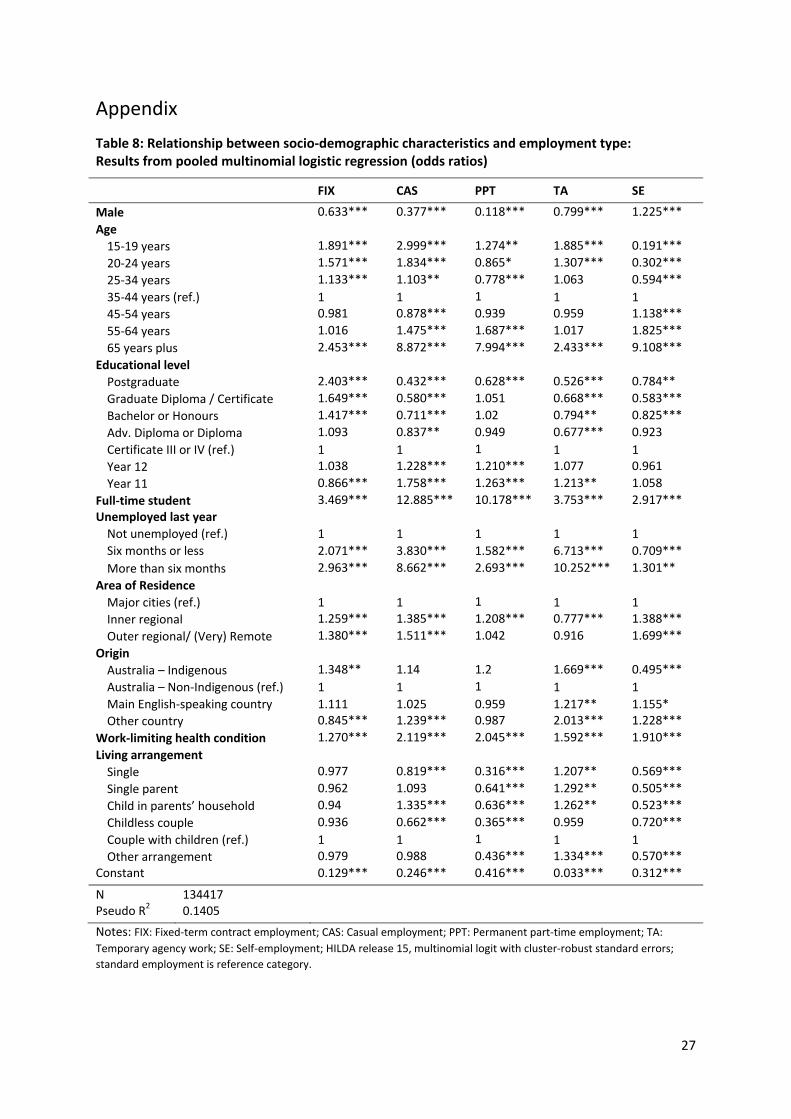
The question that arises from these bivariate, descriptive results is whether the relationships
between socio‐demographic characteristics and employment type also hold when we account for
correlations between the different factors, such as age and study status. In order to investigate this,
we run a cross‐sectional multinomial logistic regression based on the pooled sample of all waves of
the HILDA Survey, which analyses the effects of the socio‐demographic factors on the likelihood of
being found in a certain employment type compared to standard employment. From the results in
Table 8 in the appendix it can be seen that most results also hold in this multivariate framework. For
example, with the exception of self‐employment, all non‐standard workers are more likely than
standard workers to be female and in the youngest age group. Contrary to the bivariate results,
however, all types of non‐standard workers are now found to also be significantly more likely to be
65 years and older compared to standard workers. While fixed‐term contract workers are
significantly more likely to have a postgraduate qualification, the opposite is true for all other types
19
of non‐standard employment. Moreover, all types of non‐standard workers are more likely to be
full‐time students, to have had a recent unemployment experience (except for short‐term
unemployment among the self‐employed) and to have a work‐impacting health condition. In
contrast, the living arrangements of non‐standard workers are diverse, with little difference in living
arrangements for fixed‐term contract workers compared to standard workers, but a significantly
reduced likelihood of any arrangement other than couple family with children for permanent part‐
time workers and the self‐employed.
Transitions into and out of Non‐standard Employment
The final question investigated in this paper is whether non‐standard employment is a transitory or
long‐lasting experience for most workers. This analysis is based on all respondents who are observed
at least twice (either in two consecutive waves or in two waves five years apart) in the HILDA Survey
and cases are thus weighted using longitudinal weights. Note that we can only observe changes in
employment status from one interview to the next and are not able to capture repeated changes in
employment status between waves – this sort of between‐wave employment data is not collected in
the HILDA Survey.
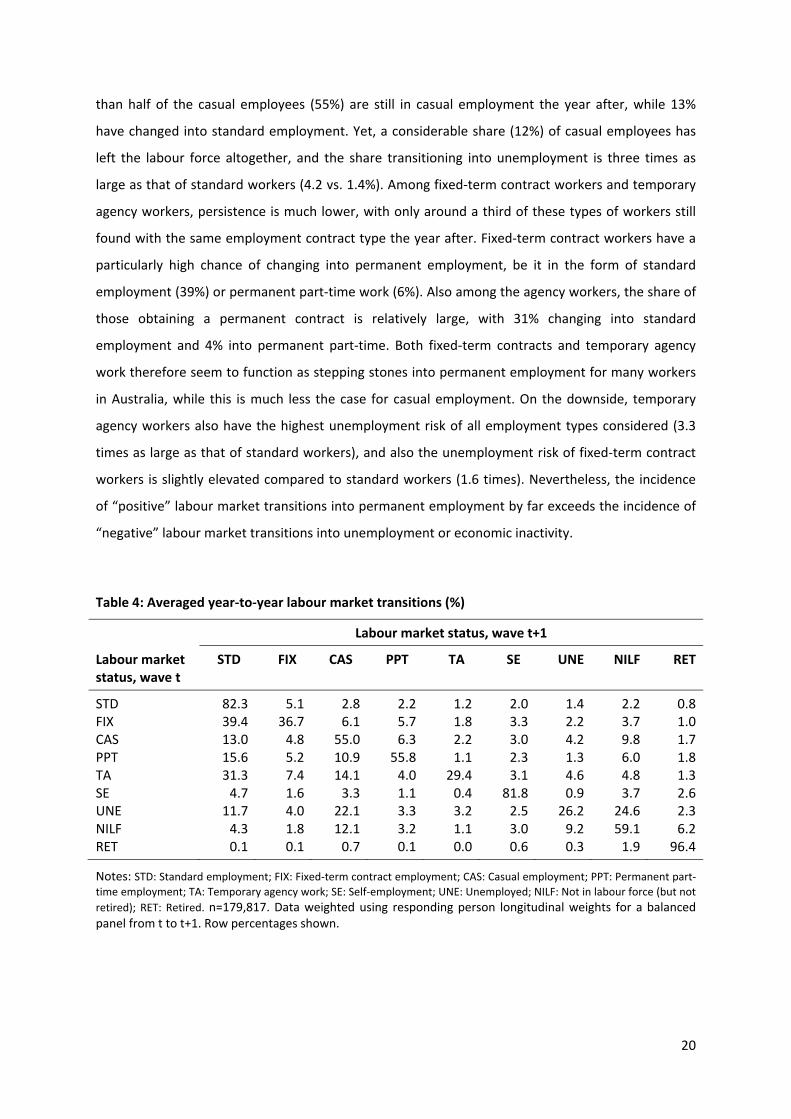
Table 4 shows the yearly transition rates between different labour market states and employment
types, averaged across the observation period. Focussing first on the transition into non‐standard
employment, we see that casual employment in particular appears to work as an entry port into the
labour market: 22% of those who are unemployed in one year and 12% of those who are not in the
labour force are found in casual employment in the next year. In contrast, the chances of
transitioning from unemployment or economic inactivity into any other employment type are much
lower, amounting for example to 12% and 4% respectively for the transition into standard
employment. Fixed‐term contracts, which play an important role for labour market entrants in many
European countries, only play a minor role in this respect in Australia: Only 4% of the unemployed
and 2% of those outside the labour force have obtained a fixed‐term position the year after.
Focusing now on the rate of transition out of an employment type, the table shows that standard
employment and self‐employment have a particularly high persistence across time, with more than
80% of workers found in these employment types in one year still being in the same state in the next
year. Permanent part‐time work also has a relatively high persistence, with more than half of these
workers still found in permanent part‐time employment the year after. However, a substantial share
(16%) also increase their working hours and thus change into standard employment. Similarly, more
20
than half of the casual employees (55%) are still in casual employment the year after, while 13%
have changed into standard employment. Yet, a considerable share (12%) of casual employees has
left the labour force altogether, and the share transitioning into unemployment is three times as
large as that of standard workers (4.2 vs. 1.4%). Among fixed‐term contract workers and temporary
agency workers, persistence is much lower, with only around a third of these types of workers still
found with the same employment contract type the year after. Fixed‐term contract workers have a
particularly high chance of changing into permanent employment, be it in the form of standard
employment (39%) or permanent part‐time work (6%). Also among the agency workers, the share of
those obtaining a permanent contract is relatively large, with 31% changing into standard
employment and 4% into permanent part‐time. Both fixed‐term contracts and temporary agency
work therefore seem to function as stepping stones into permanent employment for many workers
in Australia, while this is much less the case for casual employment. On the downside, temporary
agency workers also have the highest unemployment risk of all employment types considered (3.3
times as large as that of standard workers), and also the unemployment risk of fixed‐term contract
workers is slightly elevated compared to standard workers (1.6 times). Nevertheless, the incidence
of “positive” labour market transitions into permanent employment by far exceeds the incidence of
“negative” labour market transitions into unemployment or economic inactivity.
Table 4: Averaged year‐to‐year labour market transitions (%)
Labour market status, wave t+1
Labour market status, wave t
STD FIX CAS PPT TA SE UNE NILF RET
STD 82.3 5.1 2.8 2.2 1.2 2.0 1.4 2.2 0.8 FIX 39.4 36.7 6.1 5.7 1.8 3.3 2.2 3.7 1.0 CAS 13.0 4.8 55.0 6.3 2.2 3.0 4.2 9.8 1.7 PPT 15.6 5.2 10.9 55.8 1.1 2.3 1.3 6.0 1.8 TA 31.3 7.4 14.1 4.0 29.4 3.1 4.6 4.8 1.3 SE 4.7 1.6 3.3 1.1 0.4 81.8 0.9 3.7 2.6 UNE 11.7 4.0 22.1 3.3 3.2 2.5 26.2 24.6 2.3 NILF 4.3 1.8 12.1 3.2 1.1 3.0 9.2 59.1 6.2 RET 0.1 0.1 0.7 0.1 0.0 0.6 0.3 1.9 96.4
Notes: STD: Standard employment; FIX: Fixed‐term contract employment; CAS: Casual employment; PPT: Permanent part‐
time employment; TA: Temporary agency work; SE: Self‐employment; UNE: Unemployed; NILF: Not in labour force (but not
retired); RET: Retired. n=179,817. Data weighted using responding person longitudinal weights for a balanced panel from t to t+1. Row percentages shown.
21
The five‐year labour market transition rates, presented in Table 5, indicate a larger degree of labour
market mobility over the longer period. Standard and self‐employment are still the most stable
employment types, with 68% and 64% respectively still (or again) found in the same form of
employment five years after. More than half of fixed‐term contract workers have transitioned to
permanent employment, primarily into full‐time (47%) but also to a considerable degree into part‐
time work (7%). A similar share of casuals has moved into permanent part‐time work, but the share
moving into standard employment is much lower than among the fixed‐term workers (32%). Among
the temporary agency workers, five‐year transition rates to standard employment and permanent
part‐time employment are only slightly lower than for the fixed‐term contract workers. Only a small
minority of agency workers (9%) is still in this type of employment five years later. Among the
permanent part‐time workers, the share of those who stay in this type of employment is relatively
high (33%), but a considerable share (28%) also moves into standard employment.
Table 5: Averaged five‐year labour market transitions (%)
Labour market status, wave t+5
Labour market status, wave t
STD FIX CAS PPT TA SE UNE NILF RET
STD 68.4 5.2 4.6 4.2 1.3 5.2 1.8 4.6 4.6 FIX 46.7 18.7 6.5 7.1 1.6 7.3 2.1 5.6 4.5 CAS 32.0 7.2 26.3 7.5 1.8 5.1 4.1 9.6 6.5 PPT 28.1 6.3 10.3 32.8 1.1 3.8 1.5 7.4 8.6 TA 43.9 7.0 11.7 6.1 9.4 5.0 3.2 8.3 5.3 SE 10.5 2.4 4.6 2.2 0.5 64.1 1.4 4.6 9.6 UNE 24.0 4.1 17.3 6.5 2.8 4.1 13.6 20.3 7.4 NILF 14.7 4.6 15.7 5.9 1.8 4.9 6.5 32.8 13.2 RET 0.2 0.1 0.8 0.2 0.0 0.7 0.2 1.5 96.4
Notes: STD: Standard employment; FIX: Fixed‐term contract employment; CAS: Casual employment; PPT: Permanent part‐
time employment; TA: Temporary agency work; SE: Self‐employment; UNE: Unemployed; NILF: Not in the labour force (but
not retired); RET: Retired. n=100,973.Data weighted using responding person longitudinal weights for paired waves t and t+5. Row percentages shown.
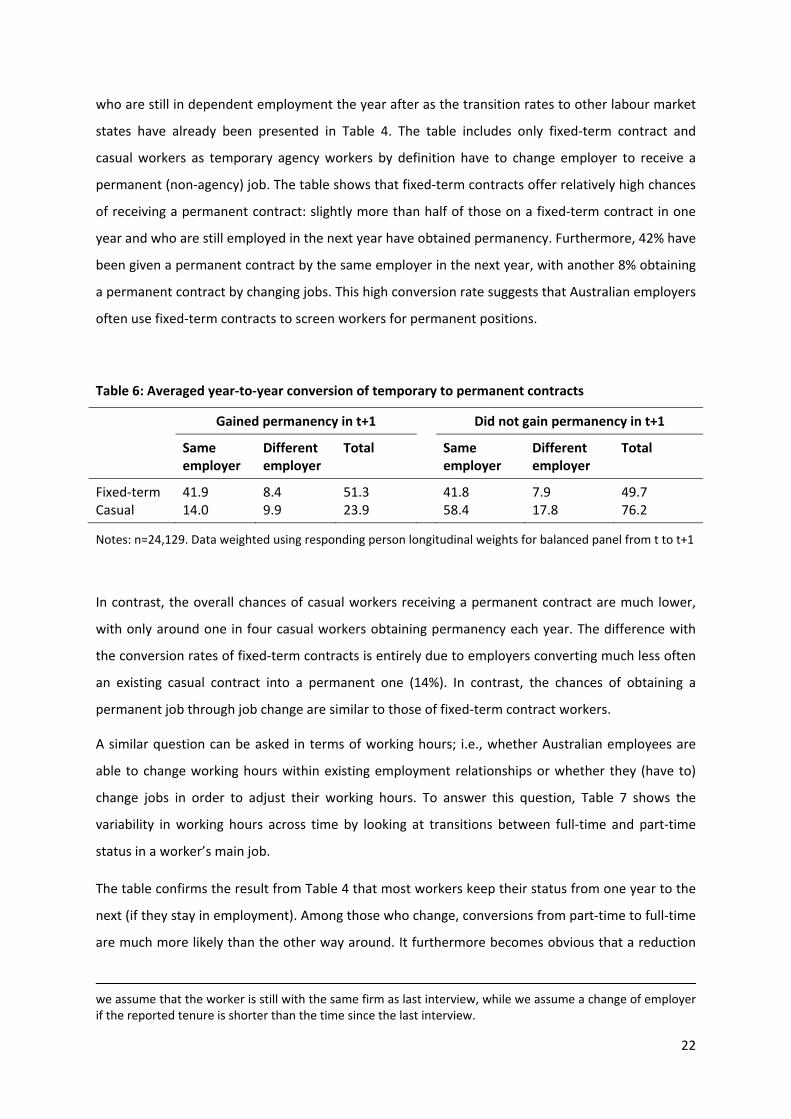
A question closely connected to the chances of transitioning into permanent employment is whether
permanency is attained by having a temporary contract converted to a permanent one by one’s
employer or by changing employers (Table 6).19 Here, we focus only on those temporary workers
19 The information on employer changes was primarily taken from a question asking respondents whether they still work for the same employer like last interview. If this information was unavailable, the information on tenure with the current employer was used instead: Each wave, respondents are asked how long they have worked for their current employer. If tenure is longer than the time which has elapsed since the last interview,
22
who are still in dependent employment the year after as the transition rates to other labour market
states have already been presented in Table 4. The table includes only fixed‐term contract and
casual workers as temporary agency workers by definition have to change employer to receive a
permanent (non‐agency) job. The table shows that fixed‐term contracts offer relatively high chances
of receiving a permanent contract: slightly more than half of those on a fixed‐term contract in one
year and who are still employed in the next year have obtained permanency. Furthermore, 42% have
been given a permanent contract by the same employer in the next year, with another 8% obtaining
a permanent contract by changing jobs. This high conversion rate suggests that Australian employers
often use fixed‐term contracts to screen workers for permanent positions.
Table 6: Averaged year‐to‐year conversion of temporary to permanent contracts
Gained permanency in t+1 Did not gain permanency in t+1
Same employer
Different employer
Total Same employer
Different employer
Total
Fixed‐term 41.9 8.4 51.3 41.8 7.9 49.7 Casual 14.0 9.9 23.9 58.4 17.8 76.2
Notes: n=24,129. Data weighted using responding person longitudinal weights for balanced panel from t to t+1
In contrast, the overall chances of casual workers receiving a permanent contract are much lower,
with only around one in four casual workers obtaining permanency each year. The difference with
the conversion rates of fixed‐term contracts is entirely due to employers converting much less often
an existing casual contract into a permanent one (14%). In contrast, the chances of obtaining a
permanent job through job change are similar to those of fixed‐term contract workers.
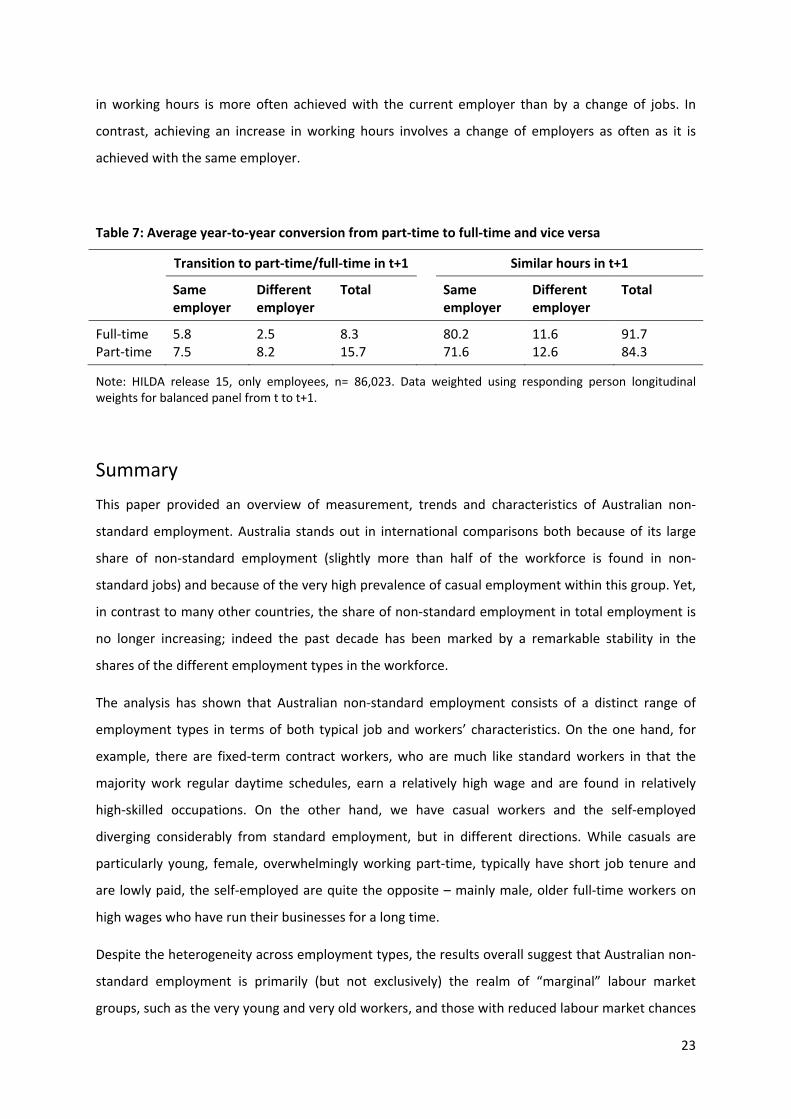
A similar question can be asked in terms of working hours; i.e., whether Australian employees are
able to change working hours within existing employment relationships or whether they (have to)
change jobs in order to adjust their working hours. To answer this question, Table 7 shows the
variability in working hours across time by looking at transitions between full‐time and part‐time
status in a worker’s main job.
The table confirms the result from Table 4 that most workers keep their status from one year to the
next (if they stay in employment). Among those who change, conversions from part‐time to full‐time
are much more likely than the other way around. It furthermore becomes obvious that a reduction
we assume that the worker is still with the same firm as last interview, while we assume a change of employer if the reported tenure is shorter than the time since the last interview.
23
in working hours is more often achieved with the current employer than by a change of jobs. In
contrast, achieving an increase in working hours involves a change of employers as often as it is
achieved with the same employer.
Table 7: Average year‐to‐year conversion from part‐time to full‐time and vice versa
Transition to part‐time/full‐time in t+1 Similar hours in t+1
Same employer
Different employer
Total Same employer
Different employer
Total
Full‐time 5.8 2.5 8.3 80.2 11.6 91.7 Part‐time 7.5 8.2 15.7 71.6 12.6 84.3
Note: HILDA release 15, only employees, n= 86,023. Data weighted using responding person longitudinal weights for balanced panel from t to t+1.
Summary
This paper provided an overview of measurement, trends and characteristics of Australian non‐
standard employment. Australia stands out in international comparisons both because of its large
share of non‐standard employment (slightly more than half of the workforce is found in non‐
standard jobs) and because of the very high prevalence of casual employment within this group. Yet,
in contrast to many other countries, the share of non‐standard employment in total employment is
no longer increasing; indeed the past decade has been marked by a remarkable stability in the
shares of the different employment types in the workforce.
The analysis has shown that Australian non‐standard employment consists of a distinct range of
employment types in terms of both typical job and workers’ characteristics. On the one hand, for
example, there are fixed‐term contract workers, who are much like standard workers in that the
majority work regular daytime schedules, earn a relatively high wage and are found in relatively
high‐skilled occupations. On the other hand, we have casual workers and the self‐employed
diverging considerably from standard employment, but in different directions. While casuals are
particularly young, female, overwhelmingly working part‐time, typically have short job tenure and
are lowly paid, the self‐employed are quite the opposite – mainly male, older full‐time workers on
high wages who have run their businesses for a long time.
Despite the heterogeneity across employment types, the results overall suggest that Australian non‐
standard employment is primarily (but not exclusively) the realm of “marginal” labour market
groups, such as the very young and very old workers, and those with reduced labour market chances
24
due to lower educational levels, recent unemployment experience or work‐limiting health
conditions. Yet, often it is also deliberately chosen by workers seeking to combine gainful
employment with non‐work commitments such as studies or childcare.
The investigation of labour market transitions has highlighted that casual employment works as the
main entry port of unemployed and economically inactive persons into employment in Australia,
while fixed‐term contract and temporary agency workers have much larger chances of transitioning
into permanent employment. Overall, the analyses have shown a considerable degree of
permeability between different employment types in the Australian labour market, suggesting that
non‐standard employment is a transitory experience in the life courses of many workers.
25
References
Addison, John T., and Christopher J. Surfield. 2009. “Atypical Work and Employment Continuity.”
Industrial Relations: A Journal of Economy and Society 48(4): 655–83.
Australian Bureau of Statistics (ABS). 1989. “Employment Benefits, Australia 1988.” ABS cat. no.
6334.0. Canberra: Australian Bureau of Statistics (ABS).
Australian Bureau of Statistics (ABS). 2017. “Labour Force, Australia (Dec 2016).” ABS cat no. 6202.0.
Canberra: Australian Bureau of Statistics (ABS).
Bastelaer, Alois van, Georges Lemaître, and Pascal Marianna. 1997. “The Definition of Part‐Time
Work for the Purpose of International Comparisons.” OECD Labour Market and Social Policy
Occasional Papers 22. Paris: OECD.
Brooks, Brian. 1985. “Aspects of Casual and Part‐Time Employment.” Journal of Industrial Relations
27(2): 158–71.
Campbell, Iain, and John Burgess. 2001. “A New Estimate of Casual Employment?” Australian
Bulletin of Labour 27(2): 85–108.
Córdova, Efrén. 1986. “From Full‐time Wage Employment to Atypical Employment: A Major Shift in
the Evolution of Labor Relations?” International Labour Review 125(6): 641–57.
Creighton, Breen, and Andrew Stewart. 2010. Labour Law. 5th ed. Annandale, NSW: Federation Press.
Dawkins, Peter, and Keith Norris. 1990. “Casual Employment in Australia.” Australian Bulletin of
Labour 19(3): 156–73.
Farber, Henry S. 1999. “Alternative and Part‐Time Employment Arrangements as a Response to Job
Loss.” Journal of Labor Economics 17(S4): S142‐S169.
Green, Colin P., and John S. Heywood. 2011. “Flexible Contracts and Subjective Well‐Being.”
Economic Inquiry 49(3): 716–29.
Grip, Andries de, Jeroen Hoevenberg, and Ed Willems. 1997. “Atypical Employment in the European
Union.” International Labour Review 136(1): 49–71.
Guest, David. 2004. “Flexible Employment Contracts, the Psychological Contract and Employee
Outcomes: An Analysis and Review of the Evidence.” International Journal of Management
Reviews 5/6(1): 1–19.
Houseman, Susan N., and Anne E. Polivka. 2000. “The Implications of Flexible Staffing Arrangements
for Job Stability.” In: On the Job: Is Long‐Term Employment a Thing of the Past?, edited by David
Neumark, pp. 427–62. New York: Russell Sage Foundation.
OECD. 2015. In It Together: Why Less Inequality Benefits All. Paris: OECD Publishing.
OECD. 2017. Incidence of Involuntary Part time Workers.
http://stats.oecd.org/viewhtml.aspx?datasetcode=INVPT_I&lang=en.
26
Polivka, Anne E. 1996. “Contingent and Alternative Work Arrangements, Defined.” Monthly Labor
Review 119(10): 3–9.
Polivka, Anne E., and Thomas Nardone. 1989. “On the Definition of ‘Contingent Work’.” Monthly
Labor Review 112(12): 9–16.
Rodgers, Gerry. 1989. “Precarious Work in Western Europe: the State of the Debate.” In: Precarious
Jobs in Labour Market Regulation: The Growth of Atypical Employment in Western Europe, edited
by Gerry Rodgers and Janine Rodgers. Geneva: International Institute for Labour Studies; Free
University of Brussels.
Treu, Tiziano. 1992. “Labour Flexibility in Europe.” International Labour Review 131(4‐5): 497–512.
Watson, Ian. 2005. “Contented Workers in Inferior Jobs? Re‐Assessing Casual Employment in
Australia.” Journal of Industrial Relations 47(4): 371–92.
Watson, Nicole, and Mark Wooden. 2012. “The HILDA Survey: A Case Study in the Design and
Development of a Successful Household Panel Study.” Longitudinal and Life Course Studies 3(3):
369–81.
Wooden, Mark. 2002. “The Changing Labour Market and its Impact on Work and Employment
Relations.” In: Working Futures: The Changing Nature of Employment Relations in Australia,
edited by Ron Callus and Russell D. Landsbury, pp. 51–69. Annandale, NSW: The Federation Press.
Wooden, Mark, and Diana Warren. 2003. “The Characteristics of Casual and Fixed‐Term
Employment: Evidence from the HILDA Survey.” Melbourne Institute Working Paper 15/03.
Melbourne: Melbourne Institute of Applied Economic and Social Research (MIAESR).
Wooden, Mark, and Diana Warren. 2004. “Non‐Standard Employment and Job Satisfaction: Evidence
from the HILDA Survey.” Journal of Industrial Relations 46(3): 275–97.
27
Appendix
Table 8: Relationship between socio‐demographic characteristics and employment type: Results from pooled multinomial logistic regression (odds ratios)
FIX CAS PPT TA SE
Male 0.633*** 0.377*** 0.118*** 0.799*** 1.225***
Age
15‐19 years 1.891*** 2.999*** 1.274** 1.885*** 0.191***
20‐24 years 1.571*** 1.834*** 0.865* 1.307*** 0.302***
25‐34 years 1.133*** 1.103** 0.778*** 1.063 0.594***
35‐44 years (ref.) 1 1 1 1 1
45‐54 years 0.981 0.878*** 0.939 0.959 1.138***
55‐64 years 1.016 1.475*** 1.687*** 1.017 1.825***
65 years plus 2.453*** 8.872*** 7.994*** 2.433*** 9.108***
Educational level
Postgraduate 2.403*** 0.432*** 0.628*** 0.526*** 0.784**
Graduate Diploma / Certificate 1.649*** 0.580*** 1.051 0.668*** 0.583***
Bachelor or Honours 1.417*** 0.711*** 1.02 0.794** 0.825***
Adv. Diploma or Diploma 1.093 0.837** 0.949 0.677*** 0.923
Certificate III or IV (ref.) 1 1 1 1 1
Year 12 1.038 1.228*** 1.210*** 1.077 0.961
Year 11 0.866*** 1.758*** 1.263*** 1.213** 1.058
Full‐time student 3.469*** 12.885*** 10.178*** 3.753*** 2.917***
Unemployed last year
Not unemployed (ref.) 1 1 1 1 1
Six months or less 2.071*** 3.830*** 1.582*** 6.713*** 0.709***
More than six months 2.963*** 8.662*** 2.693*** 10.252*** 1.301**
Area of Residence
Major cities (ref.) 1 1 1 1 1
Inner regional 1.259*** 1.385*** 1.208*** 0.777*** 1.388***
Outer regional/ (Very) Remote 1.380*** 1.511*** 1.042 0.916 1.699***
Origin
Australia – Indigenous 1.348** 1.14 1.2 1.669*** 0.495***
Australia – Non‐Indigenous (ref.) 1 1 1 1 1
Main English‐speaking country 1.111 1.025 0.959 1.217** 1.155*
Other country 0.845*** 1.239*** 0.987 2.013*** 1.228***
Work‐limiting health condition 1.270*** 2.119*** 2.045*** 1.592*** 1.910***
Living arrangement
Single 0.977 0.819*** 0.316*** 1.207** 0.569***
Single parent 0.962 1.093 0.641*** 1.292** 0.505***
Child in parents’ household 0.94 1.335*** 0.636*** 1.262** 0.523***
Childless couple 0.936 0.662*** 0.365*** 0.959 0.720***
Couple with children (ref.) 1 1 1 1 1
Other arrangement 0.979 0.988 0.436*** 1.334*** 0.570***
Constant 0.129*** 0.246*** 0.416*** 0.033*** 0.312***
N 134417 Pseudo R2 0.1405
Notes: FIX: Fixed‐term contract employment; CAS: Casual employment; PPT: Permanent part‐time employment; TA:
Temporary agency work; SE: Self‐employment; HILDA release 15, multinomial logit with cluster‐robust standard errors;
standard employment is reference category.


![SOCIO-DEMOGRAPHIC CORRELATES OF UNIPOLAR MAJOR DEPRESSION … · depression is segregated based on ethnicity, and the prevalence for Malay elderly is 6.5% [5].Additionally, a south](https://img.pdfslide.net/doc/110x75/5f0d7b1a7e708231d43a91d6/socio-demographic-correlates-of-unipolar-major-depression-depression-is-segregated.jpg)