Embed Size (px)
Citation preview

V-STARS S8 Demonstration Measurement Report
April 2006
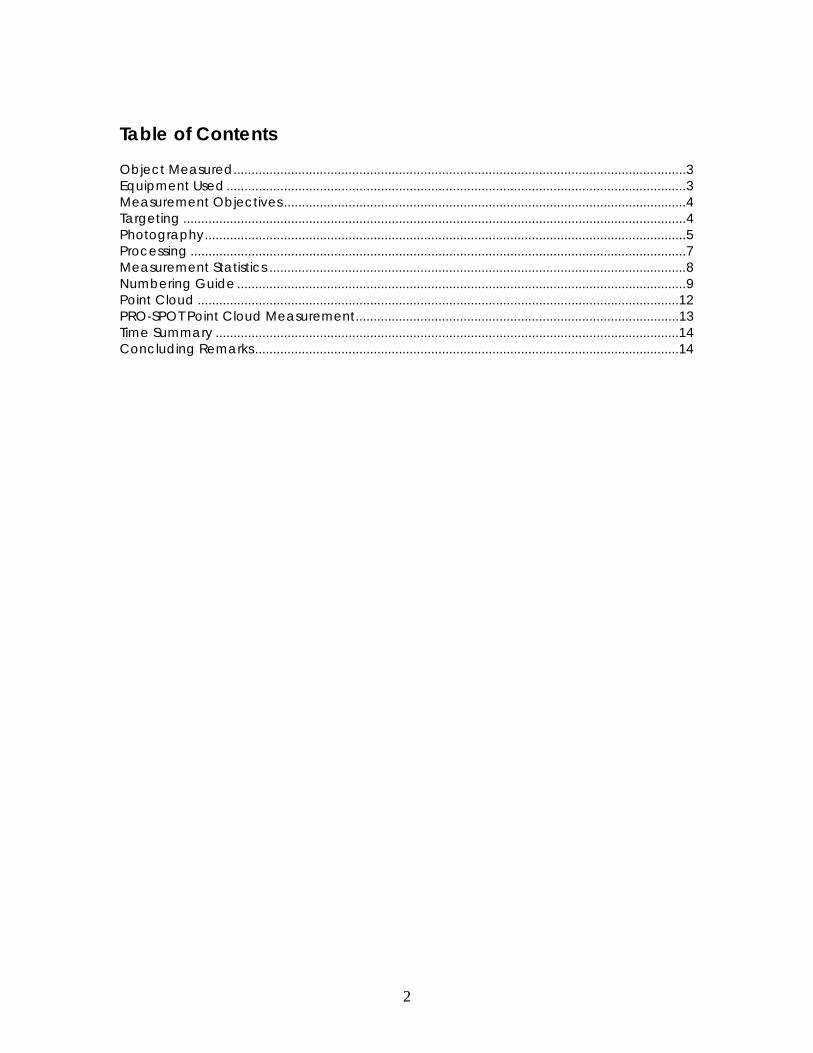
Table of Contents Object Measured..............................................................................................................................3 Equipment Used................................................................................................................................3 Measurement Objectives ................................................................................................................4 Targeting ............................................................................................................................................4 Photography......................................................................................................................................5 Processing ..........................................................................................................................................7 Measurement Statistics ....................................................................................................................8 Numbering Guide.............................................................................................................................9 Point Cloud ......................................................................................................................................12 PRO-SPOT Point Cloud Measurement..........................................................................................13 Time Summary .................................................................................................................................14 Concluding Remarks ......................................................................................................................14
2

Object Measured Two objects were measured as part of the V-STARS demonstration. The objects were two small rough cut blades. A photo of one of the blades is shown on the cover of this report. The primary objective of the measurement was to determine the coordinates of points on the surface of the each of the blades. These points would then be compared to theodolite coordinates of the same points. Equipment Used
1. V-STARS S8 INCA3 Camera 2. Scale Bars 3. AutoBar 4. Coded targets 5. Single dot targets with cross hairs and theodolite dot.
3

Measurement Objectives
1. Demonstrate INCA3 camera use 2. Determine location of key points on each object
Targeting
1. AutoBar for initial coordinate system 2. Reference coded targets to tie photography together 3. Two scale bars 4. Single dot targets on surface of blades
In order to meet the measurement objectives outlined earlier it was necessary to target the blades. In general, targets are placed on points or surfaces that are of interest. For surfaces, strips of retro-reflective tape of variable pitch and dot size are commonly used. They are relatively cheap, disposable and easy to apply. To coordinate tooling datums such as bushed holes or button datums, tooling targets are used. These come in a variety of shank and dot sizes. They are also available in variable orientations. For this measurement, single dot targets with cross hairs and a center dot were used. To automate the measurement process it was necessary to add “coded” targets to the jig. These targets are automatically detected and help the software determine the location and orientation of the camera at the time the photo was taken. They also help tie the entire object into a uniform coordinate system. The codes were placed on the front, back and sides of the blades.
The initial coordinates system and scale is determined via the AutoBar. The AutoBar used by the V-STARS system is a fixture with five targets arranged in the form of a cross. The target's known coordinates are used by the AutoMatch procedure to determine the camera's orientation relative to the AutoBar. The AutoBar is securely attached on or near the measured object, preferably in a highly visible location. The AutoBar's default
coordinate system has its origin at Target 1 at the bottom of the AutoBar. The positive Z-axis goes through Target 3 at the top of the bar. The positive X-axis is up out of the AutoBar. The diagram on the left shows both the AutoBar and its coordinate system
4

To scale a photogrammetric measurement, there must be at least one known distance. Normally this distance comes from a calibrated coded graphite scale bar or invar scale bar (Refer to adjacent image). Typically multiple scales are used for redundancy. Two scale bars were used to complete this measurement. They were each measured twice. Some of the key targeting features of the measurement are shown in the image below:
Photography The photography is carried out once the object targeting is completed. Put simply, the aim of the photography is to record each of the targeted points in as many images as possible from as wide a range of angles as possible. To improve the accuracy of the measurement, generally photos are taken both close to the ground and from an elevated position. The number of photos taken depends on the complexity of the measurement and accuracy requirements. As the blades were relatively close together they were measured at the same time.
5

The diagrams below illustrate the geometry used to create the point cloud for the blades.
Network - Top View
Network - Side View
6

Processing Once the photography has been completed the images are transferred to the system laptop. The images are stored on a PCMCIA hard drive and V-STARS accesses these images directly from the drive. Almost all of the measurement process is automated. The images are processed and the coordinates extracted by the “AutoMeasure” command. A typical AutoMeasure dialog box is shown on the right. The AutoMeasure command will open each of the images, determine the camera location, find new target points and finally adjust all the measurements in the “Bundle Adjustment”. At the conclusion the user is left with the XYZ coordinates for all the target points in the network. The AutoMeasure procedure is very powerful as it allows the user to continue working while it processes the data. It also means that relatively unskilled workers can be used to process the data. The AutoMeasure routine will assign random labels to the points it finds. These labels start with the key word “Target” followed by a number. If specific labeling is required the random labels can be easily changed to labels defined by the user. This is possible in both the picture view and the graphical 3D view. For this particular project the rows of points were re-labeled to make it easier to identify particular areas of the blade.
7

Seen below is an image taken as part of the measurement.
The green crosses represent points that have been located in this particular image. Note that the image appears a little dark and difficult to see. This is intentional as the best photogrammetric measurements are made on images that have dark backgrounds and bright targets. Some of these targets are shown in the zoom window in the corner. If the scale bar is visible then a yellow line will be drawn between the two end points. Measurement Statistics No. of photos 97 No. of points 1412 Accuracy RMS X,Y,Z X 0.022mm
Y 0.018mm Z 0.018mm
Scale Agreement = 0.007mm
8

A typical point listing is shown below.
Numbering Guide The numbering scheme used is shown below in the images below.
9

10

Alignment No alignment was necessary for this measurement.
11

Point Cloud The measurement produced the following point cloud.
12

PRO-SPOT Point Cloud Measurement The antenna was measured using strip tape. The alternate and preferred method would have been to use the PRO-SPOT target projection system. The PRO-SPOT is shown below.
The PRO-SPOT works by projecting targets onto the surface of the object being measured. The PRO-SPOT is capable of projecting up to 23,000 points onto the surface. This method is preferred as it removes the need to target the object as well as generating considerably more data. A sample of targeting and the corresponding point cloud is shown in the image below.
13

Time Summary
Initial Investigation 1 minutes Targeting 15 minutes Photography 4 minutes Processing 2 minutes Total 22 minutes
Concluding Remarks The measurement undertaken has shown that V-STARS can be a very powerful measurement tool. The results of the measurement undertaken were very accurate and produced quickly.
14