Embed Size (px)
Citation preview
International Conference on Renewable Energies and Power Quality (ICREPQ‟14)
Cordoba (Spain), 8th to 10th April, 2014 Renewable Energy and Power Quality Journal (RE&PQJ)
ISSN 2172-038 X, No.12, April 2014
Measurements and Evaluation of Flicker in High Voltage Networks
M. H. Albadi
1, A. S. Al Hinai
1, A. H. Al-Badi
1, M. S. Al Riyami
2, S. M. Al Hinai
1, and R. S Al Abri
1
1 Department of Electrical and Computer Engineering
Sultan Qaboos University (SQU)
Muscat-123, Sultanate of Oman
Tel: +968 2414 2664, Fax: +968 2441 3454
Email: [email protected], [email protected], [email protected], [email protected], [email protected] 2 Oman Electricity Transmission Company (OETC)
Tel: +96824497279, Fax: +968 24497748, Email: [email protected]
Abstract. This paper presents a case study about the impacts
of industrial loads on power quality. A review of flicker causes,
negative impacts, mitigation techniques, quantification indices
and limits are presented. Moreover, flicker measurements at three
grid station that supply the three main industrial areas located in
the main interconnected system (MIS) of Oman are conducted.
Measurement results are compared with limits specified by
national and international standards.
Key words Power Quality, Flicker, Measurements, Standards, Arc
furnace.
1. Introduction Heavy industrial loads are often connected to transmission
networks at high voltage levels such as 132 kV and 220
kV. These loads may include rolling mills often driven by
thyristor-control DC Drives, or could be an Electric Arc
furnace or induction furnaces needing large reactive
power. These types of loads can deteriorate the supply
quality of other loads connected to the same point of
common coupling (PCC).
To study the impact of heavy industrial customers on the
power quality of the high voltage network, measurement
of the existing distortion levels is important. In this paper,
flicker measurements are conducted at selected industrial
load grid stations of Oman Electricity Transmission
Company (OETC) network [1]. The on-site measurements
are performed at the 132kV side of the substation
transformer feeding the industrial customers. The
measured levels of flicker distortion are analyzed and
compared with appropriate standards. The study outcome
and recommendations can be used to further improve the
grid code and connection agreements for heavy industries.
After this introduction, the paper proceeds with presenting
an overview of the voltage flicker, its impacts, typical
sources and mitigation techniques. In section three, flicker
indices and limits are reviewed. Measurement results are
discussed in section four. Finally the main conclusions are
presented.
2. Flicker Flicker is simply the fluctuation of light intensity.
According to the International Electro technical
Vocabulary (IEV), it is defined as: “Impression of
unsteadiness of visual sensation induced by a light
stimulus whose luminance or spectral fluctuate with
time” [2]. In many cases, the term „Flicker‟ is used to
describe the voltage fluctuations themselves.
Since the inception of electric lighting, flickering of
lights has been a reality for most consumers. Flicker is
relatively an old topic. According to [3], it was the flicker
that determined the standard frequency for the electric
power system to prevent visible flickering in open-type
arc lamps in America in 1891 to be 60Hz. Europeans
select 50 Hz based on the flicker response of enclosed-
type arc lamps [3].
A. Effect of Flicker
Light flicker is just a symptom perceived by the human
eye of the original problem, which is voltage fluctuation
caused by rapid variation of the load current. If voltage
fluctuations occur with certain frequencies (0.05-35 Hz),
the fluctuation in light intensity, perceived by the human
eye, could lead to unpleasant feeling and health
problems. The most severe disturbing effect occurs when
the frequency of the fluctuation is 8.8 Hz. The flicker
phenomena can be so subtle as to not be consciously
detected by those affected but at the same time can
induce discomfort in the form of nausea or headache and
in turn affects the work efficiency. Normally flicker is
perceived as annoyance and distraction. But in some
extreme cases, it can cause epilepsy seizures to those who
are borne to it. It has been reported that flicker causes
seizures in about 4% of the patients with epilepsy [4].
Voltage fluctuations can cause other problems other than
light flickers. These include triggering of UPS units to
switch to battery and problems with some sensitive
electronic equipment, such as in medical laboratories,
which require a constant voltage. When the voltage
magnitude varies, power flow into the equipment will
also change. If the variation is large enough or within a
critical frequency range, the performance of equipment
can be affected [5]. Usually, complaints about light
flicker will occur well before any disturbances on other
loads show up [6]. As an example to this fact, the ITI
(CBEMA) curve shows the faultless operation zone of
the IT equipment as a function of nominal voltage change
https://doi.org/10.24084/repqj12.218 38 RE&PQJ, Vol.1, No.12, April 2014

and the duration of that change. This curve describes an
AC input voltage envelope which typically can be
tolerated by most Information Technology Equipment
(ITE) [7].
Fig. 1. Faultless operation zone of the IT equipment (ITI curve)
B. Causes of Flicker
In principle, any switching operations of industrial
processes and electrical appliances connected to the supply
system can cause voltage changes and in turn light flicker.
Generally, flicker phenomenon can be divided into two
general categories, cyclic and non-cyclic. Cyclic flicker is
caused by periodic load fluctuation/switching operations.
Non-cyclic flicker is caused by occasional load
fluctuations/switching operations. Some sources of flicker
can cause both cyclic and non-cyclic flicker. The typical
sources of light flicker are listed below [5].
- Arc furnaces cause fast voltage fluctuation occurs due
to the high current and the unstable nature of the arc
during the process.
- Resistive welding machines draw high repetitive
welding currents that cause the voltage to fluctuate in
the same manner.
- Large electric motors can cause flickers during
starting due to the inrush starting current and if the
load is varying. Examples of such motors are rolling
mills, stone crushers, elevators and pumps.
- on/off switching of large loads such as large capacity
copy machines, medical imaging machines and color
organs in discos.
- on/off switching of compensating elements and
changing of transformer taps cause a sudden
increase/decrease of the voltage.
- The operation of intermittent types of distributed
generation facilities such as wind turbines and PV
systems.
- Pulsated loads such as Harmonics active filters and
Thermostat controlled loads.
- System faults in electrical supply system can cause
temporary voltage fluctuations. These kinds of events
may cause very high flicker levels but are not
frequent.
C. Flicker Mitigation
Flicker occurs due to two reasons: network impedance
and fluctuated load current. To minimize flicker, the
magnitude of voltage fluctuations must be reduced. To
achieve this, two strategies can be used: a) Reduce the
network impedance. b) Reduce the load current
fluctuation.
The power utility is responsible for the first option. This
can be achieved through two approaches:
1. Network Reinforcement:
Reducing network impedance means increasing the short
circuit power at the load bus. This is achieved by
reducing the impedances between the load and the supply
through network reinforcement. Unfortunately, this
solution is economically not justifiable.
2. System Reconfiguration:
A cheaper solution could be to increase the short circuit
power at the PCC with the existing system infrastructure.
On the other hand, reducing the current fluctuation of the
load should be done by the load (network customer). This
can be achieved through reactive compensation. The
voltage drop caused by a variable/fluctuating load can be
decomposed into two components: reactive component
and active component. The reactive load component is
dominant due to high X/R ratio. There are different
options for reactive compensation: Shunt Capacitors,
Synchronous Condenser, Static Var Compensation
(SVC), and Static synchronous compensation
(STATCOM).
3. Flicker Indices and Limits A. Flicker Indices
The flicker assessment is basically based on human
perception of voltage fluctuations with certain outward
shapes and various repetition rates (frequencies). The
international Electrotechnical Commission standard IEC
61000 4-15 describes the flicker measuring
methodology[8]. Two indicators are used to assess the
flicker severity [8, 9].
- Pst (P for Perceptibility) is the short term flicker
severity index evaluated over a short period. The
standardization bodies specify the time over which
the Pst is calculated to be 10 minutes [2, 8, 9].
- Plt is the long term flicker severity index evaluated
over a long period. It calculated for 2 hours of the
observation period using 12 pieces of successive 10
minutes Pst values [2, 8, 9].
3
12
1
3
12
1
j
stlt PP (1)
When there are more than one flicker source, the total
flicker severity can be determined by adding the
annoying factors caused by individual sources.
33
i
istst PP (2)
https://doi.org/10.24084/repqj12.218 39 RE&PQJ, Vol.1, No.12, April 2014
At Pst =1 p.u flicker severity, 50% of the people exposed
to flicker will feel unpleasant or irritable. This flicker level
is called “the threshold of irritability”. The international
standardization bodies (IEC & IEEE) provide tables and
curves showing Pst=1 as a function of the percentage
relative voltage change and the frequency of the voltage
changes [9].
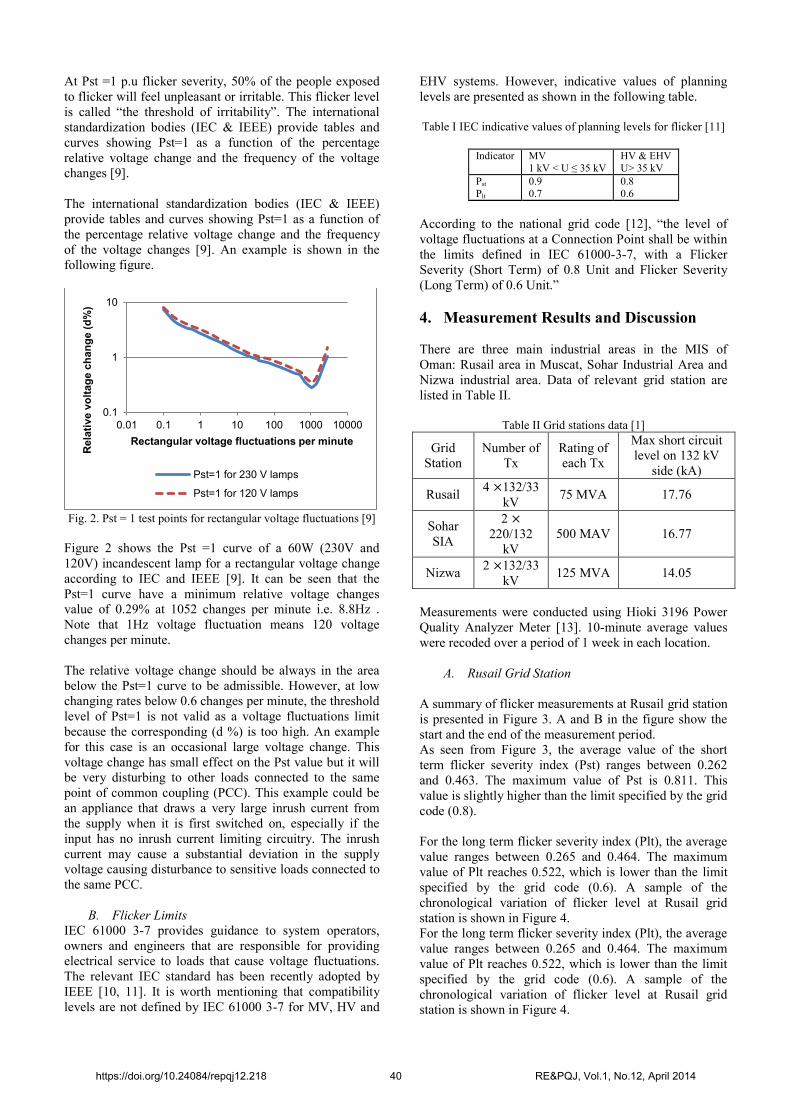
The international standardization bodies (IEC & IEEE)
provide tables and curves showing Pst=1 as a function of
the percentage relative voltage change and the frequency
of the voltage changes [9]. An example is shown in the
following figure.
Fig. 2. Pst = 1 test points for rectangular voltage fluctuations [9]
Figure 2 shows the Pst =1 curve of a 60W (230V and
120V) incandescent lamp for a rectangular voltage change
according to IEC and IEEE [9]. It can be seen that the
Pst=1 curve have a minimum relative voltage changes
value of 0.29% at 1052 changes per minute i.e. 8.8Hz .
Note that 1Hz voltage fluctuation means 120 voltage
changes per minute.
The relative voltage change should be always in the area
below the Pst=1 curve to be admissible. However, at low
changing rates below 0.6 changes per minute, the threshold
level of Pst=1 is not valid as a voltage fluctuations limit
because the corresponding (d %) is too high. An example
for this case is an occasional large voltage change. This
voltage change has small effect on the Pst value but it will
be very disturbing to other loads connected to the same
point of common coupling (PCC). This example could be
an appliance that draws a very large inrush current from
the supply when it is first switched on, especially if the
input has no inrush current limiting circuitry. The inrush
current may cause a substantial deviation in the supply
voltage causing disturbance to sensitive loads connected to
the same PCC.
B. Flicker Limits
IEC 61000 3-7 provides guidance to system operators,
owners and engineers that are responsible for providing
electrical service to loads that cause voltage fluctuations.
The relevant IEC standard has been recently adopted by
IEEE [10, 11]. It is worth mentioning that compatibility
levels are not defined by IEC 61000 3-7 for MV, HV and
EHV systems. However, indicative values of planning
levels are presented as shown in the following table.
Table I IEC indicative values of planning levels for flicker [11]
Indicator MV
1 kV < U ≤ 35 kV
HV & EHV
U> 35 kV
Pst
Plt
0.9
0.7
0.8
0.6
According to the national grid code [12], “the level of
voltage fluctuations at a Connection Point shall be within
the limits defined in IEC 61000-3-7, with a Flicker
Severity (Short Term) of 0.8 Unit and Flicker Severity
(Long Term) of 0.6 Unit.”
4. Measurement Results and Discussion
There are three main industrial areas in the MIS of
Oman: Rusail area in Muscat, Sohar Industrial Area and
Nizwa industrial area. Data of relevant grid station are
listed in Table II.
Table II Grid stations data [1]
Grid
Station
Number of
Tx
Rating of
each Tx
Max short circuit
level on 132 kV
side (kA)
Rusail 4 132/33
kV 75 MVA 17.76
Sohar
SIA
2
220/132
kV
500 MAV 16.77
Nizwa 2 132/33
kV 125 MVA 14.05
Measurements were conducted using Hioki 3196 Power
Quality Analyzer Meter [13]. 10-minute average values
were recoded over a period of 1 week in each location.
A. Rusail Grid Station
A summary of flicker measurements at Rusail grid station
is presented in Figure 3. A and B in the figure show the
start and the end of the measurement period.
As seen from Figure 3, the average value of the short
term flicker severity index (Pst) ranges between 0.262
and 0.463. The maximum value of Pst is 0.811. This
value is slightly higher than the limit specified by the grid
code (0.8).
For the long term flicker severity index (Plt), the average
value ranges between 0.265 and 0.464. The maximum
value of Plt reaches 0.522, which is lower than the limit
specified by the grid code (0.6). A sample of the
chronological variation of flicker level at Rusail grid
station is shown in Figure 4.
0.1
1
10
0.01 0.1 1 10 100 1000 10000
Rela
tive v
olt
ag
e c
ha
ng
e (
d%
)
Rectangular voltage fluctuations per minute
Pst=1 for 230 V lamps
Pst=1 for 120 V lamps
https://doi.org/10.24084/repqj12.218 40 RE&PQJ, Vol.1, No.12, April 2014
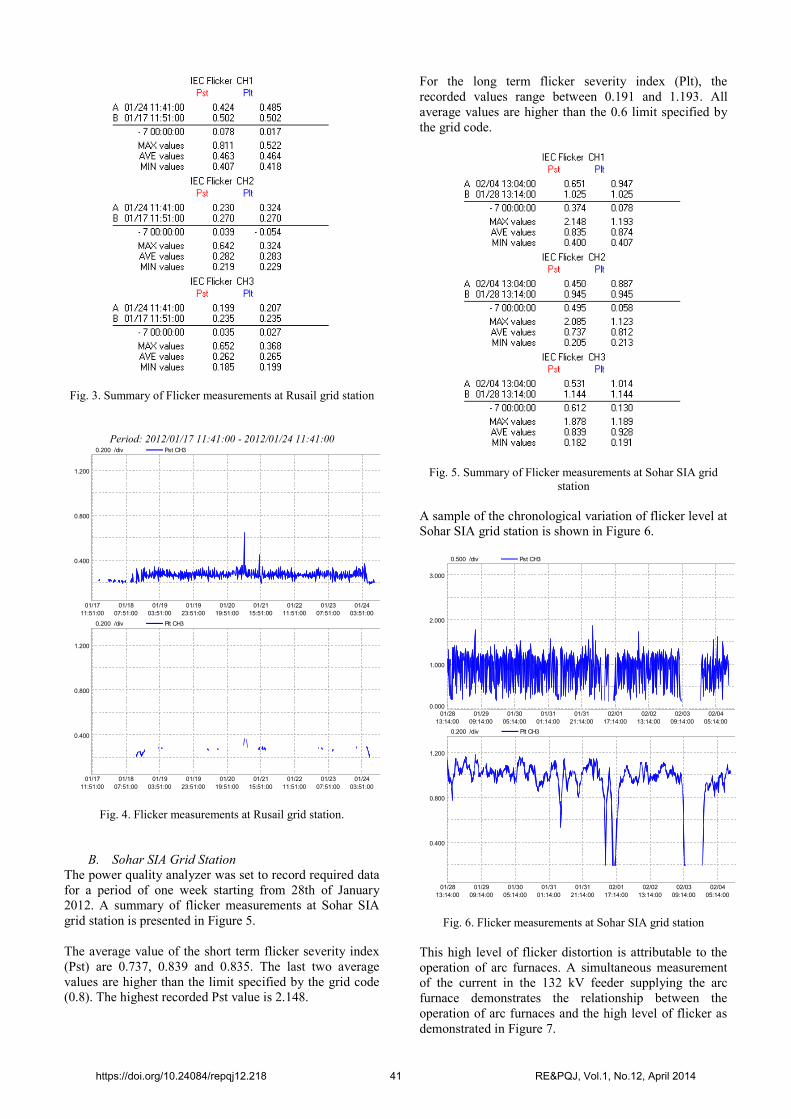
Fig. 3. Summary of Flicker measurements at Rusail grid station
Period: 2012/01/17 11:41:00 - 2012/01/24 11:41:00
Fig. 4. Flicker measurements at Rusail grid station.
B. Sohar SIA Grid Station
The power quality analyzer was set to record required data
for a period of one week starting from 28th of January
2012. A summary of flicker measurements at Sohar SIA
grid station is presented in Figure 5.
The average value of the short term flicker severity index
(Pst) are 0.737, 0.839 and 0.835. The last two average
values are higher than the limit specified by the grid code
(0.8). The highest recorded Pst value is 2.148.
For the long term flicker severity index (Plt), the
recorded values range between 0.191 and 1.193. All
average values are higher than the 0.6 limit specified by
the grid code.
Fig. 5. Summary of Flicker measurements at Sohar SIA grid
station
A sample of the chronological variation of flicker level at
Sohar SIA grid station is shown in Figure 6.
Fig. 6. Flicker measurements at Sohar SIA grid station
This high level of flicker distortion is attributable to the
operation of arc furnaces. A simultaneous measurement
of the current in the 132 kV feeder supplying the arc
furnace demonstrates the relationship between the
operation of arc furnaces and the high level of flicker as
demonstrated in Figure 7.
01/17
11:51:00
01/18
07:51:00
01/19
03:51:00
01/19
23:51:00
01/20
19:51:00
01/21
15:51:00
01/22
11:51:00
01/23
07:51:00
01/24
03:51:00
01/24
23:51:00
01/25
19:51:00
1.200
0.800
0.400
0.200 /div Pst CH3
01/17
11:51:00
01/18
07:51:00
01/19
03:51:00
01/19
23:51:00
01/20
19:51:00
01/21
15:51:00
01/22
11:51:00
01/23
07:51:00
01/24
03:51:00
01/24
23:51:00
01/25
19:51:00
1.200
0.800
0.400
0.200 /div Plt CH3
01/28
13:14:00
01/29
09:14:00
01/30
05:14:00
01/31
01:14:00
01/31
21:14:00
02/01
17:14:00
02/02
13:14:00
02/03
09:14:00
02/04
05:14:00
02/05
01:14:00
02/05
21:14:00
3.000
2.000
1.000
0.000
0.500 /div Pst CH3
01/28
13:14:00
01/29
09:14:00
01/30
05:14:00
01/31
01:14:00
01/31
21:14:00
02/01
17:14:00
02/02
13:14:00
02/03
09:14:00
02/04
05:14:00
02/05
01:14:00
02/05
21:14:00
1.200
0.800
0.400
0.200 /div Plt CH3
https://doi.org/10.24084/repqj12.218 41 RE&PQJ, Vol.1, No.12, April 2014

Fig. 7. Current measurements of the 132kV feeder connected to
an arc furnace at Sohar SIA grid station
C. Nizwa Grid Station
In Nizwa grid station, the analyzer was set to record
required data for a period of one week starting from 29th
of February 2012. As demonstrated in Figure 8, the
average values of the short term flicker severity index for
the three phases are 0.661, 0.621 and 0.6. The highest
recorded Pst value is 2.695.
Fig. 8. Summary of Flicker measurements at Nizwa grid station
It is worth mentioning that the Pst value is lower than the
limit specified by the grid code (0.8) most of the time.
However, this is not the case for the recorded Plt values. In
most of the cases, the Plt values were higher than the 0.6
limit specified by the grid code. The recorded values range
between 0.545 and 1.25. All average recorded values are
higher than the 0.6 limit.
A sample of the chronological variation of flicker level at
Nizwa grid station is shown in Figure 9.
Spikes in the flicker measurements might be attributable to
the unstable 132kV single circuit connection with
Petroleum Development Oman (PDO) power network. The
tripping of this connection causes voltage spikes as seen
in Figure 10.
Fig. 9. Flicker measurements at Sohar SIA grid station
Fig. 10. Voltage measurements at the 132kV side of Nizwa grid
station
5. Conclusions This paper presents a review of flicker causes, impacts,
mitigation techniques, indices and limits. Moreover, a
case study about flicker measurements at three grid
stations feeding industrial areas in the main
interconnected system of Oman is presented. The
measured flicker levels in two of the three grid stations
violate the limits specified by the national grid code. It is
worth mentioning that Sohar SIA grid station has the
highest flicker distortion level due to the operation of arc
furnaces. It is recommended to include limits on flicker
levels emitted from a single industrial customer in the
grid code. As heavy industry loads are expanding in the
country, it is expected that power quality distortion levels
will increase. Therefore, continuous monitoring of power
quality distortion levels is important.
0.0500kA/ div CH3 AVE
0.3000k
0.2000k
0.1000k
0.0000k
01/ 28
13:14:00
01/ 29
09:14:00
01/ 30
05:14:00
01/ 31
01:14:00
01/ 31
21:14:00
02/ 01
17:14:00
02/ 02
13:14:00
02/ 03
09:14:00
02/ 04
05:14:00
02/ 05
01:14:00
02/ 05
21:14:00
02/ 06
17:14:00
02/ 07
13:14:00
02/ 08
09:14:00
02/29
12:21:00
03/01
08:21:00
03/02
04:21:00
03/03
00:21:00
03/03
20:21:00
03/04
16:21:00
03/05
12:21:00
03/06
08:21:00
03/07
04:21:00
03/08
00:21:00
03/08
20:21:00
1.600
1.200
0.800
0.200 /div Pst CH3
02/29
12:21:00
03/01
08:21:00
03/02
04:21:00
03/03
00:21:00
03/03
20:21:00
03/04
16:21:00
03/05
12:21:00
03/06
08:21:00
03/07
04:21:00
03/08
00:21:00
03/08
20:21:00
1.600
1.200
0.800
0.200 /div Plt CH3
4.00kV/ div U3
80.00k
72.00k
64.00k
02/ 29
12:21:00
03/ 01
08:21:00
03/ 02
04:21:00
03/ 03
00:21:00
03/ 03
20:21:00
03/ 04
16:21:00
03/ 05
12:21:00
03/ 06
08:21:00
03/ 07
04:21:00
03/ 08
00:21:00
03/ 08
20:21:00
03/ 09
16:21:00
03/ 10
12:21:00
03/ 11
08:21:00
https://doi.org/10.24084/repqj12.218 42 RE&PQJ, Vol.1, No.12, April 2014
ACKNOWLEDGMENTS
The authors would like to acknowledge Oman Electricity
Transmission Company (OETC) and Sultan Qaboos
University (SQU) for the support in achieving this work.
This study is financially supported by OETC under project
number CR/ENG/ECED/11/06.
6. References [1] Oman Electricity Transmission Company (OETC) website,
http://www.omangrid.com/.
[2] International Electrotechnical Vocabulary- Chapter 161:
Electromagnetic Compatibility (IEV: 161-08-13), IEC 60050 part
161,
http://www.electropedia.org/iev/iev.nsf/display?openform&ievref
=161-08-13.
[3] (1996) Flicker still a concern after all these years. System
Compatibility Research News.
[4] P. M. Jeavons and G. F. A. Harding, Photosensitive Epilepsy:
A Review of the Literature and a Study of 460 patients. London:
William Heinemann Books, 1972.
[5] M. M. Morcos and J. C. Gomez, "Flicker Sources and
Mitigation," IEEE Power Engineering Review, vol. 22, pp. 5-10,
2002.
[6] J. Schlabach, D. Bulme, and T. Stephanblome, Voltage
Quality in Electrical Power Systems. UK- London: Institute of
Electrical Engineers (IEE), 2001.
[7] ITI (CBEMA) Curve, Information Technology Industry
Council (ITI), http://www.itic.org
[8] IEC, "IEC 61000-4-15, Electromagnetic compatibility (EMC)
– Part 4: Testing and measurement techniques – Section 15:
Flickermeter – Functional and design specifications, 2010.
[9] IEEE Recommended Practice--Adoption of IEC 61000-4-
15:2010, Electromagnetic compatibility (EMC)--Testing and
measurement techniques--Flickermeter--Functional and design
specifications," in IEEE Std 1453-2011, pp. 1-58.
[10] IEEE Draft Adoption of IEC/TR 61000-3-7:2008,
Electromagnetic compatibility (EMC)-Limits-Assessment of
emission limits for the connection of fluctuating installations to
MV, HV and EHV power systems, in IEEE Std P1453.1/D2,
March 2012, pp. 1-78.
[11] IEC, IEC 61000-3-7, Electromagnetic compatibility (EMC)-
Limits-Assessment of emission limits for the connection of
fluctuating installations to MV, HV and EHV power systems,
2008.
[12] OETC, "The Grid Code, Version 2," ed, 2010,
http://www.omangrid.com/en/Grid%20Code.aspx.
[13] HIOKI E.E. CORPORATION, Hioki 3196 Power Quality
Analyzer Meter, http://www.hioki.com/product/3196/3196v.html.
7. Biographies Mohammed H. Albadi received the B.Sc. degree in
electrical and computer engineering from Sultan Qaboos
University, Muscat, Oman in 2000; the M.Sc. degree in
electrical engineering from Aachen University of
Technology, Germany in 2003; the Ph.D. degree in
Electrical and Computer Engineering from University of
Waterloo, Canada in 2010. He is currently working as
Assistant Professor in the Electrical & Computer
Engineering Department at Sultan Qaboos University,
Muscat, Oman. His research interests include Renewable
energy, Distributed Generation, Power Quality,
Distribution systems, Demand side management, Power
system operation and planning, and Power system
economics.
Amer. S. Al Hinai received his M.Sc. and PhD in
Electrical Engineering from West Virginia University,
Morgantown, USA in December 2000 and May 2005,
respectively. He is an Assistant Professor in the Electrical
& Computer Engineering Department at Sultan Qaboos
University and a visiting professor at Masdar Institute of
Science & Technology, Abu Dhabi, UAE. He is holding
a member position at the Authority of Electricity
Regulation – Oman. His research interests are related to
energy savings, power system analysis, power system
quality and transient stability of power systems.
Abdullah H. Al-Badi obtained the degree of B.Sc. in
Electrical Engineering from Sultan Qaboos University,
Oman, in 1991. He received the degree of M.Sc. and
Ph.D from UMIST, UK, in 1993 and 1998 respectively.
In September 1991, he joined the Sultan Qaboos
University as demonstrator and, in 1998, he became an
Assistant Professor. Currently he is Professor at the
department of electrical and computer engineering and
the Dean of Admission & Registration at Sultan Qaboos
University. His research interests include electrical
machines, drives, AC interference and renewable energy.
Masoud S. Al Riyami obtained his degree from Sultan
Qaboos University in 1994 in Electrical and Electronics,
major power systems. After graduation, he worked for
the Ministry of Housing, Electricity and Water. After the
restructuring of the electricity sector in Oman in 2009, he
moved to Oman Electricity Transmission Company
S.A.O.C (OETC). He is currently working as a Senior
Manager for Transmission Department. He is serving as a
member in many internal committees in OETC as well as
the chairman of product approval committee in OETC.
Salem M. Al-Hinai received the BSc. in Electrical
Engineering from Sultan Qaboos University, Muscat,
Oman in 2001 and joined the University as a
demonstrator in 2001. He has worked as Teaching
Assistant in ECE Department at Dalhousie University.
Currently, he is Lecturer in the Electrical & Computer
Engineering Department at Sultan Qaboos University.
His research interests are in modelling, operation,
protection and control of power systems and distributed
generators.
Rashid S. Al-Abri was born in Oman. He received the
B.Sc in electrical engineering from Sultan Qaboos
University, Oman, in 2002. Then he did his M.Sc. in
electrical engineering from Curtin University of
Technology, Western Australia, and Ph.D. degree from
the Department of Electrical and Computer Engineering,
University of Waterloo, Waterloo, ON, Canada.
Currently, he is with Sultan Qaboos university, Muscat,
Oman. His research interests are power system stability,
power quality, power electronics, and distributed
generation.
https://doi.org/10.24084/repqj12.218 43 RE&PQJ, Vol.1, No.12, April 2014