Embed Size (px)
Citation preview

Measures for containing an increase in pipes’ dose-equivalent rate in the hydrogen-injected environment at the Shimane Nuclear Power Station Unit 1
1
Tomohiro Minami The Chugoku Electric Power Co., Inc.
Shimane Nuclear Power Station

All Right Reserved. Copyright © 2006 ,THE CHUGOKU ELECTRIC POWER CO., INC.
Table of Content
○ Outline of Shimane Nuclear Power Station
○ Hydrogen injections performance at Shimane Nuclear Power Station
○ Transition of PLR piping dose-equivalent rate
○ Management of gradual hydrogen injection termination
○ Current piping dose-equivalent rate
○ Future tasks
2

All Right Reserved. Copyright © 2006 ,THE CHUGOKU ELECTRIC POWER CO., INC.
Niigata
TokyoFukuoka
Hiroshima
Osaka
Sendai
Kyoto
CHUGOKU
REGION
Sapporo
SHIMANE NUCLEARPOWER STATION
Shimane Prefecture
Yamaguchi Prefecture
Hiroshima Prefecture
Okayama Prefecture
Tottori Prefecture
Hiroshima
Matsue
Yamaguchi
Yonago
Okayama
★
Outline of Shimane NPS(1/2)
3

All Right Reserved. Copyright © 2006 ,THE CHUGOKU ELECTRIC POWER CO., INC.
Outline of Shimane NPS(2/2)
Unit No. Capacity(MW)
ReactorType
Commercial
Operation
1 460 BWR Mar.1974
2 820 BWR Feb.1989
Unit 2
Unit 1
4

All Right Reserved. Copyright © 2006 ,THE CHUGOKU ELECTRIC POWER CO., INC.
Hydrogen injections performance at Shimane Nuclear Power Station
5
Year Outage/Cycle
Feed-waterhydrogen
concentration (ppm)
Description
January 1998 20th outage - ・ Installed a hydrogen injection facility (Trailer system)
February 1998 21st cycle 0 ~ 0.70.50
・ Gradual injection test (increment of 0.1ppm)・ Started continuous injection
March 1999 22nd cycle 0.45 ・ Conducted gradual injection and regular termination・ Changed hydrogen concentration due to influence on the MS monitor
May 1999 - May 2000
22nd outage - ・ Conducted shroud replacement(Chemical decontamination inside the reactor in the HOP method)
April 2000 23rd cycle 0.40 ・ Changed hydrogen concentration due to influence on the MS monitor
December 2001 24th cycle 0.40 ・ Conducted gradual injection and regular termination
February 2005 25th outage-
・ PLR piping repair work(Chemical decontamination of PLR pump inlet and outlet piping in the HOP method)
August 2005 26th cycle - ・ Preliminary oxidative operation・ Conducted gradual injection and regular termination

All Right Reserved. Copyright © 2006 ,THE CHUGOKU ELECTRIC POWER CO., INC.
Transition of PLR piping dose-equivalent rate (Pump A (21th outage))
PLR(A) inlet vertical piping
0.0E+0
1.0E+5
2.0E+5
3.0E+5
4.0E+5
5.0E+5
17th 18th 19th Interim Stoppage 20th 21st
Am
ount
of
nucl
ide
depo
sit(
Bq/
cm2)
0
1
2
3
4
5
dose
-equ
ival
ent
rate
(mSv/
h)
Co- 58Co- 60Mn- 54Fe- 59dose- equivalent rate
PLR(A) outlet vertical piping
0.0E+0
1.0E+5
2.0E+5
3.0E+5
4.0E+5
5.0E+5
18th 19th iInterim Stoppage 20th 21st
Am
ount
of
nuclid
ede
posi
t(B
q/cm
2)
0
1
2
3
4
5
dose
-equ
ival
ent
rate
(mSv/
h)Co- 58
Co- 60
Mn- 54
Fe- 59
dose- equivalent rate
6
All Right Reserved. Copyright © 2006 ,THE CHUGOKU ELECTRIC POWER CO., INC.
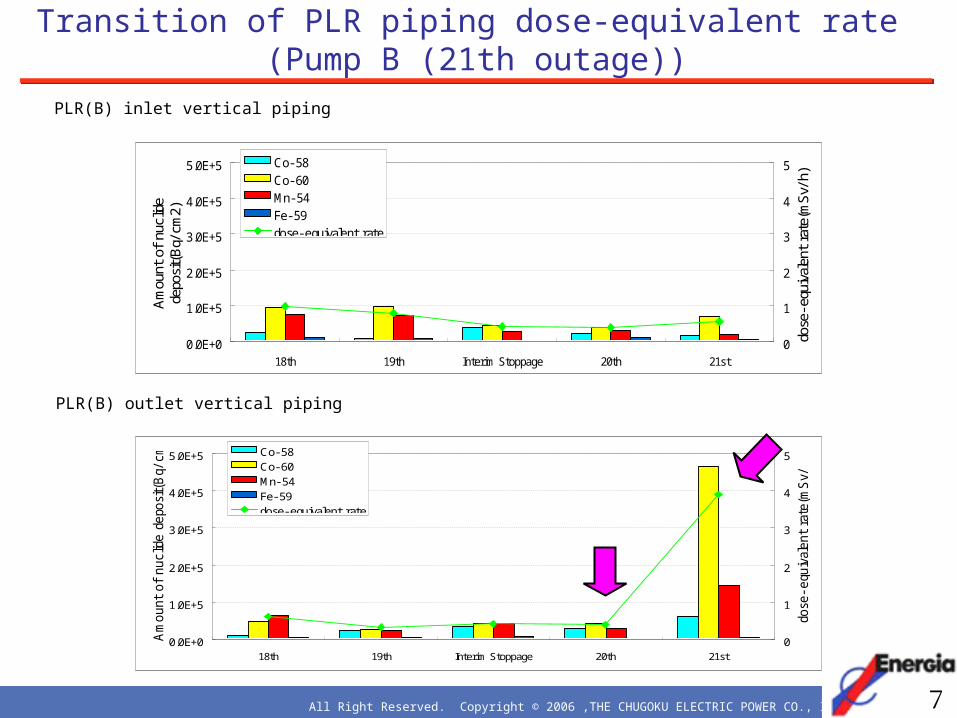
Transition of PLR piping dose-equivalent rate (Pump B (21th outage))
PLR(B) inlet vertical piping
PLR(B) outlet vertical piping
0.0E+0
1.0E+5
2.0E+5
3.0E+5
4.0E+5
5.0E+5
18th 19th Interim Stoppage 20th 21st
Am
ount
of
nuclid
e d
epo
sit(
Bq/
cm
2)
0
1
2
3
4
5
dose
-equ
ival
ent
rate
(mSv/
h)Co- 58Co- 60Mn- 54Fe- 59dose- equivalent rate
7
0.0E+0
1.0E+5
2.0E+5
3.0E+5
4.0E+5
5.0E+5
18th 19th Interim Stoppage 20th 21st
Am
ount
of
nucl
ide
depo
sit(
Bq/
cm2)
0
1
2
3
4
5
dose
-equ
ival
ent
rate
(mSv
/h)Co- 58
Co- 60Mn- 54Fe- 59dose- equivalent rate

All Right Reserved. Copyright © 2006 ,THE CHUGOKU ELECTRIC POWER CO., INC.
Dose-equivalent rate distribution in the axis / circumferential directions at the PLR pump outlet piping
21st outage Dose-equivalent rate of the A-PLR pump outlet piping
0.00
1.00
2.00
3.00
4.00
5.00
6.00
K J I H G F E D C B Aposition
pipi
ng d
ose-
equi
vale
nt r
ate(
mSv/
h)
0°90°180°270°
flow
8
The fluctuation of dose-equivalent rate in the axis and circumferential directions was evaluated as attributable to cladding buildup and the increase of dose-equivalent rate.

All Right Reserved. Copyright © 2006 ,THE CHUGOKU ELECTRIC POWER CO., INC.
Base material Base material
In the HWC environment (low hydrogen peroxide), reactor water is in reductive atmosphere, oxidizing chromium acid forms clad deposits on piping internal surfaces.
In the NWC environment, chromium oxide clad on piping's internal surfaces ionizes and elutes into the reactor water.
Chromium forms under the HWC / NWC environment
9
HWC environment NWC environment
Cr2O3 (Insoluble)
CrO42-(Soluble)

All Right Reserved. Copyright © 2006 ,THE CHUGOKU ELECTRIC POWER CO., INC.
Hydrogen injection termination/start pattern (21st cycle)
Hydrogen injection termination/start pattern in the 21st cycle
0
0.1
0.2
0.3
0.4
0.5
0.6
0.7
0.8
0.9
1
Feed
-wate
r h
yd
rog
en
con
cen
trati
on
(p
pm
)
Continuous injectionstarted at the feed-waterhydrogen concentration of0.5ppm
Termination of hydrogen injection associated with CR patternadjustment
Feed-water hydrogen concentration0.5ppm→0.1ppm(maintained for 24 hours )→Termination
21st cycle 21st outage
February
1998
Start of injection
0.5ppm
0.1ppm
Continuous operation for
around 300 days
10
( day)

All Right Reserved. Copyright © 2006 ,THE CHUGOKU ELECTRIC POWER CO., INC.
Transition of reactor-water conductivity and chromium acid concentration (21st cycle)
21cyc
0
5
10
15
20
25
0:00 12:00 0:00 12:00 0:00 12:00 0:00 12:00 0:00 12:00
Con
duct
ivity
μS/
m(
)
21cyc
0.5ppm 0.1ppm 0.0ppm21cyc
05
1015202530
0:00 12:00 0:00 12:00 0:00 12:00 0:00 12:00 0:00 12:00
Chro
miu
m a
cid
conc
entr
atio
npp
b(
)
21cyc
11
( Time )
( Time )

All Right Reserved. Copyright © 2006 ,THE CHUGOKU ELECTRIC POWER CO., INC.
External layer (Ferrite)Internal
layer(Chromite)
Clad deposit (Fe, Cr)
Base material
Radioactive ion
Shimane Unit 1 21st outage
Continuous 300-day HWC operation increased the amount of chromium deposit from reactor water. The change of environment (HWC -> NWC) eluted chromium, causing uneven piping's internal surfaces, thereby increasing the amount of cladding.
Mechanism of how the dose-equivalent rate of PLR outlet piping increased (21st outage)
12

All Right Reserved. Copyright © 2006 ,THE CHUGOKU ELECTRIC POWER CO., INC.
Mechanism of how hot spots developed at the PLR pump outlet
PLR pump outlet piping
Swirls at the PLR pump and elbow outlets disturbed the flow significantly.
Environmental change and flow disturbance at the pump outlet increased partial dissolution of Chromium oxides on piping's internal surfaces and aggravated surface unevenness.
The amount of clad deposits at the PLR pump outlet piping showed a localized increase.
Increase of dose-equivalent rate at the PLR pump outlet piping
13
After extended stable operation with hydrogen injection (around 300 days), terminated hydrogen injection and resumed the injection upon changing the pattern (12/1998).Reactor water environmentReductive→ Oxidative
Reactor water’s radioactive concentration increased upon termination of hydrogen injection.

All Right Reserved. Copyright © 2006 ,THE CHUGOKU ELECTRIC POWER CO., INC.
Hydrogen injection termination/ start pattern in the 22nd cycle
0
0.1
0.2
0.3
0.4
0.5
0.6
0.7
0.8
0.9
1
Feed
-wat
er h
ydro
gen
conc
entr
atio
npp
m(
)
22nd Cycle
Management of gradual hydrogen injection termination (reflection to the 22nd cycle)
Pattern of hydrogen injection termination / start
Termination patternFeed-water hydrogen concentration0.45ppm→0.2ppm (maintained for 24 hours) → Termination (3 days)→0.2ppm (maintained for 24 hours)→0.45ppm
Maintained for 24 hours
0.45ppm
0.2ppm
0ppm
0.45ppm
0.2ppm
Hydrogen injection termination once every three months
14
Operation for around 3 months
Operation for around 3 months
3 day stoppage

All Right Reserved. Copyright © 2006 ,THE CHUGOKU ELECTRIC POWER CO., INC.
05
1015202530
0:00 12:00 0:00 12:00 0:00 12:00 0:00 12:00 0:00 12:00
Chro
mium
acid
con
cent
ratio
npp
b(
)
21cyc
22cyc(J un)
22cyc(Sep)
22cyc(Nov)
22cyc(Mar)
0
5
10
15
20
25
0:00 12:00 0:00 12:00 0:00 12:00 0:00 12:00 0:00 12:00
Cond
uctiv
ityμ
S/m
()
21cyc
22cyc(J un)
22cyc(Sep)
22cyc(Nov)
22cyc(Mar)
0.45ppm 0.2ppm 0.0ppm
0.5ppm 0.1ppm 0.0ppm21cyc
22cyc
Transition of reactor-water conductivity and chromium acid concentration (21st and 22nd cycles)
15
( Time )
( Time )

All Right Reserved. Copyright © 2006 ,THE CHUGOKU ELECTRIC POWER CO., INC.
0.0E+0
1.0E+5
2.0E+5
3.0E+5
4.0E+5
5.0E+5
20th 21st 22nd
Am
ount
of
nucl
ide
depo
sit(
Bq/
cm2)
0
1
2
3
4
5
Dos
e-eq
uiva
lent
rat
e(m
Sv/h
)Co- 58Co- 60
Mn- 54Fe-59dose- equivalent rate
Transition of PLR piping dose-equivalent rate (Pump A (22nd outage))
PLR(A) inlet vertical piping
PLR(A) outlet vertical piping
16
0.0E+0
1.0E+5
2.0E+5
3.0E+5
4.0E+5
5.0E+5
20th 21st 22nd
Amou
nt o
f nuc
lide
depo
sit(B
q/cm
2)
0
1
2
3
4
5
dose
-equ
ivale
ntra
te(m
Sv/h
)
Co-58Co-60
Mn- 54Fe- 59
dose-equivalent rate

All Right Reserved. Copyright © 2006 ,THE CHUGOKU ELECTRIC POWER CO., INC.
0.0E+0
1.0E+5
2.0E+5
3.0E+5
4.0E+5
5.0E+5
20th 21st 22nd
Am
ount
of
nucl
ide
depo
sit(
Bq/
cm2)
0
1
2
3
4
5
Dos
e-eq
uiva
lent
rate
(mSv
/h)
Co- 58Co- 60Mn- 54Fe- 59Dose- equivalent rate
0.0E+0
1.0E+5
2.0E+5
3.0E+5
4.0E+5
5.0E+5
20th 21st 22nd
Amou
nt o
f nuc
lide
depo
sit(B
q/cm
2)
0
1
2
3
4
5
Dose
-equ
ivale
ntra
te(m
Sv/h
)
Co- 58Co- 60Mn- 54Fe- 59Dose- equivalent rate
Transition of PLR piping dose-equivalent rate (Pump B (22nd outage))
PLR(B) inlet vertical piping
PLR(B) outlet vertical piping
17

All Right Reserved. Copyright © 2006 ,THE CHUGOKU ELECTRIC POWER CO., INC.
Transition of PLR piping dose-equivalent rate (Pump A (23rd outage))
PLR(A) inlet vertical piping
0.0E+0
1.0E+5
2.0E+5
3.0E+5
4.0E+5
5.0E+5
20th 21st 22nd After decontamination 23rd
Am
ount
of
nucl
ide
depo
sit(
Bq/
cm2)
0
1
2
3
4
5
Dos
e-eq
uiva
lent
rat
e(m
Sv/
h)
Co- 58Co- 60Mn- 54Fe- 59Dose- equivalent rate
PLR(A) outlet vertical piping
0.0E+0
1.0E+5
2.0E+5
3.0E+5
4.0E+5
5.0E+5
20th 21st 22nd After decontamination 23rd
Am
ount
of nuclid
e d
epo
sit(
Bq/
cm
2)
0
1
2
3
4
5
Dose
-equ
ival
ent
rate
(mSv/
h)
Co- 58Co- 60Mn- 54Fe- 59Dose- equivalent rate
Shroud replacement work
(Chemical decontamination inside the reactor)
↓
Shroud replacement work
(Chemical decontamination inside the reactor)
↓
18

All Right Reserved. Copyright © 2006 ,THE CHUGOKU ELECTRIC POWER CO., INC.
Transition of PLR piping dose-equivalent rate (Pump B (23rd outage))
PLR(B) inlet vertical piping
PLR(B) outlet vertical piping
0.0E+0
1.0E+5
2.0E+5
3.0E+5
4.0E+5
5.0E+5
20th 21st 22nd After decontamination 23rd
Am
ount
of
nucl
ide
depo
sit(
Bq/
cm2)
0
1
2
3
4
5
Dos
e-eq
uiva
lent
rate
(mSv
/h)
Co- 58Co- 60Mn- 54Fe- 59Dose- equivalent rate
0.0E+0
1.0E+5
2.0E+5
3.0E+5
4.0E+5
5.0E+5
20th 21st 22nd After decontamination 23rd
Am
ount
of
nucl
ide
depo
sit(
Bq/
cm2)
0
1
2
3
4
5
Dos
e-eq
uiva
lent
rat
e(m
Sv/
h)
Co- 58Co- 60Mn- 54Fe- 59Dose- equivalent rate
19
Shroud replacement work
(Chemical decontamination inside the reactor)
↓
Shroud replacement work
(Chemical decontamination inside the reactor)
↓

All Right Reserved. Copyright © 2006 ,THE CHUGOKU ELECTRIC POWER CO., INC.
Base material Base material
Mechanism of how radioactive deposits built up in the HWC environment (23rd outage onward)
20
HWC Environment
NWC Environment
Radioactive ion Radioactive ion
Clad deposits(Fe 、 Cr)External layer
(Ferrite)Internal layer (Chromite)
The HWC environment (low hydrogen peroxide) encourages a buildup of the external layer (ferrite) with low protective property, and an internal layer (chromite) that readily captures Co, thereby increasing the amount of Co-60 deposit.
Operation under the NWC environment forms a dense external layer. This reduces elution of metal ions from the base, and contains the growth of the external layer (ferrite) and internal layer (chromite), thereby decreasing Co-60 deposits.

All Right Reserved. Copyright © 2006 ,THE CHUGOKU ELECTRIC POWER CO., INC.
Current PLR piping dose-equivalent rate (Pump A (25th outage))
PLR(A) inlet vertical piping
0.0E+0
1.0E+5
2.0E+5
3.0E+5
4.0E+5
5.0E+5
20th 21st 22nd Afterdecontamination
23rd End of 23rd 24th 25th
Am
ount
of
nuclid
ede
posi
t(B
q/cm
2)
0
1
2
3
4
5
Dose
-equ
ival
ent
rate
(mSv/
h)
Co- 58Co- 60Mn- 54Fe- 59Dose- equivalent rate
PLR(A) outlet vertical piping
0.0E+0
1.0E+5
2.0E+5
3.0E+5
4.0E+5
5.0E+5
20th 21st 22nd Afterdecontamination
23rd End of 23rd 24th 25th
Am
ount
of
nuclid
e d
eposit(B
q/cm
2)
0
1
2
3
4
5
Dose-equiv
ale
nt
rate
(mSv/h)
Co- 58Co- 60Mn- 54Fe- 59Dose- equivalent rate
Shroud replacement work
(Chemical decontamination inside
the reactor)
Shroud replacement work
(Chemical decontamination inside the reactor)
PLR piping repair work(Chemical
decontamination)
PLR piping repair work(Chemical
decontamination)
21

All Right Reserved. Copyright © 2006 ,THE CHUGOKU ELECTRIC POWER CO., INC.
Current PLR piping dose-equivalent rate (Pump B (25th outage))
PLR(B) inlet vertical piping
PLR(B) outlet vertical piping
0.0E+0
1.0E+5
2.0E+5
3.0E+5
4.0E+5
5.0E+5
20th 21st 22nd Afterdecontamination
23rd End of 23rd 24th 25th
Am
ount
of
nuclid
ede
posi
t(B
q/cm
2)
0
1
2
3
4
5
Dose
-equ
ival
ent
rate
(mSv/
h)
Co- 58Co- 60Mn- 54Fe- 59Dose- equivalent rate
0.0E+0
1.0E+5
2.0E+5
3.0E+5
4.0E+5
5.0E+5
20th 21st 22nd Afterdecontamination
23rd End of 23rd 24th 25th
Am
ount
of
nuclid
ede
posi
t(B
q/cm
2)
0
1
2
3
4
5
Dose
equ
ival
ent
rate
(mSv/
h)
Co- 58Co- 60Mn- 54Fe- 59Dose equivalent rate
Shroud replacement work
(Chemical decontamination inside the reactor)
Shroud replacement work
(Chemical decontamination inside
the reactor)
22
PLR piping repair work(Chemical
decontamination)
PLR piping repair work(Chemical
decontamination)

All Right Reserved. Copyright © 2006 ,THE CHUGOKU ELECTRIC POWER CO., INC.
PLR piping dose-equivalent rate after chemical decontamination (comparison with other plants)
23
0.00
0.50
1.00
1.50
2.00
-2 -1 0 1 2 3 4Outage No. counted from the outage when decontamination was conducted
PLR
pip
ing
dose
rat
e(m
Sv/h
)
Shimane Unit 1BBBCBEJ AGBGD

All Right Reserved. Copyright © 2006 ,THE CHUGOKU ELECTRIC POWER CO., INC.
Future tasks
Dose-equivalent rate assessment after preliminary oxidization operation
Application to Shimane Unit 2
Introduction of a startup hydrogen injection facility at Shimane Unit 1
24

All Right Reserved. Copyright © 2006 ,THE CHUGOKU ELECTRIC POWER CO., INC.
Thank you.
Measures for containing an increase in pipes’ dose-equivalent
rate in the hydrogen-injected environment at the Shimane Nuclear Power Station Unit 1
25