Embed Size (px)
Citation preview
IntroductionAs described in Chapter 1, epidemiologists study the distribution anddeterminants of disease frequency in human populations in order to con-trol health problems.1(p1), 2(p62) Thus, the objectives of epidemiology are todetermine the extent of disease in a population, identify patterns andtrends in disease occurrence, identify the causes of disease, and evaluatethe effectiveness of prevention and treatment activities. Measuring howoften a disease arises in a population is usually the first step in achievingthese goals.
33
2Measures of Disease Frequency
LEARNING OBJECTIVESBy the end of this chapter, the reader will be able to:■ Define and provide examples of a population.■ Distinguish between a fixed and dynamic (or open) population.■ Explain how epidemiologists create a case definition and discuss how
the definition of acquired immunodeficiency syndrome (AIDS) haschanged over time.
■ Describe the key aspects of measuring disease occurrence.■ Define and distinguish between cumulative incidence, incidence rate,
and prevalence.■ Describe the mathematical relationship between the measures of disease
frequency.■ Provide examples of commonly used measures of disease frequency in
public health.
4025X_CH02_033_058.qxd 4/13/07 9:28 AM Page 33

This chapter describes how epidemiologists quantify the occurrence ofdisease in a population. Readers will learn that this quantification processinvolves developing a definition of a particular disease, counting the num-ber of people who are affected by the disease, determining the size of thepopulation from which the diseased cases arose, and accounting for thepassage of time.
Definition of a PopulationBecause epidemiology is concerned with the occurrence of disease ingroups of people rather than in individuals, populations are at the heart ofepidemiologists’ measurements. A population can be defined as a group ofpeople with a common characteristic such as place of residence, religion,gender, age, use of hospital services, or life event (such as giving birth).
Location of residence such as a country, state, city, or neighborhood isone of the most common ways to define a population. For example, thepeople who reside in the Brooklyn borough of New York City, the city ofBoston, the state of Oregon, and the country of Sweden are members of dis-tinct populations defined by geopolitical entities ranging in size from aneighborhood to an entire country. Residence near natural geographic fea-tures such as rivers, mountains, lakes, or islands can also be used to definea population. For example, people who live along the 2350-mile length ofthe Mississippi River, around Mount St. Helens in Washington State, andon Nantucket Island off the coast of Massachusetts are members of popu-lations defined by geographic formations.
Because epidemiology focuses on disease occurrence, populations arecommonly defined in relation to a medical facility such as a doctor’s office,clinic, or hospital. The service population of a medical facility (also calledcatchment population) consists of the people who use the facility’s services.This population is often difficult to define because an individual’s decisionto use a facility may depend on how far it is from home, the person’s partic-ular medical condition, his or her type of medical insurance, and so forth.
Consider a situation in which a county has only one general hospital,which provides the complete range of medical services including preven-tive care, birthing services, and diagnostic and therapeutic services for acuteand chronic conditions. The catchment population for this general hospitalis likely to consist of all people who live in the county where the hospital islocated (see Figure 2–1).
Now suppose that this hospital enhances its cardiology department,adding many well-trained clinicians and the latest diagnostic equipment. Asthe cardiology department’s reputation for excellent care grows, patientstravel from greater distances to receive care. As a result, the catchment pop-ulation for the cardiology department expands to the surrounding countieswhile the catchment population for the other hospital services, particularly
34 E S S E N T I A L S O F E P I D E M I O L O G Y I N P U B L I C H E A LT H
4025X_CH02_033_058.qxd 4/13/07 9:28 AM Page 34
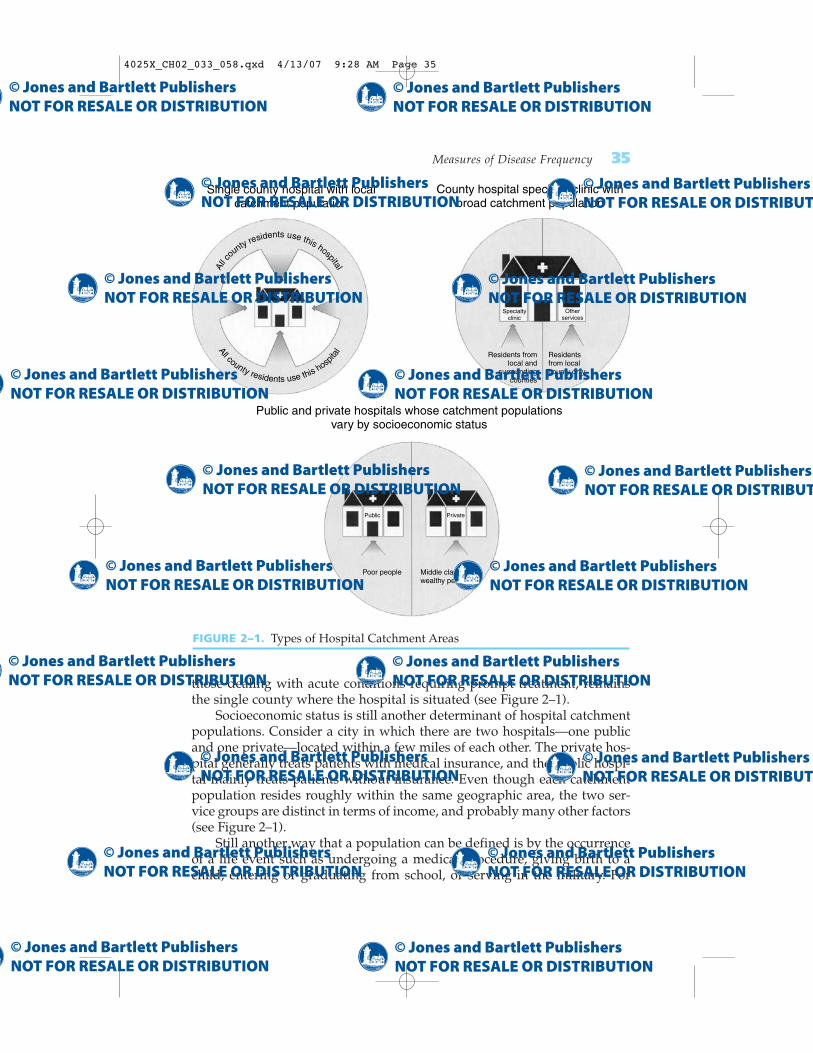
those dealing with acute conditions requiring prompt treatment, remainsthe single county where the hospital is situated (see Figure 2–1).
Socioeconomic status is still another determinant of hospital catchmentpopulations. Consider a city in which there are two hospitals—one publicand one private—located within a few miles of each other. The private hos-pital generally treats patients with medical insurance, and the public hospi-tal mainly treats patients without insurance. Even though each catchmentpopulation resides roughly within the same geographic area, the two ser-vice groups are distinct in terms of income, and probably many other factors(see Figure 2–1).
Still another way that a population can be defined is by the occurrenceof a life event such as undergoing a medical procedure, giving birth to achild, entering or graduating from school, or serving in the military. For
Measures of Disease Frequency 35
FIGURE 2–1. Types of Hospital Catchment Areas
County hospital specialty clinic withbroad catchment population
Single county hospital with localcatchment population
Public and private hospitals whose catchment populationsvary by socioeconomic status
Residents fromlocal and
surroundingcounties
Residentsfrom localcounty only
Specialtyclinic
Otherservices
All c
ounty residents use this hospital
All county residents use this hosp
ital
Poor people Middle class andwealthy people
Public Private
4025X_CH02_033_058.qxd 4/13/07 9:28 AM Page 35

example, students who graduated from college in 2005 are members of thepopulation known as the “Class of ’05,” and the men and women whoserved in the United States. military during the Persian Gulf War are mem-bers of the population known as Gulf War veterans. Populations are oftendefined by other characteristics such as age, gender, religion, or type of job.
A unifying framework for thinking about a population is whether itsmembership is permanent or transient (see Table 2–1). A population whosemembership is permanent is called a fixed population. Its membership isalways defined by a life event. For example, the people who were inHiroshima, Japan, when the atomic bomb exploded at the end of WorldWar II are members of a fixed population. This population will never gainany new members because only people who were at this historical eventcan be members.
The opposite of a fixed population is a dynamic or open population. Itsmembership is defined by a changeable state or condition, and so is tran-sient. A person is a member of a dynamic population only as long as he orshe has the defining state or condition. For example, the population of thecity of Boston is dynamic because people are members only while theyreside within the city limits. Turnover is always occurring because peopleenter the city by moving in or by birth, and people leave the city by mov-ing away or by death. The term steady state describes a situation in whichthe number of people entering the population is equal to the number leav-ing. Dynamic populations include groups defined by geographic and hos-pital catchment areas, religious groups, and occupations.
Regardless of the way in which it is defined, a population can bedivided into subgroups on the basis of any characteristic. For example,men who undergo coronary bypass surgery are a gender subgroup of afixed population defined by a life event, and all children up to six years ofage who live along the Mississippi River are an age subgroup of a dynamicpopulation defined by a geographic formation.
Definitions of Health and DiseaseIn 1948, the World Health Organization defined health as “a state of com-plete physical, mental and social well-being and not merely the absence ofdisease or infirmity.”3 More recently, Healthy People 2010, a national plan
36 E S S E N T I A L S O F E P I D E M I O L O G Y I N P U B L I C H E A LT H
TABLE 2–1 Types of Populations
Type of population Key element Example
Fixed Membership is based on Japanese atomic bomb survivorsan event and is permanent
Dynamic or open Membership is based on a Residents of a city, hospital condition and is transitory patients
4025X_CH02_033_058.qxd 4/13/07 9:28 AM Page 36
for improving the health of the American people, stated that health is a keyaspect of the quality of life and that it “reflects a personal sense of physicaland mental health and the ability to react to factors in the physical andsocial environments.” The plan also states that the “health-related qualityof life is more subjective than life expectancy and therefore can be moredifficult to measure.”4
Because measurement is a cornerstone of epidemiology, and “health”and “a sense of well-being” are nonspecific and difficult to quantify, epi-demiologists have almost entirely focused their activities on the “absenceof health” such as specific diseases, injuries, disabilities, and death. Conse-quently, epidemiologists must first compose a definition of the “absence ofhealth” or “disease” before they can begin measuring its frequency.
The definition of a disease is usually based on a combination of phys-ical and pathological examinations, diagnostic test results, and signs andsymptoms. Which and how many criteria are used to define a “case” (aperson who meets the disease definition) has important implications foraccurately determining who has the disease.
Consider the various criteria that can be used to define a heart attack“case.” One could use the symptoms of chest pain, the results of diagnos-tic tests such as electrocardiograms, or blood enzyme tests for cardiac dam-age. What are the implications of using only chest pain to define heartattack cases? Using only this nonspecific symptom will capture most butnot all people who have heart attacks because it will miss people who have“silent” heart attacks that occur without chest pain. In addition, it willerroneously include many people who have other conditions that producechest pain, such as indigestion.
A definition that includes more specific criteria such as the results ofdiagnostic tests will be more accurate. For example, if positive bloodenzyme tests are included, silent heart attacks are likely to be picked upand the other conditions that cause chest pain omitted. In practice, epi-demiologists use all available information from physical and pathologicalexaminations and laboratory and other tests to define a case of a disease asaccurately as possible.
Changes in Disease DefinitionsEven when clear-cut criteria are used, disease definitions often changeover time as more is learned about a disease and its various manifestations.For example, the official definition of acquired immune deficiency syn-drome (AIDS) has been changed several times as researchers have gainedknowledge about the disease’s cause and natural course (see Table 2–2).
The story began in the summer of 1981 when the Centers for DiseaseControl and Prevention (CDC) reported that Kaposi’s sarcoma andPneumocystis carinii pneumonia had been observed among previouslyhealthy homosexual men.5 Previously, Kaposi’s sarcoma, a malignant neo-
Measures of Disease Frequency 37
4025X_CH02_033_058.qxd 4/13/07 9:28 AM Page 37

plasm of the blood vessels, had been seen primarily among elderly males,and opportunistic infections such as Pneumocystis carinii pneumonia hadoccurred almost exclusively in people with compromised immune systems.
In 1982 the CDC composed the first definition of AIDS for nationalreporting as “a disease, at least moderately predictive of a defect in cell-mediated immunity, occurring in a person with no known cause for dimin-ished resistance to that disease . . . including Kaposi’s Sarcoma,Pneumocystis carinii pneumonia, and serious other opportunistic infec-tions.”6 Even then, the CDC acknowledged that the case definition wasimperfect because it could possibly miss the full range of AIDS manifesta-tions and falsely include individuals who were not truly immunodeficient.However, because the cause of AIDS was unknown at that time, the defi-nition at least served as a consistent tool for monitoring the epidemic.
The CDC made the first major change in the official AIDS case defini-tion in 1985 after the human immunodeficiency virus (HIV) was deter-mined to be the cause of AIDS and a highly accurate laboratory test wasdeveloped to detect the antibody to the HIV virus.7 Because epidemiolo-gists now knew what to look for and how to find its trail, it was possibleto expand the AIDS case definition from a few severe clinical conditions toa wide range of conditions accompanied by laboratory evidence of HIVinfection. Conversely, it also became possible to exclude patients who hadAIDS-like symptoms but had negative HIV antibody test results.
At the end of 1992, the CDC changed the AIDS case definition againafter natural history studies revealed the importance of lymphocytes in theHIV infection.8 The new definition was expanded to include individuals
38 E S S E N T I A L S O F E P I D E M I O L O G Y I N P U B L I C H E A LT H
TABLE 2–2 Changes in the Definition of AIDS over Time
Year Existing knowledge about AIDS Conditions included in disease definition
1982 Very limited Only a few conditions including Kaposi's sarcoma, Pneumocystis cariniipneumonia, and other severe oppor-tunistic infections
1985 HIV virus discovered as cause of 23 clinical conditions with laboratory AIDS; antibody test developed evidence of infection
1993 Discovered importance of CD4 26 clinical conditions and asympto-T lymphocytes in monitoring matic cases with low CD4 T lympho-immunodeficiency and disease cyte countsprogression
Sources: Data from Centers for Disease Control. Update on acquired immune deficiency syn-drome (AIDS)—United States. MMWR. 1982;31:507–514. Centers for Disease Control.Revision of the case definition of acquired immune deficiency syndrome for national report-ing—United States. MMWR. 1985;34:373–375. Centers for Disease Control. 1993 revised clas-sification system for HIV infection and expanded surveillance case definition for AIDS amongadolescents and adults. MMWR. 1992;44:1–19.
4025X_CH02_033_058.qxd 4/13/07 9:28 AM Page 38

who had no symptoms of AIDS but had low levels of CD4 T lymphocytes,a type of white blood cell that is responsible for fighting off infections.(These cells are the primary target of HIV and are an excellent marker ofdisease progression.)
In summary, as epidemiologists discovered the cause of AIDS, learnedmore about its different manifestations, and developed a test to detect HIV,the AIDS case definition was expanded from a few severe diseases to manyvaried conditions and the results of sophisticated laboratory tests (seeTable 2–2).
What impact did these changes in case definition have on the numberof reported AIDS cases? In general, any expansion in the case definitionwill increase the number of reportable cases and any contraction willdecrease that number. With AIDS, the definition changes increased thenumber of people who were officially counted as AIDS cases in nationalstatistics in the 1980s and early 1990s.8 More recent trends in AIDS inci-dence are no longer affected by the change in the AIDS case definition.9
Measuring Disease OccurrenceEpidemiologists must always consider three factors when they measurehow commonly a disease occurs in a group of people: (1) the number ofpeople that are affected by the disease, (2) the size of the population fromwhich the cases of disease arise, and (3) the length of time that the popula-tion is followed. Failure to consider all three components will give a falseimpression about the impact of the disease on a population.
Consider the following hypothetical data on the frequency of breastcancer in two counties. In County A, with a population of 50,000, 100 newcases of breast cancer occurred over a one year period. In County B, witha population of 5000, 75 new cases occurred over a three year period.Which county has a higher frequency of new breast cancer cases? If oneconsiders only the number of new cases, it appears that County A has ahigher frequency (100 versus 75). However, simply comparing the numberof cases in each town does not provide a full picture because the casesoccurred over different lengths of time (one versus three years) and amongpopulations of different sizes (50,000 versus 5000) (see Table 2–3).
In order to make a meaningful comparison between the two counties,it is necessary to convert the data into the same population size and timeperiod. Let us estimate the frequency of breast cancer in the two countiesover a one year period and as if each population consisted of 100,000 peo-ple. The frequency of breast cancer in County A is 100 cases/50,000 popu-lation/one year; if the county’s population were 100,000, the frequencywould double to become 200 cases/100,000 population/one year.
Two steps are needed to make a similar conversion for County B. (1) Di-vide the numerator by three to convert the frequency of breast cancer from
Measures of Disease Frequency 39
4025X_CH02_033_058.qxd 4/13/07 9:28 AM Page 39

a three to a one year period: 25 cases/5000 population/one year. (2) Multiplyboth the numerator and denominator by 20 to estimate the frequency for apopulation of 100,000. Thus, the frequency of new cases in County B is 500cases/100,000 population/one year.
Now it is clear that the “rate” at which new cases are occurring is muchhigher in County B than County A (500 cases/100,000 population/one yearversus 200 cases/100,000 population/one year), and that examining onlythe number of new cases gives a false impression. Note that the decision toconvert the frequencies to a population size of 100,000 and a one year timeperiod, while commonly done, is arbitrary. Other population sizes (such as1000 or 10,000) and time periods (such as one month or five years) could beused. The guiding principle is that the same population size and timeperiod should be used for the compared groups.
Types of Calculations: Ratios, Proportions, and RatesThree types of calculations are used to describe and compare measures ofdisease occurrence: ratios, proportions, and rates (see Table 2–4). A ratio issimply one number divided by another. The entities represented by the twonumbers are not required to be related to one another. In other words, theindividuals in the numerator can be different from those in the denomina-tor. For example, the “sex ratio” is a ratio of two unrelated numbers: thenumber of males divided by the number of females, usually expressed asthe number of males per 100 females. In recent U.S. Census data, the sexratio among U.S. residents aged 65 years and older was 73.7 males per 100females.10
A proportion is also one number divided by another, but the entities rep-resented by these numbers are related to one another. In fact, the numera-tor of a proportion is always a subset of the denominator. Proportions, alsoknown as fractions, are often expressed as percentages and range from 0 to1 or 0% to 100%. For example, the proportion of U.S. residents who areblack is the number of black residents divided by the total number of U.S.residents of all races. In recent U.S. Census data, the proportion of blackU.S. residents was 0.125 or 12.5%.10 The remaining proportion included
40 E S S E N T I A L S O F E P I D E M I O L O G Y I N P U B L I C H E A LT H
TABLE 2–3 Hypothetical Data on the Frequency of Breast Cancer in TwoCounties
Type of data County A County B
Number of cases 100 75Population size 50,000 5,000Follow-up period 1 year 3 yearsComparable disease frequency 200/100,000/year 500/100,000/year
4025X_CH02_033_058.qxd 4/13/07 9:28 AM Page 40
whites (0.762 or 76.2%) and other or multiple races (0.112 or 11.2%). Notethat these three proportions add up to 100% because the three groups(black, white, and all other races) are collectively exhaustive.
A rate is also one number divided by another, but time is an integralpart of the denominator. We are familiar with rates in our daily travelssince a rate is a measure of how fast we travel. For example, in many areasof the United States the maximum speed or rate at which cars are permit-ted to travel is 65 miles per hour. This rate can also be written as 65miles/one hour. The measure of time in the denominator is what makesthis number a rate. The measures of disease occurrence calculated previ-ously for Counties A and B are also rates (200 cases/100,000 population/one year and 500 cases/100,000 population/one year, respectively). Un-fortunately, the term rate is often incorrectly used to describe ratios andproportions.11
Measures of Disease FrequencyThe two basic measures of disease frequency in epidemiology are incidenceand prevalence. Incidence measures the occurrence of new disease, andprevalence measures the existence of current disease. Each measuredescribes an important part of the natural course of a disease. Incidencedeals with the transition from health to disease, and prevalence focuses onthe period of time that a person lives with a disease.
IncidenceIncidence is defined as the occurrence of new cases of disease that developin a candidate population over a specified time period. There are three keyideas in this definition. First, incidence measures new disease events. For dis-eases that can occur more than once, it usually measures the first occur-rence of the disease.
Second, new cases of disease are measured in a candidate population,which is a population of people who are “at risk” of getting the disease.Someone is at risk because he or she has the appropriate body organ, is notimmune, and so forth. For example, a woman who still has an intact uterus
Measures of Disease Frequency 41
TABLE 2–4 Types of Calculations
Type of calculation Characteristics
Ratio Division of two unrelated numbers
Proportion Division of two related numbers; numerator is a subset of denominator
Rate Division of two numbers; time is always in denominator
4025X_CH02_033_058.qxd 4/13/07 9:28 AM Page 41

(that is, she has not undergone a hysterectomy) is a candidate for gettinguterine cancer, and a child who has not been fully immunized against thepolio virus is a candidate for contracting poliomyelitis. Although it is pos-sible to define and measure the incidence of disease in a population not atrisk (for example, the incidence of uterine cancer in women who haveundergone hysterectomies is, by definition, zero), it is not a particularlyinteresting pursuit.
Third, incidence takes into account the specific amount of time that themembers of the population are followed until they develop the disease.Because incidence measures a person’s transition from a healthy to a dis-ease state, time must pass for this change to occur and be observed. Asdescribed in the following sections, there are two types of incidence mea-sures: cumulative incidence and incidence rate. Although closely related,each measure has different strengths and weaknesses and is used in differ-ent settings.
Cumulative Incidence
Cumulative incidence is defined as the proportion of a candidate popula-tion that becomes diseased over a specified period of time. Mathematically,it is expressed as follows:
Number of new cases of diseaseOver a specified time periodNumber in candidate population
Note that the numerator (new cases of disease) is a subset of the denomi-nator (candidate population), and so the possible value of cumulative inci-dence ranges from 0 to 1 or, if expressed as a percentage, from 0 to 100%.Time is not an integral part of this proportion but rather is expressed by thewords that accompany the numbers of the cumulative incidence measure.Thus, cumulative incidence is dimensionless (see Table 2–5).
42 E S S E N T I A L S O F E P I D E M I O L O G Y I N P U B L I C H E A LT H
TABLE 2–5 Distinguishing Characteristics of Incidence and Prevalence
Type of Type of Measure number Units Range cases Major uses
Cumulative Proportion None 0 to 1 New Research on causes,incidence, prevention,and treatment of disease
Incidence rate True rate 1/time 0 to New Research on causes,or t�1 infinity prevention, and
treatment of disease
Prevalence Proportion None 0 to 1 Existing Resource planning
4025X_CH02_033_058.qxd 4/13/07 9:28 AM Page 42
Cumulative incidence can be thought of as the average risk of getting adisease over a certain period of time. (A risk is the probability of getting a dis-ease.) A commonly cited measure of cumulative incidence is the “lifetimerisk of breast cancer” among women. Currently estimated at “one in eight”among U.S. women, it means that 13% of women will develop breast cancersometime during the course of their lives.12 Cumulative incidence is influ-enced by the length of time to which it applies. Generally, the cumulativeincidence over a long period of time (such as a lifetime) will be higher thanthat over a few years.
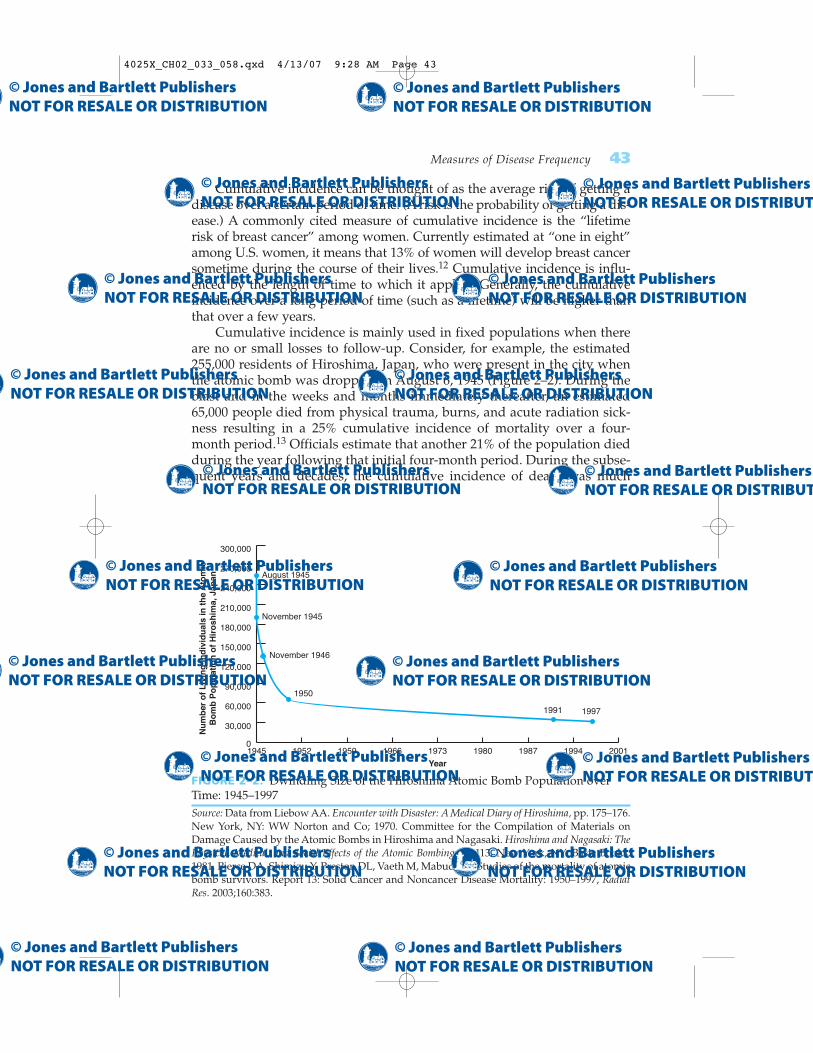
Cumulative incidence is mainly used in fixed populations when thereare no or small losses to follow-up. Consider, for example, the estimated255,000 residents of Hiroshima, Japan, who were present in the city whenthe atomic bomb was dropped on August 6, 1945 (Figure 2–2). During theblast and in the weeks and months immediately thereafter, an estimated65,000 people died from physical trauma, burns, and acute radiation sick-ness resulting in a 25% cumulative incidence of mortality over a four-month period.13 Officials estimate that another 21% of the population diedduring the year following that initial four-month period. During the subse-quent years and decades, the cumulative incidence of death was much
Measures of Disease Frequency 43
FIGURE 2–2. Dwindling Size of the Hiroshima Atomic Bomb Population overTime: 1945–1997Source: Data from Liebow AA. Encounter with Disaster: A Medical Diary of Hiroshima, pp. 175–176.New York, NY: WW Norton and Co; 1970. Committee for the Compilation of Materials onDamage Caused by the Atomic Bombs in Hiroshima and Nagasaki. Hiroshima and Nagasaki: ThePhysical, Medical, and Social Effects of the Atomic Bombings. p 113. New York, NY: Basic Books;1981. Pierce DA, Shimizu Y, Preston DL, Vaeth M, Mabuchi K. Studies of the mortality of atomicbomb survivors. Report 13: Solid Cancer and Noncancer Disease Mortality: 1950–1997, RadiatRes. 2003;160:383.
1945 1952 1959 1966 1973 1980 1987 1994 20010
30,000
60,000
90,000
120,000
150,000
180,000
210,000
240,000
270,000
300,000
August 1945
November 1945
November 1946
1950
1991 1997
Nu
mb
er o
f L
ivin
g In
div
idu
als
in t
he
Ato
mic
Bo
mb
Po
pu
lati
on
of
Hir
osh
ima,
Jap
an
Year
4025X_CH02_033_058.qxd 4/13/07 9:28 AM Page 43

lower, and different causes of death such as cancer predominated.14 Thecumulative incidence of death was 52% over the 47-year period from 1950through 1997 among Hiroshima and Nagasaki survivors who wereenrolled in the Life Span Cohort Study of the effects of high-dose radiationon the incidence of disease and death.14
Note that the cumulative incidence of death during the first 16 monthsafter the bomb was dropped (25% � 21% � 46%) was close to that duringthe 47-year follow-up period of the Life Span Cohort Study (52%). Thisfinding underscores the importance of describing the time period that themeasure covers.
Everyone in the Hiroshima atomic bomb population will eventually die,and the cumulative incidence of mortality will ultimately be 100%. In addi-tion, the size of the candidate population dwindles as members die. Forexample, all 255,000 residents were at risk of dying when the bomb wasdropped in August 1945, while approximately 190,000 survivors of the initialperiod were at risk of dying during the subsequent years (see Figure 2–2).
One critical assumption underlies the cumulative incidence measure.Everyone in the candidate population has been followed for the specifiedtime period. Thus, the estimate that women have a 13% lifetime risk of breastcancer assumes that a population was followed for incidence of breast can-cer from birth until death, an average of 70 to 80 years. Complete follow-upis difficult to attain, particularly in a dynamic population where members arecontinually entering and exiting. Thus, cumulative incidence is usuallyreserved for fixed populations, particularly when there are no or few lossesto follow-up.
Incidence Rate
Incidence rate is defined as the occurrence of new cases of disease that ariseduring person-time of observation. Mathematically, the incidence rate isexpressed as follows:
Number of new cases of diseasePerson-time of observation in candidate population
Note that the numerator for incidence rate is identical to that of cumulativeincidence. The difference between the two measures lies in the denomina-tor. The incidence rate’s denominator integrates time (t), and so it is a truerate.11 Thus, its dimension is 1/t or t �1, and its possible values range fromzero to infinity (Table 2–5). An incidence rate of infinity is possible if allmembers of a population die instantaneously.
The concept of person-time can be difficult to understand. Person-timeis accrued only among candidates for the disease. Thus, a person con-
44 E S S E N T I A L S O F E P I D E M I O L O G Y I N P U B L I C H E A LT H
4025X_CH02_033_058.qxd 4/13/07 9:28 AM Page 44

tributes time to the denominator of an incidence rate only up until he or sheis diagnosed with the disease of interest. However, unlike for cumulativeincidence, the incidence rate is not based upon the assumption that every-one in the candidate population has been followed for a specified timeperiod. Person-time is accrued only while the candidate is being followed.Accrual of person-time stops when the person dies or is lost to follow-up(such as when a person moves away from a community). The incidencerate can be calculated for either a fixed or dynamic population. However,because it directly takes into account population changes (such as migra-tion, birth, and death), it is especially useful as a measure of the transitionbetween health and disease in dynamic populations.
Consider the following population of a hypothetical town (Figure 2–3).This dynamic population of five individuals is followed for the 10-yearperiod from 1994 to 2004. Person A moved into town in 1995, was diag-nosed with disease in 1999, and so accrued four years of person-time.Person B was a resident of the town at the start of the observation period in1994, died in 2000, and so accrued six person-years. Person C moved totown in 1996 and remained healthy until he moved away in 1999. Theinvestigator could not determine where he moved and so could not learn ifhe became diseased later. Person C was considered lost to follow-up as ofthe time he moved, and so he accrued three person-years. Person D was aresident of the town at the start of the observation period, remained
Measures of Disease Frequency 45
FIGURE 2–3. Measurement of Person–Time in a Hypothetical Population
A
B
C
D
E
Total Population (A, B, C, D, E)
1984 1985 1986 1987 1988 1989 1990 1991 1992 1993 1994
Observation Period
No. Person-YearsAccrued
� 30
(Diagnosed with disease)
(Dies)
(Moves away, lost)
4
6
3
10
7
1994 1995 1996 1997 1998 1999 2000 2001 2002 2003 2004
4025X_CH02_033_058.qxd 4/13/07 9:28 AM Page 45

healthy for the entire period, and so accrued 10 years of person-time.Person E was born to Person A in 1997, remained healthy for the entireobservation period, and so accrued seven person-years.
The incidence rate in this hypothetical population is 1/30 person-years.Only one person became diseased and 30 person-years of observation wereaccrued by the population. The denominator of the incidence rate is thesum of person-time accrued by each member of the population at risk.
Now consider an actual population of 1762 women who were studiedto determine the relationship between radioactive iodine therapy forhyperthyroidism (an overactive thyroid gland) and the risk of breast can-cer.15 The women were treated from 1946 through 1964 and followed untilthe end of 1978, the closing date of the study. Each woman’s follow-up timebegan with her thyroid treatment and continued until one of the followingevents occurred: breast cancer diagnosis, lost to follow-up, or end of fol-low-up for the study. By 1978, 8% of the women were lost, 32% weredeceased, and 60% were still alive. Investigators identified 61 cases ofbreast cancer among the 30,324 person-years of follow-up, and so the inci-dence rate was 61/30,324 person-years or 201/100,000 person-years.Although it is most accurate to determine person-time on an individualbasis, as was done in this study, this method is very time consuming andlabor-intensive. Thus, researchers sometimes use shortcuts such as multi-plying the number of people under observation by an estimate of the aver-age follow-up time.
In the hypothetical example portrayed in Figure 2–3, five individualswho were followed for varying amounts of time accrued 30 person-years offollow-up. However, depending on the size of the population and length of follow-up, the 30 person-years could have been accrued in many differ-ent ways such as five people each contributing six years, three people eachcontributing 10 years, and so forth. Regardless of how the person-time isaccrued (for example, from five or 50 people), the person-time units areassumed to be equivalent. This assumption is usually reasonable, except inextreme situations where a small number of people are followed for a longperiod of time.
The particular time unit used to measure person-time can vary, butdecisions are guided by how long it takes for the disease to develop. Forexample, person-years are commonly used for diseases that take manyyears to develop (such as cancer), and person-months or person-days areused for diseases that develop rapidly (such as infection).
The number of person-time units in the denominator is arbitrary. Forexample, the same incidence rate can be expressed in terms of one person-year, 10 person-years, or 100 person-years. Epidemiologists generally use100,000 person-years for rare diseases and those that take a long time todevelop.
46 E S S E N T I A L S O F E P I D E M I O L O G Y I N P U B L I C H E A LT H
4025X_CH02_033_058.qxd 4/13/07 9:28 AM Page 46

Relationship Between Cumulative Incidence and Incidence Rate
It is possible to obtain cumulative incidence from an incidence rate. Thesimplest situation to demonstrate this relationship is in a fixed populationwith a constant incidence rate and small cumulative incidence (less than10%). Here, the mathematical relationship is as follows:
CI � IRi � ti
where CI is cumulative incidence, IRi is incidence rate, and ti is the speci-fied period of time.
When the incidence rate is not constant, it is necessary to take intoaccount the different rates that prevail during each time period:
CI � Σ (IRi � ti)
For example, the mortality rate (a type of incidence rate) amongHiroshima residents was much higher shortly after the atomic bomb explo-sion than during subsequent years (see Figure 2–2).
Incidence Summary
In summary, two measures of disease frequency—cumulative incidence andincidence rate—focus on measuring the transition from health to disease.These measures have complementary strengths and weaknesses. The cumu-lative incidence is easy to calculate and understand, although it is less accu-rate when its assumptions are not met. Although the incidence rate hasgreater accuracy, its person-time denominator is more difficult to calculateand understand. Finally, the incidence rate is most useful for dynamic popu-lations, and cumulative incidence is usually reserved for fixed populations.
PrevalenceWhile incidence measures the frequency with which new disease develops,prevalence measures the frequency of existing disease. It is simply defined asthe proportion of the total population that is diseased. There are two typesof prevalence measures—point prevalence and period prevalence—thatrelate prevalence to different amounts of time. Point prevalence refers to theproportion of the population that is diseased at a single point in time andcan be thought of as a single snapshot of the population. The point can beeither a particular calendar date such as December 1, 2005 or a point insomeone’s life such as college graduation. Period prevalence refers to theproportion of the population that is diseased during a specified duration oftime, such as during the year 2005. The period prevalence includes the
Measures of Disease Frequency 47
4025X_CH02_033_058.qxd 4/13/07 9:28 AM Page 47
number of cases that were present at the start of the period (for example,January 1, 2005) as well as the number that developed during the period(for example, January 2 through December 31, 2005). It may be helpful tothink of period prevalence as derived from a series of snapshots.
Mathematically, point prevalence is expressed as follows:
Number of existing cases of diseaseAt a point in time
Number in total population
Period prevalence can be expressed as follows:
Number of existing cases of diseaseDuring a period of time
Number in total population
Note that the numerator (existing cases) is a subset of the denominator(total population). Unlike the numerator for the two incidence measures, theprevalence numerator includes all currently living cases regardless of whenthey first developed. The denominator includes everyone in the population—sick, healthy, at risk, and not at risk. Because prevalence is a proportion, it isdimensionless and its possible values range from zero to one, or 0 to 100% (seeTable 2–5).
Relationship Between Prevalence and IncidencePrevalence depends on the rate at which new cases of disease develop (theincidence rate) as well as the duration or length of time that individualshave the disease. The duration of a disease starts at the time of diagnosisand ends when the person either is cured or dies. Mathematically, the rela-tionship between prevalence and incidence is as follows:
P/(1 � P) � IR � D
where P is prevalence (the proportion of the total population with the dis-ease), (1 � P) is the proportion of the total population without the disease,IR is incidence rate, and D is the average duration (or length of time) thatan individual has the disease.
This equation assumes that the population is in steady state (that is,inflow equals outflow) and that the incidence rate and duration do notchange over time. If the frequency of disease is rare (that is, less than 10%),the equation simplifies to:
P � IR � D
To better understand this relationship, think of the variables that influencethe level of water in a sink (see Figure 2–4). The water level is influenced
48 E S S E N T I A L S O F E P I D E M I O L O G Y I N P U B L I C H E A LT H
4025X_CH02_033_058.qxd 4/13/07 9:28 AM Page 48
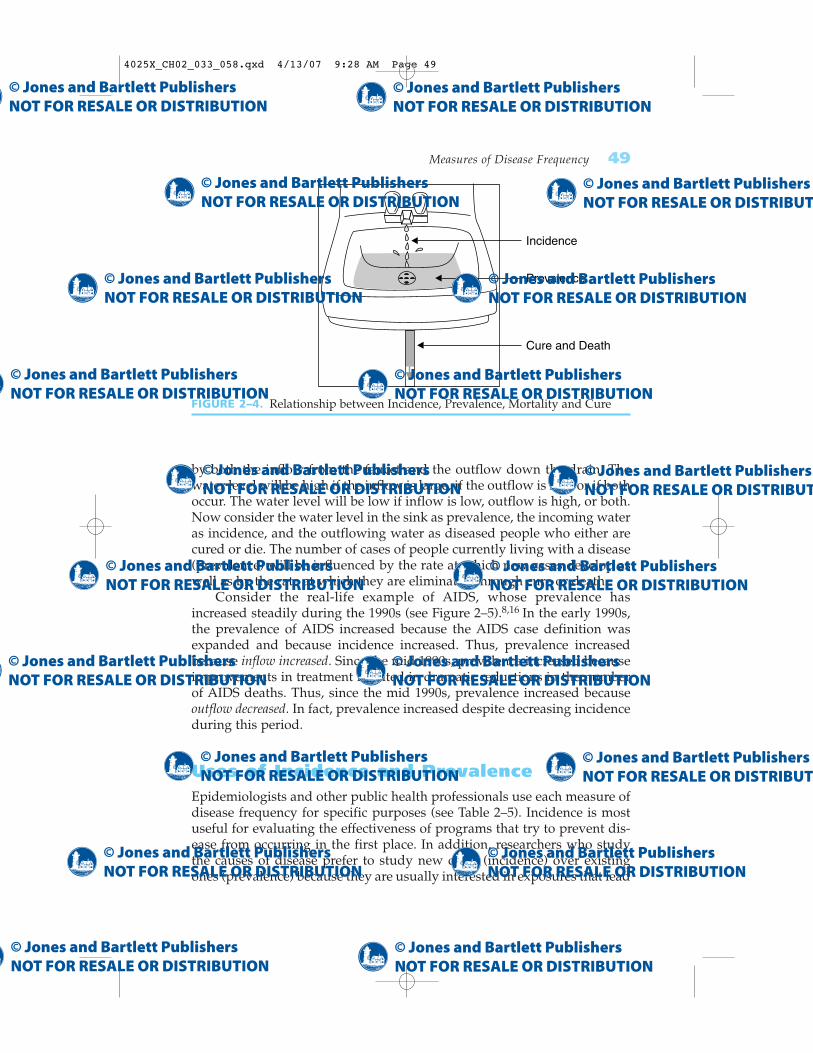
by both the inflow from the faucet and the outflow down the drain. Thewater level will be high if the inflow is large, if the outflow is low, or if bothoccur. The water level will be low if inflow is low, outflow is high, or both.Now consider the water level in the sink as prevalence, the incoming wateras incidence, and the outflowing water as diseased people who either arecured or die. The number of cases of people currently living with a disease(prevalence) will be influenced by the rate at which new cases develop aswell as by the rate at which they are eliminated through cure or death.
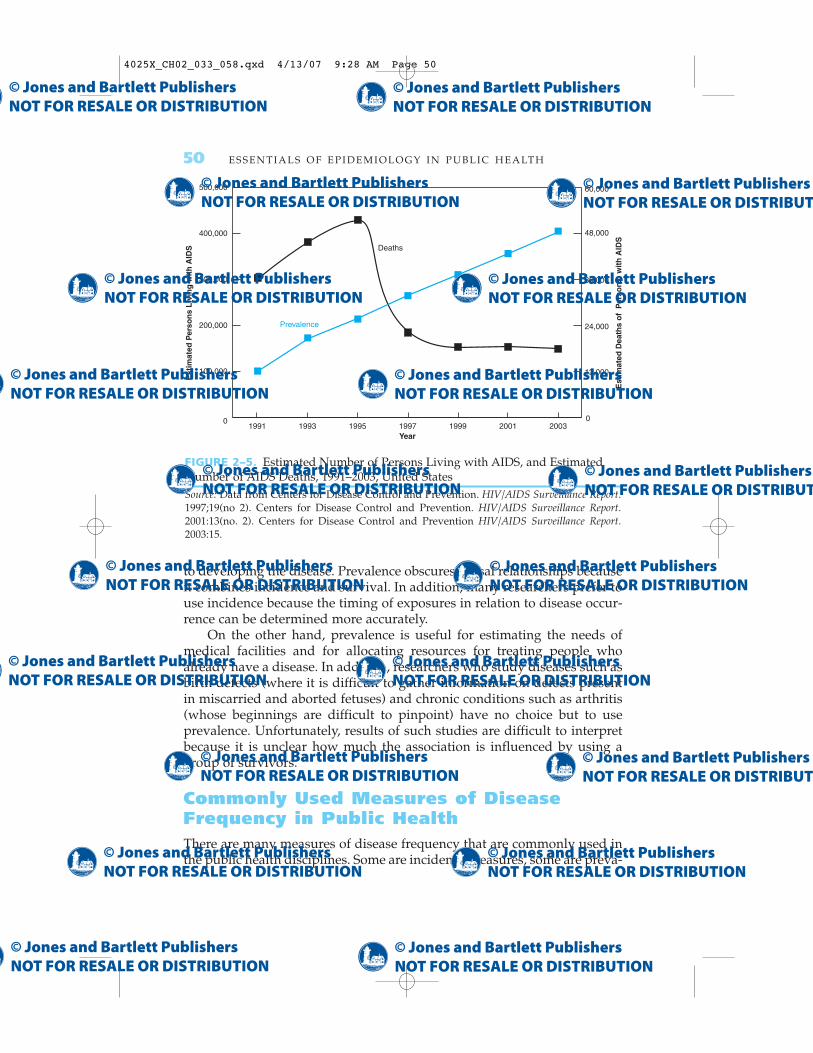
Consider the real-life example of AIDS, whose prevalence hasincreased steadily during the 1990s (see Figure 2–5).8,16 In the early 1990s,the prevalence of AIDS increased because the AIDS case definition wasexpanded and because incidence increased. Thus, prevalence increasedbecause inflow increased. Since the mid 1990s, prevalence increased becauseimprovements in treatment resulted in dramatic reductions in the numberof AIDS deaths. Thus, since the mid 1990s, prevalence increased becauseoutflow decreased. In fact, prevalence increased despite decreasing incidenceduring this period.
Uses of Incidence and PrevalenceEpidemiologists and other public health professionals use each measure ofdisease frequency for specific purposes (see Table 2–5). Incidence is mostuseful for evaluating the effectiveness of programs that try to prevent dis-ease from occurring in the first place. In addition, researchers who studythe causes of disease prefer to study new cases (incidence) over existingones (prevalence) because they are usually interested in exposures that lead
Measures of Disease Frequency 49
FIGURE 2–4. Relationship between Incidence, Prevalence, Mortality and Cure
Incidence
Prevalence
Cure and Death
4025X_CH02_033_058.qxd 4/13/07 9:28 AM Page 49
to developing the disease. Prevalence obscures causal relationships becauseit combines incidence and survival. In addition, many researchers prefer touse incidence because the timing of exposures in relation to disease occur-rence can be determined more accurately.
On the other hand, prevalence is useful for estimating the needs ofmedical facilities and for allocating resources for treating people whoalready have a disease. In addition, researchers who study diseases such asbirth defects (where it is difficult to gather information on defects presentin miscarried and aborted fetuses) and chronic conditions such as arthritis(whose beginnings are difficult to pinpoint) have no choice but to useprevalence. Unfortunately, results of such studies are difficult to interpretbecause it is unclear how much the association is influenced by using agroup of survivors.
Commonly Used Measures of DiseaseFrequency in Public HealthThere are many measures of disease frequency that are commonly used inthe public health disciplines. Some are incidence measures, some are preva-
50 E S S E N T I A L S O F E P I D E M I O L O G Y I N P U B L I C H E A LT H
FIGURE 2–5. Estimated Number of Persons Living with AIDS, and EstimatedNumber of AIDS Deaths, 1991–2003, United StatesSource: Data from Centers for Disease Control and Prevention. HIV/AIDS Surveillance Report.1997;19(no 2). Centers for Disease Control and Prevention. HIV/AIDS Surveillance Report.2001:13(no. 2). Centers for Disease Control and Prevention HIV/AIDS Surveillance Report.2003:15.
12,000
24,000
36,000
48,000
60,000
1991 200319930
100,000
200,000
300,000
400,000
500,000
1995 1997 1999 2001
Est
imat
ed P
erso
ns
Liv
ing
wit
h A
IDS
Est
imat
ed D
eath
s o
f P
erso
ns
wit
h A
IDS
Year
0
Deaths
Prevalence
4025X_CH02_033_058.qxd 4/13/07 9:28 AM Page 50

lence measures, some are ratios. Descriptions and examples of the majormeasures follow. Note that the word rate is often used incorrectly todescribe a proportion or ratio.
Crude mortality (or death) rate: Total number of deaths from all causes per100,000 population per year. The term crude means that the rate is based onraw data. In 2003, 2,448,288 deaths occurred among people residing in theUnited States, resulting in a crude mortality rate of 841.9/100,000 population/year.17
Cause-specific mortality (or death) rate: Number of deaths from a specificcause per 100,000 population per year. In 2003, there were 685,089 deathsfrom heart disease among U.S. residents resulting in a cause-specific mor-tality rate of 235.6/100,000/year.17
Age-specific mortality (or death) rate: Total number of deaths from allcauses among individuals in a specific age category per 100,000 populationper year in the age category. In 2003, there were 28,025 deaths among U.S.children under the age of one year, resulting in an age-specific death rate of700.0/100,000/year.17
Years of potential life lost: The number of years that an individual wasexpected to live beyond his or her death. In 2003, 1214 years were lost dueto heart disease, 1628 years were lost due to cancer, and 1086 were lost due to unintentional injuries before age 75 per 100,000 population youngerthan 75 years of age.17 The number of years of potential life lost reflectsboth the number of individuals who died of a particular cause and the ageat which the death occurred. For example, a cause of death that is morecommon among children and young adults (such as unintentional injuries)will result in more years of life lost per individual than a cause of death thatis common among the elderly (such as heart disease).
Livebirth rate: Total number of livebirths per 1000 population per year.A livebirth is a pregnancy that results in a child who, after separation,breathes or shows any other evidence of life. Sometimes the denominatorincludes only women of childbearing age. In 2003, 4,089,950 livebirthsoccurred among women that are residents of the United States, and thecrude livebirth rate was 14.1/1000/year.17
Infant mortality rate: Number of deaths of infants less than one year ofage per 1000 livebirths per year. This statistic is often divided into neonataldeaths (those occurring during the first 27 days following birth) and post-neonatal deaths (those occurring from 28 days through 12 months). In 2002,the infant mortality rate in the United States was 7.0/1000 livebirths/year,the neonatal mortality rate was 4.7/1000 livebirths/year, and the post-neonatal death rate was 2.3/1000 livebirths/year.17
Birth defect (also called congenital anomaly or malformation) rate: Numberof children born with defects per 10,000 births. The numerator and denom-inator often include both live- and stillbirths. According to a nationwide
Measures of Disease Frequency 51
4025X_CH02_033_058.qxd 4/13/07 9:28 AM Page 51

birth defects monitoring program, the prevalence of spina bifida, a centralnervous system malformation, was 4.45/10,000 births from 1986 to 1987.18
Morbidity rate: Number of existing or new cases of a particular diseaseor condition per 100 population. The time period that is covered and thepopulation size in the denominator vary. Morbidity is a general word thatcan apply to a disease, condition, or event. For example, from 1999 to 2002,the prevalence of physician-diagnosed diabetes among U.S. adults aged 60years and over was 15.1%.17
Attack rate: Number of new cases of disease that develop (usually dur-ing a defined and short time period) per the number in a healthy popula-tion at risk at the start of the period. This cumulative incidence measure isusually reserved for infectious disease outbreaks. For example, the 24-hourattack rate for food poisoning was 50% among people who ate chickensalad at the banquet.
Case fatality rate: Number of deaths per number of cases of disease.Note that this measure is a type of cumulative incidence, so it is necessaryto specify the length of time to which it applies. For example, the 5-yearcase fatality rates for breast cancer were 9.9% and 21.5%, respectively,among white and black women in the United States, who were diagnosedduring 1996–2002.12
Survival rate: Number of living cases per number of cases of disease.This rate is the complement of the case fatality rate; also a cumulative inci-dence measure. Five-year relative survival rates for cancer compare peoplewith a particular cancer to similar people in the general population. Forexample, from 1988 to 2002, five-year relative survival rates for prostatecancer were 100% among men diagnosed while the tumor was still con-fined to the prostate or had spread only to the regional lymph nodes, and33.5% among men whose tumor had metastasized to distant sites.12
SummaryA population is defined as a group of people with a common characteristicsuch as place of residence, age, or the occurrence of an event. There are twomain types of populations, fixed and dynamic (or open). The membershipof a fixed population is defined by a life event and is permanent, whereasthe membership of a dynamic population is defined by a changeable char-acteristic and is transient.
Three factors should always be considered when measuring how com-monly a disease occurs in a population: (1) the number of affected individ-uals or cases, (2) the size of the population from which the cases arise, and(3) the amount of time that this population is followed. Before epidemiolo-gists can count the number of affected cases, they must compose a diseasedefinition that is usually based on physical and pathological examinations,diagnostic tests, and signs and symptoms. Disease definitions often change
52 E S S E N T I A L S O F E P I D E M I O L O G Y I N P U B L I C H E A LT H
4025X_CH02_033_058.qxd 4/13/07 9:28 AM Page 52

over time, as more is learned about a disease and its manifestations. Forexample, the official case definition of AIDS expanded when its cause wasdiscovered and improvements in detection were made.
Incidence and prevalence are the two basic measures of disease fre-quency. Incidence measures the occurrence of new disease and so capturesthe transition from health to disease. Cumulative incidence and incidencerate are the two main types of incidence measures. Cumulative incidence isdefined as the proportion of a candidate population that becomes diseasedover a specified time period. It is a dimensionless proportion that measuresthe average risk of contracting a disease over a certain time period. Inci-dence rate is the occurrence of new cases of disease that arise during per-son-time of observation, and so it is a true rate. It is important to rememberthat person-time accumulates only among candidates for disease. Cum-ulative incidence and incidence rate are related mathematically. Both mea-sures are most useful for evaluating the effectiveness of disease preventionactivities and for etiological studies of disease.
Prevalence measures existing disease and so focuses on the period whena person is ill. Prevalence measures the proportion of the total populationthat is diseased at a point in time or during a period of time. Its numeratorconsists of the number of existing cases, and its denominator includes thetotal population, including sick, healthy, at-risk, and immune individuals.Point prevalence refers to a single point in time and is like a snapshot. Periodprevalence refers to a specific duration of time that may be derived from aseries of snapshots. Prevalence is typically used for estimating the needs ofmedical facilities and for allocating resources for treating diseased individuals.The incidence rate and prevalence are mathematically related.
Many measures of disease frequency are commonly used in publichealth, including the crude, cause-specific, and age-specific mortality rates;morbidity rate; livebirth rate; infant mortality rate; attack rate; case fatalityrate; and survival rate. Note that the term rate is often incorrectly used torefer to proportions and ratios.
References1. MacMahon, B, Trichopoulos, D. Epidemiology: Principles and Methods. 2nd ed.
Boston, MA: Little, Brown and Co; 1996.2. Last, JM. A Dictionary of Epidemiology. 4th ed. New York, NY: Oxford University
Press; 2001.3. Preamble to the Constitution of the World Health Organization as adopted by the
International Health Conference, New York, 19–22 June 1946; signed on 22 Julyby the representatives of 61 States (Official Records of the World HealthOrganization p. 100) and entered into force on 4 April 1948.
4. Healthy People 2010: Understanding and Improving Health. 2nd ed. WashingtonDC: U.S. Department of Health and Human Services, Public Health Service;2000.
Measures of Disease Frequency 53
4025X_CH02_033_058.qxd 4/13/07 9:28 AM Page 53

5. Centers for Disease Control. Kaposi’s sarcoma and Pneumocystis pneumoniaamong homosexual men—New York City and California. MMWR. 1981;30:305–308.
6. Centers for Disease Control. Update on acquired immune deficiency syndrome(AIDS)—United States. MMWR. 1982;31:507–514.
7. Centers for Disease Control. Revision of the case definition of acquired im-mune deficiency syndrome for national reporting—United States. MMWR.1985;34:373–375.
8. Centers for Disease Control and Prevention. HIV/AIDS Surveillance Report.1997;9:1–43.
9. Centers for Disease Control and Prevention. HIV/AIDS Surveillance Report 2004.Vol. 16. 1–46, 2005. Available at: http://www.cdc.gov/hiv/stats/hasrlink.htm.Accessed August 2006.
10. U.S. Census Bureau. Available at: http://www.census.gov/acs/www/Products/Profiles/Single/2003/ACS/Tabular/010. Accessed September 2005.
11. Elandt-Johnson, RC. Definition of rates: some remarks on their use and misuse.Am J Epidmiol. 1975;102:267–271.
12. Ries, LAG, Harkins, D, Krapcho, M, et al. SEER Cancer Statistics Review,1975–2003, National Cancer Institute, Bethesda, MD. 2006
13. Liebow, AA. Encounter with Disaster: A Medical Diary of Hiroshima. New York,NY: WW Norton and Co; 1970.
14. Preston, DL, Shimizu, Y, Pierce, DA, Suyama, A, Mabuchi, K. Studies of mor-tality of atomic bomb survivors. Report 13: Solid Cancer and Noncancer dis-ease mortality: 1950–1997. Radiat Res. 2003;160:381–407.
15. Goldman, MB, Maloof, F, Monson, RR, Aschengrau, A, Cooper, DS, Ridgway,EC. Radioactive iodine therapy and breast cancer: a follow-up study of hyper-thyroid women. Am J Epidemiol. 1988;127:969–980.
16. Centers for Disease Control and Prevention. HIV/AIDS Surveillance Report.2003;15:1–46.
17. National Center for Health Statistics. Health, United States, 2005 With Chartbookon Trends in the Health of Americans. Hyattsville, MD: National Center for HealthStatistics, 2005.
18. Centers for Disease Control. Temporal trends in the prevalence of congenitalmalformations at birth based on the Birth Defects Monitoring Program, UnitedStates 1979–87. MMWR. 1990;39(SS-4):19–23.
54 E S S E N T I A L S O F E P I D E M I O L O G Y I N P U B L I C H E A LT H
4025X_CH02_033_058.qxd 4/13/07 9:28 AM Page 54

CHAPTER QUESTIONS
1. What measure of disease frequency is each of the following?A. The percentage of freshman girls who become pregnant over the
course of their high school yearsB. The percentage of senior boys who are fathers at the time of grad-
uationC. The number of liveborn babies who die of sudden infant death syn-
drome during the first year of life per 100,000 baby-years of follow-upD. The percentage of infants weighing less than 2500 grams at birthE. The lifetime risk of breast cancer
2. Briefly describe the main similarities and differences between each ofthe following:A. Prevalence and incidenceB. Incidence rate and cumulative incidenceC. Fixed and dynamic population
3. In 2005, there were 2900 new cases of breast cancer diagnosed amongwomen in Alabama and 200 new cases diagnosed among women inAlaska. Based on these data, is it accurate to say that the incidence rateof breast cancer is higher in Alabama than Alaska. Why or why not?
4. Consider a class with 100 enrolled students. None of the students wereill at the beginning of the school year. On September 30, 5 studentsreported having gastroenteritis. All continued to be ill on October 1,but all 5 recovered within 3 days. On October 14, 3 more studentsdeveloped gastroenteritis. All of these students continued to be ill onOctober 15, but all 3 recovered 5 days later. In this example, assumethat a person cannot get gastroenteritis more than once.A. Calculate the prevalence of gastroenteritis in the class on October 1.B. Calculate the prevalence of gastroenteritis in the class on October 30.C. Calculate the cumulative incidence of gastroenteritis in the class
during the month of October.
5. The incidence rate of a nonfatal disease is 500/100,000 person-years. Peo-ple usually have the disease for an average of 3 years, at which time thedisease resolves spontaneously. Estimate the prevalence of this diseaseusing this information. Assume that the population is in steady state.
6. A population of 100 healthy men was followed for the development ofprostate cancer. After being followed for 5 years, 20 men developedprostate cancer. Ten other men were followed for 1 year and then were
Measures of Disease Frequency 55
4025X_CH02_033_058.qxd 4/13/07 9:28 AM Page 55
lost. The remaining men who never developed the disease were fol-lowed for 10 years. Calculate the number of person-years of observa-tion accrued by this population.
7. Consider the following hypothetical data on the occurrence of hepati-tis in two cities.
City New cases Observation period Starting population at risk
City A 25 January–December 2005 25,000City B 30 January–December 2005 50,000
A. Calculate the cumulative incidence of hepatitis in each city.B. Which city has the higher cumulative incidence?
8. Sixty cases of myocardial infarction were reported over a period of twoyears in a city with a population of 100,000 people. Using these data,estimate the incidence rate of myocardial infarction per 100,000 person-years. State any assumptions that are needed.
9. State the type of population (fixed or dynamic) that best describes eachof the following:A. People who live in New York CityB. Men who had coronary bypass surgery as of 2005C. Children who were vaccinated against polio in 1955D. Women who are practicing physicians
10. Indicate whether the following statements are true or false.A. Only the population at risk contributes to the denominator of the
cumulative incidence. B. When calculating the incidence rate of a disease, it is necessary to
follow all subjects for the same length of time.C. If the incidence rate of a very serious disease is 75/100,000 person-
years and the prevalence of this disease in the population is25/100,000, then the average duration of this disease must be threeyears.
D. All other things being equal, when a new prevention measure for adisease is developed, the prevalence of the disease will decreaseover time.
11. An epidemiologic investigation that was started on January 1, 2005,identified a population of 1000 individuals among whom four werefound to have the disease under study. During the year of the study, sixnew cases were found. Among the total of 10 cases, there were six deathsduring the year. For the 10 cases, the diagram indicates the time of case
56 E S S E N T I A L S O F E P I D E M I O L O G Y I N P U B L I C H E A LT H
4025X_CH02_033_058.qxd 4/13/07 9:28 AM Page 56

recognition, periods of observation during the study, and vital status atthe time of the termination of observation. An arrow at the start of thediagram (patients 1, 2, 3, 4) indicates that the start of disease occurredbefore the study began.
Assume that the 990 remaining individuals in the study did notbecome ill or die during the year of observation. From the informationand diagram given, calculate the following:A. Prevalence of the disease on January 1, 2005; July 1, 2005; and De-
cember 31, 2005B. Cumulative incidence of disease during 2005C. Cumulative incidence of death during 2005
Measures of Disease Frequency 57
1999 2000
Jan Feb Mar Apr May Jun Jul Aug Sep Oct Nov Dec Jan
1 Alive
5 Alive
7 Alive
9 Alive
2 Dead
6 Dead
10 Dead
8 Dead
3 Dead
4 Dead
2005 2006
4025X_CH02_033_058.qxd 4/13/07 9:28 AM Page 57

4025X_CH02_033_058.qxd 4/13/07 9:28 AM Page 58