Embed Size (px)
Citation preview
Calhoun: The NPS Institutional Archive
Reports and Technical Reports All Technical Reports Collection
2013-10-08
Measuring Acquisition Workforce
Quality Through Dynamic Knowledge
and Performance: An Exploratory
Investigation to Interrelate Acquisition
Knowledge with Process Maturity
Nissen, Mark E.
Monterey, California. Naval Postgraduate School
http://hdl.handle.net/10945/44501
^Åèìáëáíáçå=oÉëÉ~êÅÜ=mêçÖê~ã=dê~Çì~íÉ=pÅÜççä=çÑ=_ìëáåÉëë=C=mìÄäáÅ=mçäáÅó= - i - k~î~ä=mçëíÖê~Çì~íÉ=pÅÜççä=
NPS-CM-13-116
^`nrfpfqflk=obpb^o`e=moldo^j=pmlkploba=obmloq=pbofbp=
Measuring Acquisition Workforce Quality Through Dynamic Knowledge and Performance: An Exploratory Investigation to
Interrelate Acquisition Knowledge With Process Maturity
8 October 2013
Dr. Mark E. Nissen, Professor
Graduate School of Operational & Information Sciences, and Graduate School of Business & Public Policy
Dr. Rene G. Rendon, Associate Professor
Graduate School of Business & Public Policy
Naval Postgraduate School
Approved for public release; distribution is unlimited.
Prepared for the Naval Postgraduate School, Monterey, CA 93943.
Report Documentation Page Form ApprovedOMB No. 0704-0188
Public reporting burden for the collection of information is estimated to average 1 hour per response, including the time for reviewing instructions, searching existing data sources, gathering andmaintaining the data needed, and completing and reviewing the collection of information. Send comments regarding this burden estimate or any other aspect of this collection of information,including suggestions for reducing this burden, to Washington Headquarters Services, Directorate for Information Operations and Reports, 1215 Jefferson Davis Highway, Suite 1204, ArlingtonVA 22202-4302. Respondents should be aware that notwithstanding any other provision of law, no person shall be subject to a penalty for failing to comply with a collection of information if itdoes not display a currently valid OMB control number.
1. REPORT DATE 08 OCT 2013 2. REPORT TYPE
3. DATES COVERED 00-00-2013 to 00-00-2013
4. TITLE AND SUBTITLE Measuring Acquisition Workforce Quality Through Dynamic Knowledgeand Performance: An Exploratory Investigation to InterrelateAcquisition Knowledge With Process Maturity
5a. CONTRACT NUMBER
5b. GRANT NUMBER
5c. PROGRAM ELEMENT NUMBER
6. AUTHOR(S) 5d. PROJECT NUMBER
5e. TASK NUMBER
5f. WORK UNIT NUMBER
7. PERFORMING ORGANIZATION NAME(S) AND ADDRESS(ES) Naval Postgraduate School,Graduate School of Business & Public Policy,Monterey,CA,93943
8. PERFORMING ORGANIZATIONREPORT NUMBER
9. SPONSORING/MONITORING AGENCY NAME(S) AND ADDRESS(ES) 10. SPONSOR/MONITOR’S ACRONYM(S)
11. SPONSOR/MONITOR’S REPORT NUMBER(S)
12. DISTRIBUTION/AVAILABILITY STATEMENT Approved for public release; distribution unlimited
13. SUPPLEMENTARY NOTES
14. ABSTRACT The efficacy of defense acquisition is highly dependent upon acquisition workforce quality, but assessingsuch quality remains a major challenge, particularly given the knowledge-intensive and dynamic nature ofacquisition organizations and processes. Hence, it is difficult to gauge?much less predict?the impact ofleadership interventions in terms of policy, process, regulation, organization education, training, or likeapproaches. Building upon the development and application of Knowledge Flow Theory (KFT) over thepast couple of decades, we have developed a state-of-the-art approach that enables us to analyze, visualizeand measure dynamic knowledge and performance. The main idea is to apply this approach inwardly tointerrelate the knowledge and performance of acquisition processes (e.g., within contracting and projectmanagement organizations). In this exploratory study, we examine acquisition from the perspective of theprocurement process, focusing in particular on organization knowledge and performance with respect tothe processes used for the procurement of major systems and services. We begin with a summary of KFTand measurement and then introduce the Contract Management Maturity Model as an approach toacquisition performance measurement. We follow in turn by summarizing the research method guiding thestudy, after which we present preliminary results of our investigation. By interrelating knowledge toperformance in terms of process maturity, this report presents the premier cause?effect relationship of itskind in the acquisition domain. This technical report concludes with key observations, limitations, and anagenda for continued research along these lines.
15. SUBJECT TERMS
16. SECURITY CLASSIFICATION OF: 17. LIMITATION OF ABSTRACT Same as
Report (SAR)
18. NUMBEROF PAGES
45
19a. NAME OFRESPONSIBLE PERSON
a. REPORT unclassified
b. ABSTRACT unclassified
c. THIS PAGE unclassified

Standard Form 298 (Rev. 8-98) Prescribed by ANSI Std Z39-18

^Åèìáëáíáçå=oÉëÉ~êÅÜ=mêçÖê~ã=dê~Çì~íÉ=pÅÜççä=çÑ=_ìëáåÉëë=C=mìÄäáÅ=mçäáÅó= - ii - k~î~ä=mçëíÖê~Çì~íÉ=pÅÜççä=
The research presented in this report was supported by the Acquisition Research Program of the Graduate School of Business & Public Policy at the Naval Postgraduate School.
To request defense acquisition research, to become a research sponsor, or to print additional copies of reports, please contact any of the staff listed on the Acquisition Research Program website (www.acquisitionresearch.net).
^Åèìáëáíáçå=oÉëÉ~êÅÜ=mêçÖê~ã=dê~Çì~íÉ=pÅÜççä=çÑ=_ìëáåÉëë=C=mìÄäáÅ=mçäáÅó= - iii - k~î~ä=mçëíÖê~Çì~íÉ=pÅÜççä=
Abstract
The efficacy of defense acquisition is highly dependent upon acquisition workforce quality, but assessing such quality remains a major challenge, particularly given the knowledge-intensive and dynamic nature of acquisition organizations and processes. Hence, it is difficult to gauge—much less predict—the impact of leadership interventions in terms of policy, process, regulation, organization, education, training, or like approaches. Building upon the development and application of Knowledge Flow Theory (KFT) over the past couple of decades, we have developed a state-of-the-art approach that enables us to analyze, visualize, and measure dynamic knowledge and performance. The main idea is to apply this approach inwardly to interrelate the knowledge and performance of acquisition processes (e.g., within contracting and project management organizations). In this exploratory study, we examine acquisition from the perspective of the procurement process, focusing in particular on organization knowledge and performance with respect to the processes used for the procurement of major systems and services. We begin with a summary of KFT and measurement and then introduce the Contract Management Maturity Model as an approach to acquisition performance measurement. We follow in turn by summarizing the research method guiding the study, after which we present preliminary results of our investigation. By interrelating knowledge to performance in terms of process maturity, this report presents the premier cause–effect relationship of its kind in the acquisition domain. This technical report concludes with key observations, limitations, and an agenda for continued research along these lines.
Keywords: Acquisition Workforce Quality, Contract Management Maturity, Leadership Interventions, Knowledge Flow Theory, and Performance Measures

^Åèìáëáíáçå=oÉëÉ~êÅÜ=mêçÖê~ã=dê~Çì~íÉ=pÅÜççä=çÑ=_ìëáåÉëë=C=mìÄäáÅ=mçäáÅó= - iv - k~î~ä=mçëíÖê~Çì~íÉ=pÅÜççä=
THIS PAGE INTENTIONALLY LEFT BLANK
^Åèìáëáíáçå=oÉëÉ~êÅÜ=mêçÖê~ã=dê~Çì~íÉ=pÅÜççä=çÑ=_ìëáåÉëë=C=mìÄäáÅ=mçäáÅó= - v - k~î~ä=mçëíÖê~Çì~íÉ=pÅÜççä=
About the Authors
Dr. Mark E. Nissen—is a professor of information science and management at the Naval Postgraduate School. His research focuses on dynamic knowing and organizing. He views work, technology, organization, and people as an integrated design problem, and he has concentrated for some time on the dynamics of tacit and explicit knowledge flows, looking in particular at (re)designing organizations that balance stability with maneuverability. Nissen’s 150+ publications span information systems, project management, organization studies, knowledge management, and related fields. Before his doctoral work at the University of Southern California, he acquired over a dozen years' management experience in the aerospace and electronics industries.
Dr. Mark E. Nissen Graduate School of Operational & Information Sciences, and Graduate School of Business & Public Policy Naval Postgraduate School Monterey, CA 93943-5000 Tel: (831) 656-3570 Fax: (831) 656-3407 E-mail: [email protected]
Dr. Rene Rendon—is an associate professor at the Naval Postgraduate School (NPS), where he teaches defense acquisition courses. Prior to his appointment at the NPS, he served for more than 22 years as an acquisition and contracting officer in the United States Air Force, retiring at the rank of lieutenant colonel. His Air Force career included assignments as a contracting officer for the Peacekeeper ICBM, Maverick Missile, and the F-22 Raptor. He was also the director of contracting for the Air Force’s Space-Based Infrared satellite program and the Evolved Expendable Launch Vehicle rocket program.
Dr. Rene Rendon Graduate School of Business & Public Policy Naval Postgraduate School Monterey, CA 93943-5000 Tel: (831) 656-3464 Fax: (831) 656-3407 E-mail: [email protected]

^Åèìáëáíáçå=oÉëÉ~êÅÜ=mêçÖê~ã=dê~Çì~íÉ=pÅÜççä=çÑ=_ìëáåÉëë=C=mìÄäáÅ=mçäáÅó= - vi - k~î~ä=mçëíÖê~Çì~íÉ=pÅÜççä=
THIS PAGE INTENTIONALLY LEFT BLANK
^Åèìáëáíáçå=oÉëÉ~êÅÜ=mêçÖê~ã=dê~Çì~íÉ=pÅÜççä=çÑ=_ìëáåÉëë=C=mìÄäáÅ=mçäáÅó= - vii - k~î~ä=mçëíÖê~Çì~íÉ=pÅÜççä=
NPS-CM-13-116
^Åèìáëáíáçå=oÉëÉ~êÅÜ=mêçÖê~ã=ëéçåëçêÉÇ=oÉéçêí=pÉêáÉë=
Disclaimer: The views represented in this report are those of the author and do not reflect the official policy position of the Navy, the Department of Defense, or the federal government.
Measuring Acquisition Workforce Quality Through Dynamic Knowledge and Performance: An Exploratory Investigation to
Interrelate Acquisition Knowledge With Process Maturity
8 October 2013
Dr. Mark E. Nissen, Professor
Graduate School of Operational & Information Sciences, and Graduate School of Business & Public Policy
Dr. Rene G. Rendon, Associate Professor
Graduate School of Business & Public Policy
Naval Postgraduate School

^Åèìáëáíáçå=oÉëÉ~êÅÜ=mêçÖê~ã=dê~Çì~íÉ=pÅÜççä=çÑ=_ìëáåÉëë=C=mìÄäáÅ=mçäáÅó= - viii - k~î~ä=mçëíÖê~Çì~íÉ=pÅÜççä=
THIS PAGE INTENTIONALLY LEFT BLANK
^Åèìáëáíáçå=oÉëÉ~êÅÜ=mêçÖê~ã=dê~Çì~íÉ=pÅÜççä=çÑ=_ìëáåÉëë=C=mìÄäáÅ=mçäáÅó= - ix - k~î~ä=mçëíÖê~Çì~íÉ=pÅÜççä=
Table of Contents
Introduction ................................................................................................................ 1
Knowledge Flow Theory and Contract Management Maturity ................................... 4
KFT and Measurement ........................................................................................... 4
Contract Management Maturity Model ................................................................. 10
Research Method ..................................................................................................... 14
Results ..................................................................................................................... 15
Focal Organizations ............................................................................................. 15
Analysis ................................................................................................................ 16
Conclusion ............................................................................................................... 24
References .............................................................................................................. 27

^Åèìáëáíáçå=oÉëÉ~êÅÜ=mêçÖê~ã=dê~Çì~íÉ=pÅÜççä=çÑ=_ìëáåÉëë=C=mìÄäáÅ=mçäáÅó= - x - k~î~ä=mçëíÖê~Çì~íÉ=pÅÜççä=
THIS PAGE INTENTIONALLY LEFT BLANK
^Åèìáëáíáçå=oÉëÉ~êÅÜ=mêçÖê~ã=dê~Çì~íÉ=pÅÜççä=çÑ=_ìëáåÉëë=C=mìÄäáÅ=mçäáÅó= - xi - k~î~ä=mçëíÖê~Çì~íÉ=pÅÜççä=
List of Figures
Figure 1. 5D Knowledge Flow Diagram ........................................................... 5
Figure 2. Knowledge Creation and Application Needs .................................... 7
Figure 3. Knowledge Flow Obstruction ............................................................ 8
Figure 4. Alternate Archetypical Knowledge Flows ......................................... 9
Figure 5. Combined Score-PCO Relationship ............................................... 20
Figure 6. Organization T Score-PCO Relationship ........................................ 20
Figure 7. Organization R Score-PCO Relationship ....................................... 21
Figure 8. Organization T Score-DAWIA Relationship .................................... 21
Figure 9. Organization R Score-DAWIA Relationship ................................... 22
Figure 10. Organization T Score-Years Relationship ...................................... 22
Figure 11. Organization T Score-Years Relationship (sans outlier) ................ 23
Figure 12. Organization R Score-Years Relationship ...................................... 23

^Åèìáëáíáçå=oÉëÉ~êÅÜ=mêçÖê~ã=dê~Çì~íÉ=pÅÜççä=çÑ=_ìëáåÉëë=C=mìÄäáÅ=mçäáÅó= - xii - k~î~ä=mçëíÖê~Çì~íÉ=pÅÜççä=
THIS PAGE INTENTIONALLY LEFT BLANK
^Åèìáëáíáçå=oÉëÉ~êÅÜ=mêçÖê~ã=dê~Çì~íÉ=pÅÜççä=çÑ=_ìëáåÉëë=C=mìÄäáÅ=mçäáÅó= - xiii - k~î~ä=mçëíÖê~Çì~íÉ=pÅÜççä=
List of Tables
Table 1. Organization T Knowledge Summary ............................................. 17
Table 2. Organization R Knowledge Summary ............................................ 18
Table 3. Organization T Maturity Summary .................................................. 18
Table 4. Organization R Maturity Summary ................................................. 19

^Åèìáëáíáçå=oÉëÉ~êÅÜ=mêçÖê~ã=dê~Çì~íÉ=pÅÜççä=çÑ=_ìëáåÉëë=C=mìÄäáÅ=mçäáÅó= - xiv - k~î~ä=mçëíÖê~Çì~íÉ=pÅÜççä=
THIS PAGE INTENTIONALLY LEFT BLANK
^Åèìáëáíáçå=oÉëÉ~êÅÜ=mêçÖê~ã=dê~Çì~íÉ=pÅÜççä=çÑ=_ìëáåÉëë=C=mìÄäáÅ=mçäáÅó - 1 - k~î~ä=mçëíÖê~Çì~íÉ=pÅÜççä=
Measuring Acquisition Workforce Quality Through Dynamic Knowledge and
Performance: An Exploratory Investigation to Interrelate Acquisition Knowledge With
Process Maturity
Introduction Acquisition is big business. The U.S. Department of Defense (DoD) alone
routinely executes 12-figure budgets for research, development, procurement, and support of weapon systems and other military products and services (Dillard & Nissen, 2005). Acquisition is also a knowledge-intensive business. In addition to myriad laws governing federal acquisition in the U.S., a plethora of rules and regulations specify—often in great detail—how to accomplish the planning, review, execution, and oversight of defense acquisition programs, large and small, sole-source and competitive, military and commercial (Dillard, 2003).
As a result in part—and due to high complexity, multiple stakeholders, goal incongruence, open process execution, and large pecuniary rewards for some participants—acquisition has been a problematic business, too. Seemingly every decade, acquisition problems must be addressed by another Blue Ribbon panel and reformed yet again. The Better Buying Power Initiatives (BBPI), as a recent instance, mandated efficiency and productivity improvements in five acquisition business areas: (1) affordability and cost growth, (2) productivity and innovation in industry, (3) competition, (4) tradecraft in services acquisition, and (5) non-productive processes and bureaucracy (Office of the Under Secretary of Defense for Acquisition, Technology, and Logistics [OUSD(AT&L)], 2010). These initiatives focus principally on incentives for and interactions with contractors. The Defense Acquisition Workforce Improvement Act (DAWIA), as another instance, was signed into law in 1990 and emphasizes the education, training, and certification of people in the acquisition workforce (AWF). Of course, the two leadership interventions are related: People in the AWF need to know how to effect the kinds of efficiency and productivity improvements mandated via the BBPI.
These characteristics of acquisition emphasize the criticality of quality in the AWF itself: With so much at stake, and in such a knowledge-intensive environment, a high-quality workforce is essential to competent and professional acquisition performance.
^Åèìáëáíáçå=oÉëÉ~êÅÜ=mêçÖê~ã=dê~Çì~íÉ=pÅÜççä=çÑ=_ìëáåÉëë=C=mìÄäáÅ=mçäáÅó - 2 - k~î~ä=mçëíÖê~Çì~íÉ=pÅÜççä=
These characteristics also elucidate the central role played by people and organizations in the AWF: People must be knowledgeable and work effectively—not only in terms of their own professional acquisition activities but also with many others in acquisition and customer organizations—in order to accomplish key objectives and ensure timely, affordable, and responsive delivery of products and services to fighting and support units, at home and abroad. Indeed, we understand well how the efficacy of defense acquisition is inextricably dependent upon workforce quality. Hence, leadership interventions along these lines appear to be highly appropriate and on target.
Assessing the impact of interventions such as these is a challenge, however (Assistant Secretary of the Navy for Research, Development, and Acquisition [ASN(RDA)], 2011a, 2011b). It’s unclear whether the relatively recent BBPI, for instance, have had sufficient time to produce measurable impact. Even after two decades of the DAWIA, as another instance, efficacy remains challenging to assess, for many extant measures (e.g., number of Defense Acquisition University graduates, procurement lead times, program cost growth) fail to account for critical aspects of the AWF and important impacts on acquisition performance. Indeed, it is difficult to gauge—much less predict—the impact of any leadership interventions along these lines (e.g., how much better the AWF has become, or even if it is improving over time). Hence, the impact of any particular leadership intervention is left largely to anecdote and optimism. To help trim acquisition budgets and guide leadership, an improvement in assessing leadership initiatives and interventions is needed.
Since acquisition is a knowledge-intensive endeavor (Snider & Nissen, 2003), the knowledge stocks of people comprising the AWF represent likely indicators of quality (e.g., education levels, training courses, years of experience, certification levels). However, such indicators are relatively static, pertaining to levels of knowledge that change comparatively slowly (Nissen, 2006a). In contrast, acquisition laws, rules, and regulations are revised frequently, and acquisition knowledge can change abruptly and render obsolete even huge stocks over time. Indeed, this dynamic acquisition environment requires members of the AWF to sustain career-long learning and knowledge development just to remain proficient as acquisition professionals. Thus, as indicators of AWF quality, static knowledge stocks appear to be out of phase with the highly dynamic nature of the acquisition environment.
Moreover, acquisition organizations experience persistent flux (Snider & Nissen, 2003). We understand well that no two acquisition projects, programs, organizations, customers, or requirements are completely alike. Hence, even well-educated and -trained people, with appropriate certification levels and years or
^Åèìáëáíáçå=oÉëÉ~êÅÜ=mêçÖê~ã=dê~Çì~íÉ=pÅÜççä=çÑ=_ìëáåÉëë=C=mìÄäáÅ=mçäáÅó - 3 - k~î~ä=mçëíÖê~Çì~íÉ=pÅÜççä=
decades of acquisition experience, must continually learn afresh and expand their knowledge further with each new assignment. Likewise, it is clear that most acquisition organizations form and reform with new people (e.g., via personnel transfer, turnover, retirement, promotion) continuously and that end-customer needs shift perennially (especially at the tactical edges of warfare organizations). Due to such discontinuous membership (Ibrahim & Nissen, 2007), even these educated, trained, certified, and experienced people must learn repeatedly to trust and work effectively with many others—each time someone new joins or leaves a particular acquisition organization, and each time a novel product, service, or customer is involved. Thus, dynamic knowledge also appears to be an important AWF quality indicator.
The research discussed here recognizes these persistent—and seemingly immutable—attributes of the acquisition domain and workforce, and it seeks to overcome the limitations inherent in current approaches to assessing acquisition leadership initiatives and interventions. Specifically this work augments extant, largely static measures of AWF quality through dynamic knowledge and performance metrics applied to the acquisition domain.
Building upon the development and application of Knowledge Flow Theory (KFT) over the past couple of decades (Nissen, 2006b), including very recent work to measure dynamic knowledge and performance at the tactical edges of military combat organizations (Nissen & Gallup, 2012) and applying such work to the acquisition domain (Nissen, 2012), we’re able now to analyze, visualize, and measure dynamic knowledge flows, and we seek to leverage such ability to explain and predict corresponding organization performance levels. Two fundamental research questions follow accordingly:
How can dynamic knowledge and performance metrics be applied to assess acquisition workforce quality?
How can knowledge be linked to measure and predict performance levels of acquisition organizations?
In this exploratory study, we examine acquisition from the perspective of the procurement process, focusing in particular on organization knowledge and performance with respect to the processes used for the procurement of major systems and services, ranging from research and development to weapon system equipment and related maintenance. We begin with a summary of KFT and measurement and then introduce the Contract Management Maturity Model (CMMM; see Rendon, 2003) as an approach to acquisition performance measurement. We follow in turn by summarizing the research method guiding the study, after which we present preliminary results of our investigation. By interrelating knowledge to
^Åèìáëáíáçå=oÉëÉ~êÅÜ=mêçÖê~ã=dê~Çì~íÉ=pÅÜççä=çÑ=_ìëáåÉëë=C=mìÄäáÅ=mçäáÅó - 4 - k~î~ä=mçëíÖê~Çì~íÉ=pÅÜççä=
performance in terms of process maturity, this report presents the premier cause–effect relationship of its kind in the acquisition domain. This technical report concludes with key observations, limitations, and an agenda for continued research along these lines.
Knowledge Flow Theory and Contract Management Maturity
In this section, we begin with a summary of Knowledge Flow Theory and measurement and then introduce the Contract Management Maturity Model, discussing the potential for linking and using these two frameworks to assess acquisition performance.
KFT and Measurement The dynamic nature of knowledge indicates that both stocks and flows are
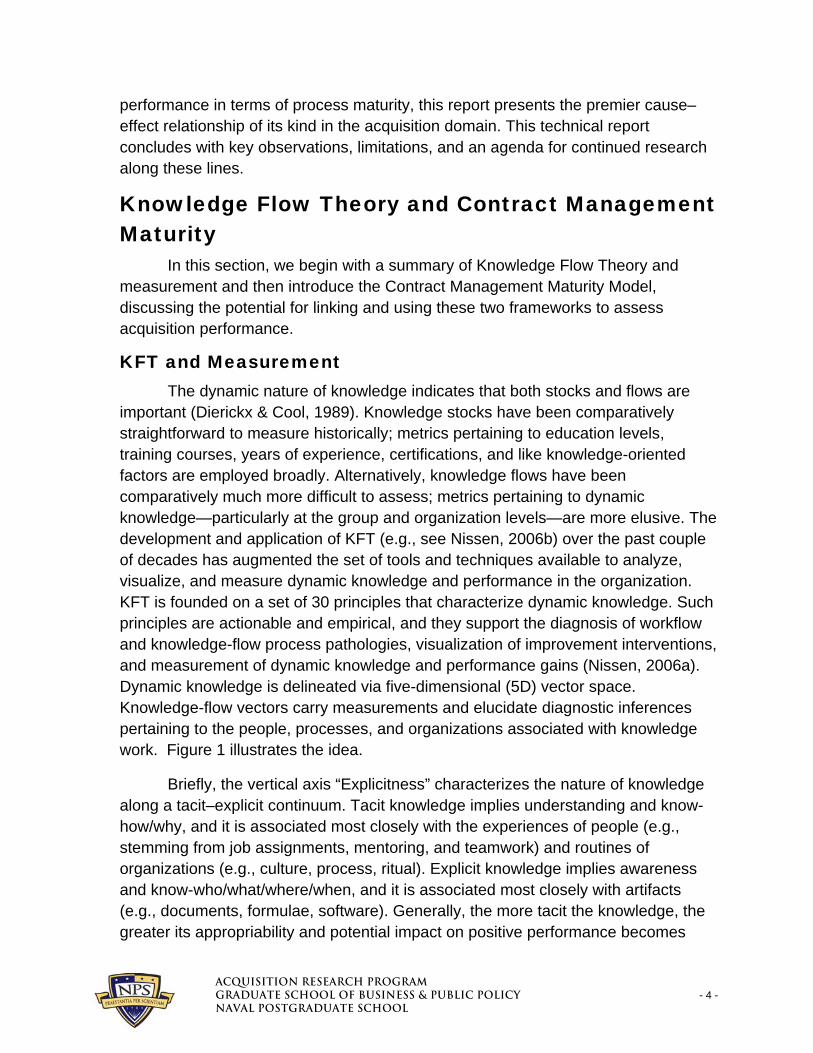
important (Dierickx & Cool, 1989). Knowledge stocks have been comparatively straightforward to measure historically; metrics pertaining to education levels, training courses, years of experience, certifications, and like knowledge-oriented factors are employed broadly. Alternatively, knowledge flows have been comparatively much more difficult to assess; metrics pertaining to dynamic knowledge—particularly at the group and organization levels—are more elusive. The development and application of KFT (e.g., see Nissen, 2006b) over the past couple of decades has augmented the set of tools and techniques available to analyze, visualize, and measure dynamic knowledge and performance in the organization. KFT is founded on a set of 30 principles that characterize dynamic knowledge. Such principles are actionable and empirical, and they support the diagnosis of workflow and knowledge-flow process pathologies, visualization of improvement interventions, and measurement of dynamic knowledge and performance gains (Nissen, 2006a). Dynamic knowledge is delineated via five-dimensional (5D) vector space. Knowledge-flow vectors carry measurements and elucidate diagnostic inferences pertaining to the people, processes, and organizations associated with knowledge work. Figure 1 illustrates the idea.
Briefly, the vertical axis “Explicitness” characterizes the nature of knowledge along a tacit–explicit continuum. Tacit knowledge implies understanding and know-how/why, and it is associated most closely with the experiences of people (e.g., stemming from job assignments, mentoring, and teamwork) and routines of organizations (e.g., culture, process, ritual). Explicit knowledge implies awareness and know-who/what/where/when, and it is associated most closely with artifacts (e.g., documents, formulae, software). Generally, the more tacit the knowledge, the greater its appropriability and potential impact on positive performance becomes
^Åèìáëáíáçå=oÉëÉ~êÅÜ=mêçÖê~ã=dê~Çì~íÉ=pÅÜççä=çÑ=_ìëáåÉëë=C=mìÄäáÅ=mçäáÅó - 5 - k~î~ä=mçëíÖê~Çì~íÉ=pÅÜççä=
(Saviotti, 1998). One can measure knowledge explicitness using ordinal, interval, or ratio scales.
TACTICAL TRAINING GROUP PACIFIC Train Hard...Be Ready, Win DecisivelyUNCLASSIFIED
UNCLASSIFIED
Reach
Life cycle
Explicitness
Tacit*1 10 100
Learn/Create
Use/Apply
Explicit
Flow time (thickness)Short/fastLong/slow
Power (color/fill)LowHigh
Share/transfer
Figure 1. 5D Knowledge Flow Diagram
The horizontal axis “Reach” characterizes how broadly knowledge is known and shared in an organization. Here we operationalize reach in terms of the number of people in an organization who have access to and can employ any particular chunk of knowledge, but we could view reach in terms of organization levels instead (e.g., individual, group, organization, interorganization). Generally, the broader the reach of knowledge, the greater its amplification and potential impact on positive performance becomes (Nonaka, 1994). Measurements can be made using ordinal, interval, or ratio scales.
The axis “Life cycle” characterizes what is being done with a particular chunk of knowledge at some specific point in time. Here we include three activities: (1) some individual in the organization learns or creates new knowledge; (2) he or she shares existing knowledge with or transfers it to other people in the organization; and (3) one or more people in the organization use or apply existing knowledge to accomplish work. Generally, knowledge does not become useful until it is used or applied (Pfeffer & Sutton, 1999). Measurements can be made using categorical or ordinal scales.
^Åèìáëáíáçå=oÉëÉ~êÅÜ=mêçÖê~ã=dê~Çì~íÉ=pÅÜççä=çÑ=_ìëáåÉëë=C=mìÄäáÅ=mçäáÅó - 6 - k~î~ä=mçëíÖê~Çì~íÉ=pÅÜççä=
Because visualization beyond three dimensions is difficult, we represent the dimension “Flow time” in terms of the thickness of lines used to delineate vectors. As shown in the key to the right of Figure 1, relatively thin lines are used to delineate short and fast knowledge flows, whereas comparatively thick lines represent knowledge that takes a long time and flows slowly. Generally, the more quickly that knowledge flows (e.g., across people, organizations, places, times), the greater its potential impact on positive performance becomes (Nissen, 2002). Measurements can be made using ordinal, interval, or ratio scales.
The dimension “Power” is represented similarly in terms of line style used to delineate knowledge-flow vectors. Knowledge that flows with relatively low power—this corresponds with relatively low performance levels of organization activities enabled by the knowledge—is delineated through orange dotted lines, whereas knowledge flows exhibiting high power—and hence enabling high performance—are delineated via purple solid lines. Measurements can be made using ordinal, interval, or ratio scales.
Integrating these five dimensions graphically and analytically generates a 5D vector space to examine dynamic knowledge. Such 5D space and examination schemes are completely general: They can be applied to any dynamic knowledge in any organization domain (e.g., acquisition, command and control, software engineering).
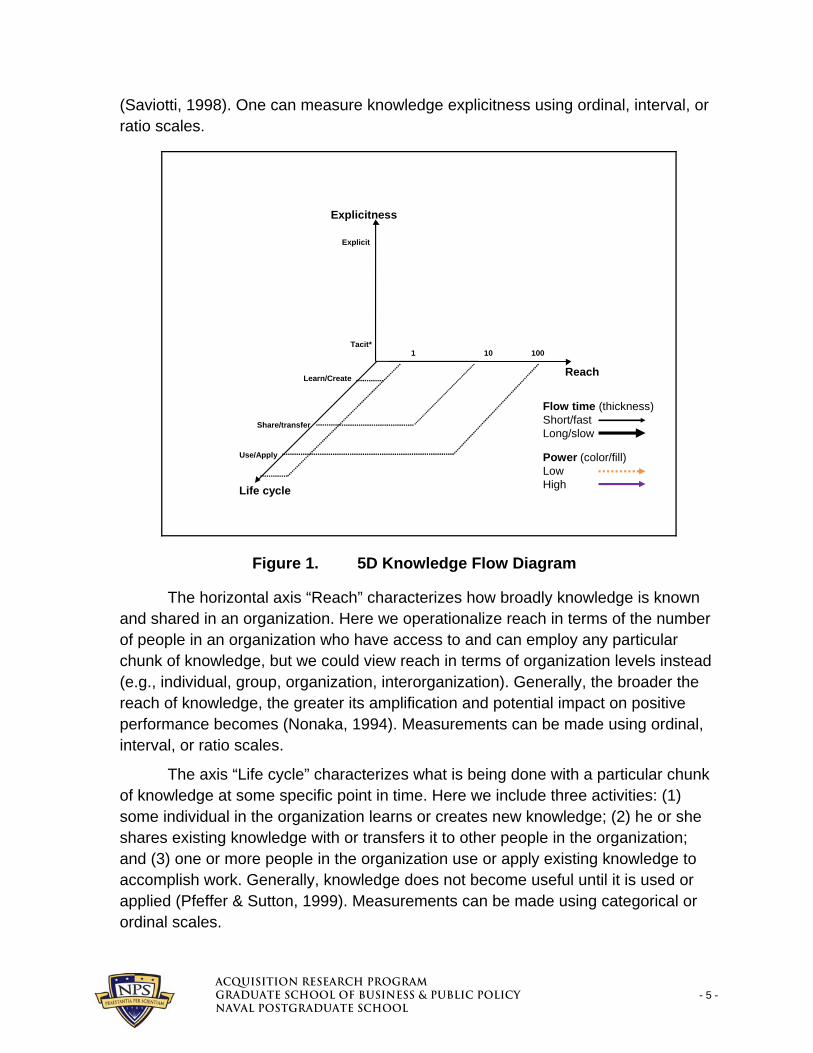
As an example of use and application, consider Figure 2, which illustrates an important knowledge flow desired by the organization. Point A represents one individual in the organization who learns something new (to that organization) or creates entirely new knowledge. In terms of the 5D space, this represents tacit knowledge that is created by an individual (i.e., one person), hence, its position at the bottom-back corner of the diagram.
^Åèìáëáíáçå=oÉëÉ~êÅÜ=mêçÖê~ã=dê~Çì~íÉ=pÅÜççä=çÑ=_ìëáåÉëë=C=mìÄäáÅ=mçäáÅó - 7 - k~î~ä=mçëíÖê~Çì~íÉ=pÅÜççä=
TACTICAL TRAINING GROUP PACIFIC Train Hard...Be Ready, Win DecisivelyUNCLASSIFIED
UNCLASSIFIED
Reach
Life cycle
Explicitness
Tacit*1 10 100
A
IndividualK creation
Learn/Create
Use/Apply
Explicit
Flow time (thickness)Short/fastLong/slow
Power (color/fill)LowHigh
?
OrgK application
Share/transfer
B
Figure 2. Knowledge Creation and Application Needs
In the acquisition domain, for instance, consider that such new knowledge could pertain to a technique for reducing the acquisition time for an important information system (IS) needed in the field. Because information technology (IT) advances so quickly—outpacing the ability of many acquisition organizations to develop and field systems responsively—the organization views this new knowledge created at Point A as important, and it would like to see such knowledge shared with and applied by all 100 people in that organization who work with IT.
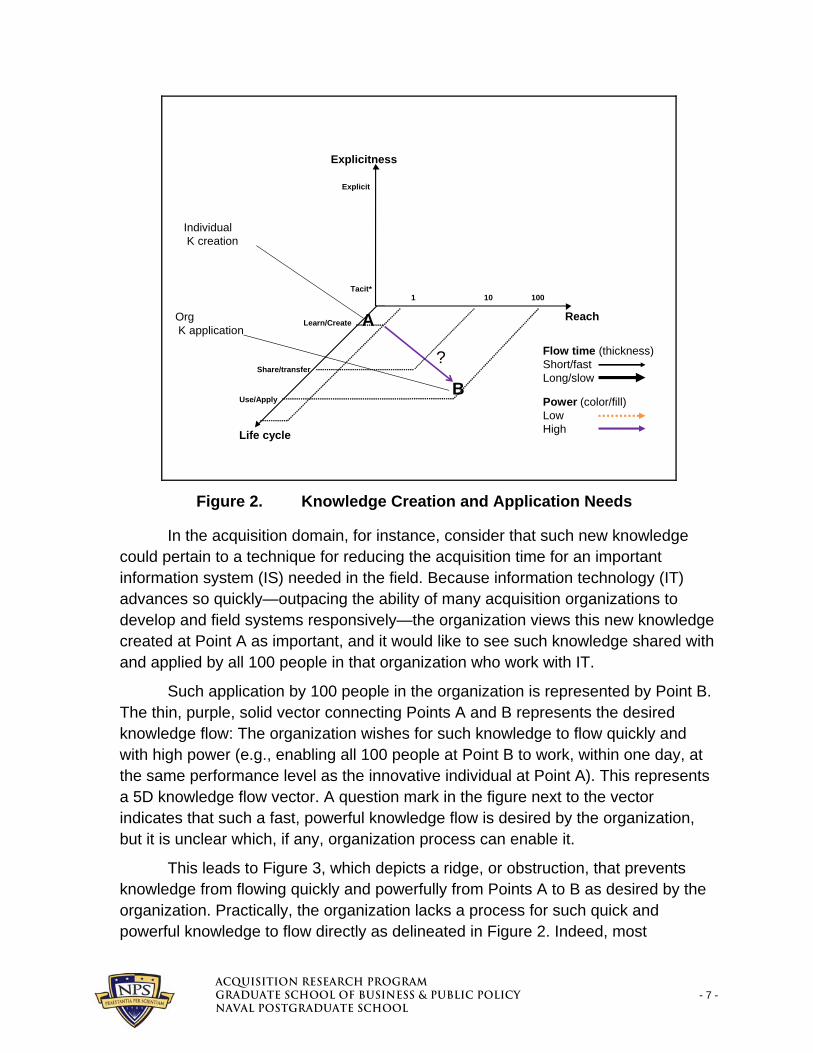
Such application by 100 people in the organization is represented by Point B. The thin, purple, solid vector connecting Points A and B represents the desired knowledge flow: The organization wishes for such knowledge to flow quickly and with high power (e.g., enabling all 100 people at Point B to work, within one day, at the same performance level as the innovative individual at Point A). This represents a 5D knowledge flow vector. A question mark in the figure next to the vector indicates that such a fast, powerful knowledge flow is desired by the organization, but it is unclear which, if any, organization process can enable it.
This leads to Figure 3, which depicts a ridge, or obstruction, that prevents knowledge from flowing quickly and powerfully from Points A to B as desired by the organization. Practically, the organization lacks a process for such quick and powerful knowledge to flow directly as delineated in Figure 2. Indeed, most
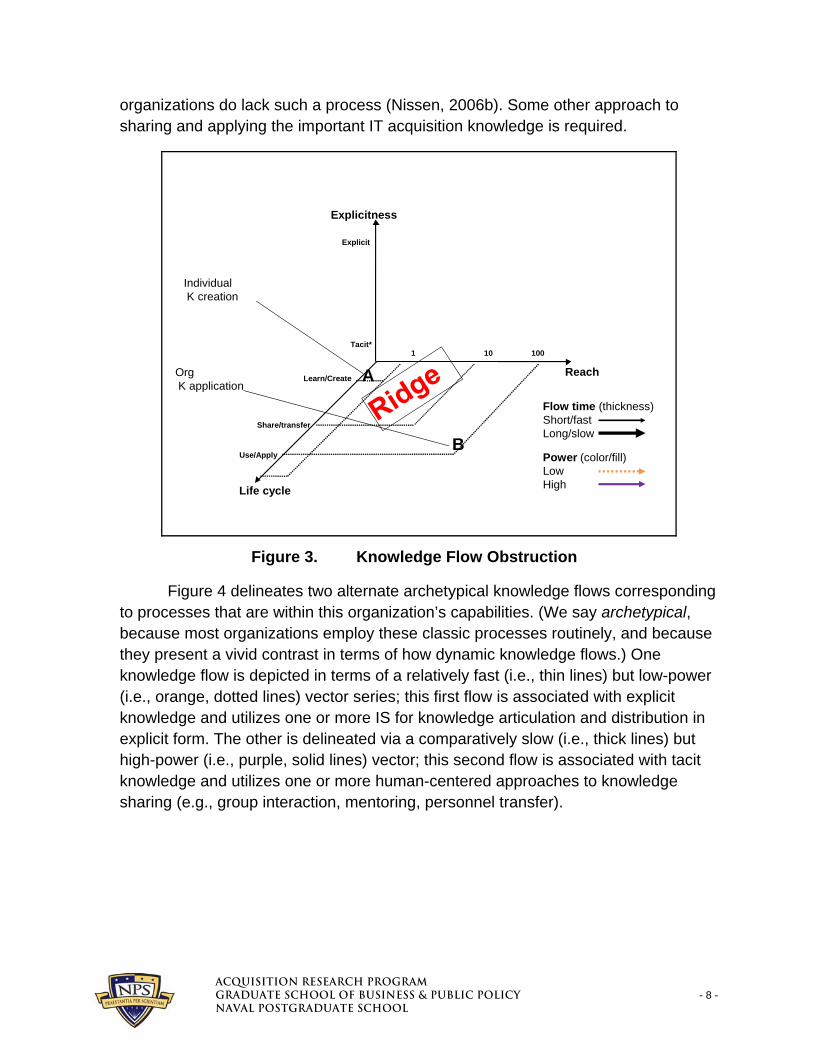
^Åèìáëáíáçå=oÉëÉ~êÅÜ=mêçÖê~ã=dê~Çì~íÉ=pÅÜççä=çÑ=_ìëáåÉëë=C=mìÄäáÅ=mçäáÅó - 8 - k~î~ä=mçëíÖê~Çì~íÉ=pÅÜççä=
organizations do lack such a process (Nissen, 2006b). Some other approach to sharing and applying the important IT acquisition knowledge is required.
TACTICAL TRAINING GROUP PACIFIC Train Hard...Be Ready, Win DecisivelyUNCLASSIFIED
UNCLASSIFIED
Reach
Life cycle
Explicitness
Tacit*1 10 100
A
IndividualK creation
Learn/Create
Use/Apply
Explicit
Flow time (thickness)Short/fastLong/slow
Power (color/fill)LowHigh
OrgK application
Share/transfer
B
Figure 3. Knowledge Flow Obstruction
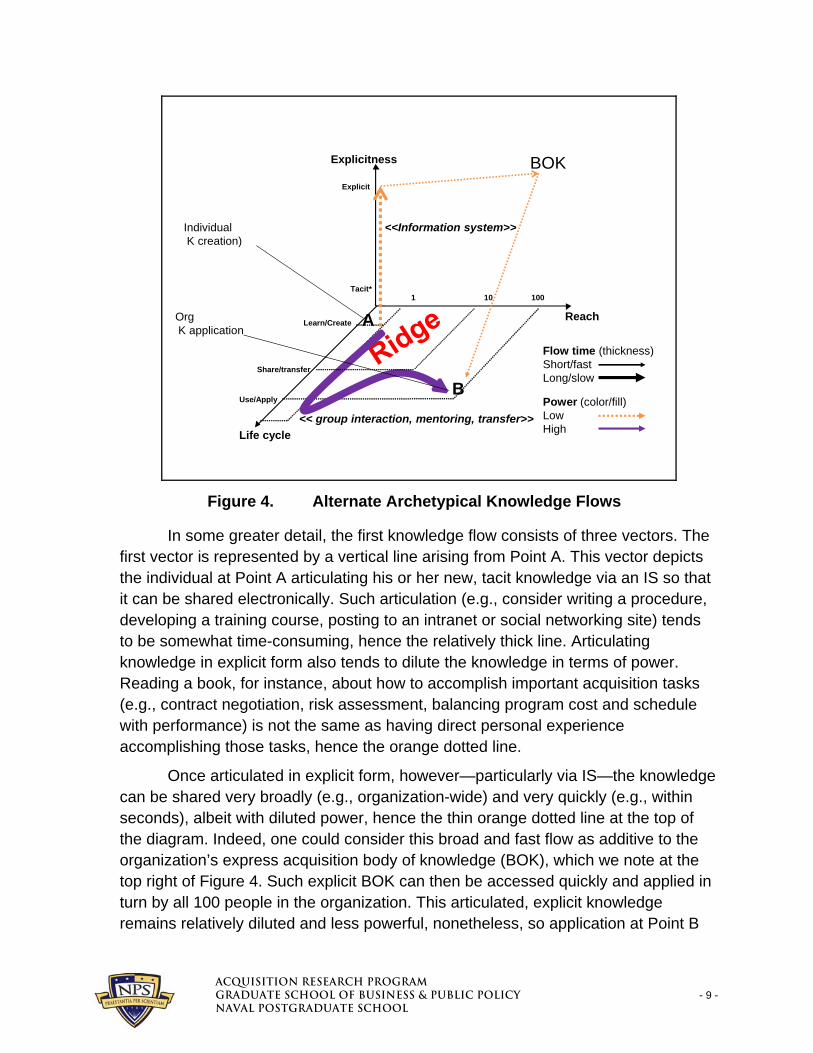
Figure 4 delineates two alternate archetypical knowledge flows corresponding to processes that are within this organization’s capabilities. (We say archetypical, because most organizations employ these classic processes routinely, and because they present a vivid contrast in terms of how dynamic knowledge flows.) One knowledge flow is depicted in terms of a relatively fast (i.e., thin lines) but low-power (i.e., orange, dotted lines) vector series; this first flow is associated with explicit knowledge and utilizes one or more IS for knowledge articulation and distribution in explicit form. The other is delineated via a comparatively slow (i.e., thick lines) but high-power (i.e., purple, solid lines) vector; this second flow is associated with tacit knowledge and utilizes one or more human-centered approaches to knowledge sharing (e.g., group interaction, mentoring, personnel transfer).
^Åèìáëáíáçå=oÉëÉ~êÅÜ=mêçÖê~ã=dê~Çì~íÉ=pÅÜççä=çÑ=_ìëáåÉëë=C=mìÄäáÅ=mçäáÅó - 9 - k~î~ä=mçëíÖê~Çì~íÉ=pÅÜççä=
TACTICAL TRAINING GROUP PACIFIC Train Hard...Be Ready, Win DecisivelyUNCLASSIFIED
UNCLASSIFIED
Reach
Life cycle
Explicitness
Tacit*1 10 100
A
B
Learn/Create
Use/Apply
Explicit
Flow time (thickness)Short/fastLong/slow
Power (color/fill)LowHigh
BOK
IndividualK creation)
OrgK application
Share/transfer
<<Information system>>
<< group interaction, mentoring, transfer>>
Figure 4. Alternate Archetypical Knowledge Flows
In some greater detail, the first knowledge flow consists of three vectors. The first vector is represented by a vertical line arising from Point A. This vector depicts the individual at Point A articulating his or her new, tacit knowledge via an IS so that it can be shared electronically. Such articulation (e.g., consider writing a procedure, developing a training course, posting to an intranet or social networking site) tends to be somewhat time-consuming, hence the relatively thick line. Articulating knowledge in explicit form also tends to dilute the knowledge in terms of power. Reading a book, for instance, about how to accomplish important acquisition tasks (e.g., contract negotiation, risk assessment, balancing program cost and schedule with performance) is not the same as having direct personal experience accomplishing those tasks, hence the orange dotted line.
Once articulated in explicit form, however—particularly via IS—the knowledge can be shared very broadly (e.g., organization-wide) and very quickly (e.g., within seconds), albeit with diluted power, hence the thin orange dotted line at the top of the diagram. Indeed, one could consider this broad and fast flow as additive to the organization’s express acquisition body of knowledge (BOK), which we note at the top right of Figure 4. Such explicit BOK can then be accessed quickly and applied in turn by all 100 people in the organization. This articulated, explicit knowledge remains relatively diluted and less powerful, nonetheless, so application at Point B
^Åèìáëáíáçå=oÉëÉ~êÅÜ=mêçÖê~ã=dê~Çì~íÉ=pÅÜççä=çÑ=_ìëáåÉëë=C=mìÄäáÅ=mçäáÅó - 10 - k~î~ä=mçëíÖê~Çì~íÉ=pÅÜççä=
would not support the same performance level as at Point A, hence the thin orange dotted line descending down to Point B.
Alternatively, the second knowledge flow consists of a single vector, although it curves and bends through the tacit knowledge plane at the bottom of Figure 4. This vector depicts the individual at Point A applying his or her new, tacit knowledge and then sharing it with some number of other people (say, 10 people, as illustrated in Figure 4) through one or more techniques such as extended group interaction, mentoring, or personnel transfer to work directly with different coworkers across the organization.
Once each of these 10 people has learned the new tacit knowledge, then all of them can continue the process and share it using similar techniques (e.g., group interaction, mentoring, or personnel transfer) with others. Through such a process, 100 people (i.e., 10 people each sharing with another 10 people) can learn this new tacit knowledge to the extent necessary for powerful application at Point B. This knowledge flow is depicted by a thick vector to indicate that it occurs comparatively slowly, but such vector is also delineated by a purple solid line to show that the corresponding knowledge has high power and enables knowledge-based action at the same performance level as the individual who created it at Point A.
The key is that one can measure these five dimensions of knowledge—whether via explicit or tacit flows—and relate them to the corresponding knowledge-based process performance by people in the organization. Indeed, by correlating such dynamic knowledge measures with performance metrics, one can develop a model capable of analyzing, visualizing, and even predicting process performance based upon knowledge flow patterns.
Of course, many diverse combinations of these archetypical knowledge flows are possible too, yet most knowledge flows are likely to reflect some aspects of these two dynamic patterns (Nissen, 2006b). Through empirical analysis and calibration of specific knowledge flowing through any particular organization in the field, one can correlate 5D dynamic knowledge flows with work performance, resulting in a model capable of measurement and prediction. Through this technique, we are working to assess AWF quality in terms of dynamic knowledge flows.
Contract Management Maturity Model Contract management is a notably challenging process, which can be viewed
productively via six phases: (1) Procurement Planning, (2) Solicitation Planning, (3) Solicitation, (4) Source Selection, (5) Contract Administration, and (6) Contract Closeout/Termination (Rendon, 2008). Both individually and together as a set, these six phases of the contract management process form the basis for assessing
^Åèìáëáíáçå=oÉëÉ~êÅÜ=mêçÖê~ã=dê~Çì~íÉ=pÅÜççä=çÑ=_ìëáåÉëë=C=mìÄäáÅ=mçäáÅó - 11 - k~î~ä=mçëíÖê~Çì~íÉ=pÅÜççä=
contract management process capability and maturity, which offer in turn an approach to measuring performance (Garrett & Rendon, 2005; Rendon, 2008). In a general process sense not specific to contract management, process capability is defined as “the inherent ability of a process to produce planned results” (Ahern, Clouse, & Turner, 2001, pg 4). As the capability of a process increases, it becomes predictable and measurable. As the organization steadily improves its process capability, organization competence increases, and organization processes become more mature (Ahern et al., 2001). Competence, in this case, is defined as “an underlying characteristic that is causally related to effective or superior performance, as determined by measurable, objective criteria, in a job or in a situation” (Curtis, Hefley, & Miller, 2001, pg 577). Maturity can be defined as “a measure of effectiveness in any specific process” (Dinsmore, 1998, pg 169). It is important to note that process maturity is not related to the passage of time. Different organizations mature at different rates, depending on the nature of the business and the emphasis placed on process improvement. Process maturity is more reflective of how far an organization has progressed toward continuously improving its process capability in any specific area.
Organization process capability can be assessed using a process maturity model. These maturity models are built on a series of maturity levels—each maturity level reflective of the level of competence for that process. As the organization gains process competence, it moves up the maturity scale. As maturity increases, so does capability and predictability, while risk decreases. Process capability maturity models include the Software Engineering Institute’s (SEI) Capability Maturity Model (CMM) and the Kerzner Project Management Maturity Model (PMMM). The SEI CMM is used to assess an organization’s software development process (Persse, 2001; Ahern et al., 2001). The PMMM is used to assess an organization’s project management processes (Kerzner, 2001).
Rendon (2003) was the first to apply the concept of process capability and maturity to organization contract management processes. The CMMM was developed as a method for assessing an organization’s contract management process capability and using the assessment results to identify contract management process deficiencies and the need for process improvement. The CMMM has been applied at Air Force, Army, Navy, and defense contractor organizations (Rendon, 2008, 2009, 2010, 2011). “Contract management,” as used in the model, is defined as the “art and science of managing a contractual agreement throughout the contracting process” (Garrett & Rendon, 2005, p. 270). “Maturity,” as defined in the model, refers to organization capabilities that can consistently produce successful business results for buyers and sellers of products, services, and integrated solutions (Garrett & Rendon, 2005). Thus, contract
^Åèìáëáíáçå=oÉëÉ~êÅÜ=mêçÖê~ã=dê~Çì~íÉ=pÅÜççä=çÑ=_ìëáåÉëë=C=mìÄäáÅ=mçäáÅó - 12 - k~î~ä=mçëíÖê~Çì~íÉ=pÅÜççä=
management refers to the buyer’s (procurement) process as well as the seller’s (business development and sales) process. The CMMM assessments analyzed in this research focus only on the buyer’s procurement process. The structure of the CMMM is based on the six contract management process phases previously discussed and on the five levels of contract management process capability maturity.
Specifically, the five levels of contract management process maturity range from an Ad Hoc level (Level 1) to a level in which optimized processes focus on continuous improvement and adoption of lessons learned and best practices (Optimized Level 5). The following is a brief description of each maturity level.
Level 1—Ad Hoc: The organization at this initial level of process maturity acknowledges that contract management processes exist and that these processes are accepted and practiced throughout various industries and within the public and private sectors. In addition, the organization’s management understands the benefit and value of using contract management processes. Although there are no basic contract management processes that are established organization-wide, some established contract management processes do exist and are used within the organization, but these established processes are applied only on an ad hoc and sporadic basis to various contracts. There is no established discipline or protocol as to which contracts these processes are applied. Furthermore, there is informal documentation of contract management processes existing within the organization, but this documentation is used only on an ad hoc and sporadic basis on various contracts. Finally, organization managers and contract management personnel are not held accountable for adhering to, or complying with, any basic contract management processes or standards.
Level 2—Basic: Organizations at this level of maturity have established some basic contract management processes and standards within the organization, but these processes are required only on selected complex, critical, or high-visibility contracts, such as contracts meeting certain dollar thresholds or contracts with certain customers. Some formal documentation has been developed for these established contract management processes and standards. Furthermore, the organization does not consider these contract management processes or standards established or institutionalized throughout the entire organization. Finally, at this maturity level, there is no organization policy requiring the consistent use of these contract management processes and standards on contracts other than the required contracts.
Level 3—Structured: At this level of maturity, contract management processes and standards are fully established, institutionalized, and mandated throughout the entire organization. Formal documentation has been developed for
^Åèìáëáíáçå=oÉëÉ~êÅÜ=mêçÖê~ã=dê~Çì~íÉ=pÅÜççä=çÑ=_ìëáåÉëë=C=mìÄäáÅ=mçäáÅó - 13 - k~î~ä=mçëíÖê~Çì~íÉ=pÅÜççä=
these contract management processes and standards, and some processes may even be automated. Furthermore, since these contract management processes are mandated, the organization allows the tailoring of processes and documents in consideration for the unique aspects of each contract, such as contracting strategy, contract type, terms and conditions, dollar value, and type of requirement (product or service). Finally, senior organization management is involved in providing guidance, direction, and even approval of key contracting strategy, decisions, related contract terms and conditions, and contract management documents.
Level 4—Integrated: Organizations at this level of maturity have contract management processes that are fully integrated with other organization core processes such as financial management, schedule management, performance management, and systems engineering. In addition to representatives from other organization functional offices, the contract’s end user customer is also an integral member of the buying or selling contracts team. Finally, the organization’s management periodically uses metrics to measure various aspects of the contract management process and to make contract-related decisions.
Level 5—Optimized: The fifth and highest level of maturity reflects an organization whose management systematically uses performance metrics to measure the quality and evaluate the efficiency and effectiveness of the contract management processes. At this level, continuous process-improvement efforts are also implemented to improve the contract management processes. Furthermore, the organization has established programs for lessons learned and best practices in order to improve contract management processes, standards, and documentation. Finally, contract management process streamlining initiatives are implemented by the organization as part of its continuous process-improvement program.
The CMMM uses a web-based assessment tool deployed to fully-qualified contracting officers and personnel. The assessment tool consists of survey questions related to industry-established best practices in contract management. The best practices are associated with the contract management process capability enablers of process strength, successful results, management support, process integration, and process measurement. The contracting personnel respond to the survey questions based on their organizations’ implementation of best practices. Each survey question uses a Likert scale response option (and numerical equivalent) ranging from I Don’t Know (0) to Always (5). The contracting personnel’s responses are calculated and then converted to a maturity level using a conversion table. The conversion table is based on the rationale that of the total points available for each contracting phase, a minimum of 95% of the available points is needed for the Optimized level, 85% for Integrated, 75% for Structured, and 50% for Basic.
^Åèìáëáíáçå=oÉëÉ~êÅÜ=mêçÖê~ã=dê~Çì~íÉ=pÅÜççä=çÑ=_ìëáåÉëë=C=mìÄäáÅ=mçäáÅó - 14 - k~î~ä=mçëíÖê~Çì~íÉ=pÅÜççä=
Anything less than 50% is considered an ad hoc level of process maturity. A maturity level is calculated for each of the six phases of the contract management process.
From this discussion, it should become clearer how knowledge interrelates dynamically with process capability and maturity. Not only does knowledge exist, grow, and move within and between individual participants of the AWF, manifested through their professional performance of acquisition tasks, we find it also at the organization level, manifested through the professional performance of processes, which are accomplished by many individual people, working together to accomplish many tasks toward a set of shared goals. Not only must individual people understand and be able to accomplish the key tasks comprising process work, the organization as a whole must also understand and be able to accomplish the process itself. Organizations at higher maturity levels have arguably developed greater process-level understanding than their lower-level counterparts, hence they show potential to manifest correspondingly higher process performance levels. Knowledge—at the organization as well as the individual level—drives such understanding and potential.
Research Method The two research questions stated in the previous section include “how”
interrogatives and suggest initially that a qualitative method may be most appropriate to investigate it (Yin, 1994). Despite the generality of KFT and the 5D space described in the previous section, applying the corresponding analytic, visualization, and measurement techniques to assess AWF quality requires acquisition domain knowledge in general and process-specific understanding in particular. We need to study one or more specific acquisition processes in detail in order to apply the techniques and assess workforce quality. The same reasoning applies to the CMMM: One or more specific processes must be examined and assessed. Only after such understanding has been developed and such assessment accomplished can we work toward linking KFT and CMMM.
Building upon recent case study research (Barnes & Williams, 2012; Nissen, 2012), in addition to our general acquisition experience and CMMM assessments (Rendon, 2011), we integrate data from previous studies to establish a basis for AWF quality assessment via KFT–CMMM linkage. In particular, we employ KFT and 5D modeling to identify key independent variables (e.g., kinds and levels of knowledge) and CMMM assessment results to identify corresponding dependent variables exhibiting good potential in our research context. We then explore the integration of these two parts (i.e., matching the independent with dependent variables) through a combination of qualitative and quantitative analysis.
^Åèìáëáíáçå=oÉëÉ~êÅÜ=mêçÖê~ã=dê~Çì~íÉ=pÅÜççä=çÑ=_ìëáåÉëë=C=mìÄäáÅ=mçäáÅó - 15 - k~î~ä=mçëíÖê~Çì~íÉ=pÅÜççä=
Specifically for KFT and 5D modeling, we look at contracting knowledge stocks from two DoD contracting centers including Procuring Contracting Officer (PCO) assignment, Defense Acquisition Workforce Improvement Act (DAWIA) contracting certification level, and years of contracting experience. PCOs are warranted contracting officers that are authorized to award, administer, and terminate contracts and make related determinations and findings. Only warranted contracting officers are authorized to obligate the government in contractual matters (Rendon & Snider, 2008). The Defense Acquisition Workforce Improvement Act (DAWIA) is a statutory law that specifies education, training, and experience requirements for the DoD contracting workforce and established three levels of certification. DAWIA contracting certification Level I is considered entry level (bachelor’s degree, entry-level training, and up to two years of experience), Level II is considered intermediate level (intermediate-level training, and two additional years of experience), and Level III is considered advanced level (advanced training and four additional years of experience; see Rendon & Snider, 2008).
The CMMM variables refer to the contract management maturity levels resulting from the CMMM assessments at two DoD contracting centers. These maturity levels are Level 1 (Ad Hoc), Level 2 (Basic), Level 3 (Structured), Level 4 (Integrated), and Level 5 (Optimized).
Results Results from this exploratory investigation center on delineating the
procurement process via KFT, summarizing corresponding CMMM assessments, and linking the two to elucidate insight into AWF quality. We begin with an overview of the focal organizations.
Focal Organizations The two focal organizations of this study include the contracting centers at
two large, operational DoD organizations. Using pseudonyms, the Organization T Contracting Center provides acquisition and contracting support for the procurement of military equipment and hardware. This includes procuring research and development, systems, and repair parts and services. The Organization T contracting center does a relatively large amount of business (over $10 billion annually).
The Organization R Contracting Center provides innovative acquisition and contracting support for research and development acquisition. The Organization R contracting center does a relatively large amount of business also (almost $7 billion annually).
^Åèìáëáíáçå=oÉëÉ~êÅÜ=mêçÖê~ã=dê~Çì~íÉ=pÅÜççä=çÑ=_ìëáåÉëë=C=mìÄäáÅ=mçäáÅó - 16 - k~î~ä=mçëíÖê~Çì~íÉ=pÅÜççä=
Although the Organization T and Organization R Contracting Centers acquire and procure different types of supplies and services, the contract management processes used are common to both organizations (Rendon & Snider, 2008). Additionally, the contract management processes used at these contracting centers are also common to other DoD and federal government agencies for the procurement of supplies and services. Thus, conclusions based on the analysis of the results from these contract management process assessments may be applicable to other DoD and federal government agencies. Indeed, given that many of the same process activities are required for all procurements, some aspects of our results should apply quite broadly and well beyond the government sector.
Analysis In this section, we summarize some of the key knowledge data associated
with our focal contracting organizations. In particular, we examine and compare three complementary knowledge proxies: PCO density, DAWIA level, and experience. The first measure characterizes the fraction of respondents surveyed in each organization that possess contracting warrants. This represents a sign of knowledge and experience in addition to education. This proxy also, to some extent, represents organization contracting capacity. Since only warranted PCOs can sign contract documents, the greater the number of PCOs, the greater the organizations’ capacity for performing the contracting mission. The measure varies from 0 (i.e., no one has a warrant) to 1 (i.e., everyone is warranted). The second measure characterizes respondents’ certification levels. As noted in the previous section, there is an educational component (e.g., bachelor’s degree and additional training) along with an experiential one (e.g., three years’ experience). The third measure sums respondents’ years of experience in the contracting domain. This measure is comparatively pure in terms of reflecting principally tacit knowledge.
There is likely to be some confounding and collinearity across these measures, as they all reflect some degree of experience (i.e., tacit knowledge), and the first two both reflect some degree of education (i.e., explicit knowledge) also. Nonetheless, they do represent knowledge proxies that lend themselves to examination in our exploratory research context. Further, although each of these three measures is static in nature, all three are expected to have strong association with organization performance in terms of our process maturity measure. Follow-on research can build upon our results to refine these data, expand data collection, and investigate dynamic knowledge measures as well.
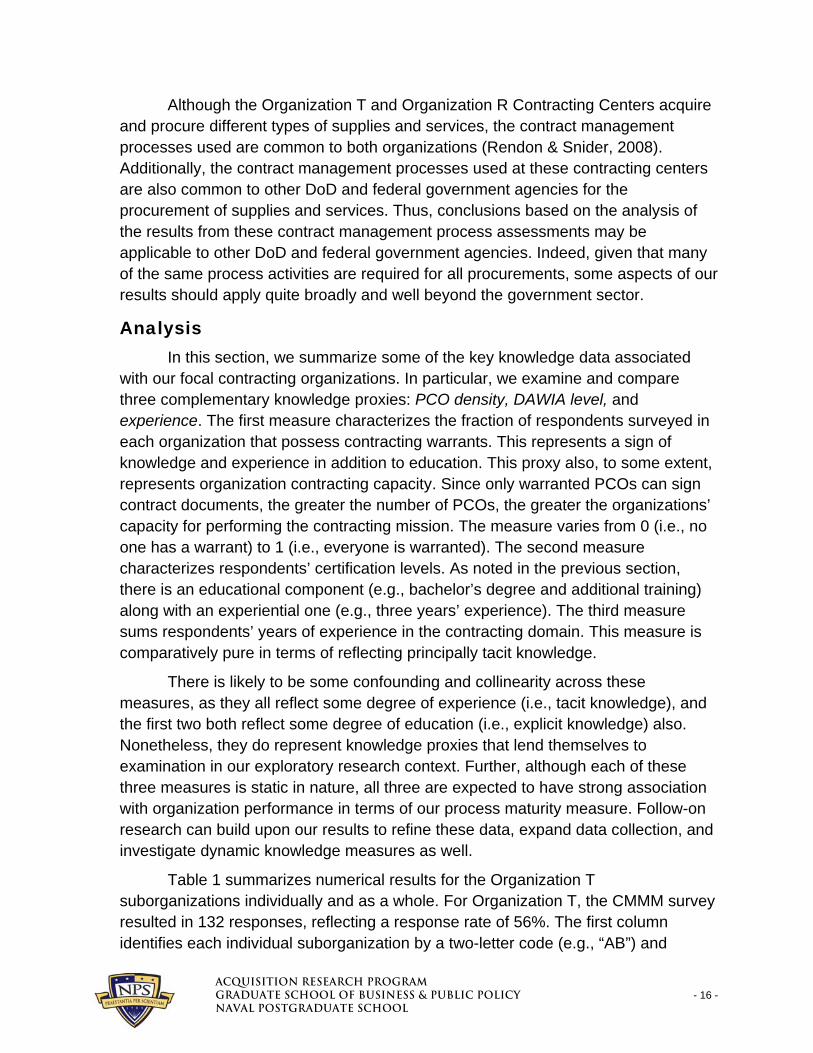
Table 1 summarizes numerical results for the Organization T suborganizations individually and as a whole. For Organization T, the CMMM survey resulted in 132 responses, reflecting a response rate of 56%. The first column identifies each individual suborganization by a two-letter code (e.g., “AB”) and
^Åèìáëáíáçå=oÉëÉ~êÅÜ=mêçÖê~ã=dê~Çì~íÉ=pÅÜççä=çÑ=_ìëáåÉëë=C=mìÄäáÅ=mçäáÅó - 17 - k~î~ä=mçëíÖê~Çì~íÉ=pÅÜççä=
includes average values across all seven such individual suborganizations (i.e., “All”). The second column summarizes the relative density of warranted contracting officers surveyed in each suborganization. In the AB suborganization, for instance, roughly 40% of survey respondents were warranted as such. This exceeds the density of warranted contracting officers in the organization as a whole of course, but it reflects the relatively high-level pool of people surveyed. Such high-level people possess relatively good understanding of the organization’s contracting processes and hence serve as appropriate respondents to evaluate its maturity.
In similar fashion, the third column summarizes the relative certification level in each organization. In this same AB suborganization, for instance, the average certification level is 2.6. This reflects likewise appropriately a relatively highly certified pool of respondents with Level II & III certifications. The fourth column summarizes the relative experience level in each organization, with suborganization AB shown at nearly 11 years’ average experience among contracting personnel surveyed. Notice how the HD suborganization at the bottom of the table appears to be something of an outlier with a considerably higher experience level (i.e., 16.8 years).
Table 1. Organization T Knowledge Summary Org PCO DAWIA Years
AB 0.4 2.6 10.8 AD 0.2 2.6 11.4 AH 0.2 2.5 10.7 AI 0.6 2.8 12.8 AS 0.2 2.6 10.8 AT 0.3 2.4 11.6 HD 0.2 2.7 16.8
All 0.3 2.6 12.1 n = 132
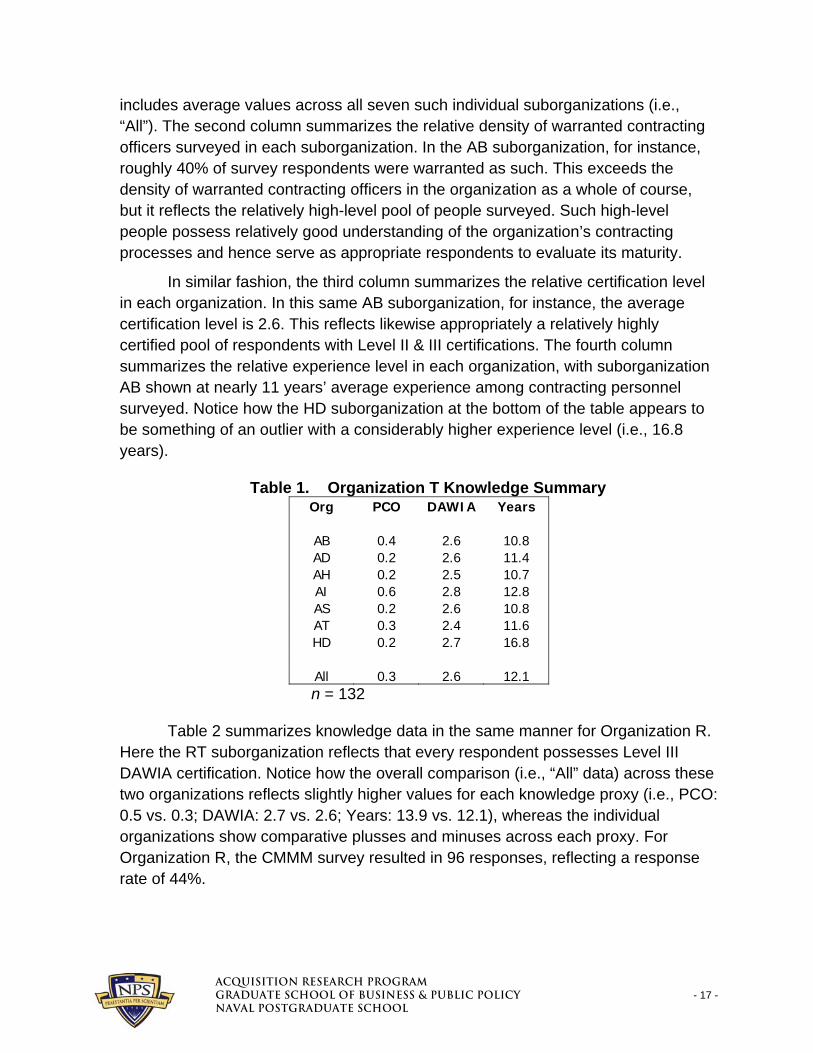
Table 2 summarizes knowledge data in the same manner for Organization R. Here the RT suborganization reflects that every respondent possesses Level III DAWIA certification. Notice how the overall comparison (i.e., “All” data) across these two organizations reflects slightly higher values for each knowledge proxy (i.e., PCO: 0.5 vs. 0.3; DAWIA: 2.7 vs. 2.6; Years: 13.9 vs. 12.1), whereas the individual organizations show comparative plusses and minuses across each proxy. For Organization R, the CMMM survey resulted in 96 responses, reflecting a response rate of 44%.
^Åèìáëáíáçå=oÉëÉ~êÅÜ=mêçÖê~ã=dê~Çì~íÉ=pÅÜççä=çÑ=_ìëáåÉëë=C=mìÄäáÅ=mçäáÅó - 18 - k~î~ä=mçëíÖê~Çì~íÉ=pÅÜççä=
Table 2. Organization R Knowledge Summary Org PCO DAWIA Years
AD 0.5 2.5 14.9 AI 0.5 2.5 12.3 AP 0.5 2.8 13.1 ED 0.6 2.7 15.0 RT 0.4 3.0 14.1
All 0.5 2.7 13.9 n = 96
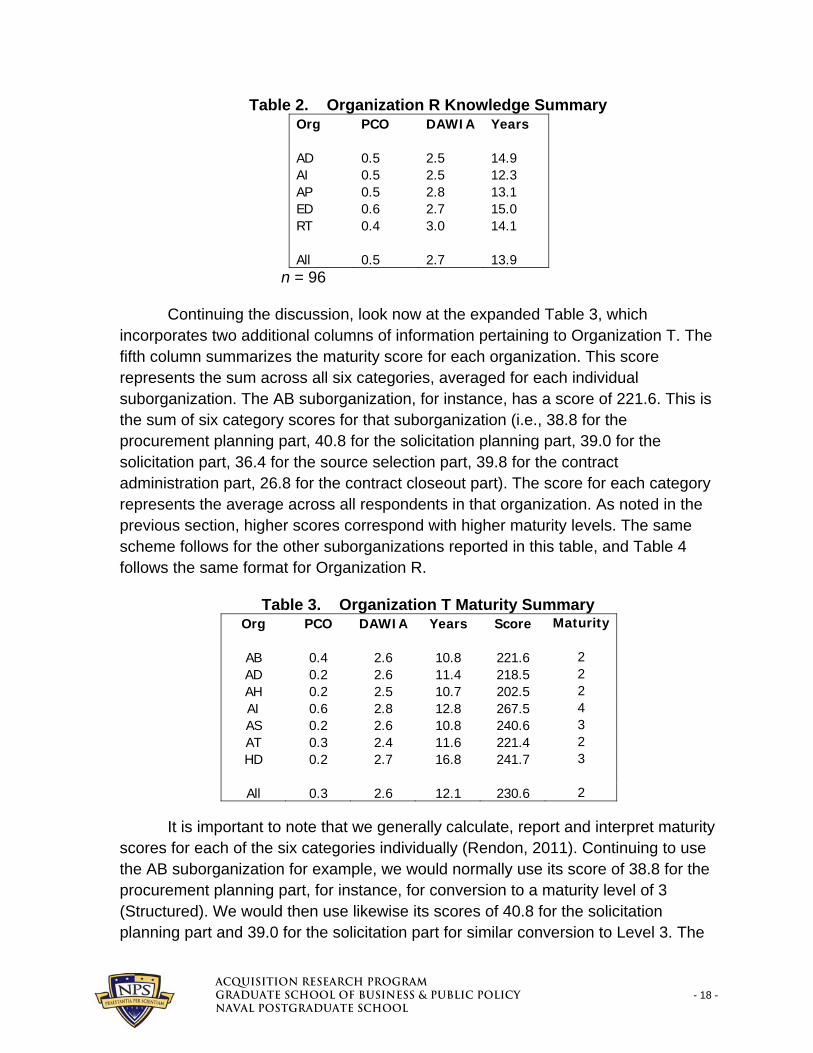
Continuing the discussion, look now at the expanded Table 3, which incorporates two additional columns of information pertaining to Organization T. The fifth column summarizes the maturity score for each organization. This score represents the sum across all six categories, averaged for each individual suborganization. The AB suborganization, for instance, has a score of 221.6. This is the sum of six category scores for that suborganization (i.e., 38.8 for the procurement planning part, 40.8 for the solicitation planning part, 39.0 for the solicitation part, 36.4 for the source selection part, 39.8 for the contract administration part, 26.8 for the contract closeout part). The score for each category represents the average across all respondents in that organization. As noted in the previous section, higher scores correspond with higher maturity levels. The same scheme follows for the other suborganizations reported in this table, and Table 4 follows the same format for Organization R.
Table 3. Organization T Maturity Summary Org PCO DAWIA Years Score Maturity
AB 0.4 2.6 10.8 221.6 2 AD 0.2 2.6 11.4 218.5 2 AH 0.2 2.5 10.7 202.5 2 AI 0.6 2.8 12.8 267.5 4 AS 0.2 2.6 10.8 240.6 3 AT 0.3 2.4 11.6 221.4 2 HD 0.2 2.7 16.8 241.7 3
All 0.3 2.6 12.1 230.6 2
It is important to note that we generally calculate, report and interpret maturity scores for each of the six categories individually (Rendon, 2011). Continuing to use the AB suborganization for example, we would normally use its score of 38.8 for the procurement planning part, for instance, for conversion to a maturity level of 3 (Structured). We would then use likewise its scores of 40.8 for the solicitation planning part and 39.0 for the solicitation part for similar conversion to Level 3. The
^Åèìáëáíáçå=oÉëÉ~êÅÜ=mêçÖê~ã=dê~Çì~íÉ=pÅÜççä=çÑ=_ìëáåÉëë=C=mìÄäáÅ=mçäáÅó - 19 - k~î~ä=mçëíÖê~Çì~íÉ=pÅÜççä=
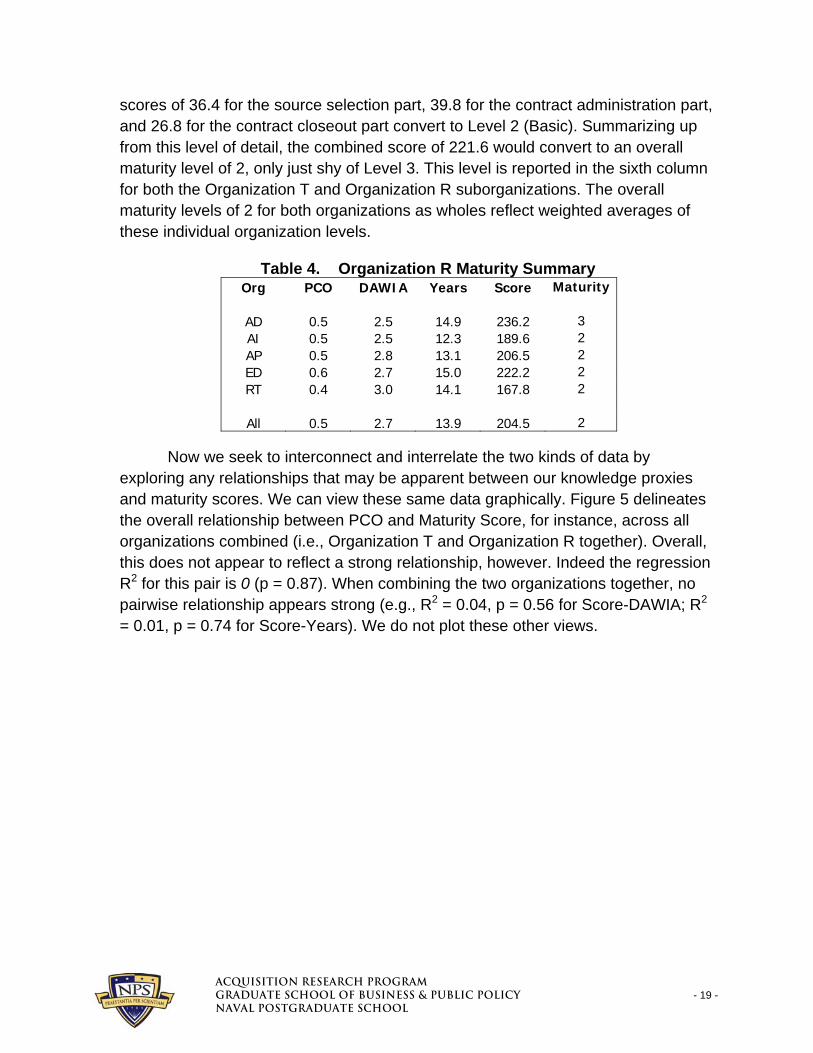
scores of 36.4 for the source selection part, 39.8 for the contract administration part, and 26.8 for the contract closeout part convert to Level 2 (Basic). Summarizing up from this level of detail, the combined score of 221.6 would convert to an overall maturity level of 2, only just shy of Level 3. This level is reported in the sixth column for both the Organization T and Organization R suborganizations. The overall maturity levels of 2 for both organizations as wholes reflect weighted averages of these individual organization levels.
Table 4. Organization R Maturity Summary Org PCO DAWIA Years Score Maturity
AD 0.5 2.5 14.9 236.2 3 AI 0.5 2.5 12.3 189.6 2 AP 0.5 2.8 13.1 206.5 2 ED 0.6 2.7 15.0 222.2 2 RT 0.4 3.0 14.1 167.8 2
All 0.5 2.7 13.9 204.5 2
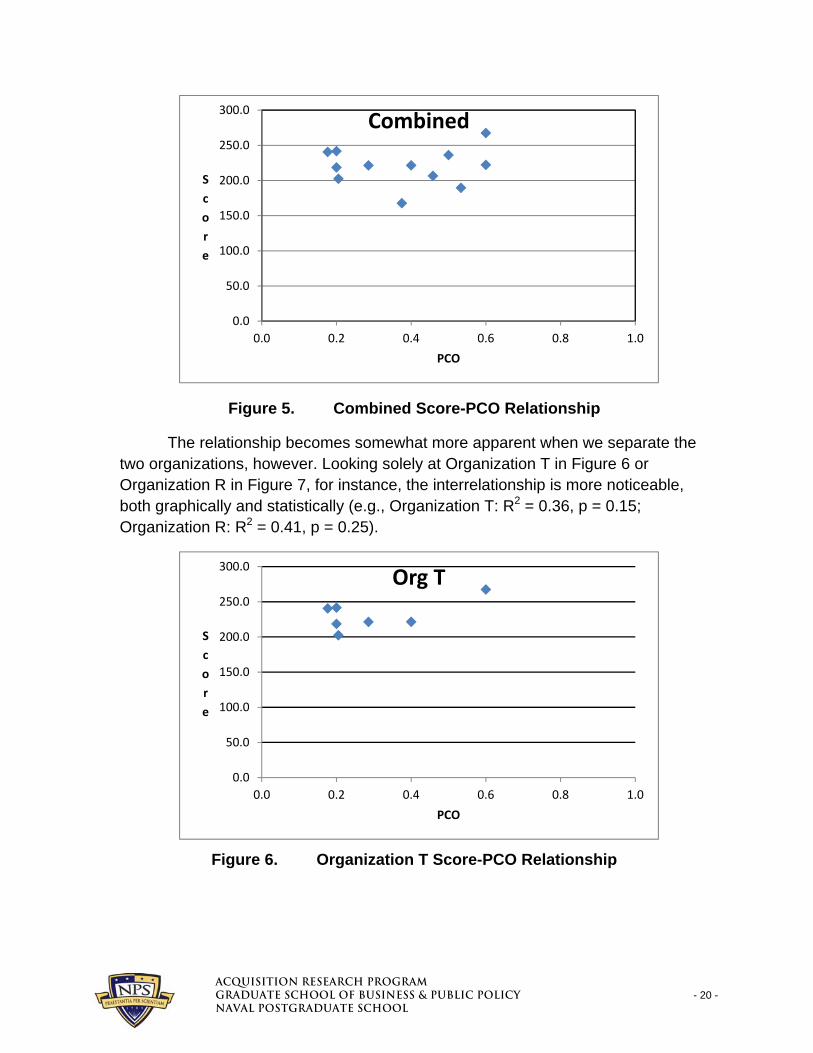
Now we seek to interconnect and interrelate the two kinds of data by exploring any relationships that may be apparent between our knowledge proxies and maturity scores. We can view these same data graphically. Figure 5 delineates the overall relationship between PCO and Maturity Score, for instance, across all organizations combined (i.e., Organization T and Organization R together). Overall, this does not appear to reflect a strong relationship, however. Indeed the regression R2 for this pair is 0 (p = 0.87). When combining the two organizations together, no pairwise relationship appears strong (e.g., R2 = 0.04, p = 0.56 for Score-DAWIA; R2 = 0.01, p = 0.74 for Score-Years). We do not plot these other views.
^Åèìáëáíáçå=oÉëÉ~êÅÜ=mêçÖê~ã=dê~Çì~íÉ=pÅÜççä=çÑ=_ìëáåÉëë=C=mìÄäáÅ=mçäáÅó - 20 - k~î~ä=mçëíÖê~Çì~íÉ=pÅÜççä=
Figure 5. Combined Score-PCO Relationship
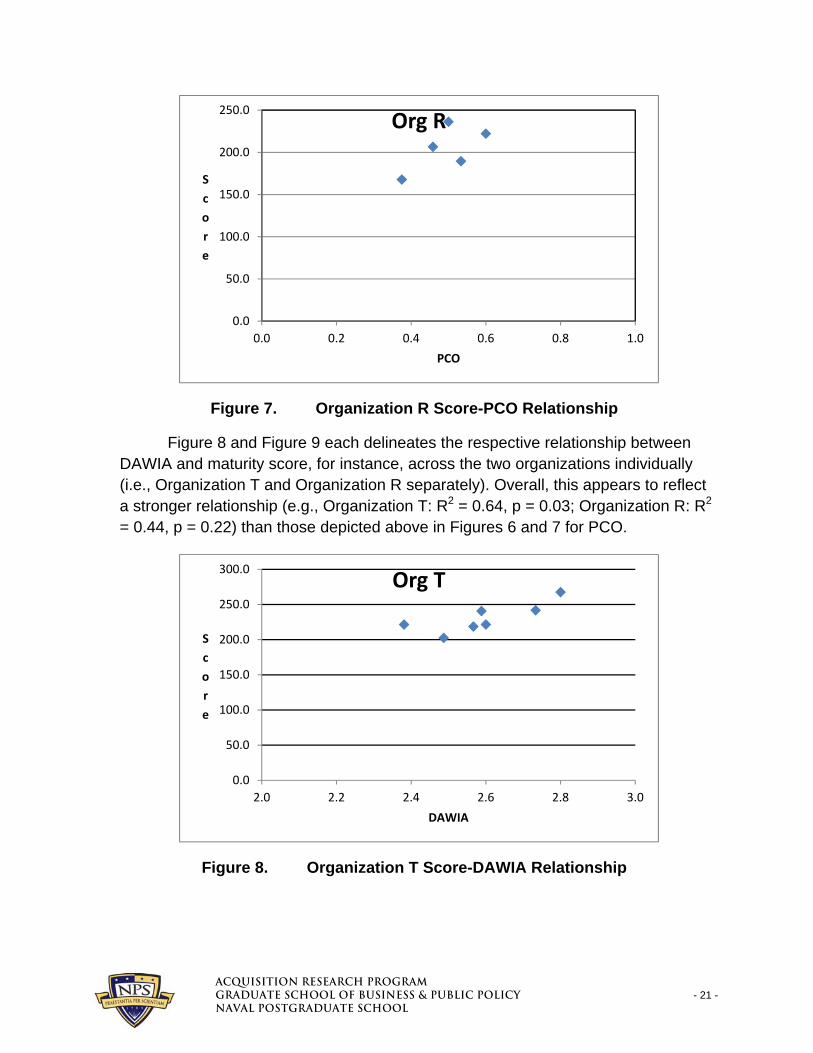
The relationship becomes somewhat more apparent when we separate the two organizations, however. Looking solely at Organization T in Figure 6 or Organization R in Figure 7, for instance, the interrelationship is more noticeable, both graphically and statistically (e.g., Organization T: R2 = 0.36, p = 0.15; Organization R: R2 = 0.41, p = 0.25).
Figure 6. Organization T Score-PCO Relationship
0.0
50.0
100.0
150.0
200.0
250.0
300.0
0.0 0.2 0.4 0.6 0.8 1.0
S
c
o
r
e
PCO
Combined
0.0
50.0
100.0
150.0
200.0
250.0
300.0
0.0 0.2 0.4 0.6 0.8 1.0
S
c
o
r
e
PCO
Org T
^Åèìáëáíáçå=oÉëÉ~êÅÜ=mêçÖê~ã=dê~Çì~íÉ=pÅÜççä=çÑ=_ìëáåÉëë=C=mìÄäáÅ=mçäáÅó - 21 - k~î~ä=mçëíÖê~Çì~íÉ=pÅÜççä=
Figure 7. Organization R Score-PCO Relationship
Figure 8 and Figure 9 each delineates the respective relationship between DAWIA and maturity score, for instance, across the two organizations individually (i.e., Organization T and Organization R separately). Overall, this appears to reflect a stronger relationship (e.g., Organization T: R2 = 0.64, p = 0.03; Organization R: R2 = 0.44, p = 0.22) than those depicted above in Figures 6 and 7 for PCO.
Figure 8. Organization T Score-DAWIA Relationship
0.0
50.0
100.0
150.0
200.0
250.0
0.0 0.2 0.4 0.6 0.8 1.0
S
c
o
r
e
PCO
Org R
0.0
50.0
100.0
150.0
200.0
250.0
300.0
2.0 2.2 2.4 2.6 2.8 3.0
S
c
o
r
e
DAWIA
Org T
^Åèìáëáíáçå=oÉëÉ~êÅÜ=mêçÖê~ã=dê~Çì~íÉ=pÅÜççä=çÑ=_ìëáåÉëë=C=mìÄäáÅ=mçäáÅó - 22 - k~î~ä=mçëíÖê~Çì~íÉ=pÅÜççä=
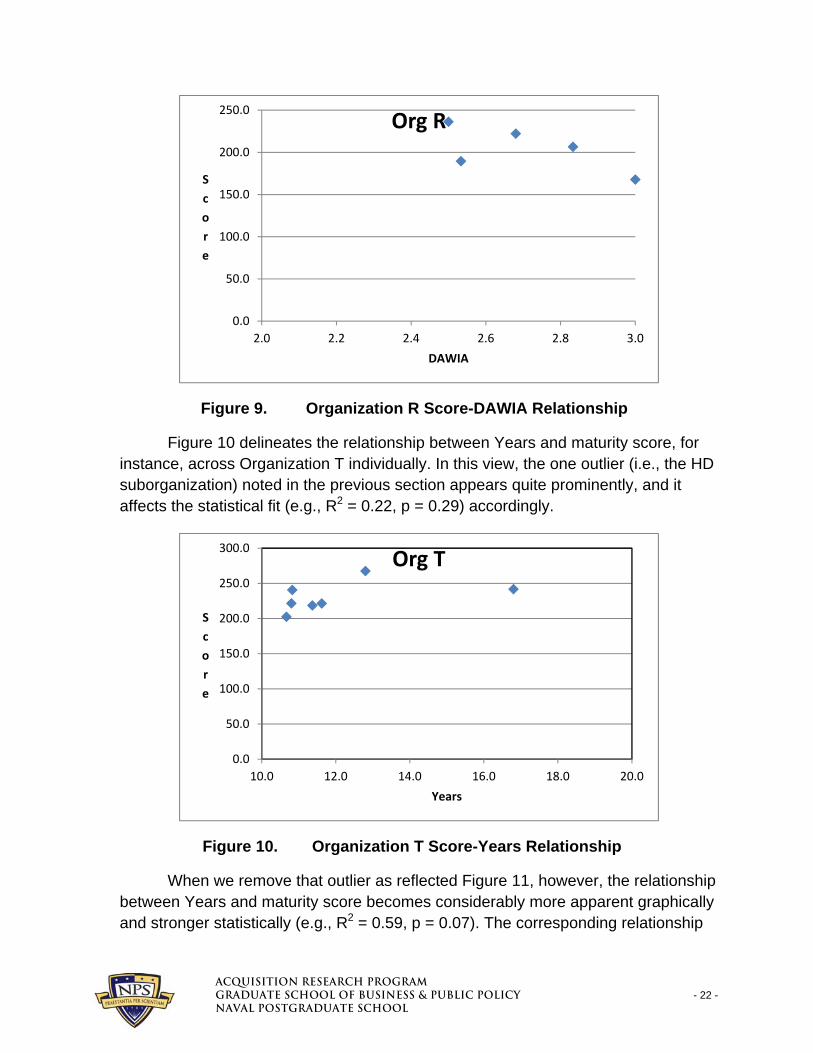
Figure 9. Organization R Score-DAWIA Relationship
Figure 10 delineates the relationship between Years and maturity score, for instance, across Organization T individually. In this view, the one outlier (i.e., the HD suborganization) noted in the previous section appears quite prominently, and it affects the statistical fit (e.g., R2 = 0.22, p = 0.29) accordingly.
Figure 10. Organization T Score-Years Relationship
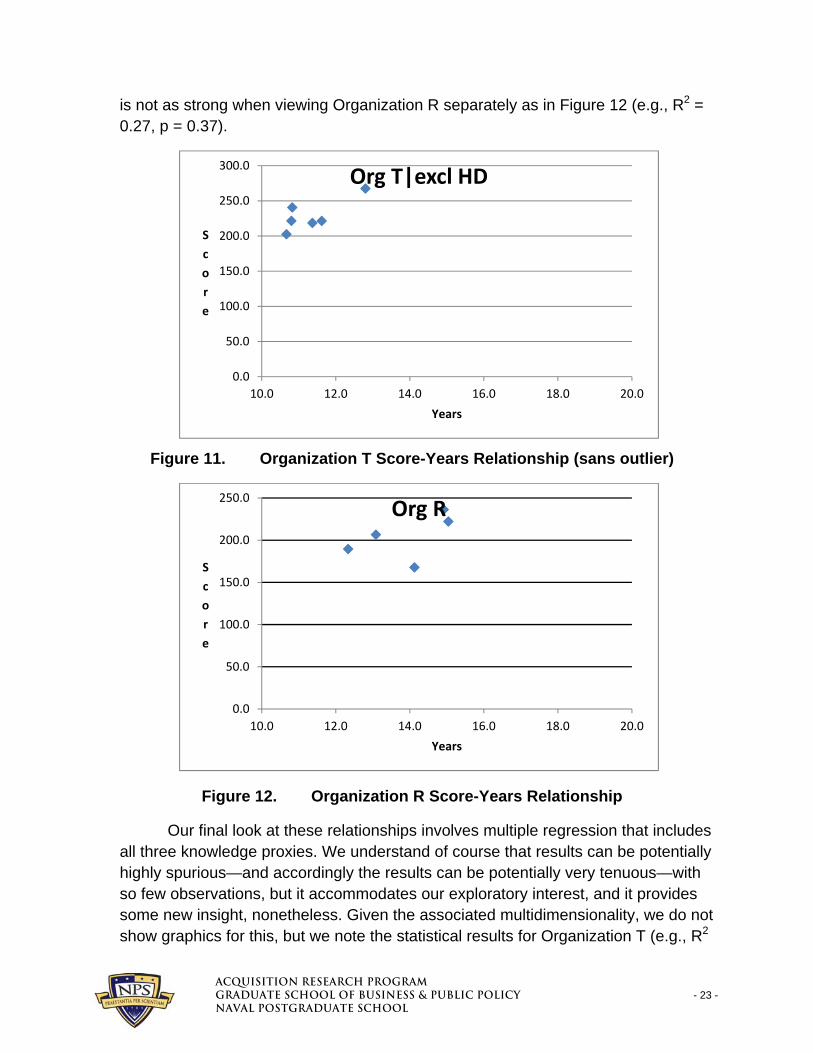
When we remove that outlier as reflected Figure 11, however, the relationship between Years and maturity score becomes considerably more apparent graphically and stronger statistically (e.g., R2 = 0.59, p = 0.07). The corresponding relationship
0.0
50.0
100.0
150.0
200.0
250.0
2.0 2.2 2.4 2.6 2.8 3.0
S
c
o
r
e
DAWIA
Org R
0.0
50.0
100.0
150.0
200.0
250.0
300.0
10.0 12.0 14.0 16.0 18.0 20.0
S
c
o
r
e
Years
Org T
^Åèìáëáíáçå=oÉëÉ~êÅÜ=mêçÖê~ã=dê~Çì~íÉ=pÅÜççä=çÑ=_ìëáåÉëë=C=mìÄäáÅ=mçäáÅó - 23 - k~î~ä=mçëíÖê~Çì~íÉ=pÅÜççä=
is not as strong when viewing Organization R separately as in Figure 12 (e.g., R2 = 0.27, p = 0.37).
Figure 11. Organization T Score-Years Relationship (sans outlier)
Figure 12. Organization R Score-Years Relationship
Our final look at these relationships involves multiple regression that includes all three knowledge proxies. We understand of course that results can be potentially highly spurious—and accordingly the results can be potentially very tenuous—with so few observations, but it accommodates our exploratory interest, and it provides some new insight, nonetheless. Given the associated multidimensionality, we do not show graphics for this, but we note the statistical results for Organization T (e.g., R2
0.0
50.0
100.0
150.0
200.0
250.0
300.0
10.0 12.0 14.0 16.0 18.0 20.0
S
c
o
r
e
Years
Org T|excl HD
0.0
50.0
100.0
150.0
200.0
250.0
10.0 12.0 14.0 16.0 18.0 20.0
S
c
o
r
e
Years
Org R
^Åèìáëáíáçå=oÉëÉ~êÅÜ=mêçÖê~ã=dê~Çì~íÉ=pÅÜççä=çÑ=_ìëáåÉëë=C=mìÄäáÅ=mçäáÅó - 24 - k~î~ä=mçëíÖê~Çì~íÉ=pÅÜççä=
= 0.71, p = 0.24) and Organization R (e.g., R2 = 0.72, p = 0.64) individually. Noting the small number of observations again, these statistics suggest that knowledge as measured via our static proxies corresponds with performance in terms of process maturity. This represents a noteworthy discovery, and it begins to provide some empirical evidence to support our theoretical connection between knowledge flows and process maturity. We address several avenues for future research to build upon these exciting and new but exploratory and tenuous results.
Conclusion The efficacy of defense acquisition is highly dependent upon acquisition
workforce quality, but assessing such quality remains a major challenge, particularly given the knowledge-intensive and dynamic nature of acquisition organizations and processes. Hence, it is difficult to gauge—much less predict—the impact of leadership interventions in terms of policy, process, regulation, organization, education, training, or like approaches.
Building upon the development and application of Knowledge Flow Theory over the past couple of decades, we have developed a state-of-the-art approach that enables us to analyze, visualize, and measure dynamic knowledge and performance. The main idea is to apply this approach inwardly to interrelate the knowledge and performance of acquisition processes (e.g., within contracting and project management organizations).
In this exploratory study, we examine acquisition from the perspective of the procurement process, focusing in particular on organization knowledge and performance with respect to the processes used for the procurement of major systems and services. Building upon considerable field research involving two large, operational Defense organizations, we collect data to summarize the absolute and relative knowledge levels across multiple organization units within both focal organizations. Specifically, we identify three knowledge proxies with good theoretical potential to correspond well with performance: PCO density, DAWIA level, and experience. We also collect data to summarize these organizations and units’ corresponding process maturity levels as a performance measure, and we work to interrelate knowledge and performance accordingly.
Examination of the organizations’ data reveals considerable variation, both within and across them, in terms of all three knowledge proxies, and we find ample variation in terms of process maturity also. Because our unit of analysis is the organization unit, we do not have a large number of observations to support sophisticated statistical analysis. We do, nonetheless, provide both graphical and statistical summaries of the interrelationships between knowledge and performance, summaries which suggest a noteworthy empirical correspondence as predicted
^Åèìáëáíáçå=oÉëÉ~êÅÜ=mêçÖê~ã=dê~Çì~íÉ=pÅÜççä=çÑ=_ìëáåÉëë=C=mìÄäáÅ=mçäáÅó - 25 - k~î~ä=mçëíÖê~Çì~íÉ=pÅÜççä=
theoretically. Further, by interrelating knowledge to performance in terms of process maturity, this report presents the premier cause–effect relationship of its kind in the acquisition domain.
This technical report provides only an exploratory beginning to such promising research, however; hence it illuminates a number of opportunities for productive follow-on work to build upon our results. For one, as noted previously, our study involves only a relatively small number of observations, due principally to its exploratory nature and our focus on the organization unit for analysis. Promising follow-on research could leverage the method developed here to expand the study across many other organizations and units. This would likely enhance the statistical power of the analysis, and it may begin to tease out subtleties and nuances between knowledge and performance.
For another, our three knowledge proxies are arguably crude, collinear, and static in nature. Future research to increase the number and sophistication of such proxies could lead to sharper, more discriminatory measures. This could enhance our understanding considerably, as such measures could help to identify important interrelationships between different kinds and levels of knowledge in the organization and levels of performance enabled by them. Moreover, our more general interest in using dynamic knowledge measures to assess dynamic organization performance could build well upon such sharper static measures.
For a third, the measurement of contract management process maturity remains in its metaphorical infancy. Considerable follow-on research to validate the survey instruments, calibrate the conversion tables, and understand how maturity interrelates with—and conceivably influences—other performance dimensions appears to be open-ended and highly promising at present.
Finally, a desirable end result includes offering policy, leadership, and management guidance for the acquisition community. Given the importance of knowledge in terms of workforce quality, and given the dynamic nature of both the acquisition domain and its workforce, managers, leaders, and policy-makers need better guidance to develop organization innovations that offer good potential for positive impact. We continue making good metaphorical strides toward this result, which continued funding and research will facilitate and drive.

^Åèìáëáíáçå=oÉëÉ~êÅÜ=mêçÖê~ã=dê~Çì~íÉ=pÅÜççä=çÑ=_ìëáåÉëë=C=mìÄäáÅ=mçäáÅó - 26 - k~î~ä=mçëíÖê~Çì~íÉ=pÅÜççä=
THIS PAGE INTENTIONALLY LEFT BLANK
^Åèìáëáíáçå=oÉëÉ~êÅÜ=mêçÖê~ã=dê~Çì~íÉ=pÅÜççä=çÑ=_ìëáåÉëë=C=mìÄäáÅ=mçäáÅó - 27 - k~î~ä=mçëíÖê~Çì~íÉ=pÅÜççä=
References
Ahern, D. M., Clouse, A., & Turner, R. (2001). CMMI, distilled. Boston, MA: Addison-Wesley.
Assistant Secretary of the Navy for Research, Development, and Acquisition (ASN[RDA]). (2011a). Analysis of USD(AT&L) Better-Buying Power (BPP) initiatives. Washington, DC: Author.
Assistant Secretary of the Navy for Research, Development, and Acquisition (ASN[RDA]). (2011b). How to measure the quality of the acquisition workforce. Washington, DC: Author.
Barnes, J. D., & Williams, H. J. (2012). An analysis of the effect of knowledge management on the execution of simplified acquisition procedures (Master’s thesis). Monterey, CA: Naval Postgraduate School.
Benbasat, I., Goldstein, D. K., & Mead, M. (1987). The case research strategy in studies of information systems. MIS Quarterly, 11(3), 368–386.
Curtis, B., Hefley, W. E., & Miller, S. A. (2001). People capability maturity model. Boston, MA: Addison-Wesley.
Dierickx, I., & Cool, K. (1989). Asset stock accumulation and sustainability of competitive advantage. Management Science, 35(12), 1504–1511.
Dillard, J. T. (2003). Centralized control of defense acquisition programs: A comparative review of the framework from 1987–2003 (NPS-GSBPP-03-003). Monterey, CA: Naval Postgraduate School.
Dillard, J. T., & Nissen, M. E. (2005, May). Determining the best loci of knowledge, responsibilities and decision rights in major acquisition organizations. In Proceedings of the Second Annual Acquisition Research Symposium. Monterey, CA: Naval Postgraduate School.
Dinsmore, P. C. (1998). Winning in business with enterprise project management. New York, NY: AMACOM.
Eisenhardt, K., & Graebner, M. (2007, February). Theory building from cases: Opportunities and challenges. Academy of Management Journal, 50(1), 25–32.
Garrett, G. A., & Rendon, R. G. (2005). Contract management organization assessment tools. McLean, VA: National Contract Management Association.
^Åèìáëáíáçå=oÉëÉ~êÅÜ=mêçÖê~ã=dê~Çì~íÉ=pÅÜççä=çÑ=_ìëáåÉëë=C=mìÄäáÅ=mçäáÅó - 28 - k~î~ä=mçëíÖê~Çì~íÉ=pÅÜççä=
Ibrahim, R., & Nissen, M. E. (2007). Discontinuity in organizations: Developing a knowledge-based organization performance model for discontinuous membership. International Journal of Knowledge Management, 3(1), 18–36.
Keeter, H. C. (2004, July). Precision strike weapon advances create mythology of infallibility. Seapower Magazine. Retrieved from http://www.navyleague.org/sea_power/jul_04_19.php
Kerzner, H. (2001). Strategic planning for project management: Using a project management maturity model. New York, NY: John Wiley & Sons.
Nissen, M. E. (2002). An extended model of knowledge-flow dynamics. Communications of the Association for Information Systems, 8, 251–266.
Nissen, M. E. (2006a). Dynamic knowledge patterns to inform design: A field study of knowledge stocks and flows in an extreme organization. Journal of Management Information Systems, 22(3), 225–263.
Nissen, M. E. (2006b). Harnessing knowledge dynamics: Principled organization knowing & learning. Hershey, PA: IRM Press.
Nissen, M. E. (2012, October). Toward an operational proxy for acquisition workforce quality (NPS-AM-12-206). Monterey, CA: Naval Postgraduate School, Acquisition Research Program.
Nissen, M. E., & Gallup, S. P. (2012). Knowledge to the tactical edge: Enhancing the TCPED process through new metrics to inform ConOps development and IT system acquisition. Independent Research & Development Presentation Series. Monterey, CA: Naval Postgraduate School.
Nonaka, I. (1994). A dynamic theory of organization knowledge creation. Organization Science, 5(1), 14–37.
Office of the Under Secretary of Defense for Acquisition, Technology, and Logistics (USD[AT&L]). (2010, November). Implementation directive for Better Buying Power—Obtaining greater efficiency and productivity in defense spending [Memorandum]. Washington, DC: Author.
Persse, J. R. (2001). Implementing the Capability Maturity Model. Hoboken, NJ: John Wiley and Sons.
Pfeffer, J., & Sutton, R. I. (1999). Knowing “what” to do is not enough: Turning knowledge into action. California Management Review, 42(1), 83–108.
Rendon, R. G. (2003). A systematic approach to assessing organization contract management maturity (Unpublished doctoral dissertation). Argosy University, Orange County, CA.
^Åèìáëáíáçå=oÉëÉ~êÅÜ=mêçÖê~ã=dê~Çì~íÉ=pÅÜççä=çÑ=_ìëáåÉëë=C=mìÄäáÅ=mçäáÅó - 29 - k~î~ä=mçëíÖê~Çì~íÉ=pÅÜççä=
Rendon, R. G. (2008). Procurement process maturity: Key to performance measurement. Journal of Public Procurement, 8(2), 200–214.
Rendon, R. G. (2009). Contract management process maturity: Empirical analysis of organization assessments (NPS-CM-09-124). Monterey, CA: Naval Postgraduate School.
Rendon, R. G. (2010). Assessment of Army Contracting Command’s contract management processes (NPS-CM-10-154). Monterey, CA: Naval Postgraduate School.
Rendon, R. G. (2011). Assessment of Army Contracting Command’s contract management processes (TACOM and RDECOM) (NPS-CM-11-019). Monterey, CA: Naval Postgraduate School.
Rendon, R. G., & Snider, K. F. (Eds.). (2008). Management of Defense Acquisition Projects. American Institute of Aeronautics and Astronautics, Reston, Virginia.Saviotti, P. P. (1998). On the dynamics of appropriability, of tacit and of codified knowledge. Research Policy, 26(7/8), 843–856.
Snider, K. F., & Nissen, M. E. (2003). Beyond the body of knowledge: A knowledge-flow approach to project management theory and practice. Project Management Journal, 34(2), 4–12.
Yin, R. K. (1994). Case study research: Design and methods (2nd ed.). Thousand Oaks, CA: Sage.

^Åèìáëáíáçå=oÉëÉ~êÅÜ=mêçÖê~ã=dê~Çì~íÉ=pÅÜççä=çÑ=_ìëáåÉëë=C=mìÄäáÅ=mçäáÅó - 30 - k~î~ä=mçëíÖê~Çì~íÉ=pÅÜççä=
THIS PAGE INTENTIONALLY LEFT BLANK

^Åèìáëáíáçå=oÉëÉ~êÅÜ=mêçÖê~ã=dê~Çì~íÉ=pÅÜççä=çÑ=_ìëáåÉëë=C=mìÄäáÅ=mçäáÅó=k~î~ä=mçëíÖê~Çì~íÉ=pÅÜççä=RRR=aóÉê=oç~ÇI=fåÖÉêëçää=e~ää=jçåíÉêÉóI=`^=VPVQP=
www.acquisitionresearch.net