Embed Size (px)
Citation preview
Measuring and Detecting Errors in Occupational Coding: anAnalysis of SHARE Data
Michele Belloni1, Agar Brugiavini1, Elena Meschi1, and Kea Tijdens2
This article studies coding errors in occupational data, as the quality of this data is importantbut often neglected. In particular, we recoded open-ended questions on occupation for last andcurrent job in the Dutch sample of the “Survey of Health, Ageing and Retirement in Europe”(SHARE) using a high-quality software program for ex-post coding (CASCOT software).Taking CASCOT coding as our benchmark, our results suggest that the incidence of codingerrors in SHARE is high, even when the comparison is made at the level of one-digitoccupational codes (28% for last job and 30% for current job). This finding highlights thecomplexity of occupational coding and suggests that processing errors due to miscodingshould be taken into account when undertaking statistical analyses or writing econometricmodels. Our analysis suggests strategies to alleviate such coding errors, and we propose a setof equations that can predict error. These equations may complement coding software andimprove the quality of occupational coding.
Key words: ISCO; coding software; coding error; cognitive functioning; education.
1. Introduction
Knowledge concerning the occupations of individuals is important in many fields of the
social sciences. For example, in economics, sociology, and other disciplines, occupation is
q Statistics Sweden
1 Department of Economics, Ca’ Foscari University of Venice. S. Giobbe, Cannaregio, 873 30121 Venice, Italy.Emails: [email protected], [email protected], and [email protected] University of Amsterdam/Amsterdam Institute for Advanced Labour Studies (AIAS), Nieuwe Prinsengracht130, 1018 VZ Amsterdam, Netherlands. Email: [email protected]: This article builds on research carried out for the DASISH project (Data ServiceInfrastructure for Social Sciences and Humanities, funded by EU-FP7, Contract no. 283646) and the SHAREproject (Survey of Health, Ageing and Retirement in Europe). The authors are grateful to researchers atCentERdata in the Netherlands for their efforts in coding Dutch job titles. The authors would like to thank EricBalster, Peter Elias, Eric Harrison, Maurice Martens, Sue Westerman, and all participants of the “CASCOT:Occupational Coding in Multi-national Surveys” Workshop in Venice (10-11 April 2014) for helpful suggestionson earlier draft of this work. The research leading to these results has received support under the EuropeanCommission’s 7th Framework Programme (FP7/2013-2017) under grant agreement n8312691, InGRID –Inclusive Growth Research Infrastructure Diffusion. The last author would like to acknowledge the contributionof WEBDATANET [COST Action IS1004]. This paper uses data from SHARE wave 1 release 2.5.0, as of 23August 2011. The SHARE data collection has been primarily funded by the European Commission through the5th Framework Programme (project QLK6-CT-2001-00360 in the thematic programme Quality of Life), throughthe 6th Framework Programme (projects SHARE-I3, RII-CT-2006-062193, COMPARE, CIT5-CT-2005-028857, and SHARELIFE, CIT4-CT2006-028812) and through the 7th Framework Programme (SHARE-PREP,N8 211909, SHARE-LEAP, N8 227822 and SHARE M4, N8 261982). Michele Belloni is also affiliated withCeRP – Collegio Carlo Alberto. Additional funding from the U.S. National Institute on Aging (U01 AG09740-13S2, P01 AG005842, P01 AG08291, P30 AG12815, R21 AG025169, Y1-AG-4553-01, IAG BSR06-11 andOGHA 04-064) and the German Ministry of Education and Research as well as from various national sources isgratefully acknowledged (see www.share-project.org for a full list of funding institutions).
Journal of Official Statistics, Vol. 32, No. 4, 2016, pp. 917–945, http://dx.doi.org/10.1515/JOS-2016-0049
Brought to you by | Università degli Studi di MilanoAuthenticated
Download Date | 11/24/16 11:34 AM
brought to you by COREView metadata, citation and similar papers at core.ac.uk
provided by Archivio istituzionale della ricerca - Università degli Studi di...
often considered – either in itself or as part of an index – as a proxy for socioeconomic
status. In sociology and labour economics, occupation is a key variable in a wide range of
studies, such as the ‘task approach’ to labour markets and job polarisation (e.g., Autor
2013; Autor et al. 2006; Goos and Manning 2007); the definition of skill mismatch and
overeducation (for an extensive overview of this literature, cf. e.g., Hartog 2000; Leuven
and Oosterbeek 2011); the analysis of the effect of occupation on health status (e.g.,
Fletcher et al. 2011; Ravesteijn et al. 2013); the dynamics of occupational mobility (e.g.,
Moscarini and Thomsson 2007; Perales 2014); and the analysis of socioeconomic status
(e.g., Rose and Harrison 2007).
The quality of occupational data is rarely discussed in this literature, despite the fact that
the measurement of occupation in social surveys is a rather complex issue. Handbooks by
international institutions such as the International Labour Organization (ILO) detail how
to ask about occupation in labour force surveys and censuses (e.g., ILO 2010). However,
empirical research on best practices and miscoding is scarce. The difficulty of providing
researchers with an accurate measure of occupation concerns, first, the choice of questions
to include in the questionnaire, second, the training of interviewers and, third, the
conversion of job titles and descriptions that are often recorded in open text fields into
occupational codes.
The statistical agencies of 150 countries associated with the ILO have adopted the
International Standard Classification of Occupations (ISCO) to normalise the
measurement of occupations. The first classification dates back to 1958, with updates in
1968, 1988, and recently in 2008. The Commission of the European Communities (2009)
has adopted ISCO-08 as its occupational classification standard, and the European
statistical agency Eurostat has made efforts to support European countries to develop
coding indexes for occupation data collected through their own labour force and similar
surveys. In 2012, almost half of the 150 countries associated with the ILO used the ISCO
standard, while the other half either did not classify occupations or maintained their own
classification standard (UN 2014).
The ILO provides a classification standard as well as task descriptions for all four-digit
occupational units in ISCO (ILO 2014). The task descriptions also provide a coding index,
but only in English. Therefore, the coding of occupations becomes particularly challen-
ging in international surveys – such as the “Survey of Health, Ageing and Retirement in
Europe” (SHARE) and the “European Social Survey” (ESS), where the occupational
codes should be fully comparable across countries – because it is sometimes problematic
for countries to map their specific occupations and job titles onto the international ISCO
categories.
Researchers are often not aware of the complex preparatory work behind occupational
coding, and often consider the published variable of ‘occupation’ as free of error. This is
not the case if processing errors arise during the coding of the variable. Processing errors
are one source of nonsampling errors that contribute to total survey errors (see Biemer and
Lyberg 2003). Processing errors arise during the data-processing stage and comprise
editing errors, coding errors, data-entry errors, and programming errors. For example, in
coding answers to open-ended questions related to economic characteristics – such as
occupation – coders may deviate from the procedures laid out in coding manuals and
therefore assign wrong codes to these characteristics.
Journal of Official Statistics918
Brought to you by | Università degli Studi di MilanoAuthenticated
Download Date | 11/24/16 11:34 AM
Elias (1997) highlighted possible sources of error in occupational data, surveying the
few existing studies that evaluated the quality of occupational data through recoding. He
found that agreement rates (i.e., the percentage of verbatim responses coded equally after
recoding) increased with higher levels of aggregation, thus at one or two digits. At three
digits, agreement rates in excess of 75% were hard to obtain. Ellison (2014) pointed out
that agreement rates tend to be higher for mother’s, father’s and last jobs than for an
individual’s current job. The intuitive explanation for these results is that individuals tend
to give too many details about their current job because they think that their job is complex
and thus do not provide a simple description, while this occurs to a lesser extent for
parents’ and last job.
In this article, we will first demonstrate that occupational coding is in fact susceptible to
processing errors. In addition, we will test whether such processing errors are random or
correlated to some specific individual or job-related characteristics. Finally, we will
present our recommendations for reducing this type of error and will propose a novel
predictive equation for coding error, given some individual and job-related characteristics,
which may be particularly useful if used during interviews.
To attain our aims, we conducted the following empirical analysis. First, we recoded the
verbatim response to the open-ended questions on current and last occupation for the
Dutch sample of SHARE data using a well-known and high-quality software program for
ex-post coding called CASCOT. Second, we compared SHARE data as originally
published with recoded occupational variables. Finally, we analysed which individual and
job-related characteristics (such as age, gender, education, or industry) were associated
with the probability of coding error. The article proceeds as follows: Section 2 discusses
the alternative methods used to collect and code information on individuals’ occupations
and describes the main features of CASCOT. In Section 3, we describe our empirical study
and present the data and the methodology adopted. The results of our analysis are
presented and discussed in Section 4. Finally, Section 5 presents our conclusions and
suggests some directions for further research.
2. Coding Occupations in Survey Data: Alternative Methods
Most occupational information in survey data is obtained from direct questions addressed
to respondents. The question about occupation is usually asked in an open text field (e.g.,:
‘What occupation did you perform in your principal job during the week of : : : to : : : ?’;
for an overview of survey questions see Tijdens 2014b; for question design see Jackle
2008 and DESA 2010). Open-ended questions allow the classification of occupations at a
detailed level of disaggregation, but the text fields require coding afterwards (‘office
coding’). Promising attempts to code job titles during CAPI interviews are currently being
made using a look-up table or coding index. One notable example of these new coding
methods is the semantic text-string matching algorithm (the ‘Jobcoder’) developed by
CentERdata (http://www.centerdata.nl/) and used for the first time in SHARE Wave 6. The
occupational coding process in this wave of SHARE followed a two-step approach. In the
first step, verbatim responses to the open-ended question on occupation were stored for
future possible checks. In the second step, the verbatim responses were forwarded to the
‘Jobcoder’, which searched its job titles database and checked whether there was an entry
Belloni et al.: Occupational Coding: Measure and Detect Errors 919
Brought to you by | Università degli Studi di MilanoAuthenticated
Download Date | 11/24/16 11:34 AM
that corresponded precisely. If such an entry was found, the software coded the text
immediately; otherwise, the interviewer was given the opportunity to ask the interviewee
for a more precise job description.
In the more standard case of ‘office coding’, the classification of occupational
information is achieved after the interview through a coding process that can be done
manually or semi-automatically using a computerised coding system (‘computer-assisted
coding’) or by a combination of both. Manual coding requires a lot of training for coders
and coder supervisors (see Hoffmann et al. 1995; Ganzeboom 2008). Semiautomatic
coding tools are becoming increasingly reliable instruments that use semantic matching
with previously coded occupations. Machine-learning algorithms also appear to be a
promising recent development, requiring a substantial number of manually coded
occupations to be used as training data for the automatic classification (Bethmann et al.
2014; Cheeseman Day 2014).
CASCOT is a software tool for coding text automatically or manually (http://www2.
warwick.ac.uk/fac/soc/ier/software/cascot/). It was developed at the Institute for
Employment Research (IER) in 1993 and since then has been continuously updated and
used by over 100 organisations in the UK and abroad. The software developed at IER is
able to code job titles in the UK into various editions of the Standard Occupational
Classification (SOC) and International Standard Classification of Occupations (ISCO).
CASCOT software is coupled with an editor which allows users to modify internal coding
rules and permits the software to use alternative occupational classification structures.
High-quality coding requires high-quality job descriptions. The recorded text should
ideally contain sufficient information to distinguish it from alternative text descriptions
which may be coded to other categories within the classification, but it should not contain
superfluous words. The recorded text should also be free of typing errors if possible. This
ideal will not always be achieved, but CASCOT has been designed to perform a
complicated analysis of the words in the text, understand common typing errors and
compare these words to those in the classification, ultimately providing a list of
recommended codes. If the input text is not sufficiently distinctive, the topmost
recommendation may not necessarily be the correct code. When CASCOT assigns a code
to a piece of text, it also calculates a score from 1 to 100, which represents the degree of
certainty that the given code is the correct one. When CASCOT encounters a word or
phrase that is descriptive of an occupation but lacks sufficient information to distinguish it
from other categories (i.e., without any further qualifying terms), CASCOT will attempt
to suggest a code but the score will be limited to below 40 to indicate the uncertainty
associated with the suggestion (e.g., cases such as ‘Teacher’ or ‘Engineer’).
The user may run CASCOT in three different modes: fully automatic, semiautomatic, or
manual/one-by-one. The fully automatic mode does not require any human intervention:
once a list of job descriptions is provided in the software, a series of corresponding codes
plus the associated scores is produced. If the software considers the quality of a given job
description too low to be able to attribute any reasonable code, it reports ‘no conclusion’
for that specific text. The semiautomatic mode works by setting a minimum score: in all
cases in which CASCOT attributes a score greater than the minimum value, it codes the
text automatically; otherwise it asks for human intervention. In these cases, the operator is
asked to choose manually from a list of recommendations. The operator’s decision may be
Journal of Official Statistics920
Brought to you by | Università degli Studi di MilanoAuthenticated
Download Date | 11/24/16 11:34 AM
supported by ancillary variables if they are available in the data: a pop-up window opens in
CASCOT and shows, for example, the industry in which the individual is/was working. In
manual mode, CASCOT provides a list of recommended codes with corresponding scores
for each job description, and leaves the final choice of the best code to the operator.
CASCOT output was compared to a selection of high-quality manually coded data, with
the overall results showing that 80% of the records receive a score greater than 40 and,
of these, 80% are matched to manually coded data. When using CASCOT, one can expect
this level of performance with similar data, but the performance depends on the quality of
the data input (for more information about the software, see Elias et al. 1993; Jones and
Elias 2004).
Statistics Netherlands (CBS) has developed a Dutch version of CASCOT, building on
the English version. Since 2012, this software (henceforth CASCOT-NL) has been used in
the Netherlands to code job titles in the most relevant social surveys, including the Dutch
Labour Force Survey. CASCOT-NL is suitable for implementation in CAPI, CATI, and
CAWI modes.
In this study, we use a version of CASCOT-NL that was used by CBS to classify job
descriptions given in the Dutch Labour Force Survey into four-digit ISCO-08 codes. A
noticeable difference between CASCOT-UK and CASCOT-NL (the ‘classification file
ISCO v1.1’) is that the latter includes a special category for vague responses called ‘99’.
Very often, a certainty score equal to 99 is given to these cases originally coded ‘99’. This
is because – once tagged in this way – these especially problematic answers go through
subsequent coding steps. These steps exploit information from additional variables such as
sector of work, the individual’s educational attainment and tasks and duties involved in the
job. Finally, the most difficult cases are manually coded by a team of experts (see CBS
2012 and Westerman 2014 for further details on CBS coding procedures).
3. Data and Empirical Strategy
Our analysis is based on SHARE data. SHARE is a cross-national longitudinal survey on
health, socioeconomic status and social and family networks representative of the
population aged 50 and over. Four waves of SHARE are currently available. We focus on
the first wave of data (collected in 2004–2005) because this is the only one in which
information on occupation was gathered using an open-ended question (in the subsequent
waves 2 to 5, the occupation question uses a tick list of ten occupational titles). In
particular, in SHARE Wave 1, respondents were asked the following question: “What
[is/was] your [main/last] job called? Please give the exact name or title.” This question
was directed at both employed/self-employed and retired/unemployed individuals (the
latter conditional on having worked earlier in life). Note that SHARE also collects
information on respondents’ second job, parents’ job and former partner’s job. Parents’
jobs are intrinsically more difficult to code than respondents’ jobs because the former may
have been excluded from recent job classifications. There are very few observations for
respondents’ second job and former partner’s job. Thus we excluded these additional
variables from our analysis.
SHARE country teams manually coded the text strings on respondents’ job titles using
ISCO-88 (COM) codes – the International Standard Classification of Occupations used at
Belloni et al.: Occupational Coding: Measure and Detect Errors 921
Brought to you by | Università degli Studi di MilanoAuthenticated
Download Date | 11/24/16 11:34 AM
that time. Each country team hired and trained coders independently. Coders were asked
to follow a protocol providing them with guidelines on how to code ‘critical’ jobs (e.g.,
managers in agriculture or teachers). These guidelines were partly common to all countries
and partly language specific. SHARE coders also made use of ancillary information on
training and qualifications needed for the job and on the industry the respondent was
working in based on the question: “What kind of business, industry or services do you
work in (that is, what do they make or do at the place where you work)?” SHARE coders
were asked to code job descriptions at the maximum possible level of detail, that is, at
four-digit (or Unit group) ISCO-88 level. It was also suggested that they code vague
responses by means of trailing zeros: this means that if they were unsure whether a given
job description could be attributable to a given Unit group, they should attribute it to either
a Minor (i.e., three digits), Sub-major (two digits) or Major (one digit) group. The ISCO-
88 codes generated for two variables – one for current main job (ep016_) and one for last
job (ep052_) – were then published (for further details, see MEA 2013, 29). The first wave
of SHARE covered eleven European countries and Israel. Our recoding exercise only uses
the Dutch sample of this wave because CASCOT is currently available in two languages –
English and Dutch – and the English language is not present in SHARE data.
We recoded job descriptions using CASCOT-NL in its semiautomatic mode by setting
a minimum score of 70 and with the assistance of an expert coder who was a Dutch native
speaker and who has been involved in occupational coding and occupational databases for
many years. As mentioned above, in all cases in which CASCOT-NL attributed a score
greater than 70, it coded the text automatically. The expert coder manually coded all the
residual cases. Consistent with what is done in SHARE, the operator coded vague
responses by means of trailing zeros. The manual recoding was done twice: with and
without ancillary information. The use of ancillary variables increased the comparability
between the SHARE and CASCOT-NL coding. Moreover, the operator made use of
the same ancillary variables (on training and qualifications needed for the job and on the
industry the respondent was working in) used by SHARE coders. In order to avoid the
‘anchoring effect’ – that is, the tendency of human coders to select the code already in
front of them (see Cheeseman Day 2014) – the expert coder used a recent CBS coding
index (see http://www.cbs.nl/nl-NL/menu/methoden/classificaties/overzicht/sbc/default.
htm) including 4,705 job titles rather than the list of codes recommended by the CASCOT-
NL classification file ISCO v1.1. We believe that the combination of a high-quality
software program (which automatically coded a high proportion of cases at the four-digit
level, see below), an expert coder, the use of ancillary information, and the use of an
extensive external job titles list ensured a high level of coding and provided better coding
than manual SHARE coding. In the following, we will therefore consider the CASCOT-
NL coding (the version exploiting ancillary variables) as our benchmark.
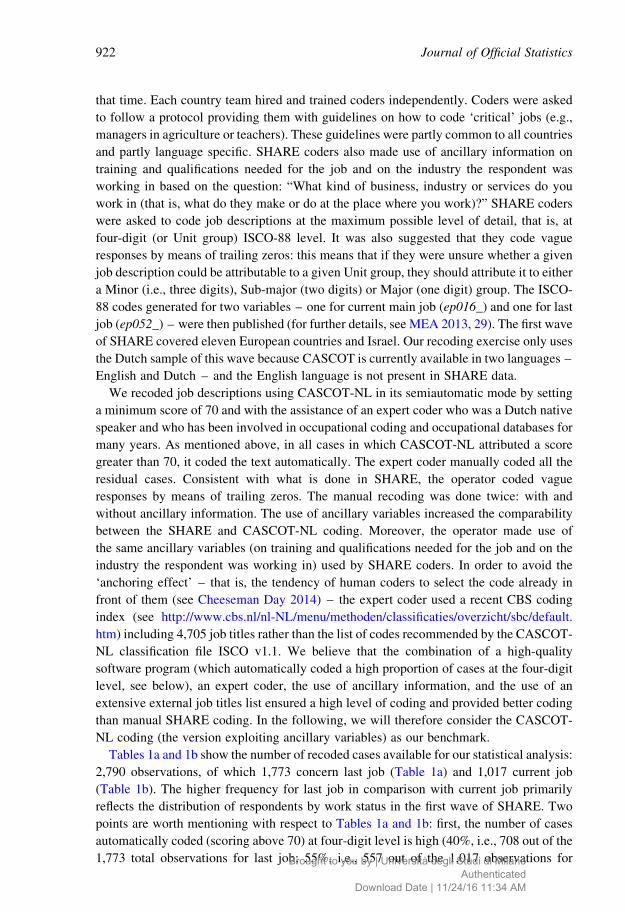
Tables 1a and 1b show the number of recoded cases available for our statistical analysis:
2,790 observations, of which 1,773 concern last job (Table 1a) and 1,017 current job
(Table 1b). The higher frequency for last job in comparison with current job primarily
reflects the distribution of respondents by work status in the first wave of SHARE. Two
points are worth mentioning with respect to Tables 1a and 1b: first, the number of cases
automatically coded (scoring above 70) at four-digit level is high (40%, i.e., 708 out of the
1,773 total observations for last job; 55%, i.e., 557 out of the 1,017 observations for
Journal of Official Statistics922
Brought to you by | Università degli Studi di MilanoAuthenticated
Download Date | 11/24/16 11:34 AM
current job); second, making use of ancillary information dramatically increases the
number of digits at which the observations are coded. For example, for last job, the
percentage of cases coded at four-digit level among those which scored below 70
increased from 50 to 80% when using ancillary variables.
The main issue arising when comparing codes from SHARE and CASCOT-NL is the
lack of homogeneity in the classification structure. SHARE Netherlands coded job
descriptions at three-digit ISCO-88 level (note that all other countries coded jobs at ISCO-
88 four-digit level, see above), while CASCOT-NL, as described above, coded to ISCO-08
four-digit level. We therefore homogenised the two sets of codes as follows. First, we
converted CASCOT-NL codes from ISCO-08 into ISCO-88 using an official corres-
pondence table (ILO 2014). Unfortunately, according to this table, there is a ‘many-to-
one’ correspondence between ISCO-88 and ISCO-08, that is, multiple ISCO-88 codes are
associated with the same four-digit ISCO-08 code. In our data, this occurs for about
20% of the sample. In these cases, we associated multiple ISCO-88 codes with the same
job description. Considering the issue of nonunivocal correspondence between different
versions of ISCO, we decided that a job description would have a different code if the
ISCO-88 code attributed by SHARE coders is not equal to any of the ISCO-88 codes
resulting from the conversion of the CASCOT-NL output into ISCO-88. Otherwise, the
Table 1a. Output of CASCOT-NL recoding at different number of digits by score level and use of ancillary
variables – Last job: frequencies, and row percentages (in italics).
4 digit 3 digit 2 digit 1 digit Total
Score above 70* 708 108 142 71 102969 10 14 7 100
Score below 70** No ancillary 336 146 115 73 67050 22 17 11 100
With ancillary 596 98 23 27 74480 13 3 4 100
Total 1,773
*automatically coded; **manually coded.
Table 1b. Output of CASCOT-NL recoding at different number of digits by score level and use of ancillary
variables – Current job: frequencies, and row percentages (in italics).
4 digit 3 digit 2 digit 1 digit Total
Score above 70* 557 87 0 7 65186 13 0 1 100
Score below 70** No ancillary 188 104 37 37 36651 28 10 10 100
With ancillary 241 53 42 30 36666 14 11 8 100
Total 1,017
*automatically coded; **manually coded.
Belloni et al.: Occupational Coding: Measure and Detect Errors 923
Brought to you by | Università degli Studi di MilanoAuthenticated
Download Date | 11/24/16 11:34 AM
job description has the same code. Second, we only considered three digits. In summary,
we compared codes from SHARE and CASCOT-NL in terms of three-digit ISCO-88
codes.
4. Results
4.1. Descriptive Statistics
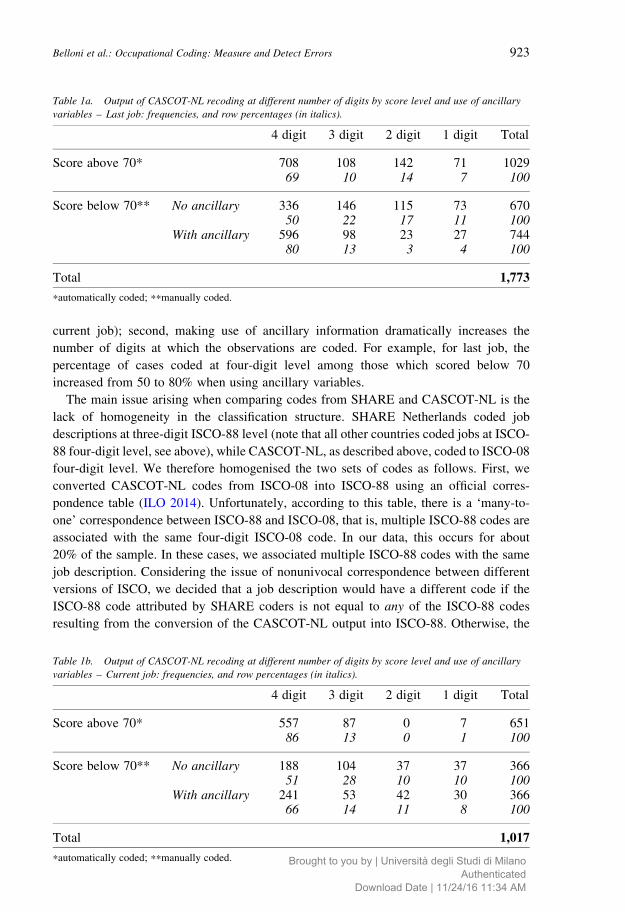
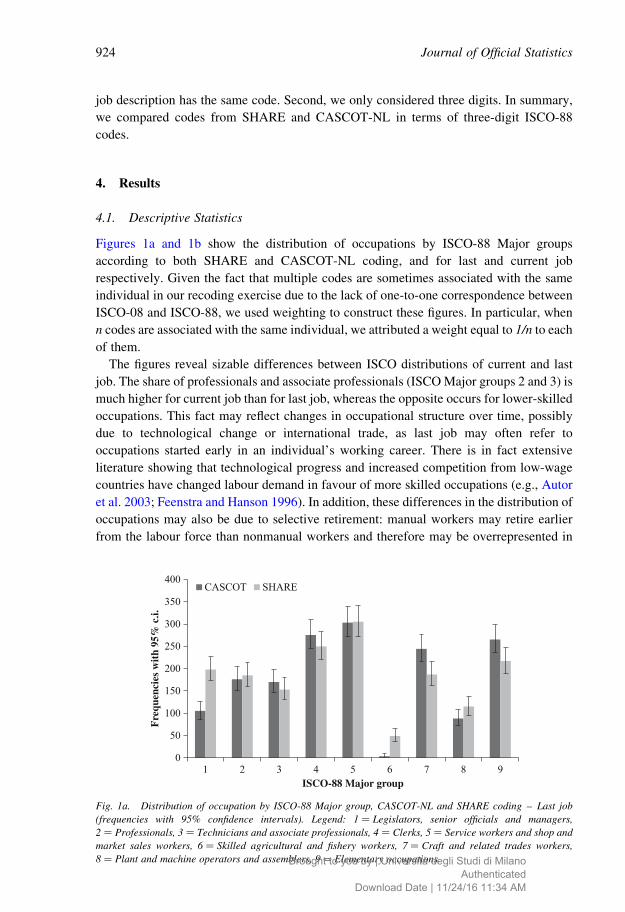
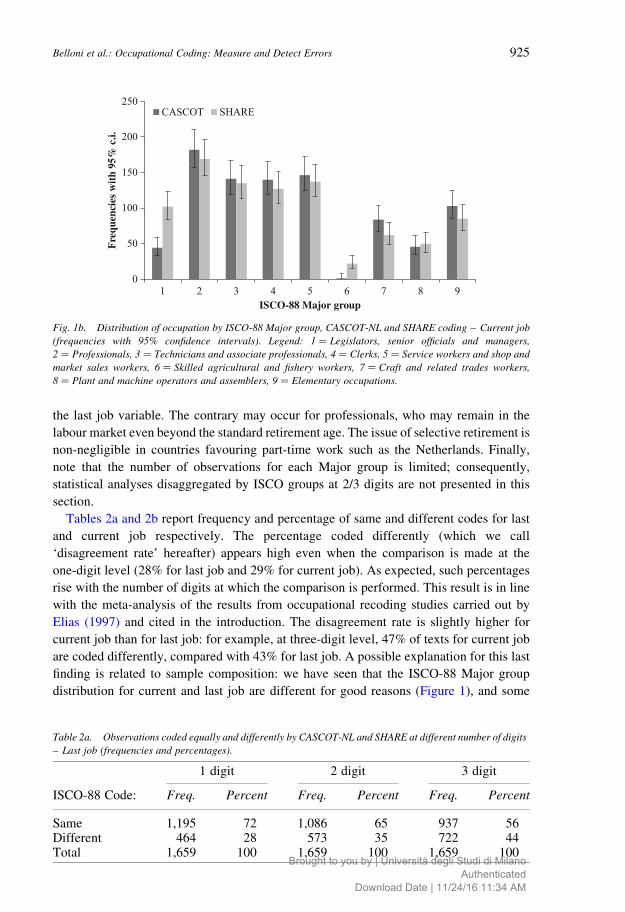
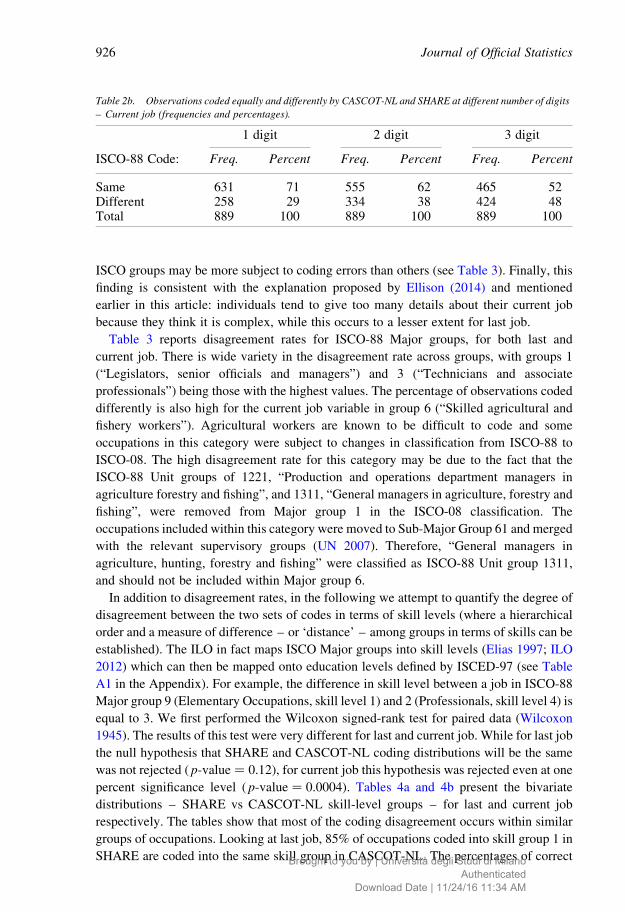
Figures 1a and 1b show the distribution of occupations by ISCO-88 Major groups
according to both SHARE and CASCOT-NL coding, and for last and current job
respectively. Given the fact that multiple codes are sometimes associated with the same
individual in our recoding exercise due to the lack of one-to-one correspondence between
ISCO-08 and ISCO-88, we used weighting to construct these figures. In particular, when
n codes are associated with the same individual, we attributed a weight equal to 1/n to each
of them.
The figures reveal sizable differences between ISCO distributions of current and last
job. The share of professionals and associate professionals (ISCO Major groups 2 and 3) is
much higher for current job than for last job, whereas the opposite occurs for lower-skilled
occupations. This fact may reflect changes in occupational structure over time, possibly
due to technological change or international trade, as last job may often refer to
occupations started early in an individual’s working career. There is in fact extensive
literature showing that technological progress and increased competition from low-wage
countries have changed labour demand in favour of more skilled occupations (e.g., Autor
et al. 2003; Feenstra and Hanson 1996). In addition, these differences in the distribution of
occupations may also be due to selective retirement: manual workers may retire earlier
from the labour force than nonmanual workers and therefore may be overrepresented in
0
50
100
150
200
250
300
350
400
1 2 3 4 5 6 7 8 9
Fre
quen
cies
wit
h 95
% c
.i.
ISCO-88 Major group
CASCOT SHARE
Fig. 1a. Distribution of occupation by ISCO-88 Major group, CASCOT-NL and SHARE coding – Last job
(frequencies with 95% confidence intervals). Legend: 1 ¼ Legislators, senior officials and managers,
2 ¼ Professionals, 3 ¼ Technicians and associate professionals, 4 ¼ Clerks, 5 ¼ Service workers and shop and
market sales workers, 6 ¼ Skilled agricultural and fishery workers, 7 ¼ Craft and related trades workers,
8 ¼ Plant and machine operators and assemblers, 9 ¼ Elementary occupations.
Journal of Official Statistics924
Brought to you by | Università degli Studi di MilanoAuthenticated
Download Date | 11/24/16 11:34 AM
the last job variable. The contrary may occur for professionals, who may remain in the
labour market even beyond the standard retirement age. The issue of selective retirement is
non-negligible in countries favouring part-time work such as the Netherlands. Finally,
note that the number of observations for each Major group is limited; consequently,
statistical analyses disaggregated by ISCO groups at 2/3 digits are not presented in this
section.
Tables 2a and 2b report frequency and percentage of same and different codes for last
and current job respectively. The percentage coded differently (which we call
‘disagreement rate’ hereafter) appears high even when the comparison is made at the
one-digit level (28% for last job and 29% for current job). As expected, such percentages
rise with the number of digits at which the comparison is performed. This result is in line
with the meta-analysis of the results from occupational recoding studies carried out by
Elias (1997) and cited in the introduction. The disagreement rate is slightly higher for
current job than for last job: for example, at three-digit level, 47% of texts for current job
are coded differently, compared with 43% for last job. A possible explanation for this last
finding is related to sample composition: we have seen that the ISCO-88 Major group
distribution for current and last job are different for good reasons (Figure 1), and some
CASCOT SHARE
0
50
100
150
200
250
1 2 3 4 5 6 7 8 9
Fre
quen
cies
wit
h 95
% c
.i.
ISCO-88 Major group
Fig. 1b. Distribution of occupation by ISCO-88 Major group, CASCOT-NL and SHARE coding – Current job
(frequencies with 95% confidence intervals). Legend: 1 ¼ Legislators, senior officials and managers,
2 ¼ Professionals, 3 ¼ Technicians and associate professionals, 4 ¼ Clerks, 5 ¼ Service workers and shop and
market sales workers, 6 ¼ Skilled agricultural and fishery workers, 7 ¼ Craft and related trades workers,
8 ¼ Plant and machine operators and assemblers, 9 ¼ Elementary occupations.
Table 2a. Observations coded equally and differently by CASCOT-NL and SHARE at different number of digits
– Last job (frequencies and percentages).
1 digit 2 digit 3 digit
ISCO-88 Code: Freq. Percent Freq. Percent Freq. Percent
Same 1,195 72 1,086 65 937 56Different 464 28 573 35 722 44Total 1,659 100 1,659 100 1,659 100
Belloni et al.: Occupational Coding: Measure and Detect Errors 925
Brought to you by | Università degli Studi di MilanoAuthenticated
Download Date | 11/24/16 11:34 AM
ISCO groups may be more subject to coding errors than others (see Table 3). Finally, this
finding is consistent with the explanation proposed by Ellison (2014) and mentioned
earlier in this article: individuals tend to give too many details about their current job
because they think it is complex, while this occurs to a lesser extent for last job.
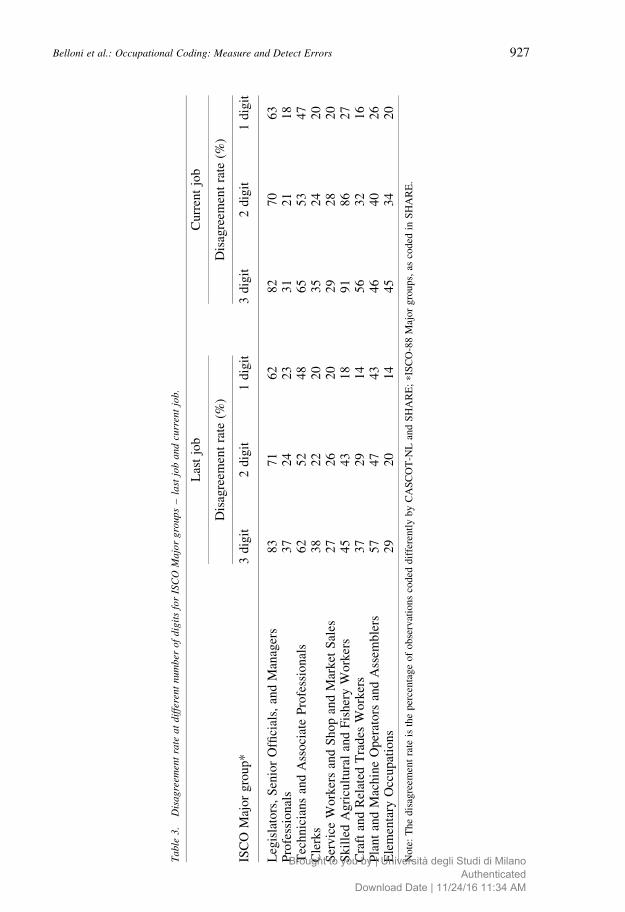
Table 3 reports disagreement rates for ISCO-88 Major groups, for both last and
current job. There is wide variety in the disagreement rate across groups, with groups 1
(“Legislators, senior officials and managers”) and 3 (“Technicians and associate
professionals”) being those with the highest values. The percentage of observations coded
differently is also high for the current job variable in group 6 (“Skilled agricultural and
fishery workers”). Agricultural workers are known to be difficult to code and some
occupations in this category were subject to changes in classification from ISCO-88 to
ISCO-08. The high disagreement rate for this category may be due to the fact that the
ISCO-88 Unit groups of 1221, “Production and operations department managers in
agriculture forestry and fishing”, and 1311, “General managers in agriculture, forestry and
fishing”, were removed from Major group 1 in the ISCO-08 classification. The
occupations included within this category were moved to Sub-Major Group 61 and merged
with the relevant supervisory groups (UN 2007). Therefore, “General managers in
agriculture, hunting, forestry and fishing” were classified as ISCO-88 Unit group 1311,
and should not be included within Major group 6.
In addition to disagreement rates, in the following we attempt to quantify the degree of
disagreement between the two sets of codes in terms of skill levels (where a hierarchical
order and a measure of difference – or ‘distance’ – among groups in terms of skills can be
established). The ILO in fact maps ISCO Major groups into skill levels (Elias 1997; ILO
2012) which can then be mapped onto education levels defined by ISCED-97 (see Table
A1 in the Appendix). For example, the difference in skill level between a job in ISCO-88
Major group 9 (Elementary Occupations, skill level 1) and 2 (Professionals, skill level 4) is
equal to 3. We first performed the Wilcoxon signed-rank test for paired data (Wilcoxon
1945). The results of this test were very different for last and current job. While for last job
the null hypothesis that SHARE and CASCOT-NL coding distributions will be the same
was not rejected ( p-value ¼ 0.12), for current job this hypothesis was rejected even at one
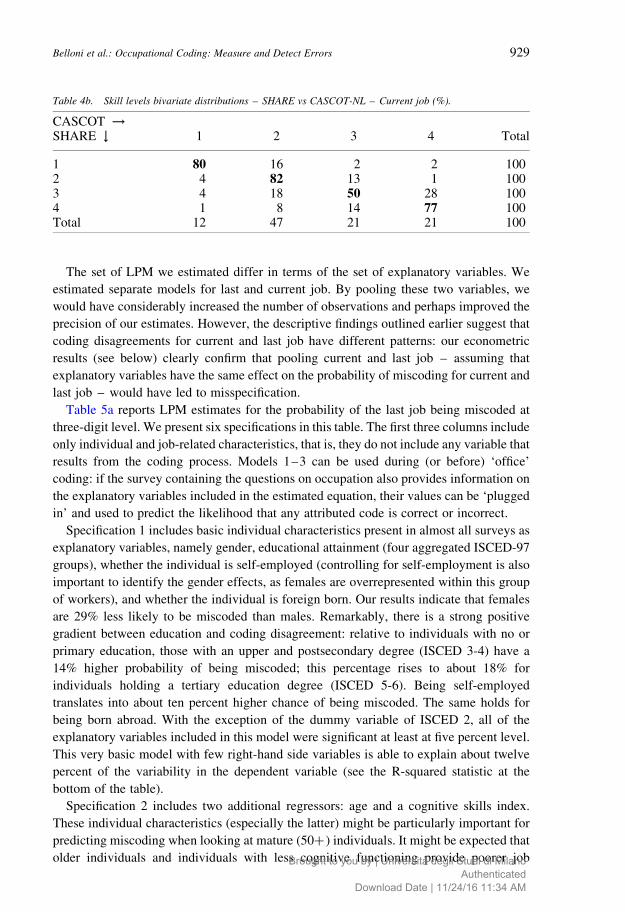
percent significance level ( p-value ¼ 0.0004). Tables 4a and 4b present the bivariate
distributions – SHARE vs CASCOT-NL skill-level groups – for last and current job
respectively. The tables show that most of the coding disagreement occurs within similar
groups of occupations. Looking at last job, 85% of occupations coded into skill group 1 in
SHARE are coded into the same skill group in CASCOT-NL. The percentages of correct
Table 2b. Observations coded equally and differently by CASCOT-NL and SHARE at different number of digits
– Current job (frequencies and percentages).
1 digit 2 digit 3 digit
ISCO-88 Code: Freq. Percent Freq. Percent Freq. Percent
Same 631 71 555 62 465 52Different 258 29 334 38 424 48Total 889 100 889 100 889 100
Journal of Official Statistics926
Brought to you by | Università degli Studi di MilanoAuthenticated
Download Date | 11/24/16 11:34 AM
Ta
ble
3.
Dis
ag
reem
ent
rate
at
dif
fere
nt
nu
mb
ero
fd
igit
sfo
rIS
CO
Ma
jor
gro
up
s–
last
job
an
dcu
rren
tjo
b.
Las
tjo
bC
urr
ent
job
Dis
agre
emen
tra
te(%
)D
isag
reem
ent
rate
(%)
ISC
OM
ajo
rg
rou
p*
3d
igit
2d
igit
1d
igit
3d
igit
2d
igit
1d
igit
Leg
isla
tors
,S
enio
rO
ffici
als,
and
Man
ager
s8
37
16
28
27
06
3P
rofe
ssio
nal
s3
72
42
33
12
11
8T
ech
nic
ian
san
dA
sso
ciat
eP
rofe
ssio
nal
s6
25
24
86
55
34
7C
lerk
s3
82
22
03
52
42
0S
erv
ice
Wo
rker
san
dS
ho
pan
dM
ark
etS
ales
27
26
20
29
28
20
Sk
ille
dA
gri
cult
ura
lan
dF
ish
ery
Wo
rker
s4
54
31
89
18
62
7C
raft
and
Rel
ated
Tra
des
Wo
rker
s3
72
91
45
63
21
6P
lan
tan
dM
ach
ine
Op
erat
ors
and
Ass
emb
lers
57
47
43
46
40
26
Ele
men
tary
Occ
up
atio
ns
29
20
14
45
34
20
Note
:T
he
dis
agre
emen
tra
teis
the
per
centa
ge
of
obse
rvat
ions
coded
dif
fere
ntl
yby
CA
SC
OT
-NL
and
SH
AR
E;
*IS
CO
-88
Maj
or
gro
up
s,as
cod
edin
SH
AR
E.
Belloni et al.: Occupational Coding: Measure and Detect Errors 927
Brought to you by | Università degli Studi di MilanoAuthenticated
Download Date | 11/24/16 11:34 AM
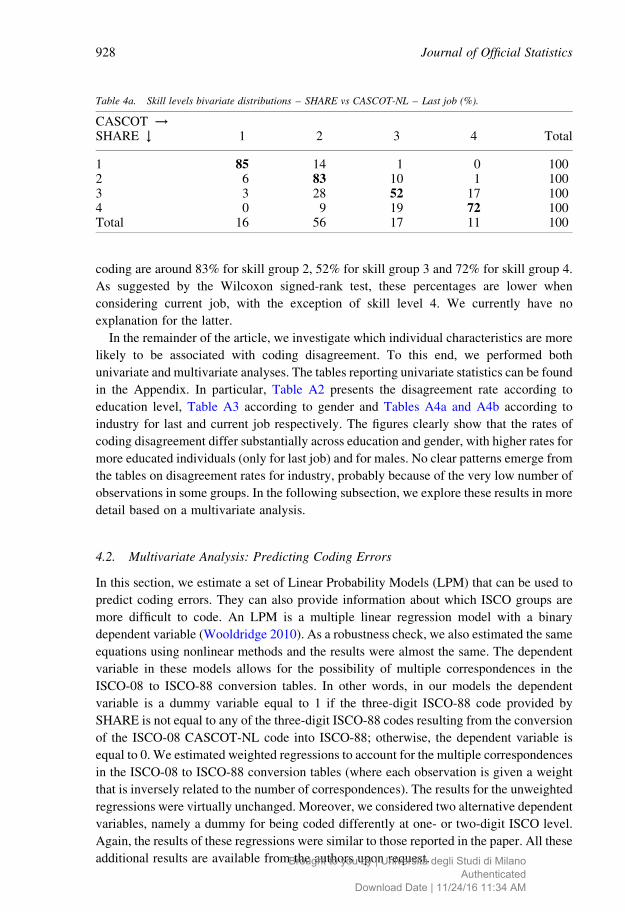
coding are around 83% for skill group 2, 52% for skill group 3 and 72% for skill group 4.
As suggested by the Wilcoxon signed-rank test, these percentages are lower when
considering current job, with the exception of skill level 4. We currently have no
explanation for the latter.
In the remainder of the article, we investigate which individual characteristics are more
likely to be associated with coding disagreement. To this end, we performed both
univariate and multivariate analyses. The tables reporting univariate statistics can be found
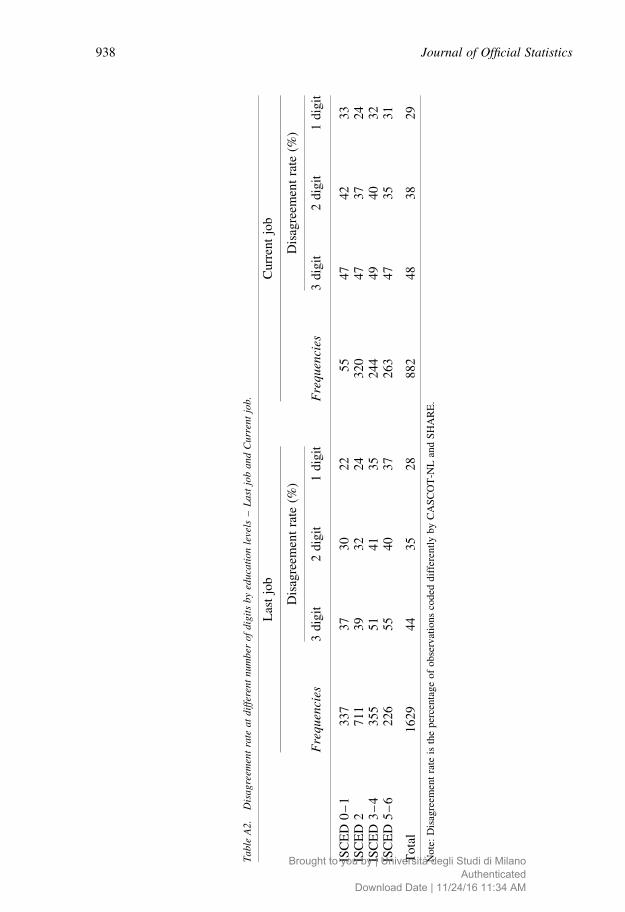
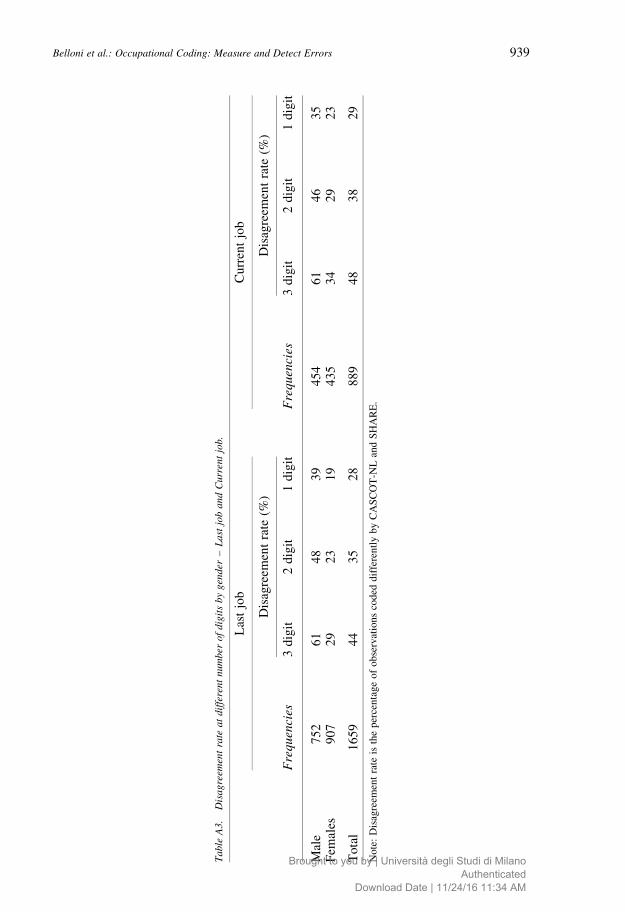
in the Appendix. In particular, Table A2 presents the disagreement rate according to
education level, Table A3 according to gender and Tables A4a and A4b according to
industry for last and current job respectively. The figures clearly show that the rates of
coding disagreement differ substantially across education and gender, with higher rates for
more educated individuals (only for last job) and for males. No clear patterns emerge from
the tables on disagreement rates for industry, probably because of the very low number of
observations in some groups. In the following subsection, we explore these results in more
detail based on a multivariate analysis.
4.2. Multivariate Analysis: Predicting Coding Errors
In this section, we estimate a set of Linear Probability Models (LPM) that can be used to
predict coding errors. They can also provide information about which ISCO groups are
more difficult to code. An LPM is a multiple linear regression model with a binary
dependent variable (Wooldridge 2010). As a robustness check, we also estimated the same
equations using nonlinear methods and the results were almost the same. The dependent
variable in these models allows for the possibility of multiple correspondences in the
ISCO-08 to ISCO-88 conversion tables. In other words, in our models the dependent
variable is a dummy variable equal to 1 if the three-digit ISCO-88 code provided by
SHARE is not equal to any of the three-digit ISCO-88 codes resulting from the conversion
of the ISCO-08 CASCOT-NL code into ISCO-88; otherwise, the dependent variable is
equal to 0. We estimated weighted regressions to account for the multiple correspondences
in the ISCO-08 to ISCO-88 conversion tables (where each observation is given a weight
that is inversely related to the number of correspondences). The results for the unweighted
regressions were virtually unchanged. Moreover, we considered two alternative dependent
variables, namely a dummy for being coded differently at one- or two-digit ISCO level.
Again, the results of these regressions were similar to those reported in the paper. All these
additional results are available from the authors upon request.
Table 4a. Skill levels bivariate distributions – SHARE vs CASCOT-NL – Last job (%).
CASCOT !SHARE # 1 2 3 4 Total
1 85 14 1 0 1002 6 83 10 1 1003 3 28 52 17 1004 0 9 19 72 100Total 16 56 17 11 100
Journal of Official Statistics928
Brought to you by | Università degli Studi di MilanoAuthenticated
Download Date | 11/24/16 11:34 AM
The set of LPM we estimated differ in terms of the set of explanatory variables. We
estimated separate models for last and current job. By pooling these two variables, we
would have considerably increased the number of observations and perhaps improved the
precision of our estimates. However, the descriptive findings outlined earlier suggest that
coding disagreements for current and last job have different patterns: our econometric
results (see below) clearly confirm that pooling current and last job – assuming that
explanatory variables have the same effect on the probability of miscoding for current and
last job – would have led to misspecification.
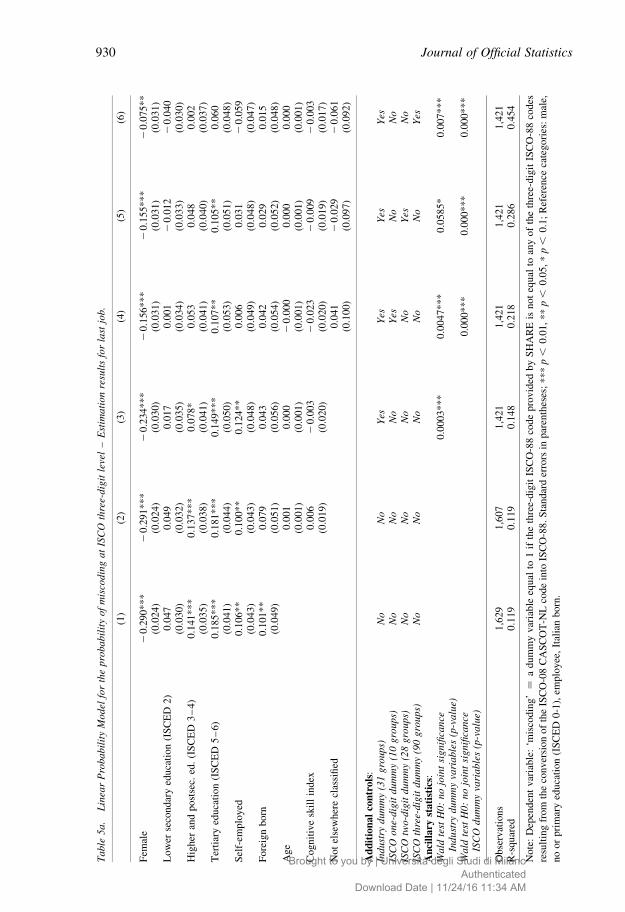
Table 5a reports LPM estimates for the probability of the last job being miscoded at
three-digit level. We present six specifications in this table. The first three columns include
only individual and job-related characteristics, that is, they do not include any variable that
results from the coding process. Models 1–3 can be used during (or before) ‘office’
coding: if the survey containing the questions on occupation also provides information on
the explanatory variables included in the estimated equation, their values can be ‘plugged
in’ and used to predict the likelihood that any attributed code is correct or incorrect.
Specification 1 includes basic individual characteristics present in almost all surveys as
explanatory variables, namely gender, educational attainment (four aggregated ISCED-97
groups), whether the individual is self-employed (controlling for self-employment is also
important to identify the gender effects, as females are overrepresented within this group
of workers), and whether the individual is foreign born. Our results indicate that females
are 29% less likely to be miscoded than males. Remarkably, there is a strong positive
gradient between education and coding disagreement: relative to individuals with no or
primary education, those with an upper and postsecondary degree (ISCED 3-4) have a
14% higher probability of being miscoded; this percentage rises to about 18% for
individuals holding a tertiary education degree (ISCED 5-6). Being self-employed
translates into about ten percent higher chance of being miscoded. The same holds for
being born abroad. With the exception of the dummy variable of ISCED 2, all of the
explanatory variables included in this model were significant at least at five percent level.
This very basic model with few right-hand side variables is able to explain about twelve
percent of the variability in the dependent variable (see the R-squared statistic at the
bottom of the table).
Specification 2 includes two additional regressors: age and a cognitive skills index.
These individual characteristics (especially the latter) might be particularly important for
predicting miscoding when looking at mature (50þ ) individuals. It might be expected that
older individuals and individuals with less cognitive functioning provide poorer job
Table 4b. Skill levels bivariate distributions – SHARE vs CASCOT-NL – Current job (%).
CASCOT !SHARE # 1 2 3 4 Total
1 80 16 2 2 1002 4 82 13 1 1003 4 18 50 28 1004 1 8 14 77 100Total 12 47 21 21 100
Belloni et al.: Occupational Coding: Measure and Detect Errors 929
Brought to you by | Università degli Studi di MilanoAuthenticated
Download Date | 11/24/16 11:34 AM
Table
5a.
Lin
ear
Pro
babil
ity
Model
for
the
pro
babil
ity
of
mis
codin
gat
ISC
Oth
ree-
dig
itle
vel
–E
stim
ati
on
resu
lts
for
last
job.
(1)
(2)
(3)
(4)
(5)
(6)
Fem
ale
20
.29
0*
**
20
.29
1*
**
20
.234
**
*2
0.1
56
**
*2
0.1
55
**
*2
0.0
75
**
(0.0
24)
(0.0
24)
(0.0
30)
(0.0
31)
(0.0
31)
(0.0
31
)L
ow
erse
condar
yed
uca
tion
(IS
CE
D2)
0.0
47
0.0
49
0.0
17
0.0
01
20
.012
20
.040
(0.0
30)
(0.0
32)
(0.0
35)
(0.0
34)
(0.0
33)
(0.0
30
)H
igher
and
po
stse
c.ed
.(I
SC
ED
3–
4)
0.1
41
**
*0
.137
**
*0
.078
*0
.053
0.0
48
0.0
02
(0.0
35)
(0.0
38)
(0.0
41)
(0.0
41)
(0.0
40)
(0.0
37
)T
erti
ary
educa
tion
(IS
CE
D5
–6)
0.1
85***
0.1
81***
0.1
49***
0.1
07**
0.1
05**
0.0
60
(0.0
41)
(0.0
44)
(0.0
50)
(0.0
53)
(0.0
51)
(0.0
48
)S
elf-
emp
loy
ed0
.106
**
0.1
00
**
0.1
24
**
0.0
06
0.0
31
20
.059
(0.0
43)
(0.0
43)
(0.0
48)
(0.0
49)
(0.0
48)
(0.0
47
)F
ore
ign
bo
rn0
.101
**
0.0
79
0.0
43
0.0
42
0.0
29
0.0
15
(0.0
49)
(0.0
51)
(0.0
56)
(0.0
54)
(0.0
52)
(0.0
48
)A
ge
0.0
01
0.0
00
20
.000
0.0
00
0.0
00
(0.0
01)
(0.0
01)
(0.0
01)
(0.0
01)
(0.0
01
)C
og
nit
ive
skil
lin
dex
0.0
06
20
.00
32
0.0
23
20
.009
20
.003
(0.0
19)
(0.0
20)
(0.0
20)
(0.0
19)
(0.0
17
)N
ot
else
wher
ecl
assi
fied
0.0
41
20
.029
20
.061
(0.1
00)
(0.0
97)
(0.0
92
)
Ad
dit
ion
al
con
tro
ls:
Ind
ust
ryd
um
my
(31
gro
up
s)N
oN
oY
esY
esY
esY
esIS
CO
on
e-d
igit
du
mm
y(1
0g
roup
s)N
oN
oN
oY
esN
oN
oIS
CO
two
-dig
itd
um
my
(28
gro
up
s)N
oN
oN
oN
oY
esN
oIS
CO
thre
e-dig
itd
um
my
(90
gro
up
s)N
oN
oN
oN
oN
oY
esA
nci
lla
ryst
ati
stic
s:W
ald
test
H0
:n
ojo
int
sig
nifi
can
ceIn
du
stry
du
mm
yva
ria
ble
s(p
-va
lue)
0.0
00
3*
**
0.0
04
7*
**
0.0
58
5*
0.0
07
**
*
Wa
ldte
stH
0:
no
join
tsi
gn
ifica
nce
ISC
Od
um
my
vari
ab
les
(p-v
alu
e)0
.00
0*
**
0.0
00
**
*0
.000
**
*
Ob
serv
atio
ns
1,6
29
1,6
07
1,4
21
1,4
21
1,4
21
1,4
21
R-s
qu
ared
0.1
19
0.1
19
0.1
48
0.2
18
0.2
86
0.4
54
Note
:D
epen
den
tvar
iable
:‘m
isco
din
g’¼
ad
um
my
var
iab
leeq
ual
to1
ifth
eth
ree-
dig
itIS
CO
-88
cod
ep
rov
ided
by
SH
AR
Eis
no
teq
ual
toan
yo
fth
eth
ree-
dig
itIS
CO
-88
cod
es
resu
ltin
gfr
om
the
con
ver
sio
no
fth
eIS
CO
-08
CA
SC
OT
-NL
cod
ein
toIS
CO
-88
.S
tan
dar
der
rors
inp
aren
thes
es;
**
*p
,0
.01,
**
p,
0.0
5,
*p
,0.1
;R
efer
ence
cate
gori
es:
mal
e,
no
or
pri
mar
yed
uca
tio
n(I
SC
ED
0-1
),em
plo
yee
,It
alia
nb
orn
.
Journal of Official Statistics930
Brought to you by | Università degli Studi di MilanoAuthenticated
Download Date | 11/24/16 11:34 AM
descriptions, which are thus more difficult to code. A ‘Cognitive Functioning’ module
included in SHARE reports the results of simple tests of verbal fluency, such as counting
the number of items that can be named in one minute; recalling as many words as possible
from a ten-word list; and testing daily life numerical calculations (see e.g., Christelis et al.
2010). Based on these tests, we built an index of cognitive abilities (Leist et al. 2013). This
index is given by the average value of the standardised results of these tests. The higher the
value of the index, the higher the cognitive abilities. We did not find any significant effect
of these two variables on the probability of miscoding last job.
In Specification 3, we additionally controlled for industry by including a set of 31
industry dummy variables in the model. Industry was classified using NACE Codes,
Version 4 Rev. 1 1993 (see http://www.top500.de/nace4-e.htm for a description of NACE
Version 4 Rev. 1 and MEA 2013, 32–33 for the shorter classification used in SHARE).
They jointly affect the probability of coding error, as indicated by the result of the Wald
test reported at the bottom of the table ( p-value ¼ 0.0003). Remarkably, even after
controlling for industry, the effects of gender, educational attainment, and being self-
employed on coding disagreement remained significant, although they were somewhat
attenuated. This richer specification is able to explain about 15% of the observed
miscoding.
Specifications 4 to 6 add a set of variables to individual and job-related characteristics
that result from coding the verbatim response to the open-ended questions on occupation.
Specification 4 includes ten ISCO one-digit (Major) groups fixed effects, Specification 5
includes 28 ISCO 2-digits (Sub-major) groups fixed effects, and Specification 6 includes
90 ISCO three-digit (Minor) groups fixed effects. Moreover, all models include a dummy
variable for being coded as “Not elsewhere classified” (NEC). This was constructed by
looking at the ISCO-88 four-digit codes, as coded by CASCOT-NL software. This NEC
dummy was equal to 1 if the ISCO-88 fourth digit was equal to 9, which, according to
ILO’s guidelines, refers to occupational categories that are not classified into other specific
categories within the classification. This variable includes ISCO categories which usually
contain many types of clerical jobs. We thus expect NEC jobs to be more likely to be
miscoded.
These extended specifications can be used to predict coding errors during CAPI
interviews. In addition to proposing a given ISCO code, the coding software (such as the
‘Jobcoder’, see Section 2) would be able to evaluate the quality of the proposal by
determining the probability that it is correct (similarly to the score produced by CASCOT).
If this probability is low, the interviewee can be asked for additional information. Another
possible use of the predictive equations 4 to 6 is to ‘double check’ office coding. After an
ISCO code has been attributed to the occupation, all of the explanatory variables are in fact
available for error prediction.
These specifications – especially Specification 6 – are very demanding in terms of data
requirements, and we expect to have limited variability in individual and job-related
characteristics once we condition on being coded in a given ISCO group. Nonetheless, the
negative coefficient for “female” remained significant at five percent even after controlling
for ISCO Minor groups. The same occurred for the industry dummy variables (the p-value
of the Wald test for no joint significance of the industry dummy variables is almost equal
Belloni et al.: Occupational Coding: Measure and Detect Errors 931
Brought to you by | Università degli Studi di MilanoAuthenticated
Download Date | 11/24/16 11:34 AM
to 0 in Specification 6). This independent source of variation increases the overall
explanatory power of our error-predicting equations.
Adding ISCO dummy variables to the model dramatically improves the model fit: the
R-squared in fact increases from 15% (Specification 3; no information on ISCO codes) to
22% (Specification 4) and progressively increases further with the number of ISCO digits,
up to about 45% (Specification 6). The p-value of the Wald test for no joint significance of
the ISCO group dummy variables is always equal to 0.
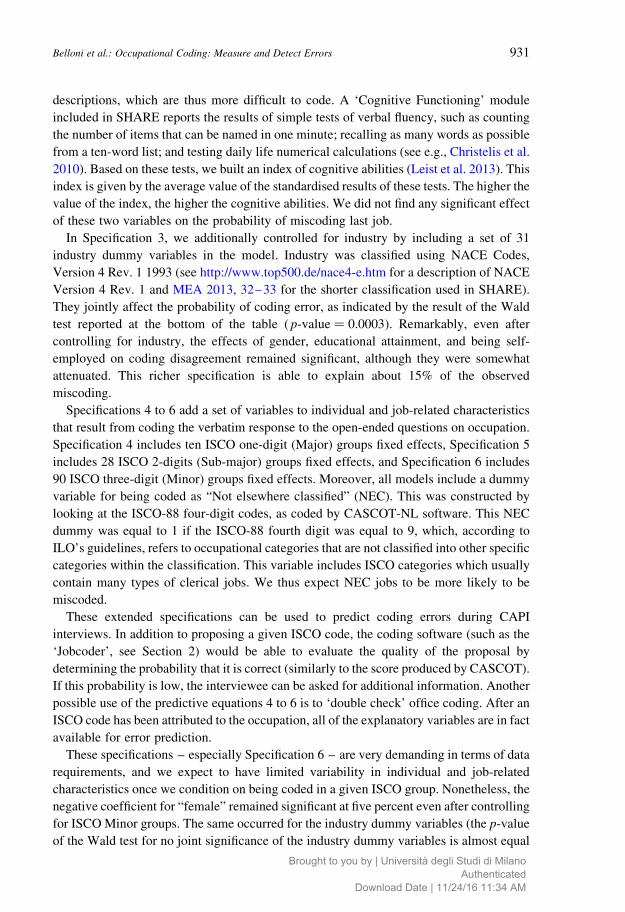
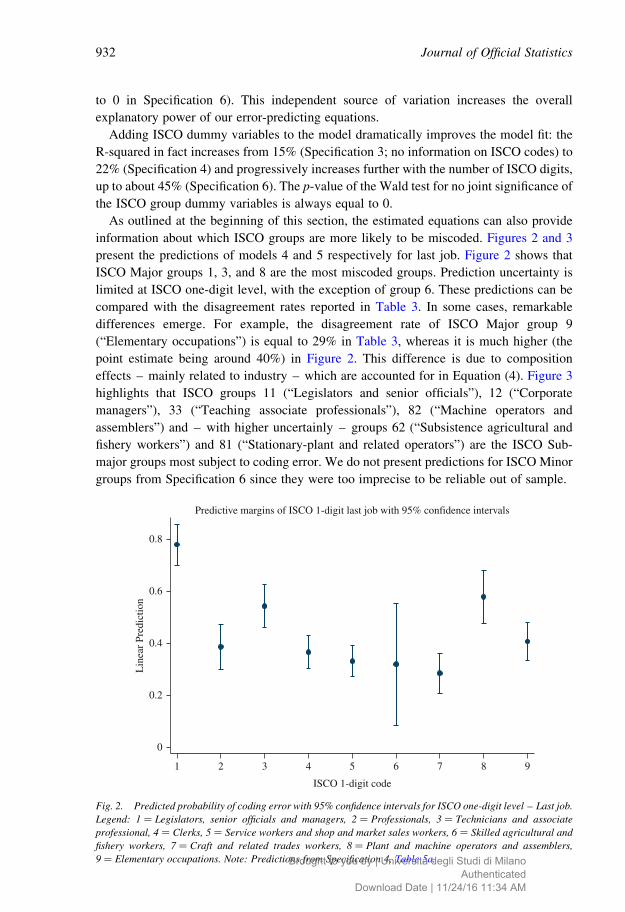
As outlined at the beginning of this section, the estimated equations can also provide
information about which ISCO groups are more likely to be miscoded. Figures 2 and 3
present the predictions of models 4 and 5 respectively for last job. Figure 2 shows that
ISCO Major groups 1, 3, and 8 are the most miscoded groups. Prediction uncertainty is
limited at ISCO one-digit level, with the exception of group 6. These predictions can be
compared with the disagreement rates reported in Table 3. In some cases, remarkable
differences emerge. For example, the disagreement rate of ISCO Major group 9
(“Elementary occupations”) is equal to 29% in Table 3, whereas it is much higher (the
point estimate being around 40%) in Figure 2. This difference is due to composition
effects – mainly related to industry – which are accounted for in Equation (4). Figure 3
highlights that ISCO groups 11 (“Legislators and senior officials”), 12 (“Corporate
managers”), 33 (“Teaching associate professionals”), 82 (“Machine operators and
assemblers”) and – with higher uncertainly – groups 62 (“Subsistence agricultural and
fishery workers”) and 81 (“Stationary-plant and related operators”) are the ISCO Sub-
major groups most subject to coding error. We do not present predictions for ISCO Minor
groups from Specification 6 since they were too imprecise to be reliable out of sample.
0
0.2
0.4
0.6
0.8
Lin
ear
Pred
ictio
n
1 2 3 4 5 6 7 8 9
ISCO 1-digit code
Predictive margins of ISCO 1-digit last job with 95% confidence intervals
Fig. 2. Predicted probability of coding error with 95% confidence intervals for ISCO one-digit level – Last job.
Legend: 1 ¼ Legislators, senior officials and managers, 2 ¼ Professionals, 3 ¼ Technicians and associate
professional, 4 ¼ Clerks, 5 ¼ Service workers and shop and market sales workers, 6 ¼ Skilled agricultural and
fishery workers, 7 ¼ Craft and related trades workers, 8 ¼ Plant and machine operators and assemblers,
9 ¼ Elementary occupations. Note: Predictions from Specification 4, Table 5a.
Journal of Official Statistics932
Brought to you by | Università degli Studi di MilanoAuthenticated
Download Date | 11/24/16 11:34 AM
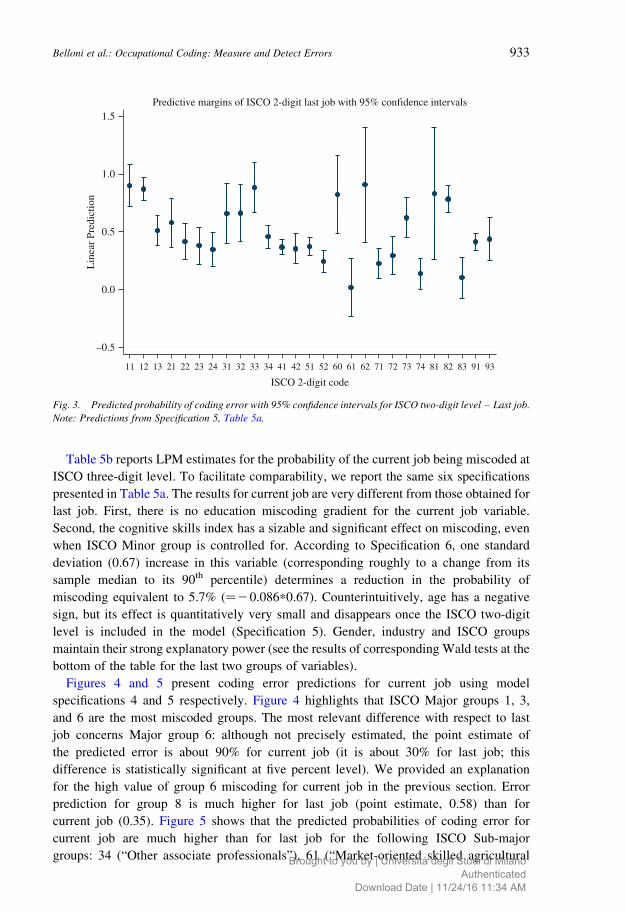
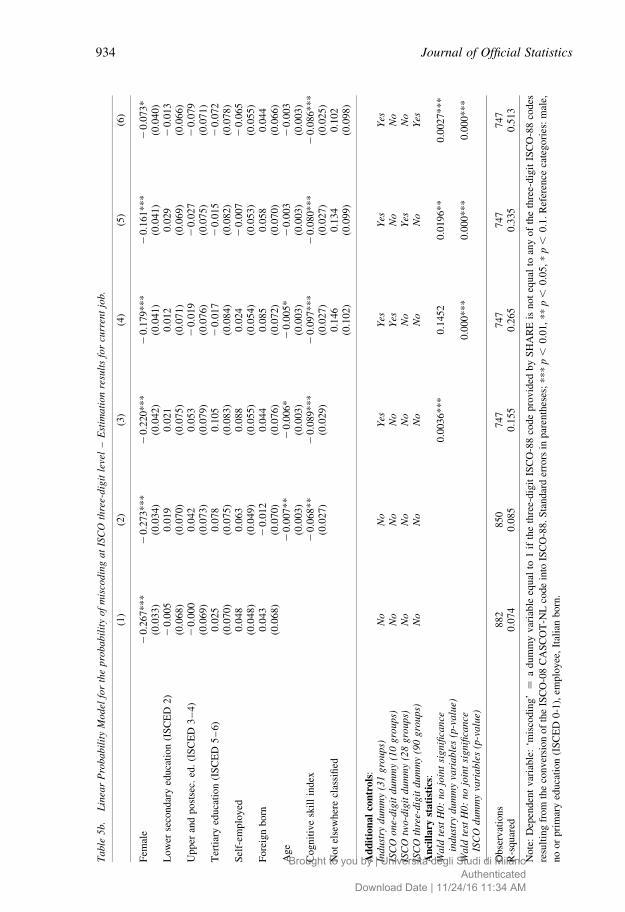
Table 5b reports LPM estimates for the probability of the current job being miscoded at
ISCO three-digit level. To facilitate comparability, we report the same six specifications
presented in Table 5a. The results for current job are very different from those obtained for
last job. First, there is no education miscoding gradient for the current job variable.
Second, the cognitive skills index has a sizable and significant effect on miscoding, even
when ISCO Minor group is controlled for. According to Specification 6, one standard
deviation (0.67) increase in this variable (corresponding roughly to a change from its
sample median to its 90th percentile) determines a reduction in the probability of
miscoding equivalent to 5.7% (¼20.086*0.67). Counterintuitively, age has a negative
sign, but its effect is quantitatively very small and disappears once the ISCO two-digit
level is included in the model (Specification 5). Gender, industry and ISCO groups
maintain their strong explanatory power (see the results of corresponding Wald tests at the
bottom of the table for the last two groups of variables).
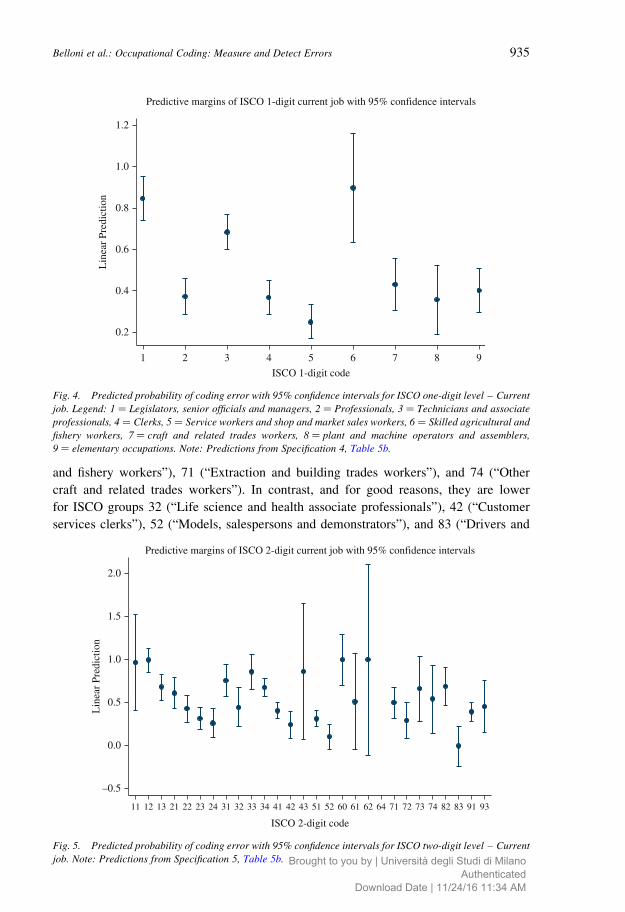
Figures 4 and 5 present coding error predictions for current job using model
specifications 4 and 5 respectively. Figure 4 highlights that ISCO Major groups 1, 3,
and 6 are the most miscoded groups. The most relevant difference with respect to last
job concerns Major group 6: although not precisely estimated, the point estimate of
the predicted error is about 90% for current job (it is about 30% for last job; this
difference is statistically significant at five percent level). We provided an explanation
for the high value of group 6 miscoding for current job in the previous section. Error
prediction for group 8 is much higher for last job (point estimate, 0.58) than for
current job (0.35). Figure 5 shows that the predicted probabilities of coding error for
current job are much higher than for last job for the following ISCO Sub-major
groups: 34 (“Other associate professionals”), 61 (“Market-oriented skilled agricultural
–0.5
0.0
0.5
1.0
1.5
Lin
ear
Pred
ictio
n
11 12 13 21 22 23 24 31 32 33 34 41 42 51 52 60 61 62 71 72 73 74 81 82 83 91 93
ISCO 2-digit code
Predictive margins of ISCO 2-digit last job with 95% confidence intervals
Fig. 3. Predicted probability of coding error with 95% confidence intervals for ISCO two-digit level – Last job.
Note: Predictions from Specification 5, Table 5a.
Belloni et al.: Occupational Coding: Measure and Detect Errors 933
Brought to you by | Università degli Studi di MilanoAuthenticated
Download Date | 11/24/16 11:34 AM
Table
5b.
Lin
ear
Pro
babil
ity
Model
for
the
pro
babil
ity
of
mis
codin
gat
ISC
Oth
ree-
dig
itle
vel
–E
stim
ati
on
resu
lts
for
curr
ent
job.
(1)
(2)
(3)
(4)
(5)
(6)
Fem
ale
20
.267
**
*2
0.2
73
**
*2
0.2
20
**
*2
0.1
79
**
*2
0.1
61
**
*2
0.0
73
*(0
.03
3)
(0.0
34)
(0.0
42)
(0.0
41)
(0.0
41)
(0.0
40
)L
ow
erse
condar
yed
uca
tion
(IS
CE
D2)
20
.005
0.0
19
0.0
21
0.0
12
0.0
29
20
.013
(0.0
68
)(0
.07
0)
(0.0
75)
(0.0
71)
(0.0
69)
(0.0
66
)U
pp
eran
dp
ost
sec.
ed.
(IS
CE
D3
–4
)2
0.0
00
0.0
42
0.0
53
20
.01
92
0.0
27
20
.079
(0.0
69
)(0
.07
3)
(0.0
79)
(0.0
76)
(0.0
75)
(0.0
71
)T
erti
ary
educa
tion
(IS
CE
D5
–6)
0.0
25
0.0
78
0.1
05
20
.01
72
0.0
15
20
.072
(0.0
70
)(0
.07
5)
(0.0
83)
(0.0
84)
(0.0
82)
(0.0
78
)S
elf-
emp
loy
ed0
.04
80
.063
0.0
88
0.0
24
20
.00
72
0.0
65
(0.0
48
)(0
.04
9)
(0.0
55)
(0.0
54)
(0.0
53)
(0.0
55
)F
ore
ign
bo
rn0
.04
32
0.0
12
0.0
44
0.0
85
0.0
58
0.0
44
(0.0
68
)(0
.07
0)
(0.0
76)
(0.0
72)
(0.0
70)
(0.0
66
)A
ge
20
.007
**
20
.006
*2
0.0
05
*2
0.0
03
20
.003
(0.0
03)
(0.0
03)
(0.0
03)
(0.0
03)
(0.0
03
)C
og
nit
ive
skil
lin
dex
20
.068
**
20
.089
**
*2
0.0
97
**
*2
0.0
80
**
*2
0.0
86
**
*(0
.02
7)
(0.0
29)
(0.0
27)
(0.0
27)
(0.0
25
)N
ot
else
wher
ecl
assi
fied
0.1
46
0.1
34
0.1
02
(0.1
02)
(0.0
99)
(0.0
98
)
Ad
dit
ion
al
con
tro
ls:
Ind
ust
ryd
um
my
(31
gro
up
s)N
oN
oY
esY
esY
esY
esIS
CO
on
e-d
igit
du
mm
y(1
0g
roup
s)N
oN
oN
oY
esN
oN
oIS
CO
two
-dig
itd
um
my
(28
gro
up
s)N
oN
oN
oN
oY
esN
oIS
CO
thre
e-dig
itd
um
my
(90
gro
up
s)N
oN
oN
oN
oN
oY
esA
nci
lla
ryst
ati
stic
s:W
ald
test
H0
:n
ojo
int
sig
nifi
can
cein
du
stry
du
mm
yva
ria
ble
s(p
-va
lue)
0.0
03
6*
**
0.1
45
20
.019
6*
*0
.002
7*
**
Wa
ldte
stH
0:
no
join
tsi
gn
ifica
nce
ISC
Od
um
my
vari
ab
les
(p-v
alu
e)0
.000
**
*0
.000
**
*0
.000
**
*
Ob
serv
atio
ns
88
28
50
74
77
47
74
77
47
R-s
qu
ared
0.0
74
0.0
85
0.1
55
0.2
65
0.3
35
0.5
13
Note
:D
epen
den
tvar
iable
:‘m
isco
din
g’¼
ad
um
my
var
iab
leeq
ual
to1
ifth
eth
ree-
dig
itIS
CO
-88
cod
ep
rov
ided
by
SH
AR
Eis
no
teq
ual
toan
yo
fth
eth
ree-
dig
itIS
CO
-88
cod
es
resu
ltin
gfr
om
the
conver
sion
of
the
ISC
O-0
8C
AS
CO
T-N
Lco
de
into
ISC
O-8
8.
Sta
ndar
der
rors
inpar
enth
eses
;*
**
p,
0.0
1,
**
p,
0.0
5,
*p
,0
.1.
Ref
eren
ceca
teg
ori
es:
mal
e,
no
or
pri
mar
yed
uca
tio
n(I
SC
ED
0-1
),em
plo
yee
,It
alia
nb
orn
.
Journal of Official Statistics934
Brought to you by | Università degli Studi di MilanoAuthenticated
Download Date | 11/24/16 11:34 AM
and fishery workers”), 71 (“Extraction and building trades workers”), and 74 (“Other
craft and related trades workers”). In contrast, and for good reasons, they are lower
for ISCO groups 32 (“Life science and health associate professionals”), 42 (“Customer
services clerks”), 52 (“Models, salespersons and demonstrators”), and 83 (“Drivers and
0.2
0.4
0.6
0.8
1.0
1.2
Lin
ear
Pred
ictio
n
1 2 3 4 5 6 7 8 9
ISCO 1-digit code
Predictive margins of ISCO 1-digit current job with 95% confidence intervals
Fig. 4. Predicted probability of coding error with 95% confidence intervals for ISCO one-digit level – Current
job. Legend: 1 ¼ Legislators, senior officials and managers, 2 ¼ Professionals, 3 ¼ Technicians and associate
professionals, 4 ¼ Clerks, 5 ¼ Service workers and shop and market sales workers, 6 ¼ Skilled agricultural and
fishery workers, 7 ¼ craft and related trades workers, 8 ¼ plant and machine operators and assemblers,
9 ¼ elementary occupations. Note: Predictions from Specification 4, Table 5b.
–0.5
0.0
0.5
1.0
1.5
2.0
Lin
ear
Pred
ictio
n
11 12 13 21 22 23 24 31 32 33 34 41 42 43 51 52 60 61 62 64 71 72 73 74 82 83 91 93
ISCO 2-digit code
Predictive margins of ISCO 2-digit current job with 95% confidence intervals
Fig. 5. Predicted probability of coding error with 95% confidence intervals for ISCO two-digit level – Current
job. Note: Predictions from Specification 5, Table 5b.
Belloni et al.: Occupational Coding: Measure and Detect Errors 935
Brought to you by | Università degli Studi di MilanoAuthenticated
Download Date | 11/24/16 11:34 AM
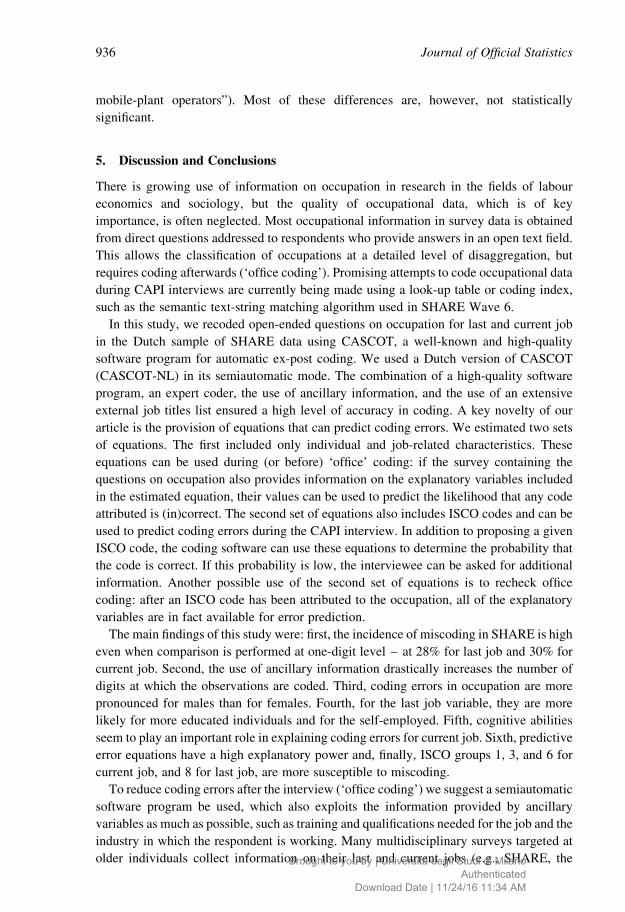
mobile-plant operators”). Most of these differences are, however, not statistically
significant.
5. Discussion and Conclusions
There is growing use of information on occupation in research in the fields of labour
economics and sociology, but the quality of occupational data, which is of key
importance, is often neglected. Most occupational information in survey data is obtained
from direct questions addressed to respondents who provide answers in an open text field.
This allows the classification of occupations at a detailed level of disaggregation, but
requires coding afterwards (‘office coding’). Promising attempts to code occupational data
during CAPI interviews are currently being made using a look-up table or coding index,
such as the semantic text-string matching algorithm used in SHARE Wave 6.
In this study, we recoded open-ended questions on occupation for last and current job
in the Dutch sample of SHARE data using CASCOT, a well-known and high-quality
software program for automatic ex-post coding. We used a Dutch version of CASCOT
(CASCOT-NL) in its semiautomatic mode. The combination of a high-quality software
program, an expert coder, the use of ancillary information, and the use of an extensive
external job titles list ensured a high level of accuracy in coding. A key novelty of our
article is the provision of equations that can predict coding errors. We estimated two sets
of equations. The first included only individual and job-related characteristics. These
equations can be used during (or before) ‘office’ coding: if the survey containing the
questions on occupation also provides information on the explanatory variables included
in the estimated equation, their values can be used to predict the likelihood that any code
attributed is (in)correct. The second set of equations also includes ISCO codes and can be
used to predict coding errors during the CAPI interview. In addition to proposing a given
ISCO code, the coding software can use these equations to determine the probability that
the code is correct. If this probability is low, the interviewee can be asked for additional
information. Another possible use of the second set of equations is to recheck office
coding: after an ISCO code has been attributed to the occupation, all of the explanatory
variables are in fact available for error prediction.
The main findings of this study were: first, the incidence of miscoding in SHARE is high
even when comparison is performed at one-digit level – at 28% for last job and 30% for
current job. Second, the use of ancillary information drastically increases the number of
digits at which the observations are coded. Third, coding errors in occupation are more
pronounced for males than for females. Fourth, for the last job variable, they are more
likely for more educated individuals and for the self-employed. Fifth, cognitive abilities
seem to play an important role in explaining coding errors for current job. Sixth, predictive
error equations have a high explanatory power and, finally, ISCO groups 1, 3, and 6 for
current job, and 8 for last job, are more susceptible to miscoding.
To reduce coding errors after the interview (‘office coding’) we suggest a semiautomatic
software program be used, which also exploits the information provided by ancillary
variables as much as possible, such as training and qualifications needed for the job and the
industry in which the respondent is working. Many multidisciplinary surveys targeted at
older individuals collect information on their last and current jobs (e.g., SHARE, the
Journal of Official Statistics936
Brought to you by | Università degli Studi di MilanoAuthenticated
Download Date | 11/24/16 11:34 AM
English Longitudinal Study of Ageing, and the US Health and Retirement Study). When
coding occupations in these surveys, one should ideally make use of measures of
individuals’ cognitive ability to assist in determining the likelihood of the attributed code
being correct. Additional specific questions targeted at the abovementioned groups of
occupations should be included in the questionnaire. The main advantage of coding during
the interview is that if the response is vague or imprecise, the interviewer can ask the
respondent for a more precise job description. Predictive error equations such as those
presented in this study may complement the coding software in this novel context.
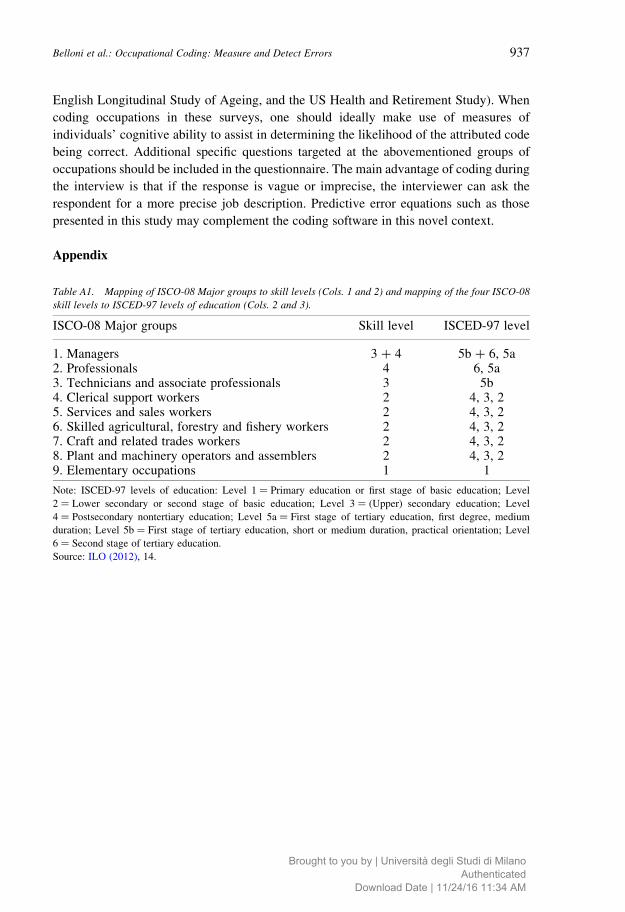
Appendix
Table A1. Mapping of ISCO-08 Major groups to skill levels (Cols. 1 and 2) and mapping of the four ISCO-08
skill levels to ISCED-97 levels of education (Cols. 2 and 3).
ISCO-08 Major groups Skill level ISCED-97 level
1. Managers 3 þ 4 5b þ 6, 5a2. Professionals 4 6, 5a3. Technicians and associate professionals 3 5b4. Clerical support workers 2 4, 3, 25. Services and sales workers 2 4, 3, 26. Skilled agricultural, forestry and fishery workers 2 4, 3, 27. Craft and related trades workers 2 4, 3, 28. Plant and machinery operators and assemblers 2 4, 3, 29. Elementary occupations 1 1
Note: ISCED-97 levels of education: Level 1 ¼ Primary education or first stage of basic education; Level
2 ¼ Lower secondary or second stage of basic education; Level 3 ¼ (Upper) secondary education; Level
4 ¼ Postsecondary nontertiary education; Level 5a ¼ First stage of tertiary education, first degree, medium
duration; Level 5b ¼ First stage of tertiary education, short or medium duration, practical orientation; Level
6 ¼ Second stage of tertiary education.
Source: ILO (2012), 14.
Belloni et al.: Occupational Coding: Measure and Detect Errors 937
Brought to you by | Università degli Studi di MilanoAuthenticated
Download Date | 11/24/16 11:34 AM
Ta
ble
A2
.D
isa
gre
emen
tra
tea
td
iffe
ren
tn
um
ber
of
dig
its
by
edu
cati
on
leve
ls–
La
stjo
ba
nd
Cu
rren
tjo
b.
Las
tjo
bC
urr
ent
job
Dis
agre
emen
tra
te(%
)D
isag
reem
ent
rate
(%)
Fre
qu
enci
es3
dig
it2
dig
it1
dig
itF
req
uen
cies
3d
igit
2d
igit
1d
igit
ISC
ED
0–
13
37
37
30
22
55
47
42
33
ISC
ED
27
11
39
32
24
32
04
73
72
4IS
CE
D3
–4
35
55
14
13
52
44
49
40
32
ISC
ED
5–
62
26
55
40
37
26
34
73
53
1
To
tal
16
29
44
35
28
88
24
83
82
9
No
te:
Dis
agre
emen
tra
teis
the
per
cen
tag
eo
fo
bse
rvat
ion
sco
ded
dif
fere
ntl
yb
yC
AS
CO
T-N
Lan
dS
HA
RE
.
Journal of Official Statistics938
Brought to you by | Università degli Studi di MilanoAuthenticated
Download Date | 11/24/16 11:34 AM
Ta
ble
A3
.D
isa
gre
emen
tra
tea
td
iffe
ren
tn
um
ber
of
dig
its
by
gen
der
–L
ast
job
an
dC
urr
ent
job.
Las
tjo
bC
urr
ent
job
Dis
agre
emen
tra
te(%
)D
isag
reem
ent
rate
(%)
Fre
qu
enci
es3
dig
it2
dig
it1
dig
itF
req
uen
cies
3d
igit
2d
igit
1d
igit
Mal
e7
52
61
48
39
45
46
14
63
5F
emal
es9
07
29
23
19
43
53
42
92
3
To
tal
16
59
44
35
28
88
94
83
82
9
No
te:
Dis
agre
emen
tra
teis
the
per
cen
tag
eo
fo
bse
rvat
ion
sco
ded
dif
fere
ntl
yb
yC
AS
CO
T-N
Lan
dS
HA
RE
.
Belloni et al.: Occupational Coding: Measure and Detect Errors 939
Brought to you by | Università degli Studi di MilanoAuthenticated
Download Date | 11/24/16 11:34 AM
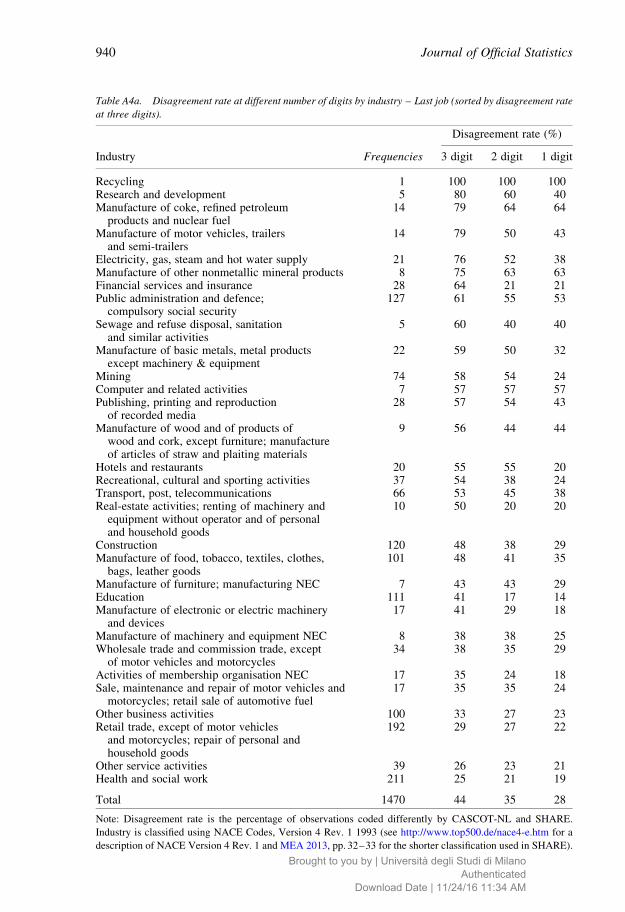
Table A4a. Disagreement rate at different number of digits by industry – Last job (sorted by disagreement rate
at three digits).
Disagreement rate (%)
Industry Frequencies 3 digit 2 digit 1 digit
Recycling 1 100 100 100Research and development 5 80 60 40Manufacture of coke, refined petroleum
products and nuclear fuel14 79 64 64
Manufacture of motor vehicles, trailersand semi-trailers
14 79 50 43
Electricity, gas, steam and hot water supply 21 76 52 38Manufacture of other nonmetallic mineral products 8 75 63 63Financial services and insurance 28 64 21 21Public administration and defence;
compulsory social security127 61 55 53
Sewage and refuse disposal, sanitationand similar activities
5 60 40 40
Manufacture of basic metals, metal productsexcept machinery & equipment
22 59 50 32
Mining 74 58 54 24Computer and related activities 7 57 57 57Publishing, printing and reproduction
of recorded media28 57 54 43
Manufacture of wood and of products ofwood and cork, except furniture; manufactureof articles of straw and plaiting materials
9 56 44 44
Hotels and restaurants 20 55 55 20Recreational, cultural and sporting activities 37 54 38 24Transport, post, telecommunications 66 53 45 38Real-estate activities; renting of machinery and
equipment without operator and of personaland household goods
10 50 20 20
Construction 120 48 38 29Manufacture of food, tobacco, textiles, clothes,
bags, leather goods101 48 41 35
Manufacture of furniture; manufacturing NEC 7 43 43 29Education 111 41 17 14Manufacture of electronic or electric machinery
and devices17 41 29 18
Manufacture of machinery and equipment NEC 8 38 38 25Wholesale trade and commission trade, except
of motor vehicles and motorcycles34 38 35 29
Activities of membership organisation NEC 17 35 24 18Sale, maintenance and repair of motor vehicles and
motorcycles; retail sale of automotive fuel17 35 35 24
Other business activities 100 33 27 23Retail trade, except of motor vehicles
and motorcycles; repair of personal andhousehold goods
192 29 27 22
Other service activities 39 26 23 21Health and social work 211 25 21 19
Total 1470 44 35 28
Note: Disagreement rate is the percentage of observations coded differently by CASCOT-NL and SHARE.
Industry is classified using NACE Codes, Version 4 Rev. 1 1993 (see http://www.top500.de/nace4-e.htm for a
description of NACE Version 4 Rev. 1 and MEA 2013, pp. 32–33 for the shorter classification used in SHARE).
Journal of Official Statistics940
Brought to you by | Università degli Studi di MilanoAuthenticated
Download Date | 11/24/16 11:34 AM
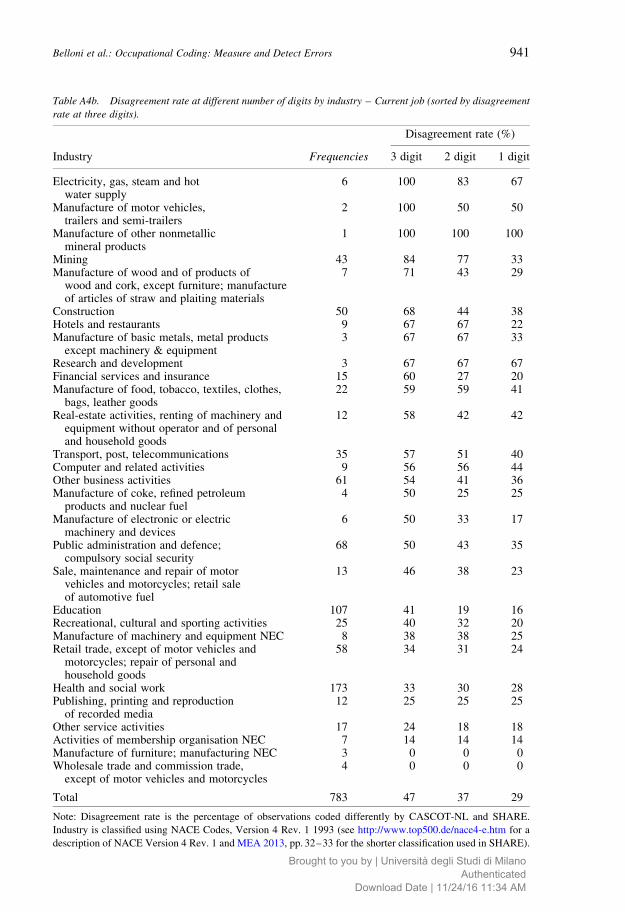
Table A4b. Disagreement rate at different number of digits by industry – Current job (sorted by disagreement
rate at three digits).
Disagreement rate (%)
Industry Frequencies 3 digit 2 digit 1 digit
Electricity, gas, steam and hotwater supply
6 100 83 67
Manufacture of motor vehicles,trailers and semi-trailers
2 100 50 50
Manufacture of other nonmetallicmineral products
1 100 100 100
Mining 43 84 77 33Manufacture of wood and of products of
wood and cork, except furniture; manufactureof articles of straw and plaiting materials
7 71 43 29
Construction 50 68 44 38Hotels and restaurants 9 67 67 22Manufacture of basic metals, metal products
except machinery & equipment3 67 67 33
Research and development 3 67 67 67Financial services and insurance 15 60 27 20Manufacture of food, tobacco, textiles, clothes,
bags, leather goods22 59 59 41
Real-estate activities, renting of machinery andequipment without operator and of personaland household goods
12 58 42 42
Transport, post, telecommunications 35 57 51 40Computer and related activities 9 56 56 44Other business activities 61 54 41 36Manufacture of coke, refined petroleum
products and nuclear fuel4 50 25 25
Manufacture of electronic or electricmachinery and devices
6 50 33 17
Public administration and defence;compulsory social security
68 50 43 35
Sale, maintenance and repair of motorvehicles and motorcycles; retail saleof automotive fuel
13 46 38 23
Education 107 41 19 16Recreational, cultural and sporting activities 25 40 32 20Manufacture of machinery and equipment NEC 8 38 38 25Retail trade, except of motor vehicles and
motorcycles; repair of personal andhousehold goods
58 34 31 24
Health and social work 173 33 30 28Publishing, printing and reproduction
of recorded media12 25 25 25
Other service activities 17 24 18 18Activities of membership organisation NEC 7 14 14 14Manufacture of furniture; manufacturing NEC 3 0 0 0Wholesale trade and commission trade,
except of motor vehicles and motorcycles4 0 0 0
Total 783 47 37 29
Note: Disagreement rate is the percentage of observations coded differently by CASCOT-NL and SHARE.
Industry is classified using NACE Codes, Version 4 Rev. 1 1993 (see http://www.top500.de/nace4-e.htm for a
description of NACE Version 4 Rev. 1 and MEA 2013, pp. 32–33 for the shorter classification used in SHARE).
Belloni et al.: Occupational Coding: Measure and Detect Errors 941
Brought to you by | Università degli Studi di MilanoAuthenticated
Download Date | 11/24/16 11:34 AM
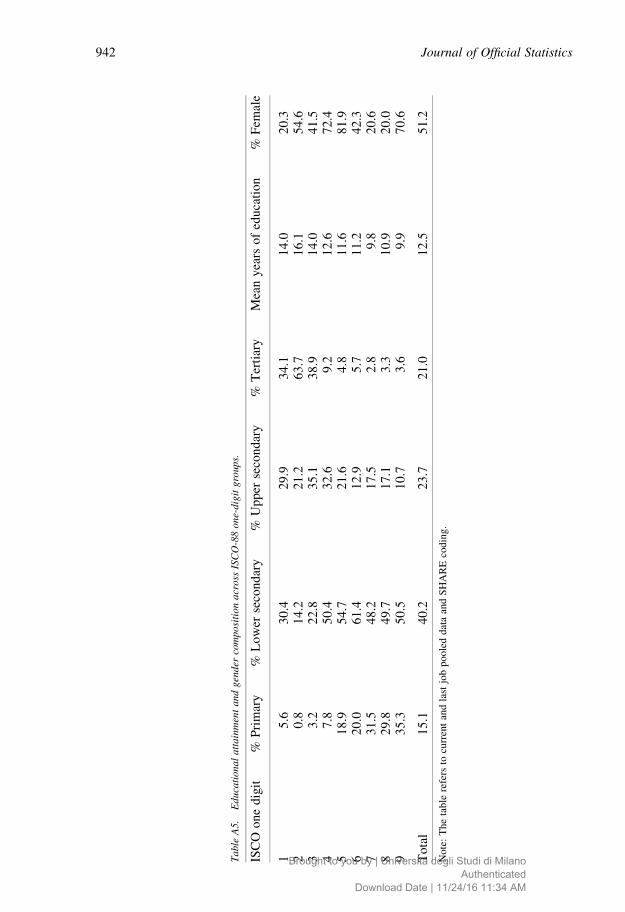
Ta
ble
A5
.E
du
cati
on
al
att
ain
men
ta
nd
gen
der
com
po
siti
on
acr
oss
ISC
O-8
8o
ne-
dig
itg
roup
s.
ISC
Oo
ne
dig
it%
Pri
mar
y%
Lo
wer
seco
nd
ary
%U
pp
erse
con
dar
y%
Ter
tiar
yM
ean
yea
rso
fed
uca
tio
n%
Fem
ale
15
.63
0.4
29
.93
4.1
14
.02
0.3
20
.81
4.2
21
.26
3.7
16
.15
4.6
33
.22
2.8
35
.13
8.9
14
.04
1.5
47
.85
0.4
32
.69
.21
2.6
72
.45
18
.95
4.7
21
.64
.81
1.6
81
.96
20
.06
1.4
12
.95
.71
1.2
42
.37
31
.54
8.2
17
.52
.89
.82
0.6
82
9.8
49
.71
7.1
3.3
10
.92
0.0
93
5.3
50
.51
0.7
3.6
9.9
70
.6
To
tal
15
.14
0.2
23
.72
1.0
12
.55
1.2
No
te:
Th
eta
ble
refe
rsto
curr
ent
and
last
job
po
ole
dd
ata
and
SH
AR
Eco
din
g.
Journal of Official Statistics942
Brought to you by | Università degli Studi di MilanoAuthenticated
Download Date | 11/24/16 11:34 AM
6. References
Autor, D. 2013. “The ‘Task Approach’ to Labour Markets: an Overview.” Journal of
Labour Market Research 46: 185 – 199. Doi: http://dx.doi.org/10.1007/
s12651-013-0128-z.
Autor, D., L.F. Katz, and M.S. Kearney. 2006. “The Polarization of the US Labor Market.”
American Economic Review 96: 189 – 194. Doi: http://dx.doi.org/10.1257/
000282806777212620.
Autor, D., F. Levy, and R.J. Murnane. 2003. “The Skill Content Of Recent Technological
Change: An Empirical Exploration.” Quarterly Journal of Economics 118: 1279–1333.
Doi: http://dx.doi.org/10.1162/003355303322552801.
Bethmann, A., M. Schierholz, K. Wenzig, and M. Zielonka. 2014. Automatic Coding of
Occupations Using Machine Learning Algorithms for Occupation Coding in Several
German Panel Surveys. In: Statistics Canada (Ed.), Beyond traditional survey taking.
Adapting to a changing world. Proceedings of Statistics Canada Symposium 2014,
Quebec. Available at: http://fdz.iab.de/342/section.aspx/Publikation/k151124301
(accessed October 2016).
Biemer, P.B. and L.E. Lyberg. 2003. Introduction to Survey Quality. New York: John
Wiley & Sons, Inc.
CBS (Statistics Netherlands). 2012. Coding Tool Implemented in 2012 for Coding
Occupations in Social Surveys. Internal Document. The Hague: Statistics Netherlands.
Cheeseman Day, J. 2014. Using an Autocoder to Code Industry and Occupation in the
American Community Survey. Presentation held at the Federal Economic Statistics
Advisory Committee Meeting, 13 June 2014. Available at: http://www2.census.gov/
adrm/fesac/2014-06-13_day.pdf (accessed October 2016).
Christelis, D., T. Jappelli, and M. Padula. 2010. “Cognitive Abilities and Portfolio
Choice.” European Economic Review 54: 18–38. Doi: http://dx.doi.org/10.1016/j.
euroecorev.2009.04.001.
Commission of the European Communities. 2009. “Commission Regulation (EC) No
1022/2009 of 29 October 2009 amending Regulations (EC) No 1738/2005, (EC) No
698/2006 and (EC) No 377/2008 as regards the International Standard Classification of
Occupations (ISCO).” Official Journal of the European Union, L 283/3, 30 October
2009. Available at: http://eur-lex.europa.eu/legal-content/EN/TXT/PDF/?uri=CE-
LEX:32009R1022&from=EN (accessed October 2016).
DESA. 2010. “Handbook on Population and Housing Census Editing.” Revision 1, Series
F, No 82 (Studies in Methods (Ser. F)), United Nations Statistics Division. New York:
United Nations Publication. Available at: http://unstats.un.org/unsd/publication/
SeriesF/seriesf_82rev1e.pdf (accessed October 2016).
Elias, P., K. Halstead, and K. Prandy. 1993. Computer-Assisted Standard Occupational
Coding. London: HMSO.
Elias, P. 1997. “Occupational Classification (ISCO-88). Concepts, Methods, Reliability,
Validity and Cross-National Comparability.” OECD Labour Market and Social Policy
Occasional Papers No. 20, OECD Publishing. Doi: http://dx.doi.org/10.1787/
304441717388.
Belloni et al.: Occupational Coding: Measure and Detect Errors 943
Brought to you by | Università degli Studi di MilanoAuthenticated
Download Date | 11/24/16 11:34 AM
Ellison, R. 2014. Demonstration of Performance of CASCOT 5.0. Presentation held at the
CASCOT: Occupational Coding in Multi-national Surveys Workshop, 10–11 April 2014,
Venice. Available at: http://dasish.eu/dasishevents/cascotworkshop/programmepres/
(accessed 15 April, 2014).
Feenstra, R.C. and G.H. Hanson. 1996. “Globalization, Outsourcing, and Wage
Inequality.” American Economic Review 86: 240–245. Available at: http://www.
jstor.org/stable/2118130.
Fletcher, J.M., J.L. Sindelar, and S. Yamaguchi. 2011. “Cumulative Effects of Job
Characteristics on Health.” Health Economics 20: 553–570. Doi: http://dx.doi.org/
10.1002/hec.1616.
Ganzeboom, H. 2008. Occupation Coding: Do’s And Dont’s. Version 2, 2 August 2008.
Available at: http://www.gesis.org/fileadmin/upload/dienstleistung/daten/umfragedaten/
issp/members/codinginfo/ISCO-coding_dos_donts_HG2008.pdf (accessed October
2016).
Goos, M. and A. Manning. 2007. “Lousy and Lovely Jobs: The Rising Polarization of
Work in Britain.” Review of Economics and Statistics 89: 118–133. Doi: http://dx.doi.
org/10.1162/rest.89.1.118.
Hartog, J. 2000. “Over-Education and Earnings: Where Are We, Where Should We Go?”
Economics of Education Review 19: 131–147. Doi: http://dx.doi.org/10.1016/
S0272-7757(99)00050-3.
Hoffmann, E., P. Elias, B. Embury, and R. Thomas. 1995. What Kind Of Work Do You Do?
Data Collection and Processing Strategies When Measuring “Occupation” for Statis-
tical Surveys and Administrative Records. ILO working paper, N.95-1. Geneva: ILO.
Available at: http://www.ilo.org/global/statistics-and-databases/WCMS_087880/
lang–en/index.htm (accessed October 2016).
Jackle, A. 2008. “Dependent Interviewing: Effects on Respondent Burden and Efficiency
of Data Collection.” Journal of Official Statistics 24: 411–430.
Jones, R. and P. Elias. 2004. “CASCOT: Computer-Assisted Structured Coding Tool.”
Coventry: Warwick Institute for Employment Research, University of Warwick.
ILO. 2014. ISCO: International Standard Classification of Occupations. Available at:
http://www.ilo.org/public/english/bureau/stat/isco/ (accessed 3 October, 2016).
ILO. 2012. International Standard Classification of Occupations: Structure, Group
Definitions and Correspondence tables. Vol. 1. Geneva: ILO. Available at: http://
www.ilo.org/wcmsp5/groups/public/ –– dgreports/ –– dcomm/ –– publ/documents/
publication/wcms_172572.pdf (accessed October 2016).
ILO. 2010. Measuring the Economically Active in Population Censuses: A Handbook.
Studies in Methods Series F, No. 102. New York: ILO and UN.
Leist, A.K., M.M. Glymour, J.P. Mackenbach, F.J. van Lenthe, and M. Avendano. 2013.
“Time Away from Work Predicts Later Cognitive Function: Differences by Activity
During Leave.” Annals of Epidemiology 23: 455–462. Doi: http://dx.doi.org/10.1016/j.
annepidem.2013.05.014.
Leuven, E. and H. Oosterbeek. 2011. “Overeducation and Mismatch in the Labor Market.”
In Handbook of the Economics of Education, edited by E. Hanushek, S. Machin and
L. Woessmann, 283–326. Amsterdam: Elsevier.
Journal of Official Statistics944
Brought to you by | Università degli Studi di MilanoAuthenticated
Download Date | 11/24/16 11:34 AM
MEA. 2013. SHARE Release Guide 2.6.0. Waves 1 & 2. Munich: publisher. Available at:
Munich Center for the Economics of Ageing (MEA) at the Max Planck Institute for
Social Law and Social Policy (MPISOC) publishing. (accessed October 2016).
Moscarini, G. and K. Thomsson. 2007. “Occupational and Job Mobility in the US.” The
Scandinavian Journal of Economics 109: 807–836. Doi: http://dx.doi.org/10.1111/j.
1467-9442.2007.00510.x.
Perales, F. 2014. “How Wrong Were We? Dependent Interviewing, Self-Reports and
Measurement Error in Occupational Mobility in Panel Surveys.” Longitudinal and Life
Course Studies 4: 299–316. Doi: http://dx.doi.org/10.14301/llcs.v5i3.295.
Ravesteijn, B., H. van Kippersluis, and E. van Doorslaer. 2013. The Wear and Tear on
Health: What is the Role of Occupation? Tinbergen Institute Discussion Paper 13-143.
Amsterdam: Tinbergen Institute. Available at: http://papers.tinbergen.nl/13143.pdf
(accessed October 2016).
Rose, D. and E. Harrison. 2007. “The European Socio-Economic Classification: A New
Social Class Schema For Comparative European Research.” European Societies 9:
459–490. Doi: http://dx.doi.org/10.1080/14616690701336518.
Tijdens, K.G. 2014a. “Drop-Out Rates During Completion of an Occupation Search Tree
in Web-Surveys.” Journal of Official Statistics 30: 23–43. Doi: http://dx.doi.org/
10.2478/jos-2014-0002.
Tijdens, K.G. 2014b. Reviewing the Measurement and Comparison of Occupations Across
Europe. AIAS Working Paper 149. Amsterdam: University of Amsterdam. Available
at: http://dare.uva.nl/record/1/432281 (accessed October 2016).
United Nations. 2007. “Updating the International Standard Classification of Occupations
(ISCO): Summary of major changes between ISCO-88 and ISCO-08 (Feb 2007 draft).”
Paper for discussion by the Expert Group on International Economic and Social
Classifications, New York, 16–18 April 2007. Available at: http://unstats.un.org/unsd/
class/intercop/expertgroup/2007/AC124-11.PDF (accessed October 2016).
United Nations (UN). 2014. National Classifications. Available at: http://unstats.un.org/
unsd/cr/ctryreg/ctrylist2.asp (accessed March 2015).
Westerman, S. 2014. “CBS and CASCOT: tuning CASCOT for improved performance.”
Presentation held at the CASCOT: Occupational Coding in Multi-national Surveys
Workshop, 10–11 April 2014, Venice. Available at: http://dasish.eu/dasishevents/
cascotworkshop/programmepres/ (accessed 15 April, 2014).
Wilcoxon, F. 1945. “Individual Comparisons by Ranking Methods.” Biometrics 1: 80–83.
Available at: http://www.jstor.org/stable/3001968.
Wooldridge, J.M. 2010. Econometric Analysis of Cross Section and Panel Data.
Cambridge, MA: MIT Press.
Received December 2014
Revised April 2016
Accepted July 2016
Belloni et al.: Occupational Coding: Measure and Detect Errors 945
Brought to you by | Università degli Studi di MilanoAuthenticated
Download Date | 11/24/16 11:34 AM