Embed Size (px)
Citation preview

WP-2015-08
Measuring and Evaluating Energy Security and Sustainability:
A Case Study of India
B.Sudhakara Reddy
Indira Gandhi Institute of Development Research, Mumbai
April 2015
http://www.igidr.ac.in/pdf/publication/WP-2015-08.pdf

Measuring and Evaluating Energy Security and Sustainability:
A Case Study of India
B.Sudhakara Reddy
Indira Gandhi Institute of Development Research (IGIDR)
General Arun Kumar Vaidya Marg
Goregaon (E), Mumbai- 400065, INDIA
Email(corresponding author): [email protected]
Abstract
The imperative for energy security is paramount for global, national and internal stability and
development. Using an indicator-based approach, the present study develops a framework for
sustainable energy security of India. First, it presents the energy supply and demand situation in the
country under different scenarios. Then it conceptualizes the notion of energy security and quantifies it
for India with the help of different indicators for energy security available in the literature. Both the
supply and demand side views and both micro and macro dimensions are considered in assessing how
secured India as a country is with respect to our energy future. The dimensions that include energy
security are: economic, environmental, social and institutional. This will help planners and policy
makers to understand India's energy scene better and design policies to develop sustainable technologies
and practices to ensure energy resources last long.
Keywords: energy, development, indicator, security, sustainability
JEL Code: P28, Q41, Q42, Q48
India’s Energy Transition—
Securing Power for a Sustainable Future
B. Sudhakara Reddy
Abstract
The imperative for energy security is paramount for global, national and internal stability
and development. Using an indicator-based approach, the present study develops a
framework for sustainable energy security of India. First, it presents the energy supply and
demand situation in the country under different scenarios. Then it conceptualizes the notion
of energy security and quantifies it for India with the help of different indicators for energy
security available in the literature. Both the supply and demand side views and both micro
and macro dimensions are considered in assessing how secured India as a country is with
respect to our energy future. The dimensions that include energy security are: economic,
environmental, social and institutional. This will help planners and policy makers to
understand India’s energy scene better and design policies to develop sustainable
technologies and practices to ensure energy resources last long.
Keywords: energy, development, indicator, security, sustainability
1. Introduction
Sustainable energy security1 is one of the major concerns of countries interested in governing
the multi-faceted issue of development. Measuring security requires the identification of its
relevant dimensions and indicators which can capture its diverse aspects. The assessment of
sustainability is then crucial to most of the stakeholders, as it allows measuring progress,
identifying policy areas to be addressed and evaluating the outcome of implemented policies.
Energy security plays an important role in human empowerment. The correlation
between energy and development suggests a two-way causation between them. Higher energy
use enhances production, promotes economic growth and improves standard of living―all
symbols of development―which in turn leads to greater energy consumption. In addition,
consumption and production of energy also play a major role in several sustainability issues
such as climate change, depletion of natural resources and indoor and outdoor local air
pollution (Ruijven, 2008). In short, for stability―global, national and internal—and
development, the need for energy security is paramount.
Energy security includes supply as well as demand-side security. Supply security for a
country means the country’s ability for efficient generation and production of energy from
1 We define sustainable energy security as “provisioning of uninterrupted energy services (short and long terms)
in an affordable, equitable, efficient and environmentally benign manner”.

diversified sources which include renewables. This requires development of new energy
sources and ensures ownership or control of such sources within and outside the country.
Demand side energy security means universal provision of energy services, which is
accessible and affordable to consumers. This involves equitable and efficient distribution and
effective conversion from final to useful energy through appropriate practices and end-use
technologies. Both supply and demand security necessitate environmental compliance which
otherwise cannot be sustained in the long run.
Energy security has an international character. As a concern, it first surfaced in 1973,
with the OPEC oil embargo. The initial stage of energy security was linked to the volatile
Middle East. However, over time, other issues like regional cooperation and cross-border
trade gained prominence. Recently, energy security has drawn high priority policy attention
stirred by high oil prices and geo political tensions (Kruyt et al., 2009). The incessant spurt in
oil prices, until the end of 2008, is due to rapid increase in energy demand in Asia and
underinvestment in energy supply and concerns about stability of countries where significant
oil and gas reserves are concentrated. For example, geopolitical tensions such as Iraq war in
2003 and gas dispute between Russia and Ukraine in 2005–06 led to supply disruptions
(Löschel et al, 2010).
Energy security, as a policy concept, has evolved over a period of time. Narrow
definitions of energy security are criticized for being only about oil (neglecting other energy
carriers), primary fuel (neglecting conversion technologies), and imports (neglecting
domestic infrastructure) (Sauter and MacKerron, 2008). Though energy security is a high
priority issue on the political and scientific agenda of industrialized and developing
economies (Löschel et al, 2010), it is more of a concern for the latter for the following
reasons. Firstly, developing countries are likely to account for about two-thirds of increase in
energy use and three-fourths of increase in CO2 emissions during 2010–2030 (IEA, 2012).
Secondly, the prevailing energy poverty in these countries is presenting a critical challenge of
achieving human development. About 2.4 billion people from these countries have no or
unreliable access to electricity and about 3.5 billion rely on solid fuels for cooking energy
needs. And for the poor among those who have access, the recent increase in energy prices
has put pressure on their affordability (Ruijven, 2008). Thirdly, developing countries are a
subject of concern worldwide for their high climate-change vulnerability. In the coming
decades, it is predicted that billions of people from these regions will face shortages of water
and food, and greater risks to health and life as a result of climate change (UNFCCC, 2007).
So, the energy security policy for developing countries needs careful appraisal.
India, being a developing economy, faces multifaceted challenge, with energy insecurity
at both supply and demand sides (Reddy and Nathan 2010). On supply side, it is heavily
dependent on world oil markets as more than 70 per cent of the oil consumed in India is
imported indicating a high strain on foreign exchange reserves (BP, 2012). India also suffers
from energy deficit of 12.3 per cent (CEA, 2012). As per the estimates of IEA (2012), India
will be the third largest emitter in the world by 2015 and the third largest oil importer by
2030, behind China and USA. Nearly, 0.4 billion people in India, i.e., 45.1% of rural and 7.8%
of urban households do not have access to electricity. There is an imperative need to reduce
dependence on fossil fuel, to secure supply of adequate eco-friendly alternatives and improve
the energy infrastructure to provide quality; and reliable energy services to the needy at
affordable price.
Measuring sustainable energy security requires identification of its relevant dimensions
and a set of indicators which can capture its diverse aspects. A comprehensive assessment of
these indicators allow us to study the current situation, find the gaps, and provide policy
makers important insights and directions to facilitate the decision-making process. The
present study develops an indicator-based analytical framework for appraising the current
energy security status of India and future prospects for it. It uses the normalization procedure
and describes the indicators’ highest and lowest values. In the process it develops a four-
dimensional measure to assess sustainable energy security. This approach could be used to
create awareness among policy makers, benchmark indicators, monitor changes and
contribute to policy formulation.
2. India’s energy trajectory
Table 1 presents the final energy use by sector for each of the major fuels. Almost all of the
coal used in India is used for electricity generation. The transport sector dominates the use of
oil products, accounting for slightly less than half of oil products use. The industrial sector is
currently the major end-user of coal, mainly for power generation. Industry also accounts for
about 40 per cent of electricity use, with residential, agricultural and commercial sectors
accounting for most of the balance of electricity demand. Overall, 34.17 per cent of the total
final energy demand is by industrial sector, 26.8 per cent by residential, 13.72 per cent by
transport sector and 17.05 for other uses.
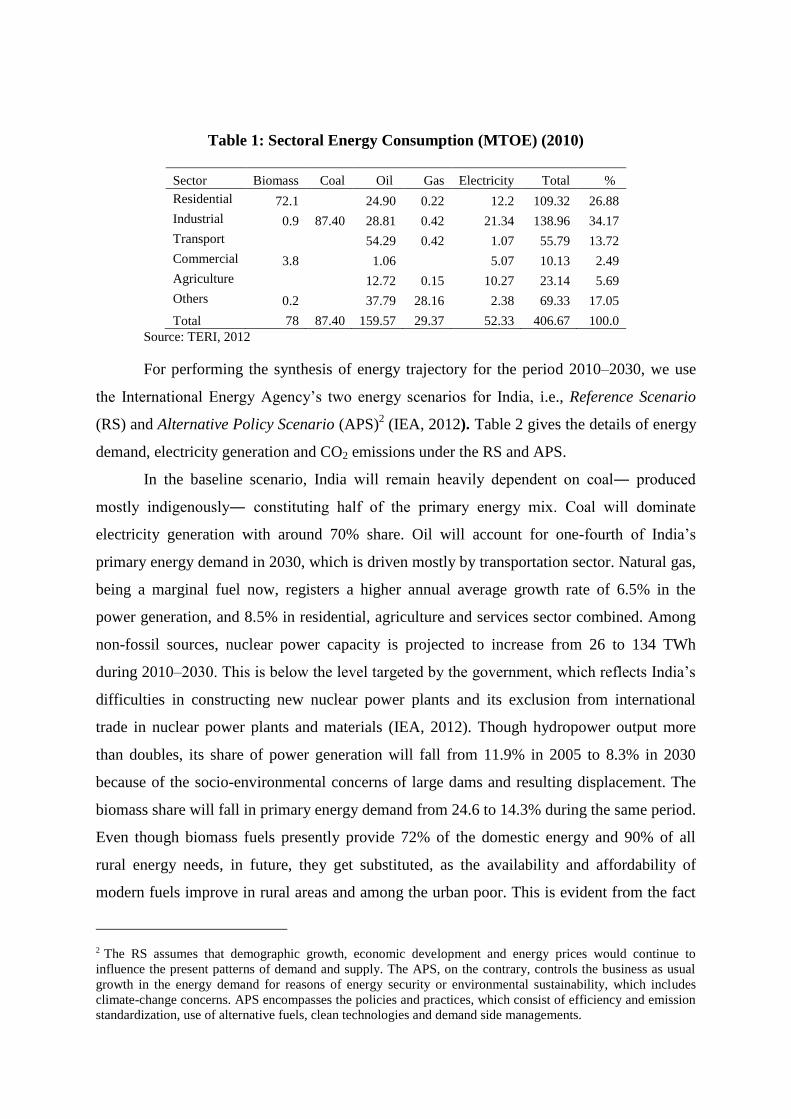
Table 1: Sectoral Energy Consumption (MTOE) (2010)
Sector Biomass Coal Oil Gas Electricity Total %
Residential 72.1
24.90 0.22 12.2 109.32 26.88
Industrial 0.9 87.40 28.81 0.42 21.34 138.96 34.17
Transport
54.29 0.42 1.07 55.79 13.72
Commercial 3.8
1.06
5.07 10.13 2.49
Agriculture
12.72 0.15 10.27 23.14 5.69
Others 0.2
37.79 28.16 2.38 69.33 17.05
Total 78 87.40 159.57 29.37 52.33 406.67 100.0
Source: TERI, 2012
For performing the synthesis of energy trajectory for the period 2010–2030, we use
the International Energy Agency’s two energy scenarios for India, i.e., Reference Scenario
(RS) and Alternative Policy Scenario (APS)2 (IEA, 2012). Table 2 gives the details of energy
demand, electricity generation and CO2 emissions under the RS and APS.
In the baseline scenario, India will remain heavily dependent on coal― produced
mostly indigenously― constituting half of the primary energy mix. Coal will dominate
electricity generation with around 70% share. Oil will account for one-fourth of India’s
primary energy demand in 2030, which is driven mostly by transportation sector. Natural gas,
being a marginal fuel now, registers a higher annual average growth rate of 6.5% in the
power generation, and 8.5% in residential, agriculture and services sector combined. Among
non-fossil sources, nuclear power capacity is projected to increase from 26 to 134 TWh
during 2010–2030. This is below the level targeted by the government, which reflects India’s
difficulties in constructing new nuclear power plants and its exclusion from international
trade in nuclear power plants and materials (IEA, 2012). Though hydropower output more
than doubles, its share of power generation will fall from 11.9% in 2005 to 8.3% in 2030
because of the socio-environmental concerns of large dams and resulting displacement. The
biomass share will fall in primary energy demand from 24.6 to 14.3% during the same period.
Even though biomass fuels presently provide 72% of the domestic energy and 90% of all
rural energy needs, in future, they get substituted, as the availability and affordability of
modern fuels improve in rural areas and among the urban poor. This is evident from the fact
2 The RS assumes that demographic growth, economic development and energy prices would continue to
influence the present patterns of demand and supply. The APS, on the contrary, controls the business as usual
growth in the energy demand for reasons of energy security or environmental sustainability, which includes
climate-change concerns. APS encompasses the policies and practices, which consist of efficiency and emission
standardization, use of alternative fuels, clean technologies and demand side managements.

that the share of biomass in domestic energy use declines from *% to below 50% by 2030.
Among the renewable sources, wind registers a significant growth with its share of electricity
generation rising from just under 0.2% to 1.9%.
Table 2: Energy demand, electricity generation and CO2 emissions under RS and APS
Source 2010
New Policies Scenario
(CPS) 450 ppm Scenario (450)
Change
(450~CPS) in
2030 (%) 2020 2030 AGR* 2020 2030 AGR*
Total primary energy demand (MTOE)
Coal 283 478 701 4.6 371 330 0.8 –52.9
Oil 166 225 322 3.4 210 279 2.6 –13.4
Gas 53 77 113 3.9 81 123 4.3 8.8
Nuclear 7 20 35 8.4 21 67 12 91.4
Hydro 10 15 21 3.8 17 39 7 85.7
Biomass and
waste 170 190 201 0.8 191 215 1.2 7
Other renewables 2 9 15 10.6 12 36 15.5 140
TOTAL 691 1013 1407 3.6 904 1089 2.3 –22.6
Electricity Generation (TWh)
Coal 653 1207 1916 5.5 895 692 0.3 -63.9
Oil 26 28 23 -0.6 17 10 -4.7 -56.5
Gas 118 212 349 5.6 253 415 6.5 18.9
Nuclear 26 77 134 8.5 82 257 12.1 91.8
Hydro 114 173 239 3.8 196 454 7.2 90
Biomass and
waste 2 17 54 17.9 25 113 22.3 109.3
Wind 20 63 100 8.4 88 196 12.1 96
Geothermal 0 0 1 1 2 100
Solar 0 22 48 30 119 147.9
Tide and Wave 0 0 0 0 1
CSP 3 22
TOTAL 960 1799 2864 5.6 1590 2280 4.4 –20.4
CO2 emissions (Mt)
Coal 1093 1824 2648 4.5 1404 1100 0 –58.5
Oil 429 588 880 3.7 544 743 2.8 –15.6
Gas 113 167 251 4.1 177 270 4.5 7.6
TOTAL 1635 2579 3779 4.3 2125 2113 1.3 –44.1
AGR is Average Annual Compounded Growth Rate (%) during 2010–2030;
Source: IEA (2012)
Under the alternative policy scenario, there is a reduction in demand of about one-
sixth for primary energy and electricity generation in 2030 as compared to reference scenario.
The corresponding decrease in CO2 emission is 27%. There is a reduction in the share of all
conventional fossil-fuel resources in primary energy in 2030, with share of coal going down
by one-third and so is coal-related CO2 emission. This is achieved through efficiency
improvement of coal based plants through renovation and modernization, and deployment of
new technologies. Electricity supply improves not only because of efficient production but

also due to reduction in transmission and distribution losses. The demand also lowers because
of efficiency improvements in appliances, lighting and air-conditioning equipment. Similarly,
introduction of emission standards in vehicles and expanded use of bio-fuels and CNG, and
improved public transport system bring a reduction of 17% in share of oil. Unlike coal and oil,
natural gas increases its share in final energy due to its high quality, convenience of use and
environmental benefits. Among non-fossil fuels, nuclear power is clearly emerging as an
option. Both hydro and nuclear will command more than 40% increase in demand under APS
in 2030 compared to RS. Biomass use increases in industry and transport sector for its use in
combined heat and power plants (CHP) and production of biofuels respectively. The share of
other renewable energy sources will increase in primary energy as a result of policies to
control pollution and lower greenhouse gas emissions. Among solar, biomass, and wind-
based power generation, solar has the highest average annual growth rate, close to 40%,
followed by bio- and wind power, which will grow at 16% and 13%, respectively.
3. Indicators of security and sustainability
Indicators can play an important role in turning data into relevant information for policy
makers and help in decision-making. They also simplify a complex and large information
base. In this way, the indicators provide a “synthesis” view of existing situation. The
indicators have become well established and are widely used in diverse fields and at various
levels, viz., global, regional, national and local (Anon, 2000). Examples of indicators include
such measurements as GDP (Gross Domestic Product) as a way of assessing economic
development in a country, the infant mortality rate (IMR) as an indicator of the health status
of a community, or the rise in carbon emissions as a way of estimating the environmental
conditions of a region. The selection criteria for the construction of indicators include factors
such as transparency, scientific validity, robustness, sensitivity and the extent to which they
are linkable to each other. The applicability of the criteria depends on the indicator in
question, and the purpose of the indicator to be used. However, no single set of criteria will
be applicable to all indicators and all situations since each have priorities for data collection
and analysis.

In literature, there are multiple ideations for sustainable energy security3
measurements and there is no single indicator. Indicators are highly context-specific and are
based on notions of diversity, import dependency, political stability, market liquidity, etc.
(Kruyt et al, 2009). Some indicators address just energy security whereas others capture
several aspects of sustainability. However, multiple indicators are applied here for broader
understanding for sustainable energy security. While using indicators to quantify energy
security, we have considered the two dimensions of energy security, namely, supply security
and demand security. The indicators linked to supply security attempts to measure the
adequacy, reliability, quality and guarantee aspects of energy resources and carriers. This has
been in the context of geographical, temporal, production capacity, climate change, economic
and diversity considerations. On the other hand, the energy demand security has been
attempted to measure from the consumer’s perspective. The indicators used for this purpose
attempt to measure the capacity of the energy system as a whole to meet the basic needs of
the weakest section of the population. The underlying logic is that the energy system can
hope to meet the lowest energy needs only after meeting the demands above that. In other
words, the indicators under energy demand security measure the extent of energy deprivation.
The notion of sustainable energy security applied here is a “four-dimensional” one.
Each dimension has various indicators. This framework sees sustainability not only in
economic, environmental, and social terms but also intuitional dimension. This is because
governance and institutions are inextricably related and are paramount to project the current
status of any system and convert it into a more desirable one in future. The role of institutions
is to make decisions that result in energy security while the individuals who run institutions
determine the degree of sustainability. Our conceptualisation of sustainable eenergy security
quantifies performance providing clear and compelling measures of key variables in economy,
environment, social systems, and institutions/governance. For example, environment
performance includes things such as the concentration of different pollutants in the air and the
amount of resources, such as water and electricity consumed. Social performance includes
factors such as affordability, while economic dimension involves issues such as reserve-to-
production ratio.
3In case of energy security, it is important to include energy sustainability. This is because the concepts of
sustainability takes into consideration the sustainable use of natural resources, the sustainable distribution of
natural resources (equity considerations) and maximising the quality of life.
4. Methodology adopted
For the present study, we try to identify the proper performance indicators which reflect
different aspects of security and sustainability. It is important that, as far as possible,
indicators should be quantitative; however, for some aspects of security, qualitative
descriptions may be more appropriate (e.g. institutional aspects). The next step in selection is
to understand which dimensions of security and sustainability should be considered. An in-
depth literature survey has been carried out to enable us in identifying the indicators. The
next step is to link energy security and sustainability which include indicators belonging to
the following dimensions—Economic, Social, Environmental and Institutional/Governance.
In this context, it is critical to derive the extent of contributions made by each of the
dimensions to the overall energy security and sustainability. Simplest assumption is that all
the dimensions contribute equally to security and sustainability and all the indicators
contribute equally to the dimensions. In other words, it means that all the indicators and
dimensions will have equal weights assigned to them. For each dimension, indicators of
performance (positive or negative) are considered from the perspective of security and
sustainability (indicators whose increasing value has a positive impact while the opposite is
true for negative). For example, for certain indicators (e.g., reserve-to-production ratio), an
increasing value reflects a positive effect on security and sustainability and for some (e.g., per
capita emissions), a negative effect on sustainability. Hence it is important to categorize
indicators from this view point for the analysis (Damjan and Peter, 2005).
The criteria for selection of indicators include considerations of data availability and
feasibility to collect additional data considered essential to the development of important
indicators in future. The indicators are quantified by analyzing extensively the data collected,
mostly from secondary sources. The threshold values representing bench marks (maximum
and minimum values of countries) are also obtained. Each indicator is evaluated separately
and is benchmarked to values that indicate high and low levels of performance in absolute
terms. To aggregate indicators, it is necessary to assign a weight, to determine their relative
importance to the final composite index. Here, we use Equally Weighted Average (EWA), in
which all indicators are given the same weight which is considered to be the most transparent
methodology (Yale Center for Environmental Law and Policy, 2005).
Different indicators are expressed in different units and hence they cannot be used in
the original units for the calculation of indices and to arrive at the security and sustainability
index. For this purpose, normalization procedure is used. For the present study, normalization
has been done using the following equations.
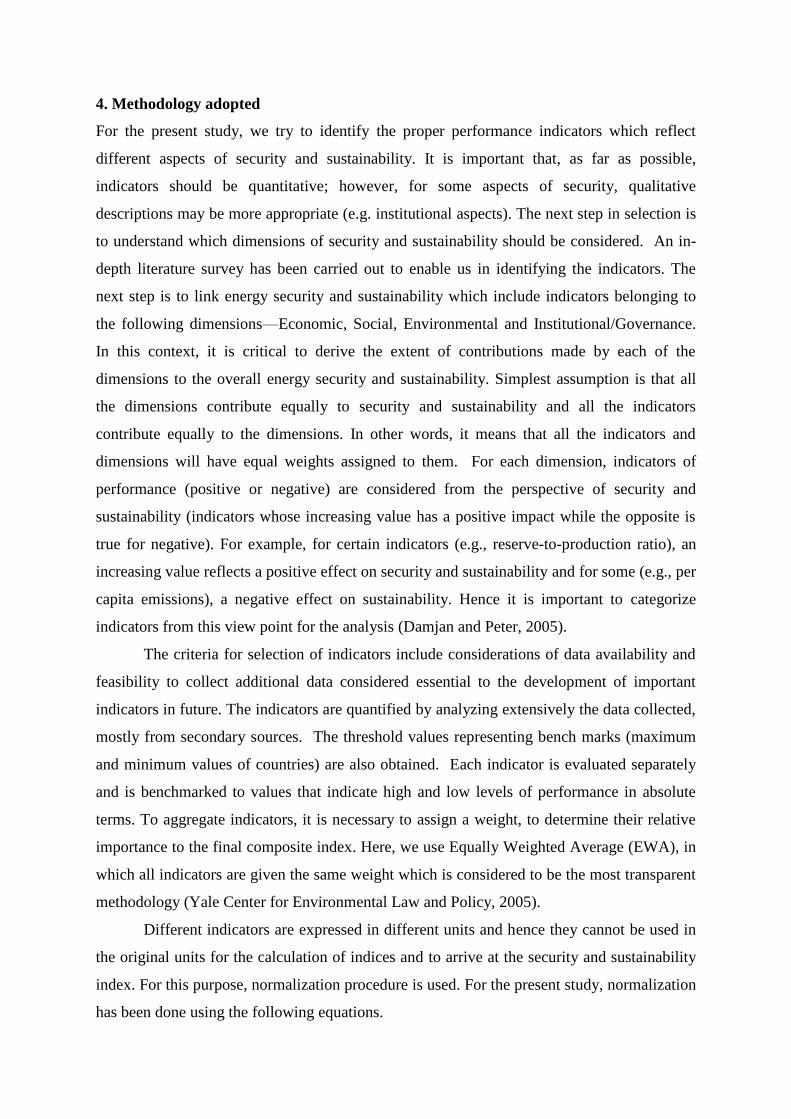
First, each dimension, indicators should be oriented in such a way that more desirable
outcomes receive a higher (positive) value and less desirable outcomes receive a lower
(negative) value.
For a positive effect indicator the equation used is
di,j= (Ai,j − ai,j)/( (bi,j − ai,j) (1)
and for a negative effect it is
di,j= (bi,j − Ai,j)/( (bi,j − ai,j) (2)
where
Ai,j = Actual value
ai,j = Minimum threshold value
bi,j = Maximum threshold value
di,j = Normalized value of the dimension indicator
The calculation of the aggregate index is a step-by-step procedure of grouping various
basic indicators into the dimension index. To obtain this index the following equation has
been used (Petrosyan, 2010).
(
∑
)
0.5 (3)
where, dj = Dimension of type “j”
Vij = Variables “i” belonging to dimension “j”, i = 1, 2, …., I
I = Number of variables in a dimension
Finally, the dimension indices are combined into the composite sustainable energy security
index using the following equation:
(∑
)
0.5 (4)
where, SESI = Sustainable energy security index
dj = Dimension “j”, j = 1, 2, …., J
J = Number of dimensions
This is an easy approach given that it normalizes indicators to an identical range [0, 1], where
higher scores represent better achievement. Also, the re-scaling widens the range of an
indicator. For many indicators such as efficiency, the minimum and maximum values needed

for the re-scaling are determined based on “natural” minimum and maximum values instead
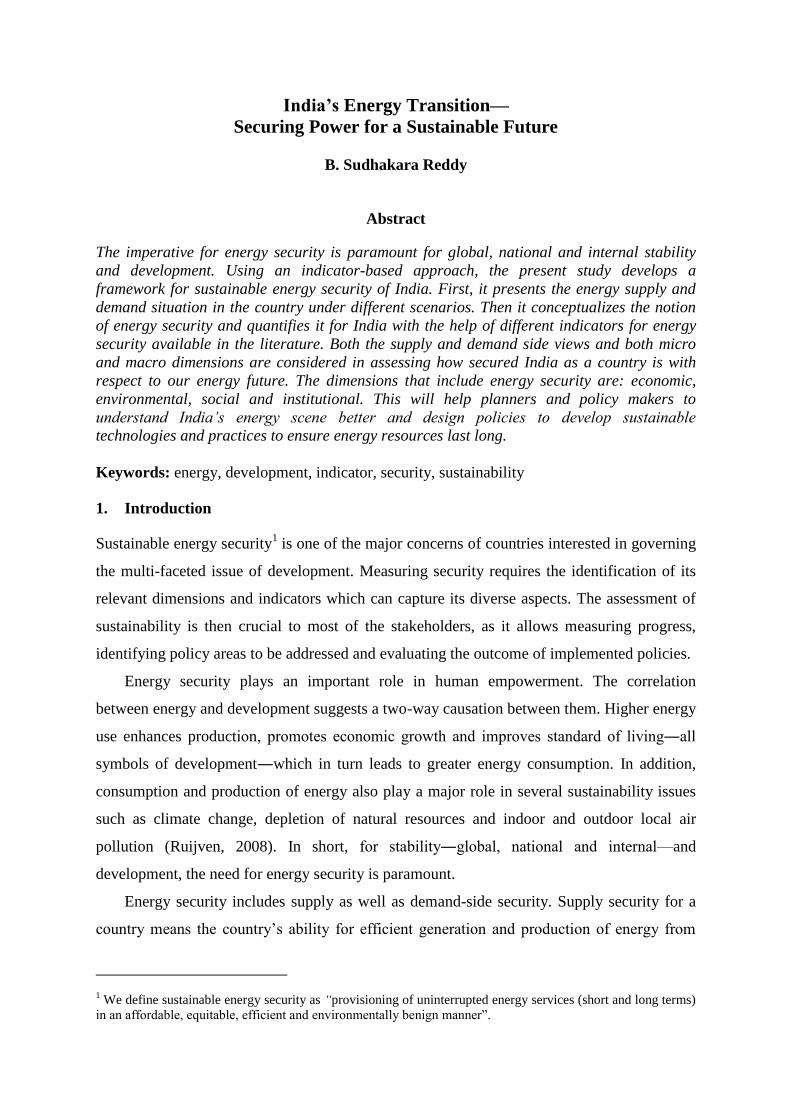
of observed ones. Figure 1 shows the methodology used to estimate the sustainable energy
security index.
Selection
Dimension
Judging
Weighting
Normalizing
Sub-indices
Combining
Figure 1: Developing SESI
5 Results
5.1 Economic Dimension
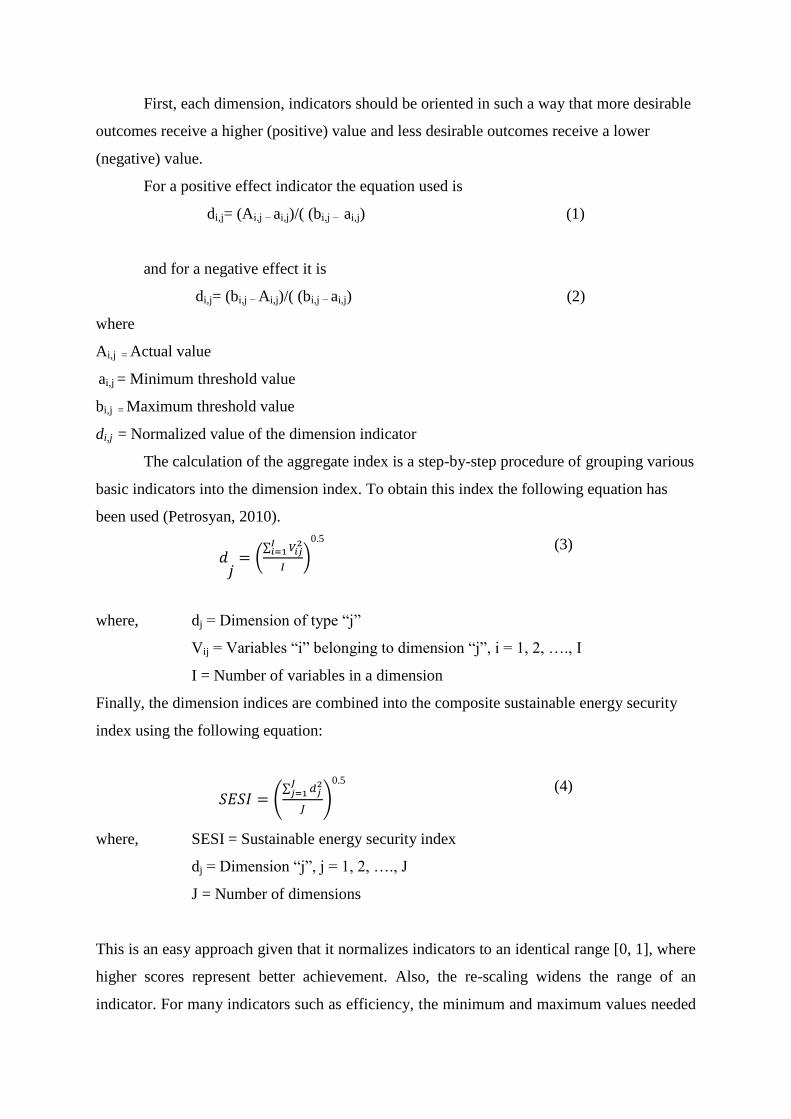
Table 3 shows indicators pertaining to economic dimension. The availability of resources and
the reliability of their supply are essential for a sustainable economic growth. All sectors of
the economy including residential, commercial, transportation, service and agricultural
sectors depend on secure, sufficient and efficient energy services. Job availability, industrial
productivity, urban and rural development and all major economic activities are strongly
affected by energy input. Electricity is an important and sometimes irreplaceable input to
modem productive activities, communication, dissemination of information and other service
industries. The energy indicators in the economic dimension consider two themes of
production and utilisation patterns, and security of supply. Within the theme of production
and consumption patterns the following sub-themes are addressed: overall use and
Sustainability indicators
Economic Institutional Social Environmental
Positive Indicators Negative indicators
Indicator Weights
Normalized indicators
Institutions Social Environment Economic
Composite energy security and sustainability index

productivity, supply efficiency, production, end-use, diversification (fuel mix) and prices.
The security theme includes dependency on imports and strategic fuel stocks. Efficiencies
and intensities are important issues affecting energy systems and define sustainability trends.
By reducing quantities of energy consumed, improvements in energy efficiencies translate
into progress towards sustainable development since investments in energy infrastructure and
expenses in fuel costs can be reduced.
The diversification of energy sources, in terms of both reserves and utilisation, is the
most important criterion for enhancing energy security. In the category of supply security, the
RP ratio for coal is the highest at 111 years, while the figures for oil and gas are 21 and 23.
The import dependence of India for RS and APS show that the country will continue to have
high import dependency even under APS.
The total energy consumption in 2010 was 530 MTOE. The share of coal is the
highest with 47% followed by oil and biomass with 27 and 15 per cent, respectively. Import
dependence is often considered as a risk to energy security. The oil import dependency is
very high with 70% and in total imports the share of energy is one third. Access to modern
energy services is limited to LPG (11% of total households) while more than 90% of the
population has access to grid electricity.
There is a direct correlation between energy consumption and economic growth.
Energy intensity provides insights into the efficiency and of energy use (how much energy is
used to produce a dollar of economic output). The intensity of the society, economy and the
sectors reflect the stages of economic development. The energy intensity of India is about
190 (toe/US$ million, ppp) while that of the society is 24 GJ/cap.
There are significant technical and non-technical losses in generating and transmitting
electricity. The reported losses for coal-based power generation are more than 70% while the
T&D losses for electricity are about 30%. Similarly the utilization efficiency of biomass as
well as kerosene stoves is very low.
An average Indian consumes about 170 kg of biomass, 173 l of oil and about 500
kWh of electricity per annum which is significantly less than the world average underlining
the significant lack of access to modern energy services, which is a key reason for slow
economic growth. The taxes for oil products are very high in India. These are 48% for petrol
and 34% for diesel. To rationalize energy use the government is phasing out energy subsidies
which are about 1% of the total GDP.
Table 3 Sustainable energy security indicators—Economic dimension
Category Subcategory Indicator Unit Value
Supply
Security
Total primary energy
consumption per capita
Coal kgoe 500
Oil bbl/day 1,000 people 3
Gas M3 54
Reserves-to-production
ratio
Coal Yrs. 111
Oil Yrs. 21
Gas Yrs. 23.3
Import Dependence
Share of energy imports % 33
Share of oil imports % 70
Oil vulnerability index No 0.93
Fuel imports as a % of GDP % 5.9
Supply infrastructure
Villages connected to grid % 92
Villages with LPG connection % 11
Villages with road connectivity % 62
Diversifi-
cation
Fuel share in primary
energy
Biomass % 24
Coal % 38
petroleum products % 26
Natural gas % 7
Renewable energy % 30
Fuel share in final
energy
Biomass % 31
Oil % 20
Electricity % 13
Share of fossil fuels in power generation % 76
Share of fossil fuel in installed capacity % 78
Locally produced fuel (biofuel or fossil fuel) % 70
Renewable energy as a % of total electricity supply % 12.5
Energy
intensity
National energy
intensity
Energy intensity of society (final energy use/cap) GJ/cap 24
Energy intensity of economy (energy use/GDP) toe/$ million (ppp) 190
Sectoral energy
intensity
Industry koe/$ (ppp) 0.04
Commercial koe/$ (ppp) 0.06
Agriculture koe/$(ppp) 0.09
Passenger transport MJ/PKM 1.4
Goods transport MJ/ton-km 3
Energy
Efficiency
Energy production
efficiency
Coal-based power plants % 27
Gas-based power plants % 39
Hydro-power plants % 80
Renewable power % 15
Oil refineries % 75
Energy
Transmission/transport
efficiency
Power grid efficiency (T&D) % 78
Efficiency of oil distribution system % 80
Coal Transport efficiency % 70
Energy end-use
efficiency (HH sector)
Biomass stove efficiency % 15
Kerosene stove efficiency % 30
LPG stove efficiency % 70
Electrical appliance efficiency % 75
Energy
consumpt-ion
Final energy
consumption
Biomass kg/cap 170
Oil l/cap 173
Natural gas cu.m/cap 54
Electricity kWh/cap 498
Taxes and
subsidies
Energy taxes
Taxes as share of petrol price % 48
Taxes as share of diesel price % 34
Taxes as share of electricity price % 15
Energy S
subsidies
Diesel subsidies as a % of GDP % 1
Kerosene subsidies as a % of GDP % 0.6
Electricity subsidies as a % of GDP % 1
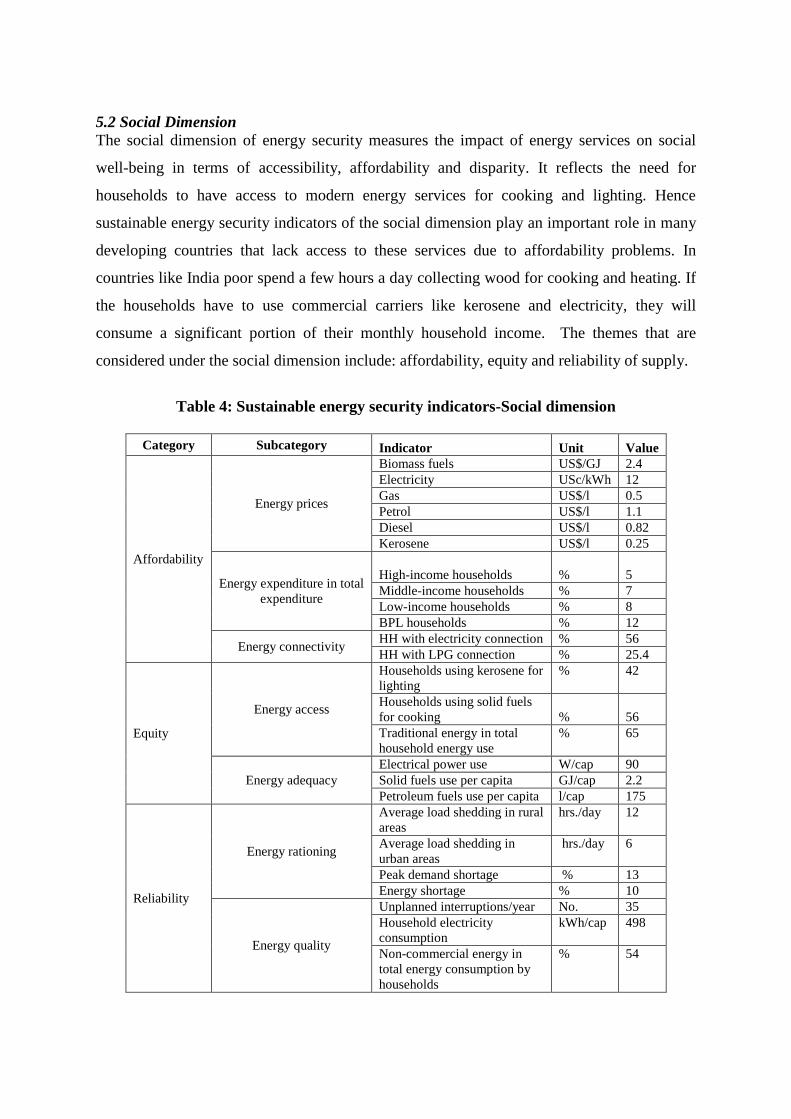
5.2 Social Dimension
The social dimension of energy security measures the impact of energy services on social
well-being in terms of accessibility, affordability and disparity. It reflects the need for
households to have access to modern energy services for cooking and lighting. Hence
sustainable energy security indicators of the social dimension play an important role in many
developing countries that lack access to these services due to affordability problems. In
countries like India poor spend a few hours a day collecting wood for cooking and heating. If
the households have to use commercial carriers like kerosene and electricity, they will
consume a significant portion of their monthly household income. The themes that are
considered under the social dimension include: affordability, equity and reliability of supply.
Table 4: Sustainable energy security indicators-Social dimension
Category Subcategory Indicator Unit Value
Affordability
Energy prices
Biomass fuels US$/GJ 2.4
Electricity USc/kWh 12
Gas US$/l 0.5
Petrol US$/l 1.1
Diesel US$/l 0.82
Kerosene US$/l 0.25
Energy expenditure in total
expenditure
High-income households
%
5
Middle-income households % 7
Low-income households % 8
BPL households % 12
Energy connectivity HH with electricity connection % 56
HH with LPG connection % 25.4
Equity
Energy access
Households using kerosene for
lighting
% 42
Households using solid fuels
for cooking
%
56
Traditional energy in total
household energy use
% 65
Energy adequacy
Electrical power use W/cap 90
Solid fuels use per capita GJ/cap 2.2
Petroleum fuels use per capita l/cap 175
Reliability
Energy rationing
Average load shedding in rural
areas
hrs./day 12
Average load shedding in
urban areas
hrs./day 6
Peak demand shortage % 13
Energy shortage % 10
Energy quality
Unplanned interruptions/year No. 35
Household electricity
consumption
kWh/cap 498
Non-commercial energy in
total energy consumption by
households
% 54

Table 4 provides information on social indicators of sustainable energy security for India.
The indicator pertaining to the prices of energy carriers addresses the issue of affordability.
Even though, the price per unit of energy for cooking is the lowest for biomass fuels, its low
efficiency (about 10%) makes them the costliest fuel. Monthly energy expenditures are
shown for four different levels of income. The figure shows the share of income that is spent
on energy services at each level of income. The data indicate that the segments of the society
with lower income levels not only use inefficient fuels but also spend a large share of their
monthly income (8–12 per cent) on basic energy needs. Energy costs thus significantly
impact the basic needs and how much disposable income is available for other needs such as
education or health care.
It is important that adequate, affordable and reliable energy services are necessary for
sustainable human development. As the table shows only 56% of the households have
electricity connection and about 25% LPG. Even for these households reliable energy supply
remains a dream. There is no electricity supply for nearly 50% of the time in rural regions
and 25% of the time in urban regions. Therefore, sustainable energy security requires
increase in accessibility and affordability of energy services.
5.3 Environmental dimension
The extraction/production, generation, transportation, distribution and use of energy create
pressures on the environment at the household, national, regional and global levels. These
environmental impacts depend on how the energy is produced and used, the nature of fuel
mix, the structure of the energy system and related regulatory actions and policy
prescriptions. The environmental indicators are divided into three themes: climate change, air
pollution and ecological impacts. Water and land quality are important categories of
environmental dimension. Energy activities degrade and acidify land and affect water quality
as well as agricultural productivity. The household use of fuel wood result in deforestation
that leads to erosion and soil loss. The quantity of greenhouse gases (GHG) that are generated
will decide whether humankind is changing the climate for the worse (Table 5).

Table 5: Sustainable energy security indicators-Environmental dimension
Category Subcategory Indicator Unit Value
Global Climate
Change GHG emissions
CO2 emissions from power
generation t/cap 0.9
CO2 emissions from
transport sector t/cap 0.125
CO2 emissions from
industry t/cap 0.34
GHG emissions per capita t/cap 1.45
GHG intensity
CO2 emissions/GDP kg/US$ PPP 0.565
CO2 emissions/kWh of
power generation Kg CO2/GJ 70
CO2 emissions per capita kg 1.45
Air pollution Energy production
AAQS (PM10) ug/m3 75
AAQS (SO2) ug/m3 90
Energy
consumption
Standard for sulphur (S)
content of diesel fuel in
parts ppm 500
SO2 emissions per populated
area
1000 t/sq.km of land
area 1150
Air pollution index No. 77.5
Ecological Water pollution Share of waste water treated
(%) % 35
Water quality index No. 35
Soil pollution Waste collected and
adequately disposed (%) % 25
Solid waste (kg/cap/year) kg/cap/y 150
Ecological impacts
Forest cover % of land area 23.7
Rate of deforestation
attributed to energy use %/year 0.35
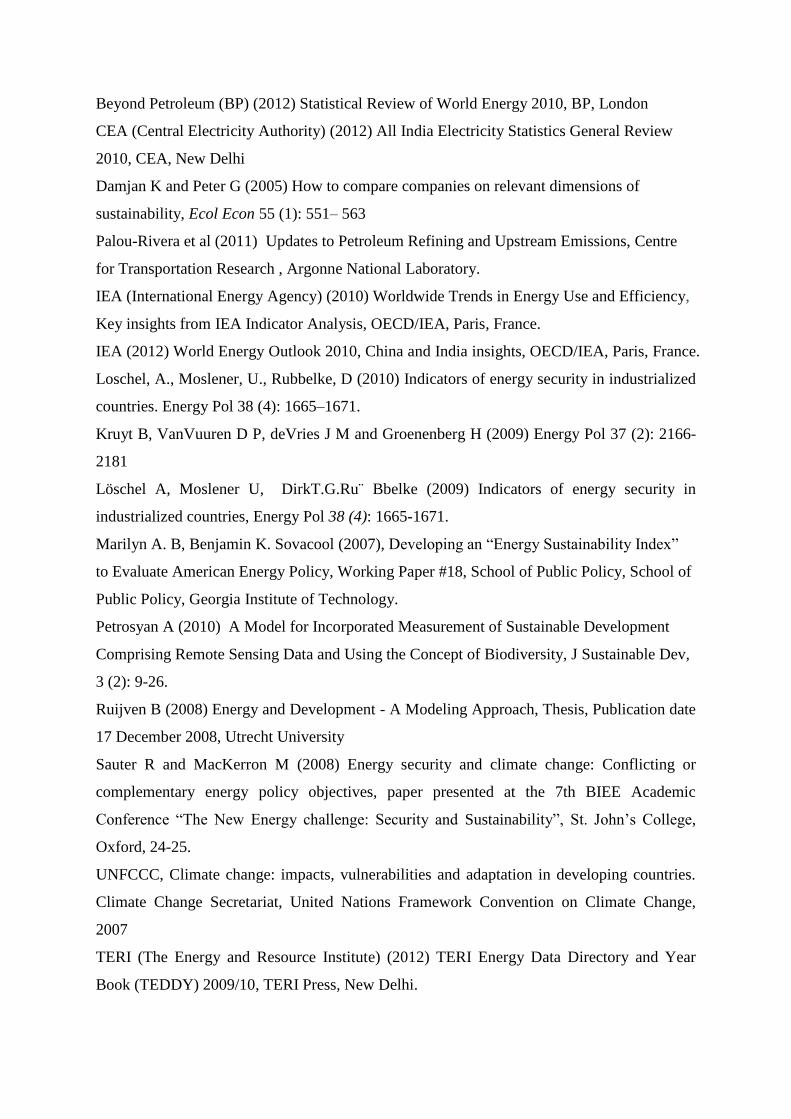
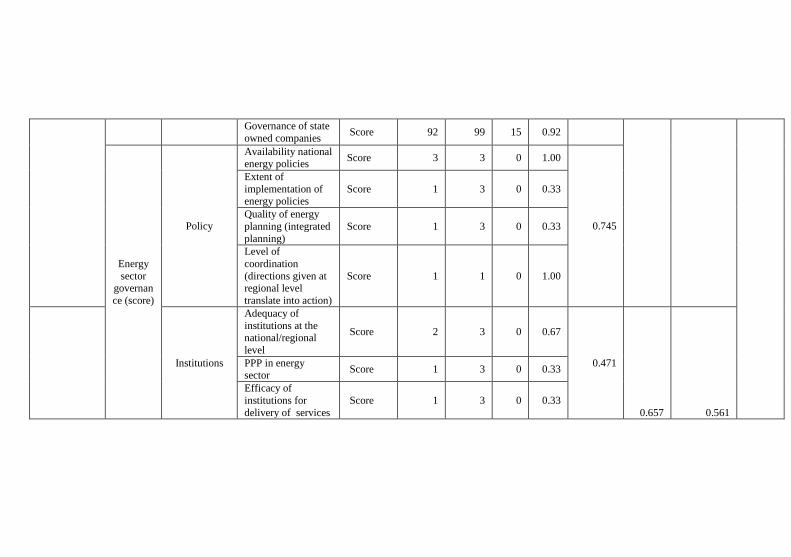
5.4 Institutional/governance dimension
The institutional/governance challenge is one of the often major ignored problems (structure,
players, influences, actions, and constraints) countries like India faces in energy security and
sustainability. Institutional indicators help measure the effectiveness of a national sustainable
energy security development strategy/plan, capabilities, adequacy and effectiveness of
investments in capacity building, R&D development and also monitor progress towards
appropriate and effective legislative, regulatory and enforcement measures to foster efficient
energy systems.
The indicators for this dimension are difficult to measure since they address issues
that are quantitative in nature. The governance index given here measures how well
countries address various challenges (Anon, 2013), viz., prevailing legal and institutional
framework that supports transparency and accountability, information published about the
resource sector, safeguards to promote integrity in its governance and broader institutional
environment conducive to accountable resource governance. There are also other indicators
such as availability of policies, private sector participation. Changes in one component can

affect governance as a whole. As areas of analysis and policy reform, they should be
considered individually as well as collectively. For the purposes of this study for each
indicator, we have assigned scores. The available indicator sets that measure aspects of each
category are summarised in Table 6.
Table 6: Sustainable energy security indicators—Institutional dimension
Category Sub-
category Indicator Unit Value
Remarks
Resource
governance Practices
Institutional and legal setting Score 60
Reporting practices Score 72
Safe guards and quality controls Score 83
Enabling environment Score 71
Governance of state owned
companies
Score
92
Energy sector
governance
(score)
Policy
Availability of national energy
policies
Score 2
3=Comprehensive Policies in place
2=Policies framework ready
1 = Policies are being worked out
0 = None
Extent of implementation of national
energy policies Score 1
3 = Implemented fully
2 = Process going on
1 = Plan is in place; 0 = No plan
Quality of energy planning
(integrated planning or sub-sector)
Score 1
3 = Whole of energy sector
plan/roadmap operational
2 = Sub-sector plan with framework
1 = Energy sector plan in preparation
0 = No plan
framework = 3; Subsector plan with operational with framework = 2; Energy sector plans in preparation = 1)
Level of coordination (how decisions
and directions given at regional level
translate into practical action) Score 1
1 = Meetings lead to relevant national
action;
0 = No action
Institutions
Adequacy energy institutions at the
national/regional level
Scor
e 2
3 = Energy ministry; 2 = Department
1 = Energy office; 0 = None
Public–private partnerships in energy
sector
Scor
e 1
3 = High; 2 = Medium
1 = Low; 0 = None
Efficacy of institutions for delivery of
energy services
Scor
e 1
3 = High; 2 = Medium
1 = Low; 0 = None
Legislation
Availability various acts related to
energy
Scor
e 3
3 = In place; 2 = Finalised
1 = In preparation; 0 = No act
Efficacy of implementation of above
acts Score 1
3 = High; 2 = Medium
1 = Low; 0 = None
Energy efficiency standards 2
3 = Implemented fully
2 = Implemented partially
1= In preparation; 0=No standards
Private sector
participation
Contributi
on
Share in total installed capacity % 9
Share in total power generation % 10
Participati
on
Share of private sector investment in
total power sector investment 8
Availability of enabling framework
for private sector participation Score 2
3= Comprehensive Framework in place
2 = Framework ready
1 = Being worked out; 0=None
Share of petroleum refinery capacity % 20
Finance/
funding
Financial
Access
Ease of access to finance for energy
project financing Score 2
3 = High; 2 = Medium
1 = Low; 0 = None
Ease of access to finance for energy
efficiency/renewable energy for HHs Score 1
3 = High; 2 = Medium
1 = Low; 0=None

Even though India faces significant economic challenges, it exhibits good practices in
many categories. It adopts transparent and accountable systems for managing its resources.
And though India’s overall institutional governance is weak, it initiated reforms in
government-owned companies, as reflected in its high score. In case of legislation and
policies the government effectiveness is moderate relatively. In these cases, governance is
less likely to improve the ability of citizens to hold governments accountable. On the other
hand, private sector participation scores well in government effectiveness but fall short in
financing. Overall, policy implementation is a problem area that lags behind the overall
governance environment. The improvements in this area could be a springboard for more
governance effectiveness.
6 Sustainable energy security index for India
To develop a composite sustainable energy security index for India we have consolidated
individual indicators under each category and then normalized the values into a single form.
For normalization, we used the maximum and minimum possible values from countries with
the highest and lowest values for that indicator. This results in threshold values (maximum
and minimum) for every indicator. Using this data, the sustainable energy security index
(SESI) has been obtained. This provides a single number (within the range of 0 and 1) for
comparing the level of security of a country. India’s performance is best understood by
looking not only at its overall SESI score but by examining its results with respect to key
indicators of different dimensions (Appendix A). The category- and dimension-wise
sustainable security indicator values and the SESI are presented in Table 7. We observe from
the table that India performs reasonably well in economic and environmental dimensions but
not in social and institutional. With respect to social sustainability, India has an indicator
value of 0.493 while it is 0.561 for institutional sustainability. In economic sustainability,
India scores 0.628 and the overall SESI is 0.593 which is above the halfway mark.
The high values for various dimensions are not surprising. In general, energy use
depends on (i) production system and (ii) life style. In countries like India production systems
are inefficient and hence the high energy intensity which results in low energy security. At
the same time, people have non-energy intensive life style (low energy use for a given
activity) resulting in low per capita use. This is a sustainable way of resource use. However,
in ideal situation efficiency of the production system should increase and of the lifestyle
decrease
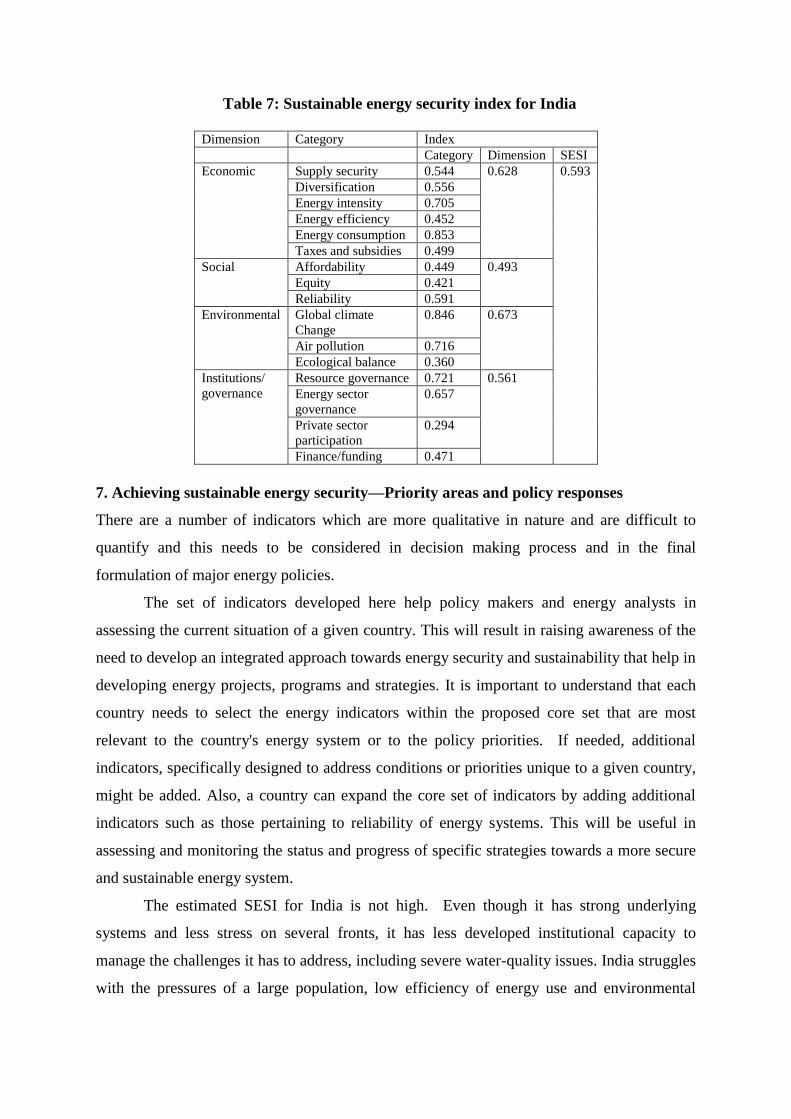
Table 7: Sustainable energy security index for India
Dimension Category Index
Category Dimension SESI
Economic Supply security 0.544 0.628 0.593
Diversification 0.556
Energy intensity 0.705
Energy efficiency 0.452
Energy consumption 0.853
Taxes and subsidies 0.499
Social Affordability 0.449 0.493
Equity 0.421
Reliability 0.591
Environmental Global climate
Change
0.846 0.673
Air pollution 0.716
Ecological balance 0.360
Institutions/
governance
Resource governance 0.721 0.561
Energy sector
governance
0.657
Private sector
participation
0.294
Finance/funding 0.471
7. Achieving sustainable energy security—Priority areas and policy responses
There are a number of indicators which are more qualitative in nature and are difficult to
quantify and this needs to be considered in decision making process and in the final
formulation of major energy policies.
The set of indicators developed here help policy makers and energy analysts in
assessing the current situation of a given country. This will result in raising awareness of the
need to develop an integrated approach towards energy security and sustainability that help in
developing energy projects, programs and strategies. It is important to understand that each
country needs to select the energy indicators within the proposed core set that are most
relevant to the country's energy system or to the policy priorities. If needed, additional
indicators, specifically designed to address conditions or priorities unique to a given country,
might be added. Also, a country can expand the core set of indicators by adding additional
indicators such as those pertaining to reliability of energy systems. This will be useful in
assessing and monitoring the status and progress of specific strategies towards a more secure
and sustainable energy system.
The estimated SESI for India is not high. Even though it has strong underlying
systems and less stress on several fronts, it has less developed institutional capacity to
manage the challenges it has to address, including severe water-quality issues. India struggles
with the pressures of a large population, low efficiency of energy use and environmental

externalities associated with rapid economic growth and resource extraction. To attain higher
security and sustainability, it has to consider the following, viz., i) reduce dependence on
imported oil and secure adequate alternative supply to meet rising demand; ii) address
environmental impact of energy use, iii) design policies to improve efficiency of generation
and use, supply infrastructure and transportation networks and (iv) strengthen institutional
base.
Progress on energy security and sustainability is not possible under conditions of
economic failure and social inequity. At the same time, it is impossible to degrade the
environment beyond a certain point while enjoying economic success. At the same time, we
need institutional capacity and performance which create conditions under which the rest of
the dimensions (economic, environmental and social) are maintained. The role of the
government is to maintain positive relationships among various dimensions of sustainability.
To assess the correct picture of a country’s energy scene, comprehensive statistical
databases are required. The government should improve and expand the energy data
collection mechanisms, monitoring systems and approaches adopted. These include the
establishment of arrangements to collect missing data, modification of existing data
compilation procedures and building capacity that is required to perform these functions.
These efforts will result in the collection of necessary data base for the development of
energy indicators relevant to sustainable development criteria and in the incorporation of
results in on-going programmes. This will also be useful in developing future scenarios
with necessary modelling tools which allow a more comprehensive monitoring mechanism
and analysis of sustainability trends and objectives (Vera and Abdalla, 2006). Because of
the range and complexity of issues that fall under various dimensions, policymaking needs
to be made more data-driven and empirical. SESI supports this goal.
8. Conclusions
This paper presents the development of a sustainable energy security index that depicts the
performance of India from various perspectives—economic, environmental, social and
institutional. It discusses how different indicators can be associated into security and
sustainability sub-indices and finally into an overall indicator of a country’s performance.
This helps to focus on measures and policies that should be taken to achieve the goal. The
approach is therefore presented as a guide which has been designed to be as flexible as
possible to facilitate its use. It should be noted that the generic framework in no way
constitutes a “ready-to-use ” list but rather a reference point where relevant criteria and

indicators can be selected according to the requirements, the actors and the types of
resources dealt with.
India’s increasing dependence on natural gas and petroleum fuels makes it vulnerable
to supply disruptions and price spikes. The various dimension of sustainable development are
primarily concerned with reduction of spending on energy, infrastructure investment and
providing clean and efficient energy systems. To achieve this, existing resources should be
used efficiently and a wide range of resources should be harnessed in the achievement of
these objectives. Until now low attention has been paid to the linkages between the social and
the economic dimensions of energy security. The essence of sustainable development lies
precisely at the interfaces and trade-offs between the conflicting objectives of economic and
social development and environmental protection. Hence, the country should design
strategies to secure supply sources and reduce energy demand. Diversification will remain the
fundamental starting principle of energy security for fossil fuels. It also requires developing
a new generation of “clean coal” and low carbon technologies encouraging a growing role for
a variety of renewable energy sources including hydrogen fuel as they become more
competitive. A move towards more sustainable technologies and fuel types is needed to meet
future challenges Investment in energy-efficient as well as renewable energy technologies
and infrastructure will require conducive economic and environmental policies. In a world of
increasing interdependence, energy security will depend much on how countries manage their
relations with one another. That is why energy security will be one of the main challenges for
India’s foreign policy in the years to come. The energy security policies of the country need
to be oriented to sustainable development as the primary goal and climate mitigation as its
byproduct. Energy being critical need for MDG, India must target in the next couple of
decades, for universalization of provision of energy services for all its citizens.
References
Anon (2005), Environmental Sustainability Index: Benchmarking National Environmental
Stewardship, Yale Centre for Environmental Law and Policy, Yale University.
Anon (2013) Resource Governance Index, Revenue Watch Institute, New York
Sudhakara Reddy B and Hippu Salk Kristle Nathan (2010) Emerging Energy insecurity—the
Indian Dimension, India Development Report, Oxford University Press, New Delhi.
Belgrave, R., Ebinger C K and Okino H (eds.) (1987) Energy Security to 2000. Boulder:
Westview Press.
Beyond Petroleum (BP) (2012) Statistical Review of World Energy 2010, BP, London
CEA (Central Electricity Authority) (2012) All India Electricity Statistics General Review
2010, CEA, New Delhi
Damjan K and Peter G (2005) How to compare companies on relevant dimensions of
sustainability, Ecol Econ 55 (1): 551– 563
Palou-Rivera et al (2011) Updates to Petroleum Refining and Upstream Emissions, Centre
for Transportation Research , Argonne National Laboratory.
IEA (International Energy Agency) (2010) Worldwide Trends in Energy Use and Efficiency,
Key insights from IEA Indicator Analysis, OECD/IEA, Paris, France.
IEA (2012) World Energy Outlook 2010, China and India insights, OECD/IEA, Paris, France.
Loschel, A., Moslener, U., Rubbelke, D (2010) Indicators of energy security in industrialized
countries. Energy Pol 38 (4): 1665–1671.
Kruyt B, VanVuuren D P, deVries J M and Groenenberg H (2009) Energy Pol 37 (2): 2166-
2181
Löschel A, Moslener U, DirkT.G.Ru¨ Bbelke (2009) Indicators of energy security in
industrialized countries, Energy Pol 38 (4): 1665-1671.
Marilyn A. B, Benjamin K. Sovacool (2007), Developing an “Energy Sustainability Index”
to Evaluate American Energy Policy, Working Paper #18, School of Public Policy, School of
Public Policy, Georgia Institute of Technology.
Petrosyan A (2010) A Model for Incorporated Measurement of Sustainable Development
Comprising Remote Sensing Data and Using the Concept of Biodiversity, J Sustainable Dev,
3 (2): 9-26.
Ruijven B (2008) Energy and Development - A Modeling Approach, Thesis, Publication date
17 December 2008, Utrecht University
Sauter R and MacKerron M (2008) Energy security and climate change: Conflicting or
complementary energy policy objectives, paper presented at the 7th BIEE Academic
Conference “The New Energy challenge: Security and Sustainability”, St. John’s College,
Oxford, 24-25.
UNFCCC, Climate change: impacts, vulnerabilities and adaptation in developing countries.
Climate Change Secretariat, United Nations Framework Convention on Climate Change,
2007
TERI (The Energy and Resource Institute) (2012) TERI Energy Data Directory and Year
Book (TEDDY) 2009/10, TERI Press, New Delhi.

Vera I A, Abdalla K L (2006) Energy Indicators to Assess Sustainable Development at the
National Level: Acting on the Johannesburg Plan of Implementation, Energy Stu Rev, 14 (1):
154-169.
Yale University (2005) Environmental sustainability index: Benchmarking National
Environmental Stewardship, Available at http://www.yale.edu/esi/ESI2005_Main_Report.pdf
(accessed in May 2013)
Data obtained from websites (accessed between January and in June 2013)
http://www.nationmaster.com/graph/ene_oil_con_percap-energy-oil-consumption-per-capita
http://data.worldbank.org/indicator/EG.IMP.CONS.ZS
http://en.wikipedia.org/wiki/Oil_by_country
http://www.fao.org/docrep/013/i1756e/i1756e02.pdf
http://www.nationmaster.com/graph/ene_coa_con_mil_ton_oil_equ-consumption-million-tonnes-oil-equivalent
http://en.wikipedia.org/wiki/List_of_countries_by_energy_intensity
http://data.worldbank.org/indicator/EG.ELC.LOSS.ZS
http://www.rite.or.jp/English/lab/syslab/about-global-warming/download-data/E-InternationalComparison_Eeff%28ElecIronCement%29.pdf
http://www.indexmundi.com/map/?v=91000
http://www.unescap.org/stat/data/syb2011/ii-environment/air-pollution-and-climate-change.pdf
http://www.teriin.org/events/INDIA_CITIZEN_GUIDE.pdf
http://ftp.iza.org/pp52.pdf
http://www.racv.com.au/wps/wcm/connect/f15f09804da9a9a29eb3de54a1b45993/World+Wide+Fuel+Prices+20+June+2013.pdf?MOD=AJPERES&CACHEID=f15f09804da9a9a29eb3de54a1b45993
http://en.wikipedia.org/wiki/Electricity_pricing
http://www.kshitij.com/research/petrol.shtml
http://chartsbin.com/view/1128
http://www-wds.worldbank.org/servlet/WDSContentServer/WDSP/IB/2012/07/09/000158349_20120709115206/Rendered/PDF/WPS6122.pdf
http://www.esmap.org/sites/esmap.org/files/Rpt_householdenergyuseindevelopingcountriescomplete.pdf
http://www.iea.org/co2highlights/co2highlights.pdf
http://ehs.sph.berkeley.edu/krsmith/publications/AWAH%20AQGs%2011%20with%20sup.pdf
http://www.worldwaterweek.org/documents/WWW_PDF/2011/Sunday/K21/The-Malin-Flakenmark-Seminar/Global-challenge-of-wastewater-Example-from-different-continents.pdf
http://siteresources.worldbank.org/INTURBANDEVELOPMENT/Resources/336387-1334852610766/AnnexK.pdf
http://rainforests.mongabay.com/deforestation/
http://www.revenuewatch.org/sites/default/files/rgi_2013_Eng.pdf
http://www.energy-regulators.eu/portal/page/portal/EER_HOME/CEER_5thBenchmarking_Report.pdf
http://www.unep.org/transport/pcfv/PDF/SulphurReport.pdf

http://www.numbeo.com/pollution/rankings_by_country.jsp
http://www.unep.org/gemswater/Portals/24154/pdfs/new/2008%20WQ%20Index%20development%20White%20Paper.pdf

24
Appendix A: Estimation of Sustainable Energy Security index
Dimension Category Sub-category Indicators Unit Actual
value
Threshold
Values Norm
alisat
ion
Indicator Values
High Low Sub-
category
Cate-
gory Dimension ESSI
Economic Supply
security
Primary
energy consumption
per capita
Coal kgoe 500 2,100 15 0.77
0.923
0.544 0.628 0.604
Oil
bbl/day/
1,000
people
3 103 2 0.99
Gas M3 54 4,315 30 0.99
Reserves-to-
production ratio
Coal Yrs. 111 481 19 0.20
0.124 Oil Yrs. 21 258 8 0.05
Gas Yrs. 23.3 220 10 0.06
Import
dependence
Share of energy
imports % 33 90 7 0.69
0.562
Share of oil imports % 70 85 0 0.18
Oil vulnerability
index No 0.93 1.11 0.3 0.22
Fuel imports as a %
of GDP % 5.9 30 1.4 0.84
Supply
infrastructure
Villages connected
to electric grid % 92 100 0 0.92 0.630

Villages with LPG
connection % 11 100 0 0.11
Villages with road
connectivity % 62 100 10 0.58
Diversification
Fuel share in
primary
energy
Biomass % 24 47 4 0.47
0.660
0.556
Coal % 38 77 0.06 0.51
Petroleum products % 26 85 18.8 0.89
Natural gas % 7 60.1 1.5 0.91
Renewable energy
in total primary energy supply
% 30 98 1.6 0.29
Fuel share in
final energy
Biomass % 31 98 0 0.32
0.427
Oil % 20 51 0 0.61
Electricity % 13 22 0.5 0.58
Share of fossil fuels in elec. generation
% 76 100 0.1 0.24
Share of fossil fuels
in installed capacity % 78 100 0.1 0.22
Share of locally
produced fuel as a
% of total supply
% 70 75 10 0.92
Share of renewables
as a% of total power supply
% 12.5 99.8 0 0.13

Energy intensity
National energy
intensity
Energy intensity of
society GJ/cap 24 325 8 0.95
0.870
0.761
Energy intensity of economy
toe/$
million
(ppp)
190 519 98 0.78
Sectoral
energy
intensity
Industry koe/$2005ppp
0.04 0.1 0.01 0.67
0.634
Commercial sector koe/$200
5ppp 0.06 0.11 0.02 0.56
Agricultural sector koe/$05p 0.09 0.11 0.00
8 0.20
Passenger transport MJ/PKM 1.4 4.5 1.3 0.97
Goods transport MJ/tonne-km
3 5 1.2 0.53
Energy
Efficienc
y
Energy
production efficiency
Coal-based power % 27 45 23 0.18
0.430
0.452
Gas-based power % 39 51 27 0.50
Hydro-power % 80 90 70 0.50
Renewables % 15 20 10 0.50
Oil refineries % 75 91.4 65 0.38
Energy
transport efficiency
Power grid (T&D) % 78 92 70 0.36
0.482 Oil distribution % 80 90 60 0.67
Coal transport % 70 85 62 0.35
Energy end-
use efficiency
Biomass stove % 15 30 10 0.25 0.443
Kerosene stove 30 40 25 0.33

(HH sector) LPG stove % 70 80 55 0.60
Electrical appliance % 75 85 65 0.50
Energy
consumption
Final energy
consumption (Per capita)
Biomass energy kg/cap 170 1100 25 0.13
0.853
0.853
Oil l/cap 173 5610 50 0.98
Natural gas cu.m/cap 54 3163 30 0.99
Electricity kWh/cap 498 15600 103 0.97
Taxes
and
subsidies
Energy taxes
(as a share of energy price)
Petrol % 48 76 42 0.18
0.161
0.499
Diesel % 34 75 30 0.09
Electricity % 15 56 5 0.20
Energy subsidies (as
% of GDP)
Diesel % 1 2.8 0.8 0.90
0.687 Kerosene % 0.6 0.9 0.15 0.40
Electricity % 1 2 0.5 0.67
Social Affordabi
lity
Energy prices
Biomass fuels US$/GJ 2.4 4 0.05 0.59
0.415
0.449
0.546
Electricity USc/kWh 12 50 1 0.22
Gas US$/l 0.5 1.9 0.05 0.24
Petrol US$/l 1.1 2.52 0.09 0.42
Diesel US$/l 0.82 2.03 0.07 0.38
Kerosene US$/l 0.25 0.4 0.1 0.50
Share of
energy
expenditure in total
expenditure
High income HH % 5 14.1 2.8 0.81
0.519
Middle income HH % 7 11 1.5 0.42
Low income HH % 8 12 2.7 0.43
BPL households % 12 15 3.5 0.26

Energy connectivity
HH with electricity
connection % 56 100 11 0.51
0.403 HH with LPG
connection % 25.4 92.3 1.6 0.26
Equity
Energy access
HH using kerosene
for lighting % 42 89 0 0.47
0.586
0.421
HH using solid fuels
for cooking % 56 96.2 0 0.58
Traditional energy
in total HH energy % 65 95 0 0.68
Energy adequacy
Household electrical
power per capita W/cap 90 2620 28 0.02
0.103 Household solid fuels use per capita
GJ/cap 2.2 12 0.1 0.18
HH petroleum fuels
use per capita l/cap 175 5760 58 0.02
Reliabilit
y
Energy
Rationing
Average load shedding in rural
areas
hrs./day 12 20 0 0.40
0.737
0.717
Average load
shedding in urban areas
hrs./day 6 12 0 0.50
Peak demand
shortage (%) 13 65 10 0.95

Energy shortage (%) 10 80 5 0.93
Energy
quality
Unplanned
interruptions/year No. 35 6 82 0.38
0.696 HH electricity consumption
kWh/cap 498 15600 103 0.97
Non-commercial
energy in total HH
energy consumption
% 54 90 0 0.60
Environment
al
Global
climate
change
GHG
emissions
CO2 emissions from
electricity
tonne per
capita 0.9 2.06 0.1 0.59
0.897
0.846
0.673
CO2 emissions from
transport sector t/cap 0.125 12.8
0.01
1 0.99
CO2 emissions from
industrial sector t/cap 0.34 12.06
0.01
3 0.97
GHG emissions t/cap 1.45 44 0.1 0.97
GHG
intensity
CO2 emissions/GDP kg/US$ PPP
0.565 4.83 0.02
6 0.89
0.791 CO2 emissions/kWh
of power generation
Kg
CO2/GJ 70 120 0.42
CO2 emissions/cap kg/US$ PPP
1.4 31 0.06 0.96
Air
Pollution
Energy
production
AAQS (PM10) ug/m3 75 175 40 0.74 0.652
0.716 AAQS (SO2) ug/m3 90 175 20 0.55
Energy consumption
Standard for sulphur
(S) content of diesel fuel in parts
ppm 500 5000 50 0.91
0.775 SO2 emissions per
populated area
1000 tons
/sq. km. land area
1150 21390 30 0.95
Air pollution index No. 77.5 97 28 0.28
Ecologic
al
Water
pollution
Waste water treated % 35 100 10 0.28 0.250
0.360
Water quality index No. 35 96 18 0.22
Soil pollution
Waste collected and adequately disposed
% 25 100 11 0.16 0.134
Solid waste kg/cap/y 150 780 75 0.11
Ecological
impacts
Forest cover % of land
area 23.7 90 2 0.25
0.555 Deforestation
attributed to energy %/year 0.35 1.23 0.05 0.75
Institutional/
governance
Resource
governance
index
Institutional/legal setting
Score 60 100 26 0.46
0.721
0.721
Reporting practices Score 72 97 23 0.66
Safe guards and
quality controls Score 83 98 26 0.79
Enabling environment
Score 71 98 9 0.70
Governance of state
owned companies Score 92 99 15 0.92
Energy
sector governan
ce (score)
Policy
Availability national
energy policies Score 3 3 0 1.00
0.745
Extent of
implementation of energy policies
Score 1 3 0 0.33
Quality of energy
planning (integrated
planning)
Score 1 3 0 0.33
Level of
coordination
(directions given at regional level
translate into action)
Score 1 1 0 1.00
Institutions
Adequacy of
institutions at the national/regional
level
Score 2 3 0 0.67
0.471
0.657 0.561
PPP in energy
sector Score 1 3 0 0.33
Efficacy of
institutions for
delivery of services
Score 1 3 0 0.33

Legislation
Availability various
acts related to energy
Score 3 3 0 1.00
0.720
Efficacy of
implementation Score 1 3 0 0.33
Energy efficiency standards
Score 2 3 0 0.67
Private
sector participat
ion
Contribution
Share in total
installed capacity % 9 100 0 0.09
0.095
0.294
Share in total power generation
% 10 100 0 0.10
Participation
Share of private
sector investment % 8 100 0 0.08
0.404
Availability of
enabling framework
for private sector participation
Score 2 3 0 0.67
Share of petroleum
refinery capacity % 20 100 0 0.20
Finance/f
unding
Financial
Access
Ease of access to finance for energy
project financing
Score 2 3 0 0.67
0.471
0.471
Ease of access to
finance for energy efficiency for HH
Score 1 3 1 0.00


![Evaluating Network Security Using [.5ex] Internet …...Chair of Network Architectures and Services Department of Informatics Technical University of Munich Evaluating Network Security](https://img.pdfslide.net/doc/110x75/5f9bc84c7774ed7fa429dc56/evaluating-network-security-using-5ex-internet-chair-of-network-architectures.jpg)