Embed Size (px)
Citation preview

Measuring financial capability: questionnaires and implementation guidance for low- and middle-income countries
June 2013


Measuring financial capability: questionnaires and implementation guidance for low- and middle-income countries
ELAINE KEMPSON
VALERIA PEROTTI
KINNON SCOTT

© 2013 International Bank for Reconstruction and Development / The World Bank
1818 H Street, NW
Washington, DC 20433
Telephone: 202-473-1000
Internet: www.worldbank.org
The findings, interpretations, and conclusions expressed here do not necessarily reflect the
views of the Executive Directors of The World Bank or the governments they represent. The
World Bank does not guarantee the accuracy of the data included in this work. The boundaries,
colors, denominations, and other information shown on any map in this work do not imply
any judgment on the part of The World Bank concerning the legal status of any territory or the
endorsement or acceptance of such boundaries.
Rights and Permissions
The material in this work is subject to copyright. Because the World Bank encourages dissem-
ination of its knowledge, this work may be reproduced, in whole or in part, for noncommercial
purposes as long as full attribution to this work is given.
Any queries on rights and licenses, including subsidiary rights, should be addressed to the
Office of the Publisher, The World Bank, 1818 H Street NW, Washington, DC 20433, USA; fax:
202-522-2422; e-mail: [email protected].
Cover photos: World Bank
Cover design/layout: Nita Congress

v
Contents
Acknowledgments — v
1 Introduction — 1
1.1 Motivation for financial capability measurement — 2
1.2 Why this financial capability survey? — 3
2 Questionnaires: purpose, content, and customization needs — 5
2.1 Individual questionnaire — 6
2.1.1 General considerations — 6
2.1.2 Sections of the questionnaire — 8
2.1.3 Customization — 20
2.2 Optional questions and modules — 24
2.2.1 Time — 24
2.2.2 Questions not used in the scores — 25
2.2.3 Additional optional sets of questions/topics — 25
2.3 Location questionnaire — 26
2.3.1 Purpose — 26
2.3.2 Who should administer the location questionnaire? — 26
2.3.3 Who should respond? — 27
2.3.4 Special Issues — 28
2.3.5 Customization — 28
2.4 Interviewer questionnaire — 29
2.5 Conventions in all questionnaires — 29
3 Survey implementation — 31
3.1 Sampling — 31
3.1.1 Probability sampling — 31
3.1.2 Why not nonprobability sampling? — 32
3.1.3 Selection of the individual to interview — 33
3.2 Training — 34
3.2.1 Training materials and manuals — 35
3.2.2 Training content and schedule — 35
3.2.3 Testing — 35
3.3 Survey organization — 36
3.3.1 Interviewers — 36

vi
Measuring finanCial Capability: questionnaires and iMpleMentation guidanCe for low- and Middle-inCoMe Countries
3.3.2 Supervisor — 37
3.4 Data entry — 38
3.5 Data cleaning — 38
3.5.1 Documenting the process — 39
3.5.2 The final data set(s) — 39
3.6 Documentation — 40
4 Analysis — 43
4.1 Weights — 43
4.2 Descriptive statistics — 43
4.3 Financial capability scores — 44
5 Research agenda — 51
Appendixes
A Main Questionnaire — 55
B Optional modules — 111
C Location Questionnaire — 127
D Interviewer Questionnaire — 133
References — 137
Boxes
3.1 Basic information document: table of contents — 41
Figures
2.1 Questionnaire structure — 9
2.2 Filling out the roster — 12
3.1 Interviewer work flow — 37
3.2 Data checks — 39
Tables
4.1 Key derived variables obtained from the survey questions — 46
4.2 How to calculate financial capability scores from the derived variables — 49

vii
acknowledgments
The Russia Trust Fund for Financial Literacy and Education World Bank Financial
Capability Survey (FCS) described here is the outcome of a multiyear research
project. The authors would like to thank the teams who managed and implemented
the research and data collection in the pilot countries: Armenia (Vardan Aghbalyan,
Arabela Aprahamian, Karen Grigorian, Juan Carlos Izaguirre, Edgar Karapetyan, Sona
Lalayan, Vahe Mambreyan, Sevak Mikayelyan, Armenuhi Mkrtchyan, Sue Rutledge,
Siegfried Zottel), Colombia (Dairo Estrada Ayiber, Sigrid Falla, Nidia García Bohórquez,
Diana Papagayo, Viviana Posada, Rekha Reddy, Nancy Zamudio Gomez), Lebanon
(Gustavo Demarco, Angela Elzir, Sabine Hatem, Lamia Moubayed, Mira Saidi, Souraya
Srage, Lina Tannir, May Wazzan), Malawi-Namibia-Zambia (Edwin Banda, Irma
Grundling, Giuseppe Iarossi, Astrid Ludin, Edward Phiri, Franko Venter, Smita Wagh),
Mexico (Marco Carrera, Jesus David Chavez Ugalde, Maria Jose Gentili, Patricia
Lopez, Arturo Luna Canales, Edgar Monsalvo, Rekha Reddy, Ana Luisa Saavedra, Luis
Treviño Garza), Nigeria (Tunde Adebisi, Temitayo Adebiyi, Lawrence Akhidenor, Gero
Carletto, Yemi Kale, Florence Nenuwa, Nemi Okujagu, Isiaka Olarewaju, Gbemisola
Oseni), Papua New Guinea (Paul Barker, Francesca Drapuluvik-Tinabar, Elizabeth
Genia, Henao Kari, Gae Kauzi, Rufina Peter, Alohai Pochapon, Mahohar Sharma,
Jonathan Sibley, the late Peter Siopun, Wei Zhang), Tanzania (Melania Akinyi,
Linda Helgesson, Emmanuel Mung’ong’o, Gerda Piprek, Giuseppe Iarossi, Smita
Wagh), Turkey (Tugba Acar, Ozgur Avcuoglu, Gokce Uysal Kolasin, Sebnem Sahin
Say, Mustafa Tasdemir, Cenap Nuhrat, Ayla Ortac, Ahmet Otunc, Kamer Ozdemir),
Uruguay (Ana Caro, Cecilia Hughes, Anya Maria Mayans, Margaret Miller). Addition-
ally, the authors would like to thank the team of experts who provided substantial
input and advice throughout the process: Gerrit Antonides who contributed to
both the quantitative and qualitative analysis, and Sharon Collard, Olga Kuzina, and
Christian Poppe who contributed to the qualitative analysis. The Russia Trust Fund
program manager Richard Hinz and the senior consultant Robert Holzmann provided
strategic guidance and insightful comments. The report also benefited from discus-
sions with Kristen Himelein. Layout and publishing support by Nita Congress and
Raiden Dillard are gratefully acknowledged, as is proofreading by Amy Gautam. For
further documentation about the activities supported by the Trust Fund, please visit
the website www.finlitedu.org.


1
CHapter 1
i ntroduction
This manual is designed to provide guidance to institutions, researchers, and
survey firms on how to measure financial capability in middle- and low-income
countries using a new survey instrument that was developed and tested, from start
to finish, in middle- and low-income countries. This new survey was developed as
part of a larger project financed by the Russia Financial Literacy and Education Trust
Fund (RTF) and implemented by the World Bank that encompassed both measure-
ment of financial capability and evaluation of financial literacy programs (see the
project website for details on the full project: www.finlitedu.org). The development of
the new RTF Financial Capability Survey (FCS) was done in collaboration with a team
of external experts and teams from a total of 12 low- and middle-income countries.
The full description of how the survey was developed can be found in Kempson,
Perotti, and Scott (2013) along with findings from the first wave of surveys that have
been done.
In this manual we briefly summarize reasons why the FCS might be of interest to a
country, provide a detailed outline of the issues related to implementing the survey
successfully, and demonstrate how to analyze the resulting data. The first chapter of
the manual lays out the reasons why this survey could be of use to policy makers.
Chapter 2 describes the FCS questionnaires and their goals and objectives. Topics
related to fieldwork, or the implementation of the survey, are covered in chapter 3.
Guidance on how to analyze the survey is provided in chapter 4. The survey instru-
ments can be found in the appendixes of this manual, and related documents—
interviewer and supervisor manuals—can be found on the Trust Fund website www.
finlitedu.org.
This manual in no way presumes to be a tool to teach survey design, implementa-
tion, or analysis. Instead it is designed for the survey practitioner, or the researcher
working with survey experts to undertake a survey of financial capability. It provides
guidance on the overall purpose of the financial capability questionnaires and their
parts, while at the same time highlighting areas of concern and issues that need to
be addressed in the implementation of the survey instrument, and in the analysis
of the data that is collected. This manual is not a substitute for a basic knowledge
of surveys and survey techniques such as probability sampling, face-to-face inter-

Measuring finanCial Capability: questionnaires and iMpleMentation guidanCe for low- and Middle-inCoMe Countries
2
viewing, and data management. For those less familiar with the field of household
and individual surveys, refer to books designed specifically for the survey practi-
tioner.
1.1 MOTIVATION FOR FINANCIAL CAPABILITY MEASUREMENT
In low- and middle-income countries, the limited scope of social insurance and safety
net programs on the one hand, and the erosion of traditional family support mecha-
nisms due to urban migration and employment shifts on the other hand, leave indi-
viduals increasingly responsible for their own income planning and risk management.
This responsibiity becomes more challenging when the number and complexity of
financial products available increases with overall economic development. The low
levels of financial inclusion observed in low- and middle-income countries are partly
driven by limited financial capability. This, in turn, limits individuals’ and households’
ability to effectively utilize financial resources, smooth their consumption over a life-
time, and manage risks.
Financial capability, the capacity to manage financial resources and use financial
services in a way that best suits individual needs and the prevalent social and
economic conditions, is a broader concept than that of financial literacy, which
focuses on people’s knowledge—e.g., of how interest rates work, the concept of
present value, and similar concepts. There is growing interest in developing inter-
ventions and strategies to raise levels of financial capability. Yet there is no accepted
tool that can be used to measure financial capability nor to identify which facets of
financial capability are weakest in a country or which population groups have the
greatest lacunae in this area.
An instrument that can measure financial capability can provide policy makers with
a range of important inputs. At the most basic level, such an instrument would allow
countries to carry out diagnostic studies to assess areas of financial capability to
show weaknesses or strengths. Additionally, it would allow policy makers to iden-
tify potential target groups that could most benefit from policy interventions and
specific programs. Such a survey could also allow for more focused research on
topics related to financial capability and its linkages with individual, household, and
community characteristics. At its best, such an instrument can be used to measure
progress toward specific objectives and answer questions on the impact of financial
and educational policy on capability and overall well-being.

CHapter 1. introduCtion
3
1.2 WHY THIS FINANCIAL CAPABILITY SURVEY?
The questionnaire described in this manual has been designed to capture some of
the characteristics of people that make them financially capable—characteristics that
are expected to translate into increased welfare through better management of one’s
own resources, including a greater or more effective use of financial services. The
instrument was developed from an open qualitative research process that provided
the inputs into the design of the quantitative instrument described in this manual. The
development process follows one that was first done in the United Kingdom for the
Financial Services Authority (FSA), and subsequently implemented in other high-in-
come countries.1 Instead of simply using the findings from the FSA work to develop a
questionnaire, however, the World Bank’s RTF project replicated the work from step
one in low- and middle-income countries. The assumption behind this decision was
that the features that matter for financial capability in low- and middle-income coun-
tries might be quite different from those in high-income countries.
The questionnaire presented here is the result of an open process that started with
focus groups in eight countries: Colombia, Malawi, Mexico, Namibia, Papua New
Guinea, Tanzania, Uruguay, and Zambia. The focus groups were conducted in both
rural and urban areas and with men and women from different socioeconomic groups
and were designed to elicit the actions, behaviors, and attitudes that make a person
financially capable. Based on this round of research, a set of common elements or
manifestations of financial capability was identified, and two rounds of in-depth cogni-
tive interviews were conducted in the same countries to pinpoint both the questions
with the most relevance and the form in which these were most readily answered by
respondents across the educational and income spectrum. (For a full description of
the development process, please see Kempson, Perotti, and Scott 2013.)
The development of the FCS was a collaborative effort with central banks and other
government agencies with a vested interest in improving financial service use
throughout their economies. This partnership has led to the instruments described
below. The content of these instruments has been informed by the populations
in which the survey was developed, and has been extensively tested and piloted
to create the most complete but also the simplest instrument possible. There are
always trade-offs in questionnaire design, with the best instrument achieving a
balance in terms of brevity, clarity, and comprehensiveness. Financial capability is a
complex concept that is not amenable to measurement by a small number of ques-
tions. That said, every effort has been made to ensure the utility of each question in
the following questionnaires and that all segments of the population will be able to
answer them.
1 See FSA (2005) and (2006) for more details.


5
CHapter 2
questionnaires: purpose, content, and customization needs
The World Bank’s Financial Capability Survey developed under the Russia Financial
Literacy and Education Trust Fund captures information on individuals’ behavior,
skills, and attitudes related to managing the finances for which they are responsible.
This chapter contains an overview of the questionnaires used in the FCS. The overall
purpose of each section of the questionnaire is highlighted, areas of potential prob-
lems are flagged, and any issues specific to the theme or format of the section are
addressed. For detailed instructions and examples of how each individual question in
the questionnaires is to be answered and for additional definitions of the terms used
in the questionnaire, detailed interviewer manuals have been written. These can be
found on the RTF project website (www.finlitedu.org).
The FCS comprises two main survey instruments—the Main (Individual) Question-
naire, which includes the questions designed to measure financial capability and
a Location Questionnaire—with a third, optional, Interviewer Questionnaire. The
Individual Questionnaire is administered to one randomly selected adult in each
sample household to collect data on the financial behaviors and attitudes identified
by the qualitative work as key components of financial capability. Some data on the
household in which the person lives are also gathered. The Location Questionnaire
is designed to collect a limited set of community variables that can be used to char-
acterize the environment in which people make financial choices. As most samples
are designed in stages, with multiple households interviewed in one location, the
Location Questionnaire is administered only once in a given community or cluster
of dwellings, and the data attributed to all the dwellings in the community. This is a
time-saving approach. The optional Interviewer Questionnaire is used to collect infor-
mation on the characteristics of the interviewers.
The questionnaires will need to be customized in several places to reflect specifics of
the country where the survey is being implemented such as schooling levels, marital
status, available financial products, and the like. The full questionnaire can be found
in appendix A of this document. All questions that require customization are high-
lighted there in yellow.
Measuring finanCial Capability: questionnaires and iMpleMentation guidanCe for low- and Middle-inCoMe Countries
6
2.1 INDIVIDUAL QUESTIONNAIRE
The Individual Questionnaire is designed primarily to collect data from one adult in
each selected household about the core topics related to financial capability. A small
amount of household-level data is collected to help understand the context in which
the individual lives and to allow the use of a probability sampling tool (Kish table) to
select the respondent for the interview. The survey instrument takes approximately
30–40 minutes to administer. This chapter provides an overview of the survey instru-
ment.
2.1.1 General considerations
ORDER
The questionnaire has been arranged so that the most potentially difficult or sensi-
tive questions come at the end of the interview, when the greatest level of rapport
between the informant and the interviewer will exist. Additionally, within sections,
the question order is based on several considerations: logic, ease of interview, and—
in some cases—the need to create a reference for later questions. An example of
this point can be seen in Section C of the questionnaire, where expected expenses
are discussed before unexpected. This order helps to frame the idea of an unex-
pected expense for the respondent. It is important to maintain both the section and
question order: reordering may undermine the validity of some sections or questions.
ONE RESPONDENT VERSUS MULTIPLE RESPONDENTS
The survey has been designed to interview one adult per household in order to
generate a random sample of adults living in a country. The decision to focus on one
person per household was made for two reasons. First, the adult composition of a
household is not stable over time—people leave households (through separation or
death) and join new ones (through marriage and other events). Second, individuals’
responsibilities may change over time as households change. Thus, understanding
capability at an individual level is important.
This focus, however, does not shed light on intra-household dynamics or household
financial capability. If these are areas of interest, then all adults in the household
should be interviewed; there is no reason why this cannot be done.1 There are, of
course, cost implications, as time in each household will increase. And, if not properly
handled, trying to interview all adults may create some problems with nonresponse.
As with any change, the costs and benefits need to be carefully assessed.
1 One of the pilot countries, Nigeria, interviewed all persons over age 15 without major difficulty.

CHapter 2. questionnaires: purpose, Content, and CustoMization needs
7
(Note, in the present design, where one respondent is chosen, there may be two
different people who provide information for the survey. The first respondent is a
“responsible adult”—the head of household, his or her spouse, or another adult in
the household who is knowledgeable about all other members of the household—
and this person will provide the information on the household and all its members
(Section R). Depending on the outcome of the selection of the respondent for the
financial survey, this person may or may not be the “selected respondent,” i.e., the
one person of all household members 18 years and older who is selected to respond
to Sections A–G of the questionnaire using the Kish table.)
TWO PATHWAYS
Given that some respondents will manage only their own personal income while
others will be managing or participating in the management of the household’s
income, the questionnaire has been split into Sections B, C, and D: there are two
versions of each module, one for those who manage only their own income and one
for those involved in household financial decision making. The two-version approach
was taken, as it removes the burden from the interviewer of having to customize the
wording of each question depending on who is being interviewed. It is expected that
this will improve data quality.
AGE OF RESPONDENT
The decision to interview only adults is based on the premise that, unless a person
has some role in managing money or making financial decisions, there is no way that
any assessment of his or her financial capability can be made with this questionnaire.
In some of the early stages of the questionnaire development, younger adults were
interviewed: those who depended on their families were unable to answer many
of the questions in the survey. For this reason, having a lower-bound cutoff age is
important. The actual age of that lower bound will vary by country. In countries with
child labor or where households rely on all members to bring in income, lowering the
age to 12 or 15 may be appropriate.
HOUSEHOLD INFORMATION
The questionnaire contains a very minimal set of questions on the members of the
household. This was done in an effort to keep the questionnaire as short as possible
and could be expanded if there were specific hypotheses that needed to be inves-
tigated; this decision should be carefully weighed before following through. Note
that every question that is added is much more than one question, as it needs to be
answered for each member of the household: for a six-person household, adding 3
questions would really be adding 18 questions.

Measuring finanCial Capability: questionnaires and iMpleMentation guidanCe for low- and Middle-inCoMe Countries
8
CUSTOMIZATION
Any questionnaire will need some customization to work in a specific context; this
topic is covered in detail at the end of this chapter. Additionally, there may be new
topics or questions that would be of great use in a given country or at a given time.
Topics that could be of interest are consumer protection, financial inclusion per
se, and financial literacy. This last topic was covered in five of the seven countries
that implemented the first wave of the survey. Any new topics that are to be added
should be included after Section E of the questionnaire: attempting to insert new
questions between Sections B through F of the questionnaire could negatively affect
the survey instrument—and the survey results.
2.1.2 Sections of the questionnaire
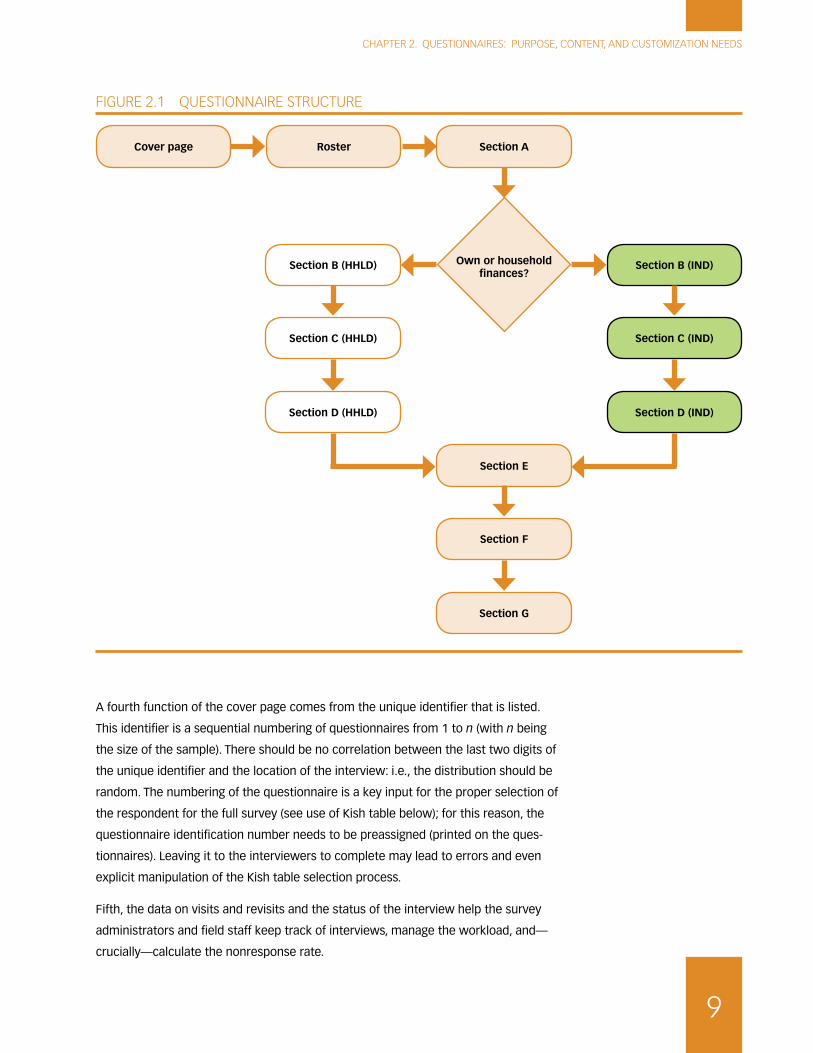
The overview of the content of the questionnaire can be seen in figure 2.1. The first
two sections of the questionnaire, “Cover page” and “Section R: Roster,” are designed
to identify the household and its characteristics and to select the respondent for
the financial capability questions. The seven sections that follow are the core of the
questionnaire—Sections A–G—and contain the questions on financial capability;
these are designed to be administered to one randomly selected adult in the house-
hold.
COVER PAGE
Who is the respondent. The respondent for this section is the interviewer him- or
herself. Much of the data should be filled in before the interviewer visits the house-
hold, as the sampling information and address are provided by the central survey
team. The information on the interview itself is filled out by the interviewer at the
time of the interview.
Purpose. As in any survey, the cover page is designed to capture all the information
that identifies the household to be interviewed, from address and name of household
head to detailed sampling data. These data are supplied ahead of time by the team
designing the sample and are filled in by interviewers prior to visiting the household.
The accuracy of the sampling information is critical. The first function of the cover
page is to ensure that the sampling design (see chapter 3 for more on sampling) is
not violated and that the correct households are interviewed. The second use for
the information in this section is to provide the codes that allow each Individual
questionnaire to be linked to its community data (Location Questionnaire). Third, the
sampling information, coupled with information on nonresponse, is the basis for the
sampling weight calculations that are required to ensure that the sample of house-
holds reflects the population of the country.
CHapter 2. questionnaires: purpose, Content, and CustoMization needs
9
A fourth function of the cover page comes from the unique identifier that is listed.
This identifier is a sequential numbering of questionnaires from 1 to n (with n being
the size of the sample). There should be no correlation between the last two digits of
the unique identifier and the location of the interview: i.e., the distribution should be
random. The numbering of the questionnaire is a key input for the proper selection of
the respondent for the full survey (see use of Kish table below); for this reason, the
questionnaire identification number needs to be preassigned (printed on the ques-
tionnaires). Leaving it to the interviewers to complete may lead to errors and even
explicit manipulation of the Kish table selection process.
Fifth, the data on visits and revisits and the status of the interview help the survey
administrators and field staff keep track of interviews, manage the workload, and—
crucially—calculate the nonresponse rate.
figure 2.1 questionnaire struCture
Cover page Roster
Section C (HHLD)
Section A
Own or household finances?
Section B (HHLD)
Section D (HHLD)
Section C (IND)
Section B (IND)
Section D (IND)
Section F
Section E
Section G

Measuring finanCial Capability: questionnaires and iMpleMentation guidanCe for low- and Middle-inCoMe Countries
10
An additional function of this section—one that is often forgotten—is that of
providing metadata on the survey: information on how often a household needed to
be visited before an interview could be completed, the days and times when inter-
viewing were most successful, and how long the interview took. All of this informa-
tion can be used as measures of quality for the present survey and can feed into the
design of the next survey.
ROSTER
This section of the questionnaire provides information that allows typologies of
households to be formed based on demographics or the characteristics of the head
of household. Additionally, in this section, information on the degree of financial
activity of all adult members of the household is captured, providing information on
who participated in household finances and the share of adults who did so.
Who should respond. Responsible adult: Any household member over the age of
majority who knows the household and its members well. Preference would usually
be given to the head of household or this person’s spouse.
Purpose. The roster is designed to (1) identify all members of the household, (2)
collect basic information on these individuals that can be used to understand the
context in which the individuals act, and (3) create a list of persons who are eligible
to be selected as the respondent for the rest of the instrument. The priority here
is to ensure that the list of household members is complete: any omissions will
affect the integrity of the sample design. There are two methods that could be used
here. In countries with small households and where ages are known, it is probably
simplest to ask the respondent to list the household members in order from oldest
to youngest. In countries with larger households or where ages may be less well
known, it is probably preferable to ask for household members in the following
order: head of household, his or her spouse, then the oldest child, that child’s spouse
and children, then the next child in age, and so on. Other relatives are next, usually
parents or parents-in-law of the head of household, and then others. Regardless of
the method used, it is critical that it minimize the risk of omission of any household
members, and that its guiding rule be used by all interviewers. Again, this helps
ensure the integrity of the sample selection using the Kish table. It is important that
interviewers probe for all household members and that the definitions of household
and household member are respected (see section on customization for definitions).
Definition of household. A standard definition of household is a “group of people
sharing a common roof and a common pot” and members are those who live there
at least six months and a day during a 12-month period. Conceptually, what is being
looked for is a group of people who share resources and decision making. Practi-
cally, the definition is designed to ensure that all people have a nonzero probability

CHapter 2. questionnaires: purpose, Content, and CustoMization needs
11
of selection but cannot be selected more than once (are not part of more than one
household). One concern with household definitions is that, in some countries,
domestic servants and even paying boarders are considered part of the household
unit. Conceptually, they should not be; but rather should be considered independent
households living in the same dwelling as another household, as their decisions are
not made jointly with the household in which they work or in whose dwelling they
live. If the household definition includes such individuals, the probability of their
selection is much lower than it would be if they were classified as independent
households. In countries with large numbers of resident domestic servants, this
broad household definition can obscure a particularly poor segment of the popula-
tion with, perhaps, very different financial capabilities or use of financial products.
Ideally, one would reclassify such households as independent ones and interview
them separately. Although this action may be difficult in practice, it is recommended.
Whatever the decision, the final write-up should be clear on how such individuals
have been treated and the effects of this decision on the analysis.
Special features. The detailed instructions for administering the questionnaire and
the definitions to be used are found in the interviewer manual. Here we highlight only
those features that may be unique or provide difficulties. The interviewer manual
should be studied carefully, and it should form the basis of much of the materials
that will be used to train interviewers, supervisors, and data entry personnel.
� Filling out the roster. The roster is filled out vertically first and then horizon-
tally. In other words, the list of members is completed first with their gender,
relation to household head, and age. Then, on a person-by-person level, Ques-
tions R5–R13 are asked for each person (see figure 2.2).
� Code of spouse. Each person has a unique identifier assigned to him or her
by virtue of the row in which their information is entered. The first column
of the roster is numbered: this is the Roster ID. The first person in the list is
considered to have Roster ID number 1; the second person listed, Roster ID
2, and so on. Thus if person 1 and person 2 are married to each other, when
person 1 is asked in Question R6 for the Roster ID code of his or her spouse,
the answer will be 2 (person 2 is the spouse). For person 2, the answer would
be “1,” as he or she is married to the head of household or the first person on
the list. The Roster ID is also used in Question R14.
� Education. Ideally, we would like know a person’s exact level of schooling.
While incomplete primary is lower than complete primary, the difference
between someone who just started first grade and someone who finished
fifth grade can be substantial, affecting job prospects and, perhaps, financial
capability or service use. Thus we would want to capture this level of detail.
However, collecting this level of detail was problematic in some countries,

fig
ure
2.2
fi
llin
g o
ut
tHe
rost
er
R1
R2
R3
R4
R5
R6
R7
R8
R9
R10
R11
R12
R13
ROSTER NUMBER
List
all
mem
ber
s of
th
e h
ouse
hol
d
and
ask
Q
. R5–
R12
fo
r al
l per
-so
ns
age
18 a
nd
ol
der
.
Is t
his
pers
on
mal
e or
fe
mal
e?
M =
1F
= 2
Wha
t is
the
rel
a-tio
nshi
p of
thi
s pe
rson
to
the
head
of h
ouse
-ho
ld?
Hea
d =
1Sp
ouse
/par
tner
= 2
Chi
ld =
3G
rand
child
= 4
Pare
nt =
5Si
blin
g =
6B
roth
er- o
r si
ster
-in
-law
= 7
Nie
ce/n
ephe
w =
8O
ther
rel
ativ
e =
9D
omes
tic h
elp
= 10
Oth
er =
11
How
old
w
as t
his
pers
on a
t hi
s or
her
la
st b
irth-
day?
If <
18
go
to n
ext
per
son
Wha
t is
thi
s pe
rson
’s m
arita
l st
atus
?
Mar
ried,
m
onog
amou
s =
1M
arrie
d,
poly
gam
ous
= 2
Info
rmal
uni
on =
3D
ivor
ced
= 4
(>
>R7)
Sepa
rate
d =
5 (>
>R7)
Wid
owed
= 6
(>
>R7)
Nev
er m
arrie
d =
7 (>
>R7)
Inte
r-vi
ewer
: C
opy
rost
er
num
-b
er o
f sp
ouse
Can
thi
s pe
rson
re
ad a
nd
writ
e in
[o
ffici
al
lan
-gu
age]
?
Cou
ntr
y te
ams
cust
om-
ize
Yes
= 1
No
= 2
Wha
t is
the
hi
ghes
t le
vel
of s
choo
ling
that
thi
s pe
rson
has
co
mpl
eted
?
Cou
ntr
y te
ams
cus-
tom
ize
How
wou
ld y
ou
desc
ribe
this
per
-so
n’s
mai
n st
atus
in
the
last
four
w
eeks
?
Empl
oyed
, for
mal
se
ctor
= 1
Empl
oyed
, inf
orm
al
sect
or =
2Se
lf-em
ploy
ed, n
ot
incl
udin
g ow
n fa
rm, u
npai
d fa
mily
w
orke
r =
3Lo
okin
g fo
r w
ork
= 4
Wai
ting
for
busy
sea
-so
n =
5St
udyi
ng =
6Re
tired
= 7
Sick
/dis
able
d =
8H
ouse
wife
/hou
se-
wor
k/ca
ring
for
hous
ehol
d m
em-
ber
= 9
Oth
er =
10
Doe
s th
is
pers
on
cont
ribut
e to
the
ho
useh
old
budg
et?
Yes
= 1
No
= 2
Doe
s th
is
pers
on p
ar-
ticip
ate
in
hous
ehol
d de
cisi
ons
abou
t m
oney
and
fin
anci
al
mat
ters
or
for
hous
e-ho
ld s
pend
-in
g?
Yes
= 1
No
= 2
Is t
his
per-
son
mai
nly
or p
artly
re
spon
sibl
e fo
r hi
s or
he
r ow
n pe
rson
al
spen
ding
?
Yes,
mai
nly
= 1
Yes,
par
tly =
2N
o =
3
Inte
r-vi
ewer
: W
rite
ro
ster
n
umb
er
of p
er-
son
wh
o
pro
vid
ed
this
in
form
a-ti
on
NA
ME
YEA
RSR
NO
.LE
VEL
1 2 3 4 5 6 7 8 9 10 11 12

CHapter 2. questionnaires: purpose, Content, and CustoMization needs
13
and there was a preference to simply ask for the level completed. This is how
the attached questionnaire treats the education question. (See the section on
customization for guidance on how to ask the more detailed education ques-
tion.) It is important, however, in the individual section that detailed schooling
information of the respondent is captured, not just the level.
� Participation in financial affairs. Questions R10–R12 are designed to cate-
gorize individuals on their participation in financial matters, either their own
personal finances or those of the household. The first question asks explicitly
if the person contributes to the household budget (finances). The next asks
about the level to which each person participates in household decision
making on financial matters; and the last on whether the person is somewhat
or fully responsible for his or her own finances. These three questions provide
a substantial amount of information on how individuals participate in house-
hold financial decisions by gender, age, education, and labor status; and they
allow a typology of households to be developed based on this.
� Selecting a respondent. The respondent for the rest of the survey is one
randomly selected adult. As noted previously, eligible adults are those 18 years
and older, as it was found in the countries where the survey was developed
that individuals under 18 were often neither contributing to the household
budget nor making any decisions on finances, either of the household or of
their own. In this case, the survey instrument is incapable of measuring finan-
cial capability. For this reason, younger respondents are omitted from the
sample.
It is preferable to use only a selection based on age and not to include other
filter variables or conditions for eligibility. By selecting only for age, the
resulting sample will be a probability sample of all adults in the country, and
the survey findings can be extrapolated to the universe of all adults in the
country. Some of the adults who will be interviewed will play no role in their
household, or even their own, financial decisions; the bulk of the questionnaire
will not be relevant for such people. In Section A, an effort is made to under-
stand exactly what role the selected adult plays in the household. If he or she
plays no role, the interview will end at this point.
By administering the questionnaire in this way, one obtains a full picture of
financial activity among all adults in the country, and can profile both inac-
tive and active adults, comparing them across basic demographic variables
at least. Additionally, the full analysis of financial capability among the active
group can be carried out. And, as the sample is of all adults, there are no
complications in the construction of sample weights.

Measuring finanCial Capability: questionnaires and iMpleMentation guidanCe for low- and Middle-inCoMe Countries
14
Once the list of eligible adults is determined, the interviewer applies a Kish
table to select the individual respondent to ensure that the final sample is a
true probability sample—one in which each adult has a known and nonzero
probability of selection. The Kish table used here is a one-page table where
the first row lists the possible number of eligible people in the household (1,
2, …, 25), and the first four columns list the possible last two digits of the
household identification number (01 to 00).2 The rest of the table is prefilled
with random numbers. The cell at the intersection of the number of eligible
people in the household and the last two digits of the household identifica-
tion number provides the order number of the person to be interviewed. For
example, if the number in the cell at the intersection of the number of house-
hold members and the household identification number is 3, then the third
eligible member listed in the roster should be interviewed (see chapter 3 for a
more detailed discussion of the Kish table and its application).
Once an individual is selected, he or she answers all remaining sections of the
questionnaire.
Note: In the first wave of surveys, the effort was to maximize the number of
financially active adults and avoid interviewing nonactive adults. In the case
of a nonactive adult being identified in Section A of the questionnaire, the
interviewer was instructed to carry out the selection process again and select
a replacement respondent. This procedure is not recommended, as it is not
only more complex for the interviewer to administer, but also leads to serious
sampling issues in the analytic phase.
SECTION A
Who responds. Adult randomly selected using the Kish table.
Purpose. This section is designed to do two things. First, it is used to identify individ-
uals for whom the questionnaire cannot measure financial capability: i.e., those who
are neither responsible for their own finances nor those of the household. The data
show that these people are in a minority but do exist. The sections of the question-
naire that collect information on financial behaviors are irrelevant for these people.
The second role of the section is to identify, for those who do participate financially
in some form, the set of financial decisions about which the person should provide
information. Where business finances are kept separate, they are not covered by
the survey; however, for some people, business finances are so intermingled with
household or individual finances, it is not possible to separate the personal from
2 This is an adaptation of the original Kish table that applies eight tables. See Kish (1949) for
more details.
CHapter 2. questionnaires: purpose, Content, and CustoMization needs
15
the business. This section allows the analyst to know when this is the case. Some
people will only be able to respond about their individual (not household) finances,
as they contribute nothing to the common household pot and/or make no decisions
concerning it. For analytic purposes, one needs to know whether respondents are
referring to their actions on household or just personal finances. The questionnaire
is structured so that people responding about household decisions have a different
skip pattern (set of questions) than those responding about personal finances. (The
two sets of questions are actually the same, but the specific wording—plural versus
singular, e.g.—varies.)
Special features.
� Informed consent and confidentiality. The privacy of the respondents in
this, and any, survey must be protected. Data that contain identifying informa-
tion may never be released, and respondents should be made aware of the
statistical confidentiality of the data they provide. It is important as the inter-
view starts with the selected respondent that the person be given a chance to
understand what the survey is about, how the data will be used, and to obtain
agreement from the respondent to do the survey. The data must be confiden-
tial; while the unit record data will be available to analysts and researchers, it
must never be disseminated to anyone with names, addresses, or any other
information that would allow a respondent to be identified. It is imperative
that this point be made clear: income and finance are sensitive subjects, and
unless informants are comfortable that their answers will be confidential,
there will be an unnecessarily high nonresponse rate or a data quality issue
(as respondents self-censor).
� Income. In this section, the goal is not to identify income sources or levels but
simply to determine if the person has such sources. As income is a sensitive
topic and this the first part of the interview, it is useful to make it clear that no
specific information about income is being requested here.
SECTION B
Who responds. Same person as in previous section.
Purpose. The purpose of this section is to collect information on how people
manage day-to-day spending. Managing money includes people’s knowledge of
their own spending, their ability to plan, and what they do when they have leftover
resources or run short of funds for daily current spending.
Special features.
� Two sections. In this section, there are two separate sequences of ques-
tions. For those who are answering about both personal and household

Measuring finanCial Capability: questionnaires and iMpleMentation guidanCe for low- and Middle-inCoMe Countries
16
finances (answer 1 in Question A6), the questions are on the white pages. For
those answering only about their personal finances, the questions are on the
green pages. The reason to use two separate sets of questions is to lower
the burden on the interviewer. If one set of questions were asked, the inter-
viewer would have to customize the wording of each question (plurals, etc.)
depending on the type of respondent.
� Avoiding nonresponse. As many of the questions in this section are designed
to be included in a score (see chapter 4 for a discussion of this analytic goal of
the survey), it is important that nonresponse and “do not know” answers be
avoided. The advice to the interviewer is, when faced with such responses, to
gently attempt to get an answer, either by rereading the question or reminding
the person that the survey answers are confidential. Clearly, there is a limit to
what can be done to elicit an answer but every attempt should be made. Role
playing this during training will be important.
� Why two-part questions? Typically in questionnaires, questions related to
activities are asked using a five-point scale (e.g., 1—Very often, 2—Often,
3—Sometimes, 4—Rarely, 5—Never). One of the important findings of the
qualitative work that informed this questionnaire is that such questions are
not easily understood or answered by all respondents. And, critically, the diffi-
culty in responding is correlated with lower levels of education and income. To
improve data quality, these types of questions were divided into sets of two
questions, first eliciting whether the person does or does not do something,
and then determining the intensity of the action. Changing these questions
into the format usually used is NOT recommended.
SECTION C
Who responds. Same person as in previous section.
Purpose. The purpose of this section is to investigate the extent to which people
plan for the future in both the short and long term. The section covers planning
related to known expenditures such as those that represent regular payments
(school fees, rent, and the like). Unexpected expenditures and emergencies are also
covered, both to determine whether the person could cover these and/or has a plan
to cope with such events. Finally, questions are asked about planning for retirement
and for one’s children.
Special features. The special features in Section C are similar to those in Section B.
There are two versions of this section, one for people answering only about their
own expenditures and one for those answering about household spending. Again,
the questions here are needed for the financial capability scoring, so nonresponse
must be avoided as much as possible. Finally, questions that might usually be posed

CHapter 2. questionnaires: purpose, Content, and CustoMization needs
17
on four- or five-point scales have been divided into separate questions to ensure that
people with less education are equally able to respond to them.
SECTION D
Who responds. Same person as in previous section.
Purpose. The main purpose of this section is to understand how people choose
financial products; whether they check the features, terms, and conditions before
buying financial products; whether they look for information before buying products;
and whether they seek advice or information before making financial decisions.
An additional objective of this section is to obtain a broad indication of the level of
financial inclusion of the individual by asking which financial products the respon-
dent holds.
Special features.
� Developing a complete list of financial products. For this section to work
properly, the survey team will need to consult closely with experts on finan-
cial services and products in the country. It will be important to include a full
range of the most common types of product, not simply the most common or
those provided by the formal sector. A review of the FINMARKET FINSCOPE
survey instruments3 will give insights on the range of products that might be
listed. If another financial inclusion survey has been done in the country, this
too could be a useful source of information to determine the list of products. It
may not be necessary to include all possible financial products (which in some
countries could represent a fairly daunting list), but examples of each type of
instrument, covering the spectrum of instruments from simple to complex and
formal and informal, is needed. It is sufficient to group together different types
of mortgages, and similarly to group different types of unsecured loans.
� Ranking financial products by complexity. Once the list is complete, it will
be necessary to list products in order of complexity. Complexity is defined by
the number and types of terms and conditions associated with each product.
The purpose of ranking is so that the following financial capability questions
can be asked about the most complex product that the respondent has been
responsible for acquiring. In addition to collecting a complete list of products
currently held, a separate list of products bought in the past five years is iden-
tified, and, among these, which ones the respondent was personally involved
in selecting. The assumption is that a person’s financial capability with regard
to selecting and acquiring financial products is best established with refer-
3 See www.finscope.co.za and www.finmark.org.za for examples of the questionnaires.

Measuring finanCial Capability: questionnaires and iMpleMentation guidanCe for low- and Middle-inCoMe Countries
18
ence to the most complex decision making they have had to make. Clearly,
there are problems with ranking all financial products by complexity: again,
consulting with financial product experts is imperative.
� Difficulty. This section has some potentially difficult questions for the inter-
viewer to administer. The interviewer manual provides detailed instructions for
filling out this section and should be studied carefully and used as a basis for
training.
SECTION E
Who responds. Same as in previous section.
Purpose. The purpose of this section is to capture underlying motivations that influ-
ence the way people behave. The questions are about motivations more generally.
To capture the various motivations, there is a core of 18 questions relating to three
motivations that form part of the scoring of financial capability. There are a further
16 questions relating to three motivations that are optional and can be included if
so desired. These questions are highlighted in blue. The use of multiple questions for
each motivation improves the robustness of psychological scales: more questions
could be added, but dropping any will undermine the validity of the section.
Special features.
� Two-part attitude questions. All questions involve reading out an attitude
statement. The respondents are then asked if they agree or disagree that the
statement describes them personally. This question is followed by a question
that asks whether they agree/disagree strongly or only to some extent. This
permits the development of a four-point scale ranging from agrees strongly to
disagrees strongly. It is important that respondents are encouraged to give a
reply and discouraged from saying “don’t know” so that they can be placed on
the four-point scale.
SECTION F
Who responds. Same person as in previous section.
Purpose. This section is designed to obtain information about the respondent’s
personal characteristics and also on income in terms of both levels and fluctuations
in income that the individual respondent and his or her household faces. To do this,
information is collected for all sources of income and then on how total income
varies throughout the year. This is probably the only section of the questionnaire that
may cause some discomfort, as it attempts to get at personal characteristics, partic-
ularly financial ones.

CHapter 2. questionnaires: purpose, Content, and CustoMization needs
19
Special features.
� Personal questions. The first thing to note is that the basic demographic
questions are repeated: if the respondent for the roster is the same as the
selected adult for the rest of the survey or was observing when the roster
was filled out, there may be resistance to answering these questions. In this
case, the interviewer shoudl indicate that he or she is just double checking
information and that it is very important that these questions be answered
correctly.
� Income. Many times, respondents are uncomfortable talking about income,
and it is important that interviewers be trained to feel fully comfortable in
asking about income, as any discomfort the interviewer feels will be trans-
mitted to the respondent. It should be borne in mind that these questions
have been asked successfully by the country survey teams that have tested
them. To minimize the discomfort, these questions are asked close to the end
of the interview, when there should be a good rapport established between
the interviewer and respondent. Additionally, no exact income figures are
requested; instead, the respondent need only identify a fairly wide range in
which his or her income fits. It may be necessary for the interviewer to remind
the respondent of the confidentiality of the data.
� Complexity. It was challenging to design questions and skip patterns to
assess (1) the sources and variability of individual income, (2) the sources of
income of other household members, and (3) overall household income and
its variability. This is a section that will require interviewers to receive clear
training. The importance of connecting sentences, as in the case of Ques-
tion F18, should be highlighted. Other issues to highlight are (1) the questions
on variability, as there was some nonresponse associated with this question,
and (2) what happens to people with no income (they skip Question F12). A
survey administered using computer-assisted personal interviewing (CAPI, see
chapter 3) would minimize these potential difficulties.
SECTION G
This section collects information of particular use for financial education programs,
as it identifies both the people who seek out financial information for making deci-
sions and the types of information they would like to have.
Who responds. Same person as in previous section.
Purpose. The section is designed to investigate information on financial products
and services and the degree to which individuals seek information about financial
matters. In the first part, respondents are asked about whether they seek infor-

Measuring finanCial Capability: questionnaires and iMpleMentation guidanCe for low- and Middle-inCoMe Countries
20
mation when making financial decisions: these questions form part of the core
questions used to develop the scores of financial capability. The second part aims
at understanding whether respondents would like to have more information about
general aspects of money management, and if so, what type of information they
would like to have. This second part is particularly useful for countries looking to
improve financial education, but it is optional since it does not form part of the
scoring. These questions are highlighted in blue.
2.1.3 Customization
No survey instrument can be taken “off the shelf” and applied as is. There is a
need to customize an instrument in various ways to reflect the specifics of each
country and the standard survey practices that may exist. The areas of the ques-
tionnaires that should be customized and how this is to be done are outlined here.
Areas in the questionnaire where specific customization is needed are highlighted
in yellow.
There are also questions that are highlighted in blue: these are optional questions.
At the end of this chapter is a description of key conventions used in the ques-
tionnaire. In principal there is no need to customize these. However, depending on
the survey practices of the organization implementing the survey, these might be
changed to reflect interviewer familiarity.
COVER PAGE
All of the information listed here needs to be collected. If there are additional levels
of sampling or different geographic divisions of the country, these should be included
here. This page is designed to both control the implementation of the sample and
allow proper sampling weights to be constructed ex post; it should be customized as
necessary to ensure both tasks can be realized.
ROSTER
Confidentiality statement. The survey needs to have a statement of confidenti-
ality. A standard statement of confidentiality may well exist as part of the national
surveys done by the statistical institute or census bureau. It is recommended to
use this. Academic researchers will be bound by the Human Subjects Board criteria
of their universities and may also have a standard statement that should be used.
Regardless of what is used, at the beginning of the interview and once an individual
respondent is selected, the confidentiality statement must be read to the respon-
dent.
Definitions of household and household members. The standard definition
of a household—a “group of people sharing a common roof and a common pot,”

CHapter 2. questionnaires: purpose, Content, and CustoMization needs
21
with members being those who live there at least six months and a day during a
12-month period—is fairly clear. Operationalizing it can be, however, quite complex
and requires an exhaustive set of rules for interviewers to follow. It is recommended
to follow the national definition of a household used by the population census. This
definition will be fully operationalized by the national census bureau or statistical
office and will have been tested and retested, thus eliminating the necessity for any
further work on this topic for the FCS. Second, using the national definition will allow
comparisons with other surveys and censuses in the country. Finally, if the FCS is
being fielded by an existing agency or firm, using the national definition will have
the added advantage of being the definition with which interviewers will be most
familiar.
Languages, Question R7. The purpose of this question is to determine the literacy
of each household member in terms of the principal language of the country. Specifi-
cally, the concern is whether the person is literate in the language that is mainly used
by the financial sector in the country. The survey team will need to determine what
this language(s). Note that the definition of literacy is being able to both read and
write the language, not just one or the other.
Education, Question R8. This question needs to collect information on the level
of schooling (preschool, primary, secondary and tertiary) and the year of schooling
completed in this level. Each country will have different levels: primary in some
countries covers six years or grades compared to basic education in other countries
with eight years or grades, secondary may be divided evenly into lower and upper
secondary with three years each or higher secondary may have four years, etc. In
this question, the levels of schooling need to be added explicitly with a code for each
level being defined in the questionnaire.
If there is interest in capturing both the level and years of schooling completed, the
education question needs to have two parts: what grade (year) and what level of
schooling did the person complete. If the question is “What is the highest level and
grade of schooling you have completed?,” there needs to be an answer for level
(none, primary, secondary, or tertiary) and an answer for the number of years in that
level. The number of years should be controlled in the second part of the question
(i.e., if primary is from first to sixth grades or years, an answer of seven years cannot
be entered if primary level is chosen). An example of customization is shown here:
the first person has completed two years of lower secondary, and the second person
has only completed five years of primary education:

Measuring finanCial Capability: questionnaires and iMpleMentation guidanCe for low- and Middle-inCoMe Countries
22
R8. WHAT IS THE HIGHEST LEvEL OF SCHOOLING THAT THIS PERSON HAS COMPLETED?
0. none
1. preschool
2. primary
3. lower secondary
4. Higher secondary
5. university
6. post graduate
LEvEL NO. YEARS/GRADE
3 22 5
SECTION A
Filtering, Questions A6 and A8. The questionnaire is set up so that there are two
versions of Sections B and C, depending on whether a person is answering about
decisions and behavior related to household finances (white pages) or individual
finances (green pages). Other color schemes may be used, of course; the goal is to
have the physical questionnaire set up so interviewers can easily follow the correct
skip patterns.
SECTION B
Question B6. This question refers to regular expenses that a household might have,
with regular being at least four times a year. The question uses a short list of exam-
ples to help the respondent understand the question. The list should be customized
to reflect the most typical of such expenditures and anything that is not applicable
should be dropped.
Questions B7, B8, B10, B12, B13, B14, B16, B20, B22 (white page version). These
questions refer to the plural you, in this case the household, in the white version of
the questionnaire. In the green version, the singular form should be used. In English
there is no difference, but it is important that this be captured correctly in any trans-
lation. For English or other languages that do not distinguish between the singular
and plural in the pronoun, the interviewer manual must highlight the plural nature of
the questions.
Questions B8a, B11a, B12a. Here the highlighted note is actually an instruction to
the data entry personnel. It may be left here or it may be removed as long as the
instruction is made clear for data entry elsewhere.

CHapter 2. questionnaires: purpose, Content, and CustoMization needs
23
SECTION C
Question C1. Specify the appropriate currency and units.
Question C2. The question refers to expected major expenses that the person or
household might have. The question includes a list of items that would be expected
major expenses in most countries. Here the survey team should customize the list
to ensure that the examples are relevant to the country in which the survey is being
implemented.
Question C6. The question refers to unexpected major expenses that the person
or household might have. The question includes a list of potential unexpected major
expenses in many countries. Again the survey team should customize the list to
ensure that the examples are relevant to the country in which the survey is being
implemented.
Questions C12a, C13a, C18a. Here the highlighted note is actually an instruction
to the data entry personnel. It may be left here or it may be removed as long as the
instruction is made clear for data entry elsewhere.
SECTION D
Questions D1 and D2. This question requires substantial customization. The first
stage is to get the best possible list of financial products that are in use in the
country. The second stage is to order this list from most to least complex product.
The second stage may require discussion with experts in the financial sectors.
Getting the complete list and the appropriate ranking is critical, as the entire section
depends on this question having been adapted correctly. The questionnaire contains
the detailed instructions; these should be read carefully.
SECTION F
Question F3. Specifically, the concern is whether the person is literate in the
language that is mainly used by the financial sector in the country. Note that the
definition of literacy is being able to both read and write the language, not just one or
the other.
Question F12. Asking people for exact incomes is problematic. For one thing, people
often find it difficult to provide this information with any precision. People are also
often very uncomfortable with providing precise income figures. To avoid discomfort
and to ensure the highest possible response rate for this question, the survey asks for
income within ranges instead of specific amounts. Data from other household surveys
that collect detailed income data will be needed to determine the four ranges (quar-
tiles) to be used here. These should be four equal-sized groups (i.e., with one-fourth of
people in each group), ranging from those with the lowest incomes in the first group to

Measuring finanCial Capability: questionnaires and iMpleMentation guidanCe for low- and Middle-inCoMe Countries
24
those with the highest incomes in the top group. The income ranges that are included
in each group should be entered in Question F12.
Question F21 and F23. These questions refer to the plural you, in this case the
household. In English there is no difference, but it is important that this be captured
correctly in any translation. For English or other languages that do not distinguish
between the singular and plural in the pronoun, the interviewer manual must high-
light the plural nature of the questions.
Question F23. As with asking about individual incomes, as described above, asking
household-level income questions can be problematic. The same solution used for
individual income is used for household income. Data from other household surveys
that collect detailed income data will be needed to determine the four ranges to be
used here. Using these other survey data, all earnings in each household should
be summed to obtain a household income figure.4 This per capita income should be
ranked from lowest to highest. This then is divided into quartiles (i.e., with one-fourth
of people in each group), ranging from those with the lowest per capita incomes in
the first group to those with the highest in the top group. The income ranges that are
included in each group should be entered in Question F23.
2.2 OPTIONAL QUESTIONS AND MODULES
2.2.1 Time
At the end of each section, there is a question that asks for the time. This allows
a calculation of the time needed to administer each section of the questionnaire.
Certainly in the pilot test of the questionnaire these should be included. Whether
this information is collected in the main survey is up to the implementing team. The
advantages of collecting these data are that (1) an accurate picture of how long each
section of the questionnaire takes can be obtained, which may inform future rounds
of the survey; (2) information on the difficulties of response by different types of
respondents (using time as a proxy) can be assessed; and (3) time data can be used
to assess the quality of the interviewers. The disadvantage is that it requires an extra
step on the part of the interviewers. The benefits appear to outweigh the costs but,
since the data are not used to analyze financial capability, these questions can be
seen as optional.
4 Ideally, one would do this at the per capita level. It is not, however, clear that respondents can
provide a per capita household income figure or how accurate it would be. Thus the ranges
are only at the household level. If one is interested in ranking households on welfare status,
this decision would need to be revisited and additional fieldwork done to determine the best
method to obtain a robust welfare ranking.

CHapter 2. questionnaires: purpose, Content, and CustoMization needs
25
2.2.2 Questions not used in the scores
There are a few questions that are not used in the financial capability scores (see
chapter 4 about analyzing the data) that may have a limited role as explanatory vari-
ables. For this reason, they can be considered optional if there is a need to restrict
the length of the survey. Unless there is a compelling reason to drop these questions,
however, it is recommended that they be kept as they can inform other types of
analysis. These are:
� Questions C5 and D11–D16
� Questions E19–E24
� Questions F13–F16 and F24–F27
These questions were more useful in countries where the role of community was
greater and appeared to be less relevant in other locations. It is recommended that
the questions be examined for relevance in each country and tested if need be.
� Questions G3–G5
These questions were always intended to be optional. They provide interesting infor-
mation, particularly for financial education programs. However, there was a concern
in some of the participating countries that these questions give the impression that
the interviewer is trying to sell some particular financial product. This is not the
purpose of the questions, but in places with recent Ponzi schemes or similar scan-
dals, it may be advisable to omit these questions.
2.2.3 Additional optional sets of questions/topics
In the process of developing the questionnaires for the first seven countries that
implemented the FCS questionnaires, additional topics were identified as being of
interest for specific countries. While these topics did not fit directly into the finan-
cial capability framework developed in the qualitative framework, they are certainly
topics relevant to the study of financial behaviors more broadly. Appendix B contains
a copy of the Optional Questions for the Individual Questionnaire. There are seven
topics covered: the source of each is listed in the questionnaire modules themselves.
� Financial literacy
� Banking
� Financial inclusion
� Credit cards
� Remittances
� Financial intermediaries
� Consumer protection

Measuring finanCial Capability: questionnaires and iMpleMentation guidanCe for low- and Middle-inCoMe Countries
26
It is recommended to consult the original sources for the specific purposes of these
modules and the issues that may arise in implementing them.
As with the questionnaires, areas in the interviewer manuals that must be custom-
ized prior to fielding the survey are highlighted in yellow.
2.3 LOCATION QUESTIONNAIRE
The Location Questionnaire is a simple form designed to capture basic data on
the context in which the interviewed individuals live. In some countries, it may be
possible to obtain this information from administrative records, but it is more likely
that the data will need to be collected in parallel with the Individual Questionnaire.
The full questionnaire can be found in appendix C.
2.3.1 Purpose
The purpose of this questionnaire is to provide information on the community or
location in which respondents live that might affect their behaviors and attitudes
toward financial services. The questionnaire is designed to collect information on the
socioeconomic position of the community. It is also used to understand the services
that are or are not available to the population. The information collected in this ques-
tionnaire is designed to be analyzed in conjunction with the data from the Main (Indi-
vidual) Questionnaire. The Location Questionnaire is not designed to carry out studies
of locations or communities per se, as the information is collected only about the
enumeration areas in which the sample of households for the survey are selected. As
such, it is not a stand-alone instrument: its only value is in relation to the Main (Indi-
vidual) Questionnaire.
2.3.2 Who should administer the location questionnaire?
The supervisor should implement this questionnaire in each enumeration area for
which he or she is responsible. This assumes fieldwork where supervisors are field-
based staff and are not confined to an office. This is the preferred way to guarantee
quality but may not always be the case. Ideally, fieldwork will be developed in such
a way that interviewers are under close supervision in the field and have access to
their supervisor to resolve issues that arise and answer questions.
In the absence of a supervisor in the field, the questionnaire will need to be admin-
istered by an interviewer. Time and budget will need to be allocated to this extra
activity of the interviewer.

CHapter 2. questionnaires: purpose, Content, and CustoMization needs
27
2.3.3 Who should respond?
LOCATION FACTS
The respondent for this questionnaire will vary substantially across and within
countries. The unit of analysis is an enumeration area, which has no administrative
standing: it is simply a geographical area defined by the national statistics office. As
such, it may not always be intuitive who should answer questions about the commu-
nity. There may be local leaders, mayors for example, who would be appropriate. But
for large urban areas or small rural ones, the team will need to identify a community
leader who has the knowledge to answer all of the questions. This may be someone
with a formal role in the community (school teacher, health professional, religious
leader) or simply someone whom the community looks up to and recognizes as
knowledgeable.5
In some countries, some of the data can be found in administrative records. This is
probably not the case in the majority of countries, but the survey team should inves-
tigate what information can be obtained ahead of time. Using appropriate adminis-
trative data—if these are of reliable quality—will simplify the fieldwork, saving time
and resources.
LOCATION PERCEPTIONS
The respondent for the second section of this questionnaire is the interviewer who
is carrying out interviews in the enumeration area. The data to be collected here are
solely that of the interviewer’s impressions of the status of the community vis-à-vis
other communities of its type (urban or rural) in the country. The thinking behind
this is twofold. First, the data are a way to provide a summary of a community: it
is possible in urban slums, for example, that there are services and most of the
answers seem fairly positive, while the reality is quite different. Having a perception
variable may help capture this. Second, community leaders may have very different
opinions on certain topics, and there is no way to check the “facts” that they provide.
In training, it is possible to calibrate across interviewers: interviewers can be given
an average community against which to measure the location they visit. Thus, the
perception questions may be used to provide a consistent metric across locations.
5 Note that community leaders are not always as knowledgeable as would be assumed (see
Frankenburg 2000 for examples of this), and the interviewer may need to call on more than one
person to obtain all of the information. In some settings, a community meeting has been orga-
nized to collect the information (see World Bank 2003 on Panama for an example). Given the
brevity of the instrument, a community meeting seems unnecessary and unproductive unless
there is no other option.

Measuring finanCial Capability: questionnaires and iMpleMentation guidanCe for low- and Middle-inCoMe Countries
28
2.3.4 Special Issues
MATCHING ON GEOGRAPHIC CODES
The most important consideration to be kept in mind with this instrument is that
the data on the cover page are accurate and consistent with the cover page of the
individual questionnaire. No location information is collected for each household:
instead, to save time and resources, one location questionnaire is administered for
all households in an enumeration area (often 10–20 households). These data are
then assigned to each household: this can only be done if all of the geographical and
sample information is the same for the location questionnaire and the Main (Indi-
vidual) Questionnaires (down to the level just before dwelling number).
DEFINITION OF A LOCATION
A location, in terms of this questionnaire, is simply the enumeration area where
households in the sample are located. It is critical that the supervisor asks the ques-
tions relative to the enumeration area, even if he or she is interviewing a commu-
nity leader who lives in another part of town. The key questions of the survey are
on distances to other services, many of them financial. As distance is an important
explanatory variable in the use of such services, it is important that the distance vari-
ables be as accurate as possible.
2.3.5 Customization
Beyond the geographic codes that need to match the individual questionnaire there
is little to customize in this survey instrument. Clearly, the names of school levels
and types of financial instruments may differ from what is in the questionnaire and
will need to be adapted.
The perceptions of the communities on the part of the interviewers are optional and
can be dropped. Deciding to drop this will depend on the extent to which the survey
team feels that community leaders can provide accurate information or on the pres-
ence of alternative sources of data.
The questionnaire was deliberately kept as short as possible. There are many other
questions that could be asked that could be relevant to the study of financial capa-
bility, and there is no reason why the survey team should not think about expanding
the questionnaire as desired. The costs in supervisor time need, of course, to be
balanced against the benefits of the additional questions. As always, it is important
to think through the models and analytic framework before adding questions to any
survey instrument.

CHapter 2. questionnaires: purpose, Content, and CustoMization needs
29
As there is for the Individual Questionnaire, there is a detailed interviewer manual
for the Location Questionnaire. This manual, which can be found on the World Bank’s
RTF project website, will also need to be customized.
2.4 INTERVIEWER QUESTIONNAIRE
There are two reasons to collect information on the characteristics of the enumera-
tors. First, there is little information on how interviewer characteristics affect survey
data collection: understanding the interactions could both help the analysis of the
present survey and serve to improve data quality in a subsequent survey. Second,
information on interviewer characteristics can be used to provide valid instruments
in the case of missing data on specific questions. Interviewer characteristics are
likely to be correlated with nonresponse, but are not correlated with the outcome of
interest, and so they can potentially be valid instrumental variables in the analysis
of sample selection issues due to nonresponse. The interviewer questionnaire (see
appendix D) is a short, self-administered instrument. Interviewers should fill this out
prior to fieldwork. Each interviewer will have a unique identification code that will be
entered on both this questionnaire and the cover page of the Main Questionnaire.
Care will need to be taken that the codes are accurately entered. The data from this
instrument will also need to be entered electronically and shared, without names or
other identifying features, with the other data sets (Main and Location).
2.5 CONVENTIONS IN ALL QUESTIONNAIRES
In any survey, there are standard conventions that apply. It is completely reason-
able to think that a particular survey firm or statistical office will be accustomed
to different conventions—and, more importantly, that its interviewers will be
accustomed to these conventions. In this case, it makes more sense to replace the
conventions in the FCS with those the interviewers are used to rather than poten-
tially create confusion by asking them to learn an entirely new system. Here we
explain the conventions used in the FCS questionnaires and the reasons for them:
alternatives are perfectly acceptable as long as they allow interviewers to recognize
the key features of the questionnaire and the questions as described here.
� Instructions to the interviewer. In several places in the questionnaire there
are explicit instructions to the interviewer. In the FCS questionnaire, anything
written in italics and bold is an instruction to the interviewer and should NOT
be read out loud. Sometimes these instructions tell the interviewer to probe
on a certain question, or specify when there are skips.

Measuring finanCial Capability: questionnaires and iMpleMentation guidanCe for low- and Middle-inCoMe Countries
30
� Explicit skips. In the FCS it is expected that all questions will be asked and
answered in the order in which they appear on the questionnaire. The only
exceptions are where explicit skips are indicated. Such skips exist when the
answer to one question renders the subsequent question irrelevant: Ques-
tion R5 asks for marital status, if the response is “widow,” it would be absurd
to then ask the respondent to identify his or her spouse in the household
(Question R6). All skips follow the response code to which they apply and are
carefully labeled on the questionnaire, e.g., “Go to Question B6.”
� Question options. Most of the questions in the FCS Individual Questionnaire
are closed-ended, meaning that there are a set number of answers that have
been precoded. In some instances, the choices are to be read aloud to the
respondent, in other places the answers are not read aloud so as not to affect
or lead the respondent in any way. Where the answers are not to be read out,
the text says “Do NOT prompt using the codes below” (e.g., Question B8).
Where they are to be read out there is an interviewer instruction saying “Read
out” as is done in Question C5.
� Other, specify. To ensure that the answer categories to each closed-ended
question are exhaustive, the category “other” is included. Any answer that
does not fit into an explicit category is coded as other. Typically, it is expected
that the other category will represent less than 5 percent of all responses. (It
makes little sense to try to have separate categories for such rare answers,
as there is little that can be done analytically with them.) However, in some
questions, there may be an interest in actually capturing this information. In
these cases, after “Other” it says “specify.” Here the interviewer is required to
write the response given. (Note that, for the pilot test, it is recommended to
have “other, specify” for all closed-ended questions. On the one hand, this is
an opportunity to determine if there are additional categories that should be
included in the full survey with their own code. It is also a way of verifying that
the interviewers are correctly coding the answers that the respondents are
giving them: often, interviewers will code in “other” answers that actually do
have a code.)
� Brackets {} or []. Sometimes in one question it is necessary to refer back to
the answer given in a previous question. This occurs in Section D on products,
where Questions D4–D9 refer to a financial product that was selected from
Question D3 as being the most complex one they personally have chosen in
the past five years. There is an interviewer check at D4 that enables him or her
to identify the type of product that needs to be referred to in the subsequent
questions containing brackets {}.

31
CHapter 3
s urvey implementation
As mentioned above, this manual does not presume to provide all of the guid-
ance needed to develop and implement a good survey but instead highlights
those specific aspects that are of critical concern for this survey of financial capa-
bility. See Kish (1941) for the seminal work on probability sampling; many other
textbooks exist that can also be used. For fieldwork organization and data entry,
documentation of existing surveys provides practical guidance (see worldbank.org/
lsms for multiple examples; also see Grosh and Munoz 1996). National institutes of
statistics and census bureaus also are excellent sources of information on all topics
related to survey implementation.
3.1 SAMPLING
Sampling theory provides a tool that allows a subset of individuals to be selected
who represent the universe of people to be studied, thus saving time and resources.
The validity and usefulness of the FCS, and any other survey, rest on the quality of
the sample design. Done correctly, probability sampling is a powerful tool that makes
possible a wide range of research. Done incorrectly, sampling can seriously, if not
completely, undermine the validity and utility of the resulting data. Sampling is an
area in which including an expert is highly recommended. Not all survey firms have
experience with probability sampling.
3.1.1 Probability sampling
A probability sample allows a subset of the population to be chosen in such a way
that the results can be extrapolated to the entire population or universe of interest.
The selection process is designed to give each person in the universe a known and
nonzero probability of selection. With this knowledge, the resulting sample can be
weighted to represent the full population. There are many methods of probability
sampling, ranging from simple random sampling performed if there is a list of all
persons in the country and cost is not a consideration, to multistage samples that
take advantage of stratification and cluster samples to increase precision and lower

Measuring finanCial Capability: questionnaires and iMpleMentation guidanCe for low- and Middle-inCoMe Countries
32
costs.1 It is expected that a multistage probability sample will be used; the exact
form of that sample will depend on the sample frames available in the country and
the overarching goals of the surveys.
The FCS needs to be based on a probability sample. When the survey is undertaken
by the national statistical office or census bureau, the use of a probability sample
should be straightforward: this is how such organizations implement surveys. If a
private firm or other entity of the government is carrying out the survey it is recom-
mended to work with the national statistical agency to have the sample design done
based on the census frame of the country. Oftentimes one can contract the agency
for this purpose. The difficulties arise when using private firms that do not have any
experience with probability sampling and/or in countries where the national statis-
tical agency will not provide a sample frame for a private firm. In these cases alter-
native sources of data on the population of interest will need to be explored. Except
in a very small handful of countries, complete lists of the population are very hard to
come by. Voting registration records may be a source in countries where registration
is mandatory, but even these may omit some elements of the population. This lack
of alternative sources of population lists is the reason so many firms rely on random
walks rather than drawn samples.
3.1.2 Why not nonprobability sampling?
Nonprobability sampling techniques often produce results that are not strictly repre-
sentative of the population of interest or, in the worst cases, provide quite biased
samples. Typical examples of nonrandom samples are quota samples, snowball
samples, and random walks. All of these methods can suffer from bias: one can
imagine a quota sample of adults where the quota is half males and half females (to
match the population share of each gender in the country) that would not represent
the population on any other criteria (socioeconomic status, education, financial capa-
bility, for example). Random walks are often used but suffer from both theoretical
and practical problems (interviewers often have too much leeway in the field and
have incentives to avoid dwellings in difficult areas or with unfriendly residents). Two
recent studies (Schnell 2008; Bauer 2012) provide evidence on the problems of using
random walks for sample selection.
If all alternative sources of population frames have been explored and it is deter-
mined that a probability sample cannot be designed, the choice is whether to carry
out the survey at all. If the decision is made to do a random walk as the “next best”
alternative, some particular effort will need to be made to minimize the degree of
1 Stratification increases sample precision; cluster sampling may actually decrease precision,
but works to lower fieldwork costs.

CHapter 3. survey iMpleMentation
33
bias. Detailed field training of interviewers to ensure that each actually knows the
rules and how to implement them is critical to avoid the obvious biases that can
arise. Having interviewers select samples in areas where they are not interviewing
downplays incentives to manipulate the system. Close supervision and full documen-
tation of all work is critical as it allows a check of the selection process and whether
what the interviewer does can be replicated. Finally, in the survey documentation it
is necessary to be transparent about what was done and the potential biases that
might arise and their implications for policy conclusions.
3.1.3 Selection of the individual to interview
Typically, the sample frames that will be available are lists of dwelling (addresses).2
The selection of the dwellings can (and should) be done by the central survey staff
and the relevant information provided to the interviewers. However, it is not usually
possible to select the individual to be interviewed ahead of time: lists of names and
ages of all household members do not exist and, even if they did, would be out of
date so quickly they would not be reliable. In practice this means that the selection
of the respondent is done at the time of the interview by the interviewer.3 To ensure
that the final sample of individuals is a true probability sample that represents the
country, or all adults in the country, a method is needed to randomly select the
respondent from the full list of eligible household members.
The method of random selection of a household member to be interviewed used
here is a variation of the Kish table. The table depends on two accurate pieces of
data. The first is the number of eligible members of the household. For the FCS this is
all household members aged 18 and older. The other is a random number associated
with the household. Here this is the unique identification number of the question-
naire that is assigned in the central office and is uncorrelated with the interviewer or
the area of the country. Using these two facts, the interviewer can select a respon-
dent in such a way that each adult has a known and nonzero probability of selection.
The Kish table included here is a relatively solid method of selection. While there
is some small bias in the final results (Németh 2003) the method has several very
important features which make it the preferred method for selecting a respondent.
2 In extremely rare cases, there may be a complete list of adults in the country that could be
used as a sample frame. In this case one could avoid the sample of dwellings. However, unless
the names were associated with addresses that could be used to do a multistage sample
design, using this list would be prohibitively expensive. This manual assumes that a standard
dwelling-based sample is used.
3 Of course, an interview team could be fielded to collect the list of names, send them to the
center offices and have the selection be done there. This is not done as it is time consuming
and costly and may increase the rate of nonresponse as households would need to be visited
more often.

Measuring finanCial Capability: questionnaires and iMpleMentation guidanCe for low- and Middle-inCoMe Countries
34
Of primary importance is that the selection is replicable: given the unique question-
naire identification number on the cover page and the roster, it is possible to repro-
duce the selection made in the dwelling by the interviewer during the administration
of the questionnaire.
It is imperative that the interviewers be well trained in the use of the Kish table
and well supervised. Interviewers have incentives to select the respondent from
someone who is present at the time the interviewer visits the dwelling (so as not to
have to return at a later date) or whomever appears to be the most open or easiest
to interview. This is particularly true when interviewers are paid by the completed
interview with no allowance made for multiple visits, rather than being paid by the
week or month. Like any tool, the Kish table can be manipulated (age changes, indi-
viduals left off the list of members, order of members changed to ensure the easy
to interview person is selected and the like). Certainly in the pilot phase, there was
evidence of misuse of the selection process. Supervision and training are critical.
3.2 TRAINING
Interviewer training is critical for the successful implementation of the survey.
Interviewers need to understand the purpose and content of the overall survey and
each individual question. They need to administer the instruments in a consistent
manner and follow all instructions and protocols of the survey. They also need to feel
comfortable asking respondents questions about financial matters and their income
in particular. Training affects quality in a variety of ways that are not always recog-
nized. A good interview is one that is almost a conversation between two people:
the interviewer and the respondent. Interviewers who know the questionnaires thor-
oughly and understand their roles are much more capable of making the personal
connection, the conversation, with the respondent. This affects nonresponse rates
(which we can measure) and the quality of the data provided (which we cannot).
Training for the FCS should be rigorous. The questionnaire has been designed to be
as straightforward as possible. Even so, some complexity cannot be avoided. There
are a range of types of questions that are asked, from yes/no to open-ended to moti-
vation questions. Interviewers need to learn skip patterns, techniques to avoid nonre-
sponse, and most importantly as mentioned above, respondent selection. There is
often an assumption that experienced interviewers need little training. This is not the
case, as each questionnaire has a different content, purpose, and structure; and the
protocols and procedures that surround them will also differ. Second, experienced
interviewers may also be the ones with bad habits if they have not been properly
supervised previously.

CHapter 3. survey iMpleMentation
35
3.2.1 Training materials and manuals
The interviewer manuals and the present document are an important source of
training materials. Developing sound training materials is critical. It is imperative
that each interviewer administer the questionnaires in the same way, has the same
understanding of the questions and has received the same guidance on what to
do in special cases. Having a full set of training materials ensures this homogeneity
across interviewers. This is of special importance for large surveys where more
than one person will be doing the training (to ensure homogeneity across trainers)
and where more than one training center will be operating (to ensure homogeneity
across regions).
3.2.2 Training content and schedule
It is recommended that training be at least a full week with practical field exercises
(test interviews) being done. The field practice helps to identify weaknesses in the
interviewers (and the training). At the same time, it is a chance for the interviewers
to assess how well they have learned the material: there are usually substantial
questions that come from the interviewers after such practicums. Also, it is a chance
for new interviewers to determine if they have the aptitude to be an interviewer: it
is not an easy job, and not everyone—no matter how studious or intelligent—will be
successful.
3.2.3 Testing
Finally, we recommend the use of interviewer testing at the end of training to deter-
mine who will be contracted for the surveys. While this is not standard practice,
experience in other surveys has shown that this can have a strong positive effect
on the quality of the survey. In this scenario, interviewers are told at the beginning
of training that only those who receive a certain score on the tests will be hired
as interviewers. Simply announcing testing helps ensure that the trainees are
very focused on the training; this is particularly important if the interviewers have
substantial experience in other types of surveys. Second, by testing, the survey team
can identify weaknesses in the training, or areas where all interviewers are showing
a lack of comprehension, and can take the opportunity to review materials as
needed before the survey begins. Finally, the testing will help to select only the best
interviewers, with obvious implications for data quality and the success of the survey.
Testing should be both written and practical.

Measuring finanCial Capability: questionnaires and iMpleMentation guidanCe for low- and Middle-inCoMe Countries
36
3.3 SURVEY ORGANIZATION
3.3.1 Interviewers
The interviewers’ main responsibilities are to (1) correctly identify the dwelling that
has been selected, (2) administer the questionnaires as instructed, and (3) provide
supervisors with completed questionnaires. The interviewer manual (for the Main
Questionnaire) provides a complete list of the do’s and don’ts of being an inter-
viewer. Each survey firm will have its own protocols about how the interviewer
organizes his or her work. Here we focus simply on the flow of the interview and the
incentive structures that can be put into place.
WORK FLOW
The work of the interviewer is outlined in figure 3.1. The interviewer starts the inter-
view by visiting the household where he or she attempts to fill out the roster, select
the respondent and carry out the interview in one visit. It is not always possible to do
this and the interviewers should follow a protocol of visiting a household three times
before the household can be considered a nonresponse. If the selected respondent is
not available the interviewer should set an appointment to visit the household when
the respondent will be available and return at that later time.
INCENTIVE STRUCTURES
Ideally, interviewers should be just interviewers. They should not be responsible for
the sample selection nor data entry, ex post coding or any other function. In the FCS,
the interviewers are responsible for selecting the respondent which is inherently
risky. Every effort must be made to ensure that this is done well and to avoid the
incentives that interviewers have to incorrectly select the respondent. There are
two factors that will help to ensure that interviewers make the requisite number of
visits and correctly select the respondents. First, close supervision in the field must
be carried out. Supervisors need to revisit nonresponding households to verify that
the household could not be found or refused to participate. They also need to check
to be sure the roster is complete and done in the proper order so that the Kish table
is properly applied. Second, interviewers should not be paid solely by completed
interview as this can lead to higher nonresponse rates and even biased samples as
incentives to finish quickly dominate. Paying by the time period (with the expectation
that a certain number of interviews be completed) can help to minimize this negative
incentive.

CHapter 3. survey iMpleMentation
37
3.3.2 Supervisor
The role of the supervisor has been mentioned several times already. Figure 3.1
also highlights the role of the supervisor. Supervisors need to play an active role in
the fieldwork and be in the field. Administrative activities such as paying per diems,
counting completed questionnaires and sorting out transportation are all part of the
job, but to positively affect the quality of the fieldwork the supervisors have to be
visible partners to the interviewers. Supervisors need to ensure that the sample of
dwellings is properly administered, that the selection of individuals is correctly done,
and that the interviewer is carrying out the work correctly. Supervisors should also
help to overcome nonresponse and answer any questions that arise during the field-
work. Finally they are the link to the data entry operators and the central office.
figure 3.1 interviewer work flow
Enter result of visit on cover sheet
Dwelling visited 3 times?
No
YesDwelling found?
Responsible adult
available?
Respondent available?
Accepts interview?
Enter result of visit on cover sheet
Enter result of visit on cover sheet
Administer roster
Select respondent (Kish)
visit selected dwelling
Enter day and time of visit on cover sheet
Inform supervisor
Interview respondent
Sections A–G
End
Set up appointment for interview
Yes
Yes
No
No
Yes
No
Yes
No

Measuring finanCial Capability: questionnaires and iMpleMentation guidanCe for low- and Middle-inCoMe Countries
38
3.4 DATA ENTRY
Each survey firm will have its own data entry system. Traditionally, fieldwork has
been separated from data entry, with the data entry taking place in the central
offices often after the fieldwork has been completed. We would recommend that
data entry be incorporated into the fieldwork, either as a system of concurrent data
entry (CAFE, computed assisted field entry) or as CAPI (computer-assisted personal
interviewing where the questionnaire is no longer paper but in electronic form). As
part of the fieldwork, the data entry system can be used to identify errors in the
information collected from the households and provide rapid guidance to supervisors
and interviewers on what households need to be revisited to resolve the problems.
The standard CAFE system has been used for the last 25 years in many complex
surveys; it provides a quick turnaround time after data are collected and improves
data quality (World Bank 1996; Scott, Steele, and Temesgen 2001). Essentially, the
data entry person and relevant equipment are in the field with the interviewers; as
interviews are finalized, the data are captured and the software application produces
a list of missing values, out-of-range answers and inconsistencies (within and across
records). With this information, decisions can be made about revisiting the respon-
dent to recover the missing data or clarify inconsistencies. Resolving data issues this
way avoids lengthy and not very satisfactory imputation work ex post.
CAPI systems are more recent and have great promise for improving data quality
(see IRIS Center 2011 for a review of the pros and cons of CAPI). Instead of using a
paper and pencil questionnaire, each interviewer has a hand-held electronic device
containing the questionnaire. The interviewer enters responses directly into the
device. This provides real time feedback on errors and omissions and has been
shown to increase data quality. Additionally it eliminates the data entry phase and
allows data to be available more quickly for analysis although it does mean that the
lead time for the survey is longer as the application needs to be fully developed and
tested.4 The FCS questionnaire has been designed for paper and pencil application
but was also, in two countries, converted to a CAPI application. Several sections of
the questionnaire would be easier to administer in a CAPI setting.
3.5 DATA CLEANING
The goal of the survey is to collect accurate and complete data from households.
Investing in the previous phases of the survey (questionnaire design, training, data
4 It does, however, require more time up front to develop, test and debug the application.
Overall, the time saving is probably not the main reason to do CAPI.

CHapter 3. survey iMpleMentation
39
collection, supervision and data entry) will help to minimize the data cleaning that is
needed. While there are many techniques for data cleaning none of them guarantee
that the resulting data are an accurate reflection of the respondents’ true answers
and thus all attempts to prevent having to do much data cleaning should be made.
3.5.1 Documenting the process
As the amount of data cleaning needed reflects data quality, it is useful to provide
the data user with some measures of this. Figure 3.2 shows a simple way to summa-
rize data quality checks. The figure is from the fieldwork done in seven countries and
shows, for example, that Section E was easy to implement while Section F was more
prone to errors.
figure 3.2 data CHeCks
Source: Kempson, Perotti, and Scott 2013.
Note: Data are for Armenia, Colombia, Lebanon, Mexico, Papua New Guinea, Turkey, and Uruguay.
3.5.2 The final data set(s)
There is always the temptation to correct all errors in a data set, imputing missing
values and resolving inconsistencies following a series of rules. However, there
are always a variety of techniques for imputations and each is based on a series
of assumptions. Not all analysts will want to make the same assumptions. For this
reason it is preferred to disseminate the data set “as is,” i.e., without imputations
or to construct separate variables that include the imputation and leave the original
variable as it is. This allows the analyst to make his or her decisions about how to
deal with missing or inconsistent data. Of course, not everyone will need to make
their own imputations, thus having the “cleaned” variable along with the original vari-
able is also useful.

Measuring finanCial Capability: questionnaires and iMpleMentation guidanCe for low- and Middle-inCoMe Countries
40
3.6 DOCUMENTATION
The survey should be fully documented. Documentation is a tool for the user of the
survey and works to ensure that the data can be used in their entirety and properly.
Without complete documentation data analysts will often misuse data through erro-
neous use of the sample, relying too heavily on sections that were problematic, not
taking into account seasonality, among other things. Data analysts rely heavily on the
documentation of the survey.
A second goal of documentation is to provide institutional memory around the
survey. Most surveys are not done just once but are repeated in the future. By orga-
nizing all of the relevant information about how the survey was developed, tested,
implemented and analyzed, the team is ensuring that a subsequent survey will be
comparable and will help the later team avoid reinventing the wheel and major
pitfalls. It is recommended that the documentation process begin early in the survey
and that, at each step, the summary notes and supporting materials are collected.
In this way at the end of the survey, when the team is often moving on to other
projects, the work to assemble the final documentation will be simpler and, thus,
more likely to be done. An outline for a basic information document that should be
prepared can be found in box 3.1. This outline will need to be adapted to each survey
and its specific features and issues.

CHapter 3. survey iMpleMentation
41
box 3.1 basiC inforMation doCuMent: table of Contents
1. Introduction
a. Purpose
b. Implementing agencies and funding sources
c. Short description
2. Overview of Survey Instruments
a. Table with: Questionnaire sections, level of data collection, respondent and
description
3. Sample Design
a. Original design
b. Final sample size (households, individuals)
4. Training
5. Format, number of training centers
6. Test
a. Description
b. Lessons learned
c. Resulting Changes in questionnaire and fieldwork
7. Fieldwork
a. Organization and timing
b. Teams: composition and distribution (in time and space)
8. Data Entry and Cleaning
a. Features of data entry software
b. How data entry linked to fieldwork
c. Main errors and lessons learned
9. How to Use the Data
a. Structure of data sets
b. Unique identifiers for matching
c. Constructed variables
d. Caveats—data quality issues
10. Comparison to Earlier Data Collections
a. Degree of comparability to previous surveys
11. Calculation of Constructed or Derived Variables
a. Purpose of variables
b. Links to code used to construct them
Appendix A. How To Obtain Copies of the Data
Appendix B. Full Sample Design (including weights)
Appendix C. Basic Descriptive Statistics
Appendix D. Notes on the Data
Appendix E. Codes Not Found in the Questionnaires
Appendix F. Explanation of Data Collection Method
Appendix G. Training Materials and Tests


43
CHapter 4
a nalysis
4.1 WEIGHTS
When probability sampling is used weights can be constructed that reflect the prob-
ability of selection of the household and the individual respondent. Household level
weights are used whenever the household is the unit of analysis. As the focus of the
FCS is on individual financial capability the individual level weights will be used more
frequently. Individual weights should reflect the probability of selection of a house-
hold member aged 18 or older (the eligibility criteria). If the application of the Kish
table is correct then the probability of selection of an individual is the product of the
probability of selection of his or her household and one over the number of eligible
adults in the household.
The calculation of weights is based on the initial sample design adjusted for nonre-
sponse. Full documentation of the construction of these weights should be part of
the documentation of the survey. All variables used in the sample design (strata,
primary and secondary sampling units and the like) must be included in the final
database.
4.2 DESCRIPTIVE STATISTICS
The first step in analyzing the data is to produce simple tabulations of frequencies
and basic descriptive statistics for the key variables of interest (statistics that may be
used include the mean, standard deviation, median value, percentiles, minimum and
maximum values, and so on). Producing basic statistics allows the analyst to under-
stand the structure of the data set and to pinpoint any problems that may exist.
It also provides the means to carry out a further check of data quality. Most coun-
tries have at least one, if not more, household-level survey that is done with some
frequency. Results of the FCS should be compared to these other surveys for all vari-
ables which they have in common (demographics, employment, and the like).

Measuring finanCial Capability: questionnaires and iMpleMentation guidanCe for low- and Middle-inCoMe Countries
44
4.3 FINANCIAL CAPABILITY SCORES
One key objective of the FCS is to develop indicators of financial capability that are
as neutral as possible with respect to culture and to education or income levels, and
that can be used for comparisons across countries. Financial capability is an abstract
concept that cannot be measured directly: the FCS has developed measures of finan-
cial capability that rely on manifestations of it (in the form of behaviors and motiva-
tions) in areas such as day-to-day money management and planning for the future.
A long process of qualitative research and quantitative analysis was conducted in
12 pilot countries to identify the key manifestations of financial capability and to
develop a scoring system to measure capability with respect to these manifestations.
A full description of this process can be found in Kempson, Perotti, and Scott (2013). A
key result of the analysis presented in the full report is that it is not possible to develop
a single indicator of financial capability. Instead, the results indicated that capability
can be measured consistently across the following 10 components:
� Budgeting
� Monitoring expenses
� Living within means
� Using information
� Not overspending
� Saving
� Covering unexpected expenses
� Attitude toward the future
� Not being impulsive
� Achievement orientation
Once the survey is completed, the resulting data can be processed to create finan-
cial capability scores for each of the 10 components. A score ranging from 0 (least
capable) to 100 (most capable) can be calculated for each of these 10 components
by following these steps.
1. Construct the key variables needed by combining the information provided by
the relevant questions (see table 4.1). The result is a set of “derived” variables.
As an example, we will refer to a generic variable V (which could be plan_freq, or
any other variable in table 4.1).
2. Add two hypothetical (“fake”) observations to the sample. These will repre-
sent the most capable and least capable cases. The most capable will have the
highest value for each of the derived variables, whereas the least capable will
have the lowest value for each of the derived variables. For example, in the most
capable case plan_freq = 3, and in the least capable case plan_freq = 1.

CHapter 4. analysis
45
3. The next step is to standardize each of the derived variables. To do this, calculate
the mean of each derived variable. Then, for every person in the database (every
record) subtract the mean of the variable from that person’s value and divide by
the standard error. In a simple formula:
4. Calculate each of the 10 component scores by using the coefficients reported
in table 4.2, which are the result of the analysis described by Kempson, Perotti,
and Scott (2013). First, the value of each derived variable is multiplied by the
relevant coefficient. For example, for plan_freq, if the first person in the database
had a value of 2 for this variable, then his or her score on plan_freq would be:
0.36 * 2 = 0.72. To calculate the component score add the scores of each derived
variable that belongs in that component. For example, for “Budgeting” the score
is: (plan_freq* 0.36) + (plan_exactly*0.35) + (plan_keep*0.36).
5. Do the same calculation as in point 4 to calculate the score for the hypothetical
most capable person. This value is the maximum score.
6. Do the same calculation as in point 4 but now for the hypothetical least capable
person. This value is the minimum score.
7. For each person (every record in the database) rescale the score using this formula:
This method is based on the assumption that the coefficients estimated from the
seven pilot countries are also applicable in the new study. If there is an interest to
test this assumption by estimating new coefficients, a more complex analysis needs
to be conducted by applying factor analysis to the derived variables, as was done to
obtain the coefficients reported here. Given the higher complexity of this alternative
approach, the expertise of a statistician or expert in factor analysis will be required.
For details of the methodology used to obtain the coefficients reported here, the full
report should be consulted (Kempson, Perotti, and Scott 2013).1
1 The method used in the World Bank’s RTF project to develop the scores is factor analysis
with principal component factoring. Principal component analysis (PCA) is a data reduction
method that identifies a small number of components that explain most of the variance of a
group of variables. By analyzing the correlation structure of variables in the data set, PCA iden-
tifies groups of variables that are explained by (or “load on”) the same unobserved underlying
component. For example, if all the variables generated from the five questions about planning
expenses against income load on the same component, the resulting component can be used
as a measure for “budgeting.”

Measuring finanCial Capability: questionnaires and iMpleMentation guidanCe for low- and Middle-inCoMe Countries
46
table 4.1 key derived variables obtained froM tHe survey questions
vARIABLE MEANING COMBINATION OF vALUES
plan_freq Whether makes a plan and fre-
quency
B1,B2 1 “No”
2 “Sometimes”
3 “Always”
plan_exactly Whether makes a plan and pre-
cision of plan
B1,B3 1 “No”
2 “Roughly”
3 “Exactly”
plan_keep Whether makes a plan and how
frequently sticks to the plan
B1,B4,B5 1 “No plan”
2 “Plans, never keeps”
3 “Plans, sometimes keeps”
4 “Plans, always keeps”
money_left Whether has money left over
and frequency
B6,B7 1 “No”
2 “Sometimes”
3 “Regularly”
money_left_do Whether has money left over
and how the money is used
B6,B8 1 “Does not have money left”
2 “Has money left and only spends on non-essentials”
3 “Has money left and saves/spends on essentials”
money_short_rev Whether runs short of money
and frequency (REVERSED)
B9,B10,B13, B14 1 “Regularly”
2 “Sometimes”
3 “No”
money_short_
why
Whether runs short of money
and why
B9,B10,B11,B13,
B14
1 “Runs short because of overspending”
2 “Runs short for other reasons”
3 “Does not run short”
borrow_food_rev Whether borrows money to buy
food and frequency (REVERSED)
B13,B14 1 “Regularly”
2 “Sometimes”
3 “No”
borrow_debt_rev Whether borrows money to
repay debts and frequency
(REVERSED)
B15,B16 1 “Regularly”
2 “Sometimes”
3 “No”
borrow_afford Whether comfortable with level
of borrowing
B21,B22 1 “Borrowed more than affordable”
2 “Borrowed to limit”
3 “Could borrow more/has not borrowed”
know_spent Whether knows amount spent
and precision
B17,B18 1 “No”
2 “Roughly”
3 “Exactly”
know_available Whether knows amount avail-
able and precision
B19,B20 1 “No”
2 “Roughly”
3 “Exactly”
getinfo Whether agrees with statement
on getting information and
advice
G1, G2 1 “Disagree strongly”
2 “Disagree to some extent”
3 “Agree to some extent”
4 “Agree strongly”
(continued)

CHapter 4. analysis
47
vARIABLE MEANING COMBINATION OF vALUES
learn Whether agrees that statement
describes him/her—learning
from others’ mistakes
B25,B26 1 “Disagree strongly”
2 “Disagree to some extent”
3 “Agree to some extent”
4 “Agree strongly”
disciplined Whether agrees that statement
describes him/her—discipline
B23,B24 1 “Disagree strongly”
2 “Disagree to some extent”
3 “Agree to some extent”
4 “Agree strongly”
cover_unexp_
plan
Whether could cover unex-
pected expense tomorrow (or
has done something or thought
about it)
C6,C7, C8 1 “Couldn’t cover, not thought”
2 “Couldn’t cover, thought only”
3 “Couldn’t cover, done something”
4 “Could cover”
cover_unexp_
worried
Whether could cover unex-
pected expense tomorrow or is
worried about it
C6,C9 1 “Couldn’t cover, not worried”
2 “Couldn’t cover, a bit worried”
3 “Couldn’t cover, very worried”
4 “Could cover”
trysave Whether statement describes
him/her—try to save
C25,C26 1 “No”
2 “To some extent”
3 “Very well”
trysave_reg Whether statement describes
him/her—try to save regularly
C27,C28 1 “No”
2 “To some extent”
3 “Very well”
tryprovision Whether statement describes
him/her—try to have provisions
C29,C30 1 “No”
2 “To some extent”
3 “Very well”
oldage_prep Whether has a strategy for
covering old-age expenses that
provides/will provide full cov-
erage
C11b, C13, C14,
C18, C19
1 “Has no provision”
2 “Has provision, no full coverage”
3 “Has provision, full coverage”
oldage_worry
(for < 60 only)
Whether has any strategies
in place for covering old-age
expenses or is worried about it
C11b, C13, C15 1 “No provision, not worried”
2 “No provision, a bit worried”
3 “No provision, very worried”
4 “Has provision”
check Whether checked terms and
conditions of the product and
how carefully
D8,D9 1 “No”
2 “Roughly”
3 “Exactly”
time_short-
focus_rev
Whether agrees with motivation
statement/Focus on short term
(REVERSED)
E1,E2 1 “Agree strongly”
2 “Agree to some extent”
3 “Disagree to some extent”
4 “Disagree strongly”
table 4.1 key derived variables obtained froM tHe survey questions (continued)
(continued)

Measuring finanCial Capability: questionnaires and iMpleMentation guidanCe for low- and Middle-inCoMe Countries
48
vARIABLE MEANING COMBINATION OF vALUES
time_present_rev Whether agrees with motivation
statement/Live for the present
(REVERSED)
E3,E4 1 “Agree strongly”
2 “Agree to some extent”
3 “Disagree to some extent”
4 “Disagree strongly”
time_itself_rev Whether agrees with motivation
statement/Future will take care
of itself (REVERSED)
E5,E6 1 “Agree strongly”
2 “Agree to some extent”
3 “Disagree to some extent”
4 “Disagree strongly”
impulsive_do_rev Whether agrees with motivation
statement/Impulsiveness/Do
things without thinking through
(REVERSED)
E7,E8 1 “Agree strongly”
2 “Agree to some extent”
3 “Disagree to some extent”
4 “Disagree strongly”
impulsive_iam_
rev
Whether agrees with motivation
statement/Impulsiveness/I am
impulsive (REVERSED)
E9,E10 1 “Agree strongly”
2 “Agree to some extent”
3 “Disagree to some extent”
4 “Disagree strongly”
impulsive_say_
rev
Whether agrees with motivation
statement/Impulsiveness/Say
things before thinking through
(REVERSED)
E11,E12 1 “Agree strongly”
2 “Agree to some extent”
3 “Disagree to some extent”
4 “Disagree strongly”
achieve_
look4opp
Whether agrees with motiva-
tion statement/Achievement/
Always look for opportunities to
improve situation
E13,E14 1 “Disagree strongly”
2 “Disagree to some extent”
3 “Agree to some extent”
4 “Agree strongly”
achieve_aspire Whether agrees with motivation
statement/Achievement/Have
many aspirations
E15,E16 1 “Disagree strongly”
2 “Disagree to some extent”
3 “Agree to some extent”
4 “Agree strongly”
achieve_
workhard
Whether agrees with motivation
statement/Achievement/Work
hard to be among the best
E17,E18 1 “Disagree strongly”
2 “Disagree to some extent”
3 “Agree to some extent”
4 “Agree strongly”
table 4.1 key derived variables obtained froM tHe survey questions (continued)

CHapter 4. analysis
49
table 4.2 How to CalCulate finanCial Capability sCores froM tHe derived variables
COMPONENT STANDARDIZED vARIABLE COEFFICIENT
Budgeting = plan_freq × 0.36 +
plan_exactly × 0.35 +
plan_keep × 0.36
Living within means = money_short_why × 0.35 +
borrow_food_rev × 0.40 +
borrow_debt_rev × 0.33
borrow_afford 0.32
Monitoring expenses = know_spent × 0.50 +
know_available × 0.50
Using information = getinfo × 0.44 +
learn × 0.50 +
disciplined × 0.55
Not overspending = b_27 × 0.50 +
b_28 × 0.50
Covering unexpected expenses = cover_unexp_worried × 1.00
Saving = trysave × 0.37 +
trysave_reg × 0.38 +
tryprovision × 0.37
Attitude toward the future = time_shortfocus_rev × 0.44 +
time_present_rev × 0.45 +
time_itself_rev × 0.40
Not being impulsive = impulsive_do_rev × 0.47 +
impulsive_iam_rev × 0.43 +
impulsive_say_rev × 0.45
Achievement orientation = achieve_lo~p × 0.44 +
achieve_as~e × 0.44 +
achieve_wo~d × 0.41

Measuring finanCial Capability: questionnaires and iMpleMentation guidanCe for low- and Middle-inCoMe Countries
50
Once the scores have been calculated, different types of analysis can be conducted
to understand which groups of the population have the lowest or highest scores
in each component. For example, it is possible to compare average scores broken
down by gender, education levels, income groups, and so on. Furthermore, each
component score can be analyzed using regression methods to assess how it varies
with the sociodemographic variables of interest. It is important to stress that simple
regression results per se do not provide evidence of a causal relationship between
the sociodemographic variables and the capability score, but they can be used to
identify interesting correlations.
If there is an interest in dividing the population into groups of individuals who have
similar capability levels within the same group, but differ from individuals in other
groups, cluster analysis can be used. This is a more complex method than regression
analysis, and the full report should be consulted for its technical details.2
2 Cluster analysis compares all possible couples of individuals in the sample by calculating the
squared Euclidean distance over the 10 component scores. It then assigns each individual to
a cluster, and proceeds iteratively by aggregating clusters (or individuals) with the shortest
distance. In simple words, the method assigns “similar” individuals to the same cluster, and the
distance between the clusters joined will increase in each step. The procedure ends when it is
no longer possible to aggregate clusters without assigning very different individuals to the same
cluster.

51
CHapter 5
r esearch agenda
The World Bank’s Financial Capability Survey allows countries to measure and
monitor financial capability. It is a new survey instrument and, as such, there is
still room for further investigation and advances in the analysis. In this chapter, we
mention some of the areas that might be of interest to researchers and agencies
charged with improving financial inclusion and financial capability.
� Using the roster to add conditions on eligibility of household members
to be selected. Somewhat unique to the roster in the FCS is a series of ques-
tions on the role each individual plays in terms of his or her contribution to
the household budget and decision making around the household budget and/
or personal monies. Ideally, to select a sample of only financially active adults,
these questions would be used as a filter to determine eligibility for being
interviewed. This is not done in the present survey as there was a concern
that the person who answered the roster section might (1) not know all
household members’ roles in financial decisions and/or (2) might, for cultural
or other reasons, answer the questions in a way that under- or overestimates
these roles. Regardless of the reason, the potential for certain groups, women
or the elderly for example, to be underrepresented in the sample seemed high
enough to prevent these questions from being used as a filter. Instead, only
age was used as a filter. However, there is a cost to the survey of interviewing
financially inactive adults if one is only interested in measuring financial capa-
bility. Carrying out careful research on whether or not the responsible adults
who answer the roster give correct answers (that match what each individual
respondent would say) will be necessary before any move is made to use
the questions in Section R as filter questions. See Cull and Scott (2012) for an
example of how such an experiment could be designed.
� Including non–financially active respondents. The first wave of FCS surveys
that have been implemented showed that most individuals 18 and older
participate in household financial decisions; very few people manage only
their own funds without any contribution to the household finances or finan-
cial decisions. The range was from 74 percent of all adults being involved in
household decisions on financial matters to 97 percent. It would be useful to

Measuring finanCial Capability: questionnaires and iMpleMentation guidanCe for low- and Middle-inCoMe Countries
52
know the characteristics of those who are inactive. Beyond the simple demo-
graphic characteristics identified in the roster and Section A of the Main Ques-
tionnaire for these people, having them answer sections of the questionnaire
on motivations (Section E), income sources (Section F), and search for knowl-
edge (Section G) could supply important information that could inform policy
making in the area of financial education and inclusion.
� Multiple respondents. Of all the countries that have implemented the FCS
to date, only Nigeria interviewed all adults in the household and not just one
randomly selected adult. It would be useful to replicate this experience in
other countries so that data on the types of households (by financial capa-
bility characteristics) could be developed. Further, understanding the degree
to which there is specialization within the household could be useful (e.g.,
which household members have financial skills?) as is information on whether
households are comprised of like individuals in terms of financial capability.
� Panel data. The assumption behind this survey and the reason for collecting
financial capability data is that financial capability matters for welfare; house-
holds and individuals with greater financial capability are better able to
smooth consumption and protect themselves from exogenous shocks. This is
a hypothesis that remains to be tested. At a minimum, testing the hypothesis
will require the presence of panel data, wherein individuals are tracked over
time. The financial capability questions were added into the Nigeria General
Household Survey Panel and, it is hoped, will provide a first test of this hypoth-
esis in the next two years. However, other efforts at collecting panel data are
needed.
� Financial capability and related topics. In an effort to keep the question-
naires as short as possible, their content was mostly restricted to the topics
that were identified in the qualitative work as those related to financial capa-
bility. However, if there were time and resources, expanding the questionnaire
to include some of the other optional modules mentioned above or related
topics would provide useful information on how different facets of financial
behavior are linked.

a ppendixes


55
appendix a. Main questionnaire
appendix a
Main questionnaire

56
Measuring finanCial Capability: questionnaires and iMpleMentation guidanCe for low- and Middle-inCoMe Countries

57
appendix a. Main questionnaire


61
appendix a. Main questionnaire

62
Measuring finanCial Capability: questionnaires and iMpleMentation guidanCe for low- and Middle-inCoMe Countries

63
appendix a. Main questionnaire

64
Measuring finanCial Capability: questionnaires and iMpleMentation guidanCe for low- and Middle-inCoMe Countries

65
appendix a. Main questionnaire

66
Measuring finanCial Capability: questionnaires and iMpleMentation guidanCe for low- and Middle-inCoMe Countries

67
appendix a. Main questionnaire

68
Measuring finanCial Capability: questionnaires and iMpleMentation guidanCe for low- and Middle-inCoMe Countries

69
appendix a. Main questionnaire

70
Measuring finanCial Capability: questionnaires and iMpleMentation guidanCe for low- and Middle-inCoMe Countries

71
appendix a. Main questionnaire

72
Measuring finanCial Capability: questionnaires and iMpleMentation guidanCe for low- and Middle-inCoMe Countries

73
appendix a. Main questionnaire

74
Measuring finanCial Capability: questionnaires and iMpleMentation guidanCe for low- and Middle-inCoMe Countries

75
appendix a. Main questionnaire

76
Measuring finanCial Capability: questionnaires and iMpleMentation guidanCe for low- and Middle-inCoMe Countries

77
appendix a. Main questionnaire

78
Measuring finanCial Capability: questionnaires and iMpleMentation guidanCe for low- and Middle-inCoMe Countries

79
appendix a. Main questionnaire

80
Measuring finanCial Capability: questionnaires and iMpleMentation guidanCe for low- and Middle-inCoMe Countries

81
appendix a. Main questionnaire
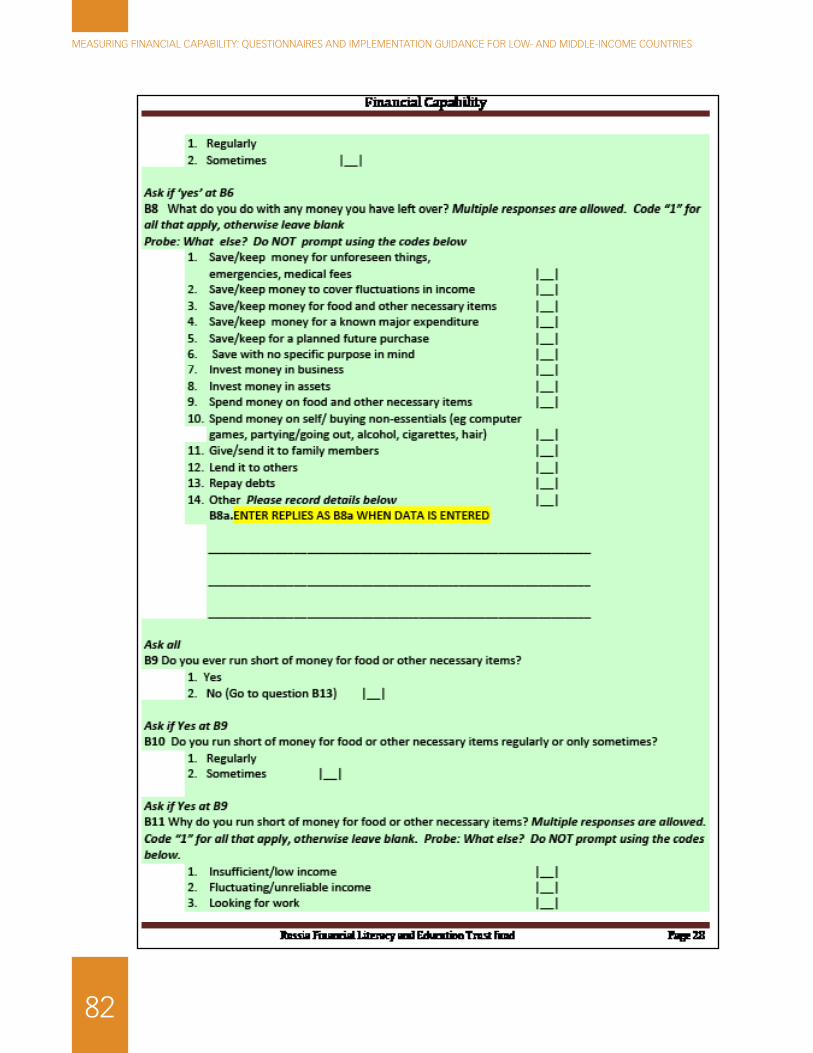
82
Measuring finanCial Capability: questionnaires and iMpleMentation guidanCe for low- and Middle-inCoMe Countries

83
appendix a. Main questionnaire

84
Measuring finanCial Capability: questionnaires and iMpleMentation guidanCe for low- and Middle-inCoMe Countries

85
appendix a. Main questionnaire

86
Measuring finanCial Capability: questionnaires and iMpleMentation guidanCe for low- and Middle-inCoMe Countries

87
appendix a. Main questionnaire

88
Measuring finanCial Capability: questionnaires and iMpleMentation guidanCe for low- and Middle-inCoMe Countries

89
appendix a. Main questionnaire

90
Measuring finanCial Capability: questionnaires and iMpleMentation guidanCe for low- and Middle-inCoMe Countries

91
appendix a. Main questionnaire

92
Measuring finanCial Capability: questionnaires and iMpleMentation guidanCe for low- and Middle-inCoMe Countries

93
appendix a. Main questionnaire

94
Measuring finanCial Capability: questionnaires and iMpleMentation guidanCe for low- and Middle-inCoMe Countries

95
appendix a. Main questionnaire

96
Measuring finanCial Capability: questionnaires and iMpleMentation guidanCe for low- and Middle-inCoMe Countries

97
appendix a. Main questionnaire

98
Measuring finanCial Capability: questionnaires and iMpleMentation guidanCe for low- and Middle-inCoMe Countries

99
appendix a. Main questionnaire

100
Measuring finanCial Capability: questionnaires and iMpleMentation guidanCe for low- and Middle-inCoMe Countries

101
appendix a. Main questionnaire

102
Measuring finanCial Capability: questionnaires and iMpleMentation guidanCe for low- and Middle-inCoMe Countries

103
appendix a. Main questionnaire

104
Measuring finanCial Capability: questionnaires and iMpleMentation guidanCe for low- and Middle-inCoMe Countries

105
appendix a. Main questionnaire

106
Measuring finanCial Capability: questionnaires and iMpleMentation guidanCe for low- and Middle-inCoMe Countries

107
appendix a. Main questionnaire

108
Measuring finanCial Capability: questionnaires and iMpleMentation guidanCe for low- and Middle-inCoMe Countries
109
appendix a. Main questionnaire


111
appendix b. optional Modulesappendix b
optional modules

112
Measuring finanCial Capability: questionnaires and iMpleMentation guidanCe for low- and Middle-inCoMe Countries

113
appendix b. optional Modules


118
Measuring finanCial Capability: questionnaires and iMpleMentation guidanCe for low- and Middle-inCoMe Countries

119
appendix b. optional Modules

120
Measuring finanCial Capability: questionnaires and iMpleMentation guidanCe for low- and Middle-inCoMe Countries

121
appendix b. optional Modules

122
Measuring finanCial Capability: questionnaires and iMpleMentation guidanCe for low- and Middle-inCoMe Countries

123
appendix b. optional Modules

124
Measuring finanCial Capability: questionnaires and iMpleMentation guidanCe for low- and Middle-inCoMe Countries

125
appendix b. optional Modules

126
Measuring finanCial Capability: questionnaires and iMpleMentation guidanCe for low- and Middle-inCoMe Countries
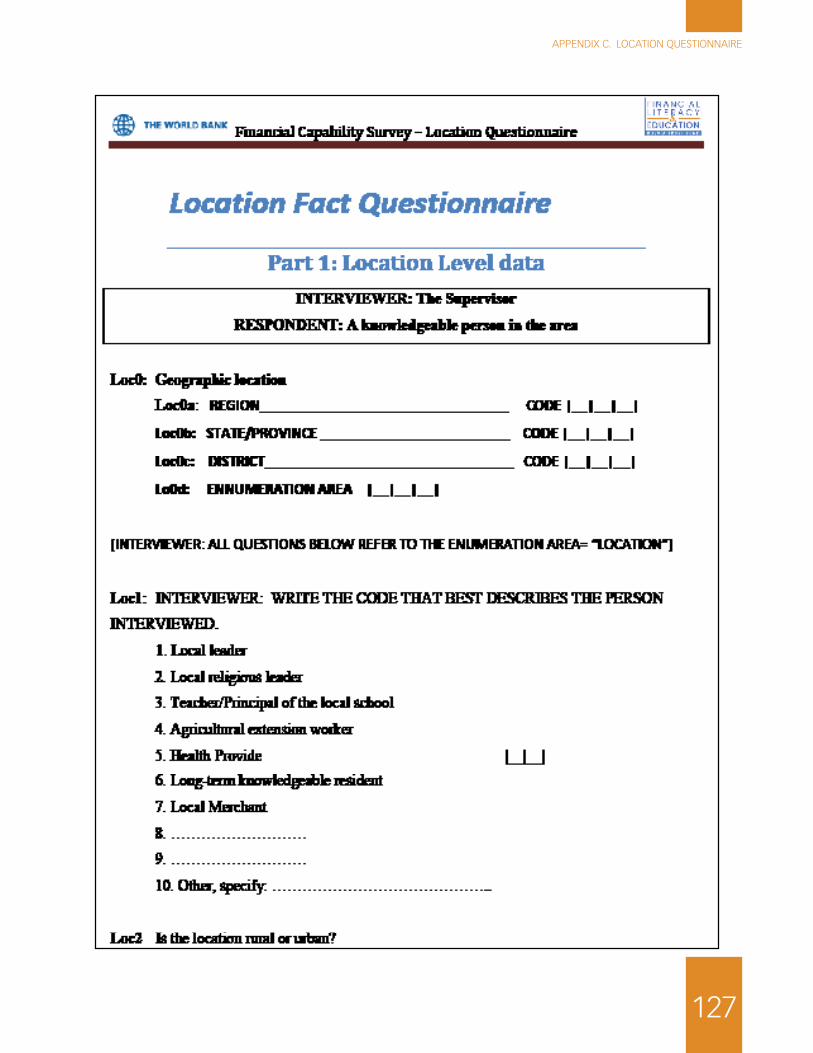
127
appendix C. loCation questionnaire
appendix C
location questionnaire

128
Measuring finanCial Capability: questionnaires and iMpleMentation guidanCe for low- and Middle-inCoMe Countries

129
appendix C. loCation questionnaire

130
Measuring finanCial Capability: questionnaires and iMpleMentation guidanCe for low- and Middle-inCoMe Countries

131
appendix C. loCation questionnaire
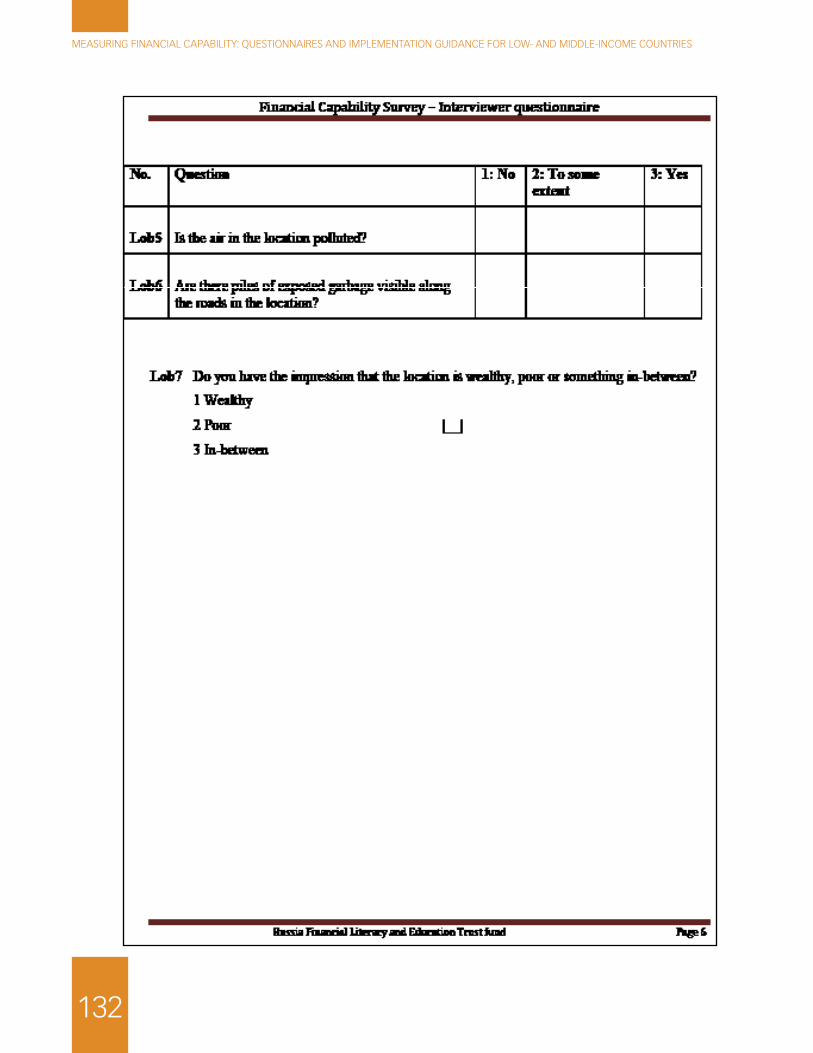
132
Measuring finanCial Capability: questionnaires and iMpleMentation guidanCe for low- and Middle-inCoMe Countries

133
appendix d. interviewer questionnaireappendix d
interviewer questionnaire

134
Measuring finanCial Capability: questionnaires and iMpleMentation guidanCe for low- and Middle-inCoMe Countries

135
appendix d. interviewer questionnaire


137
references
Bardasi, Elena, Kathleen Beegle, Pieter M. Serneels, and Andrew Dillon. 2010. “Do Labor
Statistics Depend on How and to Whom the Questions are Asked? Results from a Survey
Experiment in Tanzania,” IZA Discussion Paper No. 4733. Available at SSRN: http://ssrn.
com/abstract=1549209.
Bauer, Johannes (forthcoming). “Selection Errors of Random Route Samples,” forthcoming in
Sociological Methods and Research.
British Market Research Bureau (BMRB). 2006. Access to Financial Services by those on the
Margins of Banking: Final Report for the Financial Inclusion Taskforce. London: BMRB.
Comisión Nacional Bancaria y de Valores (CNBV) and Instituto Nacional de Estadística y
Geografía (INEGI). 2012. Encuesta Nacional de Inclusión Financiera (ENIF): Análisis
descriptivo de los resultados. Available at http://www.cnbv.gob.mx/Prensa/Paginas/
Inclusion.aspx.
Cull, Robert, and Kinnon Scott. 2010. “Measuring Household Usage of Financial Services: Does it
Matter How or Whom You Ask? “ World Bank Economic Review 24 (2): 199–233.
Frankenburg, Elizabeth. 2000. “Community and Price Data” in eds. Margaret Grosh and Paul
Glewwe, Designing household survey questionnaires for developing countries: lessons
from 15 years of the Living Standards Measurement Study, World Bank, Washington, DC.
Grosh, Margaret, and Juan Munoz. 1996. “A Manual for Planning and Implementing the
Living Standards Measurement Study Surveys,” LSMS Working Paper #126, World Bank,
Washington, DC.
Holzmann, R., F. Mulaj, and V. Perotti. 2013. Financial Capability in Low- and Middle-Income
Countries: Measurement and Evaluation. A Report on the World Bank’s Research
Program and the Knowledge from the Russia Financial Literacy and Education Trust Fund.
Washington, DC: World Bank.
IRIS Center. 2011. “Comparative Assessment of Software Programs for the Development of
Computer-Assisted Personal Interview (CAPI) Applications,” University of Maryland, College
Park, Maryland.
Kempson, Elaine. 2002. “Over-indebtedness in Britain: A report to the Department of Trade and
Industry.” Personal Finance Research Centre, University of Bristol. Bristol, UK.
Kempson, Elaine, Valeria Perotti, and Kinnon Scott. 2013. Measuring Financial Capability: A New
Instrument and Results from Low- and Middle-Income Countries. Washington, DC: World
Bank.
Kish, Leslie. 1949. “A Procedure for Objective Respondent Selection within the Household,”
Journal of the American Statistical Association 44 (247): 380–87.

138
Measuring finanCial Capability: questionnaires and iMpleMentation guidanCe for low- and Middle-inCoMe Countries
Németh, Renáta. 2003. “Sampling Design of Health Surveys: Household as a Sampling Unit,”
Luxembourg Income Study Working Paper Series, Working Paper No. 358, Luxembourg.
OECD/INFE (Organisation for Economic Co-operation and Development Network for Financial
Education). 2011. “Measuring Financial Literacy: Core Questionnaire in Measuring Financial
Literacy: Questionnaire and Guidance Notes for Conducting an Internationally Comparable
Survey of Financial Literacy.” Paris: OECD.
Schnell, Rainer. 2008. “Avoiding Problems of Traditional Sampling Strategies for Household
Surveys in Germany: Some New Suggestions” Data Documentation No. 33, Deutsches
Institut Fur Wirtshafsforschung, Berlin.
Scott, Kinnon, Diane Steele, and Tilahun Temesgen. 2005. “Living Standards Measurement
Study Surveys,” in Household Surveys in Developing and Transition Countries: Design,
Implementation and Analysis, United Nations, New York.


MINISTRY OF FINANCE OF THE RUSSIAN FEDERATION
The Russia Financial Literacy and Education Trust Fund was established in 2008 at the World
Bank with funding provided by the Ministry of Finance of the Russian Federation. The work
supported by the Trust Fund is jointly managed by the World Bank and the Organisation for
Economic Co-operation and Development (OECD) and is directed toward improving public pol-
icies and programs to enhance financial knowledge and capabilities in low- and middle-income
countries. This effort has focused on the review of national strategies for financial education,
the development of methods for the measurement of financial knowledge and capabilities,
methods for evaluating the impact and outcome of programs, and research applying these
methods to programs in developing countries. The products of this program of work can be
found at the Trust Fund website at:
www.finlitedu.org