Embed Size (px)
Citation preview

Measuring Inter-Industry Financial Transmission of Shocks
October 25th 2006
Daniel Paravisini
Columbia University GSB
Federal Deposit Insurance Corporation – CRF 2006 Fall Workshop
Work in Progress Report
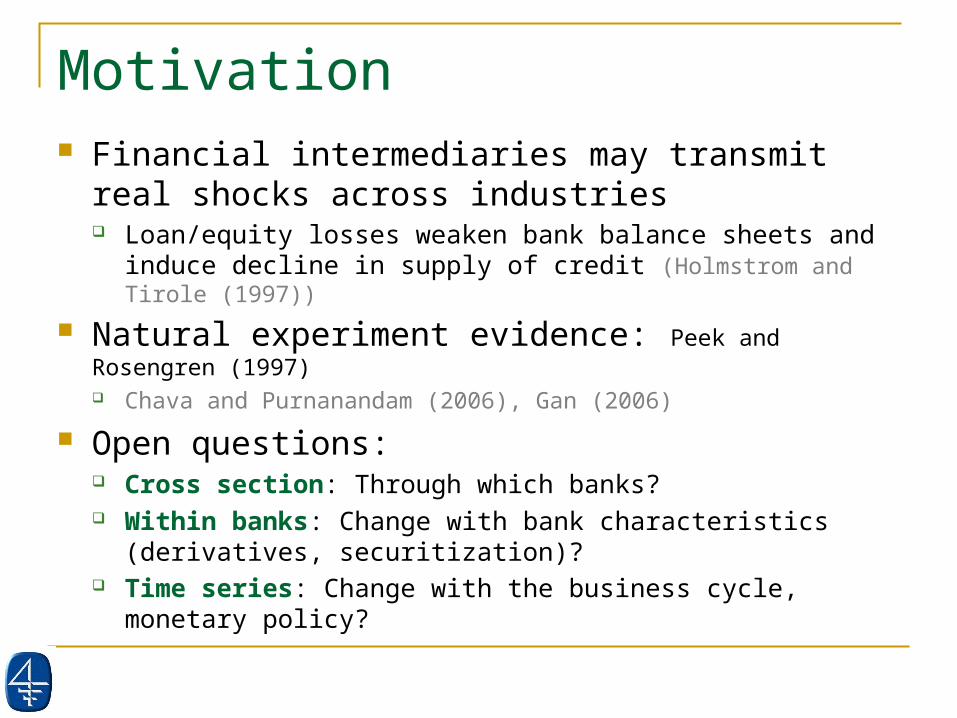
Motivation Financial intermediaries may transmit real shocks
across industries Loan/equity losses weaken bank balance sheets and induce
decline in supply of credit (Holmstrom and Tirole (1997))
Natural experiment evidence: Peek and Rosengren (1997) Chava and Purnanandam (2006), Gan (2006)
Open questions: Cross section: Through which banks? Within banks: Change with bank characteristics (derivatives,
securitization)? Time series: Change with the business cycle, monetary policy?
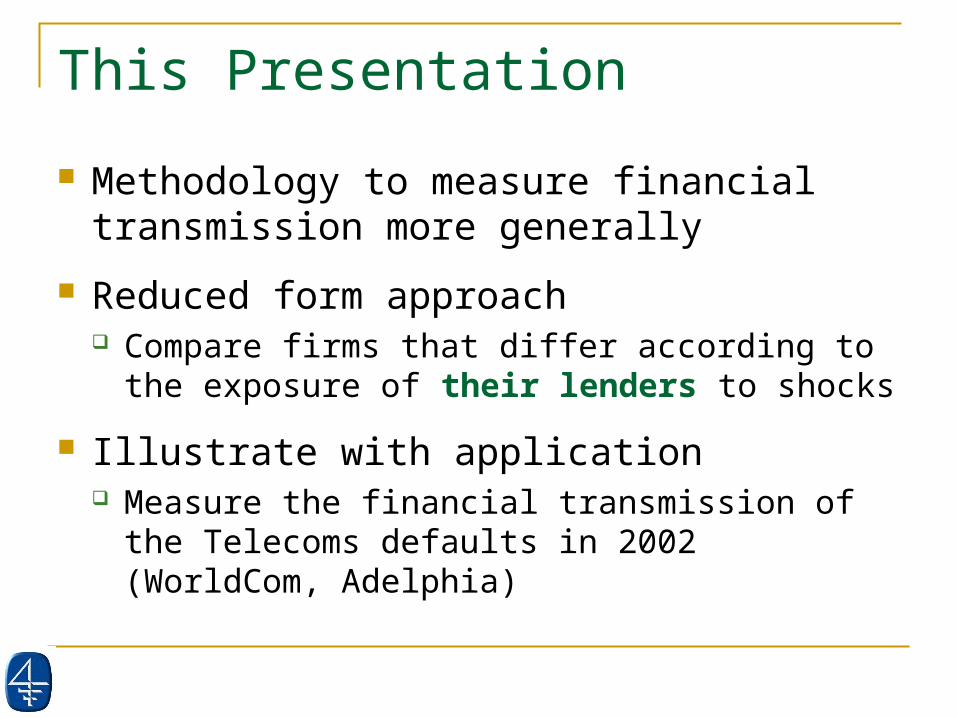
This Presentation
Methodology to measure financial transmission more generally
Reduced form approach Compare firms that differ according to the
exposure of their lenders to shocks
Illustrate with application Measure the financial transmission of the
Telecoms defaults in 2002 (WorldCom, Adelphia)
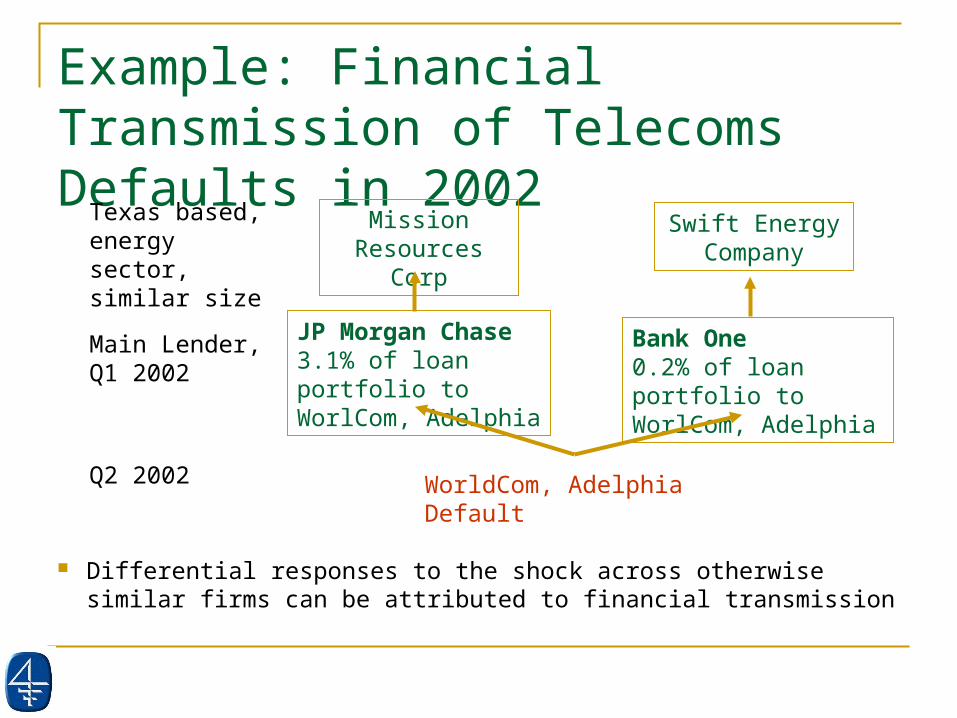
Example: Financial Transmission of Telecoms Defaults in 2002
Mission Resources Corp
Swift Energy Company
JP Morgan Chase 3.1% of loan portfolio to WorlCom, Adelphia
Bank One 0.2% of loan portfolio to WorlCom, Adelphia
Main Lender, Q1 2002
Texas based, energy sector, similar size
Differential responses to the shock across otherwise similar firms can be attributed to financial transmission
WorldCom, Adelphia DefaultQ2 2002
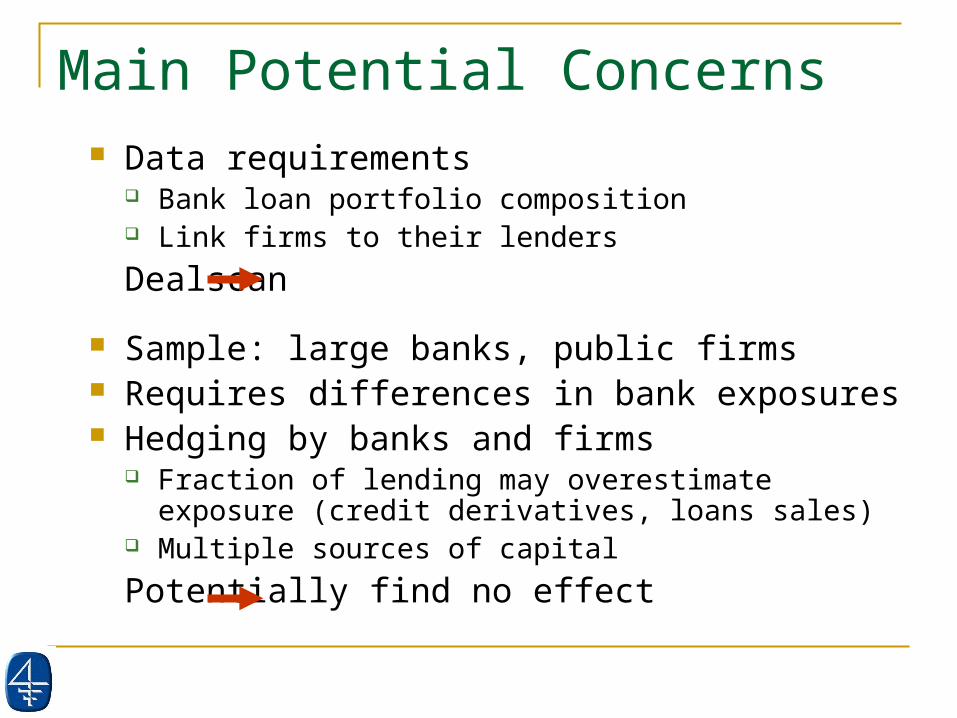
Main Potential Concerns Data requirements
Bank loan portfolio composition Link firms to their lenders
Dealscan
Sample: large banks, public firms Requires differences in bank exposures Hedging by banks and firms
Fraction of lending may overestimate exposure (credit derivatives, loans sales)
Multiple sources of capital
Potentially find no effect
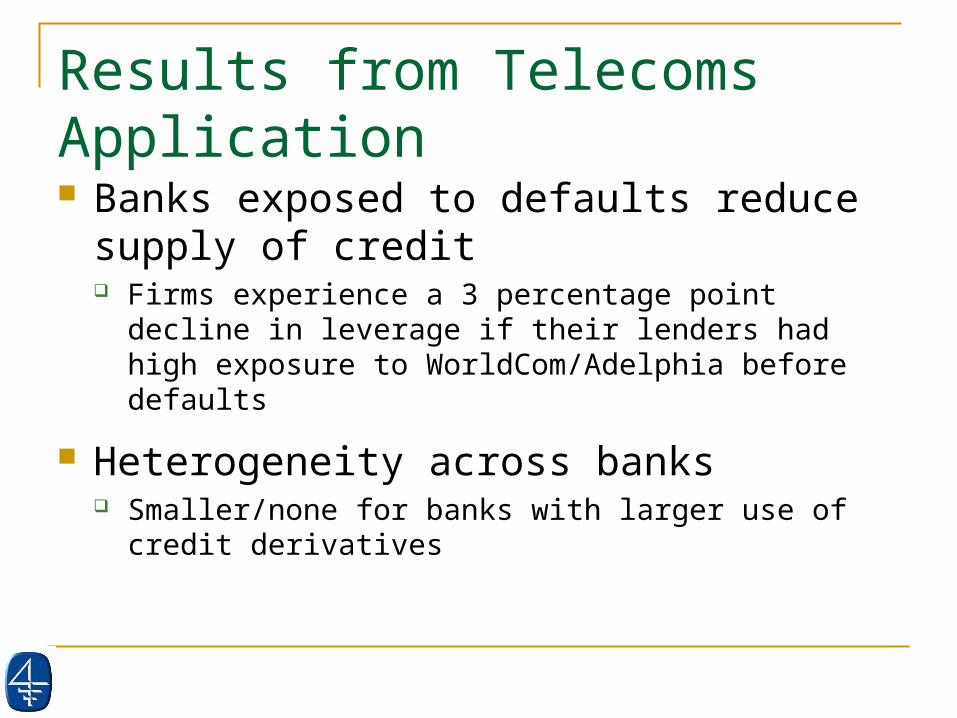
Results from Telecoms Application Banks exposed to defaults reduce supply of
credit Firms experience a 3 percentage point decline in leverage
if their lenders had high exposure to WorldCom/Adelphia before defaults
Heterogeneity across banks Smaller/none for banks with larger use of credit derivatives
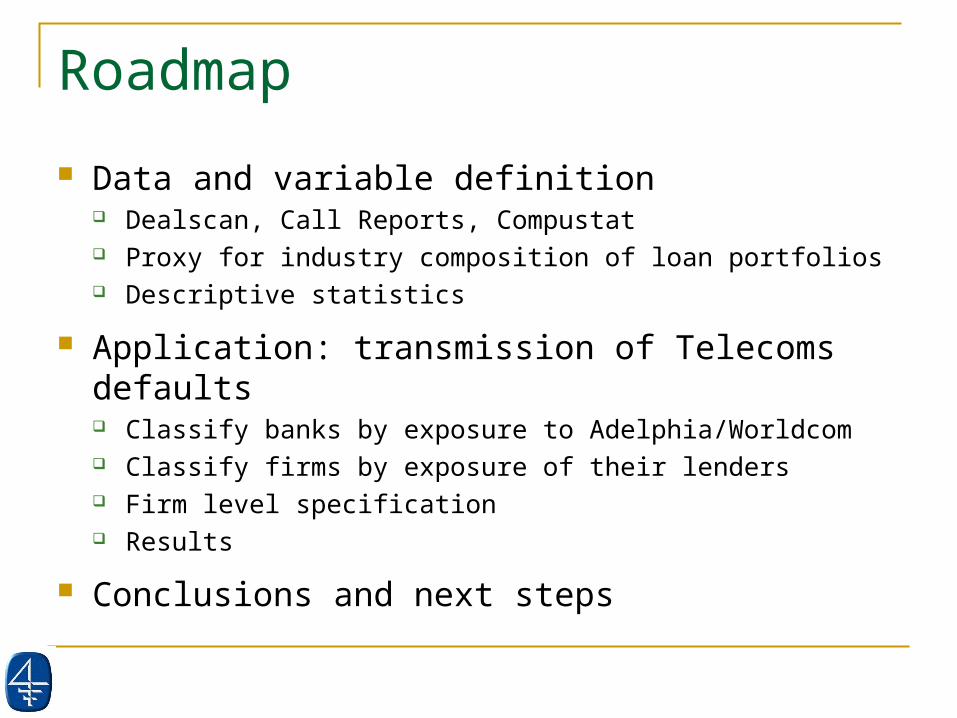
Roadmap
Data and variable definition Dealscan, Call Reports, Compustat Proxy for industry composition of loan portfolios Descriptive statistics
Application: transmission of Telecoms defaults Classify banks by exposure to Adelphia/Worldcom Classify firms by exposure of their lenders Firm level specification Results
Conclusions and next steps
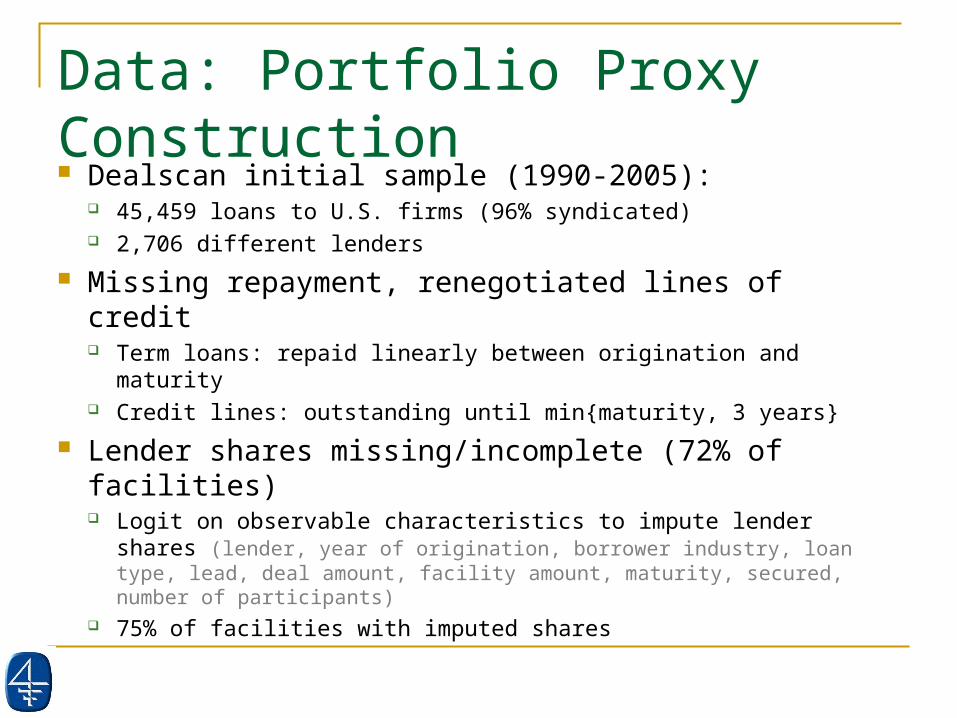
Data: Portfolio Proxy Construction Dealscan initial sample (1990-2005):
45,459 loans to U.S. firms (96% syndicated) 2,706 different lenders
Missing repayment, renegotiated lines of credit Term loans: repaid linearly between origination and maturity Credit lines: outstanding until min{maturity, 3 years}
Lender shares missing/incomplete (72% of facilities) Logit on observable characteristics to impute lender shares
(lender, year of origination, borrower industry, loan type, lead, deal amount, facility amount, maturity, secured, number of participants)
75% of facilities with imputed shares
Descriptive Statistics: Portfolio Proxy Calculate amount outstanding for every
firm/bank/quarter Implied by imputed lender shares and repayment schedule
by facility
Total outstanding by bank/quarter: Average 52.3% of C&I loans from Call Reports using the
1995 to 2004 sample
Substantial time series and cross sectional variation in industry composition of portfolios
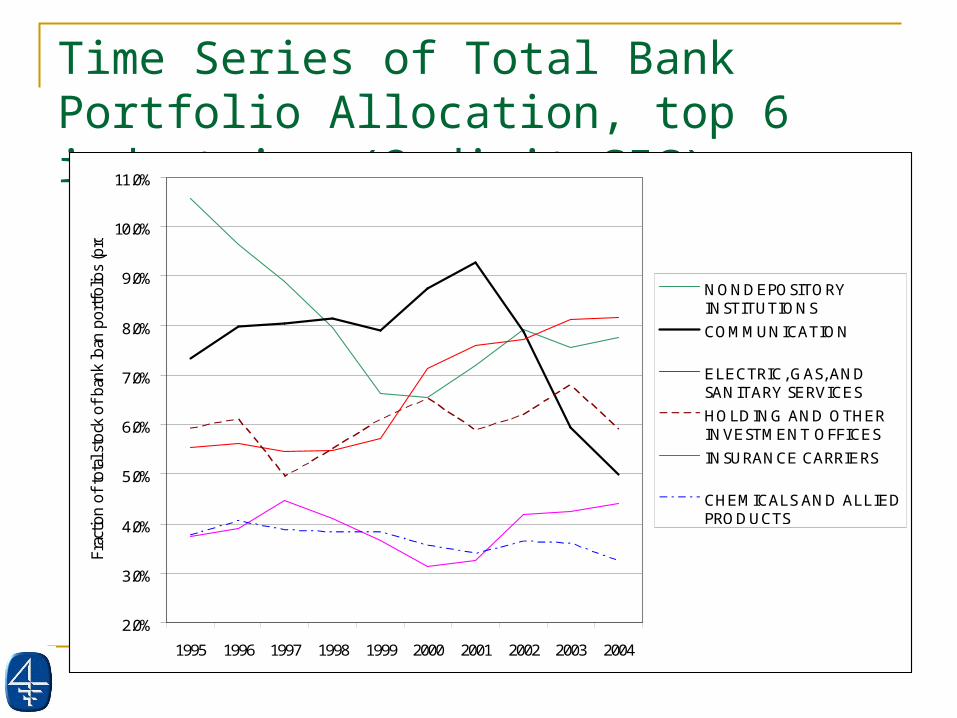
Time Series of Total Bank Portfolio Allocation, top 6 industries (2-digit SIC)
2.0%
3.0%
4.0%
5.0%
6.0%
7.0%
8.0%
9.0%
10.0%
11.0%
1995 1996 1997 1998 1999 2000 2001 2002 2003 2004
Frac
tion
of to
tal s
tock
of ba
nk lo
an p
ortfol
ios
(pro
xy)
NONDEPOSITORYINSTITUTIONS
COMMUNICATION
ELECTRIC, GAS, ANDSANITARY SERVICES
HOLDING AND OTHERINVESTMENT OFFICES
INSURANCE CARRIERS
CHEMICALS AND ALLIEDPRODUCTS
0.05
.1.15
mea
n of
fsto
ck
NO
ND
EPO
SITO
RY IN
STIT
UTI
ON
S
CHEM
ICAL
S AN
D A
LLIE
D P
ROD
UCT
S
HO
LDIN
G A
ND
OTH
ER IN
VEST
MEN
T O
FFIC
ES
ELEC
TRO
NIC
& O
THER
ELE
CTRI
C EQ
UIP
MEN
T
INSU
RAN
CE C
ARRI
ERS
IND
UST
RIAL
MAC
HIN
ERY
AND
EQ
UIPM
ENT
FOO
D A
ND
KIN
DRE
D P
ROD
UCTS
COM
MUN
ICAT
ION
ELEC
TRIC
, GAS
, AN
D S
ANIT
ARY
SERV
ICES
0.05
.1.15
mea
n of
fsto
ck
HO
TELS
AN
D O
THER
LO
DG
ING
PLA
CES
WH
OLE
SALE
TRA
DE
- DUR
ABLE
GO
OD
S
BUSI
NES
S SE
RVIC
ES
INSU
RAN
CE C
ARRI
ERS
HO
LDIN
G A
ND
OTH
ER IN
VEST
MEN
T O
FFIC
ES
ELEC
TRIC
, GAS
, AN
D S
ANIT
ARY
SERV
ICES
COM
MUN
ICAT
ION
NO
ND
EPO
SITO
RY IN
STIT
UTIO
NS
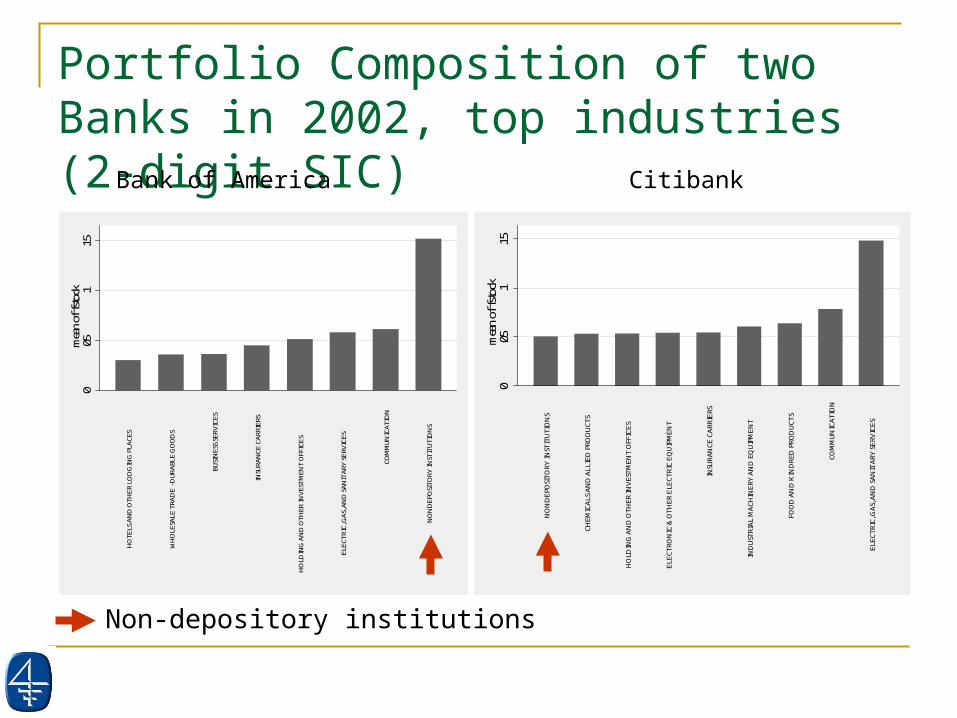
Portfolio Composition of two Banks in 2002, top industries (2-digit SIC)
Bank of America
Non-depository institutions
Citibank
0.05
.1.15
mea
n of
fsto
ck
NO
ND
EPO
SITO
RY IN
STIT
UTI
ON
S
CHEM
ICAL
S AN
D A
LLIE
D P
ROD
UCT
S
HO
LDIN
G A
ND
OTH
ER IN
VEST
MEN
T O
FFIC
ES
ELEC
TRO
NIC
& O
THER
ELE
CTRI
C EQ
UIP
MEN
T
INSU
RAN
CE C
ARRI
ERS
IND
UST
RIAL
MAC
HIN
ERY
AND
EQ
UIPM
ENT
FOO
D A
ND
KIN
DRE
D P
ROD
UCTS
COM
MUN
ICAT
ION
ELEC
TRIC
, GAS
, AN
D S
ANIT
ARY
SERV
ICES
0.05
.1.15
mea
n of
fsto
ck
HO
TELS
AN
D O
THER
LO
DG
ING
PLA
CES
WH
OLE
SALE
TRA
DE
- DUR
ABLE
GO
OD
S
BUSI
NES
S SE
RVIC
ES
INSU
RAN
CE C
ARRI
ERS
HO
LDIN
G A
ND
OTH
ER IN
VEST
MEN
T O
FFIC
ES
ELEC
TRIC
, GAS
, AN
D S
ANIT
ARY
SERV
ICES
COM
MUN
ICAT
ION
NO
ND
EPO
SITO
RY IN
STIT
UTIO
NS
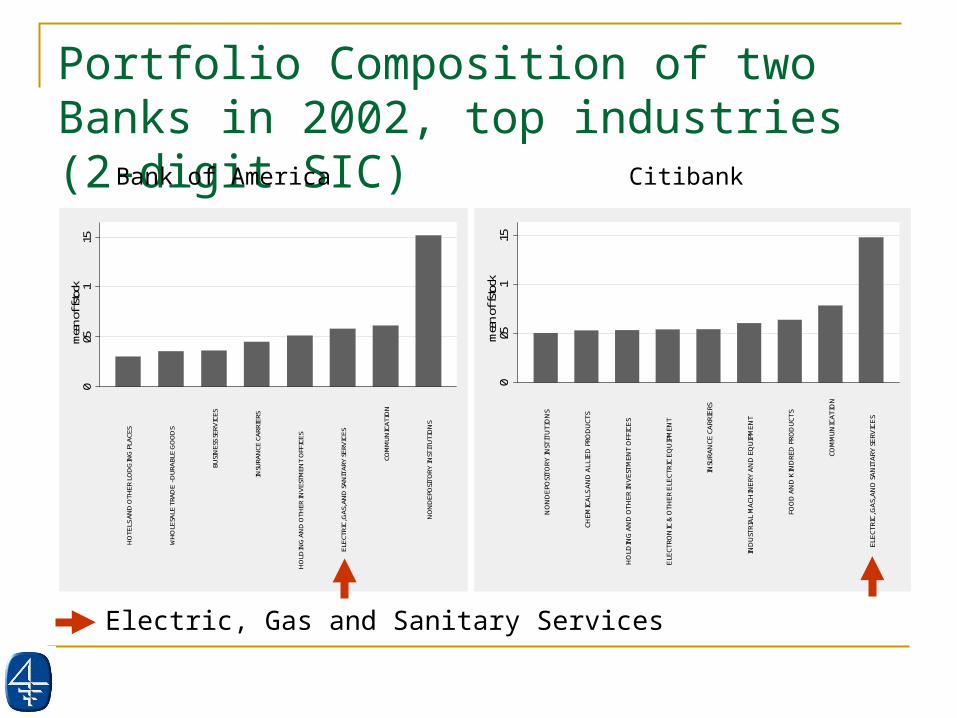
Portfolio Composition of two Banks in 2002, top industries (2-digit SIC)
Electric, Gas and Sanitary Services
Bank of America Citibank
Roadmap
Data and variable definition Dealscan, Call Reports, Compustat Proxy for industry composition of loan portfolios Descriptive statistics
Application: transmission of Telecoms defaults Classify banks by exposure to Adelphia/Worldcom Classify firms according to exposure of their lenders Firm level specification Results
Conclusions and next steps
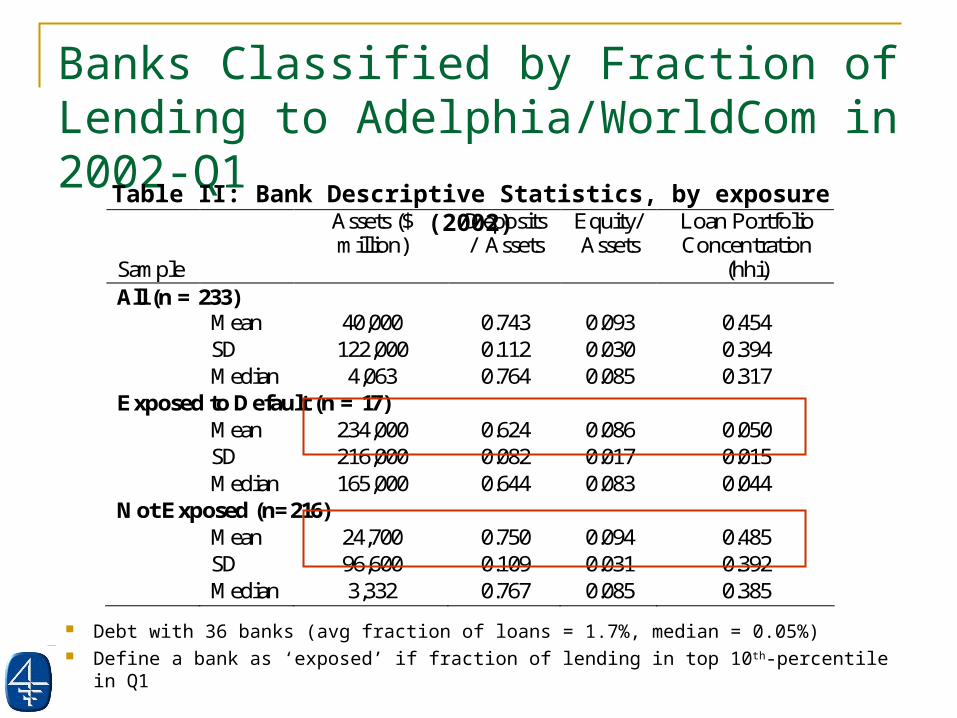
Banks Classified by Fraction of Lending to Adelphia/WorldCom in 2002-Q1
Debt with 36 banks (avg fraction of loans = 1.7%, median = 0.05%) Define a bank as ‘exposed’ if fraction of lending in top 10th-percentile in Q1
Sample
Assets ($ million)
Deposits/ Assets
Equity/ Assets
Loan Portfolio Concentration
(hhi) All (n = 233) Mean 40,000 0.743 0.093 0.454 SD 122,000 0.112 0.030 0.394 Median 4,063 0.764 0.085 0.317 Exposed to Default (n = 17) Mean 234,000 0.624 0.086 0.050 SD 216,000 0.082 0.017 0.015 Median 165,000 0.644 0.083 0.044 Not Exposed (n=216) Mean 24,700 0.750 0.094 0.485 SD 96,600 0.109 0.031 0.392 Median 3,332 0.767 0.085 0.385
Table II: Bank Descriptive Statistics, by exposure (2002)
Roadmap
Data and variable definition Dealscan, Call Reports, Compustat Proxy for industry composition of loan portfolios Descriptive statistics
Application: transmission of Telecoms defaults Classify banks by exposure to Adelphia/Worldcom Classify firms according to exposure of their lenders Firm level specification Results
Conclusions and next steps
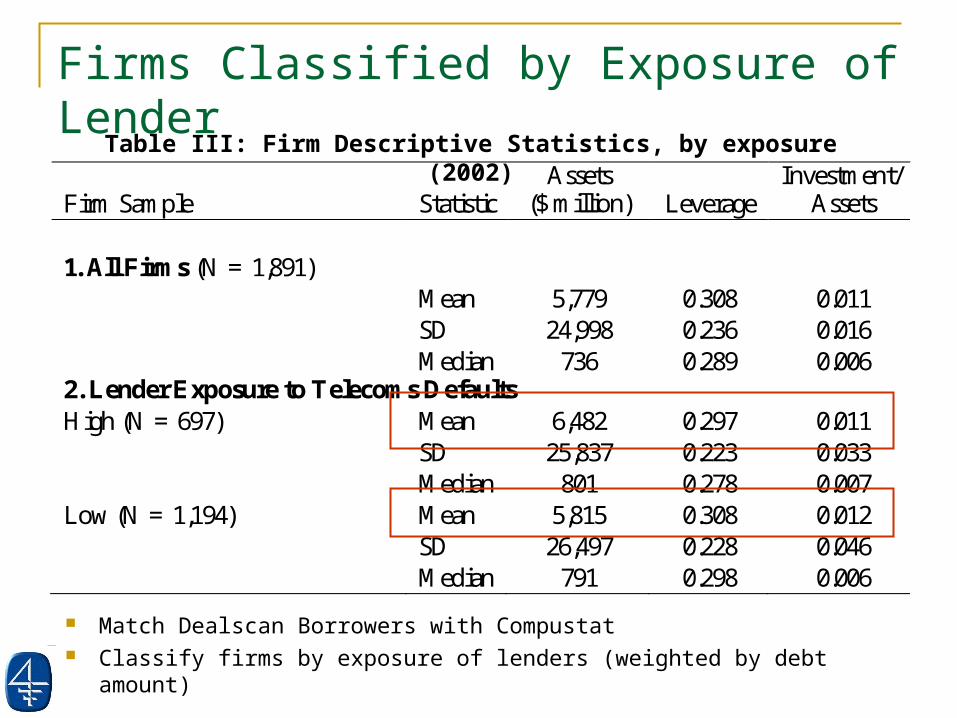
Firm Sample Statistic Assets
($ million) Leverage Investment/
Assets 1. All Firms (N = 1,891) Mean 5,779 0.308 0.011 SD 24,998 0.236 0.016 Median 736 0.289 0.006 2. Lender Exposure to Telecoms Defaults High (N = 697) Mean 6,482 0.297 0.011 SD 25,837 0.223 0.033 Median 801 0.278 0.007 Low (N = 1,194) Mean 5,815 0.308 0.012 SD 26,497 0.228 0.046 Median 791 0.298 0.006
Firms Classified by Exposure of Lender
Match Dealscan Borrowers with Compustat Classify firms by exposure of lenders (weighted by debt amount)
Table III: Firm Descriptive Statistics, by exposure (2002)
Roadmap
Data and variable definition Dealscan, Call Reports, Compustat Proxy for industry composition of loan portfolios Descriptive statistics
Application: transmission of Telecoms defaults Classify banks by exposure to Adelphia/Worldcom Classify firms by exposure of their lenders Firm level specification Results
Conclusions and next steps
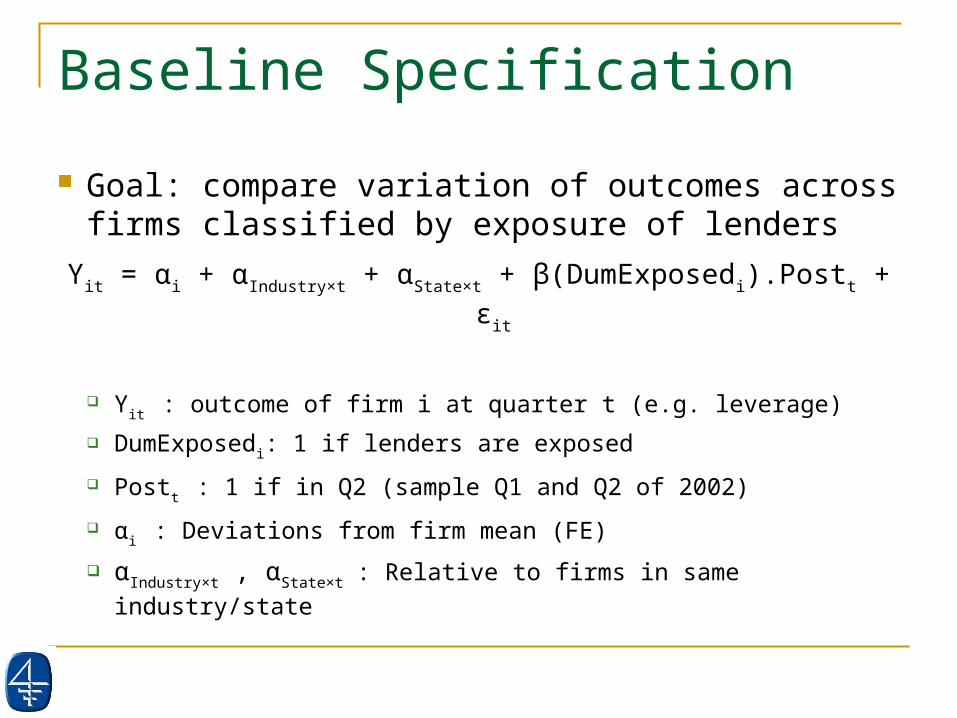
Baseline Specification
Goal: compare variation of outcomes across firms classified by exposure of lenders
Yit = αi + αIndustry×t + αState×t + β(DumExposedi).Postt + εit
Yit : outcome of firm i at quarter t (e.g. leverage)
DumExposedi: 1 if lenders are exposed
Postt : 1 if in Q2 (sample Q1 and Q2 of 2002)
αi : Deviations from firm mean (FE)
αIndustry×t , αState×t : Relative to firms in same industry/state
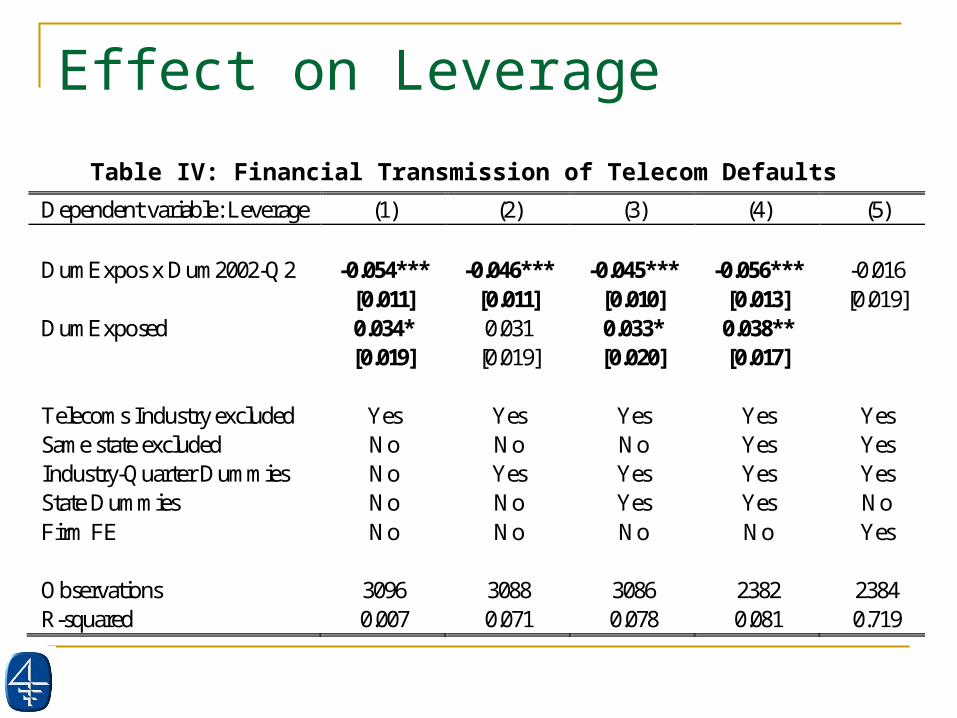
Effect on Leverage
Dependent variable: Leverage (1) (2) (3) (4) (5) DumExpos x Dum2002-Q2 -0.054*** -0.046*** -0.045*** -0.056*** -0.016 [0.011] [0.011] [0.010] [0.013] [0.019] DumExposed 0.034* 0.031 0.033* 0.038** [0.019] [0.019] [0.020] [0.017] Telecoms Industry excluded Yes Yes Yes Yes Yes Same state excluded No No No Yes Yes Industry-Quarter Dummies No Yes Yes Yes Yes State Dummies No No Yes Yes No Firm FE No No No No Yes Observations 3096 3088 3086 2382 2384 R-squared 0.007 0.071 0.078 0.081 0.719
Table IV: Financial Transmission of Telecom Defaults
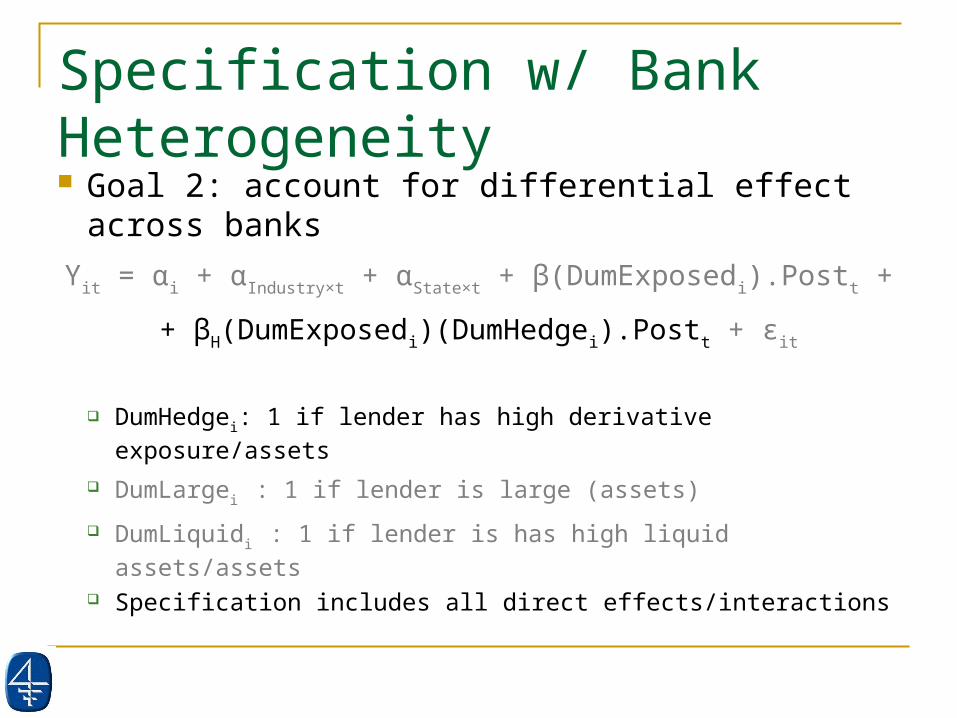
Specification w/ Bank Heterogeneity Goal 2: account for differential effect across banks
Yit = αi + αIndustry×t + αState×t + β(DumExposedi).Postt +
+ βH(DumExposedi)(DumHedgei).Postt + εit
DumHedgei: 1 if lender has high derivative exposure/assets
DumLargei : 1 if lender is large (assets)
DumLiquidi : 1 if lender is has high liquid assets/assets
Specification includes all direct effects/interactions
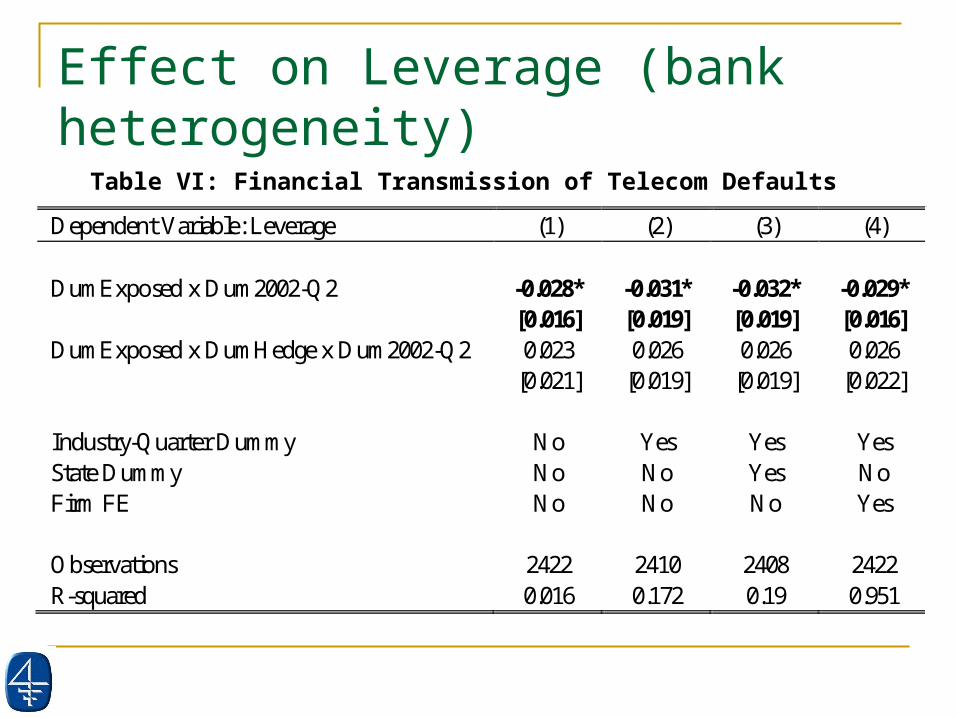
Effect on Leverage (bank heterogeneity)
Table VI: Financial Transmission of Telecom Defaults
Dependent Variable: Leverage (1) (2) (3) (4) DumExposed x Dum2002-Q2 -0.028* -0.031* -0.032* -0.029* [0.016] [0.019] [0.019] [0.016] DumExposed x DumHedge x Dum2002-Q2 0.023 0.026 0.026 0.026 [0.021] [0.019] [0.019] [0.022] Industry-Quarter Dummy No Yes Yes Yes State Dummy No No Yes No Firm FE No No No Yes Observations 2422 2410 2408 2422 R-squared 0.016 0.172 0.19 0.951
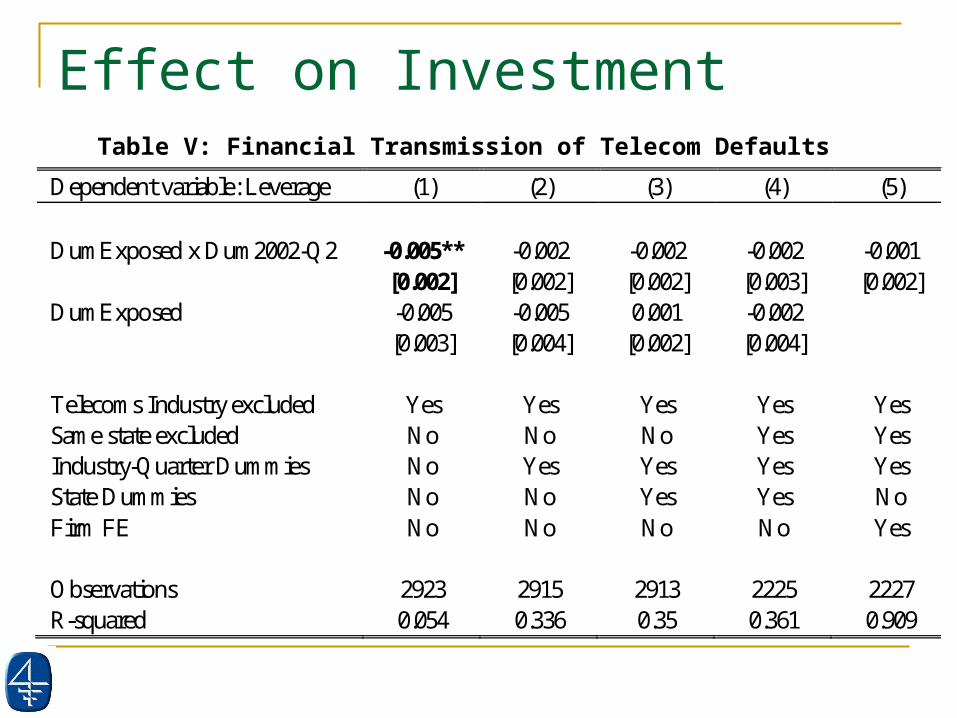
Effect on Investment
Dependent variable: Leverage (1) (2) (3) (4) (5) DumExposed x Dum2002-Q2 -0.005** -0.002 -0.002 -0.002 -0.001 [0.002] [0.002] [0.002] [0.003] [0.002] DumExposed -0.005 -0.005 0.001 -0.002 [0.003] [0.004] [0.002] [0.004] Telecoms Industry excluded Yes Yes Yes Yes Yes Same state excluded No No No Yes Yes Industry-Quarter Dummies No Yes Yes Yes Yes State Dummies No No Yes Yes No Firm FE No No No No Yes Observations 2923 2915 2913 2225 2227 R-squared 0.054 0.336 0.35 0.361 0.909
Table V: Financial Transmission of Telecom Defaults
Summary of Results: Telecoms Application Effect on supply of credit by exposed bank
Borrowers of exposed banks experience a 3 percentage point decline in leverage
Effect on total supply of capital? No overall effect on investment, stock returns Look deeper into firm heterogeneity
Evidence of bank heterogeneity Smaller effect for banks with larger use of credit derivatives No evidence across size or liquid assets
Conclusion and Next Steps
Methodology useful to identify financial transmission Generalization: aggregate industry defaults/rating
migrations (S&P) Potential questions
Which banks are more likely to be a conduit for financial transmission? Does the magnitude change, within banks, when bank characteristics change?
Which firms can substitute sources of finance? Does the magnitude of financial transmission change with
the business cycle, monetary policy? Financial transmission versus ‘real’ transmission


![GSB 550 RE GSB 550-2 - bosch-pt.co.kr0/user_manual_20024_2609140164.pdf · GSB 550 RE GSB 550-2 PROFESSIONAL ... [rpm] 2 500/3 000 0–3 000 0–3 000 Impact rate, max. [bpm]](https://img.pdfslide.net/doc/110x75/5b8439157f8b9a784a8bdcf8/gsb-550-re-gsb-550-2-bosch-ptcokr-0usermanual20024-gsb-550-re-gsb-550-2.jpg)