Embed Size (px)
Citation preview

8/8/2019 Measuring Rate and Return
http://slidepdf.com/reader/full/measuring-rate-and-return 1/45
MEASURING RISK AND RETURN
8/8/2019 Measuring Rate and Return
http://slidepdf.com/reader/full/measuring-rate-and-return 2/45
I. PORTFOLIO THEORY
´ How does investor decide among group of
assets?
´
assume: investors are risk averse« additional compensation for risk
« tradeoff between risk and expected return

8/8/2019 Measuring Rate and Return
http://slidepdf.com/reader/full/measuring-rate-and-return 3/45
GOAL
´ efficient or optimal portfolio
« for a given risk, maximize exp. return
«
OR« for a given exp. return, minimize the risk
8/8/2019 Measuring Rate and Return
http://slidepdf.com/reader/full/measuring-rate-and-return 4/45
TOOLS
´ measure risk, return
´ quantify risk/return tradeoff
8/8/2019 Measuring Rate and Return
http://slidepdf.com/reader/full/measuring-rate-and-return 5/45
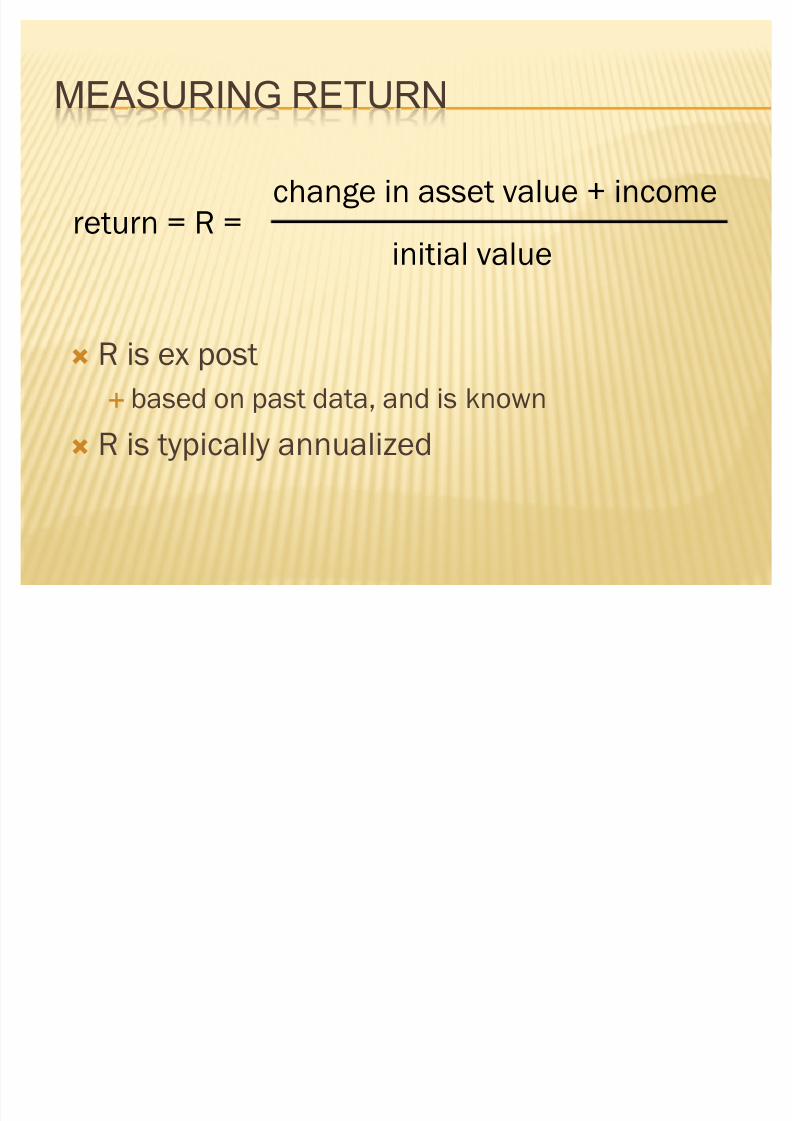
return = R =change in asset value + income
initial value
MEASURING RETURN
´ R is ex post
« based on past data, and is known
´ R is typically annualized
8/8/2019 Measuring Rate and Return
http://slidepdf.com/reader/full/measuring-rate-and-return 6/45
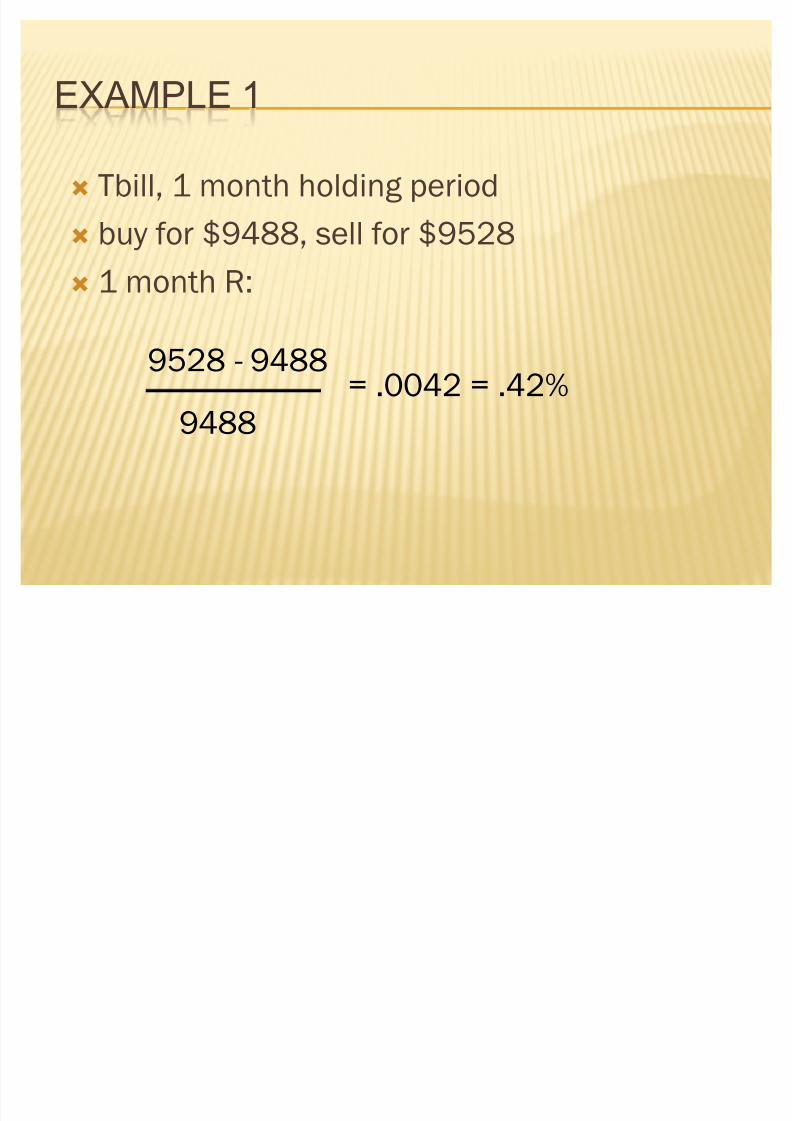
EXAMPLE 1
´ Tbill, 1 month holding period
´ buy for $9488, sell for $9528
´ 1 month R:
9528 - 9488
9488
= .0042 = .42%
8/8/2019 Measuring Rate and Return
http://slidepdf.com/reader/full/measuring-rate-and-return 7/45
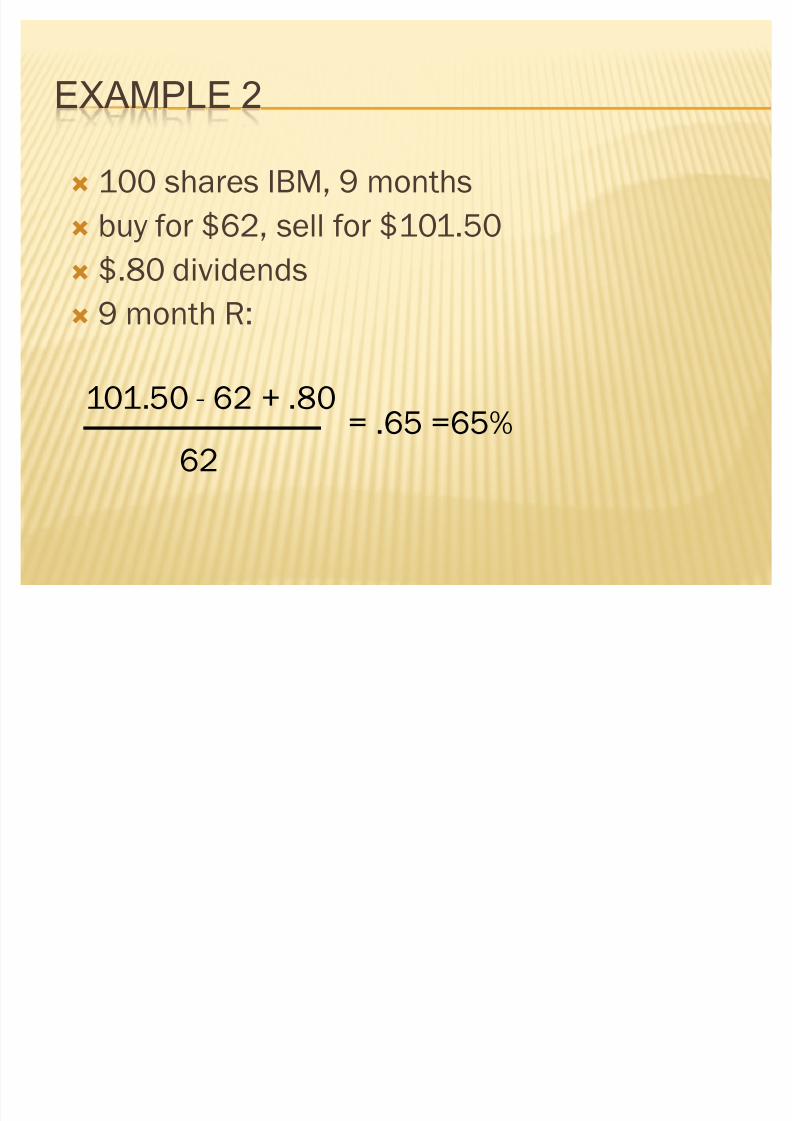
EXAMPLE 2
´ 100 shares IBM, 9 months
´ buy for $62, sell for $101.50
´ $.80 dividends´ 9 month R:
101.50 - 62 + .8062
= .65 =65%
8/8/2019 Measuring Rate and Return
http://slidepdf.com/reader/full/measuring-rate-and-return 8/45
EXPECTED RETURN
´ The future is uncertain.
´ Investors do not know with certainty whether the economy will
be growing rapidly or be in recession.
´ Investors do not know what rate of return their investments willyield.
´ Therefore, they base their decisions on their expectations
concerning the future.
´ The expected rate of return on a stock represents the mean of a probability distribution of possible future returns on the stock.
8
8/8/2019 Measuring Rate and Return
http://slidepdf.com/reader/full/measuring-rate-and-return 9/45
EXPECTED RETURN
´ measuring likely future return
´ based on probability distribution
´ random variable
E(R) = SUM(Ri x Prob(Ri))
8/8/2019 Measuring Rate and Return
http://slidepdf.com/reader/full/measuring-rate-and-return 10/45
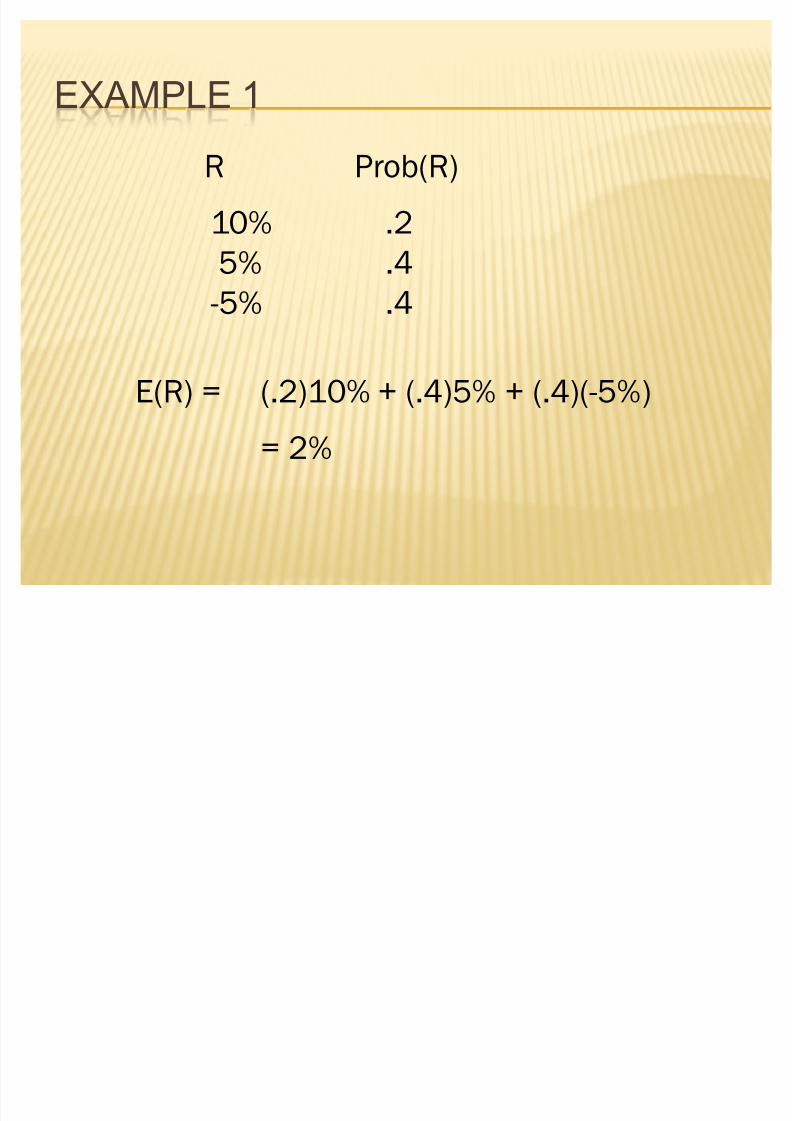
EXAMPLE 1
R Prob(R)
10% .2
5% .4-5% .4
E(R) = (.2)10% + (.4)5% + (.4)(-5%)
= 2%
8/8/2019 Measuring Rate and Return
http://slidepdf.com/reader/full/measuring-rate-and-return 11/45
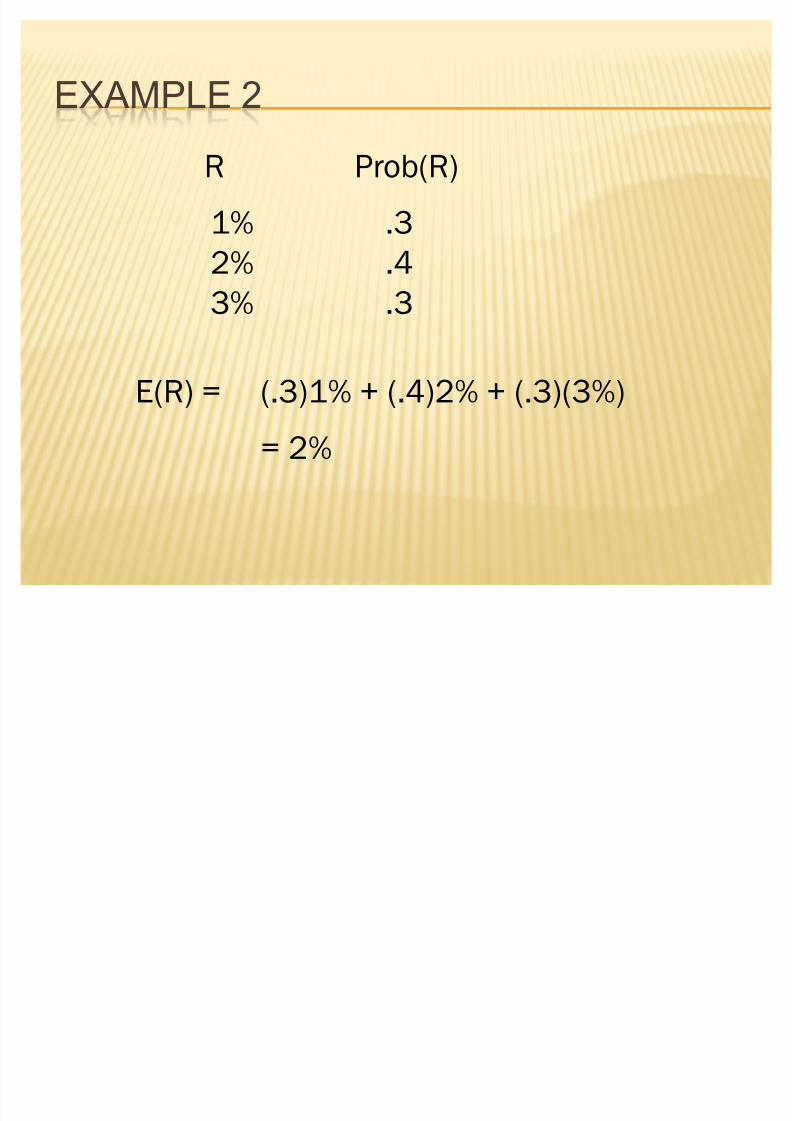
EXAMPLE 2
R Prob(R)
1% .3
2% .43% .3
E(R) = (.3)1% + (.4)2% + (.3)(3%)
= 2%
8/8/2019 Measuring Rate and Return
http://slidepdf.com/reader/full/measuring-rate-and-return 12/45
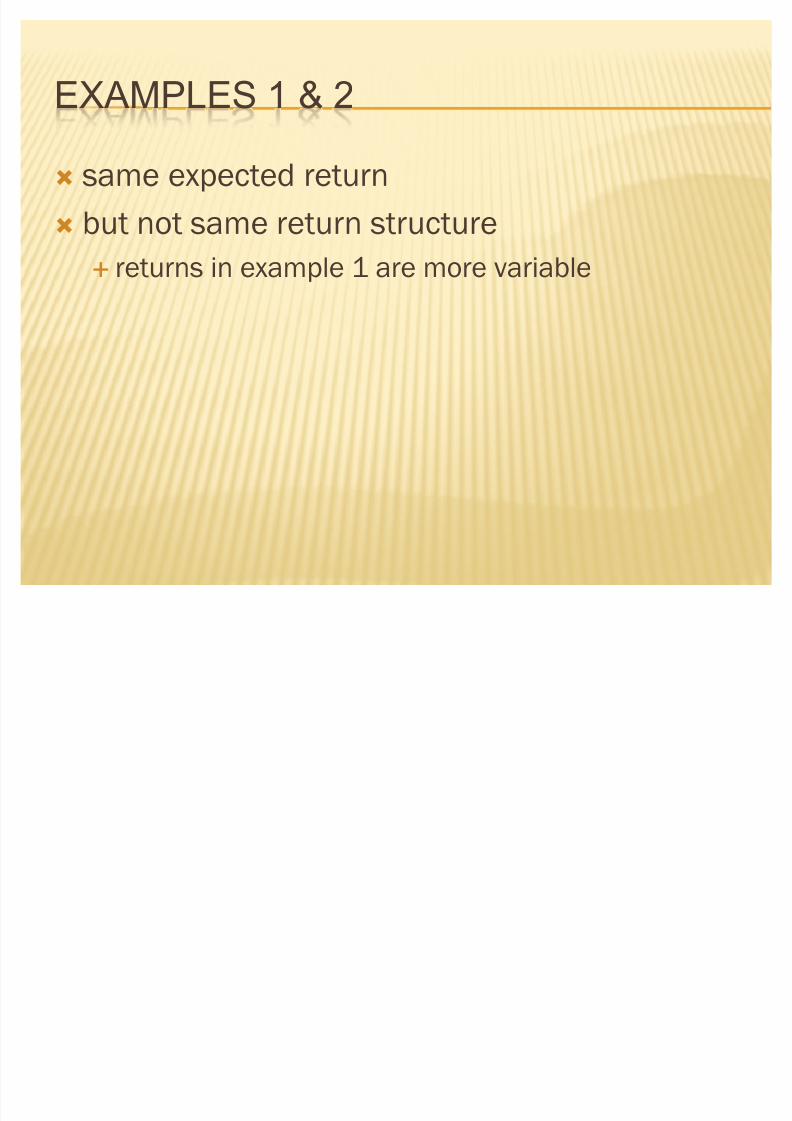
EXAMPLES 1 & 2
´ same expected return
´ but not same return structure
«
returns in example 1 are more variable
8/8/2019 Measuring Rate and Return
http://slidepdf.com/reader/full/measuring-rate-and-return 13/45
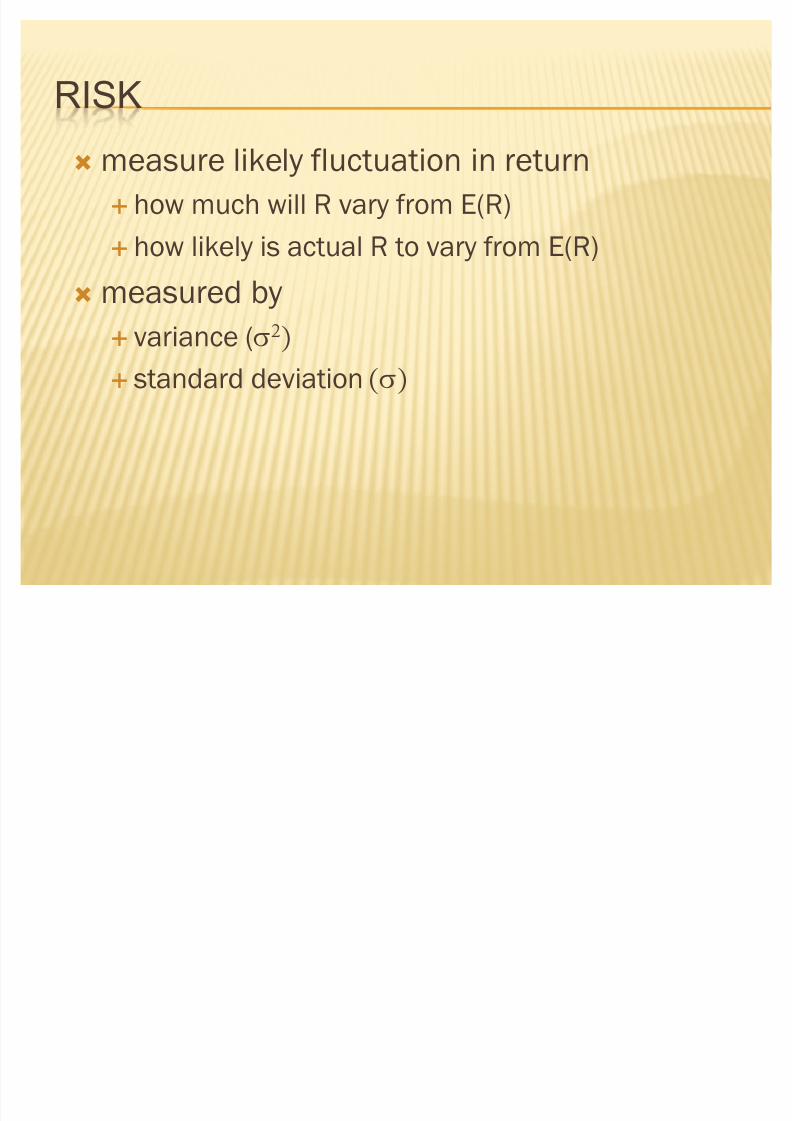
RISK
´measure likely fluctuation in return
« how much will R vary from E(R)
« how likely is actual R to vary from E(R)
´measured by
« variance (W
« standard deviation W
8/8/2019 Measuring Rate and Return
http://slidepdf.com/reader/full/measuring-rate-and-return 14/45
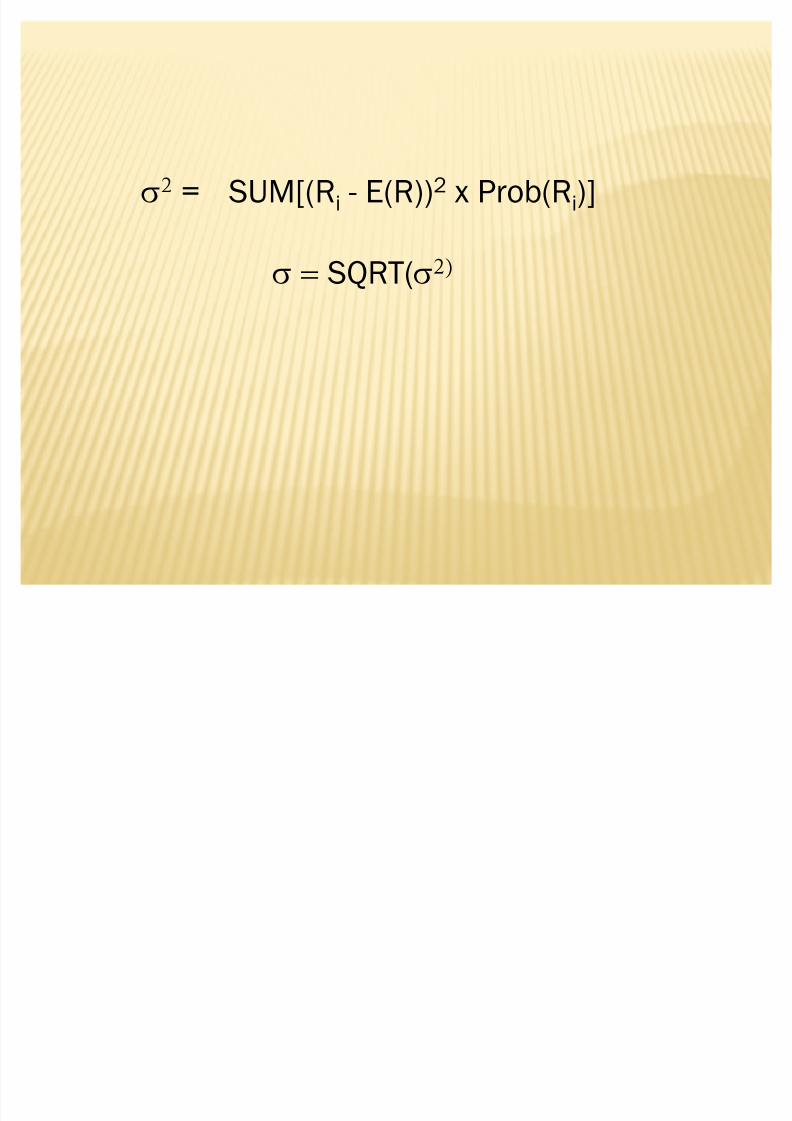
W = SUM[(Ri - E(R))2 x Prob(Ri)]
W!SQRT(W
8/8/2019 Measuring Rate and Return
http://slidepdf.com/reader/full/measuring-rate-and-return 15/45
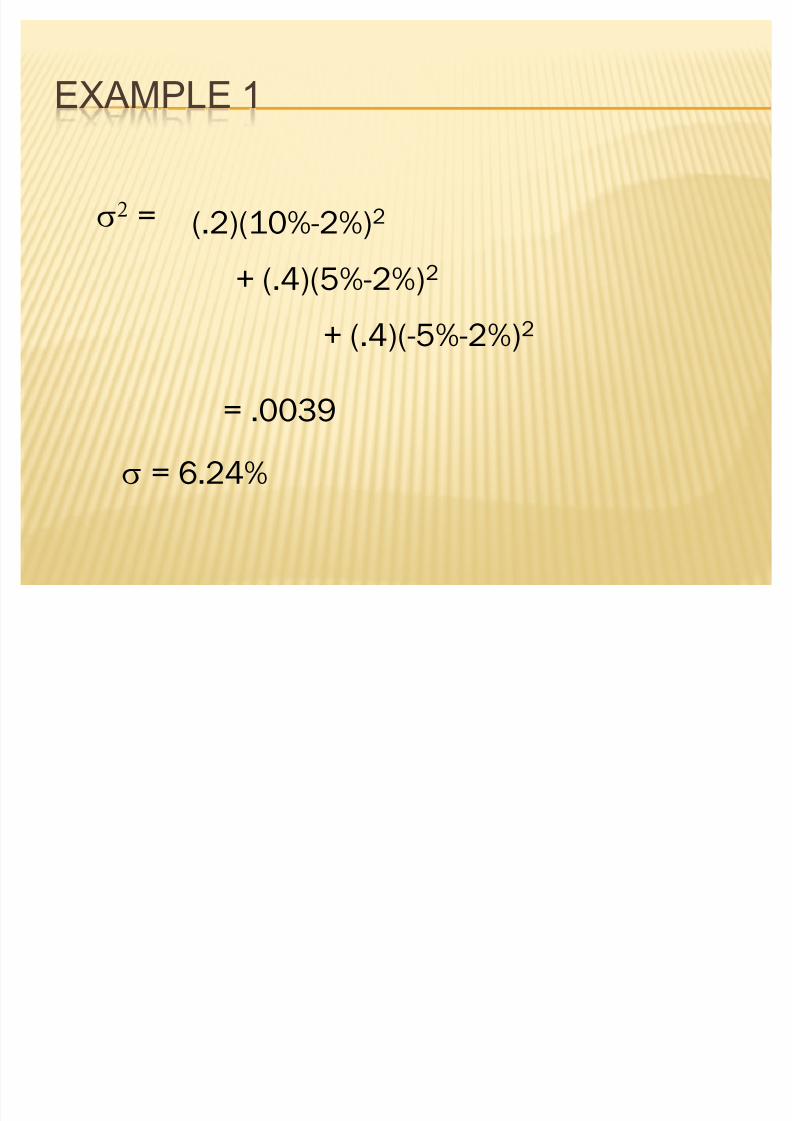
EXAMPLE 1
W = (.2)(10%-2%)2
= .0039
+ (.4)(5%-2%)2
+ (.4)(-5%-2%)2
W = 6.24%
8/8/2019 Measuring Rate and Return
http://slidepdf.com/reader/full/measuring-rate-and-return 16/45
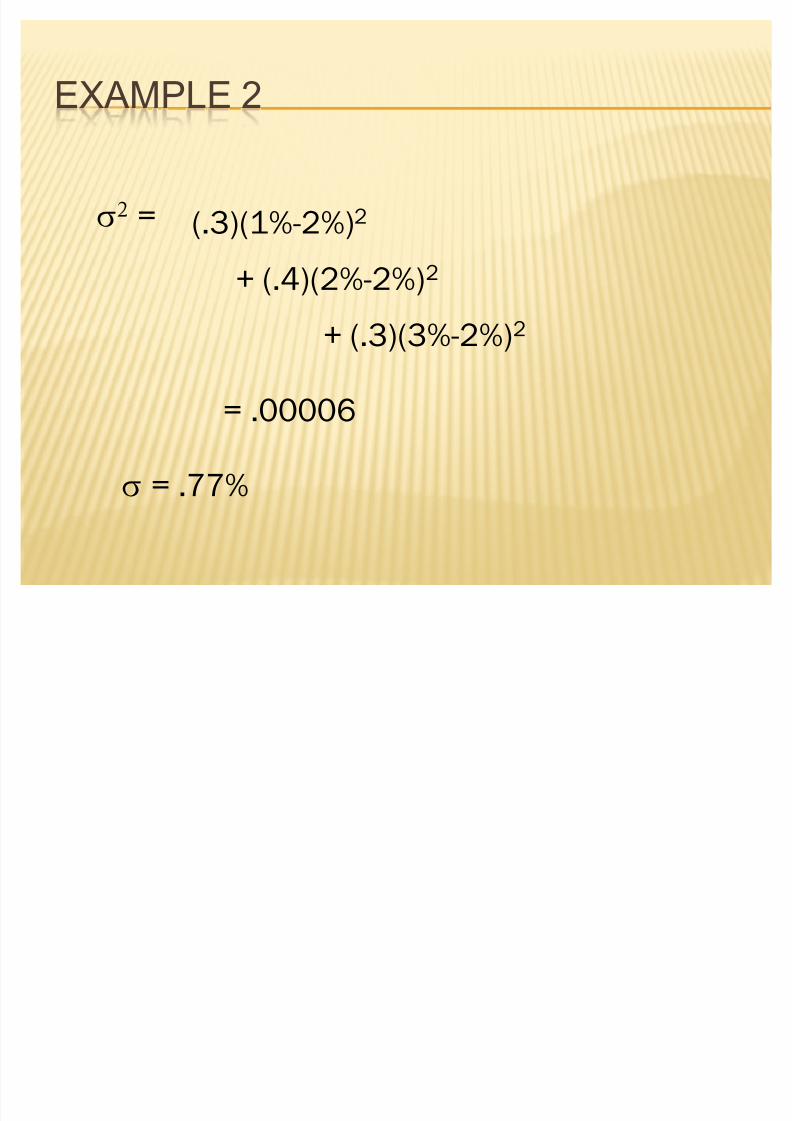
EXAMPLE 2
W = (.3)(1%-2%)2
= .00006
+ (.4)(2%-2%)2
+ (.3)(3%-2%)2
W = .77%
8/8/2019 Measuring Rate and Return
http://slidepdf.com/reader/full/measuring-rate-and-return 17/45
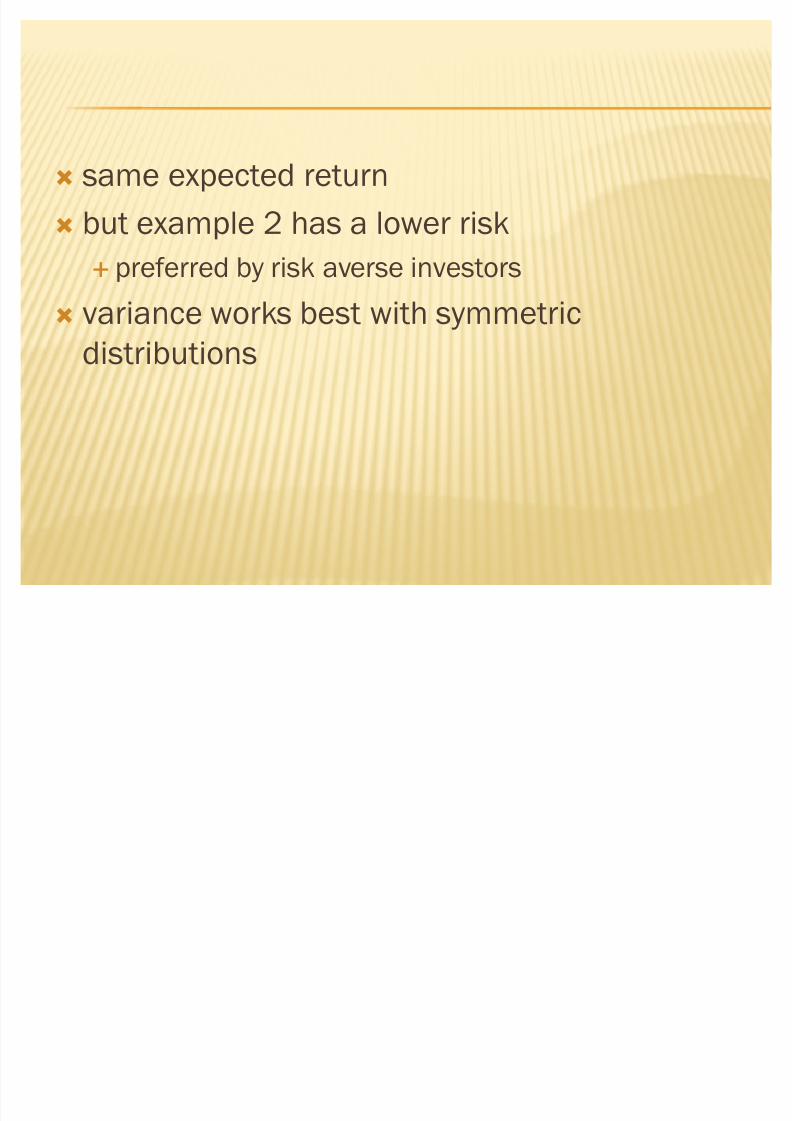
´ same expected return
´ but example 2 has a lower risk
«
preferred by risk averse investors´ variance works best with symmetric
distributions
8/8/2019 Measuring Rate and Return
http://slidepdf.com/reader/full/measuring-rate-and-return 18/45
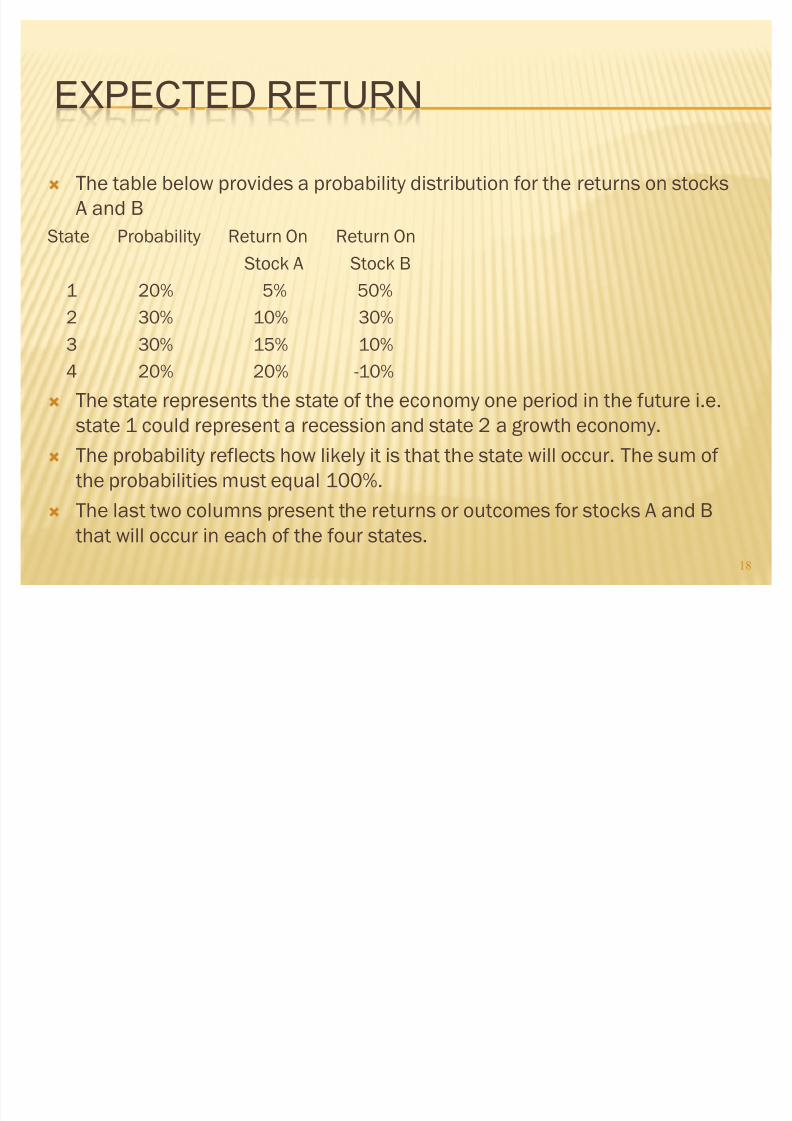
EXPECTED RETURN
´ The table below provides a probability distribution for the returns on stocks
A and B
State Probability Return On Return On
Stock A Stock B
1 20% 5% 50%
2 30% 10% 30%
3 30% 15% 10%
4 20% 20% -10%
´ The state represents the state of the economy one period in the future i.e.
state 1 could represent a recession and state 2 a growth economy.
´ The probability reflects how likely it is that the state will occur. The sum of
the probabilities must equal 100%.
´ The last two columns present the returns or outcomes for stocks A and B
that will occur in each of the four states.
18
8/8/2019 Measuring Rate and Return
http://slidepdf.com/reader/full/measuring-rate-and-return 19/45
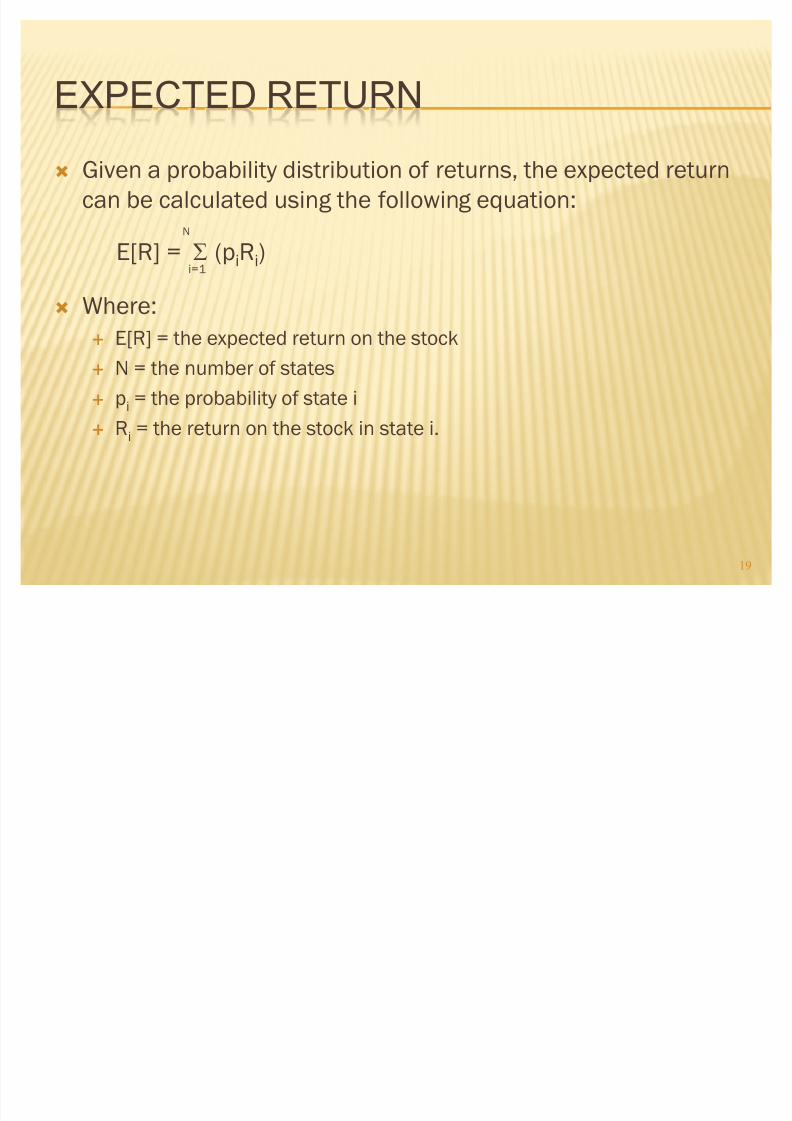
EXPECTED RETURN
´ Given a probability distribution of returns, the expected return
can be calculated using the following equation:N
E[R] = 7(piRi)i=1
´ Where:
« E[R] = the expected return on the stock
« N = the number of states
« pi = the probability of state i
« Ri = the return on the stock in state i.
19
8/8/2019 Measuring Rate and Return
http://slidepdf.com/reader/full/measuring-rate-and-return 20/45
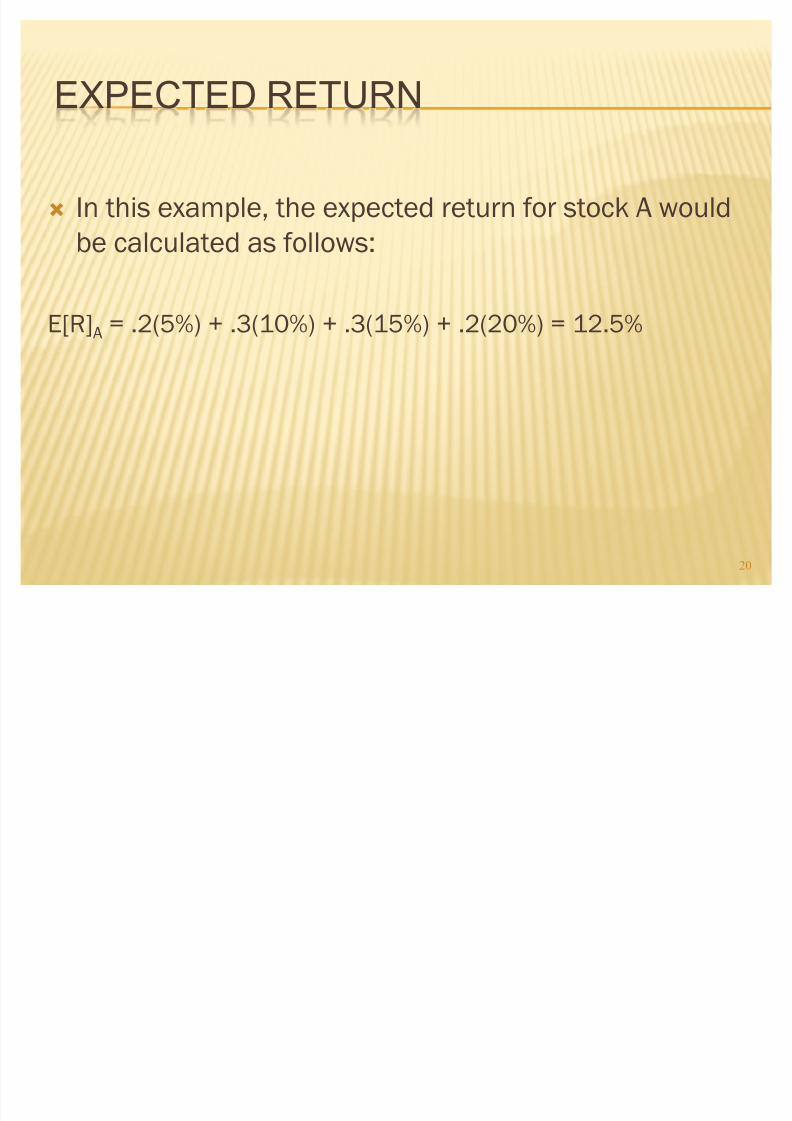
EXPECTED RETURN
´ In this example, the expected return for stock A would
be calculated as follows:
E[R]A = .2(5%) + .3(10%) + .3(15%) + .2(20%) = 12.5%
20
8/8/2019 Measuring Rate and Return
http://slidepdf.com/reader/full/measuring-rate-and-return 21/45
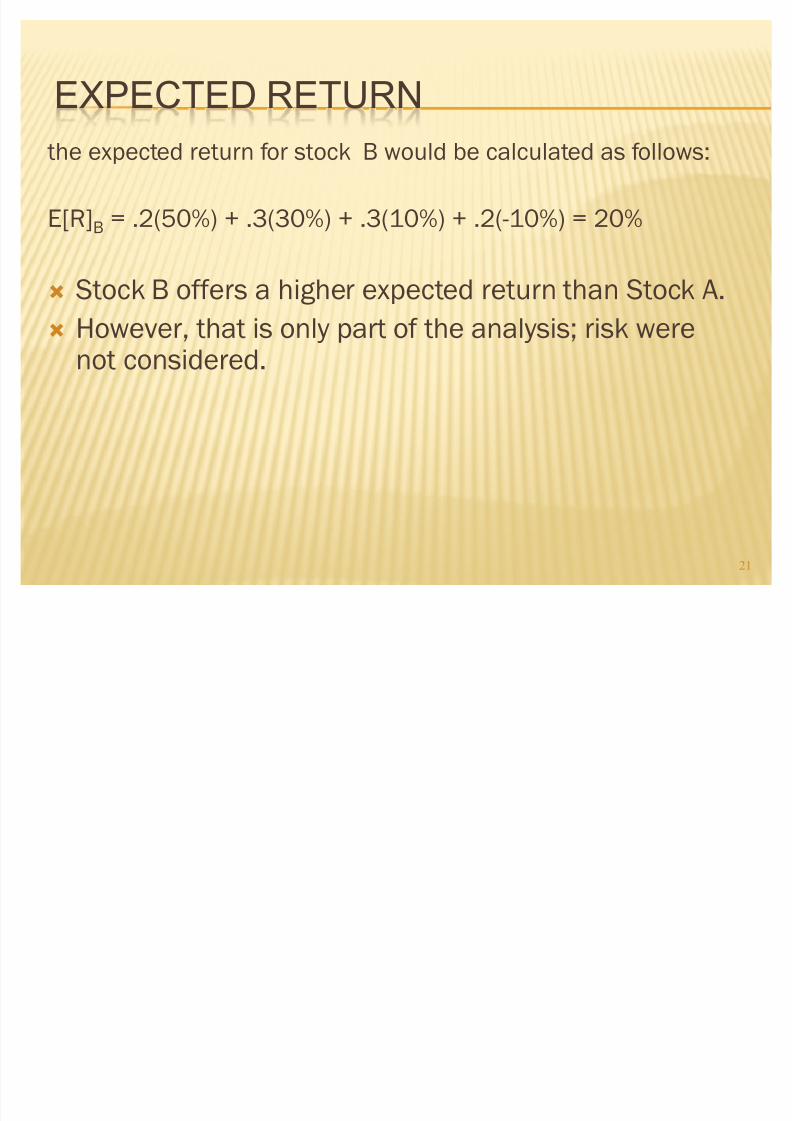
EXPECTED RETURN
the expected return for stock B would be calculated as follows:
E[R]B = .2(50%) + .3(30%) + .3(10%) + .2(-10%) = 20%
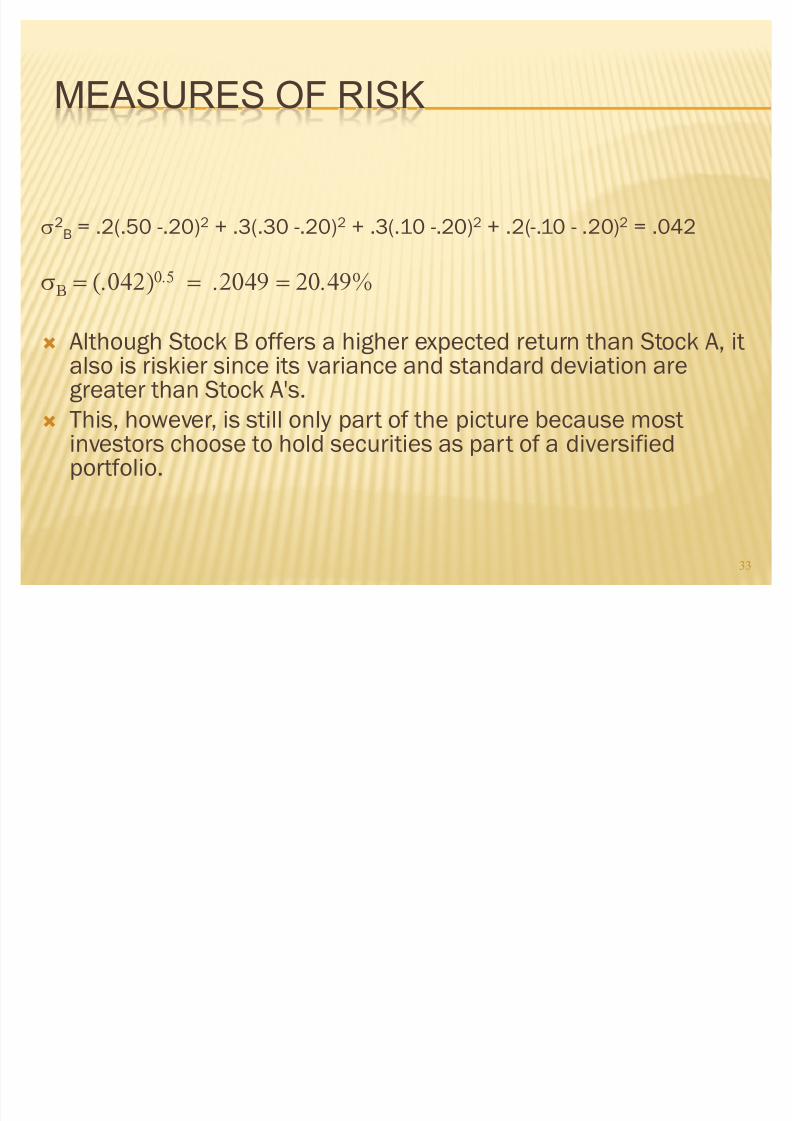
´ Stock B offers a higher expected return than Stock A.
´ However, that is only part of the analysis; risk werenot considered.
21

8/8/2019 Measuring Rate and Return
http://slidepdf.com/reader/full/measuring-rate-and-return 22/45
MANAGING RISK
´ Diversification
« holding a group of assets
« lower risk w/out lowering E(R)
8/8/2019 Measuring Rate and Return
http://slidepdf.com/reader/full/measuring-rate-and-return 23/45
´Why?
« individual assets do not have same return pattern
« combining assets reduces overall return variation
8/8/2019 Measuring Rate and Return
http://slidepdf.com/reader/full/measuring-rate-and-return 24/45
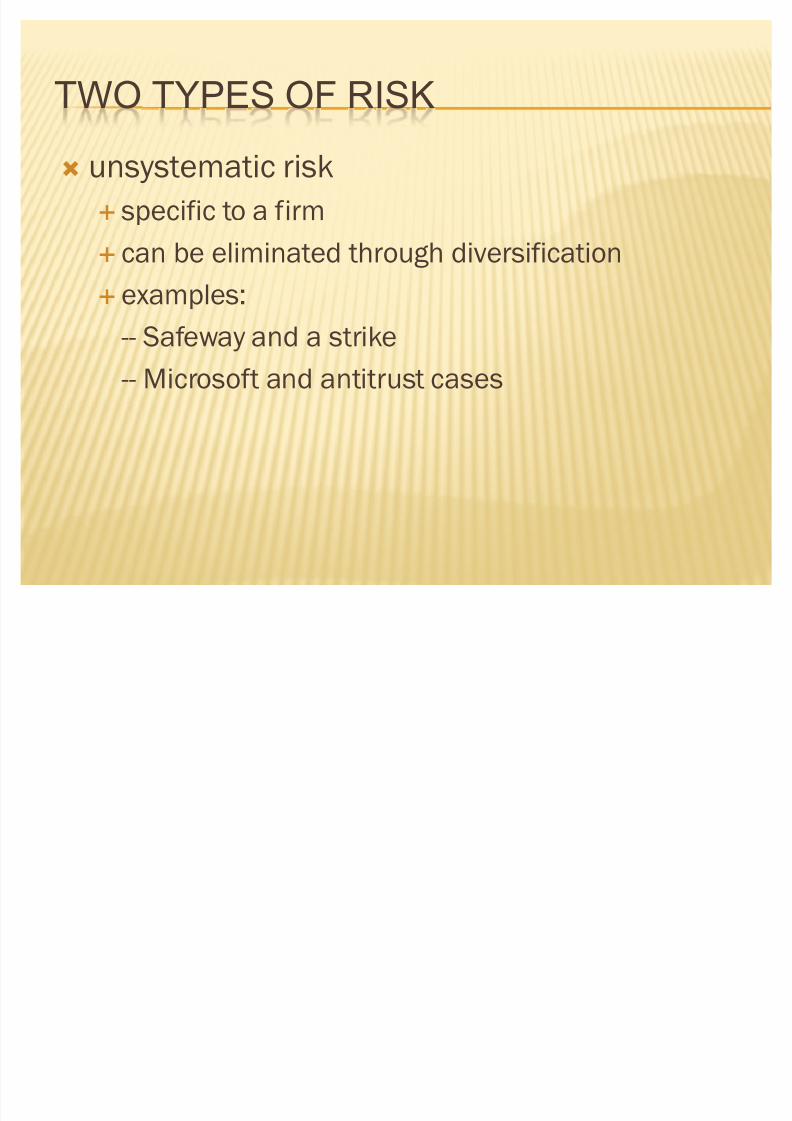
TWO TYPES OF RISK
´ unsystematic risk
« specific to a firm
« can be eliminated through diversification
« examples:
-- Safeway and a strike
-- Microsoft and antitrust cases
8/8/2019 Measuring Rate and Return
http://slidepdf.com/reader/full/measuring-rate-and-return 25/45
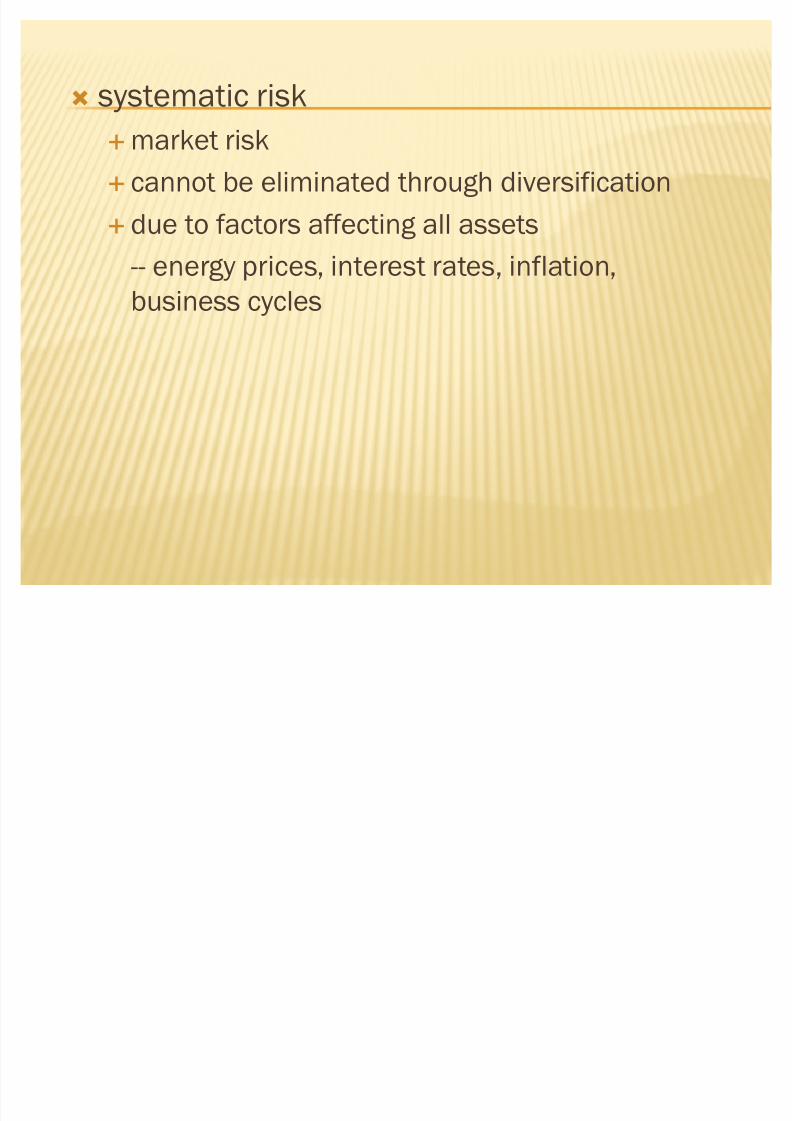
´ systematic risk
«market risk« cannot be eliminated through diversification
« due to factors affecting all assets
-- energy prices, interest rates, inflation,business cycles

8/8/2019 Measuring Rate and Return
http://slidepdf.com/reader/full/measuring-rate-and-return 26/45
EXAMPLE
´ choose stocks from NSE listings
´ go from 1 stock to 20 stocks
«
reduce risk by 40-50%
8/8/2019 Measuring Rate and Return
http://slidepdf.com/reader/full/measuring-rate-and-return 27/45
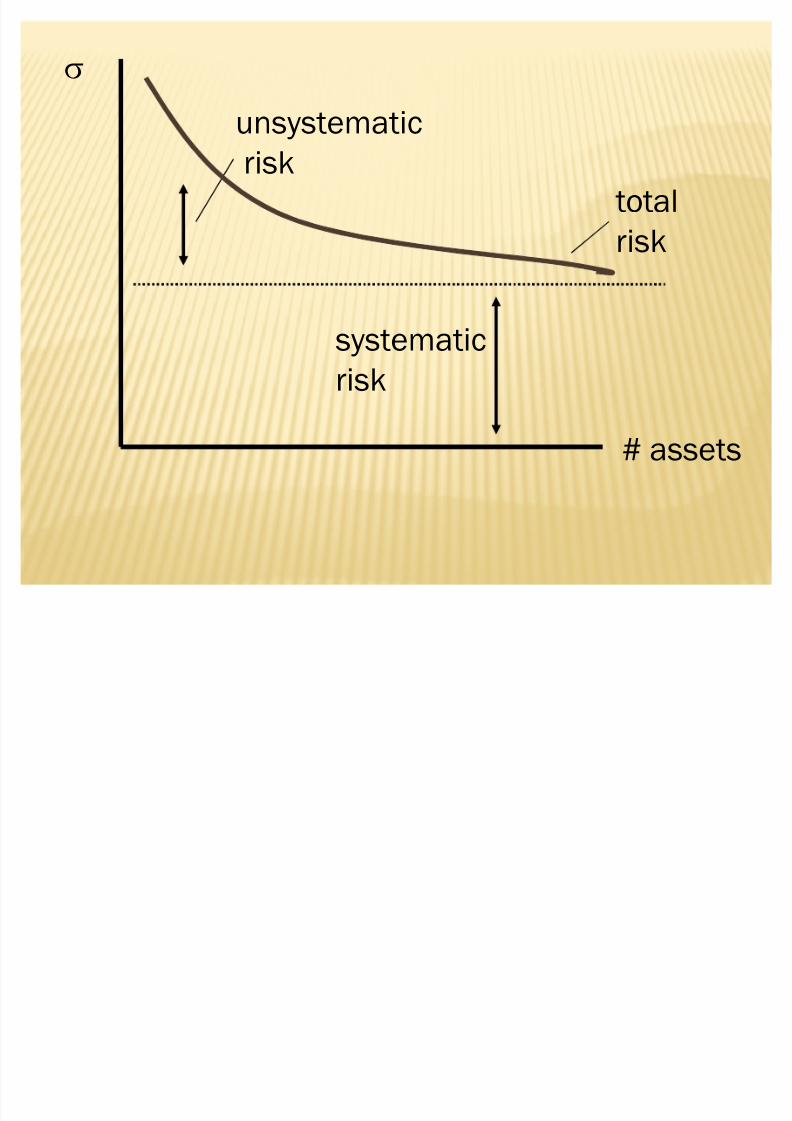
W
# assets
systematic
risk
unsystematic
risktotal
risk
8/8/2019 Measuring Rate and Return
http://slidepdf.com/reader/full/measuring-rate-and-return 28/45
MEASURES OF RISK
´ Risk reflects the chance that the actual return on an
investment may be different than the expected return.
´ One way to measure risk is to calculate the variance and
standard deviation of the distribution of returns.
28
8/8/2019 Measuring Rate and Return
http://slidepdf.com/reader/full/measuring-rate-and-return 29/45
MEASURES OF RISK
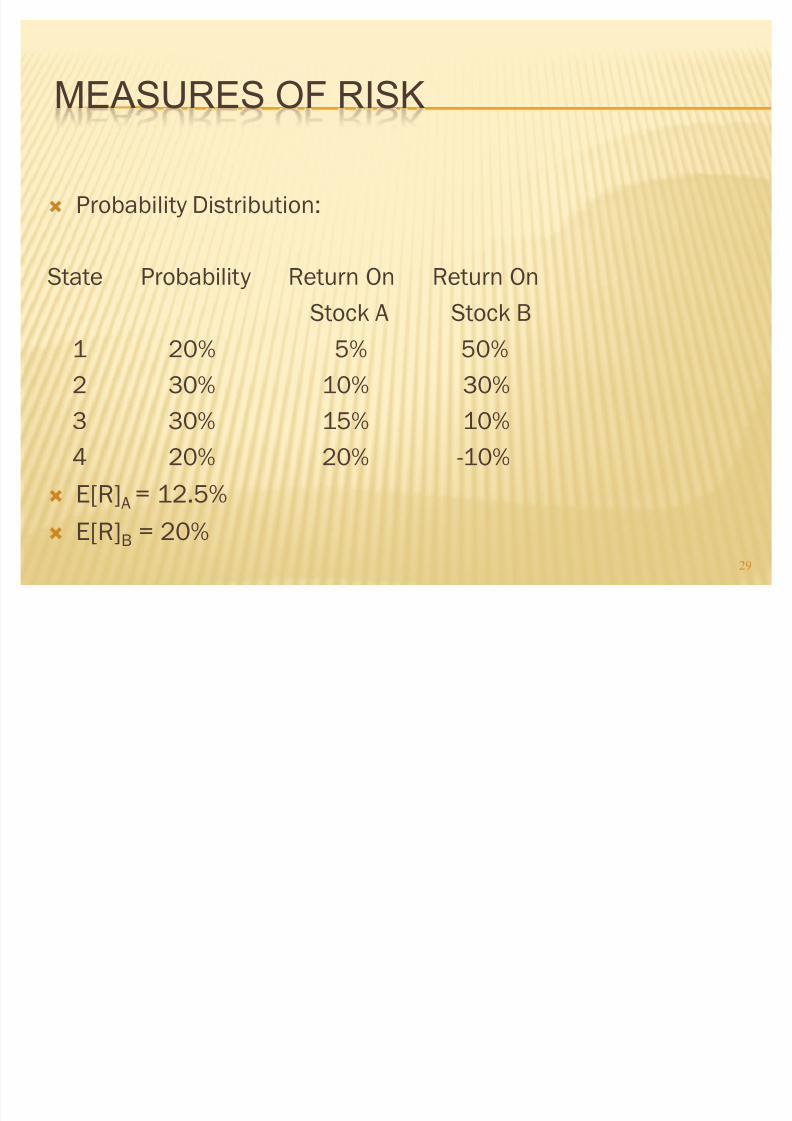
´ Probability Distribution:
State Probability Return On Return OnStock A Stock B
1 20% 5% 50%
2 30% 10% 30%
3 30% 15% 10%4 20% 20% -10%
´ E[R]A = 12.5%
´ E[R]B = 20%29
8/8/2019 Measuring Rate and Return
http://slidepdf.com/reader/full/measuring-rate-and-return 30/45
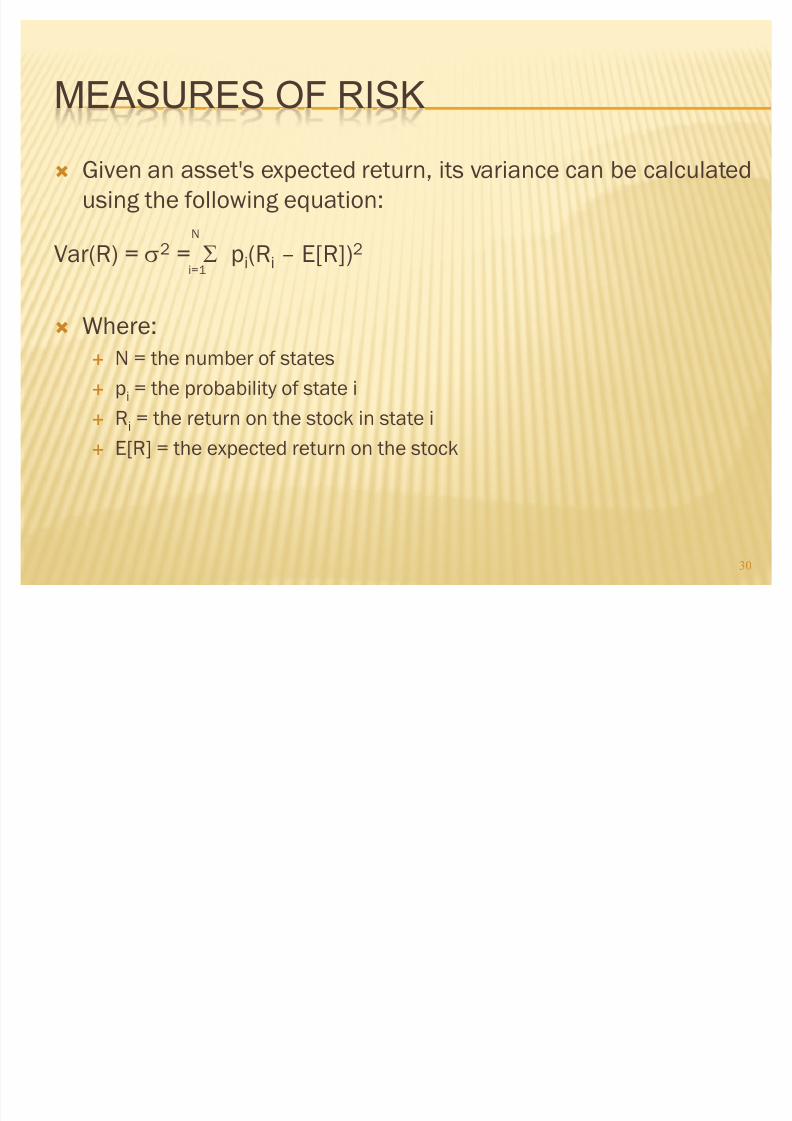
MEASURES OF RISK
´ Given an asset's expected return, its variance can be calculated
using the following equation:
N
Var(R) = W2 = 7 pi(Ri ² E[R])2
i=1
´ Where:
« N = the number of states
« pi = the probability of state i
« Ri = the return on the stock in state i« E[R] = the expected return on the stock
30
8/8/2019 Measuring Rate and Return
http://slidepdf.com/reader/full/measuring-rate-and-return 31/45
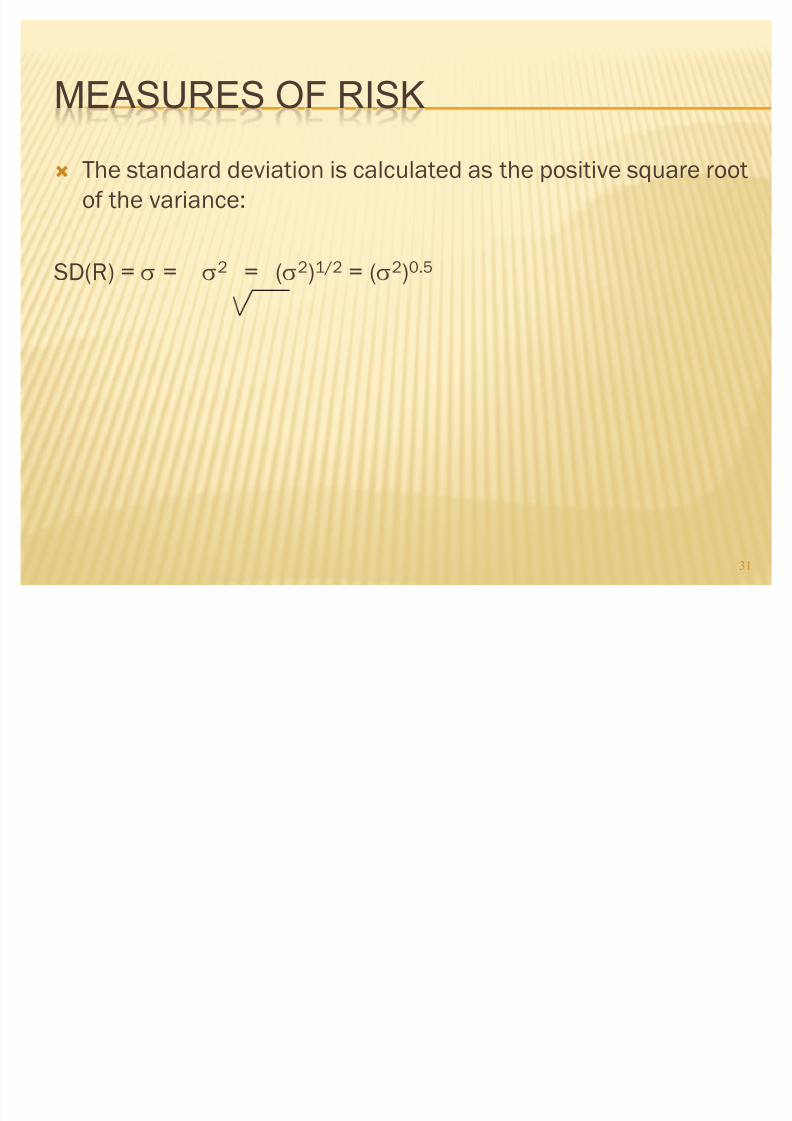
MEASURES OF RISK
´ The standard deviation is calculated as the positive square root
of the variance:
SD
(R) = W = W2
= (W2
)1/2
= (W2
)0.5
31
8/8/2019 Measuring Rate and Return
http://slidepdf.com/reader/full/measuring-rate-and-return 32/45
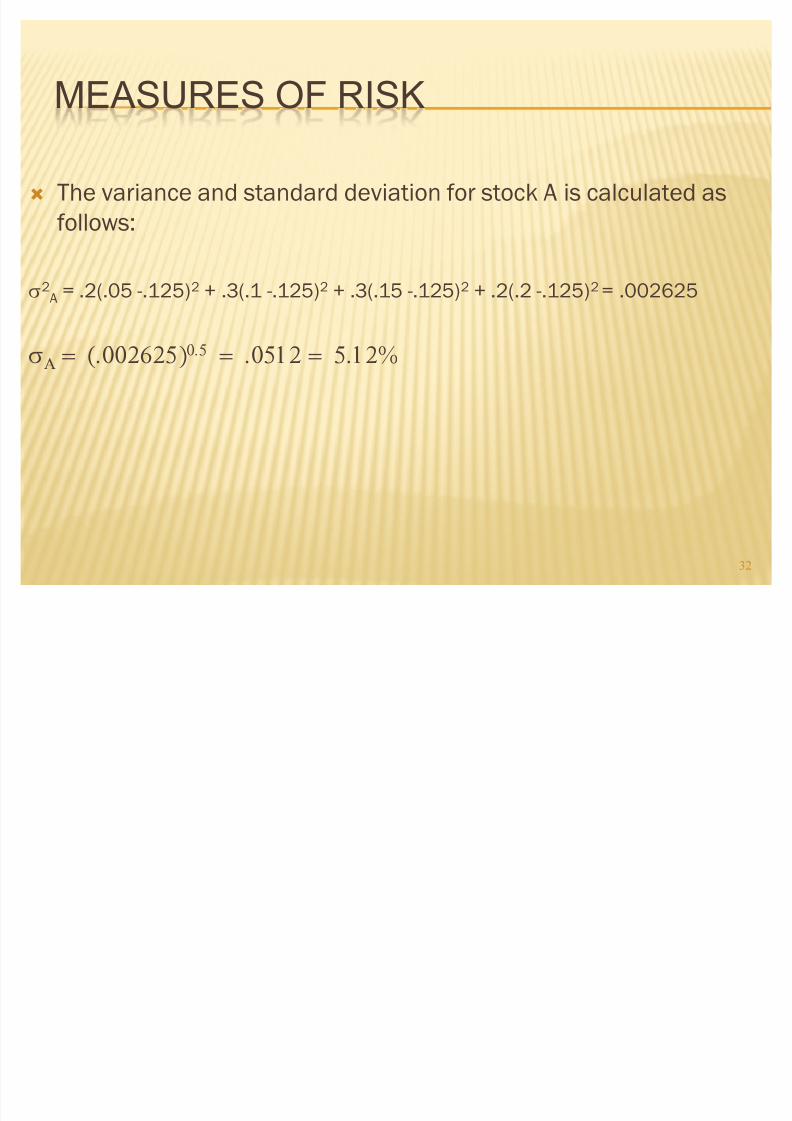
MEASURES OF RISK
´ The variance and standard deviation for stock A is calculated as
follows:
W2A = .2(.05 -.125)2 + .3(.1 -.125)2 + .3(.15 -.125)2 + .2(.2 -.125)2 = .002625
W% ! !!
32
8/8/2019 Measuring Rate and Return
http://slidepdf.com/reader/full/measuring-rate-and-return 33/45
8/8/2019 Measuring Rate and Return
http://slidepdf.com/reader/full/measuring-rate-and-return 34/45
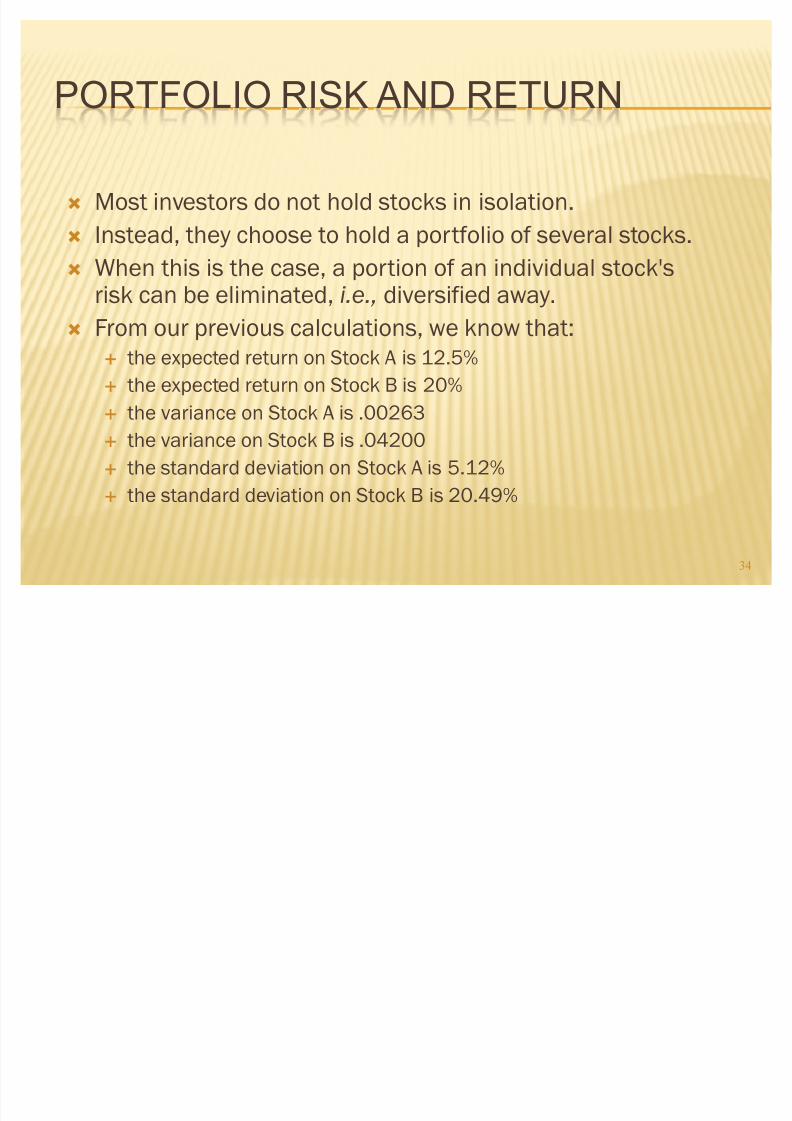
PORTFOLIO RISK AND RETURN
´ Most investors do not hold stocks in isolation.
´ Instead, they choose to hold a portfolio of several stocks.
´ When this is the case, a portion of an individual stock'srisk can be eliminated, i.e., diversified away.
´ From our previous calculations, we know that:« the expected return on Stock A is 12.5%
« the expected return on Stock B is 20%
«
the variance on Stock A is .00263« the variance on Stock B is .04200
« the standard deviation on Stock A is 5.12%
« the standard deviation on Stock B is 20.49%
34
8/8/2019 Measuring Rate and Return
http://slidepdf.com/reader/full/measuring-rate-and-return 35/45
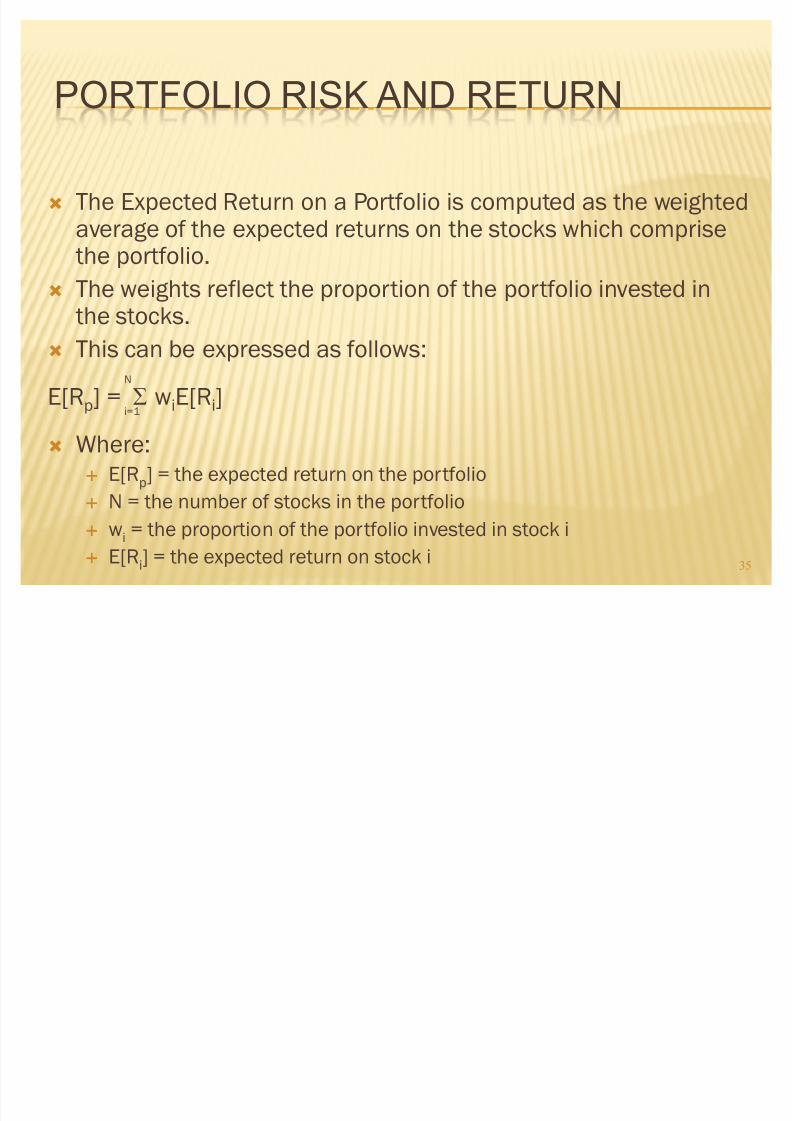
PORTFOLIO RISK AND RETURN
´ The Expected Return on a Portfolio is computed as the weightedaverage of the expected returns on the stocks which comprisethe portfolio.
´ The weights reflect the proportion of the portfolio invested inthe stocks.
´ This can be expressed as follows:N
E[Rp] = 7 wiE[Ri]i=1
´ Where:« E[Rp] = the expected return on the portfolio
« N = the number of stocks in the portfolio
« wi = the proportion of the portfolio invested in stock i
« E[Ri] = the expected return on stock i 35
8/8/2019 Measuring Rate and Return
http://slidepdf.com/reader/full/measuring-rate-and-return 36/45
PORTFOLIO RISK AND RETURN
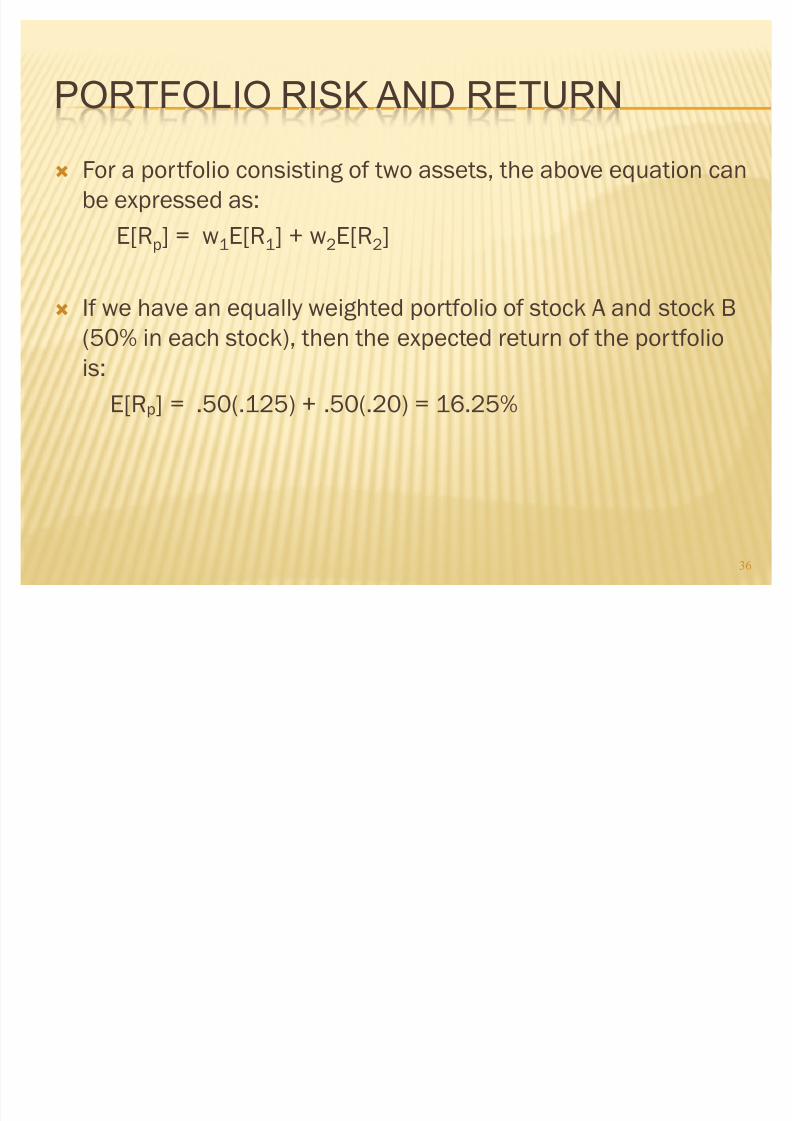
´ For a portfolio consisting of two assets, the above equation can
be expressed as:
E[Rp] = w1E[R1] + w2E[R2]
´ If we have an equally weighted portfolio of stock A and stock B
(50% in each stock), then the expected return of the portfolio
is:
E[Rp] = .50(.125) + .50(.20) = 16.25%
36
8/8/2019 Measuring Rate and Return
http://slidepdf.com/reader/full/measuring-rate-and-return 37/45
PORTFOLIO RISK AND RETURN
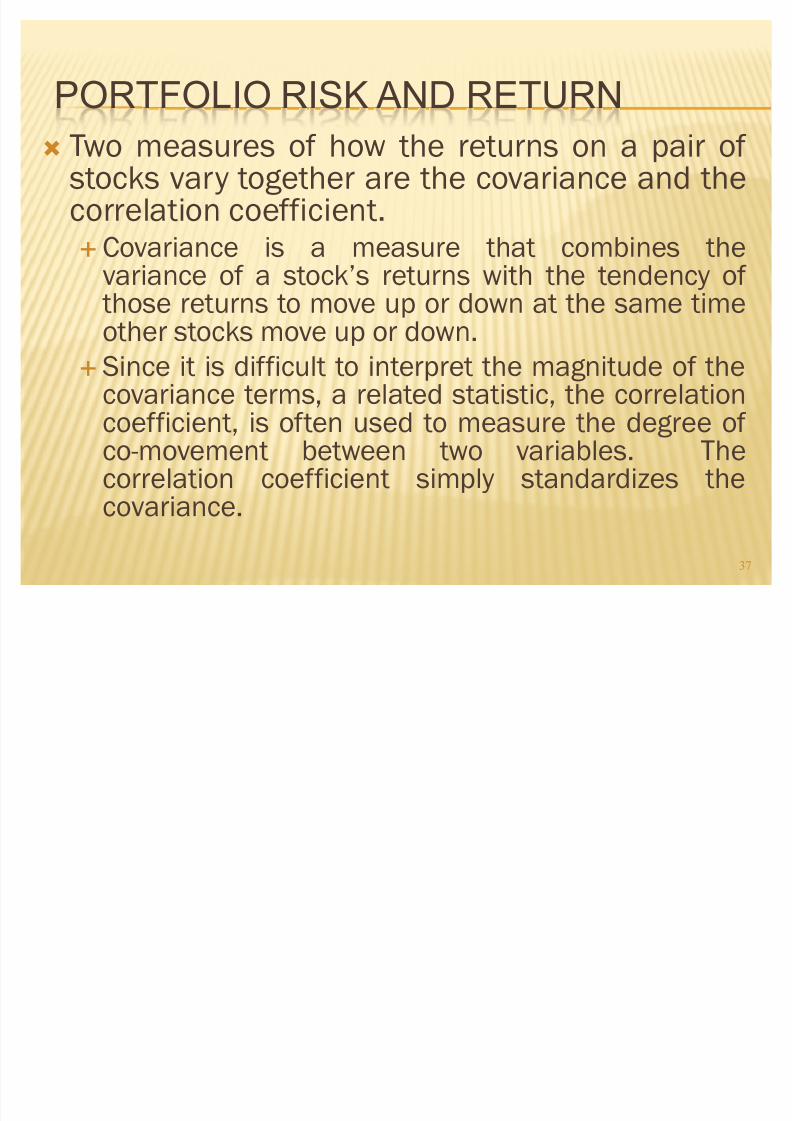
´ Two measures of how the returns on a pair of stocks vary together are the covariance and thecorrelation coefficient.«Covariance is a measure that combines the
variance of a stock·s returns with the tendency of those returns to move up or down at the same timeother stocks move up or down.
« Since it is difficult to interpret the magnitude of thecovariance terms, a related statistic, the correlation
coefficient, is often used to measure the degree of co-movement between two variables. Thecorrelation coefficient simply standardizes thecovariance.
37
8/8/2019 Measuring Rate and Return
http://slidepdf.com/reader/full/measuring-rate-and-return 38/45
PORTFOLIO RISK AND RETURN
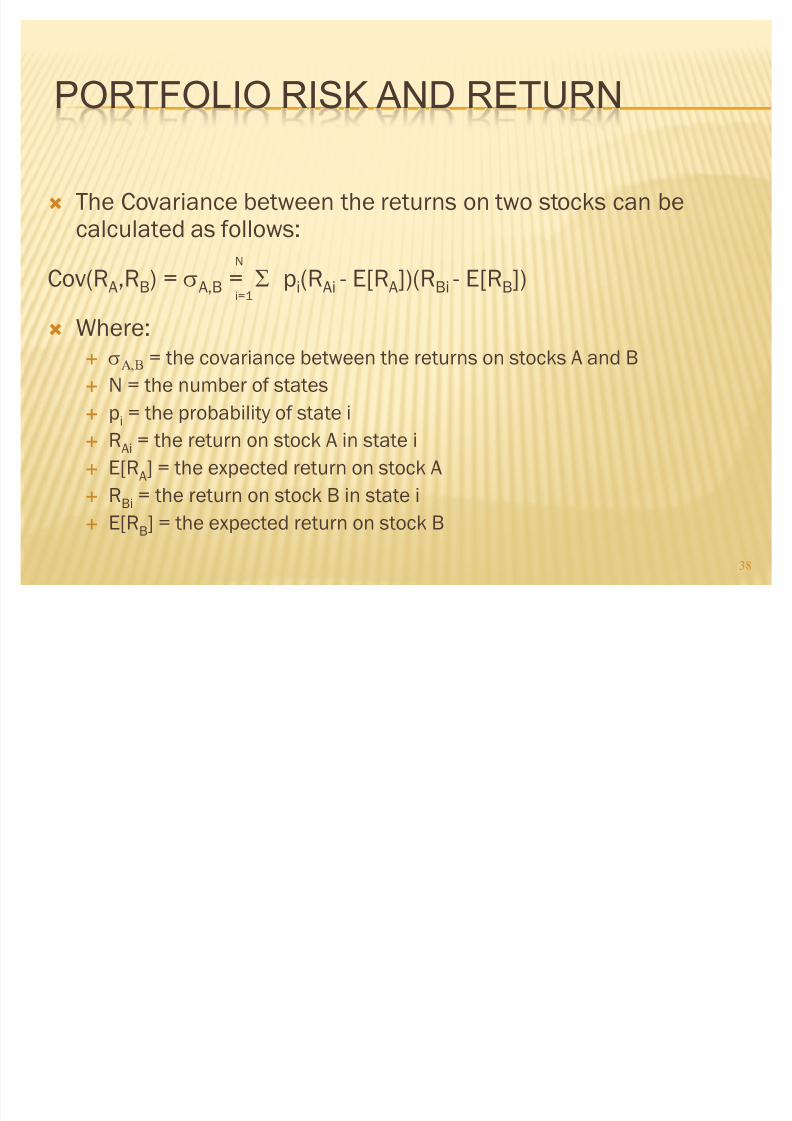
´ The Covariance between the returns on two stocks can becalculated as follows:
N
Cov(RA,RB) = WA,B = 7 pi(RAi - E[RA])(RBi - E[RB])i=1
´ Where:« W%& = the covariance between the returns on stocks A and B
« N = the number of states
«
pi = the probability of state i« RAi = the return on stock A in state i
« E[RA] = the expected return on stock A
« RBi = the return on stock B in state i
« E[RB] = the expected return on stock B
38
8/8/2019 Measuring Rate and Return
http://slidepdf.com/reader/full/measuring-rate-and-return 39/45
PORTFOLIO RISK AND RETURN
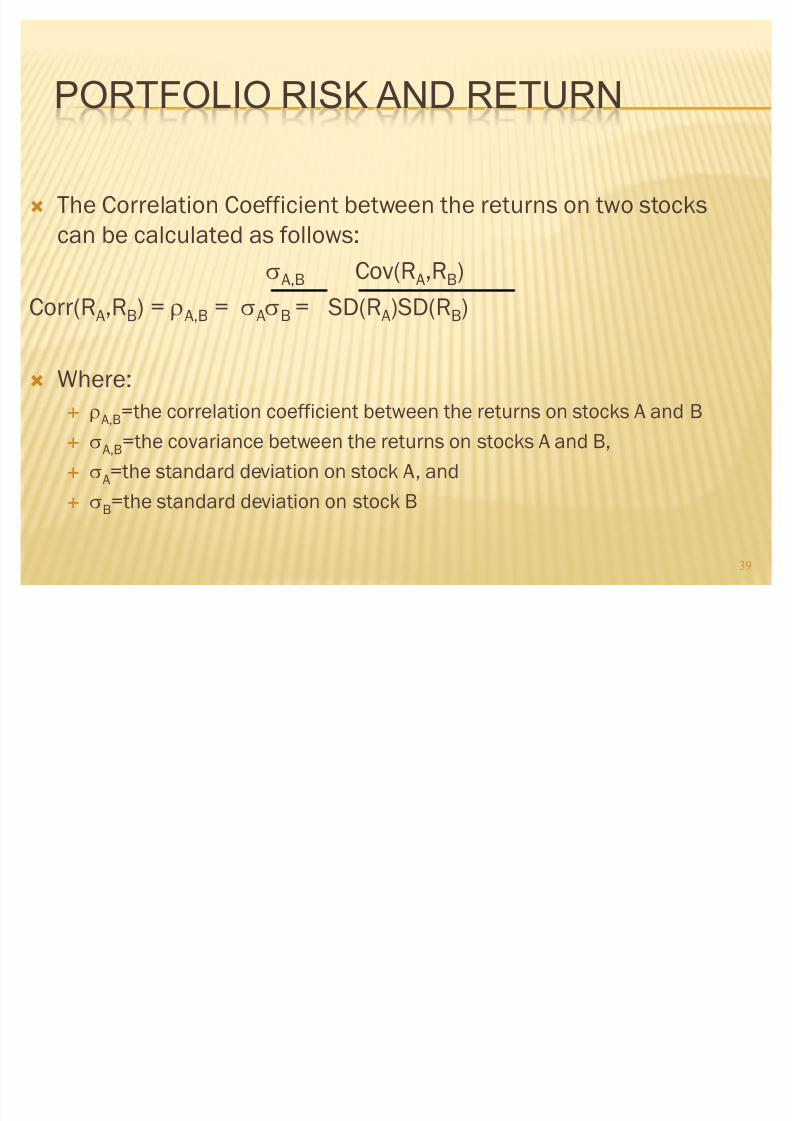
´ The Correlation Coefficient between the returns on two stocks
can be calculated as follows:
WA,B Cov(RA,RB)Corr(RA,RB) = VA,B = WAWB = SD(RA)SD(RB)
´ Where:
«
VA,B=the correlation coefficient between the returns on stocks A and B« WA,B=the covariance between the returns on stocks A and B,
« WA=the standard deviation on stock A, and
« WB=the standard deviation on stock B
39
8/8/2019 Measuring Rate and Return
http://slidepdf.com/reader/full/measuring-rate-and-return 40/45
PORTFOLIO RISK AND RETURN
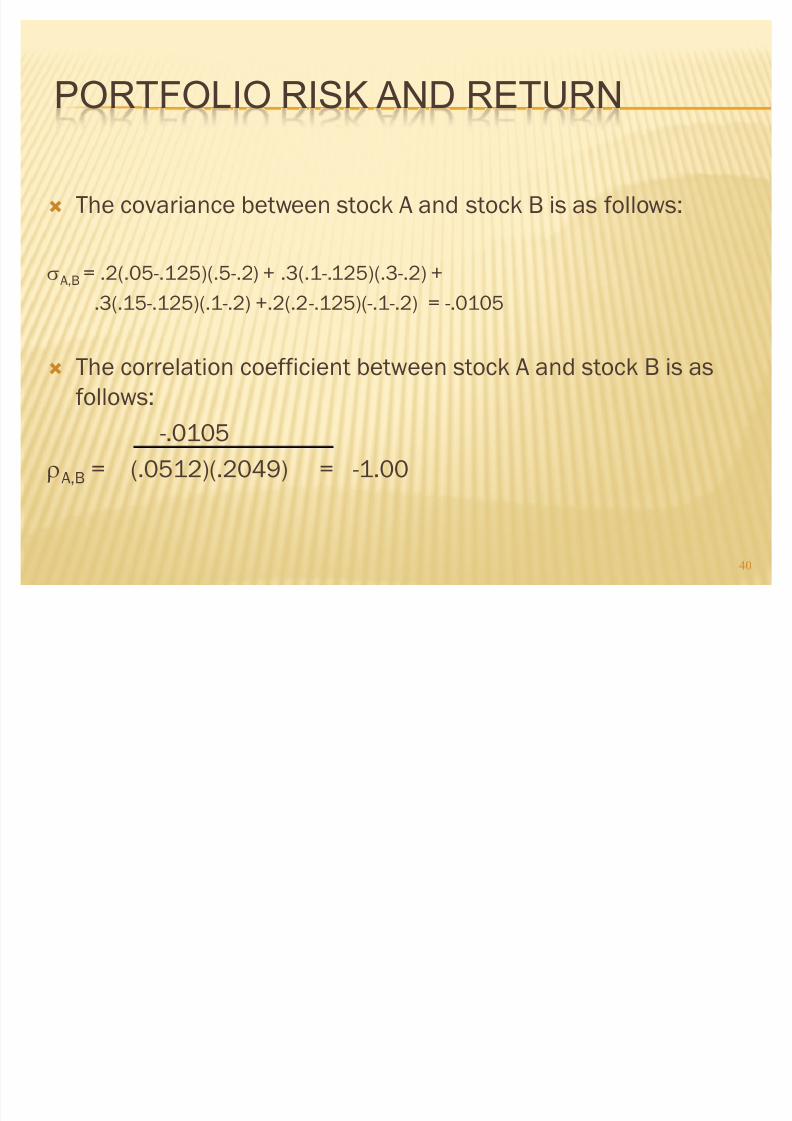
´ The covariance between stock A and stock B is as follows:
WA,B = .2(.05-.125)(.5-.2) + .3(.1-.125)(.3-.2) +.3(.15-.125)(.1-.2) +.2(.2-.125)(-.1-.2) = -.0105
´ The correlation coefficient between stock A and stock B is as
follows:
-.0105
VA,B = (.0512)(.2049) = -1.00
40
8/8/2019 Measuring Rate and Return
http://slidepdf.com/reader/full/measuring-rate-and-return 41/45
PORTFOLIO RISK AND RETURN
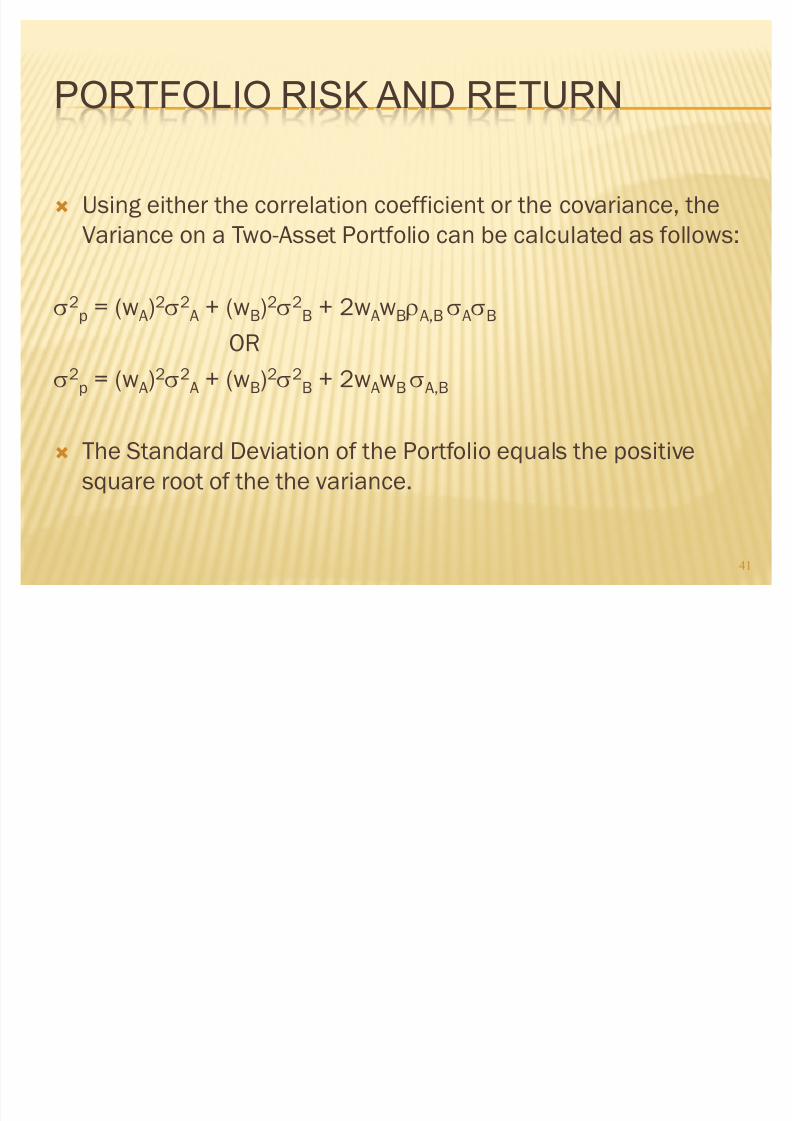
´ Using either the correlation coefficient or the covariance, the
Variance on a Two-Asset Portfolio can be calculated as follows:
W2p = (wA)2W2
A + (wB)2W2B + 2wAwB VA,BWAWB
OR
W2p = (wA)2W2
A + (wB)2W2B + 2wAwBWA,B
´ The Standard Deviation of the Portfolio equals the positive
square root of the the variance.
41
8/8/2019 Measuring Rate and Return
http://slidepdf.com/reader/full/measuring-rate-and-return 42/45
PORTFOLIO RISK AND RETURN
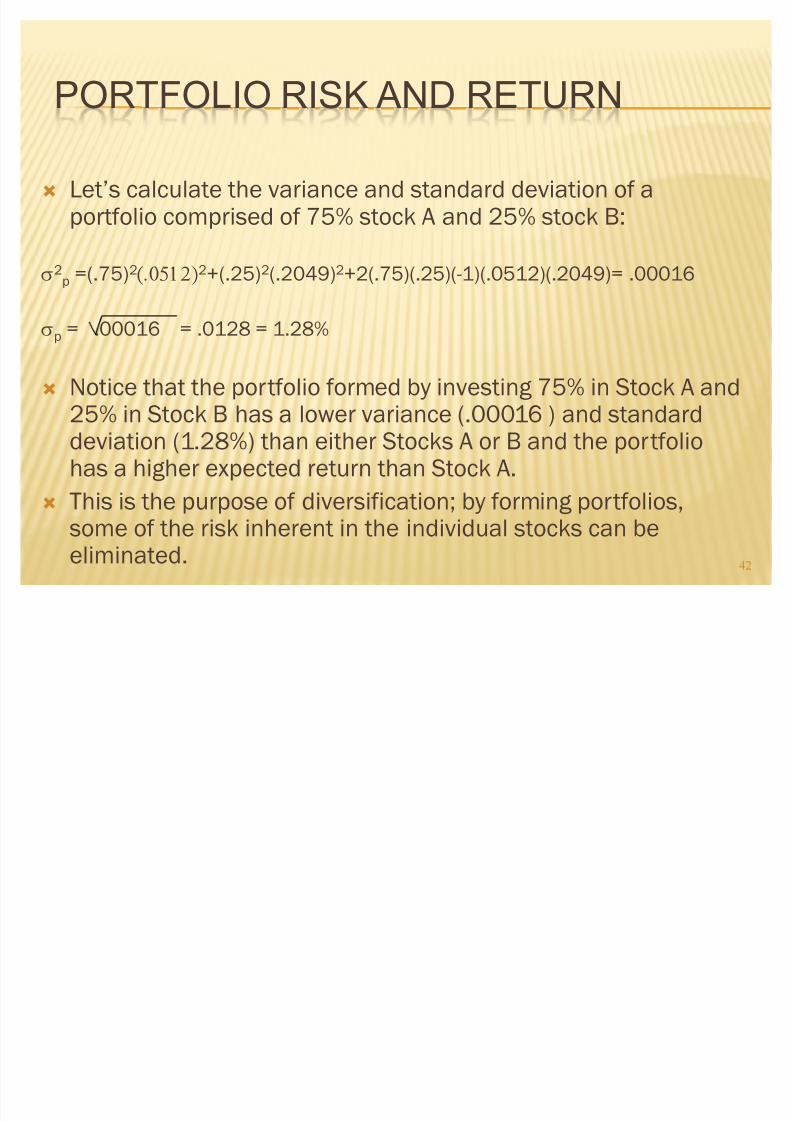
´ Let·s calculate the variance and standard deviation of aportfolio comprised of 75% stock A and 25% stock B:
W2
p =(.75)2
2
+(.25)2
(.2049)2
+2(.75)(.25)(-1)(.0512)(.2049)= .00016
Wp = .00016 = .0128 = 1.28%
´ Notice that the portfolio formed by investing 75% in Stock A and
25% in Stock B has a lower variance (.00016 ) and standarddeviation (1.28%) than either Stocks A or B and the portfoliohas a higher expected return than Stock A.
´ This is the purpose of diversification; by forming portfolios,some of the risk inherent in the individual stocks can be
eliminated. 42
8/8/2019 Measuring Rate and Return
http://slidepdf.com/reader/full/measuring-rate-and-return 43/45
MEASURING RELATIVE RISK
´ if some risk is diversifiable,
« then W is not the best measure of risk
« is an absolute measure of risk
´ need a measure just for the systematic
component
8/8/2019 Measuring Rate and Return
http://slidepdf.com/reader/full/measuring-rate-and-return 44/45
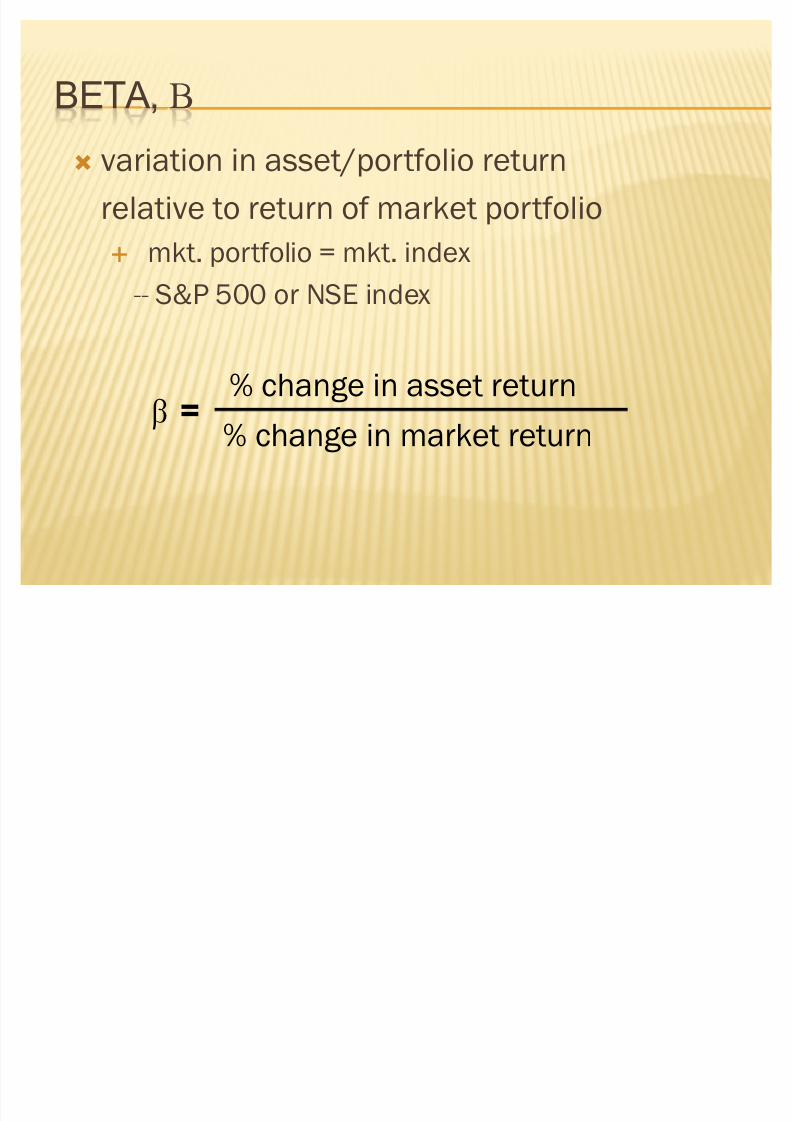
BETA, &
´ variation in asset/portfolio return
relative to return of market portfolio
« mkt. portfolio = mkt. index
-- S&P 500 or NSE index
F=
% change in asset return
% change in market return
8/8/2019 Measuring Rate and Return
http://slidepdf.com/reader/full/measuring-rate-and-return 45/45
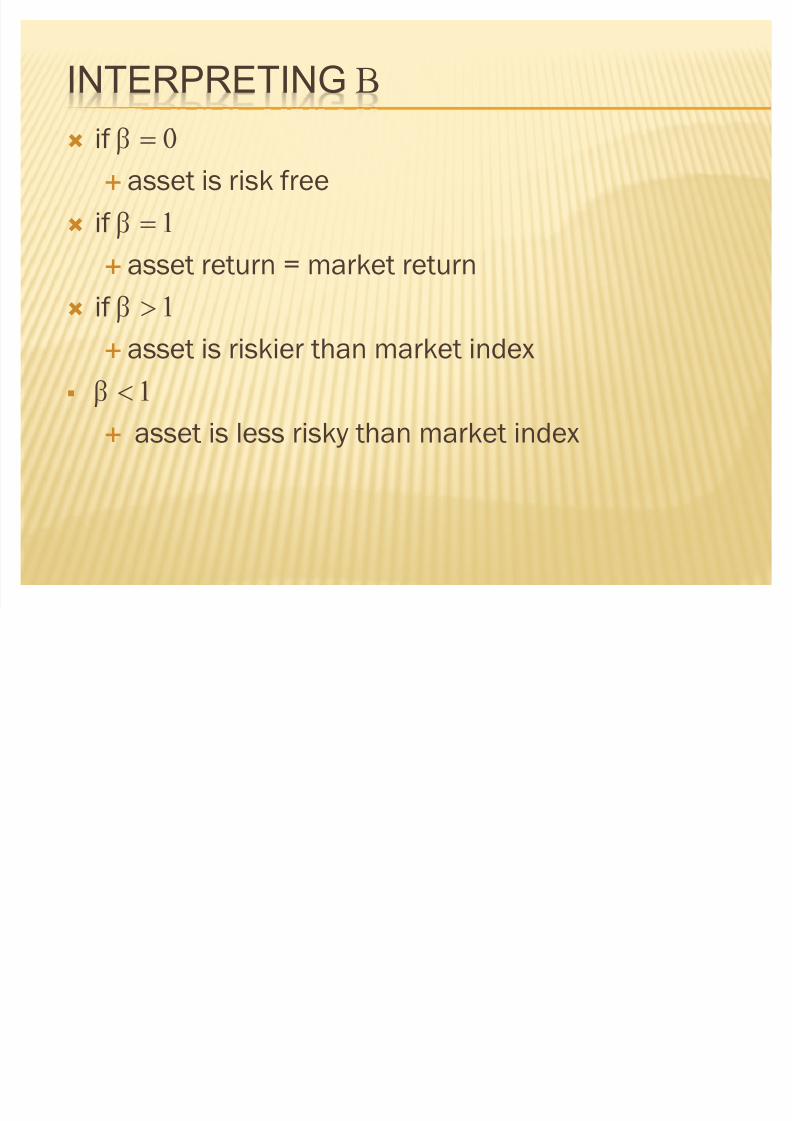
INTERPRETING &
´ if F!« asset is risk free
´ if F!
« asset return = market return
´ if F"
« asset is riskier than market index
F
« asset is less risky than market index