Embed Size (px)
Citation preview
MeasuringStudentAccessandSuccessJulieHartley,USHEDavidMa,USHE
SessionOverview
• Regents’accessandsuccessstrategicplan
• USHE’saccessandsuccessmetrics
• Nextsteps
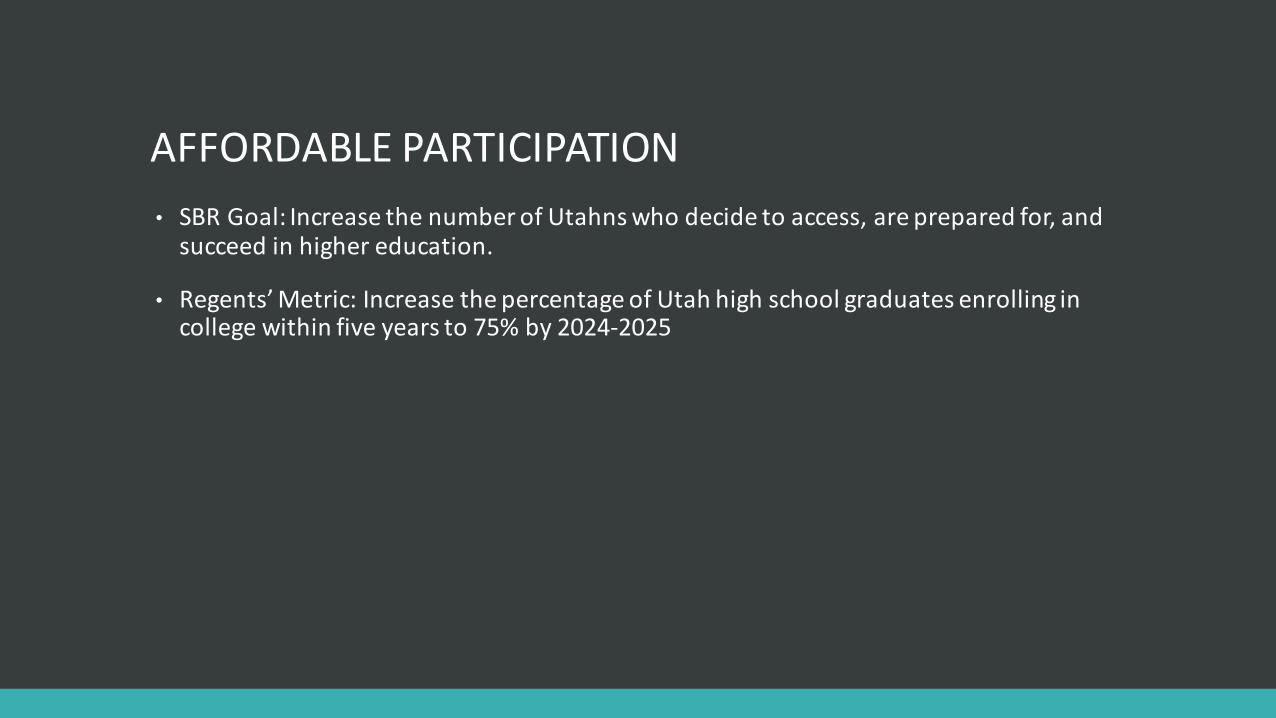
AFFORDABLEPARTICIPATION• SBRGoal:IncreasethenumberofUtahnswhodecidetoaccess,arepreparedfor,andsucceedinhighereducation.
• Regents’Metric:IncreasethepercentageofUtahhighschoolgraduatesenrollingincollegewithinfiveyearsto75%by2024-2025
TimelyCompletion
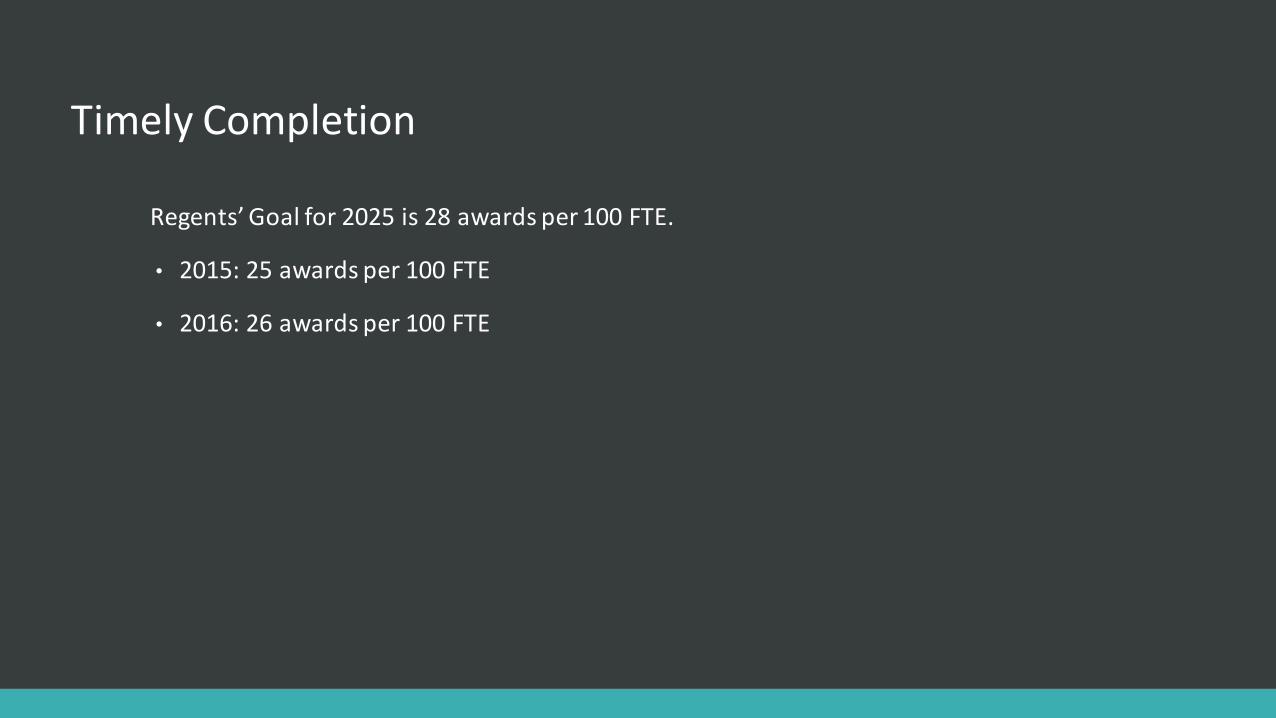
Regents’Goalfor2025is28awardsper100FTE.
• 2015:25awardsper100FTE
• 2016:26awardsper100FTE
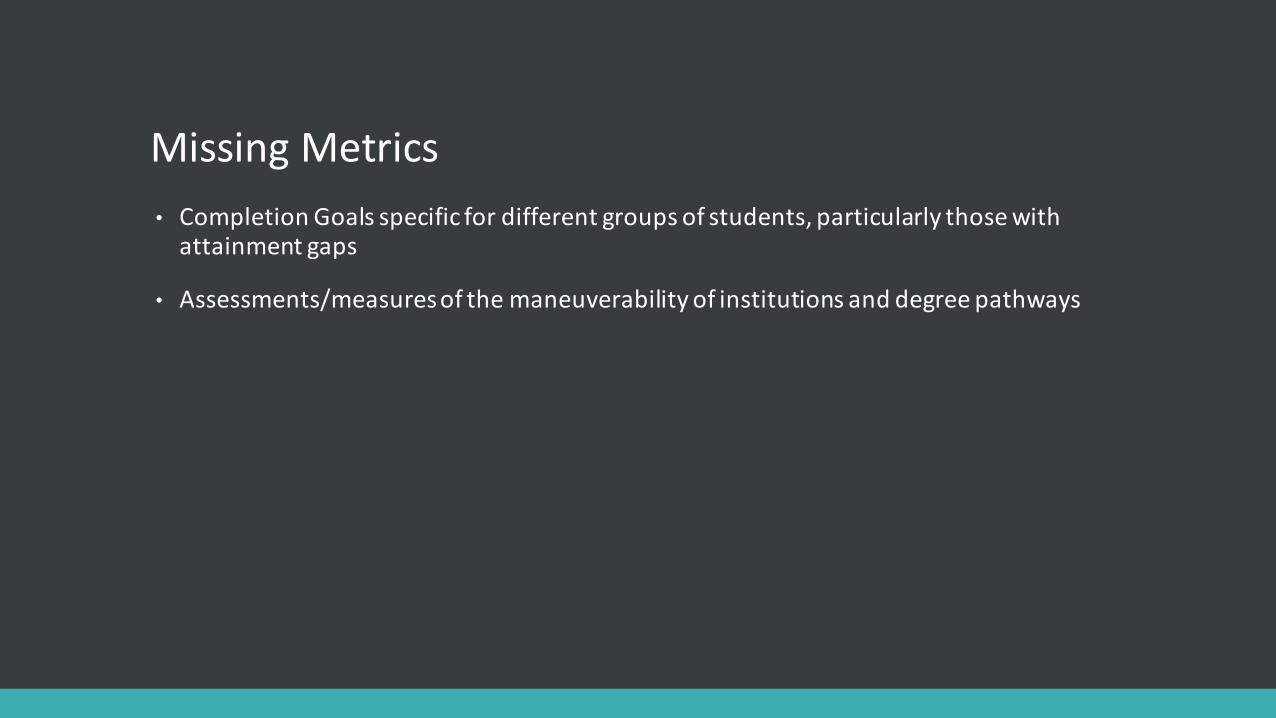
MissingMetrics• CompletionGoalsspecificfordifferentgroupsofstudents,particularlythosewithattainmentgaps
• Assessments/measuresofthemaneuverabilityofinstitutionsanddegreepathways

IncreasetheeducationalattainmentofUtahnstoenhancetheiroverallqualityoflife,
andtomeetUtah’scurrentandfutureworkforceneeds.
AffordableAccess TimelyCompletion Research&Workforce Capacity&Growth
RegentWorkGroups
UtahCollegeAcceptanceLetter
StudentAidandTuitionPolicy
StepUpSchools
Highdemand,undersuppliedoccupations
StatewideData/Tech.Strategy
StrategicCommunications Plan
ImproveInformationtoStudents onWorkforce
Options
MentalHealthRecommendations
StudentTransfer
AffordableParticipation
StrategicPlanGoal
• 75%ofhighschoolgraduatesenrolledincollegewithinfiveofhighschoolgraduation
Cohorts2007-2012:
• 5th year:69%• 10th year:71%
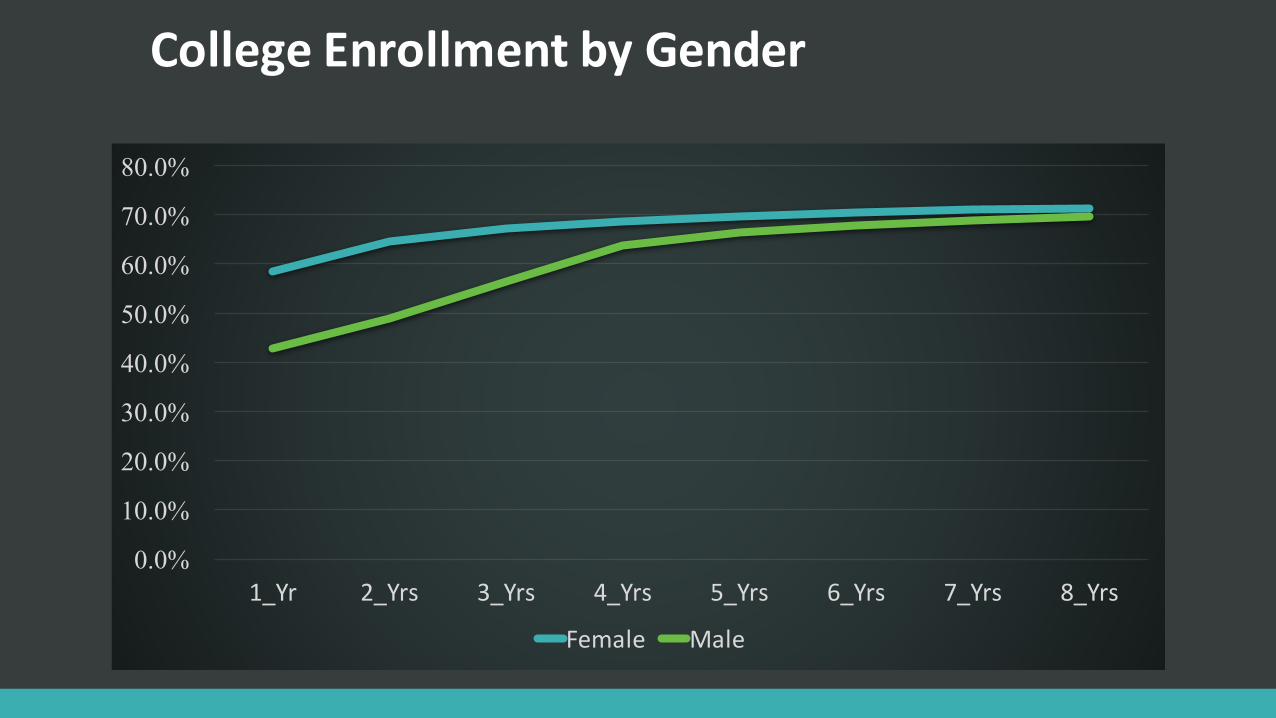
CollegeEnrollmentbyGender
0.0%
10.0%
20.0%
30.0%
40.0%
50.0%
60.0%
70.0%
80.0%
1_Yr 2_Yrs 3_Yrs 4_Yrs 5_Yrs 6_Yrs 7_Yrs 8_Yrs
Female Male
CollegeReadiness“ImplementspecificK-16partnershipinitiativesthatencouragecollegereadinesswiththegoalthateveryUtahhighschoolgraduateispreparedforcollege.”
USHERecommendedHighSchoolCurriculum
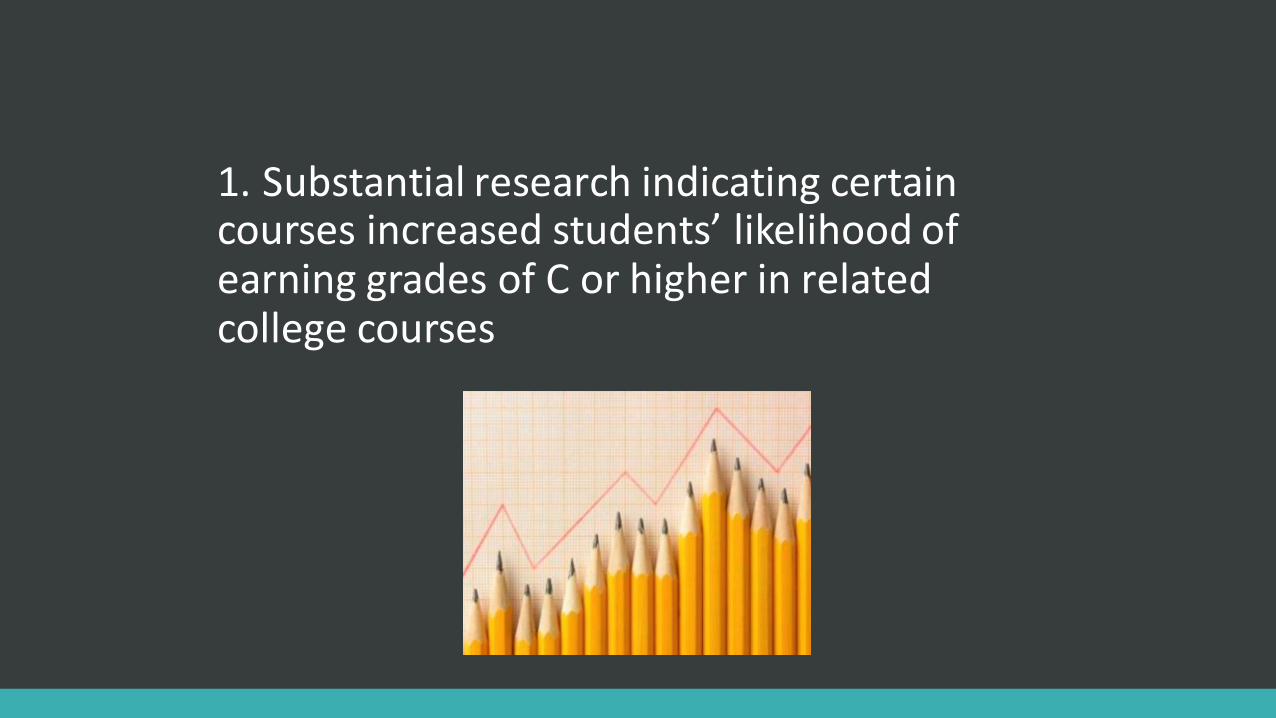
1.Substantialresearchindicatingcertaincoursesincreasedstudents’likelihoodofearninggradesofCorhigherinrelatedcollegecourses
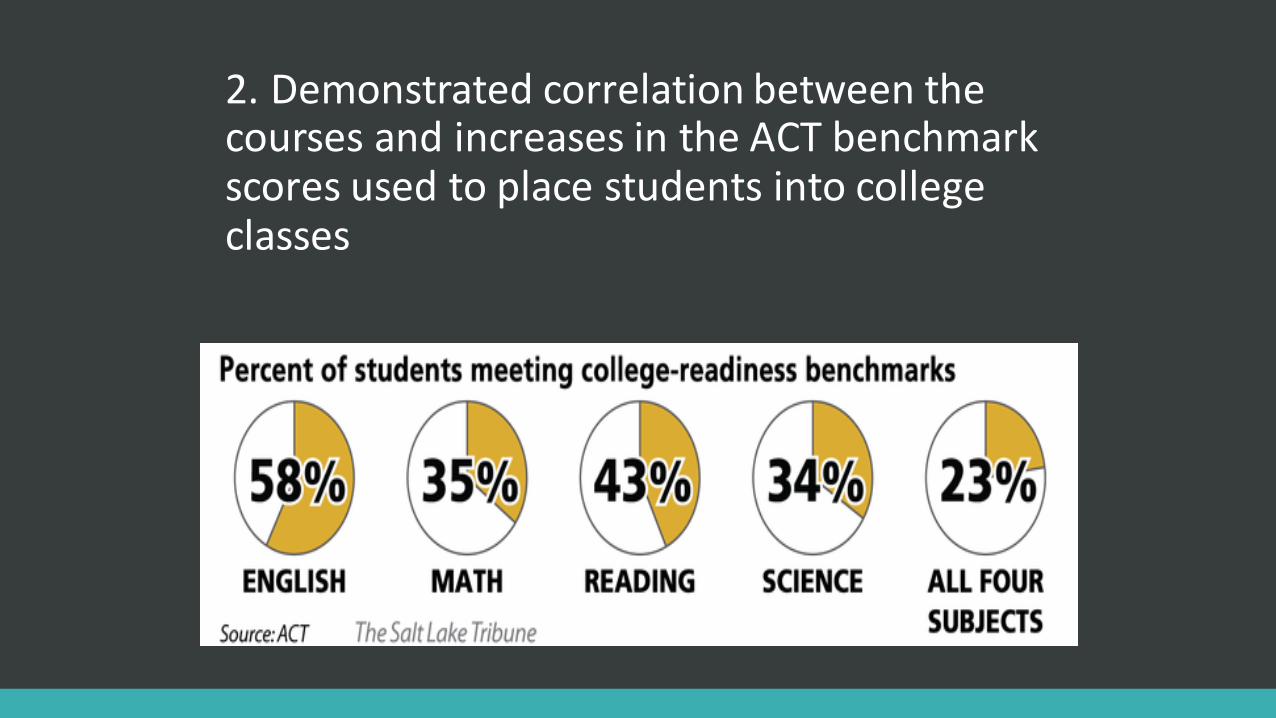
2.DemonstratedcorrelationbetweenthecoursesandincreasesintheACTbenchmarkscoresusedtoplacestudentsintocollegeclasses
3.Alignmentwiththemoredemandingadmissionsrequirementsofhighlyselectiveinstitutions.
(UofU,USU,Westminster,BYU,Harvard,Yale,Columbia,Berkeley,Princeton,Stanford)
Math
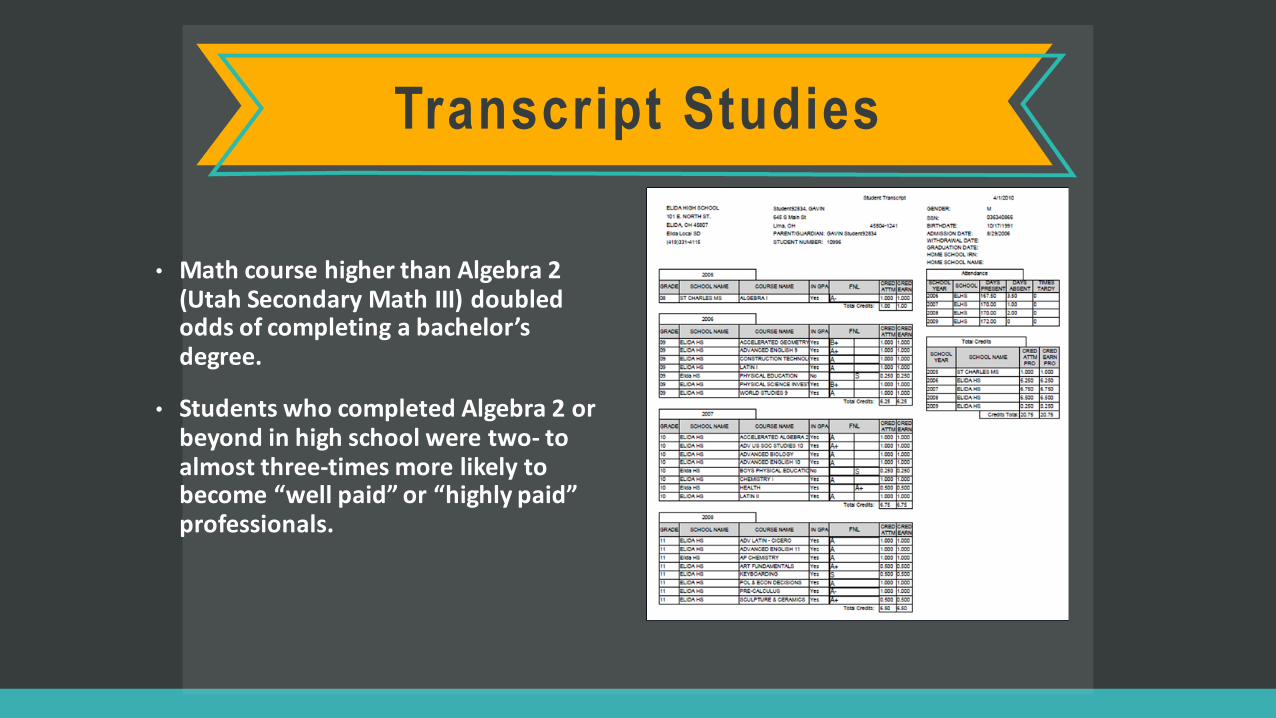
Transcript Studies
• MathcoursehigherthanAlgebra2(UtahSecondaryMathIII)doubledoddsofcompletingabachelor’sdegree.
• StudentswhocompletedAlgebra2orbeyondinhighschoolweretwo- toalmostthree-timesmorelikelytobecome“wellpaid”or“highlypaid”professionals.
ACT• Utahstudentswho
• CompletedMathIII:16%metACTmathbenchmark
• Completed4thcreditofMath:62%hitbenchmark
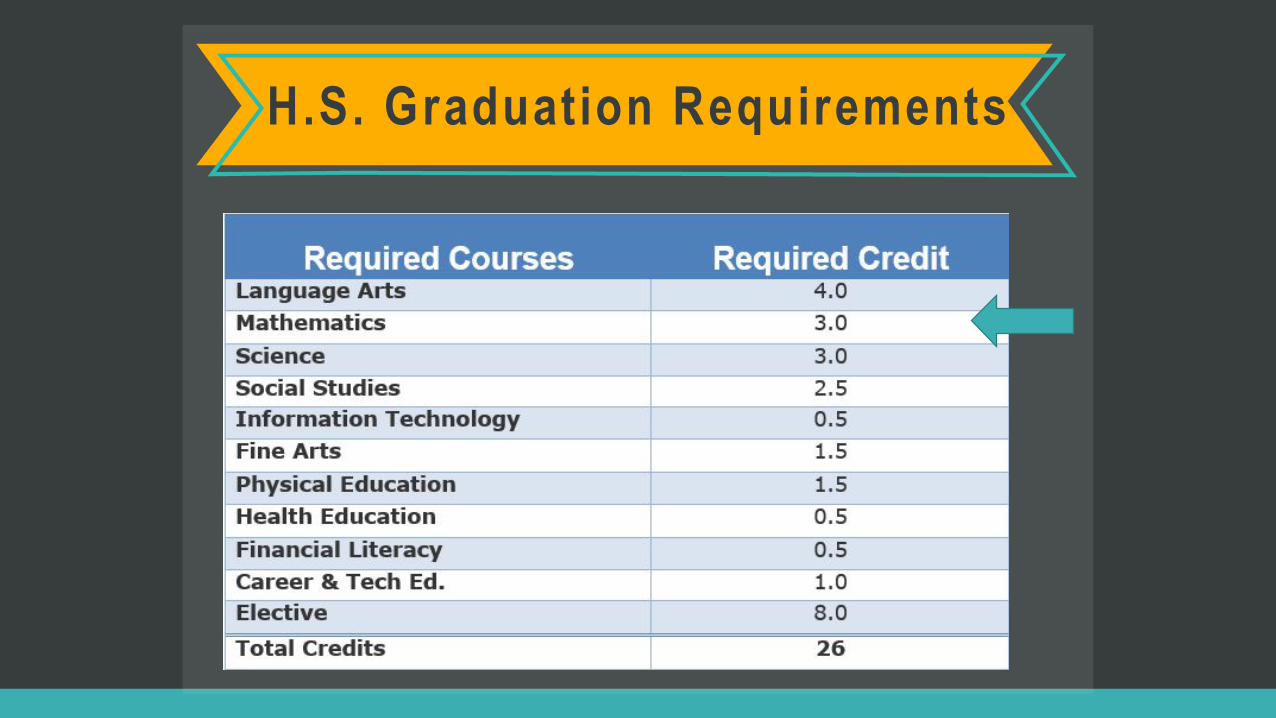
H.S. Graduation Requirements
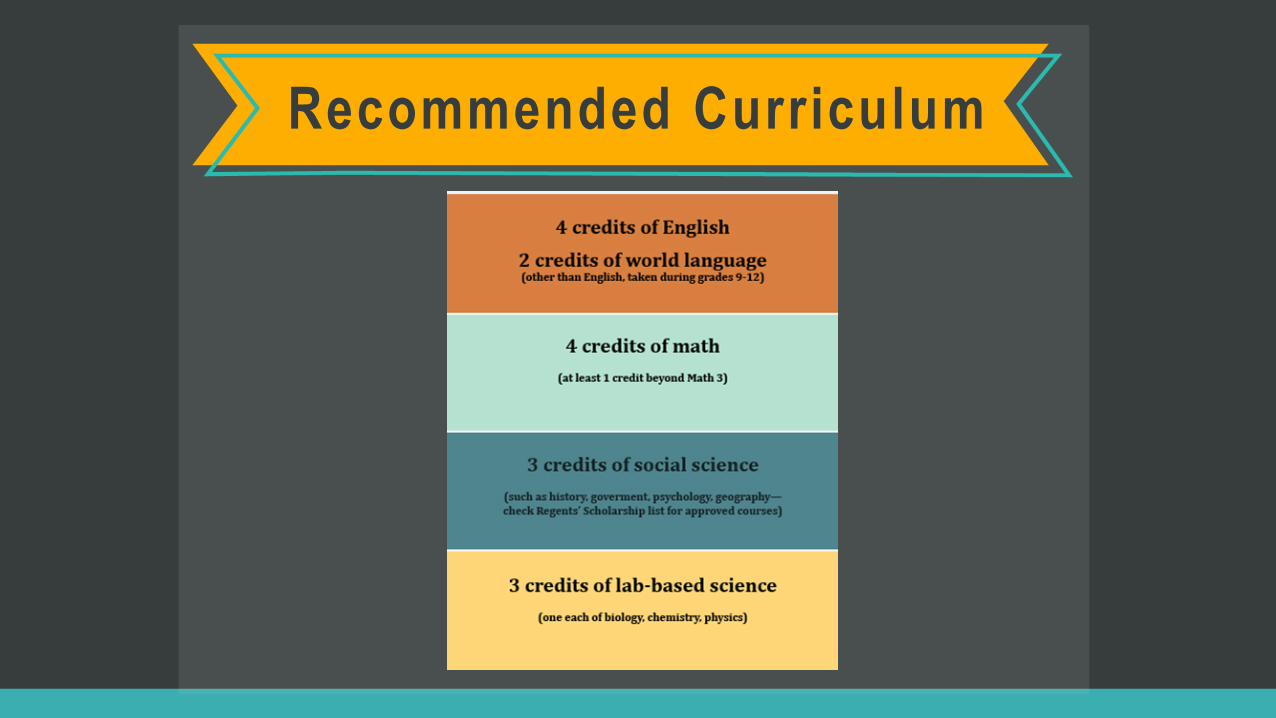
Recommended Curriculum

Find Out More:HigherEdUtah.org
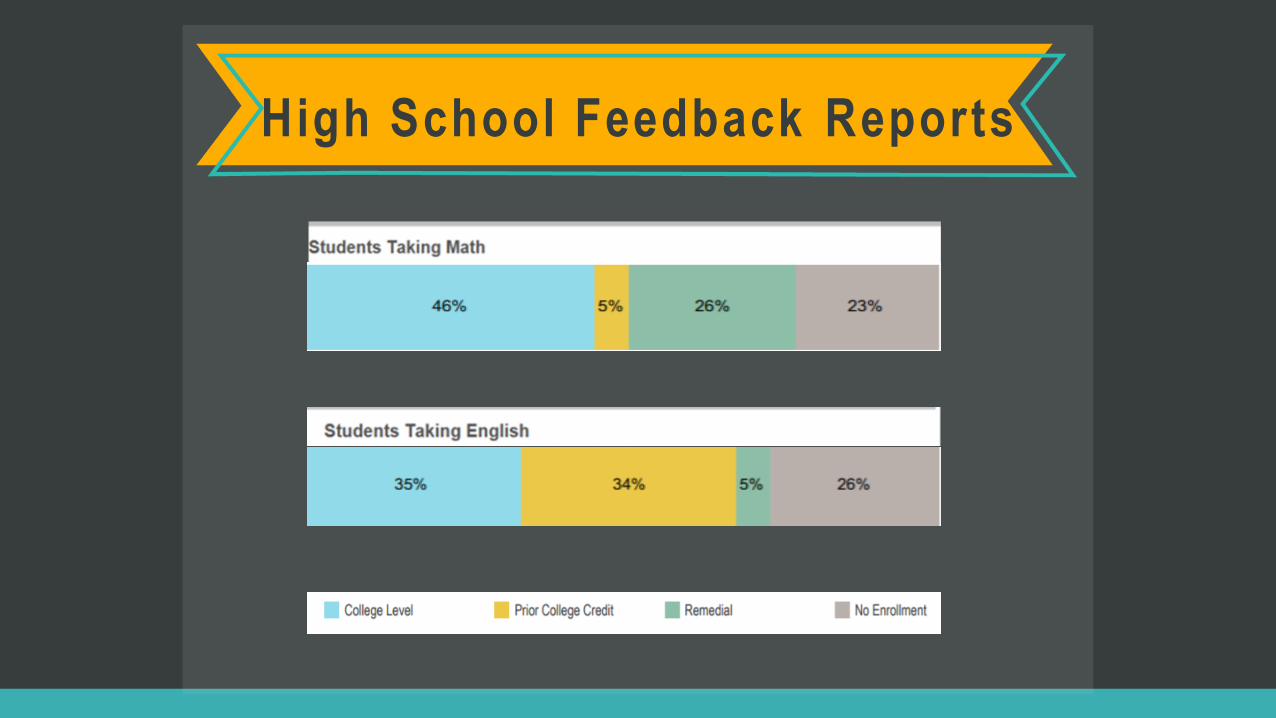
High School Feedback Reports

Access&Completion
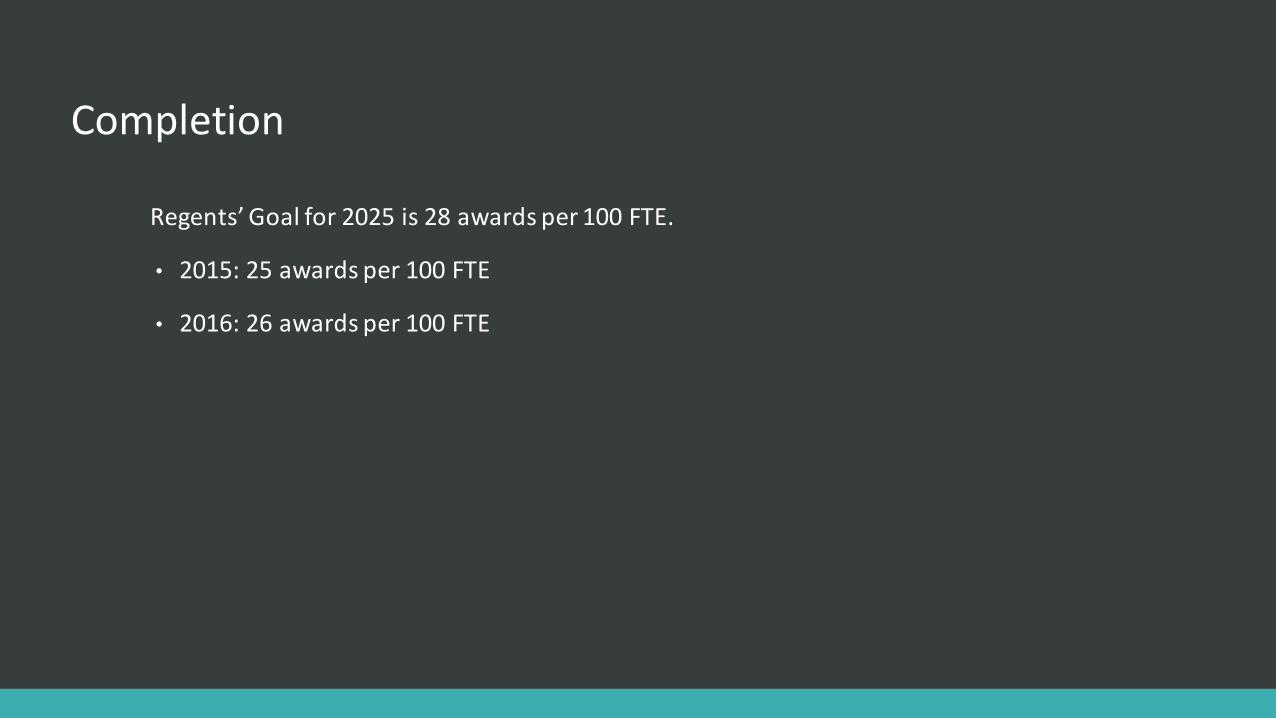
Completion
Regents’Goalfor2025is28awardsper100FTE.
• 2015:25awardsper100FTE
• 2016:26awardsper100FTE
Underrepresentedpopulations“Increasetheparticipationoffirst-generation,economicallydisadvantaged,andreturningadultswithtargetedoutreacheffortsandpartnershipswithorganizationsfocusedonimprovingcollegeaccessforthesecommunities.”
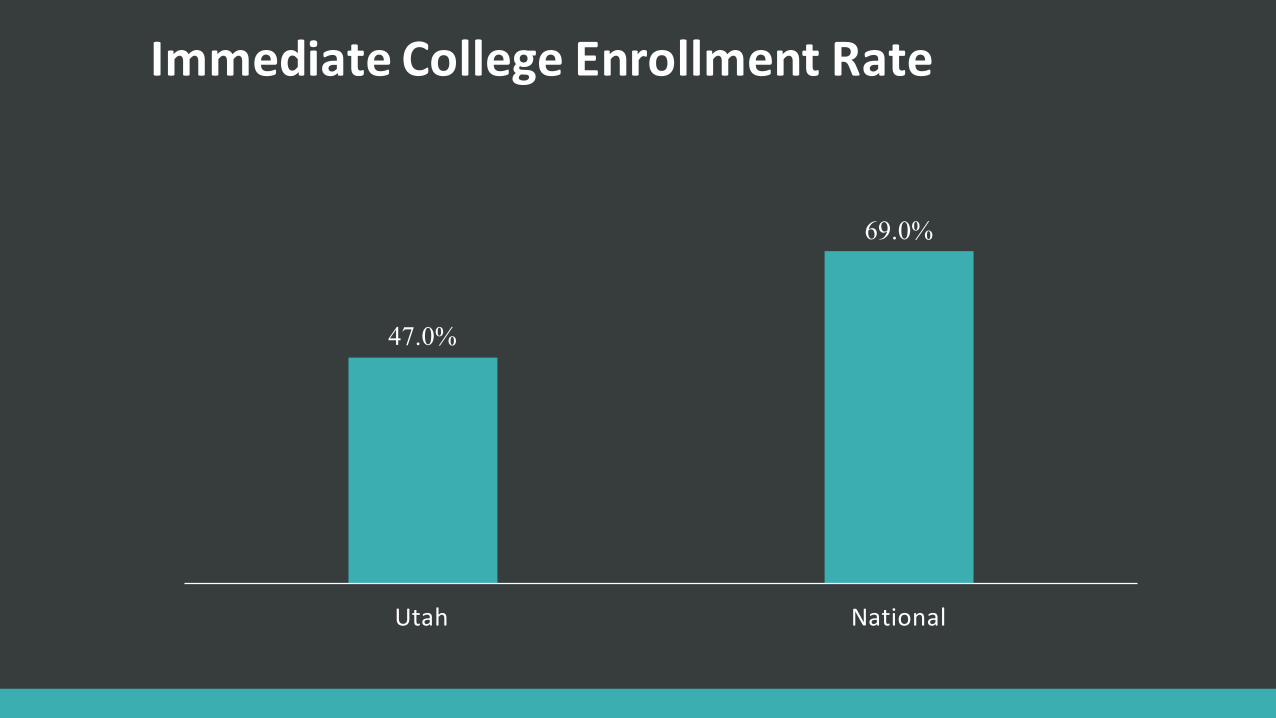
ImmediateCollegeEnrollmentRate
47.0%
69.0%
Utah National
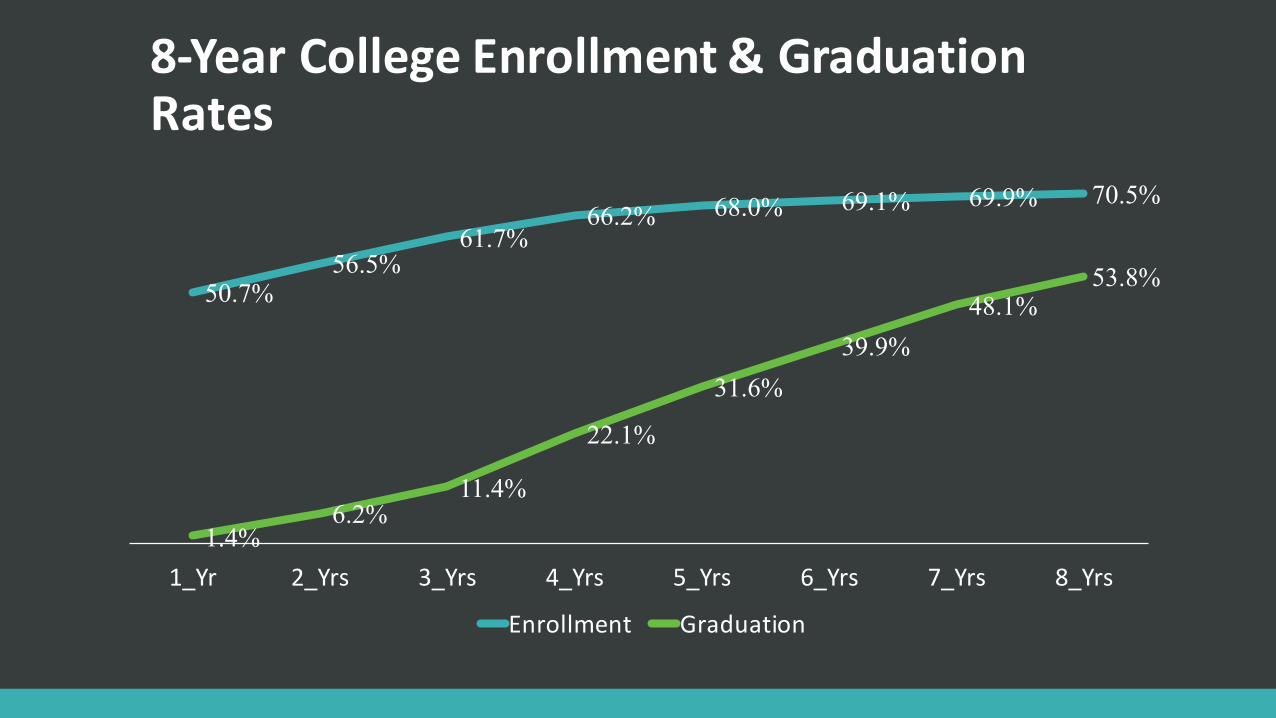
8-YearCollegeEnrollment&GraduationRates
50.7%56.5%
61.7%66.2% 68.0% 69.1% 69.9% 70.5%
1.4%6.2%
11.4%
22.1%
31.6%39.9%
48.1%53.8%
1_Yr 2_Yrs 3_Yrs 4_Yrs 5_Yrs 6_Yrs 7_Yrs 8_Yrs
Enrollment Graduation
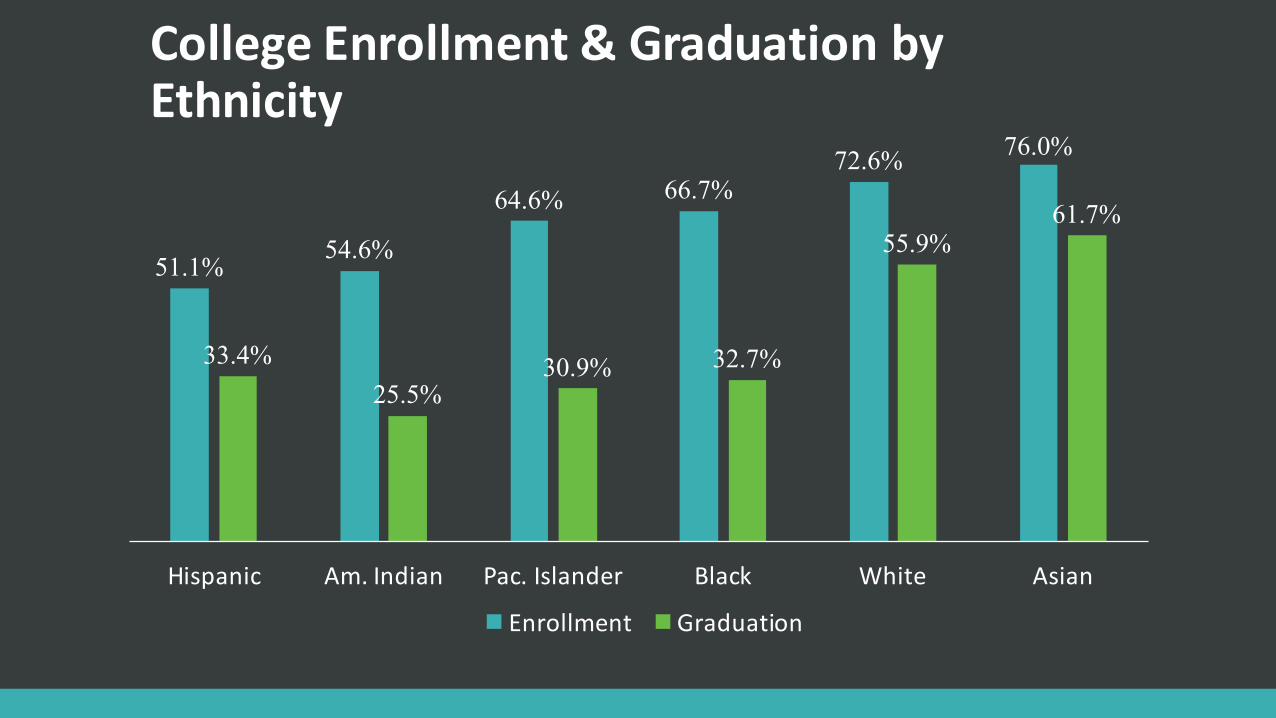
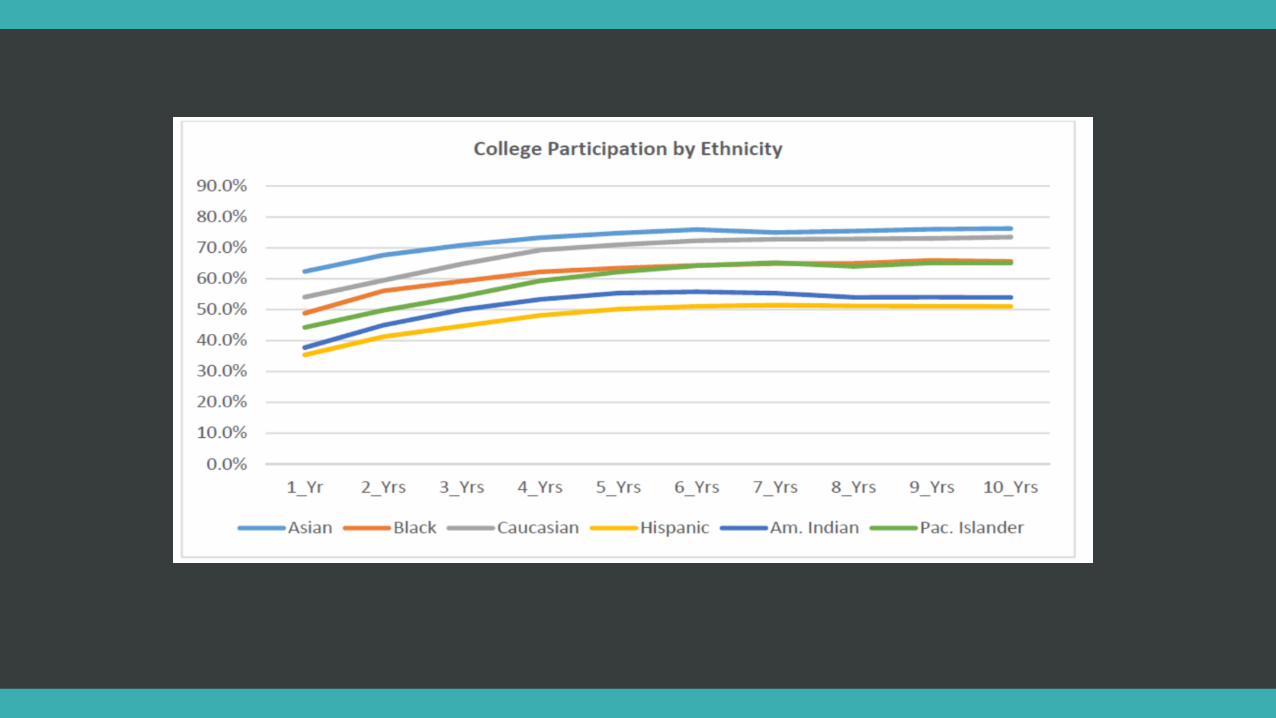
CollegeEnrollment&GraduationbyEthnicity
51.1%54.6%
64.6% 66.7%72.6% 76.0%
33.4%25.5%
30.9% 32.7%
55.9%61.7%
Hispanic Am.Indian Pac.Islander Black White Asian
Enrollment Graduation
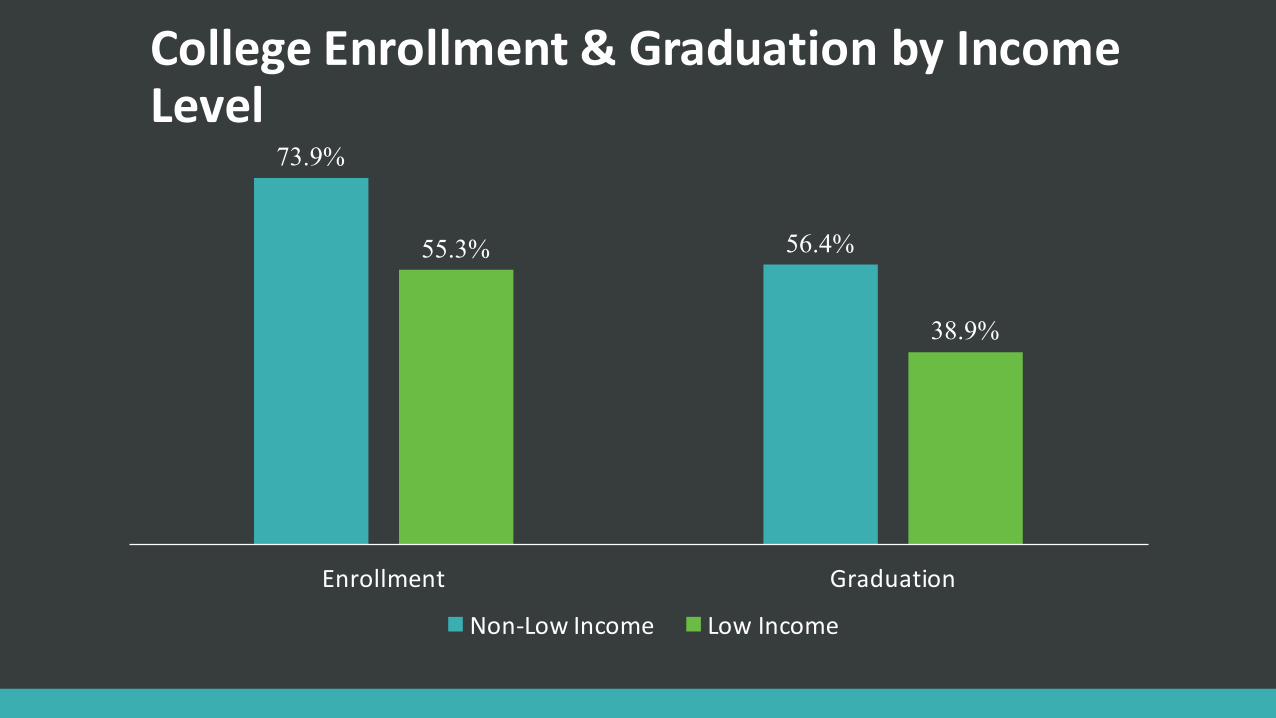
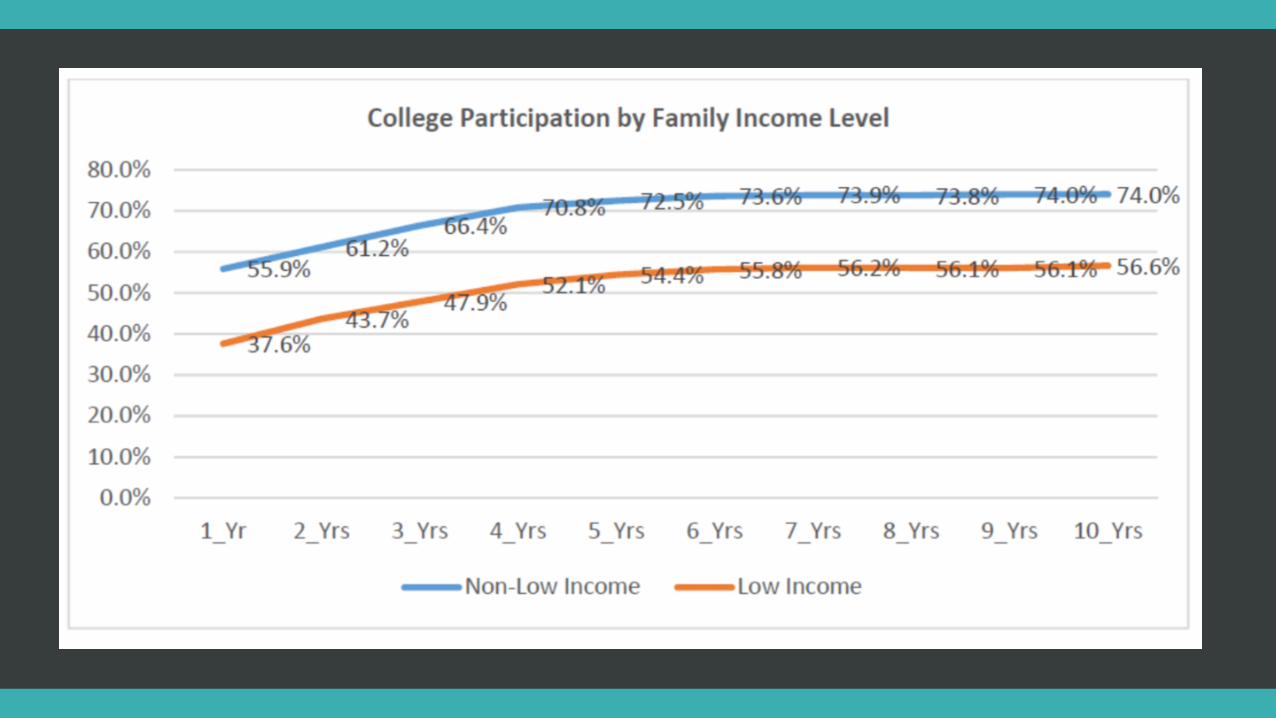
CollegeEnrollment&GraduationbyIncomeLevel
73.9%
56.4%55.3%
38.9%
Enrollment Graduation
Non-LowIncome LowIncome
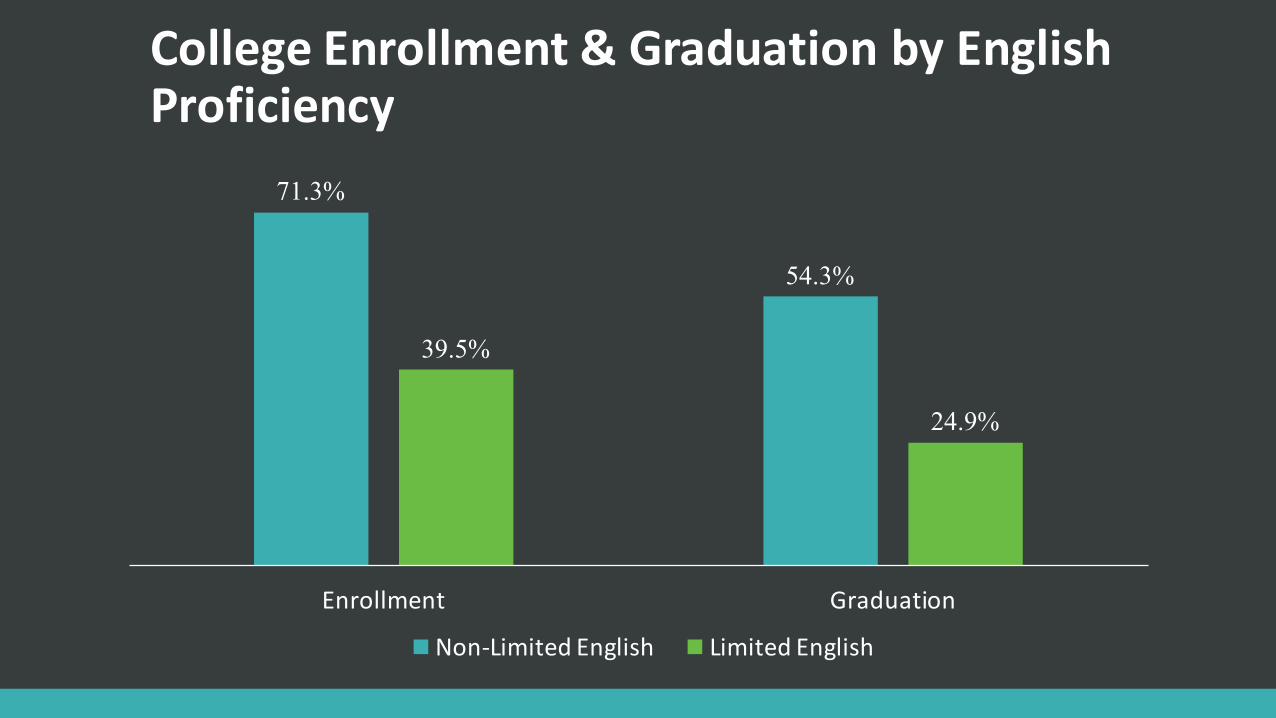
CollegeEnrollment&GraduationbyEnglishProficiency
71.3%
54.3%
39.5%
24.9%
Enrollment Graduation
Non-LimitedEnglish LimitedEnglish
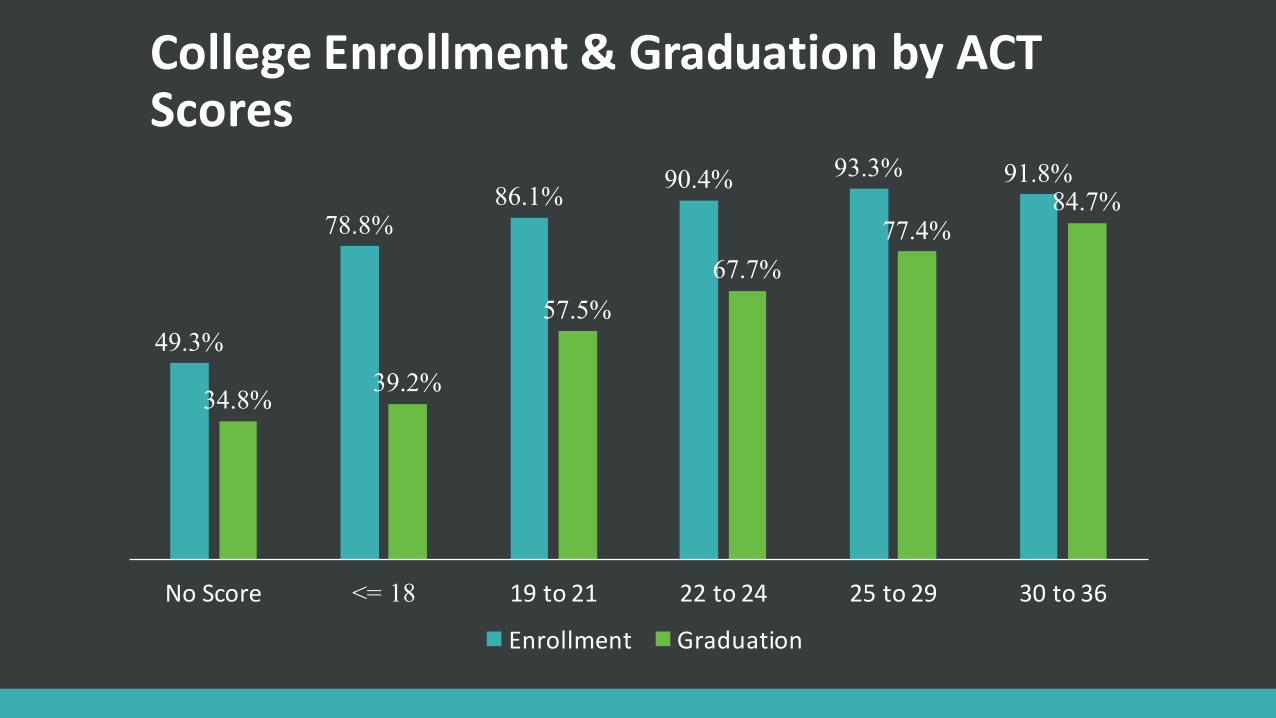
CollegeEnrollment&GraduationbyACTScores
49.3%
78.8%86.1% 90.4% 93.3% 91.8%
34.8% 39.2%
57.5%67.7%
77.4%84.7%
NoScore <= 18 19to21 22to24 25to29 30to36
Enrollment Graduation
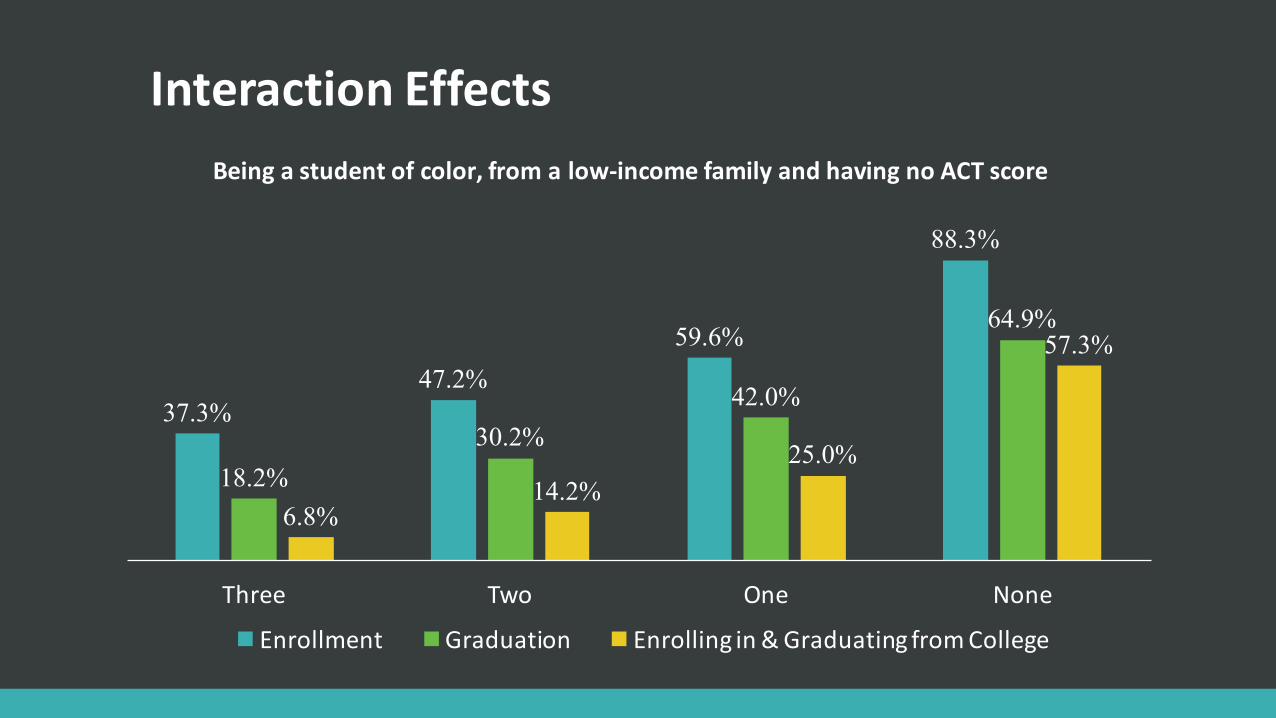
InteractionEffects
37.3%47.2%
59.6%
88.3%
18.2%30.2%
42.0%
64.9%
6.8%14.2%
25.0%
57.3%
Three Two One None
Enrollment Graduation Enrollingin&GraduatingfromCollege
Beingastudentofcolor,fromalow-incomefamilyandhavingnoACTscore
Easeofparticipation
Maneuverability“ImproveeaseofaccessamongK-12studentsthroughon-campusexperiences,concurrentenrollment,andaccessamongallstudentsthroughtransferabilityandstreamlinedtransitionstocollegethroughtheadmissionsandonboardingprocessesatUSHEinstitutions.”
Gatewayvs.GatekeeperCourses
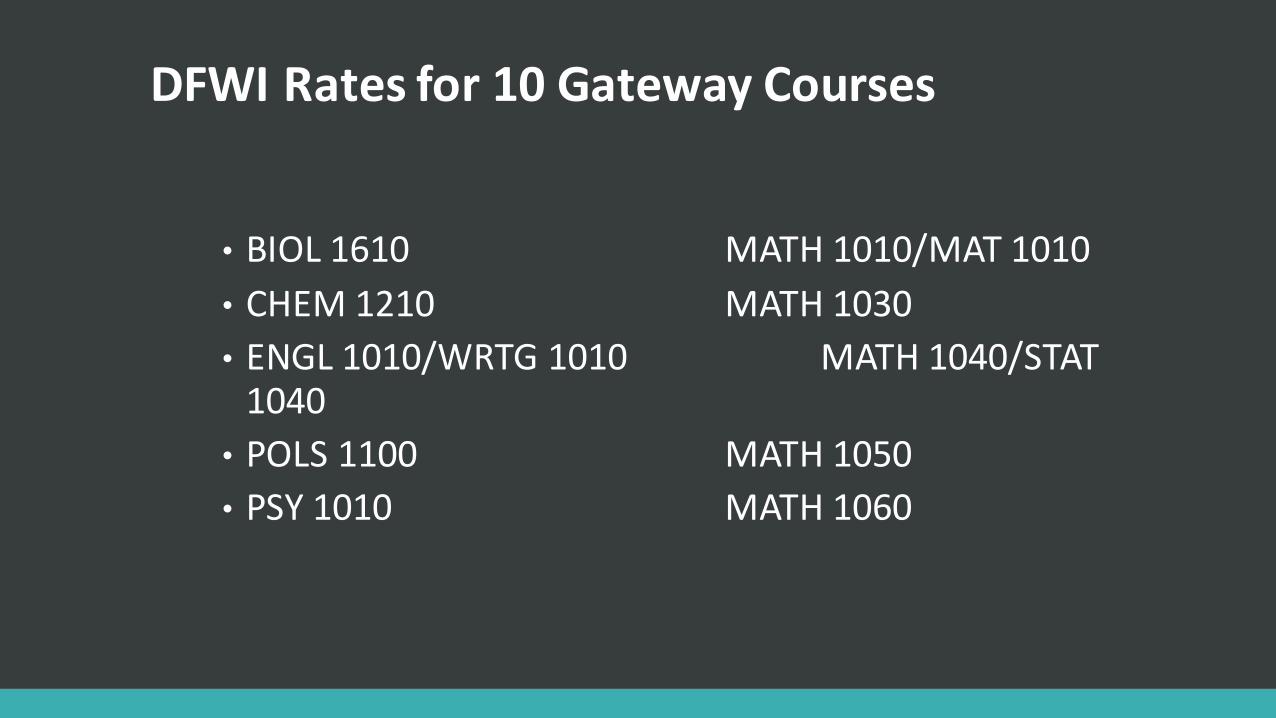
DFWIRatesfor10GatewayCourses
• BIOL1610 MATH1010/MAT1010• CHEM1210 MATH1030• ENGL1010/WRTG1010 MATH1040/STAT1040• POLS1100 MATH1050• PSY1010 MATH1060
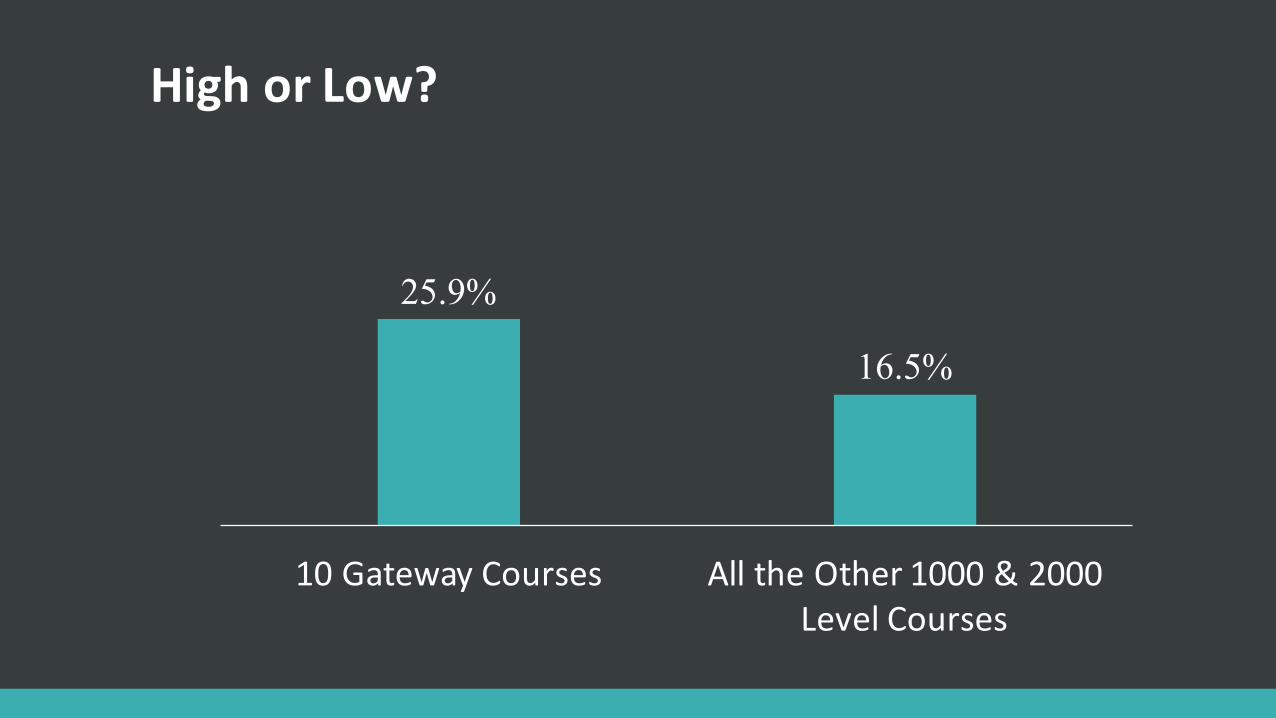
HighorLow?
25.9%
16.5%
10GatewayCourses AlltheOther1000&2000LevelCourses
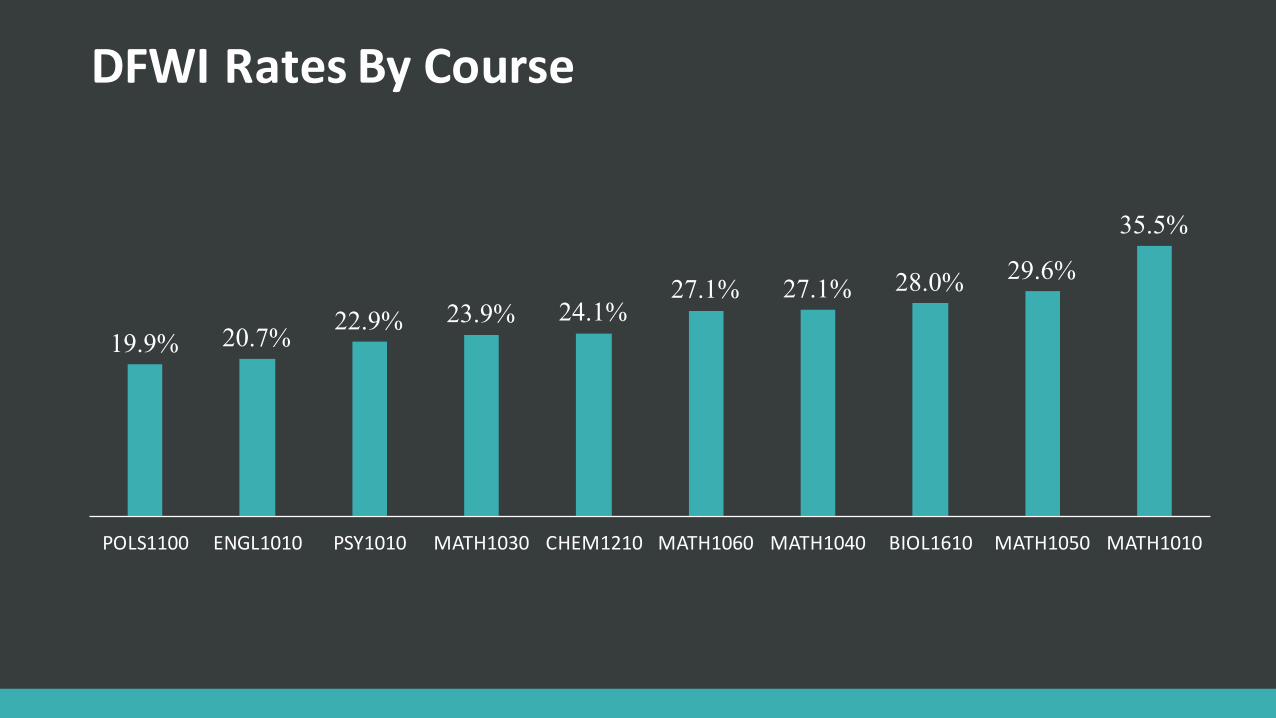
DFWIRatesByCourse
19.9% 20.7% 22.9% 23.9% 24.1%27.1% 27.1% 28.0% 29.6%
35.5%
POLS1100 ENGL1010 PSY1010 MATH1030 CHEM1210 MATH1060 MATH1040 BIOL1610 MATH1050 MATH1010
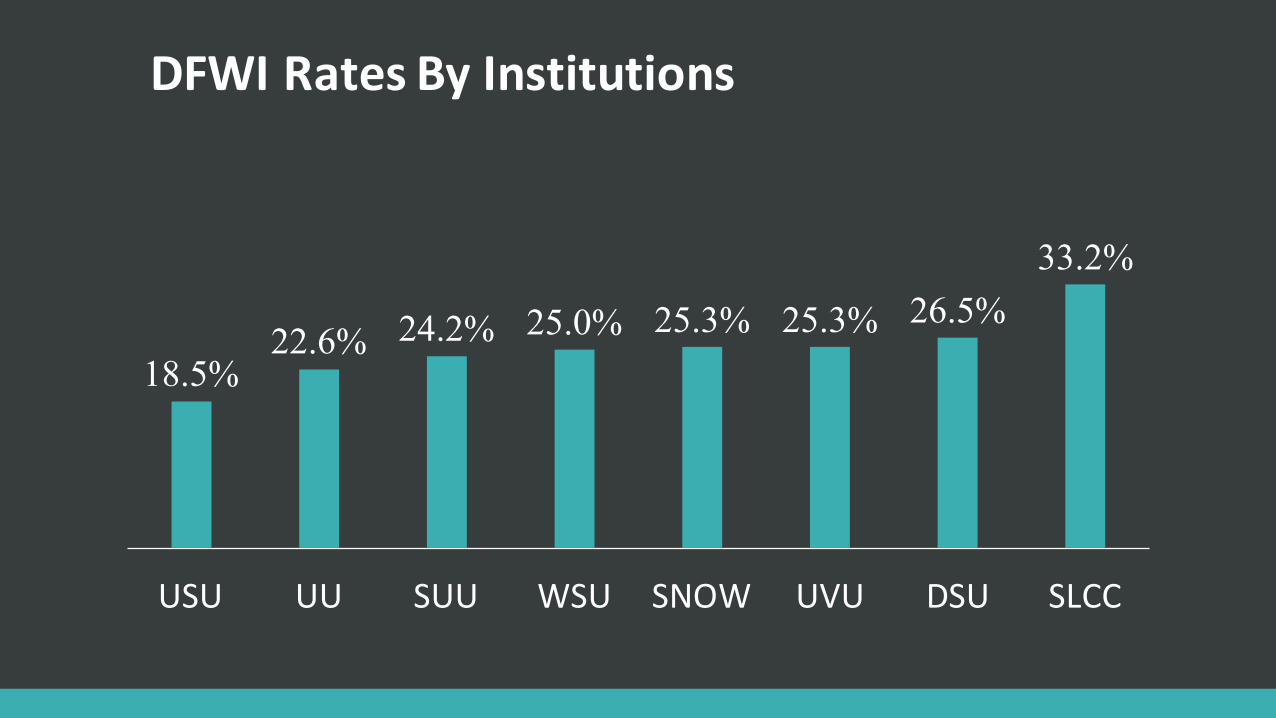
DFWIRatesByInstitutions
18.5%22.6% 24.2% 25.0% 25.3% 25.3% 26.5%
33.2%
USU UU SUU WSU SNOW UVU DSU SLCC
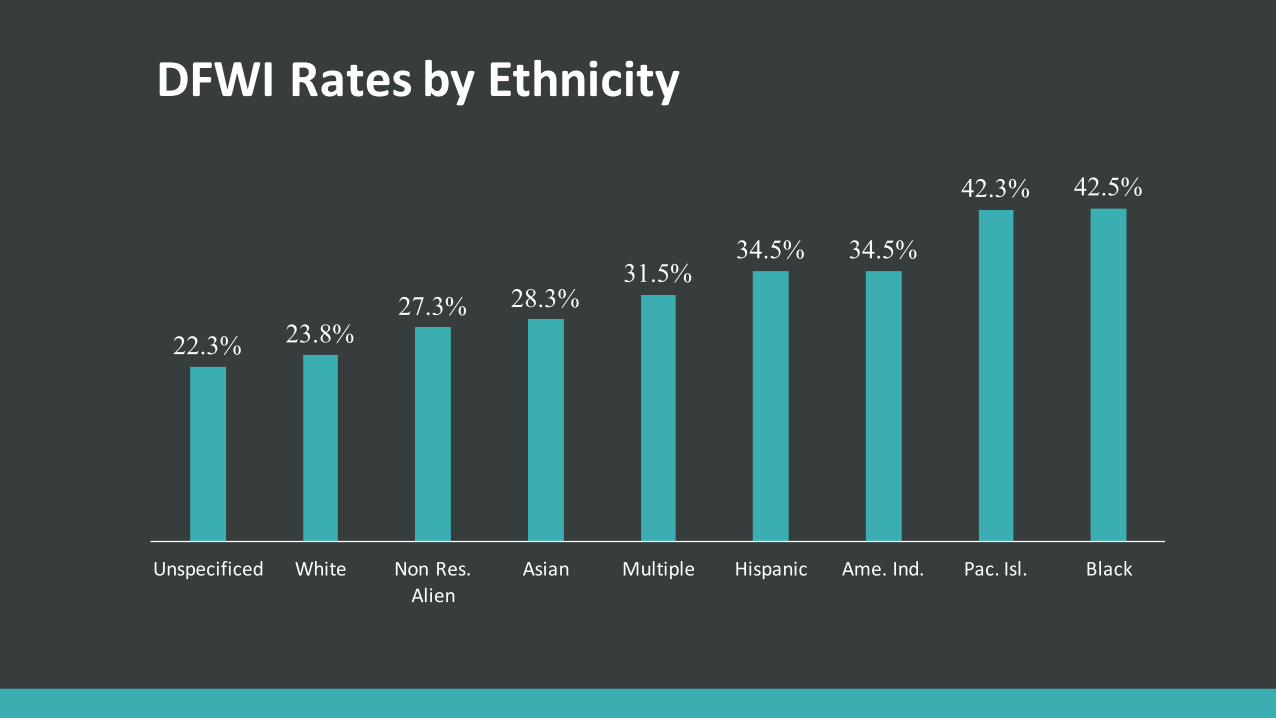
DFWIRatesbyEthnicity
22.3% 23.8%27.3% 28.3%
31.5%34.5% 34.5%
42.3% 42.5%
Unspecificed White NonRes.Alien
Asian Multiple Hispanic Ame.Ind. Pac.Isl. Black
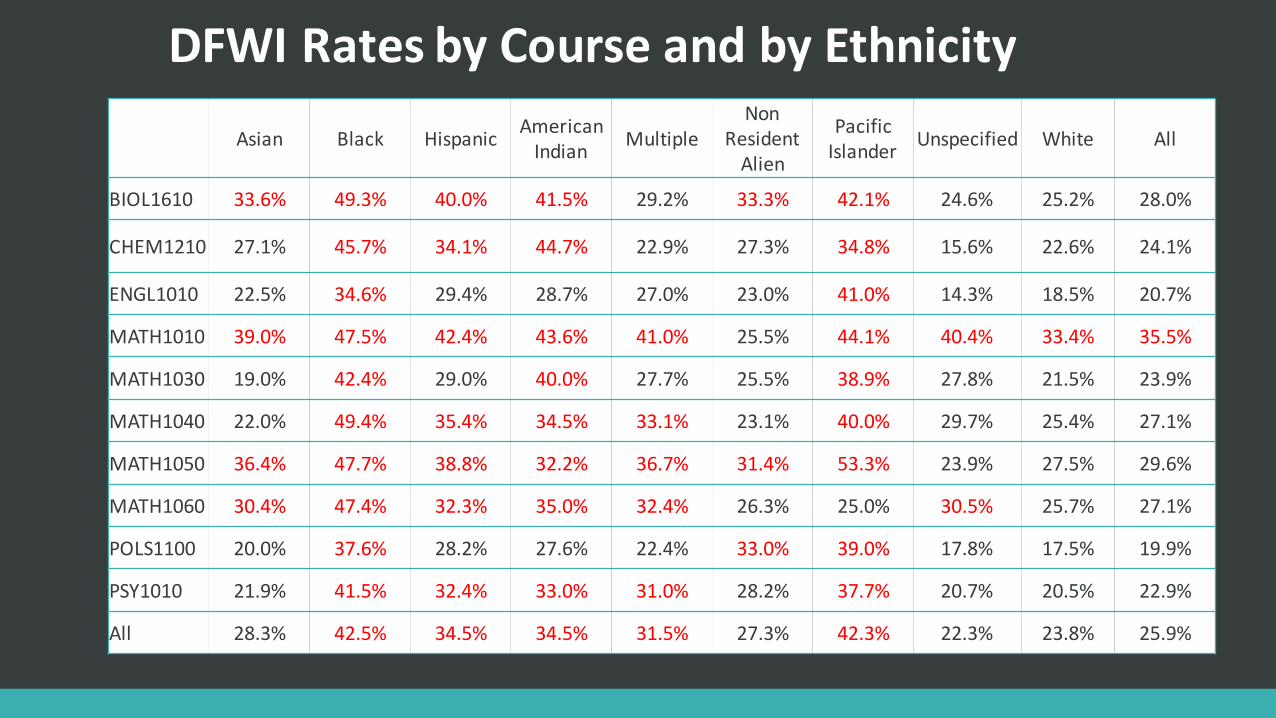
DFWIRatesbyCourseandbyEthnicityAsian Black Hispanic American
Indian MultipleNon
ResidentAlien
PacificIslander Unspecified White All
BIOL1610 33.6% 49.3% 40.0% 41.5% 29.2% 33.3% 42.1% 24.6% 25.2% 28.0%
CHEM1210 27.1% 45.7% 34.1% 44.7% 22.9% 27.3% 34.8% 15.6% 22.6% 24.1%
ENGL1010 22.5% 34.6% 29.4% 28.7% 27.0% 23.0% 41.0% 14.3% 18.5% 20.7%
MATH1010 39.0% 47.5% 42.4% 43.6% 41.0% 25.5% 44.1% 40.4% 33.4% 35.5%
MATH1030 19.0% 42.4% 29.0% 40.0% 27.7% 25.5% 38.9% 27.8% 21.5% 23.9%
MATH1040 22.0% 49.4% 35.4% 34.5% 33.1% 23.1% 40.0% 29.7% 25.4% 27.1%
MATH1050 36.4% 47.7% 38.8% 32.2% 36.7% 31.4% 53.3% 23.9% 27.5% 29.6%
MATH1060 30.4% 47.4% 32.3% 35.0% 32.4% 26.3% 25.0% 30.5% 25.7% 27.1%
POLS1100 20.0% 37.6% 28.2% 27.6% 22.4% 33.0% 39.0% 17.8% 17.5% 19.9%
PSY1010 21.9% 41.5% 32.4% 33.0% 31.0% 28.2% 37.7% 20.7% 20.5% 22.9%
All 28.3% 42.5% 34.5% 34.5% 31.5% 27.3% 42.3% 22.3% 23.8% 25.9%
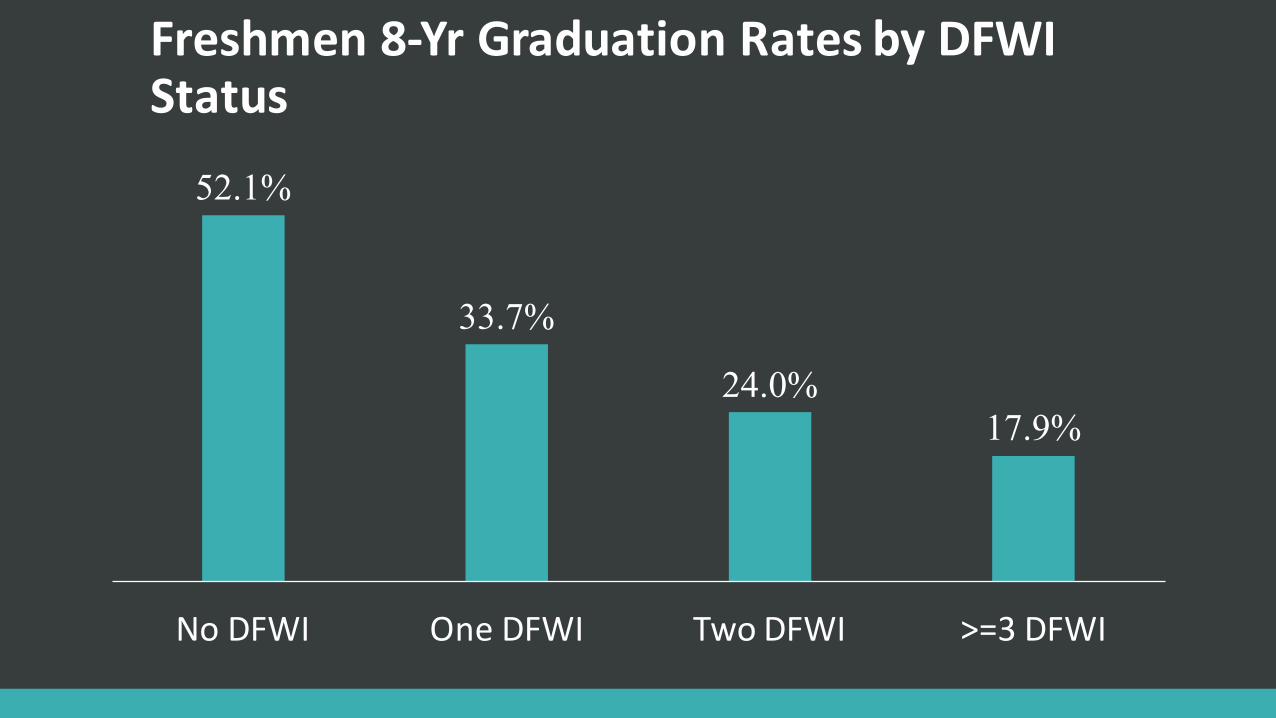
Freshmen8-YrGraduationRatesbyDFWIStatus
52.1%
33.7%
24.0%17.9%
NoDFWI OneDFWI TwoDFWI >=3DFWI
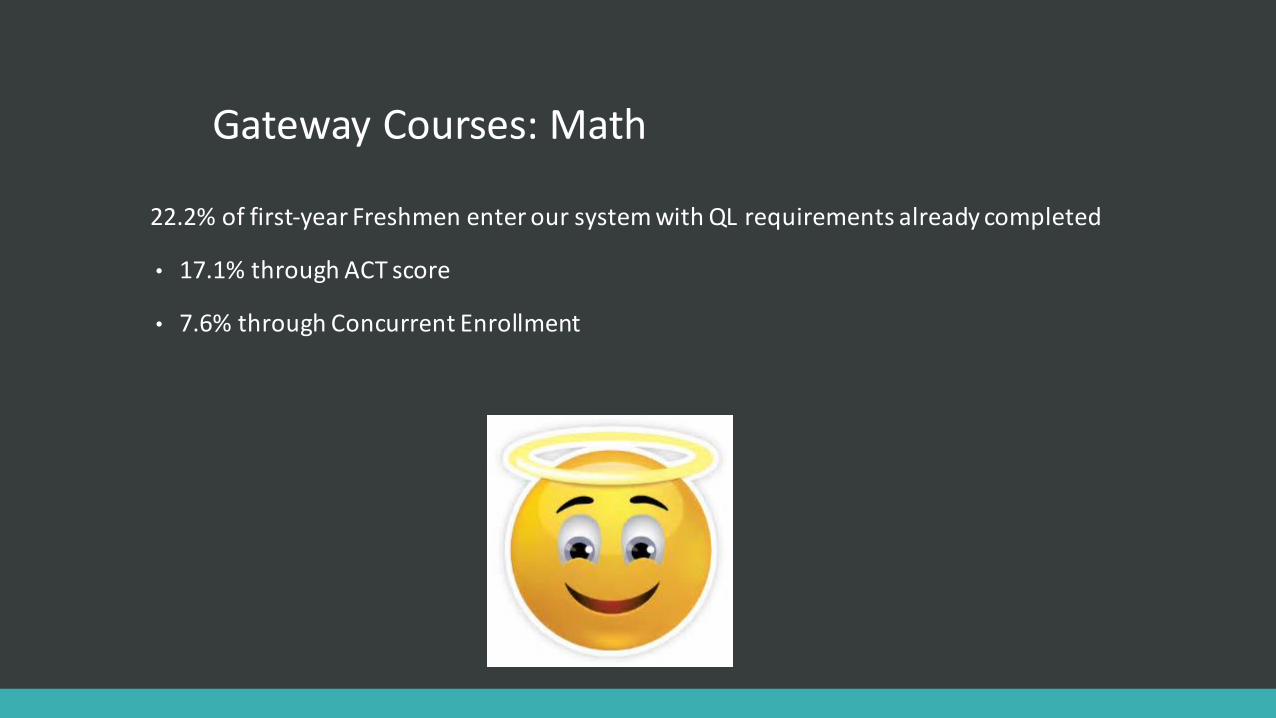
GatewayCourses:Math
22.2%offirst-yearFreshmenenteroursystemwithQLrequirementsalreadycompleted
• 17.1%throughACTscore
• 7.6%throughConcurrentEnrollment
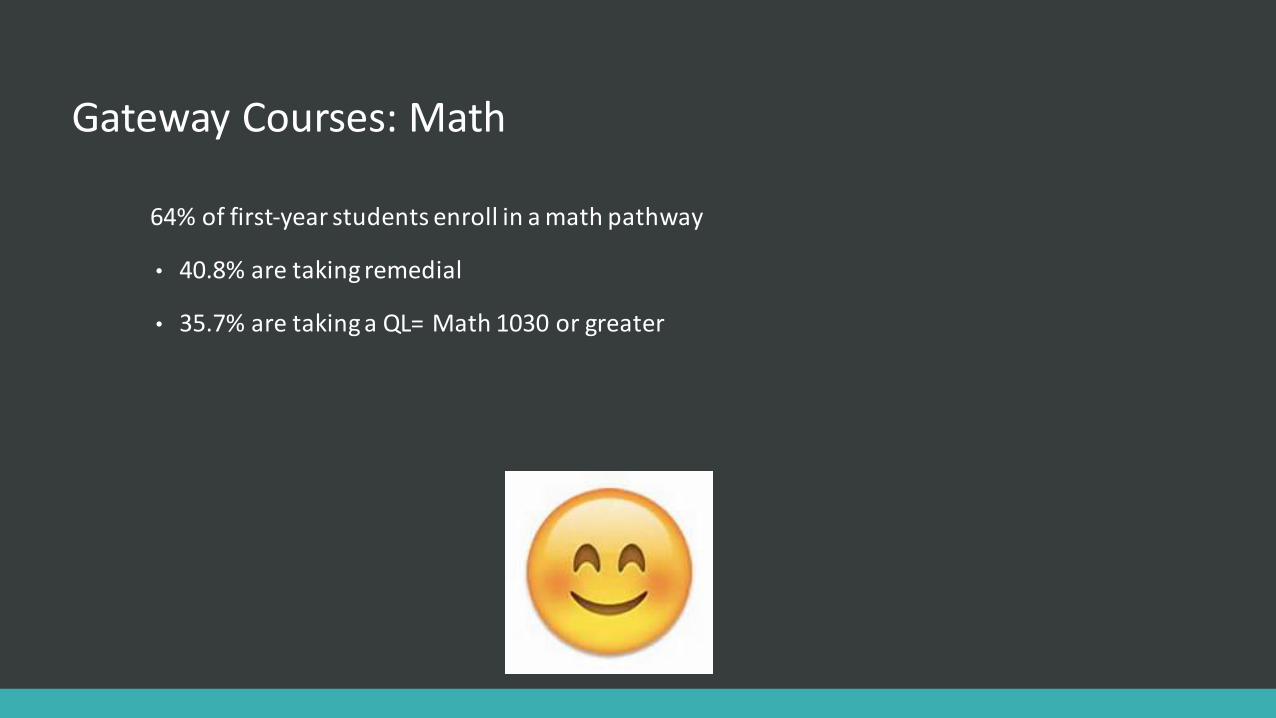
GatewayCourses:Math
64%offirst-yearstudentsenrollinamathpathway
• 40.8%aretakingremedial
• 35.7%aretakingaQL=Math1030orgreater
USHEGatewayCourses:Math
Passrates:
• 54%whotookaremedialcoursefailed
• 49%ofstudentswhotookQuantitativeLiteracycoursesfailed
Problem:WrongMathPathway
DFWIStudy
• StudentswhoareadvisedintoMath1050areatgreaterriskforfailure,especiallyifcalculusisnotneededfortheirmajor.
• Puttingstudentsinthewrongmathclass=settingthemuptodropout.
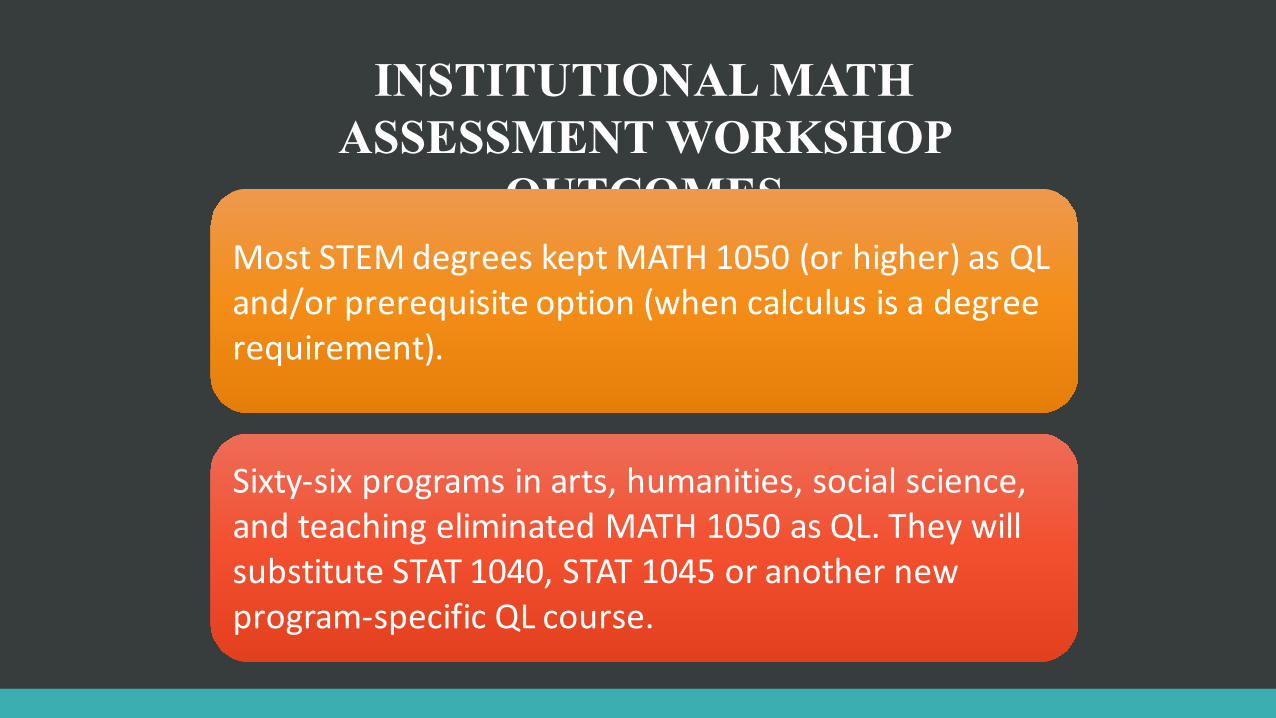
INSTITUTIONAL MATH ASSESSMENT WORKSHOP
OUTCOMESMostSTEMdegreeskeptMATH1050(orhigher)asQLand/orprerequisiteoption(whencalculusisadegreerequirement).
Sixty-sixprogramsinarts,humanities,socialscience,andteachingeliminatedMATH1050asQL.TheywillsubstituteSTAT1040,STAT1045oranothernewprogram-specificQLcourse.
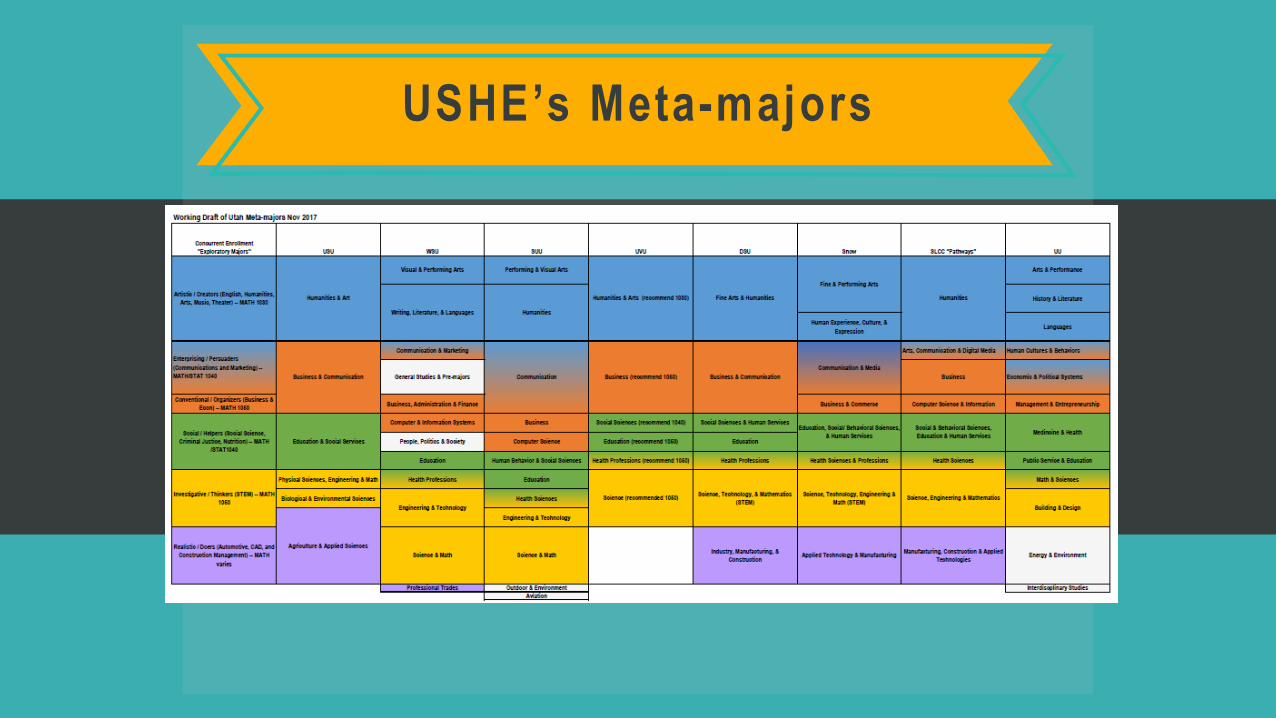
USHE’s Meta-majors

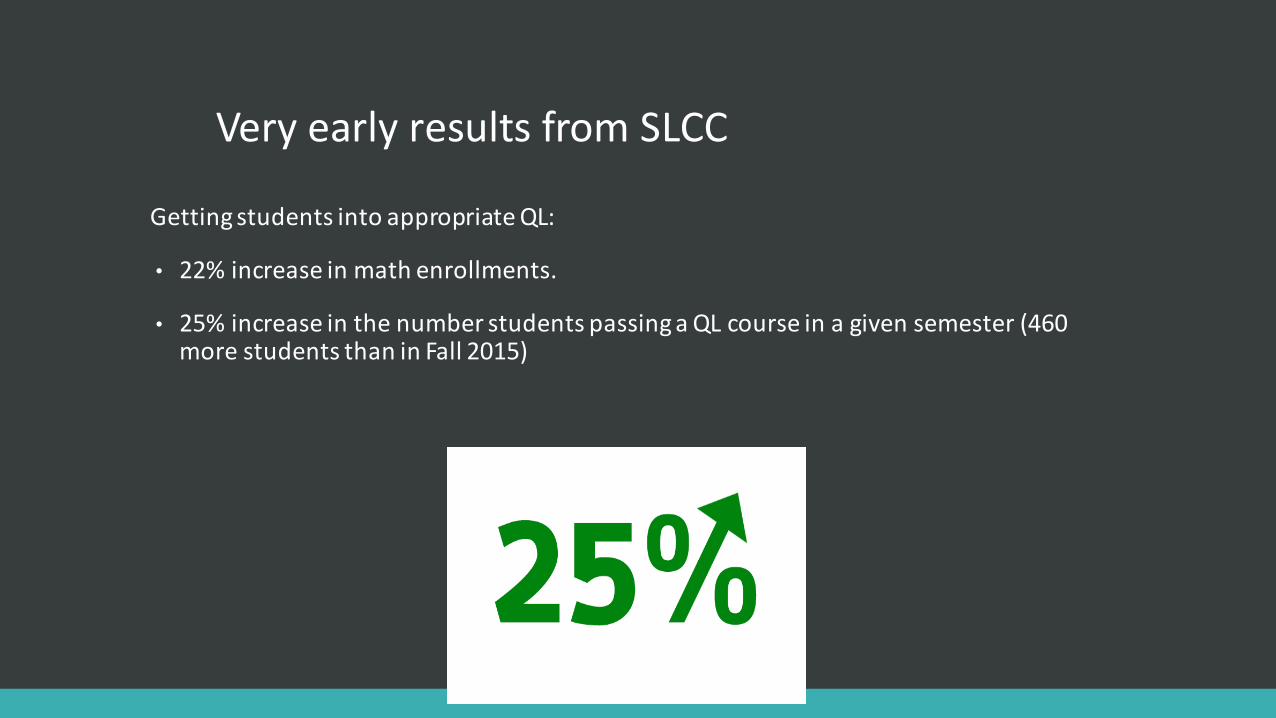
VeryearlyresultsfromSLCC
GettingstudentsintoappropriateQL:
• 22%increaseinmathenrollments.
• 25%increaseinthenumberstudentspassingaQLcourseinagivensemester(460morestudentsthaninFall2015)
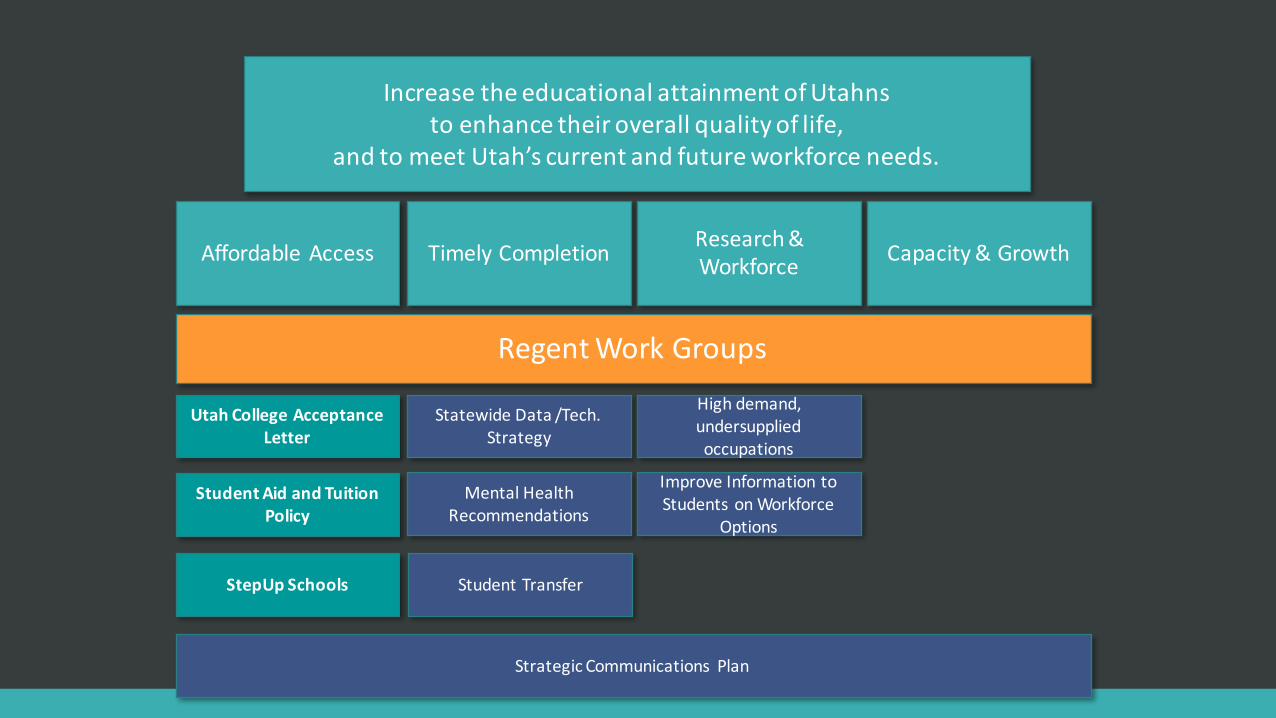
IncreasetheeducationalattainmentofUtahnstoenhancetheiroverallqualityoflife,
andtomeetUtah’scurrentandfutureworkforceneeds.
AffordableAccess TimelyCompletion Research&Workforce Capacity&Growth
RegentWorkGroups
UtahCollegeAcceptanceLetter
StudentAidandTuitionPolicy
StepUpSchools
Highdemand,undersuppliedoccupations
StatewideData/Tech.Strategy
StrategicCommunications Plan
ImproveInformationtoStudents onWorkforce
Options
MentalHealthRecommendations
StudentTransfer
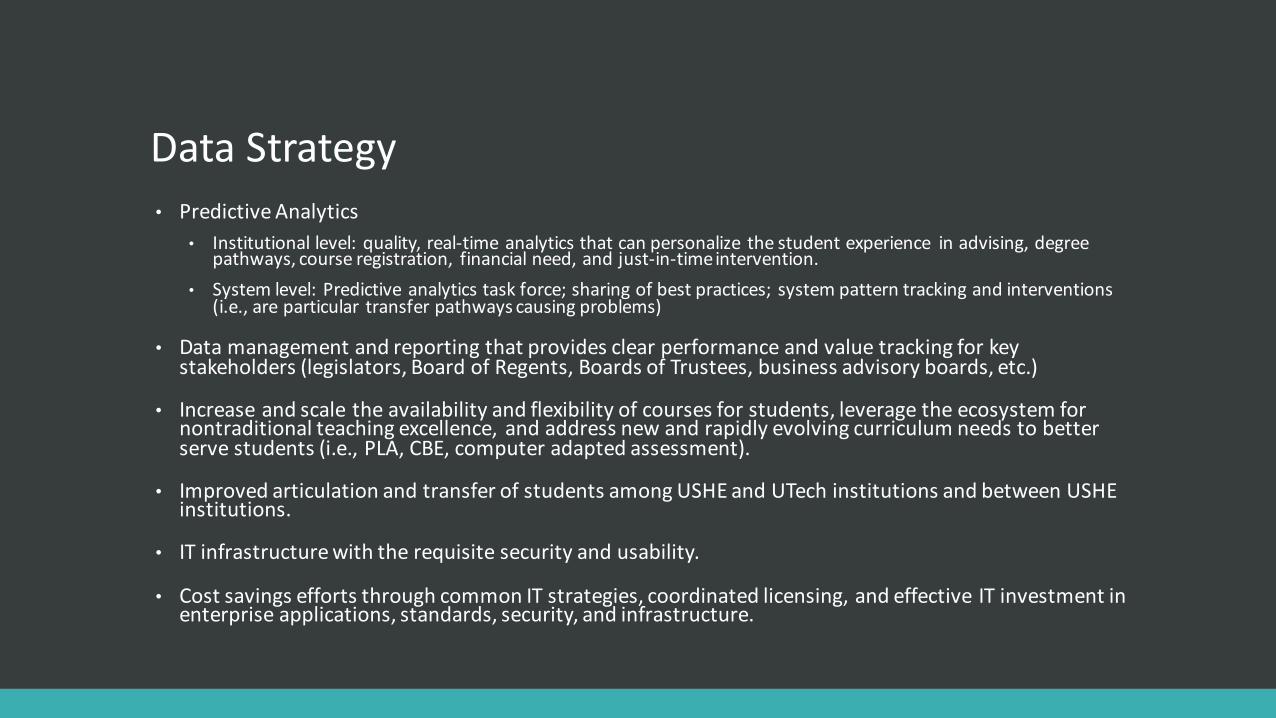
DataStrategy• PredictiveAnalytics
• Institutionallevel:quality,real-timeanalyticsthatcanpersonalize thestudentexperience inadvising,degreepathways,courseregistration, financialneed,andjust-in-timeintervention.
• Systemlevel:Predictiveanalyticstaskforce;sharingofbestpractices; systempatterntrackingandinterventions(i.e.,areparticular transferpathwayscausingproblems)
• Datamanagementandreportingthatprovidesclearperformanceandvaluetrackingforkeystakeholders(legislators,BoardofRegents,BoardsofTrustees,businessadvisoryboards,etc.)
• Increaseandscaletheavailabilityandflexibilityofcoursesforstudents,leveragetheecosystemfornontraditionalteachingexcellence, andaddressnewandrapidlyevolvingcurriculumneedstobetterservestudents(i.e.,PLA,CBE,computeradaptedassessment).
• ImprovedarticulationandtransferofstudentsamongUSHEandUTech institutionsandbetweenUSHEinstitutions.
• ITinfrastructurewiththerequisitesecurityandusability.
• CostsavingseffortsthroughcommonITstrategies,coordinatedlicensing,andeffectiveITinvestmentinenterpriseapplications,standards,security,andinfrastructure.
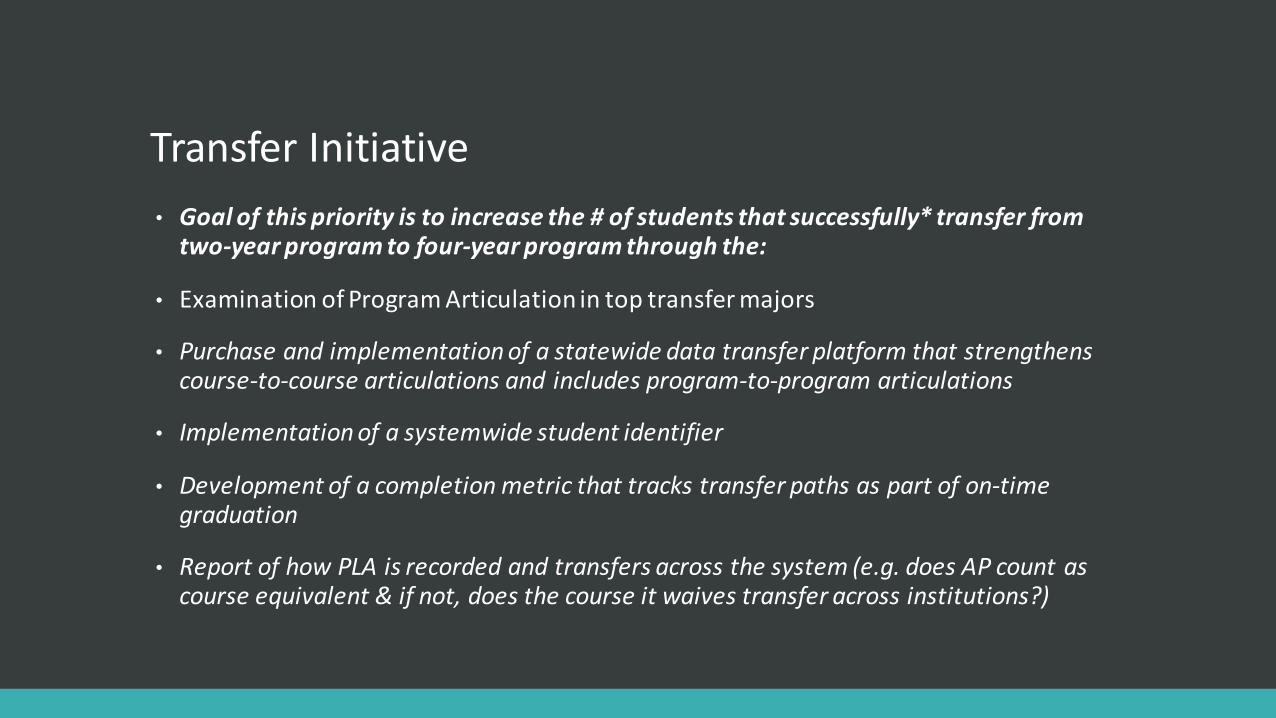
TransferInitiative• Goalofthispriorityistoincreasethe#ofstudentsthatsuccessfully*transferfromtwo-yearprogramtofour-yearprogramthroughthe:
• ExaminationofProgramArticulationintoptransfermajors
• Purchaseandimplementationofastatewidedatatransferplatformthatstrengthenscourse-to-coursearticulationsandincludesprogram-to-programarticulations
• Implementationofasystemwide studentidentifier
• Developmentofacompletionmetricthattrackstransferpathsaspartofon-timegraduation
• ReportofhowPLAisrecordedandtransfersacrossthesystem(e.g.doesAPcountascourseequivalent&ifnot,doesthecourseitwaivestransferacrossinstitutions?)

Questions