Embed Size (px)
Citation preview
1
Measuring the Systemic Importance of Banks
Georgios Moratis1 Plutarchos Sakellaris2
November 2017
Abstract
We measure the systemic importance of all banks that issue publicly traded CDS
contracts among the worldrsquos biggest 150 Systemic importance is captured by
the intensity of spillovers of daily CDS movements Our new empirical tool uses
Bayesian VAR to address the dimensionality problem and identifies banks that
may trigger instability in the global financial system For the period January
2008 to June 2017 we find the following A bankrsquos systemic importance is not
adequately captured by its size European banks have been the main source of
global systemic risk with strong interconnections to US banks For the global
system we identify periods of increased interconnections among banks during
which systemic and idiosyncratic shocks are propagated more intensely via the
network Using principal components analysis we identify a single dominant
factor associated with fluctuations in CDS spreads Individual banksrsquo exposure to
this factor is related to their governmentrsquos ability to support them and to their
retail orientation but not to their size JEL classification E30 E50 E58 E60 G15 Keywords Macroprudential Policy Systemic Risk Financial Markets
Acknowledgements We would like to thank Heather Gibson Dimitris Malliaropoulos Petros Mygiakis and seminar participants at Bank of Greece University of Crete University of Birmingham and Athens University of Economics and Business for useful comments This research has been supported by a grant from the Bank of Greece
1 Athens University of Economics and Business 76 Patission Str GR10434 Athens-Greece Email
gmoratisauebgr 2 Athens University of Economics and Business 76 Patission Str GR10434 Athens-Greece Email
plutarchauebgr
2
1 Introduction Macroprudential policy entails bank supervision from a system-wide
perspective rather than that of the individual institution The objective is to
limit the risk of system-wide financial crisis as well as to contain the costs to the
real economy if a crisis erupts In order to ensure that each institution pays for
the externality it imposes on the global system the measures applied to each
bank should be calibrated to the systemic importance of each bank In this
paper we provide a measure of systemic importance of all banks that issue
publicly traded CDS contracts among the worldrsquos biggest 150 banks for the
period January 2008 to June 2017 We capture systemic importance by the
intensity of spillovers of daily CDS movements This measure captures
institutional externalities such as ldquotoo big to failrdquo or ldquotoo correlated to failrdquo
We obtain some strong and in some respects surprising results A bankrsquos
systemic importance is not adequately captured by its size In addition there is a
considerable number of banks officially designated as GSIBs that are not ranked
in the first quartile in terms of our novel measure of systemic importance3
Throughout the examined period European banks have been the main source of
global systemic risk with strong interconnections to US banks Looking at the
time dimension for global systemic risk we identify periods of increased
interconnections among banks during which systemic and idiosyncratic shocks
are propagated more intensely via the network Using principal components
analysis we identify a single dominant factor associated with fluctuations in
banksrsquo CDS spreads Individual banksrsquo exposure to this factor is related to their
3 See FSB (2013) for a description of the methodology for assessing the systemic importance of global systemically important banks (GSIBs) and the higher loss absorbency requirements imposed on them
3
governmentrsquos ability to support them and to their retail orientation but not to
their size
Our novel measure of bank systemic importance identifies separately the
degree of externalities originating in a bank from its vulnerability to the system
Externalities are captured by the degree to which a shock experienced by a bank
is propagated to each individual bank in the global bank system Vulnerability is
captured by the shocks it receives from each bank in the global system In
particular we find that more systemically important banks display relatively
higher externalities than vulnerability to the global system This decomposition
better allows the macroprudential supervisor to differentiate the ldquocurerdquo
according to the individual bankrsquos systemic ldquodiseaserdquo The ldquocurerdquo usually
consists of a combination of capital requirements quantitative restrictions and
supervisory review actions Arguably this is an improved approach to
safeguarding financial stability
Our methodology is based on two pillars First we use market information
incorporated in CDS spreads as a reduced-form measure of the linkages among
banks4 CDS spreads are a better measure of credit risk than bond spreads
equity returns or other market variables Second we use Bayesian VAR to
confront the high dimensionality of bank networks Past work on this topic had
to limit attention to a subset of global banks because of the dimensionality
problem5 The closest to our approach is Alter and Beyer (2012) which builds
upon the framework of Diebold and Yilmaz (2009 2012) We deviate from
4 These linkages may arise from correlated exposures counterparty relationships or other structural channels 5 There are two exceptions that address the dimensionality problem using LASSO methods applied to stock return data Demirer et al (2017) for the global bank system and Basu et al (2016) for the US financial system
4
common practice in the literature by removing any market-wide shocks through
the inclusion of a set of common external systemic variables Thus we allow
each bank to become a source of systemic risk after idiosyncratic shocks through
spillovers
The remainder of this document is structured as follows Section 2 presents
the existing literature and section 3 describes the process of measuring systemic
risk the existing frameworks and the motivation Section 4 presents the
methodology and the data while section 5 presents the results and section 6
concludes
2 Relevant Literature
Our paper is closely related to four literature strands First it is related to
studies concerning macroprudential policy The aim of macroprudential policy is
to increase the resilience of individual financial institutions and of the financial
system as a whole by limiting the build-up of vulnerabilities in order to mitigate
systemic risk (ECB 2016) It is also used to smooth-out the financial cycle
driven by fluctuations in credit leverage and asset prices which may otherwise
result in a pattern of boom and bust (DellrsquoAriccia et al 2013 Elliot et al 2013
Cerutti et al 2015) Appropriate policies should be designed toward limiting the
ex ante externalities that lead to an excessive build-up of systemic risk and the
ex post externalities that can generate inefficient failures of otherwise sound
institutions in a crisis All in all macroprudential policy is the usage of primarily
prudential tools to limit systemic risk (Crockett 2000 FSBIMFBIS 2011 IMF
2013) The literature on macroprudential policy is growing at a fast pace but is
still at an early stage and historical experience is thin The most relevant part of
5
the literature aims at assessing the systemic importance of G-SIBs The most
important framework is the one developed by Basel Committee on Banking
Supervision (BCBS) The framework compares each bankrsquos activity over twelve
indicators and finally assigns a score to each bank The indicators include the
size the interconnectedness the substitutability the complexity and the cross-
jurisdictional activity of each bank
The BCBS methodology has also been used by Financial Stability Board for
the identification of G-SIBs This methodology has been transposed in the EU
regulatory framework (see Article 131 of the Capital Requirements Directive IV
(CRDIV)) which defines global systemically important institutions or G-SIIs The
BCBSFSB framework for determining systemic risk has some deficiencies It
assigns primal importance to size as all bank characteristics considered are
directly related to size This is a premise that is not necessarily backed by
empirical evidence that the biggest banks are the most dangerous ones for
financial stability In addition the weights assigned to the characteristics are
arbitrary Finally it does not provide any information on the degree of
externalities between a systemically important bank and any other one in the
system Our contribution is to use direct observations on credit risk to measure
externalities between any two banks in the global system In this way we
quantify the degree of danger that any bank may pose to the financial system or
parts of it defined broadly or narrowly Our methodology flexibly updates the
classification dynamically as new information is obtained
The second relevant field of literature has to do with the alternative systemic
risk rankings for financial institutions There is an important number of
methodologies for calculating the exposure of financial institutions to changes in
6
current economic conditions how concentrated the risks are among the financial
institutions and how closely linked they are with each other The first stream has
to do with price-based systemic risk rankings such as banksrsquo VaR (Adams Fuss
and Gropp 2014 White Kim and Manganelli 2015) ∆CoVaR (Adrian and
Brunnermeier 2014 Castro and Ferrari 2014) and MES (Acharya Pedersen
Philippon and Richardson 2010) These measure the VaR or MES of financial
institutions conditional on the entire set of institutions performing poorly The
second group of such metrics incorporates book values as well and includes
SRISK (Acharya Engle and Richardson 2012 Brownlees and Engle 2010)
leverage ratio (Fostel and Geanakoplos 2008 Geanakoplos and Pedersen 2014)
and CAPM beta times market capitalization (Benoit Colliard Hurlin and
Perignon 2015) Finally the distressed insurance premium (DIP) by Huang et al
(2012) measures the insurance premium required to cover distressed losses in
the banking system These closely related approaches have a key weakness
which is that they do not provide information on the pairwise directional
connectedness ie the direction of externalities between any two banks in the
global system In response to this shortcoming some papers (see Billio et al
2012) use Granger causality as a tool to uncover directionality However
Granger causality is unable to consider contemporaneous movements control
for exogenous variables quantify intensities of effects or consider multi-
dimensional networks These are all aspects that our methodology and measure
enables
The third group of relevant papers deals with the estimation of high-
dimensional VAR models Our approach is closely related to the approach
developed by Alter and Beyer (2013) which is based on the framework of
7
Diebold and Yilmaz (2009 2011) The high-dimensionality problem had forced
this research on global bank connectedness to limit their analysis to small
samples of banks Needless to say this is not appropriate when considering bank
importance for the global system A relevant methodology has been recently
suggested by Demirer Diebold Liu and Yilmaz (2017) who use LASSO methods
to shrink select and estimate the high-dimensional network linking the publicly-
traded subset of global banks In a similar vein Basu et al (2017) use Lasso
penalized Vector Autoregressive model to estimate a model that leverages a
system-wide approach to identify systemically important financial institutions in
the US Our distinct approach is to use Bayesian VAR in order to resolve the
dimensionality problem
Finally our paper relates to studies that apply principal components
methods to analyze systemic risk Billio et al (2012) suggested that an
important symptom of systemic risk is the presence of sudden regime shifts
Giglio et al (2015) proposed dimension-reduction estimators for constructing
systemic risk indexes from the cross section of measures and prove their
consistency in a factor model setting We differ by examining the individual bank
loadings on the dominant factor associated with fluctuations in bank CDS
spreads and determining which bank and country characteristics are related to
these This provides solid empirical basis for using relevant characteristics as
indicators to measure systemic importance indirectly
3 Definition of Systemic Importance
8
Systemic risk may originate in an endogenous build-up of financial
imbalances possibly associated with a booming financial cycle large aggregate
shocks hitting the economy or the financial system or contagion effects across
markets intermediaries or infrastructures Our study focuses on contagion
among banks and measures the systemic importance of a bank by the amount of
spillovers it receives from and sends to the rest of the banking system According
to Allen et al (2012) contagion refers to the risk that the failure of one financial
institution leads to the default of others through a domino effect in the interbank
market the payment system or through asset prices More precisely we adopt
the ldquopure-contagionrdquo (Gomez-Puig and Sosvilla Rivero 2013) definition by
controlling only for external common factors through the inclusion of a set of
common external systemic risk factors and assume that each bank could become
itself a source of systemic risk as a result of an idiosyncratic shock
The following example illustrates how we measure the systemic importance
of banks (see Figure 1) Assume that there exist three banks Focusing on bank A
as the source of shocks figure 1 presents the potential impact of an idiosyncratic
shock on bank A to bank B and to bank C respectively Bank A sends a ten-unit
shock to B and a seventeen-unit shock to C a total of 27 Next we focus on the
shocks received by bank A from the other banks in the system Bank A receives a
twenty-one-unit shock from bank B and a five-unit shock from bank C a total of
26 If we sum the shocks that bank A sends to and receives from the system we
obtain an estimate of the degree of connectedness for bank A This is a valid
measure of bank Arsquos systemic importance This procedure is repeated in order to
calculate the systemic importance of bank B and bank C
9
Figure 1 Example of pairwise directional connectedness
Transforming this figure into a table we construct the directional
connectedness matrix
Table 1 Directional connectedness matrix
ShockResponse Bank A Bank B Bank C To Others (Sum_Out)
Bank A - 10 17 27
Bank B 21 - 28 49
Bank C 5 19 - 24
From Other(Sum_In) 26 29 45 100
Score (Sum_Out+Sum_In) 53 78 69
Note Variables in the first column are the impulse origin while variables on the top row are the respondents to the shock
Table 1 presents the entire picture for all three banks in the system Shocks
emanate from row banks to column banks Each row shows the contagion effects
of an equal-sized impulse to the relevant bank in the first column In the last
column we aggregate the total externality effects of each row bank The columns
provide the picture of vulnerability of each bank to shocks in different banks
10
The second to last row is a measure of total vulnerability of a bank to all other
banks in the system It contains the answer to the question ldquoIf all other banks in
the system experienced an idiosyncratic shock of 100 basis points what would
be the impact on bank Xrdquo In the bottom row we aggregate the total externality
effect and the total vulnerability effect of each bank In other words we lump
together shocks sent and received by an individual bank as a measure of total
individual bank connectedness In calculating a bankrsquos systemic importance we
assign equal weights to shocks it sends as to shocks it receives as we are
agnostic as to whether one source of systemic instability is more dangerous than
the other
There are two aspects of financial contagion due to a bankrsquos participation in a
banking system that are of relevance to regulators externalities emanating from
a bankrsquos failure and individual bank vulnerability to financial contagion Both
components are important for regulators but their importance may not be equal
If they are of equal importance then the regulator would consider the sum of
these two However the clear decomposition in Table 1 as well as in our
econometric method allows the regulator to assign different weights in order to
capture the appropriate measure of systemic importance
4 Data and Methodology
41 Data
We study 77 banks from 19 developed and 7 emerging economies Our
selection procedure is as follows We started with the list of the worldrsquos top 150
banks in terms of total assets in Q42016 Using bank names we matched 77
banks to CDS prices from Thomson-Reuters Datastream and Bloomberg CDS
11
spreads cover the period from January 2008 to June 2017 and are at daily
frequency The sample contains all the banks that are designated as ldquoglobal
systemically important banksrdquo (ldquoGSIBrsquosrdquo) by the Basel Committee on Banking
Supervision except for three Chinese banks (Agricultural Bank of China Bank of
China and Industrial and Commercial Bank of China) and one French bank
(Group BPCE) Table 2a (in the Appendix) classifies banks by assets and provides
detail on the 77 banks in the sample such as home-country and total assets
while table 2b (in the Appendix) classifies banks by home-country We note that
40 out of the 77 banks (52) in the sample are from Europe while 28 of them
(34) are headquartered in Eurozone members Tables 3a and 3b (in the
Appendix) provide the regional characteristics of the sample
411 Systemic Risk factor
We will allow for the presence of a global systemic risk factor This permits
us to interpret robustly the results obtained from our model Longstaff et al
(2011) for instance has argued that credit risk appears related to global rather
than country-specific factors while Aizenman et al (2013) has established the
importance of international economic factors in the pricing of credit risk The
variables we chose to employ in order to capture global financial risk conditions
have been widely used in related studies as control variables (see among others
De Santis 2012 Aizenman et al 2013 Ang and Longstaff 2011) The global
default risk conditions are represented by the CDX which is the family of CDS
indices covering North America the VIX volatility index which captures the
global capital marketsrsquo ldquofearrdquo condition and the global liquidity conditions which
is represented by the US 3-month treasury bills The systemic factor is assumed
12
to affect the endogenous variables contemporaneously Table 4 contains the
variable definitions and Table 5 provides descriptive statistics
412 Bank-specific characteristics
A variety of bank- and country-specific variables are used for identifying the
determinants of systemic risk fluctuation over time The first bank-specific
variable is bank size expressed as each bankrsquos total assets (in log) According to
BIS (2011a) the larger a bank is the more likely it is to receive a bailout package
In this sense we also take into consideration the ldquotoo-big-to-failrdquo (TBTF) issue
(Acharya et al 2013) The second bank-specific variable is the loan-to-asset
ratio which provides information on the bankrsquos retail orientation Ayadi et al
(2011) and Koumlhler (2013) suggest that retail-orientated banks appeared to be
less risky than other banks during the recent financial crisis Also according to
Altunbas et al (2011) the non-interest income over total revenue is considered
to be a measure of each bankrsquos diversification since the less a bank relies on
interest income the less exposed the bank is to a negative shock Finally we
include each bankrsquos nonperforming loans over total loans (see Tables 4 and 5)
413 Country-specific characteristics
It is important to include country-specific factors since the impact of
macroprudential policy might differ depending on the underlying economic
conditions of each bankrsquos home country For example the impact of shocks may
be larger for economies that were under stress and hence rely more on rescue
packages and foreign financing (IMF 2015a) These economies would not have
the same ability to support effectively their banking systems in times of distress
13
We investigate the role of sovereigns by searching among each bankrsquos home-
country GDP growth the primary surplus over GDP and public debt over GDP
42 Connectedness matrix
We estimate a VARX model with two lags (p=2) for the endogenous variables
and contemporaneous exogenous variables (q=0)
The vector of endogenous variables (y) consists of log differences of daily CDS
spreads for the 77 banks By including the exogenous variables we account for
common factors that affect at the same time all bank CDS spreads (Bekaert et al
2005)
421 Bayesian VAR
The suggested model has many more parameters than observations overfits
the data in-sample and as a consequence could perform poorly Researchers
working in the relevant literature typically use prior shrinkage on the
parameters to overcome such over-parametrization concerns Most flexible
Bayesian priors that result in shrinkage of high-dimensional parameter spaces
rely on computationally intensive Markov Chain Monte Carlo (MCMC) methods
Their application to recursive forecasting exercises can as a consequence be
prohibitive or even infeasible The only exception is a variant of the Minnesota
prior that is based on the natural conjugate prior an idea that has recently been
exploited by Banbura Giannone and Reichlin (2010) and Giannone Lenza and
Primiceri (2012) among others While this prior allows for an analytical formula
ttttt uXBYAYAaY 122110
14
for the posterior there is a cost in terms of flexibility in that a priori all VAR
equations are treated in the same manner see Koop and Korobilis (2010) for a
further discussion of this aspect of the natural conjugate prior
The traditional ldquoMinnesota priorrdquo an empirical-Bayes prior which is due to
Littermann (1979) and co-authors (see eg Doan Litterman and Sims 1984)
still dominates many applications of VAR models in economics The recent
contribution of Giannone Lenza and Primiceri (2012) provides guidance on
selecting the prior hyperparameter controlling shrinkage of the VAR coefficients
Note that computational simplicity is a priority in this paper so that the
Gibbs sampler is preferred compared to other potentially more powerful and
elegant Markov Chain Monte Carlo (MCMC) and Sequential Monte Carlo (SMC)
algorithms for prior selection However we recognize that the flexibility of
choosing the prior freely is one of the main controversial issues associated with
Bayesian analysis and the reason why some researchers view the latter as
subjective It is also the reason why the Bayesian practice especially in the early
days was dominated by non-informative priors as these priors assign equal
probabilities to all possible states of the parameter space with the aim of
rectifying the subjectivity problem We estimate the coefficients of a VAR(2) for
78 banks using the arithmetic returns of each bankrsquos CDS As we explained
above a key concern of users of Bayesian statistics and criticism by critics is the
dependence of the posterior distribution on onersquos prior and for this reason we
specify hyperparameters for the prior
The Bayesian VAR(p) model can be written as
119910119905 = 1198860 + sum 119860119895119910119905minus119895 + 120576119905
119901
119895=1
15
where yt for t = 1 T is an M x 1 vector containing observations on M time series
variables εt is an M x 1 vector of errors α0 is an M x 1 vector of intercepts and Aj
is an M x M matrix of coefficients We assume εt to be iid N (0 Σ) Exogenous
variables are added to the VAR and included in all the derivations below but we
do not do so to keep the notation as simple as possible
422 The connectedness matrix framework
The construction of the diagnostic tool is based on a medium-size Bayesian
vector autoregressive model with exogenous variables (Bayesian VARX) that
accounts for common global and regional trends and is able to include even
bank-specific characteristics Then similar as the framework described by
Diebold and Yilmaz (2009 2012) and the one described by Alter and Beyer
(2013) we construct the spillover matrix in order to capture any potential
spillovers among banks This methodology relies on Generalized Forecast Error
Variance Decomposition (GFEVD) or on Generalized Impulse Response
Functions (GIRF) obtained as shown in Pesaran and Shin (1998) Therefore we
derive Generalized Impulse Response Functions as functions of residuals
together with the interdependent coefficients According to Alter and Beyer
(2012) it is of low importance which methodology we select since they produce
qualitatively similar results
16
Table 6 Contagionconnectedness matrix
Note Variables in the first column are the impulse origin while variables on the top row are the respondents to the shock The cumulative impact is bound between 0 and 1 A value of 05 means that the response variable would be impacted in the same direction with an intensity of 50 the initial unexpected shock in the impulse variable The last column presents the aggregated impact sent (Sum OUT) by each row variable and on the bottom row the aggregated spillover received (Sum IN) by each column variable The bottom-right cell shows total spillover in the system and by dividing this value to the total number of non-diagonal cells we obtain the connectedness index (CI)
In table 2 row variables are the origin of the unexpected shock Column
variables are the respondents of contagion receivers CI represents the
connectedness index calculated as the average response in the contagion matrix
The potential contagion effects are aggregated on each line and column and
represent the total to_others and the total from_others as potential contributions
to contagion from and to each bank The main diagonal values represent the
effect of a variablersquos shock on itself and they are excluded from any calculations
The possible contagion effects answer the question ldquoHow would bank B evolve in
the following period if bank A CDS increases by one unit shockrdquo
We use accumulated Impulse Response functions over a 10-step horizon (10-
days) Not all the banks respond to the shocks within the same period but the
majority of the shocks are absorbed within 10-days Nevertheless the
framework is flexible and it easily adapts to the needs of each study
5 Empirical results
17
51 Individual bank connectedness
We estimate the connectedness matrix as described in section 422 for the
whole sample period 1 January 2008 to 31 June 2017 and estimate the
individual bank connectedness (table 7) which reports several notable results
The evidence do not offer support to the argument that systemic importance of a
bank can be adequately captured by its size According to table 7 the bank that
creates the most systemic risk in the system is Intesa Sanpaolo a medium-sized
European bank that is ranked 27th in terms of total assets with total contagion
effects of 1056 which is further decomposed into 0505 vulnerability-score and
0551 externalities-score For instance the Intesa Sanpaolorsquos 0551 externalities
score implies that one-unit shock in Intesa Sanpaolo will have an impact of
551 to the system while the 0505 vulnerability score means that one-unit
shock to the market will affect Intesa Sanpaolo by 505 Among the top-20
most connected banks can also be found smaller banks like BBVA (3rd) Credit
Lyonnais (10th) Banca Monte dei Paschi (16th) and Mediobanca (20th) while the
largest bank in the sample is listed 50th in terms of systemic importance
The existing literature on the topic suggests that during crises periods large
banks behave differently than small or medium-sized banks (Laeven et al 2014)
This phenomenon could be partially attributed to some common characteristics
that are shared by large banks and are associated with higher levels of risk
namely the increased portion of market-based activities the reduced capital
adequacy the less stable funding and the higher organizational complexity
However it remains unidentified the bank-size threshold above or below which
these criteria are valid Results presented in table 8 provide a more narrow
response to the question whether systemic importance is related to size or not
18
Size per se is a determinant of systemic importance since when banks are
ranked by systemic importance the first quartile compiles the largest percentage
of total assets (34 of total assets) However when the sample is ranked by total
assets and not in terms of connectedness the first quartile represents 62 of
total assets indicating a severe leakage of assets to the other quartiles and
revealing the existence of structural variables that interact with size
The existing frameworks used by regulators and policy makers such as the
BCBSFSB framework rely heavily on size either through size-related indicators
or size per se to calculate the capital adequacy ratios Our results suggest that
the measures taking strong size-effect as granted should also focus on the large
banksrsquo idiosyncratic characteristics that place 50 of G-SIBs in the first quartile
of systemic importance
Table 8 Banks ranked by systemic importance and by assets ndash Number of banks per quartile
Quartile ranked by Number of G-SIBs per quartile
Score Assets
1st Quartile 34 62 48
2nd Quartile 33 224 28
3rd Quartile 18 105 10
4th Quartile 14 51 14
The next step is to calculate the systemic contribution of each bank in the
system as the ratio between the total individual contagion effects and the total
contagion in the system
100TC
TICTSC i
i
y
y
19
TSC is the total systemic contribution TIC is the total individual contagion
effects and TC is the total contagion in the system The bank with the highest
ranking contributes 225 of the total contagion effects while the bank at the
bottom of the table contributes almost 0 (table 9) This measure allows us to
compare the results among samples with different number of entities
We define each bankrsquos directional connectedness as the ratio between the
individual externalities and the total individual contagion
100
i
i
i
y
yOUT
yOUTTIC
IEID or
100
i
i
i
y
yIN
yINTIC
IVID
ID is the individual directionality IE is the individual externalities IV is the
individual vulnerabilities and TIC is total individual contagion The followings
should be always valid
1 ii yINyOUT IDID
ii yINyOUT IDID
In case iyOUTID is larger than 50 it means than the bank that the systemic score
of the bank it refers to is externalities-driven When breaking the results into
quartiles that represent the average individual directionality for all the banks
that belong in this quartile (table 10) we realize that banks with higher TIC tend
to have higher iyOUTID ratios (54) that their peers that belong in the last
quartile (30) We do not suggest that the directionality of contagion
determines the systemic importance of banks because this is beyond control and
difficult to interpret but that in terms of systemic importance that may be
20
interpreted into increased capital requirements is ldquobetter to receive shocks than
to send shocks to the systemrdquo
Table 10 Average Individual Directionality (OUT) per quartile
iyOUTID
1st Quartile 54
2nd Quartile 53
3rd Quartile 47
4th Quartile 30
Note banks are ranked by systemic importance
52 Regional network connectedness
Prior quantifying the transmission of contagion effects we focus on table 7
that reveals a very strong regional effect This is that the first quartile of systemic
importance is exclusively dominated by banks that are headquartered in Europe
implying the existence of a regional component and severe clustering Table 11a
shows the regional concentration per quartile and table 11b expresses the
regional concentration as a percentage of the total number of banks that exist
per region
Table 11a Concentration of banks per region
Quartile Europe Eurozone (as
of EU) N America Asia Oceania Africa
1st Quartile 100 75 - - - -
2nd Quartile 25 25 40 25 10 -
3rd Quartile 50 50 10 30 10 -
4th Quartile 35 75 12 48 - 5
Table 11b Regional concentration as a percentage of total banks per region
21
Quartile Europe N America Asia Oceania Africa
1st Quartile 47 - - - -
2nd Quartile 12 73 25 25 -
3rd Quartile 21 9 35 75 -
4th Quartile 16 18 40 - 100
The next step is to understand the flows of shocks among the different
regions the contagion effects and the degree of connectedness among the
different regions (Table 12a and b) We focus on four regions Europe North
America (expressed by US banks) Asia and Oceania Table 12a shows regionrsquos A
externalities to the other regions as a percentage of regionrsquos A total externalities
while table 12b focuses on the vulnerabilities side Combining the information
obtained by tables 12a and b European and US appear to be strongly
interconnected More precisely 58 of the aggregate shocks that are sent by US
banks are directed to Europe while 64 of the aggregate shocks received by US
banks are generated in Europe Also another important finding is that 69 of
the aggregate shocks that are sent by European banks remain within Europe
Table 12a Shocks sent per region as of total shocks sent per region
Asia Europe NAmerica Oceania
Sum
Asia 41 41 9 9
100
Europe 16 69 960 540
100
NAmerica 1950 58 16 650
100
Oceania 33 4450 950 12
100
22
Table 12b Shocks received per region as of total shocks received per region
Asia Europe NAmerica Oceania
Asia
28 10 13 21
Europe
54 75 64 59
NAmerica
12 12 20 13
Oceania
6 3 3 7
Sum
100 100 100 100
All in all it is obvious that there exists a regional factor that affects
significantly the bank connectedness However it is interesting to find out the
driving forces of this regional component especially in the case of Europe which
has been a special case due to the different transmission channels of the financial
crisis the highly interconnected banking system the feedback loops among
sovereigns and banks and the contagion from one country to the rest of Europe
53 National banking system connectedness
We approach the national banking system first of all by calculating the
average systemic risk per bank for each one of the countries in the sample
(Figure 2) Four out of the first five banks that contributed the most to the global
systemic risk belong to Eurozone French banks contributed the most to
systemic risk while Italy and Spain both of which suffered from banking
systems in distress followed at close range Banks in non-Euro-area countries
like Swiss and UK banks played an important role as well Surprisingly the
average contagion effects for German banks place them almost in the middle of
the table indicating that German banking system may acted as a stability factor
for the European region Both Portuguese and especially Greek banking system
appeared to be isolated from the global banking system
23
Figure 2 Average systemic risk per bank ndash Own shocks are excluded
Note results concern the period January 2008-June 2017
In figure 3 we approach the total contagion from a different perspective by
presenting the total contagion effects for each sovereign This approach may
depends on the number of banks per sovereign but illustrates that US-European
cluster dominates in terms of systemic importance
Figure 3 National systemic risk ndash Own shocks are excluded
Note results concern the period January 2008-June 2017
53 Rolling window
000
010
020
030
040
050
060
070
080
090
100
Fra
nce
Ital
y
Swit
z
Net
her
l
Spai
n
UK
Au
stri
a
Den
mar
k
S K
ore
a
USA
Ru
ssia
Au
stra
lia
Ger
man
y
Swed
en
Mal
aysi
a
Ind
ia
Ch
ina
Bel
giu
m
Sin
gap
ore
Irel
and
S A
fric
a
Jap
an
Po
rtu
gal
Tai
wan
Gre
ece
Tu
rkey
000
100
200
300
400
500
600
700
USA U
K
Fra
nce
Ital
y
Spai
n
S K
ore
a
Ger
man
y
Jap
an
Au
stra
lia
Swed
en
Swit
z
Net
her
l
Ch
ina
Bel
giu
m
Sin
gap
ore
Au
stri
a
Den
mar
k
Po
rtu
gal
Ru
ssia
Mal
aysi
a
Ind
ia
Irel
and
S A
fric
a
Tai
wan
Gre
ece
Tu
rkey
24
531 Individual Banks
In order to better understand the evolvement of systemic risk and how this
fluctuated over the whole period we use rolling-window analysis where the
length of the window is 340 days and the step is 150 days Figure 3 presents the
evolution of total contagion over time where strong co-movement and
interconnections among banks are obvious We also discriminate periods where
the cluster of TCI lines is shrinking and systemic risk is becoming more unified
which means that systemic and idiosyncratic shocks are propagated more
intensely via the network
Figure 3 Total Individual Contagion
Note The length of the window is 340 days and the step is 150 days
We introduce the range as a new metric of systemic risk unification Range at
each point in time is defined as the difference between the highest and the
lowest score in the system (Figure 4) The lowest the score the more unified the
000
020
040
060
080
100
120
Jan
-08
May
-08
Sep
-08
Jan
-09
May
-09
Sep
-09
Jan
-10
May
-10
Sep
-10
Jan
-11
May
-11
Sep
-11
Jan
-12
May
-12
Sep
-12
Jan
-13
May
-13
Sep
-13
Jan
-14
May
-14
Sep
-14
Jan
-15
May
-15
Sep
-15
Jan
-16
May
-16
Sep
-16
Jan
-17
May
-17
25
systemic risk is becoming Given the predictive power of CDS spreads this new
measure could be used by regulators and policymakers as an early-warning tool
However it remains an open question what is the threshold below which the
unification of systemic risk could consist a problem It is remarkable that the
most ldquolooserdquo links were observed during the post-Lehman collapse in late 2008
and reached its lowest price at the beginning of Greek crisis
Figure 4 Systemic risk range
Note The length of the window is 340 days and the step is 150 days
532 Global banking system
In this part we are interested in understanding the behavior of aggregate
contagion effects Total Systemic risk (TSR) is defined as the total of the off-
0
01
02
03
04
05
06
07
08
09
1
Jan
-08
May
-08
Sep
-08
Jan
-09
May
-09
Sep
-09
Jan
-10
May
-10
Sep
-10
Jan
-11
May
-11
Sep
-11
Jan
-12
May
-12
Sep
-12
Jan
-13
May
-13
Sep
-13
Jan
-14
May
-14
Sep
-14
Jan
-15
May
-15
Sep
-15
Jan
-16
May
-16
Sep
-16
Jan
-17
May
-17
26
diagonal entries in the connectedness matrix or as the sum of the ldquofromrdquo column
or ldquotordquo row measures total connectedness
N
ijji
H
ij
H IRTSR 1
We could plot a moving contagion measure defined as the sum of all IRFs ldquoto
others but we go one step further and we choose to present the Total Contagion
index (TCI) which is calculated as the average response per bank in the
connectedness matrix and is calculated as the sum of all non-diagonal cells
divided by the total number of entities
N
i j yy jiIR
NTCI
1 1
1
Cumulative IRs interval is [01] the index will be bound between 0 and 100
Higher contagion index implies a tightening of the nexus among banks (Figure
5)
Figure 5 Total Connectedness (TC)
Note The length of the window is 340 days and the step is 150 days
000
500
1000
1500
2000
2500
3000
3500
4000
4500
Jan
-08
May
-08
Sep
-08
Jan
-09
May
-09
Sep
-09
Jan
-10
May
-10
Sep
-10
Jan
-11
May
-11
Sep
-11
Jan
-12
May
-12
Sep
-12
Jan
-13
May
-13
Sep
-13
Jan
-14
May
-14
Sep
-14
Jan
-15
May
-15
Sep
-15
Jan
-16
May
-16
Sep
-16
Jan
-17
May
-17
27
Total connectedness reached its peak after Lehman collapse and was
severely affected by the developments in the European banking and sovereign
debt markets that shocked some EU member countries until mid-2012 The
Greek crisis and then the fact that in the early 2011 Italy and Spain joined the
countries with stressed banking systems pushed total connectedness upwards
After the early 2012 the actions taken by the ECB constrained total contagion
but after early 2015 higher political uncertainty following the outcomes of the
UK referendum on EU membership and the US election as well as market
concerns about euro area banksrsquo longer-term profitability prospects played their
role and contributed to the severe increase in the index At the same time
continued accommodative monetary policy in advanced economies and abating
market concerns about the possibility of a sharp slowdown in China have
dampened spikes in systemic stress Also a major concern for global markets
was the crisis in Deutsche Bank and its deep connections to global financial
institutions
From a policy perspective the most pressing issue for euro area financial
institutions remains the high level of NPLs which needs to be addressed The
resolution of systemic NPL problems will take time and requires a
comprehensive strategy involving coordination of all relevant stakeholders
533 Rolling Window ndash Regional Systemic Contribution (RSC)
We calculate the systemic contribution of each region as the ratio between
the total regional contagion effects and the total contagion in the system We
focus on Europe North America (US) and Euro-area since these regions
28
dominated in terms of systemic risk during the period Figure 8 compares the
systemic contribution of these regions Surprisingly the share of systemic risk
that European banks hold increased after 2014 while the contribution of US
banks remains increasingly lower than European banksrsquo contribution after mid-
2012 The difference between the systemic contribution of European and US
banks fluctuates between 40 and 55
Figure 8 European US and Euro-area banksrsquo contribution to total systemic risk
(as a of total systemic risk)
Note US banksrsquo contribution is presented in secondary axis
54 Principal Component Analysis
We use PCA analysis in which the banksrsquo CDS spreads are decomposed into
orthogonal factors of decreasing explanatory power to identify the increased
000
500
1000
1500
2000
2500
000
1000
2000
3000
4000
5000
6000
7000
8000
Jan
-08
May
-08
Sep
-08
Jan
-09
May
-09
Sep
-09
Jan
-10
May
-10
Sep
-10
Jan
-11
May
-11
Sep
-11
Jan
-12
May
-12
Sep
-12
Jan
-13
May
-13
Sep
-13
Jan
-14
May
-14
Sep
-14
Jan
-15
May
-15
Sep
-15
Jan
-16
May
-16
Sep
-16
Jan
-17
May
-17
EU Euroarea US
29
commonality among the default risk of banks (see Muirhead 1982 for an
exposition of PCA)
Let 119884119905 be the log difference of bankrsquos i CDS i=1hellip77 let the systemrsquos
aggregate credit risk be represented by the sum 119884119878 = sum 119884119894119894 and let 119864[119884119894] = 120583119894
and Var[119877119894] = 1205901198942 Then we have
1205901199042 = sum sum 120590119894120590119895120550[119911119894119911119895]
119873
119895=1
119873
119894=1
where 119911119896 = (119877119896 minus 120583119896)120590119896 k=ij
where 119911119896 is the CDS of bank k and 1205901199042 is the variance of the system
PCA produces the decomposition of the variance-covariance matrix of CDS
spreads of the 77 banks contained in the sample into the orthogonal matrix of
loadings L (eigenvector of the correlation matrix of CDS spreads) and the
diagonal matrix of eigenvalues Λ
We focus on the first three eigenvalues as they explain most of the variation
in the system These three eigenvalues are supposed to explain a larger portion
of the total volatility in the system when the CDS spreads are moving together or
in other words when systemic risk in more unified So periods when the first
three components explain most of the total volatility indicates the existence of
increased interconnectedness among banks The first component that is
extracted accounts for the maximum amount of total variance in the observed
variables In other words the proportion of explained variance by the first
component shows how much of the variations in the CDS spreads can be
explained by one common factor This result is in line with Fontana and
Scheicher (2010) who finds there to be a single large determinant dominating
the variation in the CDS spread where the proportion of explained variance by
30
factor 1 exceeds 80 According to Billio et al (2012) during periods of distress
fewer components explain larger part of the volatility which means that the
fluctuation of the first principal component while taking into account the
predictive power that CDS carry reveal periods of increased systemic risk
We run rolling window analysis where the length of the window is 200 days
and the step is 100 days over the period January 2008 to June 2017 and the
results indicate the existence of a single dominant component that determines
the fluctuations of CDS spreads (Figure 9)
Figure 9 Rolling Principal Components analysis
Note The length of the window is 200 days and the step is 100 days
Investigating the determinants of the loadings of each bank to the first
principal component through rolling cross-sectional analysis will reveal the
driving forces of systemic risk on a yearly basis over the period 2008-2016 For
that reason we use rolling cross-sectional analysis
0
10
20
30
40
50
60
Jan
-08
Jun
-08
No
v-0
8
Ap
r-0
9
Sep
-09
Feb
-10
Jul-
10
Dec
-10
May
-11
Oct
-11
Mar
-12
Au
g-1
2
Jan
-13
Jun
-13
No
v-1
3
Ap
r-1
4
Sep
-14
Feb
-15
Jul-
15
Dec
-15
May
-16
Oct
-16
comp1 comp2 comp3
31
ii
iiiiiii
Debt
SurplusGDPNIINPLsLoansAssetsay
7
654321
yi is each bankrsquos loading to the first component
We search among the following bank-specific characteristics total value of
bank assets (logs) retail orientation the total loanstotal assets (levels) NPLs
total loans (levels) and non-interest income total revenue and among the
following home-country specific characteristics GDP growth primary
surplusGDP (levels) public debtGDP (levels) We manage to match 47 banks to
bank-specific characteristics
Table 13 Determinants of each bankrsquos loadings in the first component over the nine
periods
2008 2009 2010 2011 2012 2013 2014 2015 2016
Size -0012 -0002 -0007 -0012 0001 0004 0001 -0002 -0003
(0008) (0007) (0006) (0006) (0007) (0006) (0010) (0008) (0009)
Loan-to-assets -0048 -0142 -0113 -0136 -0135 -0114 -0212 -0210 -0239
(0043) (0051) (0051) (0051) (0054) (0051) (0078) (0069) (0074)
NPLs 0844 0414 0352 0035 0004 -0097 0333 0304 0194
(0349) (0253) (0187) (0183) (0054) (0139) (0187) (0147) (0174)
Non-interest-income 0000 0000 0001 0000 0001 0000 0001 0000 0000
(0000) (0000) (0006) (0006) (0000) (0000) (0000) (0000) (0000)
GDP -0004 -0003 -0006 -0003 -0009 -0009 -0011 -0004 -0007
(0004) (0002) (0001) (0003) (0054) (0003) (0005) (0001) (0006)
Primary SurplusGDP 0000 -0002 0002 0000 -0002 -0004 -0009 -0014 -0012
(0002) (0001) (0001) (0170) (0054) (0003) (0004) (0004) (0005)
DebtGDP -0001 -00005 -00006 -0001 -00007 -00005 -00005 0000 -0000
(0000) (0000) (0000) (0000) (0054) (0000) (0000) (0000) (0000)
_cons 0300 0235 0297 0372 0248 0229 0252 0283 0323
(0080) (0076) (0068) (0078) (0054) (0072) (0111) (0094) (0107)
Note 1 510
32
6 Conclusions
Macroprudential policy is still in its infancy Much work is still needed on
developing good and timely analysis effective policy instrument tools and
effective implementation Our paper makes a contribution on the dimension of
analysis and measurement The key aim of macroprudential policy is to address
externalities and spillovers among financial institutions in an effort to safeguard
financial stability These interactions are complex We provide a tool for
clarifying and quantifying these interactions Our measures can guide
appropriate macroprudential policies that aim to internalize these externalities
A key conclusion from our study is that the focus on size does not adequately
address the systemic importance of banks
33
References
Acharya V Engle R Richardson M 2012 Capital Shortfall A New Approach to
Ranking and Regulating Systemic Risks American Economic Review Vol102 No
3
Acharya V Pedersen L Philippon T Richardson M 2010 Measuring systemic
risk Technical Report Department of Finance NYU
Acharya V Drechsler I Schnabl P 2014 A Pyrrhic Victory Bank Bailouts and
Sovereign Credit Risk Journal of Finance 2014 vol 69 issue 6 2689-2739
Adams Z Fuss R Gropp R 2014 Spillover Effects among Financial
Institutions A State-Dependent Sensitivity Value-at-Risk (SDSVaR) Approach
Journal of Financial and Quantitative Analysis (JFQA) Vol 49 No 3
Adrian T Brunnermeier M 2009 CoVaR Manuscript Princeton University
Aizenman J Hutchison H and JinjarakY (2013) lsquoWhat is the Risk of European
Sovereign Debt Defaults Fiscal Space CDS Spreads and Market Pricing of Riskrsquo
Journal of International Money and Finance 34 37-59
Allen F A Babus and E Carletti (2012) Asset commonality debt maturity and
systemic risk Journal of Financial Economics 104(3) 519ndash534
Alter A Beyer A 2013 The dynamics of spillover effects during the European
sovereign debt turmoil Journal of Banking and Finance 42 134-153
Altunbas Y Manganelli S Marques-Ibanez D 2011 Bank risk during the
financial crisis Do business models matter ECB Working Paper No 1394
Ang A Longstaff F 2011 Systemic sovereign credit risk Lessons from the US
and Europe NBER discussion paper 16983
Ayadi R Arbak E De Groen W 2011 Business Models in European Banking A
pre-and post-crisis screening CEPS Paperbacks
34
Banbura M Giannone D Reichlin L 2011 Nowcasting Oxford Handbook on
Economic Forecasting ed by M P Clements and D F Hendry pp 63ndash90 Oxford
University Press
Bank for Internaional Settlements 2010 Guidance for national authorities
operating the countercyclical capital buffer
Bank for Internaional Settlements 2011 Global systemically important banks
Assessment methodology and the additional loss absorbency requirement
Basel Committee on Banking Supervision 2010 Basel III A global regulatory
framework for more resilient banks and banking systems Bank for International
Settlements
Basu S Das S Michailidis G Purnanandam A 2017 A system-wide approach
to measure connectivity in the financial sector Unpublished
Benoit S Colliard J-E Hurlin C Perignon C 2015 Where the risks lie A
survey on systemic risk Unpublished working paper
Billio M Getmansky M Lo A W Pelizzon L 2012 Econometric measures of
systemic risk in the finance and insurance sectors Journal of Financial
Economics 104 535ndash559
Brownlees CT Engle RF 2010 Volatility correlation and tails for systemic
risk measurement Manuscript Stern School of Business New York University
Canova F and Pappa P 2007 Price Differentials in Monetary Unions The Role
of Fiscal Shocks Economic Journal 117 2007 713-737
Castro C Ferrari S 2014 Measuring and testing for the systemically important financial institutions Journal of Empirical Finance 2014 vol 25 issue C 1-14 Cerutti E Claessens S Laeven L 2015 The Use and Effectiveness of
Macroprudential Policies New Evidence IMF Working Paper No 1561
Crockett A 2000 Marrying the Micro- and Macro-prudential Dimensions of
Financial Stability Eleventh International Conference of Banking Supervisors
held in Basel 20-21
35
De Santis R (2012) ldquoThe euro area sovereign debt crisis Safe haven credit
rating agencies and the spread of the fever from Greece Ireland and Portugalrdquo
ECB Working Paper 1419
DellrsquoAriccia G Igan D Laeven L Tong H Bakker B Vandenbussche J 2012
Policies for Macrofinancial Stability How to Deal with Credit Booms IMF Staff
Discussion Note 1206
Demirer M Diebold F Liu L Yilmaz K 2017 Estimating global bank network
connectedness Journal of Applied Eeconometrics forthcoming
Diebold F X Yilmaz K 2009 Measuring Financial Asset Return and Volatility
Spillovers with Application to Global Equity Markets The Economic Journal
119(534) 158-171
Diebold F X Yilmaz K 2012 Better to give than to receive Predictive
directional measurement of volatility spillovers International Journal of
Forecasting Issue 28 pp 57-66
Doan T Litterman R Sims CA 1984 Forecasting and Conditional Projections
Using Realistic Prior Distributions Econometric Reviews 3(4) 1ndash 100
Elliott D J Feldberg G Lehnert A 2013 The History of Cyclical
Macroprudential Policy in the United States Office of Financial Research
Working Paper No 8
European Central Bank 2016 Macroprudential Bulletin Issue 12016
Financial Stability Board 2011 Measures to address systemically important
financial institutions
Fontana A Scheicher M 2010 An analyisis of euro area sovereign CDS and
their relation with government bonds ECB Working Paper Series Issue 1271
Fostel A Geanakoplos J 2008 Leverage Cycles and the Anxious Economy
American Economic Review 98 (4) 1211ndash1244 [2196]
36
Geanakoplos J Pedersen L H 2014 Monitoring leverage In Brunnermeier M
K Krishnamurthy A (Eds) Risk Topography Systemic Risk and Macro
Modeling NBER pp 175ndash182
Giannone D Lenza M Primiceri GE 2012 Prior Selection for Vector
Autoregressions CEPR Discussion Papers 8755 CEPR Discussion Papers
Giglio S Kelly B T Pruitt S 2015 Systemic risk and the macroeconomy An
empirical evaluation Journal of Financial Economics 2016 vol 119 issue 3 457-
471
Goacutemez-Puig M amp Sosvilla-Rivero S (2014) EMU sovereign debt markets crisis
Fundamental-based or pure contagion Institut de Recerca en Economia
Aplicada (IREA) Working Papers Universitat de Barcelona 201402
Huang X Zhou H Zhu H 2012 Systemic Risk Contributions Journal of
Financial Services Research 2012 vol 42 issue 1 55-83
International Monetary Fund 2013a The Interaction of Monetary and
Macroprudential Policies Washington International Monetary Fund
International Monetary Fund 2015a Financial Operations
Koumlhler M 2013 Does non-interest income make banks more risky Retail-
versus investment oriented banks Deutsche Bundesbank Discussion Paper
No172013
Koop G Korobilis D 2010 Bayesian Multivariate Time Series Methods for
Empirical Macroeconomics Foundations and Trends in Econometrics Vol 3 No
4 pp 267-358
Litterman Robert B 1979 Techniques of forecasting using vector
autoregressions Research Department Working Paper 115 Federal Reserve
Bank of Minneapolis Minnesota
37
Longstaff F Pan J Pedersen L Singleton K 201 How Sovereign Is Sovereign
Credit Risk American Economic Journal Macroeconomics 2011 vol 3 issue 2
75-103
Pesaran H Shin Y 1998 Generalized impulse response analysis in linear
mulitvariate models Economic Letters 58(1) 17-29
White H Kim TH Manganelli S 2008 Modeling autoregressive conditional
skewness and kurtosis with multi-quantile CAViaR In Russell J Watson M
(Eds) Volatility and Time Series Econometrics A Festschrift in Honor of Robert
F Engle
Part B
We study 77 banks from 26 developed and emerging economies Data are downloaded from Thomson-Reuters and cover the period from January 1st 2008 to June 30th 2017 The first sample contains 77 banks are from 19 developed economies while the rest are from 6 emerging economies (as of IMFrsquos list) The sample contains most of the banks that are designated as ldquoglobal systemically important banksrdquo (ldquoGSIBrsquosrdquo) as designated by the Basel Committee on Banking Supervision except for three Chinese banks (Agricultural Bank of China Bank of China and Industrial and Commercial Bank of China) and one French bank Group BPCE 43 out of the 77 banks (544) in the sample are from Europe while 28 of them (3544) are headquartered in Eurozone members The sample is extended by adding 19 smaller European banks
B Sample Presentation Bank Details Descriptive Statistics Tables 2a and b presents the 77 banks in the sample in the worldrsquos top 150 as they ordered by assets (Q4 2016) Table A3 presents the share of assets that each home-country holds in the sample as well as the share of assets per developed and emerging countries while Table A4 presents the share of assets per region Table A5 presents the 14 European banks that are added to the initial sample
Table 2a Banks ordered by Total Assets (in US $ billion)
Rank Bank Name Country Total assets
38
US$B
1 Bank of China China 2613 2 Mitsubishi UFJ Financial Group Japan 2597 3 JPMorgan Chase amp Co USA 2490 4 HSBC Holdings UK 2374 5 BNP Paribas France 2196
6 Bank of America USA 2187 7 Wells Fargo USA 1930 8 China Development Bank China 1904 9 Credit Agricole Group France 1821 10 Citigroup USA 1792
11 Mizuho Financial Group Japan 1757 12 Deutsche Bank Germany 1682 13 Sumitomo Mitsui Financial Group Japan 1654 14 Barclays PLC UK 1490 15 Societe Generale France 1461
16 Banco Santander Spain 1416 17 Lloyds Banking Group UK 1004 18 Norinchukin Bank Japan 984 19 Royal Bank of Scotland Group UK 981 20 UBS Group AG Switzerland 919
21 Unicredit SpA Italy 908 22 ING Groep NV Netherlands 893 23 Goldman Sachs Group USA 860 24 Morgan Stanley USA 814 25 Credit Suisse Group Switzerland 806
Table 2a ndash Continued from previous page
26 BBVA Spain 773 27 Intesa Sanpaolo Italy 766 28 Commonwealth Bank of Australia Australia 703 29 Rabobank Group Netherlands 700 30 Australia amp New Zealand Banking Group Australia 661
31 Nordea Sweden 651 32 Standard Chartered Plc UK 646 33 Westpac Banking Corp Australia 607 34 National Australia Bank Australia 562 35 Commerzbank Germany 549
36 Danske Denmark 495 37 State bank of India India 492 38 US Bancorp USA 445 39 The Export-Import Bank of China China 427 40 Sberbank of Russia Russia 420
41 Resona Japan 412 42 Sumitomo Mitsui TH Japan 406 43 Nomura Holdings Japan 370 44 PNC Financial Services USA 366 45 Capital One Financial Corporation USA 357
46 DBS Group Holdings Singapore 332 47 Shinhan Financial Group South Korea 328 48 KBC Group NV Belgium 291 49 Svenska Handelsbanken Sweden 289 50 Skandinaviska Enskilda Banken Sweden 289
51 Hana Financial Group South Korea 288 52 Nationwide Building Society UK 276 53 Korea Development Bank South Korea 268
39
54 Woori Bank South Korea 257 55 Landesbank Baden-Wurttemberg Germany 257
56 Cathay Financial Holding Taiwan 252 57 Swedbank Sweden 237 58 United Overseas Bank (UOB) Singapore 235 59 Dexia Belgium 225 60 Banco Sabadell Spain 224
61 Bayerische Landesbank Germany 224 62 Erste Group Bank AG Austria 220 63 Banco Popular Espanol Spain 204 64 Industrial Bank of Korea South Korea 196 65 Bank of Ireland Ireland 182
66 Malayan Malaysia 161 67 Standard Bank Group South Africa 161 68 Banca Monte dei Paschi di Siena Italy 161 69 American Express USA 158 70 National Bank of Greece Greece 153 71 Macquarie USA 143
72 Credit Lyonnais France 120 73 Comercial Portuguese Portuguese 113 74 Banco Espirito Santo Portugal 112 75 Turkiye is bankasi Turkey 112 76 Mediobanca Italy 95
77 Landesbank Hessen Germany 92
Table 2b Banks ordered by Country
Rank Bank Country Total assets
US$B
1 Commonwealth Bank of Australia Australia 703 2 Australia amp New Zealand Banking Group Australia 661 3 Westpac Banking Corp Australia 607 4 National Australia Bank Australia 562
5 Erste Group Bank AG Austria 220
6 KBC Group NV Belgium 291 7 Dexia Belgium 225
8 Bank of China China 2613 9 China Development Bank China 1904
10 The Export-Import Bank of China China 427
11 Danske Denmark 495
12 BNP Paribas France 2196 13 Credit Agricole Group France 1821 14 Societe Generale France 1461 15 Credit Lyonnais France 120
16 Deutsche Bank Germany 1682 17 Commerzbank Germany 549 18 Landesbank Baden-Wurttemberg Germany 257 19 Bayerische Landesbank Germany 224 20 Landesbank Hessen Germany 92
21 National Bank of Greece Greece 153
22 State bank of India India 492
23 Bank of Ireland Ireland 182
24 Unicredit SpA Italy 908 25 Intesa Sanpaolo Italy 766
40
26 Banca Monte dei Paschi di Siena Italy 161 27 Mediobanca Italy 95
28 Mitsubishi UFJ Financial Group Japan 2597 29 Mizuho Financial Group Japan 1757 30 Sumitomo Mitsui Financial Group Japan 1654 31 Norinchukin Bank Japan 984 32 Resona Japan 412 33 Sumitomo Mitsui TH Japan 406 34 Nomura Holdings Japan 370 35 Yamaguchi Financial Group Japan 93
36 ING Groep NV Netherlands 893 37 Rabobank Group Netherlands 700
38 Banco Espirito Santo Portugal 111
39 Sberbank of Russia Russia 420
40 DBS Group Holdings Singapore 332 41 United Overseas Bank (UOB) Singapore 235 42 Standard Bank Group South Africa 161
43 Shinhan Financial Group South Korea 328 44 Hana Financial Group South Korea 288 45 Korea Development Bank South Korea 268 46 Woori Bank South Korea 257 47 Industrial Bank of Korea South Korea 196
48 Banco Santander Spain 1416 49 BBVA Spain 773 50 Banco Sabadell Spain 224 51 Banco Popular Espanol Spain 204
Table 2b ndash Continued from previous page
53 Nordea Sweden 651 54 Svenska Handelsbanken Sweden 289 55 Skandinaviska Enskilda Banken Sweden 289 56 Swedbank Sweden 237
57 UBS Group AG Switzerland 919 58 Credit Suisse Group Switzerland 806
59 Cathay Financial Holding Taiwan 252
60 Turkiye is bankasi Turkey 112
61 HSBC Holdings UK 2374 62 Barclays PLC UK 1490 63 Lloyds Banking Group UK 1004 64 Royal Bank of Scotland Group UK 981 65 Standard Chartered Plc UK 646 66 Nationwide Building Society UK 276
68 JPMorgan Chase amp Co USA 2490 69 Bank of America USA 2187 70 Wells Fargo USA 1930 71 Citigroup USA 1792 72 Goldman Sachs Group USA 860 73 Morgan Stanley USA 814 74 US Bancorp USA 445 75 PNC Financial Services USA 366 76 Capital One Financial Corporation USA 357 77 American Express USA 158 78 Macquarie USA 143
41
Table 3a Banksrsquo home-countries ordered by the sum of total bank assets
Developed Total Assets Developing Total Assets USA 11547 China 4944 Japan 7867 India 492 UK 6936 Russia 420 France 5599 Taiwan 252 Germany 2994 South Africa 161 Spain 2617 Turkey 112
Australia 2534 Italy 1933 Switzerland 1725
Netherlands 1584 Sweden 1467 South Korea 1340 Singapore 568 Belgium 516 Denmark 495 Ireland 344 Austria 220 Greece 153 Portugal 111 Total Assets of banks that are headquartered in
Developed 5055366 Emerging 63823 of total assets 888 of total assets 112
42
Table 3b Regional details
Region Number of Banks Total bank
assets of total
assets
Europe 40 2669673 473
Asia 21 1557658 275
N America 11 1154724 204
Oceania 4 2534 45
Africa 1 161 03
B Data Definitions and Descriptive Statistics
Table 4 Data Definitions
Variable Description
Endogenous CDS CDS 5-year spread
Exogenous Systemic risk
CDX The family of CDS indeces covering North America
VIX The volatiliy index of SampP 500
US 3-month T Bill The short-term obligation backed by the Treasury Dept of the US goverment
Bank-specific Size Total assets
Retail orientation Total Loans Total assets
Diversification Non-interest income Total revenues
NPLs Non-performing loans Total Loans
Country-specific
GDP Each bankrsquos home-country GDP growth
Budget Balance Current AccountGDP
Public Debt Public DebtGDP
43
Table 5 Descriptive Statistics
Panel A Systemic risk factor
CDX VIX TED
Mean 269E-06 -0000123 -000121 Median 0000 -0001 0000 Maximum 0020 0176 0250 Minimum -0009 -0152 -0750
Std Dev 0001 0031 0033 Skewness 4689 0689 -17326
Kurtosis 106047 6789 377496 Jarque-Bera 1105896 1679364 14610377 Probability 0000 0000 0000
Sum 0007 -0304 -3000 Sum Sq Dev 0003 2427 2746
Note CDX and VIX are in log differences TED spread is in first differences
Panel B Bank specific
Assets Loans_to_Assets Non_Interest_Inc NPLs
Mean 732382 55596 2442 4601
Median 458009 59921 2378 2411
Maximum 3030645 8664 8640 35217
44
Minimum 4354387 9070 -5962 01082
Std Dev 7460013 17017 1481 5612
Skewness 1081 -0641 -0694 2376
Kurtosis 30129 2584 6193 9630
Jarque-Bera 7023 272888 182117 999501
Probability 0000 0000 0000 0000
Sum 264E+09 2003702 8803746 1658430 Sum Sq Dev 201E+15 1043392 7908036 1134867
Note Data are in levels
Part C ndash Global Sample
Table 7 Individual systemic importance
Panel A ndash Ranked by total score Rank by score
Rank by bank assets Bank Name
Home-Country Region
Assets (billion
US $) Score
To others (Aggr)
From others (Aggr)
1 27 Intesa Sanpaolo Italy Europe 766 1056 0505 0551
2 16 Banco Santander Spain Europe 1416 1038 0464 0574
3 26 BBVA Spain Europe 773 0987 0454 0533
4 5 BNP Paribas France Europe 2196 0982 0445 0537
5 21 Unicredit SpA Italy Europe 908 0975 0489 0485
6 14 Barclays PLC UK Europe 1490 0961 0454 0507
7 12 Deutsche Bank Germany Europe 1682 0954 0428 0526
8 9 Credit Agricole Group France Europe 1821 0942 0424 0518
9 15 Societe Generale France Europe 1461 0940 0427 0512
10 72 Credit Lyonnais France Europe 120 0938 0445 0493
11 17 Lloyds Banking Group UK Europe 1004 0925 0438 0487
12 25 Credit Suisse Group Switz Europe 806 0907 0376 0531
13 35 Commerzbank Germany Europe 549 0904 0410 0494
14 20 UBS Group AG Switz Europe 919 0890 0387 0503
15 32 Standard Chartered Plc UK Europe 646 0870 0419 0451
16 68 Banca Monte dei Paschi Italy Europe 161 0861 0429 0433
45
17 19
Royal Bank of Scotland Group
UK Europe 981 0845 0423 0423
18 29 Rabobank Group Netherl Europe 700 0841 0376 0465
19 22 ING Groep NV Netherl Europe 893 0823 0374 0449
20 76 Mediobanca Italy Europe 95 0821 0389 0433
21 24 Morgan Stanley USA N Amer 814 0752 0315 0437
22 69 American Express USA N Amer 158 0736 0332 0404
23 6 Bank of America USA N Amer 2187 0716 0318 0398
24 23 Goldman Sachs Group USA N Amer 860 0711 0302 0410
25 10 Citigroup USA N Amer 1792 0706 0313 0393
26 4 HSBC Holdings UK Europe 2374 0695 0372 0323
27 62 Erste Group Bank AG Austria Europe 220 0688 0314 0375
28 49 Svenska Handelsbanken Sweden Europe 289 0678 0281 0397
29 53
Korea Development Bank
S Korea Asia 268 0677 0393 0284
30 60 Banco Sabadell Spain Europe 224 0670 0295 0375
31 36 Danske Denmark Europe 495 0663 0296 0367
32 45
Capital One Financial Corp
USA N Amer 357 0662 0260 0401
33 3 JPMorgan Chase amp Co USA N Amer 2490 0658 0257 0401
34 7 Wells Fargo USA N Amer 1930 0653 0259 0394
35 34 National Australia Bank Australia Oceania 562 0622 0376 0247
Table continued on next page
Table 3- Panel A continued from previous page
36 2 Mitsubishi UFJ Financial Japan Asia 2597 0621 0223 0398
37 47 Shinhan Financial Group S Korea Asia 328 0615 0331 0283
38 54 Woori Bank S Korea Asia 257 0612 0333 0278
39 64 Industrial Bank of Korea S Korea Asia 196 0603 0341 0261
40 28 Commonwealth Bank Australia Oceania 703 0599 0388 0211
41 40 Sberbank of Russia Russia Europe 420 0598 0294 0305
42 30 Australia amp N Zealand Australia Oceania 661 0597 0383 0214
43 50 Skandinaviska Enskilda Sweden Europe 289 0578 0262 0316
44 31 Nordea Sweden Europe 651 0574 0289 0285
45 71 Macquarie USA N Amer 143 0572 0321 0251
46 48 KBC Group NV Belgium Europe 291 0568 0241 0327
47 63 Banco Popular Espanol Spain Europe 204 0558 0297 0261
48 61 Bayerische Landesbank Germany Europe 224 0552 0249 0303
49 39 The Export-Import Bank China Asia 427 0548 0284 0264
50 1 Bank of China China Asia 2613 0548 0276 0272
51 66 Malayan Malaysia Asia 171 0543 0321 0223
52 33 Westpac Banking Corp Australia Oceania 606 0540 0374 0166
53 37 State bank of India India Asia 492 0530 0238 0291
54 51 Hana Financial Group S Korea Asia 288 0518 0290 0227
55 57 Swedbank Sweden Europe 237 0486 0253 0233
56 8 China Development Bank China Asia 1904 0468 0260 0208
46
57 52 Nationwide Building Society UK Europe 276 0463 0217 0246
58 59 Dexia Belgium Europe 225 0409 0197 0212
59 46 DBS Group Holdings Singapore Asia 332 0397 0212 0186
60 65 Bank of Ireland Ireland Europe 182 0379 0197 0182
61 58 United Overseas Bank Singapore Asia 235 0373 0214 0159
62 11 Mizuho Financial Group Japan Asia 1757 0367 0271 0096
63 67 Standard Bank Group S Africa Africa 161 0365 0123 0242
64 74 Espirito Santos Portugal Europe 112 0362 0186 0176
65 41 Resona Japan Asia 412 0357 0263 0094
66 13 Sumitomo Mitsui Financial Japan Asia 1654 0355 0250 0104
67 38 US Bancorp USA N Amer 445 0353 0188 0165
68 55 Landesbank Baden-Wurtt Germany Europe 257 0340 0170 0171
69 42 Sumitomo Mitsui TH Japan Asia 406 0323 0273 0050
70 56 Cathay Financial Holding Taiwan Asia 252 0298 0189 0109
71 73 Comercial Portuguese Portugal Europe 113 0279 0268 0011
72 70 National Bank of Greece Greece Europe 153 0220 0176 0044
73 18 Norinchukin Bank Japan Asia 984 0215 0164 0050
74 43 Nomura Holdings Japan Asia 370 0197 0161 0035
75 77 Landesbank Hessen Germany Europe 92 0159 0089 0071
76 44 PNC Financial Services USA N Amer 366 0078 0034 0043
77 75 Turkiye is bankasi Turkey Europe 112 0037 0030 0007
Note Results concern the period January 2008 ndash June 2017 and are of daily frequency
Table 9 Systemic contribution per bank (January 2008 ndash June 2017)
Rank Bank Name SC Rank Bank Name SC Rank Bank Name SC Rank Bank Name SC
1 Intesa Sanpaolo
225 21 Morgan Stanley 160 41 Sberbank of Russia
128 61 United Overseas
080
2 Banco Santander
221 22 American Express
157 42 Australia amp N Zealand
127 62 Mizuho Financial
078
3 BBVA 210 23 Bank of America
153 43 Skandinaviska Enskilda
123 63 Standard Bank Group
078
4 BNP Paribas 209 24 Goldman Sachs Group
152 44 Nordea 122 64 Espirito Santos
077
5 Unicredit SpA
208 25 Citigroup 151 45 Macquarie 122 65 Resona 076
6 Barclays PLC 205 26 HSBC Holdings 148 46 KBC Group NV
121 66 Sumitomo Mitsui
076
7 Deutsche Bank
203 27 Erste Group 147 47 Banco Popular
119 67 US Bancorp
075
8 Credit Agricole
201 28 Svenska 145 48 Bayerische Landesbank
118 68 Landesbank 072
9 Societe Generale
200 29 Korea Development Bank
144 49 The Export-Import
117 69 Sumitomo Mitsui TH
069
10 Credit Lyonnais
200 30 Banco Sabadell 143 50 Bank of China 117 70 Cathay Financial
064
11 Lloyds Banking
197 31 Danske 141 51 Malayan 116 71 Comercial Portuguese
059
47
12 Credit Suisse Group
193 32 Capital One Financial Corp
141 52 Westpac Banking Corp
115 72 NBG 047
13 Commerzbank 193 33 JPMorgan Chase amp Co
140 53 State bank of India
113 73 Norinchukin Bank
046
14 UBS Group AG 190 34 Wells Fargo 139 54 Hana Financial Group
110 74 Nomura Holdings
042
15 Standard Chartered
186 35 National Australia Bank
133 55 Swedbank 104 75 Landesbank Hessen
034
16 Banca Monte dei
184 36 Mitsubishi UFJ Financial
132 56 China Development
100 76 PNC Financial Services
017
17 RBS 180 37 Shinhan Financial Group
131 57 Nationwide Building
099 77 Turkiye is bankasi
008
18 Rabobank Group
179 38 Woori Bank 130 58 Dexia 087
19 ING Groep NV 175 39 Industrial Bank of Korea
129 59 DBS Group Holdings
085
20 Mediobanca 175 40 Commonwealth Bank
128 60 Bank of Ireland
081
2
1 Introduction Macroprudential policy entails bank supervision from a system-wide
perspective rather than that of the individual institution The objective is to
limit the risk of system-wide financial crisis as well as to contain the costs to the
real economy if a crisis erupts In order to ensure that each institution pays for
the externality it imposes on the global system the measures applied to each
bank should be calibrated to the systemic importance of each bank In this
paper we provide a measure of systemic importance of all banks that issue
publicly traded CDS contracts among the worldrsquos biggest 150 banks for the
period January 2008 to June 2017 We capture systemic importance by the
intensity of spillovers of daily CDS movements This measure captures
institutional externalities such as ldquotoo big to failrdquo or ldquotoo correlated to failrdquo
We obtain some strong and in some respects surprising results A bankrsquos
systemic importance is not adequately captured by its size In addition there is a
considerable number of banks officially designated as GSIBs that are not ranked
in the first quartile in terms of our novel measure of systemic importance3
Throughout the examined period European banks have been the main source of
global systemic risk with strong interconnections to US banks Looking at the
time dimension for global systemic risk we identify periods of increased
interconnections among banks during which systemic and idiosyncratic shocks
are propagated more intensely via the network Using principal components
analysis we identify a single dominant factor associated with fluctuations in
banksrsquo CDS spreads Individual banksrsquo exposure to this factor is related to their
3 See FSB (2013) for a description of the methodology for assessing the systemic importance of global systemically important banks (GSIBs) and the higher loss absorbency requirements imposed on them
3
governmentrsquos ability to support them and to their retail orientation but not to
their size
Our novel measure of bank systemic importance identifies separately the
degree of externalities originating in a bank from its vulnerability to the system
Externalities are captured by the degree to which a shock experienced by a bank
is propagated to each individual bank in the global bank system Vulnerability is
captured by the shocks it receives from each bank in the global system In
particular we find that more systemically important banks display relatively
higher externalities than vulnerability to the global system This decomposition
better allows the macroprudential supervisor to differentiate the ldquocurerdquo
according to the individual bankrsquos systemic ldquodiseaserdquo The ldquocurerdquo usually
consists of a combination of capital requirements quantitative restrictions and
supervisory review actions Arguably this is an improved approach to
safeguarding financial stability
Our methodology is based on two pillars First we use market information
incorporated in CDS spreads as a reduced-form measure of the linkages among
banks4 CDS spreads are a better measure of credit risk than bond spreads
equity returns or other market variables Second we use Bayesian VAR to
confront the high dimensionality of bank networks Past work on this topic had
to limit attention to a subset of global banks because of the dimensionality
problem5 The closest to our approach is Alter and Beyer (2012) which builds
upon the framework of Diebold and Yilmaz (2009 2012) We deviate from
4 These linkages may arise from correlated exposures counterparty relationships or other structural channels 5 There are two exceptions that address the dimensionality problem using LASSO methods applied to stock return data Demirer et al (2017) for the global bank system and Basu et al (2016) for the US financial system
4
common practice in the literature by removing any market-wide shocks through
the inclusion of a set of common external systemic variables Thus we allow
each bank to become a source of systemic risk after idiosyncratic shocks through
spillovers
The remainder of this document is structured as follows Section 2 presents
the existing literature and section 3 describes the process of measuring systemic
risk the existing frameworks and the motivation Section 4 presents the
methodology and the data while section 5 presents the results and section 6
concludes
2 Relevant Literature
Our paper is closely related to four literature strands First it is related to
studies concerning macroprudential policy The aim of macroprudential policy is
to increase the resilience of individual financial institutions and of the financial
system as a whole by limiting the build-up of vulnerabilities in order to mitigate
systemic risk (ECB 2016) It is also used to smooth-out the financial cycle
driven by fluctuations in credit leverage and asset prices which may otherwise
result in a pattern of boom and bust (DellrsquoAriccia et al 2013 Elliot et al 2013
Cerutti et al 2015) Appropriate policies should be designed toward limiting the
ex ante externalities that lead to an excessive build-up of systemic risk and the
ex post externalities that can generate inefficient failures of otherwise sound
institutions in a crisis All in all macroprudential policy is the usage of primarily
prudential tools to limit systemic risk (Crockett 2000 FSBIMFBIS 2011 IMF
2013) The literature on macroprudential policy is growing at a fast pace but is
still at an early stage and historical experience is thin The most relevant part of
5
the literature aims at assessing the systemic importance of G-SIBs The most
important framework is the one developed by Basel Committee on Banking
Supervision (BCBS) The framework compares each bankrsquos activity over twelve
indicators and finally assigns a score to each bank The indicators include the
size the interconnectedness the substitutability the complexity and the cross-
jurisdictional activity of each bank
The BCBS methodology has also been used by Financial Stability Board for
the identification of G-SIBs This methodology has been transposed in the EU
regulatory framework (see Article 131 of the Capital Requirements Directive IV
(CRDIV)) which defines global systemically important institutions or G-SIIs The
BCBSFSB framework for determining systemic risk has some deficiencies It
assigns primal importance to size as all bank characteristics considered are
directly related to size This is a premise that is not necessarily backed by
empirical evidence that the biggest banks are the most dangerous ones for
financial stability In addition the weights assigned to the characteristics are
arbitrary Finally it does not provide any information on the degree of
externalities between a systemically important bank and any other one in the
system Our contribution is to use direct observations on credit risk to measure
externalities between any two banks in the global system In this way we
quantify the degree of danger that any bank may pose to the financial system or
parts of it defined broadly or narrowly Our methodology flexibly updates the
classification dynamically as new information is obtained
The second relevant field of literature has to do with the alternative systemic
risk rankings for financial institutions There is an important number of
methodologies for calculating the exposure of financial institutions to changes in
6
current economic conditions how concentrated the risks are among the financial
institutions and how closely linked they are with each other The first stream has
to do with price-based systemic risk rankings such as banksrsquo VaR (Adams Fuss
and Gropp 2014 White Kim and Manganelli 2015) ∆CoVaR (Adrian and
Brunnermeier 2014 Castro and Ferrari 2014) and MES (Acharya Pedersen
Philippon and Richardson 2010) These measure the VaR or MES of financial
institutions conditional on the entire set of institutions performing poorly The
second group of such metrics incorporates book values as well and includes
SRISK (Acharya Engle and Richardson 2012 Brownlees and Engle 2010)
leverage ratio (Fostel and Geanakoplos 2008 Geanakoplos and Pedersen 2014)
and CAPM beta times market capitalization (Benoit Colliard Hurlin and
Perignon 2015) Finally the distressed insurance premium (DIP) by Huang et al
(2012) measures the insurance premium required to cover distressed losses in
the banking system These closely related approaches have a key weakness
which is that they do not provide information on the pairwise directional
connectedness ie the direction of externalities between any two banks in the
global system In response to this shortcoming some papers (see Billio et al
2012) use Granger causality as a tool to uncover directionality However
Granger causality is unable to consider contemporaneous movements control
for exogenous variables quantify intensities of effects or consider multi-
dimensional networks These are all aspects that our methodology and measure
enables
The third group of relevant papers deals with the estimation of high-
dimensional VAR models Our approach is closely related to the approach
developed by Alter and Beyer (2013) which is based on the framework of
7
Diebold and Yilmaz (2009 2011) The high-dimensionality problem had forced
this research on global bank connectedness to limit their analysis to small
samples of banks Needless to say this is not appropriate when considering bank
importance for the global system A relevant methodology has been recently
suggested by Demirer Diebold Liu and Yilmaz (2017) who use LASSO methods
to shrink select and estimate the high-dimensional network linking the publicly-
traded subset of global banks In a similar vein Basu et al (2017) use Lasso
penalized Vector Autoregressive model to estimate a model that leverages a
system-wide approach to identify systemically important financial institutions in
the US Our distinct approach is to use Bayesian VAR in order to resolve the
dimensionality problem
Finally our paper relates to studies that apply principal components
methods to analyze systemic risk Billio et al (2012) suggested that an
important symptom of systemic risk is the presence of sudden regime shifts
Giglio et al (2015) proposed dimension-reduction estimators for constructing
systemic risk indexes from the cross section of measures and prove their
consistency in a factor model setting We differ by examining the individual bank
loadings on the dominant factor associated with fluctuations in bank CDS
spreads and determining which bank and country characteristics are related to
these This provides solid empirical basis for using relevant characteristics as
indicators to measure systemic importance indirectly
3 Definition of Systemic Importance
8
Systemic risk may originate in an endogenous build-up of financial
imbalances possibly associated with a booming financial cycle large aggregate
shocks hitting the economy or the financial system or contagion effects across
markets intermediaries or infrastructures Our study focuses on contagion
among banks and measures the systemic importance of a bank by the amount of
spillovers it receives from and sends to the rest of the banking system According
to Allen et al (2012) contagion refers to the risk that the failure of one financial
institution leads to the default of others through a domino effect in the interbank
market the payment system or through asset prices More precisely we adopt
the ldquopure-contagionrdquo (Gomez-Puig and Sosvilla Rivero 2013) definition by
controlling only for external common factors through the inclusion of a set of
common external systemic risk factors and assume that each bank could become
itself a source of systemic risk as a result of an idiosyncratic shock
The following example illustrates how we measure the systemic importance
of banks (see Figure 1) Assume that there exist three banks Focusing on bank A
as the source of shocks figure 1 presents the potential impact of an idiosyncratic
shock on bank A to bank B and to bank C respectively Bank A sends a ten-unit
shock to B and a seventeen-unit shock to C a total of 27 Next we focus on the
shocks received by bank A from the other banks in the system Bank A receives a
twenty-one-unit shock from bank B and a five-unit shock from bank C a total of
26 If we sum the shocks that bank A sends to and receives from the system we
obtain an estimate of the degree of connectedness for bank A This is a valid
measure of bank Arsquos systemic importance This procedure is repeated in order to
calculate the systemic importance of bank B and bank C
9
Figure 1 Example of pairwise directional connectedness
Transforming this figure into a table we construct the directional
connectedness matrix
Table 1 Directional connectedness matrix
ShockResponse Bank A Bank B Bank C To Others (Sum_Out)
Bank A - 10 17 27
Bank B 21 - 28 49
Bank C 5 19 - 24
From Other(Sum_In) 26 29 45 100
Score (Sum_Out+Sum_In) 53 78 69
Note Variables in the first column are the impulse origin while variables on the top row are the respondents to the shock
Table 1 presents the entire picture for all three banks in the system Shocks
emanate from row banks to column banks Each row shows the contagion effects
of an equal-sized impulse to the relevant bank in the first column In the last
column we aggregate the total externality effects of each row bank The columns
provide the picture of vulnerability of each bank to shocks in different banks
10
The second to last row is a measure of total vulnerability of a bank to all other
banks in the system It contains the answer to the question ldquoIf all other banks in
the system experienced an idiosyncratic shock of 100 basis points what would
be the impact on bank Xrdquo In the bottom row we aggregate the total externality
effect and the total vulnerability effect of each bank In other words we lump
together shocks sent and received by an individual bank as a measure of total
individual bank connectedness In calculating a bankrsquos systemic importance we
assign equal weights to shocks it sends as to shocks it receives as we are
agnostic as to whether one source of systemic instability is more dangerous than
the other
There are two aspects of financial contagion due to a bankrsquos participation in a
banking system that are of relevance to regulators externalities emanating from
a bankrsquos failure and individual bank vulnerability to financial contagion Both
components are important for regulators but their importance may not be equal
If they are of equal importance then the regulator would consider the sum of
these two However the clear decomposition in Table 1 as well as in our
econometric method allows the regulator to assign different weights in order to
capture the appropriate measure of systemic importance
4 Data and Methodology
41 Data
We study 77 banks from 19 developed and 7 emerging economies Our
selection procedure is as follows We started with the list of the worldrsquos top 150
banks in terms of total assets in Q42016 Using bank names we matched 77
banks to CDS prices from Thomson-Reuters Datastream and Bloomberg CDS
11
spreads cover the period from January 2008 to June 2017 and are at daily
frequency The sample contains all the banks that are designated as ldquoglobal
systemically important banksrdquo (ldquoGSIBrsquosrdquo) by the Basel Committee on Banking
Supervision except for three Chinese banks (Agricultural Bank of China Bank of
China and Industrial and Commercial Bank of China) and one French bank
(Group BPCE) Table 2a (in the Appendix) classifies banks by assets and provides
detail on the 77 banks in the sample such as home-country and total assets
while table 2b (in the Appendix) classifies banks by home-country We note that
40 out of the 77 banks (52) in the sample are from Europe while 28 of them
(34) are headquartered in Eurozone members Tables 3a and 3b (in the
Appendix) provide the regional characteristics of the sample
411 Systemic Risk factor
We will allow for the presence of a global systemic risk factor This permits
us to interpret robustly the results obtained from our model Longstaff et al
(2011) for instance has argued that credit risk appears related to global rather
than country-specific factors while Aizenman et al (2013) has established the
importance of international economic factors in the pricing of credit risk The
variables we chose to employ in order to capture global financial risk conditions
have been widely used in related studies as control variables (see among others
De Santis 2012 Aizenman et al 2013 Ang and Longstaff 2011) The global
default risk conditions are represented by the CDX which is the family of CDS
indices covering North America the VIX volatility index which captures the
global capital marketsrsquo ldquofearrdquo condition and the global liquidity conditions which
is represented by the US 3-month treasury bills The systemic factor is assumed
12
to affect the endogenous variables contemporaneously Table 4 contains the
variable definitions and Table 5 provides descriptive statistics
412 Bank-specific characteristics
A variety of bank- and country-specific variables are used for identifying the
determinants of systemic risk fluctuation over time The first bank-specific
variable is bank size expressed as each bankrsquos total assets (in log) According to
BIS (2011a) the larger a bank is the more likely it is to receive a bailout package
In this sense we also take into consideration the ldquotoo-big-to-failrdquo (TBTF) issue
(Acharya et al 2013) The second bank-specific variable is the loan-to-asset
ratio which provides information on the bankrsquos retail orientation Ayadi et al
(2011) and Koumlhler (2013) suggest that retail-orientated banks appeared to be
less risky than other banks during the recent financial crisis Also according to
Altunbas et al (2011) the non-interest income over total revenue is considered
to be a measure of each bankrsquos diversification since the less a bank relies on
interest income the less exposed the bank is to a negative shock Finally we
include each bankrsquos nonperforming loans over total loans (see Tables 4 and 5)
413 Country-specific characteristics
It is important to include country-specific factors since the impact of
macroprudential policy might differ depending on the underlying economic
conditions of each bankrsquos home country For example the impact of shocks may
be larger for economies that were under stress and hence rely more on rescue
packages and foreign financing (IMF 2015a) These economies would not have
the same ability to support effectively their banking systems in times of distress
13
We investigate the role of sovereigns by searching among each bankrsquos home-
country GDP growth the primary surplus over GDP and public debt over GDP
42 Connectedness matrix
We estimate a VARX model with two lags (p=2) for the endogenous variables
and contemporaneous exogenous variables (q=0)
The vector of endogenous variables (y) consists of log differences of daily CDS
spreads for the 77 banks By including the exogenous variables we account for
common factors that affect at the same time all bank CDS spreads (Bekaert et al
2005)
421 Bayesian VAR
The suggested model has many more parameters than observations overfits
the data in-sample and as a consequence could perform poorly Researchers
working in the relevant literature typically use prior shrinkage on the
parameters to overcome such over-parametrization concerns Most flexible
Bayesian priors that result in shrinkage of high-dimensional parameter spaces
rely on computationally intensive Markov Chain Monte Carlo (MCMC) methods
Their application to recursive forecasting exercises can as a consequence be
prohibitive or even infeasible The only exception is a variant of the Minnesota
prior that is based on the natural conjugate prior an idea that has recently been
exploited by Banbura Giannone and Reichlin (2010) and Giannone Lenza and
Primiceri (2012) among others While this prior allows for an analytical formula
ttttt uXBYAYAaY 122110
14
for the posterior there is a cost in terms of flexibility in that a priori all VAR
equations are treated in the same manner see Koop and Korobilis (2010) for a
further discussion of this aspect of the natural conjugate prior
The traditional ldquoMinnesota priorrdquo an empirical-Bayes prior which is due to
Littermann (1979) and co-authors (see eg Doan Litterman and Sims 1984)
still dominates many applications of VAR models in economics The recent
contribution of Giannone Lenza and Primiceri (2012) provides guidance on
selecting the prior hyperparameter controlling shrinkage of the VAR coefficients
Note that computational simplicity is a priority in this paper so that the
Gibbs sampler is preferred compared to other potentially more powerful and
elegant Markov Chain Monte Carlo (MCMC) and Sequential Monte Carlo (SMC)
algorithms for prior selection However we recognize that the flexibility of
choosing the prior freely is one of the main controversial issues associated with
Bayesian analysis and the reason why some researchers view the latter as
subjective It is also the reason why the Bayesian practice especially in the early
days was dominated by non-informative priors as these priors assign equal
probabilities to all possible states of the parameter space with the aim of
rectifying the subjectivity problem We estimate the coefficients of a VAR(2) for
78 banks using the arithmetic returns of each bankrsquos CDS As we explained
above a key concern of users of Bayesian statistics and criticism by critics is the
dependence of the posterior distribution on onersquos prior and for this reason we
specify hyperparameters for the prior
The Bayesian VAR(p) model can be written as
119910119905 = 1198860 + sum 119860119895119910119905minus119895 + 120576119905
119901
119895=1
15
where yt for t = 1 T is an M x 1 vector containing observations on M time series
variables εt is an M x 1 vector of errors α0 is an M x 1 vector of intercepts and Aj
is an M x M matrix of coefficients We assume εt to be iid N (0 Σ) Exogenous
variables are added to the VAR and included in all the derivations below but we
do not do so to keep the notation as simple as possible
422 The connectedness matrix framework
The construction of the diagnostic tool is based on a medium-size Bayesian
vector autoregressive model with exogenous variables (Bayesian VARX) that
accounts for common global and regional trends and is able to include even
bank-specific characteristics Then similar as the framework described by
Diebold and Yilmaz (2009 2012) and the one described by Alter and Beyer
(2013) we construct the spillover matrix in order to capture any potential
spillovers among banks This methodology relies on Generalized Forecast Error
Variance Decomposition (GFEVD) or on Generalized Impulse Response
Functions (GIRF) obtained as shown in Pesaran and Shin (1998) Therefore we
derive Generalized Impulse Response Functions as functions of residuals
together with the interdependent coefficients According to Alter and Beyer
(2012) it is of low importance which methodology we select since they produce
qualitatively similar results
16
Table 6 Contagionconnectedness matrix
Note Variables in the first column are the impulse origin while variables on the top row are the respondents to the shock The cumulative impact is bound between 0 and 1 A value of 05 means that the response variable would be impacted in the same direction with an intensity of 50 the initial unexpected shock in the impulse variable The last column presents the aggregated impact sent (Sum OUT) by each row variable and on the bottom row the aggregated spillover received (Sum IN) by each column variable The bottom-right cell shows total spillover in the system and by dividing this value to the total number of non-diagonal cells we obtain the connectedness index (CI)
In table 2 row variables are the origin of the unexpected shock Column
variables are the respondents of contagion receivers CI represents the
connectedness index calculated as the average response in the contagion matrix
The potential contagion effects are aggregated on each line and column and
represent the total to_others and the total from_others as potential contributions
to contagion from and to each bank The main diagonal values represent the
effect of a variablersquos shock on itself and they are excluded from any calculations
The possible contagion effects answer the question ldquoHow would bank B evolve in
the following period if bank A CDS increases by one unit shockrdquo
We use accumulated Impulse Response functions over a 10-step horizon (10-
days) Not all the banks respond to the shocks within the same period but the
majority of the shocks are absorbed within 10-days Nevertheless the
framework is flexible and it easily adapts to the needs of each study
5 Empirical results
17
51 Individual bank connectedness
We estimate the connectedness matrix as described in section 422 for the
whole sample period 1 January 2008 to 31 June 2017 and estimate the
individual bank connectedness (table 7) which reports several notable results
The evidence do not offer support to the argument that systemic importance of a
bank can be adequately captured by its size According to table 7 the bank that
creates the most systemic risk in the system is Intesa Sanpaolo a medium-sized
European bank that is ranked 27th in terms of total assets with total contagion
effects of 1056 which is further decomposed into 0505 vulnerability-score and
0551 externalities-score For instance the Intesa Sanpaolorsquos 0551 externalities
score implies that one-unit shock in Intesa Sanpaolo will have an impact of
551 to the system while the 0505 vulnerability score means that one-unit
shock to the market will affect Intesa Sanpaolo by 505 Among the top-20
most connected banks can also be found smaller banks like BBVA (3rd) Credit
Lyonnais (10th) Banca Monte dei Paschi (16th) and Mediobanca (20th) while the
largest bank in the sample is listed 50th in terms of systemic importance
The existing literature on the topic suggests that during crises periods large
banks behave differently than small or medium-sized banks (Laeven et al 2014)
This phenomenon could be partially attributed to some common characteristics
that are shared by large banks and are associated with higher levels of risk
namely the increased portion of market-based activities the reduced capital
adequacy the less stable funding and the higher organizational complexity
However it remains unidentified the bank-size threshold above or below which
these criteria are valid Results presented in table 8 provide a more narrow
response to the question whether systemic importance is related to size or not
18
Size per se is a determinant of systemic importance since when banks are
ranked by systemic importance the first quartile compiles the largest percentage
of total assets (34 of total assets) However when the sample is ranked by total
assets and not in terms of connectedness the first quartile represents 62 of
total assets indicating a severe leakage of assets to the other quartiles and
revealing the existence of structural variables that interact with size
The existing frameworks used by regulators and policy makers such as the
BCBSFSB framework rely heavily on size either through size-related indicators
or size per se to calculate the capital adequacy ratios Our results suggest that
the measures taking strong size-effect as granted should also focus on the large
banksrsquo idiosyncratic characteristics that place 50 of G-SIBs in the first quartile
of systemic importance
Table 8 Banks ranked by systemic importance and by assets ndash Number of banks per quartile
Quartile ranked by Number of G-SIBs per quartile
Score Assets
1st Quartile 34 62 48
2nd Quartile 33 224 28
3rd Quartile 18 105 10
4th Quartile 14 51 14
The next step is to calculate the systemic contribution of each bank in the
system as the ratio between the total individual contagion effects and the total
contagion in the system
100TC
TICTSC i
i
y
y
19
TSC is the total systemic contribution TIC is the total individual contagion
effects and TC is the total contagion in the system The bank with the highest
ranking contributes 225 of the total contagion effects while the bank at the
bottom of the table contributes almost 0 (table 9) This measure allows us to
compare the results among samples with different number of entities
We define each bankrsquos directional connectedness as the ratio between the
individual externalities and the total individual contagion
100
i
i
i
y
yOUT
yOUTTIC
IEID or
100
i
i
i
y
yIN
yINTIC
IVID
ID is the individual directionality IE is the individual externalities IV is the
individual vulnerabilities and TIC is total individual contagion The followings
should be always valid
1 ii yINyOUT IDID
ii yINyOUT IDID
In case iyOUTID is larger than 50 it means than the bank that the systemic score
of the bank it refers to is externalities-driven When breaking the results into
quartiles that represent the average individual directionality for all the banks
that belong in this quartile (table 10) we realize that banks with higher TIC tend
to have higher iyOUTID ratios (54) that their peers that belong in the last
quartile (30) We do not suggest that the directionality of contagion
determines the systemic importance of banks because this is beyond control and
difficult to interpret but that in terms of systemic importance that may be
20
interpreted into increased capital requirements is ldquobetter to receive shocks than
to send shocks to the systemrdquo
Table 10 Average Individual Directionality (OUT) per quartile
iyOUTID
1st Quartile 54
2nd Quartile 53
3rd Quartile 47
4th Quartile 30
Note banks are ranked by systemic importance
52 Regional network connectedness
Prior quantifying the transmission of contagion effects we focus on table 7
that reveals a very strong regional effect This is that the first quartile of systemic
importance is exclusively dominated by banks that are headquartered in Europe
implying the existence of a regional component and severe clustering Table 11a
shows the regional concentration per quartile and table 11b expresses the
regional concentration as a percentage of the total number of banks that exist
per region
Table 11a Concentration of banks per region
Quartile Europe Eurozone (as
of EU) N America Asia Oceania Africa
1st Quartile 100 75 - - - -
2nd Quartile 25 25 40 25 10 -
3rd Quartile 50 50 10 30 10 -
4th Quartile 35 75 12 48 - 5
Table 11b Regional concentration as a percentage of total banks per region
21
Quartile Europe N America Asia Oceania Africa
1st Quartile 47 - - - -
2nd Quartile 12 73 25 25 -
3rd Quartile 21 9 35 75 -
4th Quartile 16 18 40 - 100
The next step is to understand the flows of shocks among the different
regions the contagion effects and the degree of connectedness among the
different regions (Table 12a and b) We focus on four regions Europe North
America (expressed by US banks) Asia and Oceania Table 12a shows regionrsquos A
externalities to the other regions as a percentage of regionrsquos A total externalities
while table 12b focuses on the vulnerabilities side Combining the information
obtained by tables 12a and b European and US appear to be strongly
interconnected More precisely 58 of the aggregate shocks that are sent by US
banks are directed to Europe while 64 of the aggregate shocks received by US
banks are generated in Europe Also another important finding is that 69 of
the aggregate shocks that are sent by European banks remain within Europe
Table 12a Shocks sent per region as of total shocks sent per region
Asia Europe NAmerica Oceania
Sum
Asia 41 41 9 9
100
Europe 16 69 960 540
100
NAmerica 1950 58 16 650
100
Oceania 33 4450 950 12
100
22
Table 12b Shocks received per region as of total shocks received per region
Asia Europe NAmerica Oceania
Asia
28 10 13 21
Europe
54 75 64 59
NAmerica
12 12 20 13
Oceania
6 3 3 7
Sum
100 100 100 100
All in all it is obvious that there exists a regional factor that affects
significantly the bank connectedness However it is interesting to find out the
driving forces of this regional component especially in the case of Europe which
has been a special case due to the different transmission channels of the financial
crisis the highly interconnected banking system the feedback loops among
sovereigns and banks and the contagion from one country to the rest of Europe
53 National banking system connectedness
We approach the national banking system first of all by calculating the
average systemic risk per bank for each one of the countries in the sample
(Figure 2) Four out of the first five banks that contributed the most to the global
systemic risk belong to Eurozone French banks contributed the most to
systemic risk while Italy and Spain both of which suffered from banking
systems in distress followed at close range Banks in non-Euro-area countries
like Swiss and UK banks played an important role as well Surprisingly the
average contagion effects for German banks place them almost in the middle of
the table indicating that German banking system may acted as a stability factor
for the European region Both Portuguese and especially Greek banking system
appeared to be isolated from the global banking system
23
Figure 2 Average systemic risk per bank ndash Own shocks are excluded
Note results concern the period January 2008-June 2017
In figure 3 we approach the total contagion from a different perspective by
presenting the total contagion effects for each sovereign This approach may
depends on the number of banks per sovereign but illustrates that US-European
cluster dominates in terms of systemic importance
Figure 3 National systemic risk ndash Own shocks are excluded
Note results concern the period January 2008-June 2017
53 Rolling window
000
010
020
030
040
050
060
070
080
090
100
Fra
nce
Ital
y
Swit
z
Net
her
l
Spai
n
UK
Au
stri
a
Den
mar
k
S K
ore
a
USA
Ru
ssia
Au
stra
lia
Ger
man
y
Swed
en
Mal
aysi
a
Ind
ia
Ch
ina
Bel
giu
m
Sin
gap
ore
Irel
and
S A
fric
a
Jap
an
Po
rtu
gal
Tai
wan
Gre
ece
Tu
rkey
000
100
200
300
400
500
600
700
USA U
K
Fra
nce
Ital
y
Spai
n
S K
ore
a
Ger
man
y
Jap
an
Au
stra
lia
Swed
en
Swit
z
Net
her
l
Ch
ina
Bel
giu
m
Sin
gap
ore
Au
stri
a
Den
mar
k
Po
rtu
gal
Ru
ssia
Mal
aysi
a
Ind
ia
Irel
and
S A
fric
a
Tai
wan
Gre
ece
Tu
rkey
24
531 Individual Banks
In order to better understand the evolvement of systemic risk and how this
fluctuated over the whole period we use rolling-window analysis where the
length of the window is 340 days and the step is 150 days Figure 3 presents the
evolution of total contagion over time where strong co-movement and
interconnections among banks are obvious We also discriminate periods where
the cluster of TCI lines is shrinking and systemic risk is becoming more unified
which means that systemic and idiosyncratic shocks are propagated more
intensely via the network
Figure 3 Total Individual Contagion
Note The length of the window is 340 days and the step is 150 days
We introduce the range as a new metric of systemic risk unification Range at
each point in time is defined as the difference between the highest and the
lowest score in the system (Figure 4) The lowest the score the more unified the
000
020
040
060
080
100
120
Jan
-08
May
-08
Sep
-08
Jan
-09
May
-09
Sep
-09
Jan
-10
May
-10
Sep
-10
Jan
-11
May
-11
Sep
-11
Jan
-12
May
-12
Sep
-12
Jan
-13
May
-13
Sep
-13
Jan
-14
May
-14
Sep
-14
Jan
-15
May
-15
Sep
-15
Jan
-16
May
-16
Sep
-16
Jan
-17
May
-17
25
systemic risk is becoming Given the predictive power of CDS spreads this new
measure could be used by regulators and policymakers as an early-warning tool
However it remains an open question what is the threshold below which the
unification of systemic risk could consist a problem It is remarkable that the
most ldquolooserdquo links were observed during the post-Lehman collapse in late 2008
and reached its lowest price at the beginning of Greek crisis
Figure 4 Systemic risk range
Note The length of the window is 340 days and the step is 150 days
532 Global banking system
In this part we are interested in understanding the behavior of aggregate
contagion effects Total Systemic risk (TSR) is defined as the total of the off-
0
01
02
03
04
05
06
07
08
09
1
Jan
-08
May
-08
Sep
-08
Jan
-09
May
-09
Sep
-09
Jan
-10
May
-10
Sep
-10
Jan
-11
May
-11
Sep
-11
Jan
-12
May
-12
Sep
-12
Jan
-13
May
-13
Sep
-13
Jan
-14
May
-14
Sep
-14
Jan
-15
May
-15
Sep
-15
Jan
-16
May
-16
Sep
-16
Jan
-17
May
-17
26
diagonal entries in the connectedness matrix or as the sum of the ldquofromrdquo column
or ldquotordquo row measures total connectedness
N
ijji
H
ij
H IRTSR 1
We could plot a moving contagion measure defined as the sum of all IRFs ldquoto
others but we go one step further and we choose to present the Total Contagion
index (TCI) which is calculated as the average response per bank in the
connectedness matrix and is calculated as the sum of all non-diagonal cells
divided by the total number of entities
N
i j yy jiIR
NTCI
1 1
1
Cumulative IRs interval is [01] the index will be bound between 0 and 100
Higher contagion index implies a tightening of the nexus among banks (Figure
5)
Figure 5 Total Connectedness (TC)
Note The length of the window is 340 days and the step is 150 days
000
500
1000
1500
2000
2500
3000
3500
4000
4500
Jan
-08
May
-08
Sep
-08
Jan
-09
May
-09
Sep
-09
Jan
-10
May
-10
Sep
-10
Jan
-11
May
-11
Sep
-11
Jan
-12
May
-12
Sep
-12
Jan
-13
May
-13
Sep
-13
Jan
-14
May
-14
Sep
-14
Jan
-15
May
-15
Sep
-15
Jan
-16
May
-16
Sep
-16
Jan
-17
May
-17
27
Total connectedness reached its peak after Lehman collapse and was
severely affected by the developments in the European banking and sovereign
debt markets that shocked some EU member countries until mid-2012 The
Greek crisis and then the fact that in the early 2011 Italy and Spain joined the
countries with stressed banking systems pushed total connectedness upwards
After the early 2012 the actions taken by the ECB constrained total contagion
but after early 2015 higher political uncertainty following the outcomes of the
UK referendum on EU membership and the US election as well as market
concerns about euro area banksrsquo longer-term profitability prospects played their
role and contributed to the severe increase in the index At the same time
continued accommodative monetary policy in advanced economies and abating
market concerns about the possibility of a sharp slowdown in China have
dampened spikes in systemic stress Also a major concern for global markets
was the crisis in Deutsche Bank and its deep connections to global financial
institutions
From a policy perspective the most pressing issue for euro area financial
institutions remains the high level of NPLs which needs to be addressed The
resolution of systemic NPL problems will take time and requires a
comprehensive strategy involving coordination of all relevant stakeholders
533 Rolling Window ndash Regional Systemic Contribution (RSC)
We calculate the systemic contribution of each region as the ratio between
the total regional contagion effects and the total contagion in the system We
focus on Europe North America (US) and Euro-area since these regions
28
dominated in terms of systemic risk during the period Figure 8 compares the
systemic contribution of these regions Surprisingly the share of systemic risk
that European banks hold increased after 2014 while the contribution of US
banks remains increasingly lower than European banksrsquo contribution after mid-
2012 The difference between the systemic contribution of European and US
banks fluctuates between 40 and 55
Figure 8 European US and Euro-area banksrsquo contribution to total systemic risk
(as a of total systemic risk)
Note US banksrsquo contribution is presented in secondary axis
54 Principal Component Analysis
We use PCA analysis in which the banksrsquo CDS spreads are decomposed into
orthogonal factors of decreasing explanatory power to identify the increased
000
500
1000
1500
2000
2500
000
1000
2000
3000
4000
5000
6000
7000
8000
Jan
-08
May
-08
Sep
-08
Jan
-09
May
-09
Sep
-09
Jan
-10
May
-10
Sep
-10
Jan
-11
May
-11
Sep
-11
Jan
-12
May
-12
Sep
-12
Jan
-13
May
-13
Sep
-13
Jan
-14
May
-14
Sep
-14
Jan
-15
May
-15
Sep
-15
Jan
-16
May
-16
Sep
-16
Jan
-17
May
-17
EU Euroarea US
29
commonality among the default risk of banks (see Muirhead 1982 for an
exposition of PCA)
Let 119884119905 be the log difference of bankrsquos i CDS i=1hellip77 let the systemrsquos
aggregate credit risk be represented by the sum 119884119878 = sum 119884119894119894 and let 119864[119884119894] = 120583119894
and Var[119877119894] = 1205901198942 Then we have
1205901199042 = sum sum 120590119894120590119895120550[119911119894119911119895]
119873
119895=1
119873
119894=1
where 119911119896 = (119877119896 minus 120583119896)120590119896 k=ij
where 119911119896 is the CDS of bank k and 1205901199042 is the variance of the system
PCA produces the decomposition of the variance-covariance matrix of CDS
spreads of the 77 banks contained in the sample into the orthogonal matrix of
loadings L (eigenvector of the correlation matrix of CDS spreads) and the
diagonal matrix of eigenvalues Λ
We focus on the first three eigenvalues as they explain most of the variation
in the system These three eigenvalues are supposed to explain a larger portion
of the total volatility in the system when the CDS spreads are moving together or
in other words when systemic risk in more unified So periods when the first
three components explain most of the total volatility indicates the existence of
increased interconnectedness among banks The first component that is
extracted accounts for the maximum amount of total variance in the observed
variables In other words the proportion of explained variance by the first
component shows how much of the variations in the CDS spreads can be
explained by one common factor This result is in line with Fontana and
Scheicher (2010) who finds there to be a single large determinant dominating
the variation in the CDS spread where the proportion of explained variance by
30
factor 1 exceeds 80 According to Billio et al (2012) during periods of distress
fewer components explain larger part of the volatility which means that the
fluctuation of the first principal component while taking into account the
predictive power that CDS carry reveal periods of increased systemic risk
We run rolling window analysis where the length of the window is 200 days
and the step is 100 days over the period January 2008 to June 2017 and the
results indicate the existence of a single dominant component that determines
the fluctuations of CDS spreads (Figure 9)
Figure 9 Rolling Principal Components analysis
Note The length of the window is 200 days and the step is 100 days
Investigating the determinants of the loadings of each bank to the first
principal component through rolling cross-sectional analysis will reveal the
driving forces of systemic risk on a yearly basis over the period 2008-2016 For
that reason we use rolling cross-sectional analysis
0
10
20
30
40
50
60
Jan
-08
Jun
-08
No
v-0
8
Ap
r-0
9
Sep
-09
Feb
-10
Jul-
10
Dec
-10
May
-11
Oct
-11
Mar
-12
Au
g-1
2
Jan
-13
Jun
-13
No
v-1
3
Ap
r-1
4
Sep
-14
Feb
-15
Jul-
15
Dec
-15
May
-16
Oct
-16
comp1 comp2 comp3
31
ii
iiiiiii
Debt
SurplusGDPNIINPLsLoansAssetsay
7
654321
yi is each bankrsquos loading to the first component
We search among the following bank-specific characteristics total value of
bank assets (logs) retail orientation the total loanstotal assets (levels) NPLs
total loans (levels) and non-interest income total revenue and among the
following home-country specific characteristics GDP growth primary
surplusGDP (levels) public debtGDP (levels) We manage to match 47 banks to
bank-specific characteristics
Table 13 Determinants of each bankrsquos loadings in the first component over the nine
periods
2008 2009 2010 2011 2012 2013 2014 2015 2016
Size -0012 -0002 -0007 -0012 0001 0004 0001 -0002 -0003
(0008) (0007) (0006) (0006) (0007) (0006) (0010) (0008) (0009)
Loan-to-assets -0048 -0142 -0113 -0136 -0135 -0114 -0212 -0210 -0239
(0043) (0051) (0051) (0051) (0054) (0051) (0078) (0069) (0074)
NPLs 0844 0414 0352 0035 0004 -0097 0333 0304 0194
(0349) (0253) (0187) (0183) (0054) (0139) (0187) (0147) (0174)
Non-interest-income 0000 0000 0001 0000 0001 0000 0001 0000 0000
(0000) (0000) (0006) (0006) (0000) (0000) (0000) (0000) (0000)
GDP -0004 -0003 -0006 -0003 -0009 -0009 -0011 -0004 -0007
(0004) (0002) (0001) (0003) (0054) (0003) (0005) (0001) (0006)
Primary SurplusGDP 0000 -0002 0002 0000 -0002 -0004 -0009 -0014 -0012
(0002) (0001) (0001) (0170) (0054) (0003) (0004) (0004) (0005)
DebtGDP -0001 -00005 -00006 -0001 -00007 -00005 -00005 0000 -0000
(0000) (0000) (0000) (0000) (0054) (0000) (0000) (0000) (0000)
_cons 0300 0235 0297 0372 0248 0229 0252 0283 0323
(0080) (0076) (0068) (0078) (0054) (0072) (0111) (0094) (0107)
Note 1 510
32
6 Conclusions
Macroprudential policy is still in its infancy Much work is still needed on
developing good and timely analysis effective policy instrument tools and
effective implementation Our paper makes a contribution on the dimension of
analysis and measurement The key aim of macroprudential policy is to address
externalities and spillovers among financial institutions in an effort to safeguard
financial stability These interactions are complex We provide a tool for
clarifying and quantifying these interactions Our measures can guide
appropriate macroprudential policies that aim to internalize these externalities
A key conclusion from our study is that the focus on size does not adequately
address the systemic importance of banks
33
References
Acharya V Engle R Richardson M 2012 Capital Shortfall A New Approach to
Ranking and Regulating Systemic Risks American Economic Review Vol102 No
3
Acharya V Pedersen L Philippon T Richardson M 2010 Measuring systemic
risk Technical Report Department of Finance NYU
Acharya V Drechsler I Schnabl P 2014 A Pyrrhic Victory Bank Bailouts and
Sovereign Credit Risk Journal of Finance 2014 vol 69 issue 6 2689-2739
Adams Z Fuss R Gropp R 2014 Spillover Effects among Financial
Institutions A State-Dependent Sensitivity Value-at-Risk (SDSVaR) Approach
Journal of Financial and Quantitative Analysis (JFQA) Vol 49 No 3
Adrian T Brunnermeier M 2009 CoVaR Manuscript Princeton University
Aizenman J Hutchison H and JinjarakY (2013) lsquoWhat is the Risk of European
Sovereign Debt Defaults Fiscal Space CDS Spreads and Market Pricing of Riskrsquo
Journal of International Money and Finance 34 37-59
Allen F A Babus and E Carletti (2012) Asset commonality debt maturity and
systemic risk Journal of Financial Economics 104(3) 519ndash534
Alter A Beyer A 2013 The dynamics of spillover effects during the European
sovereign debt turmoil Journal of Banking and Finance 42 134-153
Altunbas Y Manganelli S Marques-Ibanez D 2011 Bank risk during the
financial crisis Do business models matter ECB Working Paper No 1394
Ang A Longstaff F 2011 Systemic sovereign credit risk Lessons from the US
and Europe NBER discussion paper 16983
Ayadi R Arbak E De Groen W 2011 Business Models in European Banking A
pre-and post-crisis screening CEPS Paperbacks
34
Banbura M Giannone D Reichlin L 2011 Nowcasting Oxford Handbook on
Economic Forecasting ed by M P Clements and D F Hendry pp 63ndash90 Oxford
University Press
Bank for Internaional Settlements 2010 Guidance for national authorities
operating the countercyclical capital buffer
Bank for Internaional Settlements 2011 Global systemically important banks
Assessment methodology and the additional loss absorbency requirement
Basel Committee on Banking Supervision 2010 Basel III A global regulatory
framework for more resilient banks and banking systems Bank for International
Settlements
Basu S Das S Michailidis G Purnanandam A 2017 A system-wide approach
to measure connectivity in the financial sector Unpublished
Benoit S Colliard J-E Hurlin C Perignon C 2015 Where the risks lie A
survey on systemic risk Unpublished working paper
Billio M Getmansky M Lo A W Pelizzon L 2012 Econometric measures of
systemic risk in the finance and insurance sectors Journal of Financial
Economics 104 535ndash559
Brownlees CT Engle RF 2010 Volatility correlation and tails for systemic
risk measurement Manuscript Stern School of Business New York University
Canova F and Pappa P 2007 Price Differentials in Monetary Unions The Role
of Fiscal Shocks Economic Journal 117 2007 713-737
Castro C Ferrari S 2014 Measuring and testing for the systemically important financial institutions Journal of Empirical Finance 2014 vol 25 issue C 1-14 Cerutti E Claessens S Laeven L 2015 The Use and Effectiveness of
Macroprudential Policies New Evidence IMF Working Paper No 1561
Crockett A 2000 Marrying the Micro- and Macro-prudential Dimensions of
Financial Stability Eleventh International Conference of Banking Supervisors
held in Basel 20-21
35
De Santis R (2012) ldquoThe euro area sovereign debt crisis Safe haven credit
rating agencies and the spread of the fever from Greece Ireland and Portugalrdquo
ECB Working Paper 1419
DellrsquoAriccia G Igan D Laeven L Tong H Bakker B Vandenbussche J 2012
Policies for Macrofinancial Stability How to Deal with Credit Booms IMF Staff
Discussion Note 1206
Demirer M Diebold F Liu L Yilmaz K 2017 Estimating global bank network
connectedness Journal of Applied Eeconometrics forthcoming
Diebold F X Yilmaz K 2009 Measuring Financial Asset Return and Volatility
Spillovers with Application to Global Equity Markets The Economic Journal
119(534) 158-171
Diebold F X Yilmaz K 2012 Better to give than to receive Predictive
directional measurement of volatility spillovers International Journal of
Forecasting Issue 28 pp 57-66
Doan T Litterman R Sims CA 1984 Forecasting and Conditional Projections
Using Realistic Prior Distributions Econometric Reviews 3(4) 1ndash 100
Elliott D J Feldberg G Lehnert A 2013 The History of Cyclical
Macroprudential Policy in the United States Office of Financial Research
Working Paper No 8
European Central Bank 2016 Macroprudential Bulletin Issue 12016
Financial Stability Board 2011 Measures to address systemically important
financial institutions
Fontana A Scheicher M 2010 An analyisis of euro area sovereign CDS and
their relation with government bonds ECB Working Paper Series Issue 1271
Fostel A Geanakoplos J 2008 Leverage Cycles and the Anxious Economy
American Economic Review 98 (4) 1211ndash1244 [2196]
36
Geanakoplos J Pedersen L H 2014 Monitoring leverage In Brunnermeier M
K Krishnamurthy A (Eds) Risk Topography Systemic Risk and Macro
Modeling NBER pp 175ndash182
Giannone D Lenza M Primiceri GE 2012 Prior Selection for Vector
Autoregressions CEPR Discussion Papers 8755 CEPR Discussion Papers
Giglio S Kelly B T Pruitt S 2015 Systemic risk and the macroeconomy An
empirical evaluation Journal of Financial Economics 2016 vol 119 issue 3 457-
471
Goacutemez-Puig M amp Sosvilla-Rivero S (2014) EMU sovereign debt markets crisis
Fundamental-based or pure contagion Institut de Recerca en Economia
Aplicada (IREA) Working Papers Universitat de Barcelona 201402
Huang X Zhou H Zhu H 2012 Systemic Risk Contributions Journal of
Financial Services Research 2012 vol 42 issue 1 55-83
International Monetary Fund 2013a The Interaction of Monetary and
Macroprudential Policies Washington International Monetary Fund
International Monetary Fund 2015a Financial Operations
Koumlhler M 2013 Does non-interest income make banks more risky Retail-
versus investment oriented banks Deutsche Bundesbank Discussion Paper
No172013
Koop G Korobilis D 2010 Bayesian Multivariate Time Series Methods for
Empirical Macroeconomics Foundations and Trends in Econometrics Vol 3 No
4 pp 267-358
Litterman Robert B 1979 Techniques of forecasting using vector
autoregressions Research Department Working Paper 115 Federal Reserve
Bank of Minneapolis Minnesota
37
Longstaff F Pan J Pedersen L Singleton K 201 How Sovereign Is Sovereign
Credit Risk American Economic Journal Macroeconomics 2011 vol 3 issue 2
75-103
Pesaran H Shin Y 1998 Generalized impulse response analysis in linear
mulitvariate models Economic Letters 58(1) 17-29
White H Kim TH Manganelli S 2008 Modeling autoregressive conditional
skewness and kurtosis with multi-quantile CAViaR In Russell J Watson M
(Eds) Volatility and Time Series Econometrics A Festschrift in Honor of Robert
F Engle
Part B
We study 77 banks from 26 developed and emerging economies Data are downloaded from Thomson-Reuters and cover the period from January 1st 2008 to June 30th 2017 The first sample contains 77 banks are from 19 developed economies while the rest are from 6 emerging economies (as of IMFrsquos list) The sample contains most of the banks that are designated as ldquoglobal systemically important banksrdquo (ldquoGSIBrsquosrdquo) as designated by the Basel Committee on Banking Supervision except for three Chinese banks (Agricultural Bank of China Bank of China and Industrial and Commercial Bank of China) and one French bank Group BPCE 43 out of the 77 banks (544) in the sample are from Europe while 28 of them (3544) are headquartered in Eurozone members The sample is extended by adding 19 smaller European banks
B Sample Presentation Bank Details Descriptive Statistics Tables 2a and b presents the 77 banks in the sample in the worldrsquos top 150 as they ordered by assets (Q4 2016) Table A3 presents the share of assets that each home-country holds in the sample as well as the share of assets per developed and emerging countries while Table A4 presents the share of assets per region Table A5 presents the 14 European banks that are added to the initial sample
Table 2a Banks ordered by Total Assets (in US $ billion)
Rank Bank Name Country Total assets
38
US$B
1 Bank of China China 2613 2 Mitsubishi UFJ Financial Group Japan 2597 3 JPMorgan Chase amp Co USA 2490 4 HSBC Holdings UK 2374 5 BNP Paribas France 2196
6 Bank of America USA 2187 7 Wells Fargo USA 1930 8 China Development Bank China 1904 9 Credit Agricole Group France 1821 10 Citigroup USA 1792
11 Mizuho Financial Group Japan 1757 12 Deutsche Bank Germany 1682 13 Sumitomo Mitsui Financial Group Japan 1654 14 Barclays PLC UK 1490 15 Societe Generale France 1461
16 Banco Santander Spain 1416 17 Lloyds Banking Group UK 1004 18 Norinchukin Bank Japan 984 19 Royal Bank of Scotland Group UK 981 20 UBS Group AG Switzerland 919
21 Unicredit SpA Italy 908 22 ING Groep NV Netherlands 893 23 Goldman Sachs Group USA 860 24 Morgan Stanley USA 814 25 Credit Suisse Group Switzerland 806
Table 2a ndash Continued from previous page
26 BBVA Spain 773 27 Intesa Sanpaolo Italy 766 28 Commonwealth Bank of Australia Australia 703 29 Rabobank Group Netherlands 700 30 Australia amp New Zealand Banking Group Australia 661
31 Nordea Sweden 651 32 Standard Chartered Plc UK 646 33 Westpac Banking Corp Australia 607 34 National Australia Bank Australia 562 35 Commerzbank Germany 549
36 Danske Denmark 495 37 State bank of India India 492 38 US Bancorp USA 445 39 The Export-Import Bank of China China 427 40 Sberbank of Russia Russia 420
41 Resona Japan 412 42 Sumitomo Mitsui TH Japan 406 43 Nomura Holdings Japan 370 44 PNC Financial Services USA 366 45 Capital One Financial Corporation USA 357
46 DBS Group Holdings Singapore 332 47 Shinhan Financial Group South Korea 328 48 KBC Group NV Belgium 291 49 Svenska Handelsbanken Sweden 289 50 Skandinaviska Enskilda Banken Sweden 289
51 Hana Financial Group South Korea 288 52 Nationwide Building Society UK 276 53 Korea Development Bank South Korea 268
39
54 Woori Bank South Korea 257 55 Landesbank Baden-Wurttemberg Germany 257
56 Cathay Financial Holding Taiwan 252 57 Swedbank Sweden 237 58 United Overseas Bank (UOB) Singapore 235 59 Dexia Belgium 225 60 Banco Sabadell Spain 224
61 Bayerische Landesbank Germany 224 62 Erste Group Bank AG Austria 220 63 Banco Popular Espanol Spain 204 64 Industrial Bank of Korea South Korea 196 65 Bank of Ireland Ireland 182
66 Malayan Malaysia 161 67 Standard Bank Group South Africa 161 68 Banca Monte dei Paschi di Siena Italy 161 69 American Express USA 158 70 National Bank of Greece Greece 153 71 Macquarie USA 143
72 Credit Lyonnais France 120 73 Comercial Portuguese Portuguese 113 74 Banco Espirito Santo Portugal 112 75 Turkiye is bankasi Turkey 112 76 Mediobanca Italy 95
77 Landesbank Hessen Germany 92
Table 2b Banks ordered by Country
Rank Bank Country Total assets
US$B
1 Commonwealth Bank of Australia Australia 703 2 Australia amp New Zealand Banking Group Australia 661 3 Westpac Banking Corp Australia 607 4 National Australia Bank Australia 562
5 Erste Group Bank AG Austria 220
6 KBC Group NV Belgium 291 7 Dexia Belgium 225
8 Bank of China China 2613 9 China Development Bank China 1904
10 The Export-Import Bank of China China 427
11 Danske Denmark 495
12 BNP Paribas France 2196 13 Credit Agricole Group France 1821 14 Societe Generale France 1461 15 Credit Lyonnais France 120
16 Deutsche Bank Germany 1682 17 Commerzbank Germany 549 18 Landesbank Baden-Wurttemberg Germany 257 19 Bayerische Landesbank Germany 224 20 Landesbank Hessen Germany 92
21 National Bank of Greece Greece 153
22 State bank of India India 492
23 Bank of Ireland Ireland 182
24 Unicredit SpA Italy 908 25 Intesa Sanpaolo Italy 766
40
26 Banca Monte dei Paschi di Siena Italy 161 27 Mediobanca Italy 95
28 Mitsubishi UFJ Financial Group Japan 2597 29 Mizuho Financial Group Japan 1757 30 Sumitomo Mitsui Financial Group Japan 1654 31 Norinchukin Bank Japan 984 32 Resona Japan 412 33 Sumitomo Mitsui TH Japan 406 34 Nomura Holdings Japan 370 35 Yamaguchi Financial Group Japan 93
36 ING Groep NV Netherlands 893 37 Rabobank Group Netherlands 700
38 Banco Espirito Santo Portugal 111
39 Sberbank of Russia Russia 420
40 DBS Group Holdings Singapore 332 41 United Overseas Bank (UOB) Singapore 235 42 Standard Bank Group South Africa 161
43 Shinhan Financial Group South Korea 328 44 Hana Financial Group South Korea 288 45 Korea Development Bank South Korea 268 46 Woori Bank South Korea 257 47 Industrial Bank of Korea South Korea 196
48 Banco Santander Spain 1416 49 BBVA Spain 773 50 Banco Sabadell Spain 224 51 Banco Popular Espanol Spain 204
Table 2b ndash Continued from previous page
53 Nordea Sweden 651 54 Svenska Handelsbanken Sweden 289 55 Skandinaviska Enskilda Banken Sweden 289 56 Swedbank Sweden 237
57 UBS Group AG Switzerland 919 58 Credit Suisse Group Switzerland 806
59 Cathay Financial Holding Taiwan 252
60 Turkiye is bankasi Turkey 112
61 HSBC Holdings UK 2374 62 Barclays PLC UK 1490 63 Lloyds Banking Group UK 1004 64 Royal Bank of Scotland Group UK 981 65 Standard Chartered Plc UK 646 66 Nationwide Building Society UK 276
68 JPMorgan Chase amp Co USA 2490 69 Bank of America USA 2187 70 Wells Fargo USA 1930 71 Citigroup USA 1792 72 Goldman Sachs Group USA 860 73 Morgan Stanley USA 814 74 US Bancorp USA 445 75 PNC Financial Services USA 366 76 Capital One Financial Corporation USA 357 77 American Express USA 158 78 Macquarie USA 143
41
Table 3a Banksrsquo home-countries ordered by the sum of total bank assets
Developed Total Assets Developing Total Assets USA 11547 China 4944 Japan 7867 India 492 UK 6936 Russia 420 France 5599 Taiwan 252 Germany 2994 South Africa 161 Spain 2617 Turkey 112
Australia 2534 Italy 1933 Switzerland 1725
Netherlands 1584 Sweden 1467 South Korea 1340 Singapore 568 Belgium 516 Denmark 495 Ireland 344 Austria 220 Greece 153 Portugal 111 Total Assets of banks that are headquartered in
Developed 5055366 Emerging 63823 of total assets 888 of total assets 112
42
Table 3b Regional details
Region Number of Banks Total bank
assets of total
assets
Europe 40 2669673 473
Asia 21 1557658 275
N America 11 1154724 204
Oceania 4 2534 45
Africa 1 161 03
B Data Definitions and Descriptive Statistics
Table 4 Data Definitions
Variable Description
Endogenous CDS CDS 5-year spread
Exogenous Systemic risk
CDX The family of CDS indeces covering North America
VIX The volatiliy index of SampP 500
US 3-month T Bill The short-term obligation backed by the Treasury Dept of the US goverment
Bank-specific Size Total assets
Retail orientation Total Loans Total assets
Diversification Non-interest income Total revenues
NPLs Non-performing loans Total Loans
Country-specific
GDP Each bankrsquos home-country GDP growth
Budget Balance Current AccountGDP
Public Debt Public DebtGDP
43
Table 5 Descriptive Statistics
Panel A Systemic risk factor
CDX VIX TED
Mean 269E-06 -0000123 -000121 Median 0000 -0001 0000 Maximum 0020 0176 0250 Minimum -0009 -0152 -0750
Std Dev 0001 0031 0033 Skewness 4689 0689 -17326
Kurtosis 106047 6789 377496 Jarque-Bera 1105896 1679364 14610377 Probability 0000 0000 0000
Sum 0007 -0304 -3000 Sum Sq Dev 0003 2427 2746
Note CDX and VIX are in log differences TED spread is in first differences
Panel B Bank specific
Assets Loans_to_Assets Non_Interest_Inc NPLs
Mean 732382 55596 2442 4601
Median 458009 59921 2378 2411
Maximum 3030645 8664 8640 35217
44
Minimum 4354387 9070 -5962 01082
Std Dev 7460013 17017 1481 5612
Skewness 1081 -0641 -0694 2376
Kurtosis 30129 2584 6193 9630
Jarque-Bera 7023 272888 182117 999501
Probability 0000 0000 0000 0000
Sum 264E+09 2003702 8803746 1658430 Sum Sq Dev 201E+15 1043392 7908036 1134867
Note Data are in levels
Part C ndash Global Sample
Table 7 Individual systemic importance
Panel A ndash Ranked by total score Rank by score
Rank by bank assets Bank Name
Home-Country Region
Assets (billion
US $) Score
To others (Aggr)
From others (Aggr)
1 27 Intesa Sanpaolo Italy Europe 766 1056 0505 0551
2 16 Banco Santander Spain Europe 1416 1038 0464 0574
3 26 BBVA Spain Europe 773 0987 0454 0533
4 5 BNP Paribas France Europe 2196 0982 0445 0537
5 21 Unicredit SpA Italy Europe 908 0975 0489 0485
6 14 Barclays PLC UK Europe 1490 0961 0454 0507
7 12 Deutsche Bank Germany Europe 1682 0954 0428 0526
8 9 Credit Agricole Group France Europe 1821 0942 0424 0518
9 15 Societe Generale France Europe 1461 0940 0427 0512
10 72 Credit Lyonnais France Europe 120 0938 0445 0493
11 17 Lloyds Banking Group UK Europe 1004 0925 0438 0487
12 25 Credit Suisse Group Switz Europe 806 0907 0376 0531
13 35 Commerzbank Germany Europe 549 0904 0410 0494
14 20 UBS Group AG Switz Europe 919 0890 0387 0503
15 32 Standard Chartered Plc UK Europe 646 0870 0419 0451
16 68 Banca Monte dei Paschi Italy Europe 161 0861 0429 0433
45
17 19
Royal Bank of Scotland Group
UK Europe 981 0845 0423 0423
18 29 Rabobank Group Netherl Europe 700 0841 0376 0465
19 22 ING Groep NV Netherl Europe 893 0823 0374 0449
20 76 Mediobanca Italy Europe 95 0821 0389 0433
21 24 Morgan Stanley USA N Amer 814 0752 0315 0437
22 69 American Express USA N Amer 158 0736 0332 0404
23 6 Bank of America USA N Amer 2187 0716 0318 0398
24 23 Goldman Sachs Group USA N Amer 860 0711 0302 0410
25 10 Citigroup USA N Amer 1792 0706 0313 0393
26 4 HSBC Holdings UK Europe 2374 0695 0372 0323
27 62 Erste Group Bank AG Austria Europe 220 0688 0314 0375
28 49 Svenska Handelsbanken Sweden Europe 289 0678 0281 0397
29 53
Korea Development Bank
S Korea Asia 268 0677 0393 0284
30 60 Banco Sabadell Spain Europe 224 0670 0295 0375
31 36 Danske Denmark Europe 495 0663 0296 0367
32 45
Capital One Financial Corp
USA N Amer 357 0662 0260 0401
33 3 JPMorgan Chase amp Co USA N Amer 2490 0658 0257 0401
34 7 Wells Fargo USA N Amer 1930 0653 0259 0394
35 34 National Australia Bank Australia Oceania 562 0622 0376 0247
Table continued on next page
Table 3- Panel A continued from previous page
36 2 Mitsubishi UFJ Financial Japan Asia 2597 0621 0223 0398
37 47 Shinhan Financial Group S Korea Asia 328 0615 0331 0283
38 54 Woori Bank S Korea Asia 257 0612 0333 0278
39 64 Industrial Bank of Korea S Korea Asia 196 0603 0341 0261
40 28 Commonwealth Bank Australia Oceania 703 0599 0388 0211
41 40 Sberbank of Russia Russia Europe 420 0598 0294 0305
42 30 Australia amp N Zealand Australia Oceania 661 0597 0383 0214
43 50 Skandinaviska Enskilda Sweden Europe 289 0578 0262 0316
44 31 Nordea Sweden Europe 651 0574 0289 0285
45 71 Macquarie USA N Amer 143 0572 0321 0251
46 48 KBC Group NV Belgium Europe 291 0568 0241 0327
47 63 Banco Popular Espanol Spain Europe 204 0558 0297 0261
48 61 Bayerische Landesbank Germany Europe 224 0552 0249 0303
49 39 The Export-Import Bank China Asia 427 0548 0284 0264
50 1 Bank of China China Asia 2613 0548 0276 0272
51 66 Malayan Malaysia Asia 171 0543 0321 0223
52 33 Westpac Banking Corp Australia Oceania 606 0540 0374 0166
53 37 State bank of India India Asia 492 0530 0238 0291
54 51 Hana Financial Group S Korea Asia 288 0518 0290 0227
55 57 Swedbank Sweden Europe 237 0486 0253 0233
56 8 China Development Bank China Asia 1904 0468 0260 0208
46
57 52 Nationwide Building Society UK Europe 276 0463 0217 0246
58 59 Dexia Belgium Europe 225 0409 0197 0212
59 46 DBS Group Holdings Singapore Asia 332 0397 0212 0186
60 65 Bank of Ireland Ireland Europe 182 0379 0197 0182
61 58 United Overseas Bank Singapore Asia 235 0373 0214 0159
62 11 Mizuho Financial Group Japan Asia 1757 0367 0271 0096
63 67 Standard Bank Group S Africa Africa 161 0365 0123 0242
64 74 Espirito Santos Portugal Europe 112 0362 0186 0176
65 41 Resona Japan Asia 412 0357 0263 0094
66 13 Sumitomo Mitsui Financial Japan Asia 1654 0355 0250 0104
67 38 US Bancorp USA N Amer 445 0353 0188 0165
68 55 Landesbank Baden-Wurtt Germany Europe 257 0340 0170 0171
69 42 Sumitomo Mitsui TH Japan Asia 406 0323 0273 0050
70 56 Cathay Financial Holding Taiwan Asia 252 0298 0189 0109
71 73 Comercial Portuguese Portugal Europe 113 0279 0268 0011
72 70 National Bank of Greece Greece Europe 153 0220 0176 0044
73 18 Norinchukin Bank Japan Asia 984 0215 0164 0050
74 43 Nomura Holdings Japan Asia 370 0197 0161 0035
75 77 Landesbank Hessen Germany Europe 92 0159 0089 0071
76 44 PNC Financial Services USA N Amer 366 0078 0034 0043
77 75 Turkiye is bankasi Turkey Europe 112 0037 0030 0007
Note Results concern the period January 2008 ndash June 2017 and are of daily frequency
Table 9 Systemic contribution per bank (January 2008 ndash June 2017)
Rank Bank Name SC Rank Bank Name SC Rank Bank Name SC Rank Bank Name SC
1 Intesa Sanpaolo
225 21 Morgan Stanley 160 41 Sberbank of Russia
128 61 United Overseas
080
2 Banco Santander
221 22 American Express
157 42 Australia amp N Zealand
127 62 Mizuho Financial
078
3 BBVA 210 23 Bank of America
153 43 Skandinaviska Enskilda
123 63 Standard Bank Group
078
4 BNP Paribas 209 24 Goldman Sachs Group
152 44 Nordea 122 64 Espirito Santos
077
5 Unicredit SpA
208 25 Citigroup 151 45 Macquarie 122 65 Resona 076
6 Barclays PLC 205 26 HSBC Holdings 148 46 KBC Group NV
121 66 Sumitomo Mitsui
076
7 Deutsche Bank
203 27 Erste Group 147 47 Banco Popular
119 67 US Bancorp
075
8 Credit Agricole
201 28 Svenska 145 48 Bayerische Landesbank
118 68 Landesbank 072
9 Societe Generale
200 29 Korea Development Bank
144 49 The Export-Import
117 69 Sumitomo Mitsui TH
069
10 Credit Lyonnais
200 30 Banco Sabadell 143 50 Bank of China 117 70 Cathay Financial
064
11 Lloyds Banking
197 31 Danske 141 51 Malayan 116 71 Comercial Portuguese
059
47
12 Credit Suisse Group
193 32 Capital One Financial Corp
141 52 Westpac Banking Corp
115 72 NBG 047
13 Commerzbank 193 33 JPMorgan Chase amp Co
140 53 State bank of India
113 73 Norinchukin Bank
046
14 UBS Group AG 190 34 Wells Fargo 139 54 Hana Financial Group
110 74 Nomura Holdings
042
15 Standard Chartered
186 35 National Australia Bank
133 55 Swedbank 104 75 Landesbank Hessen
034
16 Banca Monte dei
184 36 Mitsubishi UFJ Financial
132 56 China Development
100 76 PNC Financial Services
017
17 RBS 180 37 Shinhan Financial Group
131 57 Nationwide Building
099 77 Turkiye is bankasi
008
18 Rabobank Group
179 38 Woori Bank 130 58 Dexia 087
19 ING Groep NV 175 39 Industrial Bank of Korea
129 59 DBS Group Holdings
085
20 Mediobanca 175 40 Commonwealth Bank
128 60 Bank of Ireland
081
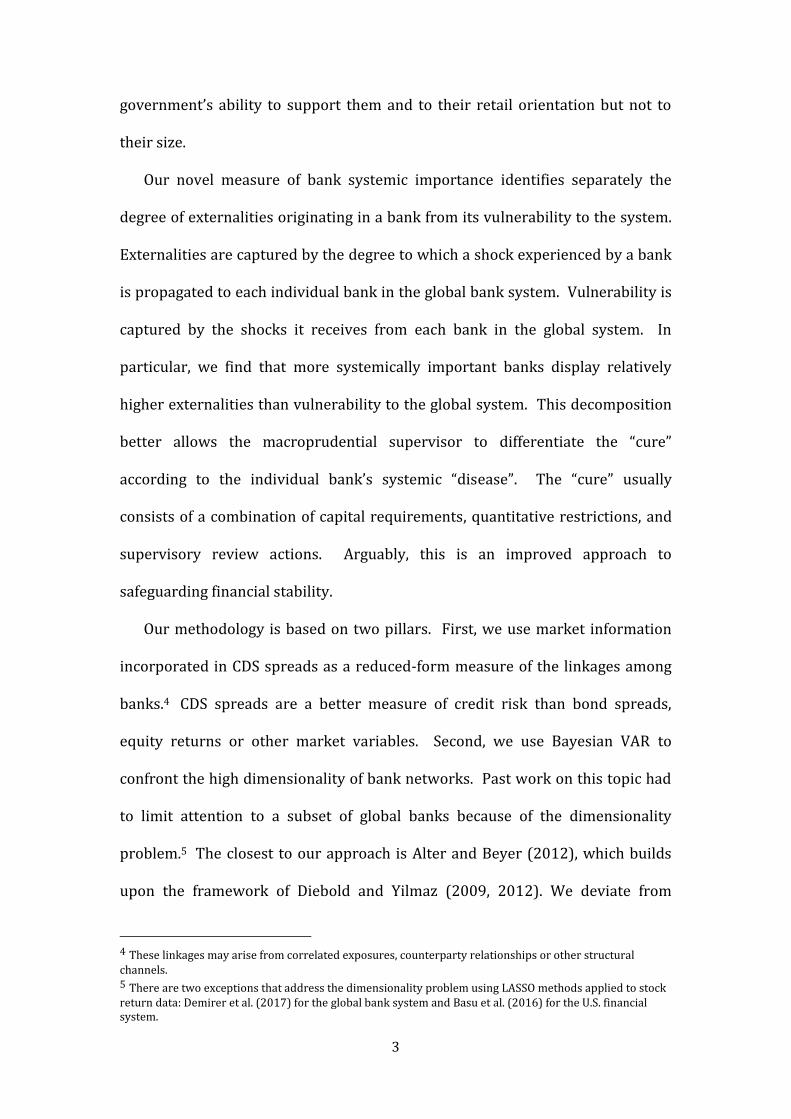
3
governmentrsquos ability to support them and to their retail orientation but not to
their size
Our novel measure of bank systemic importance identifies separately the
degree of externalities originating in a bank from its vulnerability to the system
Externalities are captured by the degree to which a shock experienced by a bank
is propagated to each individual bank in the global bank system Vulnerability is
captured by the shocks it receives from each bank in the global system In
particular we find that more systemically important banks display relatively
higher externalities than vulnerability to the global system This decomposition
better allows the macroprudential supervisor to differentiate the ldquocurerdquo
according to the individual bankrsquos systemic ldquodiseaserdquo The ldquocurerdquo usually
consists of a combination of capital requirements quantitative restrictions and
supervisory review actions Arguably this is an improved approach to
safeguarding financial stability
Our methodology is based on two pillars First we use market information
incorporated in CDS spreads as a reduced-form measure of the linkages among
banks4 CDS spreads are a better measure of credit risk than bond spreads
equity returns or other market variables Second we use Bayesian VAR to
confront the high dimensionality of bank networks Past work on this topic had
to limit attention to a subset of global banks because of the dimensionality
problem5 The closest to our approach is Alter and Beyer (2012) which builds
upon the framework of Diebold and Yilmaz (2009 2012) We deviate from
4 These linkages may arise from correlated exposures counterparty relationships or other structural channels 5 There are two exceptions that address the dimensionality problem using LASSO methods applied to stock return data Demirer et al (2017) for the global bank system and Basu et al (2016) for the US financial system
4
common practice in the literature by removing any market-wide shocks through
the inclusion of a set of common external systemic variables Thus we allow
each bank to become a source of systemic risk after idiosyncratic shocks through
spillovers
The remainder of this document is structured as follows Section 2 presents
the existing literature and section 3 describes the process of measuring systemic
risk the existing frameworks and the motivation Section 4 presents the
methodology and the data while section 5 presents the results and section 6
concludes
2 Relevant Literature
Our paper is closely related to four literature strands First it is related to
studies concerning macroprudential policy The aim of macroprudential policy is
to increase the resilience of individual financial institutions and of the financial
system as a whole by limiting the build-up of vulnerabilities in order to mitigate
systemic risk (ECB 2016) It is also used to smooth-out the financial cycle
driven by fluctuations in credit leverage and asset prices which may otherwise
result in a pattern of boom and bust (DellrsquoAriccia et al 2013 Elliot et al 2013
Cerutti et al 2015) Appropriate policies should be designed toward limiting the
ex ante externalities that lead to an excessive build-up of systemic risk and the
ex post externalities that can generate inefficient failures of otherwise sound
institutions in a crisis All in all macroprudential policy is the usage of primarily
prudential tools to limit systemic risk (Crockett 2000 FSBIMFBIS 2011 IMF
2013) The literature on macroprudential policy is growing at a fast pace but is
still at an early stage and historical experience is thin The most relevant part of
5
the literature aims at assessing the systemic importance of G-SIBs The most
important framework is the one developed by Basel Committee on Banking
Supervision (BCBS) The framework compares each bankrsquos activity over twelve
indicators and finally assigns a score to each bank The indicators include the
size the interconnectedness the substitutability the complexity and the cross-
jurisdictional activity of each bank
The BCBS methodology has also been used by Financial Stability Board for
the identification of G-SIBs This methodology has been transposed in the EU
regulatory framework (see Article 131 of the Capital Requirements Directive IV
(CRDIV)) which defines global systemically important institutions or G-SIIs The
BCBSFSB framework for determining systemic risk has some deficiencies It
assigns primal importance to size as all bank characteristics considered are
directly related to size This is a premise that is not necessarily backed by
empirical evidence that the biggest banks are the most dangerous ones for
financial stability In addition the weights assigned to the characteristics are
arbitrary Finally it does not provide any information on the degree of
externalities between a systemically important bank and any other one in the
system Our contribution is to use direct observations on credit risk to measure
externalities between any two banks in the global system In this way we
quantify the degree of danger that any bank may pose to the financial system or
parts of it defined broadly or narrowly Our methodology flexibly updates the
classification dynamically as new information is obtained
The second relevant field of literature has to do with the alternative systemic
risk rankings for financial institutions There is an important number of
methodologies for calculating the exposure of financial institutions to changes in
6
current economic conditions how concentrated the risks are among the financial
institutions and how closely linked they are with each other The first stream has
to do with price-based systemic risk rankings such as banksrsquo VaR (Adams Fuss
and Gropp 2014 White Kim and Manganelli 2015) ∆CoVaR (Adrian and
Brunnermeier 2014 Castro and Ferrari 2014) and MES (Acharya Pedersen
Philippon and Richardson 2010) These measure the VaR or MES of financial
institutions conditional on the entire set of institutions performing poorly The
second group of such metrics incorporates book values as well and includes
SRISK (Acharya Engle and Richardson 2012 Brownlees and Engle 2010)
leverage ratio (Fostel and Geanakoplos 2008 Geanakoplos and Pedersen 2014)
and CAPM beta times market capitalization (Benoit Colliard Hurlin and
Perignon 2015) Finally the distressed insurance premium (DIP) by Huang et al
(2012) measures the insurance premium required to cover distressed losses in
the banking system These closely related approaches have a key weakness
which is that they do not provide information on the pairwise directional
connectedness ie the direction of externalities between any two banks in the
global system In response to this shortcoming some papers (see Billio et al
2012) use Granger causality as a tool to uncover directionality However
Granger causality is unable to consider contemporaneous movements control
for exogenous variables quantify intensities of effects or consider multi-
dimensional networks These are all aspects that our methodology and measure
enables
The third group of relevant papers deals with the estimation of high-
dimensional VAR models Our approach is closely related to the approach
developed by Alter and Beyer (2013) which is based on the framework of
7
Diebold and Yilmaz (2009 2011) The high-dimensionality problem had forced
this research on global bank connectedness to limit their analysis to small
samples of banks Needless to say this is not appropriate when considering bank
importance for the global system A relevant methodology has been recently
suggested by Demirer Diebold Liu and Yilmaz (2017) who use LASSO methods
to shrink select and estimate the high-dimensional network linking the publicly-
traded subset of global banks In a similar vein Basu et al (2017) use Lasso
penalized Vector Autoregressive model to estimate a model that leverages a
system-wide approach to identify systemically important financial institutions in
the US Our distinct approach is to use Bayesian VAR in order to resolve the
dimensionality problem
Finally our paper relates to studies that apply principal components
methods to analyze systemic risk Billio et al (2012) suggested that an
important symptom of systemic risk is the presence of sudden regime shifts
Giglio et al (2015) proposed dimension-reduction estimators for constructing
systemic risk indexes from the cross section of measures and prove their
consistency in a factor model setting We differ by examining the individual bank
loadings on the dominant factor associated with fluctuations in bank CDS
spreads and determining which bank and country characteristics are related to
these This provides solid empirical basis for using relevant characteristics as
indicators to measure systemic importance indirectly
3 Definition of Systemic Importance
8
Systemic risk may originate in an endogenous build-up of financial
imbalances possibly associated with a booming financial cycle large aggregate
shocks hitting the economy or the financial system or contagion effects across
markets intermediaries or infrastructures Our study focuses on contagion
among banks and measures the systemic importance of a bank by the amount of
spillovers it receives from and sends to the rest of the banking system According
to Allen et al (2012) contagion refers to the risk that the failure of one financial
institution leads to the default of others through a domino effect in the interbank
market the payment system or through asset prices More precisely we adopt
the ldquopure-contagionrdquo (Gomez-Puig and Sosvilla Rivero 2013) definition by
controlling only for external common factors through the inclusion of a set of
common external systemic risk factors and assume that each bank could become
itself a source of systemic risk as a result of an idiosyncratic shock
The following example illustrates how we measure the systemic importance
of banks (see Figure 1) Assume that there exist three banks Focusing on bank A
as the source of shocks figure 1 presents the potential impact of an idiosyncratic
shock on bank A to bank B and to bank C respectively Bank A sends a ten-unit
shock to B and a seventeen-unit shock to C a total of 27 Next we focus on the
shocks received by bank A from the other banks in the system Bank A receives a
twenty-one-unit shock from bank B and a five-unit shock from bank C a total of
26 If we sum the shocks that bank A sends to and receives from the system we
obtain an estimate of the degree of connectedness for bank A This is a valid
measure of bank Arsquos systemic importance This procedure is repeated in order to
calculate the systemic importance of bank B and bank C
9
Figure 1 Example of pairwise directional connectedness
Transforming this figure into a table we construct the directional
connectedness matrix
Table 1 Directional connectedness matrix
ShockResponse Bank A Bank B Bank C To Others (Sum_Out)
Bank A - 10 17 27
Bank B 21 - 28 49
Bank C 5 19 - 24
From Other(Sum_In) 26 29 45 100
Score (Sum_Out+Sum_In) 53 78 69
Note Variables in the first column are the impulse origin while variables on the top row are the respondents to the shock
Table 1 presents the entire picture for all three banks in the system Shocks
emanate from row banks to column banks Each row shows the contagion effects
of an equal-sized impulse to the relevant bank in the first column In the last
column we aggregate the total externality effects of each row bank The columns
provide the picture of vulnerability of each bank to shocks in different banks
10
The second to last row is a measure of total vulnerability of a bank to all other
banks in the system It contains the answer to the question ldquoIf all other banks in
the system experienced an idiosyncratic shock of 100 basis points what would
be the impact on bank Xrdquo In the bottom row we aggregate the total externality
effect and the total vulnerability effect of each bank In other words we lump
together shocks sent and received by an individual bank as a measure of total
individual bank connectedness In calculating a bankrsquos systemic importance we
assign equal weights to shocks it sends as to shocks it receives as we are
agnostic as to whether one source of systemic instability is more dangerous than
the other
There are two aspects of financial contagion due to a bankrsquos participation in a
banking system that are of relevance to regulators externalities emanating from
a bankrsquos failure and individual bank vulnerability to financial contagion Both
components are important for regulators but their importance may not be equal
If they are of equal importance then the regulator would consider the sum of
these two However the clear decomposition in Table 1 as well as in our
econometric method allows the regulator to assign different weights in order to
capture the appropriate measure of systemic importance
4 Data and Methodology
41 Data
We study 77 banks from 19 developed and 7 emerging economies Our
selection procedure is as follows We started with the list of the worldrsquos top 150
banks in terms of total assets in Q42016 Using bank names we matched 77
banks to CDS prices from Thomson-Reuters Datastream and Bloomberg CDS
11
spreads cover the period from January 2008 to June 2017 and are at daily
frequency The sample contains all the banks that are designated as ldquoglobal
systemically important banksrdquo (ldquoGSIBrsquosrdquo) by the Basel Committee on Banking
Supervision except for three Chinese banks (Agricultural Bank of China Bank of
China and Industrial and Commercial Bank of China) and one French bank
(Group BPCE) Table 2a (in the Appendix) classifies banks by assets and provides
detail on the 77 banks in the sample such as home-country and total assets
while table 2b (in the Appendix) classifies banks by home-country We note that
40 out of the 77 banks (52) in the sample are from Europe while 28 of them
(34) are headquartered in Eurozone members Tables 3a and 3b (in the
Appendix) provide the regional characteristics of the sample
411 Systemic Risk factor
We will allow for the presence of a global systemic risk factor This permits
us to interpret robustly the results obtained from our model Longstaff et al
(2011) for instance has argued that credit risk appears related to global rather
than country-specific factors while Aizenman et al (2013) has established the
importance of international economic factors in the pricing of credit risk The
variables we chose to employ in order to capture global financial risk conditions
have been widely used in related studies as control variables (see among others
De Santis 2012 Aizenman et al 2013 Ang and Longstaff 2011) The global
default risk conditions are represented by the CDX which is the family of CDS
indices covering North America the VIX volatility index which captures the
global capital marketsrsquo ldquofearrdquo condition and the global liquidity conditions which
is represented by the US 3-month treasury bills The systemic factor is assumed
12
to affect the endogenous variables contemporaneously Table 4 contains the
variable definitions and Table 5 provides descriptive statistics
412 Bank-specific characteristics
A variety of bank- and country-specific variables are used for identifying the
determinants of systemic risk fluctuation over time The first bank-specific
variable is bank size expressed as each bankrsquos total assets (in log) According to
BIS (2011a) the larger a bank is the more likely it is to receive a bailout package
In this sense we also take into consideration the ldquotoo-big-to-failrdquo (TBTF) issue
(Acharya et al 2013) The second bank-specific variable is the loan-to-asset
ratio which provides information on the bankrsquos retail orientation Ayadi et al
(2011) and Koumlhler (2013) suggest that retail-orientated banks appeared to be
less risky than other banks during the recent financial crisis Also according to
Altunbas et al (2011) the non-interest income over total revenue is considered
to be a measure of each bankrsquos diversification since the less a bank relies on
interest income the less exposed the bank is to a negative shock Finally we
include each bankrsquos nonperforming loans over total loans (see Tables 4 and 5)
413 Country-specific characteristics
It is important to include country-specific factors since the impact of
macroprudential policy might differ depending on the underlying economic
conditions of each bankrsquos home country For example the impact of shocks may
be larger for economies that were under stress and hence rely more on rescue
packages and foreign financing (IMF 2015a) These economies would not have
the same ability to support effectively their banking systems in times of distress
13
We investigate the role of sovereigns by searching among each bankrsquos home-
country GDP growth the primary surplus over GDP and public debt over GDP
42 Connectedness matrix
We estimate a VARX model with two lags (p=2) for the endogenous variables
and contemporaneous exogenous variables (q=0)
The vector of endogenous variables (y) consists of log differences of daily CDS
spreads for the 77 banks By including the exogenous variables we account for
common factors that affect at the same time all bank CDS spreads (Bekaert et al
2005)
421 Bayesian VAR
The suggested model has many more parameters than observations overfits
the data in-sample and as a consequence could perform poorly Researchers
working in the relevant literature typically use prior shrinkage on the
parameters to overcome such over-parametrization concerns Most flexible
Bayesian priors that result in shrinkage of high-dimensional parameter spaces
rely on computationally intensive Markov Chain Monte Carlo (MCMC) methods
Their application to recursive forecasting exercises can as a consequence be
prohibitive or even infeasible The only exception is a variant of the Minnesota
prior that is based on the natural conjugate prior an idea that has recently been
exploited by Banbura Giannone and Reichlin (2010) and Giannone Lenza and
Primiceri (2012) among others While this prior allows for an analytical formula
ttttt uXBYAYAaY 122110
14
for the posterior there is a cost in terms of flexibility in that a priori all VAR
equations are treated in the same manner see Koop and Korobilis (2010) for a
further discussion of this aspect of the natural conjugate prior
The traditional ldquoMinnesota priorrdquo an empirical-Bayes prior which is due to
Littermann (1979) and co-authors (see eg Doan Litterman and Sims 1984)
still dominates many applications of VAR models in economics The recent
contribution of Giannone Lenza and Primiceri (2012) provides guidance on
selecting the prior hyperparameter controlling shrinkage of the VAR coefficients
Note that computational simplicity is a priority in this paper so that the
Gibbs sampler is preferred compared to other potentially more powerful and
elegant Markov Chain Monte Carlo (MCMC) and Sequential Monte Carlo (SMC)
algorithms for prior selection However we recognize that the flexibility of
choosing the prior freely is one of the main controversial issues associated with
Bayesian analysis and the reason why some researchers view the latter as
subjective It is also the reason why the Bayesian practice especially in the early
days was dominated by non-informative priors as these priors assign equal
probabilities to all possible states of the parameter space with the aim of
rectifying the subjectivity problem We estimate the coefficients of a VAR(2) for
78 banks using the arithmetic returns of each bankrsquos CDS As we explained
above a key concern of users of Bayesian statistics and criticism by critics is the
dependence of the posterior distribution on onersquos prior and for this reason we
specify hyperparameters for the prior
The Bayesian VAR(p) model can be written as
119910119905 = 1198860 + sum 119860119895119910119905minus119895 + 120576119905
119901
119895=1
15
where yt for t = 1 T is an M x 1 vector containing observations on M time series
variables εt is an M x 1 vector of errors α0 is an M x 1 vector of intercepts and Aj
is an M x M matrix of coefficients We assume εt to be iid N (0 Σ) Exogenous
variables are added to the VAR and included in all the derivations below but we
do not do so to keep the notation as simple as possible
422 The connectedness matrix framework
The construction of the diagnostic tool is based on a medium-size Bayesian
vector autoregressive model with exogenous variables (Bayesian VARX) that
accounts for common global and regional trends and is able to include even
bank-specific characteristics Then similar as the framework described by
Diebold and Yilmaz (2009 2012) and the one described by Alter and Beyer
(2013) we construct the spillover matrix in order to capture any potential
spillovers among banks This methodology relies on Generalized Forecast Error
Variance Decomposition (GFEVD) or on Generalized Impulse Response
Functions (GIRF) obtained as shown in Pesaran and Shin (1998) Therefore we
derive Generalized Impulse Response Functions as functions of residuals
together with the interdependent coefficients According to Alter and Beyer
(2012) it is of low importance which methodology we select since they produce
qualitatively similar results
16
Table 6 Contagionconnectedness matrix
Note Variables in the first column are the impulse origin while variables on the top row are the respondents to the shock The cumulative impact is bound between 0 and 1 A value of 05 means that the response variable would be impacted in the same direction with an intensity of 50 the initial unexpected shock in the impulse variable The last column presents the aggregated impact sent (Sum OUT) by each row variable and on the bottom row the aggregated spillover received (Sum IN) by each column variable The bottom-right cell shows total spillover in the system and by dividing this value to the total number of non-diagonal cells we obtain the connectedness index (CI)
In table 2 row variables are the origin of the unexpected shock Column
variables are the respondents of contagion receivers CI represents the
connectedness index calculated as the average response in the contagion matrix
The potential contagion effects are aggregated on each line and column and
represent the total to_others and the total from_others as potential contributions
to contagion from and to each bank The main diagonal values represent the
effect of a variablersquos shock on itself and they are excluded from any calculations
The possible contagion effects answer the question ldquoHow would bank B evolve in
the following period if bank A CDS increases by one unit shockrdquo
We use accumulated Impulse Response functions over a 10-step horizon (10-
days) Not all the banks respond to the shocks within the same period but the
majority of the shocks are absorbed within 10-days Nevertheless the
framework is flexible and it easily adapts to the needs of each study
5 Empirical results
17
51 Individual bank connectedness
We estimate the connectedness matrix as described in section 422 for the
whole sample period 1 January 2008 to 31 June 2017 and estimate the
individual bank connectedness (table 7) which reports several notable results
The evidence do not offer support to the argument that systemic importance of a
bank can be adequately captured by its size According to table 7 the bank that
creates the most systemic risk in the system is Intesa Sanpaolo a medium-sized
European bank that is ranked 27th in terms of total assets with total contagion
effects of 1056 which is further decomposed into 0505 vulnerability-score and
0551 externalities-score For instance the Intesa Sanpaolorsquos 0551 externalities
score implies that one-unit shock in Intesa Sanpaolo will have an impact of
551 to the system while the 0505 vulnerability score means that one-unit
shock to the market will affect Intesa Sanpaolo by 505 Among the top-20
most connected banks can also be found smaller banks like BBVA (3rd) Credit
Lyonnais (10th) Banca Monte dei Paschi (16th) and Mediobanca (20th) while the
largest bank in the sample is listed 50th in terms of systemic importance
The existing literature on the topic suggests that during crises periods large
banks behave differently than small or medium-sized banks (Laeven et al 2014)
This phenomenon could be partially attributed to some common characteristics
that are shared by large banks and are associated with higher levels of risk
namely the increased portion of market-based activities the reduced capital
adequacy the less stable funding and the higher organizational complexity
However it remains unidentified the bank-size threshold above or below which
these criteria are valid Results presented in table 8 provide a more narrow
response to the question whether systemic importance is related to size or not
18
Size per se is a determinant of systemic importance since when banks are
ranked by systemic importance the first quartile compiles the largest percentage
of total assets (34 of total assets) However when the sample is ranked by total
assets and not in terms of connectedness the first quartile represents 62 of
total assets indicating a severe leakage of assets to the other quartiles and
revealing the existence of structural variables that interact with size
The existing frameworks used by regulators and policy makers such as the
BCBSFSB framework rely heavily on size either through size-related indicators
or size per se to calculate the capital adequacy ratios Our results suggest that
the measures taking strong size-effect as granted should also focus on the large
banksrsquo idiosyncratic characteristics that place 50 of G-SIBs in the first quartile
of systemic importance
Table 8 Banks ranked by systemic importance and by assets ndash Number of banks per quartile
Quartile ranked by Number of G-SIBs per quartile
Score Assets
1st Quartile 34 62 48
2nd Quartile 33 224 28
3rd Quartile 18 105 10
4th Quartile 14 51 14
The next step is to calculate the systemic contribution of each bank in the
system as the ratio between the total individual contagion effects and the total
contagion in the system
100TC
TICTSC i
i
y
y
19
TSC is the total systemic contribution TIC is the total individual contagion
effects and TC is the total contagion in the system The bank with the highest
ranking contributes 225 of the total contagion effects while the bank at the
bottom of the table contributes almost 0 (table 9) This measure allows us to
compare the results among samples with different number of entities
We define each bankrsquos directional connectedness as the ratio between the
individual externalities and the total individual contagion
100
i
i
i
y
yOUT
yOUTTIC
IEID or
100
i
i
i
y
yIN
yINTIC
IVID
ID is the individual directionality IE is the individual externalities IV is the
individual vulnerabilities and TIC is total individual contagion The followings
should be always valid
1 ii yINyOUT IDID
ii yINyOUT IDID
In case iyOUTID is larger than 50 it means than the bank that the systemic score
of the bank it refers to is externalities-driven When breaking the results into
quartiles that represent the average individual directionality for all the banks
that belong in this quartile (table 10) we realize that banks with higher TIC tend
to have higher iyOUTID ratios (54) that their peers that belong in the last
quartile (30) We do not suggest that the directionality of contagion
determines the systemic importance of banks because this is beyond control and
difficult to interpret but that in terms of systemic importance that may be
20
interpreted into increased capital requirements is ldquobetter to receive shocks than
to send shocks to the systemrdquo
Table 10 Average Individual Directionality (OUT) per quartile
iyOUTID
1st Quartile 54
2nd Quartile 53
3rd Quartile 47
4th Quartile 30
Note banks are ranked by systemic importance
52 Regional network connectedness
Prior quantifying the transmission of contagion effects we focus on table 7
that reveals a very strong regional effect This is that the first quartile of systemic
importance is exclusively dominated by banks that are headquartered in Europe
implying the existence of a regional component and severe clustering Table 11a
shows the regional concentration per quartile and table 11b expresses the
regional concentration as a percentage of the total number of banks that exist
per region
Table 11a Concentration of banks per region
Quartile Europe Eurozone (as
of EU) N America Asia Oceania Africa
1st Quartile 100 75 - - - -
2nd Quartile 25 25 40 25 10 -
3rd Quartile 50 50 10 30 10 -
4th Quartile 35 75 12 48 - 5
Table 11b Regional concentration as a percentage of total banks per region
21
Quartile Europe N America Asia Oceania Africa
1st Quartile 47 - - - -
2nd Quartile 12 73 25 25 -
3rd Quartile 21 9 35 75 -
4th Quartile 16 18 40 - 100
The next step is to understand the flows of shocks among the different
regions the contagion effects and the degree of connectedness among the
different regions (Table 12a and b) We focus on four regions Europe North
America (expressed by US banks) Asia and Oceania Table 12a shows regionrsquos A
externalities to the other regions as a percentage of regionrsquos A total externalities
while table 12b focuses on the vulnerabilities side Combining the information
obtained by tables 12a and b European and US appear to be strongly
interconnected More precisely 58 of the aggregate shocks that are sent by US
banks are directed to Europe while 64 of the aggregate shocks received by US
banks are generated in Europe Also another important finding is that 69 of
the aggregate shocks that are sent by European banks remain within Europe
Table 12a Shocks sent per region as of total shocks sent per region
Asia Europe NAmerica Oceania
Sum
Asia 41 41 9 9
100
Europe 16 69 960 540
100
NAmerica 1950 58 16 650
100
Oceania 33 4450 950 12
100
22
Table 12b Shocks received per region as of total shocks received per region
Asia Europe NAmerica Oceania
Asia
28 10 13 21
Europe
54 75 64 59
NAmerica
12 12 20 13
Oceania
6 3 3 7
Sum
100 100 100 100
All in all it is obvious that there exists a regional factor that affects
significantly the bank connectedness However it is interesting to find out the
driving forces of this regional component especially in the case of Europe which
has been a special case due to the different transmission channels of the financial
crisis the highly interconnected banking system the feedback loops among
sovereigns and banks and the contagion from one country to the rest of Europe
53 National banking system connectedness
We approach the national banking system first of all by calculating the
average systemic risk per bank for each one of the countries in the sample
(Figure 2) Four out of the first five banks that contributed the most to the global
systemic risk belong to Eurozone French banks contributed the most to
systemic risk while Italy and Spain both of which suffered from banking
systems in distress followed at close range Banks in non-Euro-area countries
like Swiss and UK banks played an important role as well Surprisingly the
average contagion effects for German banks place them almost in the middle of
the table indicating that German banking system may acted as a stability factor
for the European region Both Portuguese and especially Greek banking system
appeared to be isolated from the global banking system
23
Figure 2 Average systemic risk per bank ndash Own shocks are excluded
Note results concern the period January 2008-June 2017
In figure 3 we approach the total contagion from a different perspective by
presenting the total contagion effects for each sovereign This approach may
depends on the number of banks per sovereign but illustrates that US-European
cluster dominates in terms of systemic importance
Figure 3 National systemic risk ndash Own shocks are excluded
Note results concern the period January 2008-June 2017
53 Rolling window
000
010
020
030
040
050
060
070
080
090
100
Fra
nce
Ital
y
Swit
z
Net
her
l
Spai
n
UK
Au
stri
a
Den
mar
k
S K
ore
a
USA
Ru
ssia
Au
stra
lia
Ger
man
y
Swed
en
Mal
aysi
a
Ind
ia
Ch
ina
Bel
giu
m
Sin
gap
ore
Irel
and
S A
fric
a
Jap
an
Po
rtu
gal
Tai
wan
Gre
ece
Tu
rkey
000
100
200
300
400
500
600
700
USA U
K
Fra
nce
Ital
y
Spai
n
S K
ore
a
Ger
man
y
Jap
an
Au
stra
lia
Swed
en
Swit
z
Net
her
l
Ch
ina
Bel
giu
m
Sin
gap
ore
Au
stri
a
Den
mar
k
Po
rtu
gal
Ru
ssia
Mal
aysi
a
Ind
ia
Irel
and
S A
fric
a
Tai
wan
Gre
ece
Tu
rkey
24
531 Individual Banks
In order to better understand the evolvement of systemic risk and how this
fluctuated over the whole period we use rolling-window analysis where the
length of the window is 340 days and the step is 150 days Figure 3 presents the
evolution of total contagion over time where strong co-movement and
interconnections among banks are obvious We also discriminate periods where
the cluster of TCI lines is shrinking and systemic risk is becoming more unified
which means that systemic and idiosyncratic shocks are propagated more
intensely via the network
Figure 3 Total Individual Contagion
Note The length of the window is 340 days and the step is 150 days
We introduce the range as a new metric of systemic risk unification Range at
each point in time is defined as the difference between the highest and the
lowest score in the system (Figure 4) The lowest the score the more unified the
000
020
040
060
080
100
120
Jan
-08
May
-08
Sep
-08
Jan
-09
May
-09
Sep
-09
Jan
-10
May
-10
Sep
-10
Jan
-11
May
-11
Sep
-11
Jan
-12
May
-12
Sep
-12
Jan
-13
May
-13
Sep
-13
Jan
-14
May
-14
Sep
-14
Jan
-15
May
-15
Sep
-15
Jan
-16
May
-16
Sep
-16
Jan
-17
May
-17
25
systemic risk is becoming Given the predictive power of CDS spreads this new
measure could be used by regulators and policymakers as an early-warning tool
However it remains an open question what is the threshold below which the
unification of systemic risk could consist a problem It is remarkable that the
most ldquolooserdquo links were observed during the post-Lehman collapse in late 2008
and reached its lowest price at the beginning of Greek crisis
Figure 4 Systemic risk range
Note The length of the window is 340 days and the step is 150 days
532 Global banking system
In this part we are interested in understanding the behavior of aggregate
contagion effects Total Systemic risk (TSR) is defined as the total of the off-
0
01
02
03
04
05
06
07
08
09
1
Jan
-08
May
-08
Sep
-08
Jan
-09
May
-09
Sep
-09
Jan
-10
May
-10
Sep
-10
Jan
-11
May
-11
Sep
-11
Jan
-12
May
-12
Sep
-12
Jan
-13
May
-13
Sep
-13
Jan
-14
May
-14
Sep
-14
Jan
-15
May
-15
Sep
-15
Jan
-16
May
-16
Sep
-16
Jan
-17
May
-17
26
diagonal entries in the connectedness matrix or as the sum of the ldquofromrdquo column
or ldquotordquo row measures total connectedness
N
ijji
H
ij
H IRTSR 1
We could plot a moving contagion measure defined as the sum of all IRFs ldquoto
others but we go one step further and we choose to present the Total Contagion
index (TCI) which is calculated as the average response per bank in the
connectedness matrix and is calculated as the sum of all non-diagonal cells
divided by the total number of entities
N
i j yy jiIR
NTCI
1 1
1
Cumulative IRs interval is [01] the index will be bound between 0 and 100
Higher contagion index implies a tightening of the nexus among banks (Figure
5)
Figure 5 Total Connectedness (TC)
Note The length of the window is 340 days and the step is 150 days
000
500
1000
1500
2000
2500
3000
3500
4000
4500
Jan
-08
May
-08
Sep
-08
Jan
-09
May
-09
Sep
-09
Jan
-10
May
-10
Sep
-10
Jan
-11
May
-11
Sep
-11
Jan
-12
May
-12
Sep
-12
Jan
-13
May
-13
Sep
-13
Jan
-14
May
-14
Sep
-14
Jan
-15
May
-15
Sep
-15
Jan
-16
May
-16
Sep
-16
Jan
-17
May
-17
27
Total connectedness reached its peak after Lehman collapse and was
severely affected by the developments in the European banking and sovereign
debt markets that shocked some EU member countries until mid-2012 The
Greek crisis and then the fact that in the early 2011 Italy and Spain joined the
countries with stressed banking systems pushed total connectedness upwards
After the early 2012 the actions taken by the ECB constrained total contagion
but after early 2015 higher political uncertainty following the outcomes of the
UK referendum on EU membership and the US election as well as market
concerns about euro area banksrsquo longer-term profitability prospects played their
role and contributed to the severe increase in the index At the same time
continued accommodative monetary policy in advanced economies and abating
market concerns about the possibility of a sharp slowdown in China have
dampened spikes in systemic stress Also a major concern for global markets
was the crisis in Deutsche Bank and its deep connections to global financial
institutions
From a policy perspective the most pressing issue for euro area financial
institutions remains the high level of NPLs which needs to be addressed The
resolution of systemic NPL problems will take time and requires a
comprehensive strategy involving coordination of all relevant stakeholders
533 Rolling Window ndash Regional Systemic Contribution (RSC)
We calculate the systemic contribution of each region as the ratio between
the total regional contagion effects and the total contagion in the system We
focus on Europe North America (US) and Euro-area since these regions
28
dominated in terms of systemic risk during the period Figure 8 compares the
systemic contribution of these regions Surprisingly the share of systemic risk
that European banks hold increased after 2014 while the contribution of US
banks remains increasingly lower than European banksrsquo contribution after mid-
2012 The difference between the systemic contribution of European and US
banks fluctuates between 40 and 55
Figure 8 European US and Euro-area banksrsquo contribution to total systemic risk
(as a of total systemic risk)
Note US banksrsquo contribution is presented in secondary axis
54 Principal Component Analysis
We use PCA analysis in which the banksrsquo CDS spreads are decomposed into
orthogonal factors of decreasing explanatory power to identify the increased
000
500
1000
1500
2000
2500
000
1000
2000
3000
4000
5000
6000
7000
8000
Jan
-08
May
-08
Sep
-08
Jan
-09
May
-09
Sep
-09
Jan
-10
May
-10
Sep
-10
Jan
-11
May
-11
Sep
-11
Jan
-12
May
-12
Sep
-12
Jan
-13
May
-13
Sep
-13
Jan
-14
May
-14
Sep
-14
Jan
-15
May
-15
Sep
-15
Jan
-16
May
-16
Sep
-16
Jan
-17
May
-17
EU Euroarea US
29
commonality among the default risk of banks (see Muirhead 1982 for an
exposition of PCA)
Let 119884119905 be the log difference of bankrsquos i CDS i=1hellip77 let the systemrsquos
aggregate credit risk be represented by the sum 119884119878 = sum 119884119894119894 and let 119864[119884119894] = 120583119894
and Var[119877119894] = 1205901198942 Then we have
1205901199042 = sum sum 120590119894120590119895120550[119911119894119911119895]
119873
119895=1
119873
119894=1
where 119911119896 = (119877119896 minus 120583119896)120590119896 k=ij
where 119911119896 is the CDS of bank k and 1205901199042 is the variance of the system
PCA produces the decomposition of the variance-covariance matrix of CDS
spreads of the 77 banks contained in the sample into the orthogonal matrix of
loadings L (eigenvector of the correlation matrix of CDS spreads) and the
diagonal matrix of eigenvalues Λ
We focus on the first three eigenvalues as they explain most of the variation
in the system These three eigenvalues are supposed to explain a larger portion
of the total volatility in the system when the CDS spreads are moving together or
in other words when systemic risk in more unified So periods when the first
three components explain most of the total volatility indicates the existence of
increased interconnectedness among banks The first component that is
extracted accounts for the maximum amount of total variance in the observed
variables In other words the proportion of explained variance by the first
component shows how much of the variations in the CDS spreads can be
explained by one common factor This result is in line with Fontana and
Scheicher (2010) who finds there to be a single large determinant dominating
the variation in the CDS spread where the proportion of explained variance by
30
factor 1 exceeds 80 According to Billio et al (2012) during periods of distress
fewer components explain larger part of the volatility which means that the
fluctuation of the first principal component while taking into account the
predictive power that CDS carry reveal periods of increased systemic risk
We run rolling window analysis where the length of the window is 200 days
and the step is 100 days over the period January 2008 to June 2017 and the
results indicate the existence of a single dominant component that determines
the fluctuations of CDS spreads (Figure 9)
Figure 9 Rolling Principal Components analysis
Note The length of the window is 200 days and the step is 100 days
Investigating the determinants of the loadings of each bank to the first
principal component through rolling cross-sectional analysis will reveal the
driving forces of systemic risk on a yearly basis over the period 2008-2016 For
that reason we use rolling cross-sectional analysis
0
10
20
30
40
50
60
Jan
-08
Jun
-08
No
v-0
8
Ap
r-0
9
Sep
-09
Feb
-10
Jul-
10
Dec
-10
May
-11
Oct
-11
Mar
-12
Au
g-1
2
Jan
-13
Jun
-13
No
v-1
3
Ap
r-1
4
Sep
-14
Feb
-15
Jul-
15
Dec
-15
May
-16
Oct
-16
comp1 comp2 comp3
31
ii
iiiiiii
Debt
SurplusGDPNIINPLsLoansAssetsay
7
654321
yi is each bankrsquos loading to the first component
We search among the following bank-specific characteristics total value of
bank assets (logs) retail orientation the total loanstotal assets (levels) NPLs
total loans (levels) and non-interest income total revenue and among the
following home-country specific characteristics GDP growth primary
surplusGDP (levels) public debtGDP (levels) We manage to match 47 banks to
bank-specific characteristics
Table 13 Determinants of each bankrsquos loadings in the first component over the nine
periods
2008 2009 2010 2011 2012 2013 2014 2015 2016
Size -0012 -0002 -0007 -0012 0001 0004 0001 -0002 -0003
(0008) (0007) (0006) (0006) (0007) (0006) (0010) (0008) (0009)
Loan-to-assets -0048 -0142 -0113 -0136 -0135 -0114 -0212 -0210 -0239
(0043) (0051) (0051) (0051) (0054) (0051) (0078) (0069) (0074)
NPLs 0844 0414 0352 0035 0004 -0097 0333 0304 0194
(0349) (0253) (0187) (0183) (0054) (0139) (0187) (0147) (0174)
Non-interest-income 0000 0000 0001 0000 0001 0000 0001 0000 0000
(0000) (0000) (0006) (0006) (0000) (0000) (0000) (0000) (0000)
GDP -0004 -0003 -0006 -0003 -0009 -0009 -0011 -0004 -0007
(0004) (0002) (0001) (0003) (0054) (0003) (0005) (0001) (0006)
Primary SurplusGDP 0000 -0002 0002 0000 -0002 -0004 -0009 -0014 -0012
(0002) (0001) (0001) (0170) (0054) (0003) (0004) (0004) (0005)
DebtGDP -0001 -00005 -00006 -0001 -00007 -00005 -00005 0000 -0000
(0000) (0000) (0000) (0000) (0054) (0000) (0000) (0000) (0000)
_cons 0300 0235 0297 0372 0248 0229 0252 0283 0323
(0080) (0076) (0068) (0078) (0054) (0072) (0111) (0094) (0107)
Note 1 510
32
6 Conclusions
Macroprudential policy is still in its infancy Much work is still needed on
developing good and timely analysis effective policy instrument tools and
effective implementation Our paper makes a contribution on the dimension of
analysis and measurement The key aim of macroprudential policy is to address
externalities and spillovers among financial institutions in an effort to safeguard
financial stability These interactions are complex We provide a tool for
clarifying and quantifying these interactions Our measures can guide
appropriate macroprudential policies that aim to internalize these externalities
A key conclusion from our study is that the focus on size does not adequately
address the systemic importance of banks
33
References
Acharya V Engle R Richardson M 2012 Capital Shortfall A New Approach to
Ranking and Regulating Systemic Risks American Economic Review Vol102 No
3
Acharya V Pedersen L Philippon T Richardson M 2010 Measuring systemic
risk Technical Report Department of Finance NYU
Acharya V Drechsler I Schnabl P 2014 A Pyrrhic Victory Bank Bailouts and
Sovereign Credit Risk Journal of Finance 2014 vol 69 issue 6 2689-2739
Adams Z Fuss R Gropp R 2014 Spillover Effects among Financial
Institutions A State-Dependent Sensitivity Value-at-Risk (SDSVaR) Approach
Journal of Financial and Quantitative Analysis (JFQA) Vol 49 No 3
Adrian T Brunnermeier M 2009 CoVaR Manuscript Princeton University
Aizenman J Hutchison H and JinjarakY (2013) lsquoWhat is the Risk of European
Sovereign Debt Defaults Fiscal Space CDS Spreads and Market Pricing of Riskrsquo
Journal of International Money and Finance 34 37-59
Allen F A Babus and E Carletti (2012) Asset commonality debt maturity and
systemic risk Journal of Financial Economics 104(3) 519ndash534
Alter A Beyer A 2013 The dynamics of spillover effects during the European
sovereign debt turmoil Journal of Banking and Finance 42 134-153
Altunbas Y Manganelli S Marques-Ibanez D 2011 Bank risk during the
financial crisis Do business models matter ECB Working Paper No 1394
Ang A Longstaff F 2011 Systemic sovereign credit risk Lessons from the US
and Europe NBER discussion paper 16983
Ayadi R Arbak E De Groen W 2011 Business Models in European Banking A
pre-and post-crisis screening CEPS Paperbacks
34
Banbura M Giannone D Reichlin L 2011 Nowcasting Oxford Handbook on
Economic Forecasting ed by M P Clements and D F Hendry pp 63ndash90 Oxford
University Press
Bank for Internaional Settlements 2010 Guidance for national authorities
operating the countercyclical capital buffer
Bank for Internaional Settlements 2011 Global systemically important banks
Assessment methodology and the additional loss absorbency requirement
Basel Committee on Banking Supervision 2010 Basel III A global regulatory
framework for more resilient banks and banking systems Bank for International
Settlements
Basu S Das S Michailidis G Purnanandam A 2017 A system-wide approach
to measure connectivity in the financial sector Unpublished
Benoit S Colliard J-E Hurlin C Perignon C 2015 Where the risks lie A
survey on systemic risk Unpublished working paper
Billio M Getmansky M Lo A W Pelizzon L 2012 Econometric measures of
systemic risk in the finance and insurance sectors Journal of Financial
Economics 104 535ndash559
Brownlees CT Engle RF 2010 Volatility correlation and tails for systemic
risk measurement Manuscript Stern School of Business New York University
Canova F and Pappa P 2007 Price Differentials in Monetary Unions The Role
of Fiscal Shocks Economic Journal 117 2007 713-737
Castro C Ferrari S 2014 Measuring and testing for the systemically important financial institutions Journal of Empirical Finance 2014 vol 25 issue C 1-14 Cerutti E Claessens S Laeven L 2015 The Use and Effectiveness of
Macroprudential Policies New Evidence IMF Working Paper No 1561
Crockett A 2000 Marrying the Micro- and Macro-prudential Dimensions of
Financial Stability Eleventh International Conference of Banking Supervisors
held in Basel 20-21
35
De Santis R (2012) ldquoThe euro area sovereign debt crisis Safe haven credit
rating agencies and the spread of the fever from Greece Ireland and Portugalrdquo
ECB Working Paper 1419
DellrsquoAriccia G Igan D Laeven L Tong H Bakker B Vandenbussche J 2012
Policies for Macrofinancial Stability How to Deal with Credit Booms IMF Staff
Discussion Note 1206
Demirer M Diebold F Liu L Yilmaz K 2017 Estimating global bank network
connectedness Journal of Applied Eeconometrics forthcoming
Diebold F X Yilmaz K 2009 Measuring Financial Asset Return and Volatility
Spillovers with Application to Global Equity Markets The Economic Journal
119(534) 158-171
Diebold F X Yilmaz K 2012 Better to give than to receive Predictive
directional measurement of volatility spillovers International Journal of
Forecasting Issue 28 pp 57-66
Doan T Litterman R Sims CA 1984 Forecasting and Conditional Projections
Using Realistic Prior Distributions Econometric Reviews 3(4) 1ndash 100
Elliott D J Feldberg G Lehnert A 2013 The History of Cyclical
Macroprudential Policy in the United States Office of Financial Research
Working Paper No 8
European Central Bank 2016 Macroprudential Bulletin Issue 12016
Financial Stability Board 2011 Measures to address systemically important
financial institutions
Fontana A Scheicher M 2010 An analyisis of euro area sovereign CDS and
their relation with government bonds ECB Working Paper Series Issue 1271
Fostel A Geanakoplos J 2008 Leverage Cycles and the Anxious Economy
American Economic Review 98 (4) 1211ndash1244 [2196]
36
Geanakoplos J Pedersen L H 2014 Monitoring leverage In Brunnermeier M
K Krishnamurthy A (Eds) Risk Topography Systemic Risk and Macro
Modeling NBER pp 175ndash182
Giannone D Lenza M Primiceri GE 2012 Prior Selection for Vector
Autoregressions CEPR Discussion Papers 8755 CEPR Discussion Papers
Giglio S Kelly B T Pruitt S 2015 Systemic risk and the macroeconomy An
empirical evaluation Journal of Financial Economics 2016 vol 119 issue 3 457-
471
Goacutemez-Puig M amp Sosvilla-Rivero S (2014) EMU sovereign debt markets crisis
Fundamental-based or pure contagion Institut de Recerca en Economia
Aplicada (IREA) Working Papers Universitat de Barcelona 201402
Huang X Zhou H Zhu H 2012 Systemic Risk Contributions Journal of
Financial Services Research 2012 vol 42 issue 1 55-83
International Monetary Fund 2013a The Interaction of Monetary and
Macroprudential Policies Washington International Monetary Fund
International Monetary Fund 2015a Financial Operations
Koumlhler M 2013 Does non-interest income make banks more risky Retail-
versus investment oriented banks Deutsche Bundesbank Discussion Paper
No172013
Koop G Korobilis D 2010 Bayesian Multivariate Time Series Methods for
Empirical Macroeconomics Foundations and Trends in Econometrics Vol 3 No
4 pp 267-358
Litterman Robert B 1979 Techniques of forecasting using vector
autoregressions Research Department Working Paper 115 Federal Reserve
Bank of Minneapolis Minnesota
37
Longstaff F Pan J Pedersen L Singleton K 201 How Sovereign Is Sovereign
Credit Risk American Economic Journal Macroeconomics 2011 vol 3 issue 2
75-103
Pesaran H Shin Y 1998 Generalized impulse response analysis in linear
mulitvariate models Economic Letters 58(1) 17-29
White H Kim TH Manganelli S 2008 Modeling autoregressive conditional
skewness and kurtosis with multi-quantile CAViaR In Russell J Watson M
(Eds) Volatility and Time Series Econometrics A Festschrift in Honor of Robert
F Engle
Part B
We study 77 banks from 26 developed and emerging economies Data are downloaded from Thomson-Reuters and cover the period from January 1st 2008 to June 30th 2017 The first sample contains 77 banks are from 19 developed economies while the rest are from 6 emerging economies (as of IMFrsquos list) The sample contains most of the banks that are designated as ldquoglobal systemically important banksrdquo (ldquoGSIBrsquosrdquo) as designated by the Basel Committee on Banking Supervision except for three Chinese banks (Agricultural Bank of China Bank of China and Industrial and Commercial Bank of China) and one French bank Group BPCE 43 out of the 77 banks (544) in the sample are from Europe while 28 of them (3544) are headquartered in Eurozone members The sample is extended by adding 19 smaller European banks
B Sample Presentation Bank Details Descriptive Statistics Tables 2a and b presents the 77 banks in the sample in the worldrsquos top 150 as they ordered by assets (Q4 2016) Table A3 presents the share of assets that each home-country holds in the sample as well as the share of assets per developed and emerging countries while Table A4 presents the share of assets per region Table A5 presents the 14 European banks that are added to the initial sample
Table 2a Banks ordered by Total Assets (in US $ billion)
Rank Bank Name Country Total assets
38
US$B
1 Bank of China China 2613 2 Mitsubishi UFJ Financial Group Japan 2597 3 JPMorgan Chase amp Co USA 2490 4 HSBC Holdings UK 2374 5 BNP Paribas France 2196
6 Bank of America USA 2187 7 Wells Fargo USA 1930 8 China Development Bank China 1904 9 Credit Agricole Group France 1821 10 Citigroup USA 1792
11 Mizuho Financial Group Japan 1757 12 Deutsche Bank Germany 1682 13 Sumitomo Mitsui Financial Group Japan 1654 14 Barclays PLC UK 1490 15 Societe Generale France 1461
16 Banco Santander Spain 1416 17 Lloyds Banking Group UK 1004 18 Norinchukin Bank Japan 984 19 Royal Bank of Scotland Group UK 981 20 UBS Group AG Switzerland 919
21 Unicredit SpA Italy 908 22 ING Groep NV Netherlands 893 23 Goldman Sachs Group USA 860 24 Morgan Stanley USA 814 25 Credit Suisse Group Switzerland 806
Table 2a ndash Continued from previous page
26 BBVA Spain 773 27 Intesa Sanpaolo Italy 766 28 Commonwealth Bank of Australia Australia 703 29 Rabobank Group Netherlands 700 30 Australia amp New Zealand Banking Group Australia 661
31 Nordea Sweden 651 32 Standard Chartered Plc UK 646 33 Westpac Banking Corp Australia 607 34 National Australia Bank Australia 562 35 Commerzbank Germany 549
36 Danske Denmark 495 37 State bank of India India 492 38 US Bancorp USA 445 39 The Export-Import Bank of China China 427 40 Sberbank of Russia Russia 420
41 Resona Japan 412 42 Sumitomo Mitsui TH Japan 406 43 Nomura Holdings Japan 370 44 PNC Financial Services USA 366 45 Capital One Financial Corporation USA 357
46 DBS Group Holdings Singapore 332 47 Shinhan Financial Group South Korea 328 48 KBC Group NV Belgium 291 49 Svenska Handelsbanken Sweden 289 50 Skandinaviska Enskilda Banken Sweden 289
51 Hana Financial Group South Korea 288 52 Nationwide Building Society UK 276 53 Korea Development Bank South Korea 268
39
54 Woori Bank South Korea 257 55 Landesbank Baden-Wurttemberg Germany 257
56 Cathay Financial Holding Taiwan 252 57 Swedbank Sweden 237 58 United Overseas Bank (UOB) Singapore 235 59 Dexia Belgium 225 60 Banco Sabadell Spain 224
61 Bayerische Landesbank Germany 224 62 Erste Group Bank AG Austria 220 63 Banco Popular Espanol Spain 204 64 Industrial Bank of Korea South Korea 196 65 Bank of Ireland Ireland 182
66 Malayan Malaysia 161 67 Standard Bank Group South Africa 161 68 Banca Monte dei Paschi di Siena Italy 161 69 American Express USA 158 70 National Bank of Greece Greece 153 71 Macquarie USA 143
72 Credit Lyonnais France 120 73 Comercial Portuguese Portuguese 113 74 Banco Espirito Santo Portugal 112 75 Turkiye is bankasi Turkey 112 76 Mediobanca Italy 95
77 Landesbank Hessen Germany 92
Table 2b Banks ordered by Country
Rank Bank Country Total assets
US$B
1 Commonwealth Bank of Australia Australia 703 2 Australia amp New Zealand Banking Group Australia 661 3 Westpac Banking Corp Australia 607 4 National Australia Bank Australia 562
5 Erste Group Bank AG Austria 220
6 KBC Group NV Belgium 291 7 Dexia Belgium 225
8 Bank of China China 2613 9 China Development Bank China 1904
10 The Export-Import Bank of China China 427
11 Danske Denmark 495
12 BNP Paribas France 2196 13 Credit Agricole Group France 1821 14 Societe Generale France 1461 15 Credit Lyonnais France 120
16 Deutsche Bank Germany 1682 17 Commerzbank Germany 549 18 Landesbank Baden-Wurttemberg Germany 257 19 Bayerische Landesbank Germany 224 20 Landesbank Hessen Germany 92
21 National Bank of Greece Greece 153
22 State bank of India India 492
23 Bank of Ireland Ireland 182
24 Unicredit SpA Italy 908 25 Intesa Sanpaolo Italy 766
40
26 Banca Monte dei Paschi di Siena Italy 161 27 Mediobanca Italy 95
28 Mitsubishi UFJ Financial Group Japan 2597 29 Mizuho Financial Group Japan 1757 30 Sumitomo Mitsui Financial Group Japan 1654 31 Norinchukin Bank Japan 984 32 Resona Japan 412 33 Sumitomo Mitsui TH Japan 406 34 Nomura Holdings Japan 370 35 Yamaguchi Financial Group Japan 93
36 ING Groep NV Netherlands 893 37 Rabobank Group Netherlands 700
38 Banco Espirito Santo Portugal 111
39 Sberbank of Russia Russia 420
40 DBS Group Holdings Singapore 332 41 United Overseas Bank (UOB) Singapore 235 42 Standard Bank Group South Africa 161
43 Shinhan Financial Group South Korea 328 44 Hana Financial Group South Korea 288 45 Korea Development Bank South Korea 268 46 Woori Bank South Korea 257 47 Industrial Bank of Korea South Korea 196
48 Banco Santander Spain 1416 49 BBVA Spain 773 50 Banco Sabadell Spain 224 51 Banco Popular Espanol Spain 204
Table 2b ndash Continued from previous page
53 Nordea Sweden 651 54 Svenska Handelsbanken Sweden 289 55 Skandinaviska Enskilda Banken Sweden 289 56 Swedbank Sweden 237
57 UBS Group AG Switzerland 919 58 Credit Suisse Group Switzerland 806
59 Cathay Financial Holding Taiwan 252
60 Turkiye is bankasi Turkey 112
61 HSBC Holdings UK 2374 62 Barclays PLC UK 1490 63 Lloyds Banking Group UK 1004 64 Royal Bank of Scotland Group UK 981 65 Standard Chartered Plc UK 646 66 Nationwide Building Society UK 276
68 JPMorgan Chase amp Co USA 2490 69 Bank of America USA 2187 70 Wells Fargo USA 1930 71 Citigroup USA 1792 72 Goldman Sachs Group USA 860 73 Morgan Stanley USA 814 74 US Bancorp USA 445 75 PNC Financial Services USA 366 76 Capital One Financial Corporation USA 357 77 American Express USA 158 78 Macquarie USA 143
41
Table 3a Banksrsquo home-countries ordered by the sum of total bank assets
Developed Total Assets Developing Total Assets USA 11547 China 4944 Japan 7867 India 492 UK 6936 Russia 420 France 5599 Taiwan 252 Germany 2994 South Africa 161 Spain 2617 Turkey 112
Australia 2534 Italy 1933 Switzerland 1725
Netherlands 1584 Sweden 1467 South Korea 1340 Singapore 568 Belgium 516 Denmark 495 Ireland 344 Austria 220 Greece 153 Portugal 111 Total Assets of banks that are headquartered in
Developed 5055366 Emerging 63823 of total assets 888 of total assets 112
42
Table 3b Regional details
Region Number of Banks Total bank
assets of total
assets
Europe 40 2669673 473
Asia 21 1557658 275
N America 11 1154724 204
Oceania 4 2534 45
Africa 1 161 03
B Data Definitions and Descriptive Statistics
Table 4 Data Definitions
Variable Description
Endogenous CDS CDS 5-year spread
Exogenous Systemic risk
CDX The family of CDS indeces covering North America
VIX The volatiliy index of SampP 500
US 3-month T Bill The short-term obligation backed by the Treasury Dept of the US goverment
Bank-specific Size Total assets
Retail orientation Total Loans Total assets
Diversification Non-interest income Total revenues
NPLs Non-performing loans Total Loans
Country-specific
GDP Each bankrsquos home-country GDP growth
Budget Balance Current AccountGDP
Public Debt Public DebtGDP
43
Table 5 Descriptive Statistics
Panel A Systemic risk factor
CDX VIX TED
Mean 269E-06 -0000123 -000121 Median 0000 -0001 0000 Maximum 0020 0176 0250 Minimum -0009 -0152 -0750
Std Dev 0001 0031 0033 Skewness 4689 0689 -17326
Kurtosis 106047 6789 377496 Jarque-Bera 1105896 1679364 14610377 Probability 0000 0000 0000
Sum 0007 -0304 -3000 Sum Sq Dev 0003 2427 2746
Note CDX and VIX are in log differences TED spread is in first differences
Panel B Bank specific
Assets Loans_to_Assets Non_Interest_Inc NPLs
Mean 732382 55596 2442 4601
Median 458009 59921 2378 2411
Maximum 3030645 8664 8640 35217
44
Minimum 4354387 9070 -5962 01082
Std Dev 7460013 17017 1481 5612
Skewness 1081 -0641 -0694 2376
Kurtosis 30129 2584 6193 9630
Jarque-Bera 7023 272888 182117 999501
Probability 0000 0000 0000 0000
Sum 264E+09 2003702 8803746 1658430 Sum Sq Dev 201E+15 1043392 7908036 1134867
Note Data are in levels
Part C ndash Global Sample
Table 7 Individual systemic importance
Panel A ndash Ranked by total score Rank by score
Rank by bank assets Bank Name
Home-Country Region
Assets (billion
US $) Score
To others (Aggr)
From others (Aggr)
1 27 Intesa Sanpaolo Italy Europe 766 1056 0505 0551
2 16 Banco Santander Spain Europe 1416 1038 0464 0574
3 26 BBVA Spain Europe 773 0987 0454 0533
4 5 BNP Paribas France Europe 2196 0982 0445 0537
5 21 Unicredit SpA Italy Europe 908 0975 0489 0485
6 14 Barclays PLC UK Europe 1490 0961 0454 0507
7 12 Deutsche Bank Germany Europe 1682 0954 0428 0526
8 9 Credit Agricole Group France Europe 1821 0942 0424 0518
9 15 Societe Generale France Europe 1461 0940 0427 0512
10 72 Credit Lyonnais France Europe 120 0938 0445 0493
11 17 Lloyds Banking Group UK Europe 1004 0925 0438 0487
12 25 Credit Suisse Group Switz Europe 806 0907 0376 0531
13 35 Commerzbank Germany Europe 549 0904 0410 0494
14 20 UBS Group AG Switz Europe 919 0890 0387 0503
15 32 Standard Chartered Plc UK Europe 646 0870 0419 0451
16 68 Banca Monte dei Paschi Italy Europe 161 0861 0429 0433
45
17 19
Royal Bank of Scotland Group
UK Europe 981 0845 0423 0423
18 29 Rabobank Group Netherl Europe 700 0841 0376 0465
19 22 ING Groep NV Netherl Europe 893 0823 0374 0449
20 76 Mediobanca Italy Europe 95 0821 0389 0433
21 24 Morgan Stanley USA N Amer 814 0752 0315 0437
22 69 American Express USA N Amer 158 0736 0332 0404
23 6 Bank of America USA N Amer 2187 0716 0318 0398
24 23 Goldman Sachs Group USA N Amer 860 0711 0302 0410
25 10 Citigroup USA N Amer 1792 0706 0313 0393
26 4 HSBC Holdings UK Europe 2374 0695 0372 0323
27 62 Erste Group Bank AG Austria Europe 220 0688 0314 0375
28 49 Svenska Handelsbanken Sweden Europe 289 0678 0281 0397
29 53
Korea Development Bank
S Korea Asia 268 0677 0393 0284
30 60 Banco Sabadell Spain Europe 224 0670 0295 0375
31 36 Danske Denmark Europe 495 0663 0296 0367
32 45
Capital One Financial Corp
USA N Amer 357 0662 0260 0401
33 3 JPMorgan Chase amp Co USA N Amer 2490 0658 0257 0401
34 7 Wells Fargo USA N Amer 1930 0653 0259 0394
35 34 National Australia Bank Australia Oceania 562 0622 0376 0247
Table continued on next page
Table 3- Panel A continued from previous page
36 2 Mitsubishi UFJ Financial Japan Asia 2597 0621 0223 0398
37 47 Shinhan Financial Group S Korea Asia 328 0615 0331 0283
38 54 Woori Bank S Korea Asia 257 0612 0333 0278
39 64 Industrial Bank of Korea S Korea Asia 196 0603 0341 0261
40 28 Commonwealth Bank Australia Oceania 703 0599 0388 0211
41 40 Sberbank of Russia Russia Europe 420 0598 0294 0305
42 30 Australia amp N Zealand Australia Oceania 661 0597 0383 0214
43 50 Skandinaviska Enskilda Sweden Europe 289 0578 0262 0316
44 31 Nordea Sweden Europe 651 0574 0289 0285
45 71 Macquarie USA N Amer 143 0572 0321 0251
46 48 KBC Group NV Belgium Europe 291 0568 0241 0327
47 63 Banco Popular Espanol Spain Europe 204 0558 0297 0261
48 61 Bayerische Landesbank Germany Europe 224 0552 0249 0303
49 39 The Export-Import Bank China Asia 427 0548 0284 0264
50 1 Bank of China China Asia 2613 0548 0276 0272
51 66 Malayan Malaysia Asia 171 0543 0321 0223
52 33 Westpac Banking Corp Australia Oceania 606 0540 0374 0166
53 37 State bank of India India Asia 492 0530 0238 0291
54 51 Hana Financial Group S Korea Asia 288 0518 0290 0227
55 57 Swedbank Sweden Europe 237 0486 0253 0233
56 8 China Development Bank China Asia 1904 0468 0260 0208
46
57 52 Nationwide Building Society UK Europe 276 0463 0217 0246
58 59 Dexia Belgium Europe 225 0409 0197 0212
59 46 DBS Group Holdings Singapore Asia 332 0397 0212 0186
60 65 Bank of Ireland Ireland Europe 182 0379 0197 0182
61 58 United Overseas Bank Singapore Asia 235 0373 0214 0159
62 11 Mizuho Financial Group Japan Asia 1757 0367 0271 0096
63 67 Standard Bank Group S Africa Africa 161 0365 0123 0242
64 74 Espirito Santos Portugal Europe 112 0362 0186 0176
65 41 Resona Japan Asia 412 0357 0263 0094
66 13 Sumitomo Mitsui Financial Japan Asia 1654 0355 0250 0104
67 38 US Bancorp USA N Amer 445 0353 0188 0165
68 55 Landesbank Baden-Wurtt Germany Europe 257 0340 0170 0171
69 42 Sumitomo Mitsui TH Japan Asia 406 0323 0273 0050
70 56 Cathay Financial Holding Taiwan Asia 252 0298 0189 0109
71 73 Comercial Portuguese Portugal Europe 113 0279 0268 0011
72 70 National Bank of Greece Greece Europe 153 0220 0176 0044
73 18 Norinchukin Bank Japan Asia 984 0215 0164 0050
74 43 Nomura Holdings Japan Asia 370 0197 0161 0035
75 77 Landesbank Hessen Germany Europe 92 0159 0089 0071
76 44 PNC Financial Services USA N Amer 366 0078 0034 0043
77 75 Turkiye is bankasi Turkey Europe 112 0037 0030 0007
Note Results concern the period January 2008 ndash June 2017 and are of daily frequency
Table 9 Systemic contribution per bank (January 2008 ndash June 2017)
Rank Bank Name SC Rank Bank Name SC Rank Bank Name SC Rank Bank Name SC
1 Intesa Sanpaolo
225 21 Morgan Stanley 160 41 Sberbank of Russia
128 61 United Overseas
080
2 Banco Santander
221 22 American Express
157 42 Australia amp N Zealand
127 62 Mizuho Financial
078
3 BBVA 210 23 Bank of America
153 43 Skandinaviska Enskilda
123 63 Standard Bank Group
078
4 BNP Paribas 209 24 Goldman Sachs Group
152 44 Nordea 122 64 Espirito Santos
077
5 Unicredit SpA
208 25 Citigroup 151 45 Macquarie 122 65 Resona 076
6 Barclays PLC 205 26 HSBC Holdings 148 46 KBC Group NV
121 66 Sumitomo Mitsui
076
7 Deutsche Bank
203 27 Erste Group 147 47 Banco Popular
119 67 US Bancorp
075
8 Credit Agricole
201 28 Svenska 145 48 Bayerische Landesbank
118 68 Landesbank 072
9 Societe Generale
200 29 Korea Development Bank
144 49 The Export-Import
117 69 Sumitomo Mitsui TH
069
10 Credit Lyonnais
200 30 Banco Sabadell 143 50 Bank of China 117 70 Cathay Financial
064
11 Lloyds Banking
197 31 Danske 141 51 Malayan 116 71 Comercial Portuguese
059
47
12 Credit Suisse Group
193 32 Capital One Financial Corp
141 52 Westpac Banking Corp
115 72 NBG 047
13 Commerzbank 193 33 JPMorgan Chase amp Co
140 53 State bank of India
113 73 Norinchukin Bank
046
14 UBS Group AG 190 34 Wells Fargo 139 54 Hana Financial Group
110 74 Nomura Holdings
042
15 Standard Chartered
186 35 National Australia Bank
133 55 Swedbank 104 75 Landesbank Hessen
034
16 Banca Monte dei
184 36 Mitsubishi UFJ Financial
132 56 China Development
100 76 PNC Financial Services
017
17 RBS 180 37 Shinhan Financial Group
131 57 Nationwide Building
099 77 Turkiye is bankasi
008
18 Rabobank Group
179 38 Woori Bank 130 58 Dexia 087
19 ING Groep NV 175 39 Industrial Bank of Korea
129 59 DBS Group Holdings
085
20 Mediobanca 175 40 Commonwealth Bank
128 60 Bank of Ireland
081
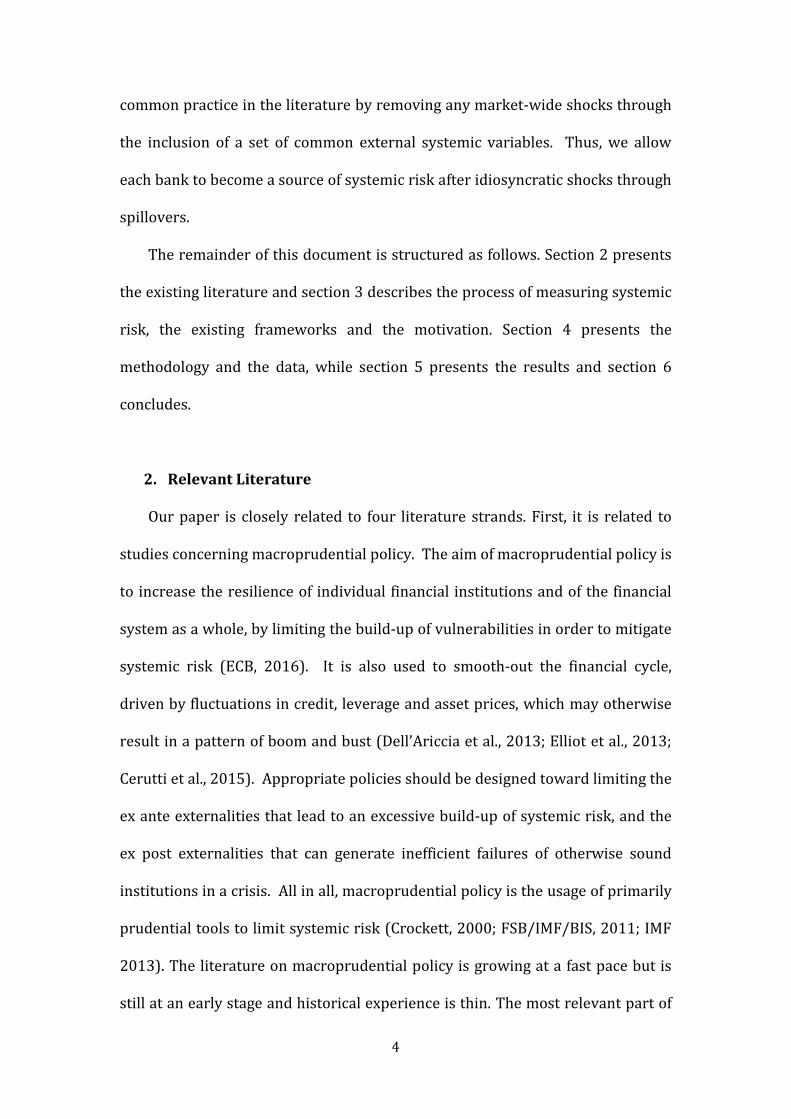
4
common practice in the literature by removing any market-wide shocks through
the inclusion of a set of common external systemic variables Thus we allow
each bank to become a source of systemic risk after idiosyncratic shocks through
spillovers
The remainder of this document is structured as follows Section 2 presents
the existing literature and section 3 describes the process of measuring systemic
risk the existing frameworks and the motivation Section 4 presents the
methodology and the data while section 5 presents the results and section 6
concludes
2 Relevant Literature
Our paper is closely related to four literature strands First it is related to
studies concerning macroprudential policy The aim of macroprudential policy is
to increase the resilience of individual financial institutions and of the financial
system as a whole by limiting the build-up of vulnerabilities in order to mitigate
systemic risk (ECB 2016) It is also used to smooth-out the financial cycle
driven by fluctuations in credit leverage and asset prices which may otherwise
result in a pattern of boom and bust (DellrsquoAriccia et al 2013 Elliot et al 2013
Cerutti et al 2015) Appropriate policies should be designed toward limiting the
ex ante externalities that lead to an excessive build-up of systemic risk and the
ex post externalities that can generate inefficient failures of otherwise sound
institutions in a crisis All in all macroprudential policy is the usage of primarily
prudential tools to limit systemic risk (Crockett 2000 FSBIMFBIS 2011 IMF
2013) The literature on macroprudential policy is growing at a fast pace but is
still at an early stage and historical experience is thin The most relevant part of
5
the literature aims at assessing the systemic importance of G-SIBs The most
important framework is the one developed by Basel Committee on Banking
Supervision (BCBS) The framework compares each bankrsquos activity over twelve
indicators and finally assigns a score to each bank The indicators include the
size the interconnectedness the substitutability the complexity and the cross-
jurisdictional activity of each bank
The BCBS methodology has also been used by Financial Stability Board for
the identification of G-SIBs This methodology has been transposed in the EU
regulatory framework (see Article 131 of the Capital Requirements Directive IV
(CRDIV)) which defines global systemically important institutions or G-SIIs The
BCBSFSB framework for determining systemic risk has some deficiencies It
assigns primal importance to size as all bank characteristics considered are
directly related to size This is a premise that is not necessarily backed by
empirical evidence that the biggest banks are the most dangerous ones for
financial stability In addition the weights assigned to the characteristics are
arbitrary Finally it does not provide any information on the degree of
externalities between a systemically important bank and any other one in the
system Our contribution is to use direct observations on credit risk to measure
externalities between any two banks in the global system In this way we
quantify the degree of danger that any bank may pose to the financial system or
parts of it defined broadly or narrowly Our methodology flexibly updates the
classification dynamically as new information is obtained
The second relevant field of literature has to do with the alternative systemic
risk rankings for financial institutions There is an important number of
methodologies for calculating the exposure of financial institutions to changes in
6
current economic conditions how concentrated the risks are among the financial
institutions and how closely linked they are with each other The first stream has
to do with price-based systemic risk rankings such as banksrsquo VaR (Adams Fuss
and Gropp 2014 White Kim and Manganelli 2015) ∆CoVaR (Adrian and
Brunnermeier 2014 Castro and Ferrari 2014) and MES (Acharya Pedersen
Philippon and Richardson 2010) These measure the VaR or MES of financial
institutions conditional on the entire set of institutions performing poorly The
second group of such metrics incorporates book values as well and includes
SRISK (Acharya Engle and Richardson 2012 Brownlees and Engle 2010)
leverage ratio (Fostel and Geanakoplos 2008 Geanakoplos and Pedersen 2014)
and CAPM beta times market capitalization (Benoit Colliard Hurlin and
Perignon 2015) Finally the distressed insurance premium (DIP) by Huang et al
(2012) measures the insurance premium required to cover distressed losses in
the banking system These closely related approaches have a key weakness
which is that they do not provide information on the pairwise directional
connectedness ie the direction of externalities between any two banks in the
global system In response to this shortcoming some papers (see Billio et al
2012) use Granger causality as a tool to uncover directionality However
Granger causality is unable to consider contemporaneous movements control
for exogenous variables quantify intensities of effects or consider multi-
dimensional networks These are all aspects that our methodology and measure
enables
The third group of relevant papers deals with the estimation of high-
dimensional VAR models Our approach is closely related to the approach
developed by Alter and Beyer (2013) which is based on the framework of
7
Diebold and Yilmaz (2009 2011) The high-dimensionality problem had forced
this research on global bank connectedness to limit their analysis to small
samples of banks Needless to say this is not appropriate when considering bank
importance for the global system A relevant methodology has been recently
suggested by Demirer Diebold Liu and Yilmaz (2017) who use LASSO methods
to shrink select and estimate the high-dimensional network linking the publicly-
traded subset of global banks In a similar vein Basu et al (2017) use Lasso
penalized Vector Autoregressive model to estimate a model that leverages a
system-wide approach to identify systemically important financial institutions in
the US Our distinct approach is to use Bayesian VAR in order to resolve the
dimensionality problem
Finally our paper relates to studies that apply principal components
methods to analyze systemic risk Billio et al (2012) suggested that an
important symptom of systemic risk is the presence of sudden regime shifts
Giglio et al (2015) proposed dimension-reduction estimators for constructing
systemic risk indexes from the cross section of measures and prove their
consistency in a factor model setting We differ by examining the individual bank
loadings on the dominant factor associated with fluctuations in bank CDS
spreads and determining which bank and country characteristics are related to
these This provides solid empirical basis for using relevant characteristics as
indicators to measure systemic importance indirectly
3 Definition of Systemic Importance
8
Systemic risk may originate in an endogenous build-up of financial
imbalances possibly associated with a booming financial cycle large aggregate
shocks hitting the economy or the financial system or contagion effects across
markets intermediaries or infrastructures Our study focuses on contagion
among banks and measures the systemic importance of a bank by the amount of
spillovers it receives from and sends to the rest of the banking system According
to Allen et al (2012) contagion refers to the risk that the failure of one financial
institution leads to the default of others through a domino effect in the interbank
market the payment system or through asset prices More precisely we adopt
the ldquopure-contagionrdquo (Gomez-Puig and Sosvilla Rivero 2013) definition by
controlling only for external common factors through the inclusion of a set of
common external systemic risk factors and assume that each bank could become
itself a source of systemic risk as a result of an idiosyncratic shock
The following example illustrates how we measure the systemic importance
of banks (see Figure 1) Assume that there exist three banks Focusing on bank A
as the source of shocks figure 1 presents the potential impact of an idiosyncratic
shock on bank A to bank B and to bank C respectively Bank A sends a ten-unit
shock to B and a seventeen-unit shock to C a total of 27 Next we focus on the
shocks received by bank A from the other banks in the system Bank A receives a
twenty-one-unit shock from bank B and a five-unit shock from bank C a total of
26 If we sum the shocks that bank A sends to and receives from the system we
obtain an estimate of the degree of connectedness for bank A This is a valid
measure of bank Arsquos systemic importance This procedure is repeated in order to
calculate the systemic importance of bank B and bank C
9
Figure 1 Example of pairwise directional connectedness
Transforming this figure into a table we construct the directional
connectedness matrix
Table 1 Directional connectedness matrix
ShockResponse Bank A Bank B Bank C To Others (Sum_Out)
Bank A - 10 17 27
Bank B 21 - 28 49
Bank C 5 19 - 24
From Other(Sum_In) 26 29 45 100
Score (Sum_Out+Sum_In) 53 78 69
Note Variables in the first column are the impulse origin while variables on the top row are the respondents to the shock
Table 1 presents the entire picture for all three banks in the system Shocks
emanate from row banks to column banks Each row shows the contagion effects
of an equal-sized impulse to the relevant bank in the first column In the last
column we aggregate the total externality effects of each row bank The columns
provide the picture of vulnerability of each bank to shocks in different banks
10
The second to last row is a measure of total vulnerability of a bank to all other
banks in the system It contains the answer to the question ldquoIf all other banks in
the system experienced an idiosyncratic shock of 100 basis points what would
be the impact on bank Xrdquo In the bottom row we aggregate the total externality
effect and the total vulnerability effect of each bank In other words we lump
together shocks sent and received by an individual bank as a measure of total
individual bank connectedness In calculating a bankrsquos systemic importance we
assign equal weights to shocks it sends as to shocks it receives as we are
agnostic as to whether one source of systemic instability is more dangerous than
the other
There are two aspects of financial contagion due to a bankrsquos participation in a
banking system that are of relevance to regulators externalities emanating from
a bankrsquos failure and individual bank vulnerability to financial contagion Both
components are important for regulators but their importance may not be equal
If they are of equal importance then the regulator would consider the sum of
these two However the clear decomposition in Table 1 as well as in our
econometric method allows the regulator to assign different weights in order to
capture the appropriate measure of systemic importance
4 Data and Methodology
41 Data
We study 77 banks from 19 developed and 7 emerging economies Our
selection procedure is as follows We started with the list of the worldrsquos top 150
banks in terms of total assets in Q42016 Using bank names we matched 77
banks to CDS prices from Thomson-Reuters Datastream and Bloomberg CDS
11
spreads cover the period from January 2008 to June 2017 and are at daily
frequency The sample contains all the banks that are designated as ldquoglobal
systemically important banksrdquo (ldquoGSIBrsquosrdquo) by the Basel Committee on Banking
Supervision except for three Chinese banks (Agricultural Bank of China Bank of
China and Industrial and Commercial Bank of China) and one French bank
(Group BPCE) Table 2a (in the Appendix) classifies banks by assets and provides
detail on the 77 banks in the sample such as home-country and total assets
while table 2b (in the Appendix) classifies banks by home-country We note that
40 out of the 77 banks (52) in the sample are from Europe while 28 of them
(34) are headquartered in Eurozone members Tables 3a and 3b (in the
Appendix) provide the regional characteristics of the sample
411 Systemic Risk factor
We will allow for the presence of a global systemic risk factor This permits
us to interpret robustly the results obtained from our model Longstaff et al
(2011) for instance has argued that credit risk appears related to global rather
than country-specific factors while Aizenman et al (2013) has established the
importance of international economic factors in the pricing of credit risk The
variables we chose to employ in order to capture global financial risk conditions
have been widely used in related studies as control variables (see among others
De Santis 2012 Aizenman et al 2013 Ang and Longstaff 2011) The global
default risk conditions are represented by the CDX which is the family of CDS
indices covering North America the VIX volatility index which captures the
global capital marketsrsquo ldquofearrdquo condition and the global liquidity conditions which
is represented by the US 3-month treasury bills The systemic factor is assumed
12
to affect the endogenous variables contemporaneously Table 4 contains the
variable definitions and Table 5 provides descriptive statistics
412 Bank-specific characteristics
A variety of bank- and country-specific variables are used for identifying the
determinants of systemic risk fluctuation over time The first bank-specific
variable is bank size expressed as each bankrsquos total assets (in log) According to
BIS (2011a) the larger a bank is the more likely it is to receive a bailout package
In this sense we also take into consideration the ldquotoo-big-to-failrdquo (TBTF) issue
(Acharya et al 2013) The second bank-specific variable is the loan-to-asset
ratio which provides information on the bankrsquos retail orientation Ayadi et al
(2011) and Koumlhler (2013) suggest that retail-orientated banks appeared to be
less risky than other banks during the recent financial crisis Also according to
Altunbas et al (2011) the non-interest income over total revenue is considered
to be a measure of each bankrsquos diversification since the less a bank relies on
interest income the less exposed the bank is to a negative shock Finally we
include each bankrsquos nonperforming loans over total loans (see Tables 4 and 5)
413 Country-specific characteristics
It is important to include country-specific factors since the impact of
macroprudential policy might differ depending on the underlying economic
conditions of each bankrsquos home country For example the impact of shocks may
be larger for economies that were under stress and hence rely more on rescue
packages and foreign financing (IMF 2015a) These economies would not have
the same ability to support effectively their banking systems in times of distress
13
We investigate the role of sovereigns by searching among each bankrsquos home-
country GDP growth the primary surplus over GDP and public debt over GDP
42 Connectedness matrix
We estimate a VARX model with two lags (p=2) for the endogenous variables
and contemporaneous exogenous variables (q=0)
The vector of endogenous variables (y) consists of log differences of daily CDS
spreads for the 77 banks By including the exogenous variables we account for
common factors that affect at the same time all bank CDS spreads (Bekaert et al
2005)
421 Bayesian VAR
The suggested model has many more parameters than observations overfits
the data in-sample and as a consequence could perform poorly Researchers
working in the relevant literature typically use prior shrinkage on the
parameters to overcome such over-parametrization concerns Most flexible
Bayesian priors that result in shrinkage of high-dimensional parameter spaces
rely on computationally intensive Markov Chain Monte Carlo (MCMC) methods
Their application to recursive forecasting exercises can as a consequence be
prohibitive or even infeasible The only exception is a variant of the Minnesota
prior that is based on the natural conjugate prior an idea that has recently been
exploited by Banbura Giannone and Reichlin (2010) and Giannone Lenza and
Primiceri (2012) among others While this prior allows for an analytical formula
ttttt uXBYAYAaY 122110
14
for the posterior there is a cost in terms of flexibility in that a priori all VAR
equations are treated in the same manner see Koop and Korobilis (2010) for a
further discussion of this aspect of the natural conjugate prior
The traditional ldquoMinnesota priorrdquo an empirical-Bayes prior which is due to
Littermann (1979) and co-authors (see eg Doan Litterman and Sims 1984)
still dominates many applications of VAR models in economics The recent
contribution of Giannone Lenza and Primiceri (2012) provides guidance on
selecting the prior hyperparameter controlling shrinkage of the VAR coefficients
Note that computational simplicity is a priority in this paper so that the
Gibbs sampler is preferred compared to other potentially more powerful and
elegant Markov Chain Monte Carlo (MCMC) and Sequential Monte Carlo (SMC)
algorithms for prior selection However we recognize that the flexibility of
choosing the prior freely is one of the main controversial issues associated with
Bayesian analysis and the reason why some researchers view the latter as
subjective It is also the reason why the Bayesian practice especially in the early
days was dominated by non-informative priors as these priors assign equal
probabilities to all possible states of the parameter space with the aim of
rectifying the subjectivity problem We estimate the coefficients of a VAR(2) for
78 banks using the arithmetic returns of each bankrsquos CDS As we explained
above a key concern of users of Bayesian statistics and criticism by critics is the
dependence of the posterior distribution on onersquos prior and for this reason we
specify hyperparameters for the prior
The Bayesian VAR(p) model can be written as
119910119905 = 1198860 + sum 119860119895119910119905minus119895 + 120576119905
119901
119895=1
15
where yt for t = 1 T is an M x 1 vector containing observations on M time series
variables εt is an M x 1 vector of errors α0 is an M x 1 vector of intercepts and Aj
is an M x M matrix of coefficients We assume εt to be iid N (0 Σ) Exogenous
variables are added to the VAR and included in all the derivations below but we
do not do so to keep the notation as simple as possible
422 The connectedness matrix framework
The construction of the diagnostic tool is based on a medium-size Bayesian
vector autoregressive model with exogenous variables (Bayesian VARX) that
accounts for common global and regional trends and is able to include even
bank-specific characteristics Then similar as the framework described by
Diebold and Yilmaz (2009 2012) and the one described by Alter and Beyer
(2013) we construct the spillover matrix in order to capture any potential
spillovers among banks This methodology relies on Generalized Forecast Error
Variance Decomposition (GFEVD) or on Generalized Impulse Response
Functions (GIRF) obtained as shown in Pesaran and Shin (1998) Therefore we
derive Generalized Impulse Response Functions as functions of residuals
together with the interdependent coefficients According to Alter and Beyer
(2012) it is of low importance which methodology we select since they produce
qualitatively similar results
16
Table 6 Contagionconnectedness matrix
Note Variables in the first column are the impulse origin while variables on the top row are the respondents to the shock The cumulative impact is bound between 0 and 1 A value of 05 means that the response variable would be impacted in the same direction with an intensity of 50 the initial unexpected shock in the impulse variable The last column presents the aggregated impact sent (Sum OUT) by each row variable and on the bottom row the aggregated spillover received (Sum IN) by each column variable The bottom-right cell shows total spillover in the system and by dividing this value to the total number of non-diagonal cells we obtain the connectedness index (CI)
In table 2 row variables are the origin of the unexpected shock Column
variables are the respondents of contagion receivers CI represents the
connectedness index calculated as the average response in the contagion matrix
The potential contagion effects are aggregated on each line and column and
represent the total to_others and the total from_others as potential contributions
to contagion from and to each bank The main diagonal values represent the
effect of a variablersquos shock on itself and they are excluded from any calculations
The possible contagion effects answer the question ldquoHow would bank B evolve in
the following period if bank A CDS increases by one unit shockrdquo
We use accumulated Impulse Response functions over a 10-step horizon (10-
days) Not all the banks respond to the shocks within the same period but the
majority of the shocks are absorbed within 10-days Nevertheless the
framework is flexible and it easily adapts to the needs of each study
5 Empirical results
17
51 Individual bank connectedness
We estimate the connectedness matrix as described in section 422 for the
whole sample period 1 January 2008 to 31 June 2017 and estimate the
individual bank connectedness (table 7) which reports several notable results
The evidence do not offer support to the argument that systemic importance of a
bank can be adequately captured by its size According to table 7 the bank that
creates the most systemic risk in the system is Intesa Sanpaolo a medium-sized
European bank that is ranked 27th in terms of total assets with total contagion
effects of 1056 which is further decomposed into 0505 vulnerability-score and
0551 externalities-score For instance the Intesa Sanpaolorsquos 0551 externalities
score implies that one-unit shock in Intesa Sanpaolo will have an impact of
551 to the system while the 0505 vulnerability score means that one-unit
shock to the market will affect Intesa Sanpaolo by 505 Among the top-20
most connected banks can also be found smaller banks like BBVA (3rd) Credit
Lyonnais (10th) Banca Monte dei Paschi (16th) and Mediobanca (20th) while the
largest bank in the sample is listed 50th in terms of systemic importance
The existing literature on the topic suggests that during crises periods large
banks behave differently than small or medium-sized banks (Laeven et al 2014)
This phenomenon could be partially attributed to some common characteristics
that are shared by large banks and are associated with higher levels of risk
namely the increased portion of market-based activities the reduced capital
adequacy the less stable funding and the higher organizational complexity
However it remains unidentified the bank-size threshold above or below which
these criteria are valid Results presented in table 8 provide a more narrow
response to the question whether systemic importance is related to size or not
18
Size per se is a determinant of systemic importance since when banks are
ranked by systemic importance the first quartile compiles the largest percentage
of total assets (34 of total assets) However when the sample is ranked by total
assets and not in terms of connectedness the first quartile represents 62 of
total assets indicating a severe leakage of assets to the other quartiles and
revealing the existence of structural variables that interact with size
The existing frameworks used by regulators and policy makers such as the
BCBSFSB framework rely heavily on size either through size-related indicators
or size per se to calculate the capital adequacy ratios Our results suggest that
the measures taking strong size-effect as granted should also focus on the large
banksrsquo idiosyncratic characteristics that place 50 of G-SIBs in the first quartile
of systemic importance
Table 8 Banks ranked by systemic importance and by assets ndash Number of banks per quartile
Quartile ranked by Number of G-SIBs per quartile
Score Assets
1st Quartile 34 62 48
2nd Quartile 33 224 28
3rd Quartile 18 105 10
4th Quartile 14 51 14
The next step is to calculate the systemic contribution of each bank in the
system as the ratio between the total individual contagion effects and the total
contagion in the system
100TC
TICTSC i
i
y
y
19
TSC is the total systemic contribution TIC is the total individual contagion
effects and TC is the total contagion in the system The bank with the highest
ranking contributes 225 of the total contagion effects while the bank at the
bottom of the table contributes almost 0 (table 9) This measure allows us to
compare the results among samples with different number of entities
We define each bankrsquos directional connectedness as the ratio between the
individual externalities and the total individual contagion
100
i
i
i
y
yOUT
yOUTTIC
IEID or
100
i
i
i
y
yIN
yINTIC
IVID
ID is the individual directionality IE is the individual externalities IV is the
individual vulnerabilities and TIC is total individual contagion The followings
should be always valid
1 ii yINyOUT IDID
ii yINyOUT IDID
In case iyOUTID is larger than 50 it means than the bank that the systemic score
of the bank it refers to is externalities-driven When breaking the results into
quartiles that represent the average individual directionality for all the banks
that belong in this quartile (table 10) we realize that banks with higher TIC tend
to have higher iyOUTID ratios (54) that their peers that belong in the last
quartile (30) We do not suggest that the directionality of contagion
determines the systemic importance of banks because this is beyond control and
difficult to interpret but that in terms of systemic importance that may be
20
interpreted into increased capital requirements is ldquobetter to receive shocks than
to send shocks to the systemrdquo
Table 10 Average Individual Directionality (OUT) per quartile
iyOUTID
1st Quartile 54
2nd Quartile 53
3rd Quartile 47
4th Quartile 30
Note banks are ranked by systemic importance
52 Regional network connectedness
Prior quantifying the transmission of contagion effects we focus on table 7
that reveals a very strong regional effect This is that the first quartile of systemic
importance is exclusively dominated by banks that are headquartered in Europe
implying the existence of a regional component and severe clustering Table 11a
shows the regional concentration per quartile and table 11b expresses the
regional concentration as a percentage of the total number of banks that exist
per region
Table 11a Concentration of banks per region
Quartile Europe Eurozone (as
of EU) N America Asia Oceania Africa
1st Quartile 100 75 - - - -
2nd Quartile 25 25 40 25 10 -
3rd Quartile 50 50 10 30 10 -
4th Quartile 35 75 12 48 - 5
Table 11b Regional concentration as a percentage of total banks per region
21
Quartile Europe N America Asia Oceania Africa
1st Quartile 47 - - - -
2nd Quartile 12 73 25 25 -
3rd Quartile 21 9 35 75 -
4th Quartile 16 18 40 - 100
The next step is to understand the flows of shocks among the different
regions the contagion effects and the degree of connectedness among the
different regions (Table 12a and b) We focus on four regions Europe North
America (expressed by US banks) Asia and Oceania Table 12a shows regionrsquos A
externalities to the other regions as a percentage of regionrsquos A total externalities
while table 12b focuses on the vulnerabilities side Combining the information
obtained by tables 12a and b European and US appear to be strongly
interconnected More precisely 58 of the aggregate shocks that are sent by US
banks are directed to Europe while 64 of the aggregate shocks received by US
banks are generated in Europe Also another important finding is that 69 of
the aggregate shocks that are sent by European banks remain within Europe
Table 12a Shocks sent per region as of total shocks sent per region
Asia Europe NAmerica Oceania
Sum
Asia 41 41 9 9
100
Europe 16 69 960 540
100
NAmerica 1950 58 16 650
100
Oceania 33 4450 950 12
100
22
Table 12b Shocks received per region as of total shocks received per region
Asia Europe NAmerica Oceania
Asia
28 10 13 21
Europe
54 75 64 59
NAmerica
12 12 20 13
Oceania
6 3 3 7
Sum
100 100 100 100
All in all it is obvious that there exists a regional factor that affects
significantly the bank connectedness However it is interesting to find out the
driving forces of this regional component especially in the case of Europe which
has been a special case due to the different transmission channels of the financial
crisis the highly interconnected banking system the feedback loops among
sovereigns and banks and the contagion from one country to the rest of Europe
53 National banking system connectedness
We approach the national banking system first of all by calculating the
average systemic risk per bank for each one of the countries in the sample
(Figure 2) Four out of the first five banks that contributed the most to the global
systemic risk belong to Eurozone French banks contributed the most to
systemic risk while Italy and Spain both of which suffered from banking
systems in distress followed at close range Banks in non-Euro-area countries
like Swiss and UK banks played an important role as well Surprisingly the
average contagion effects for German banks place them almost in the middle of
the table indicating that German banking system may acted as a stability factor
for the European region Both Portuguese and especially Greek banking system
appeared to be isolated from the global banking system
23
Figure 2 Average systemic risk per bank ndash Own shocks are excluded
Note results concern the period January 2008-June 2017
In figure 3 we approach the total contagion from a different perspective by
presenting the total contagion effects for each sovereign This approach may
depends on the number of banks per sovereign but illustrates that US-European
cluster dominates in terms of systemic importance
Figure 3 National systemic risk ndash Own shocks are excluded
Note results concern the period January 2008-June 2017
53 Rolling window
000
010
020
030
040
050
060
070
080
090
100
Fra
nce
Ital
y
Swit
z
Net
her
l
Spai
n
UK
Au
stri
a
Den
mar
k
S K
ore
a
USA
Ru
ssia
Au
stra
lia
Ger
man
y
Swed
en
Mal
aysi
a
Ind
ia
Ch
ina
Bel
giu
m
Sin
gap
ore
Irel
and
S A
fric
a
Jap
an
Po
rtu
gal
Tai
wan
Gre
ece
Tu
rkey
000
100
200
300
400
500
600
700
USA U
K
Fra
nce
Ital
y
Spai
n
S K
ore
a
Ger
man
y
Jap
an
Au
stra
lia
Swed
en
Swit
z
Net
her
l
Ch
ina
Bel
giu
m
Sin
gap
ore
Au
stri
a
Den
mar
k
Po
rtu
gal
Ru
ssia
Mal
aysi
a
Ind
ia
Irel
and
S A
fric
a
Tai
wan
Gre
ece
Tu
rkey
24
531 Individual Banks
In order to better understand the evolvement of systemic risk and how this
fluctuated over the whole period we use rolling-window analysis where the
length of the window is 340 days and the step is 150 days Figure 3 presents the
evolution of total contagion over time where strong co-movement and
interconnections among banks are obvious We also discriminate periods where
the cluster of TCI lines is shrinking and systemic risk is becoming more unified
which means that systemic and idiosyncratic shocks are propagated more
intensely via the network
Figure 3 Total Individual Contagion
Note The length of the window is 340 days and the step is 150 days
We introduce the range as a new metric of systemic risk unification Range at
each point in time is defined as the difference between the highest and the
lowest score in the system (Figure 4) The lowest the score the more unified the
000
020
040
060
080
100
120
Jan
-08
May
-08
Sep
-08
Jan
-09
May
-09
Sep
-09
Jan
-10
May
-10
Sep
-10
Jan
-11
May
-11
Sep
-11
Jan
-12
May
-12
Sep
-12
Jan
-13
May
-13
Sep
-13
Jan
-14
May
-14
Sep
-14
Jan
-15
May
-15
Sep
-15
Jan
-16
May
-16
Sep
-16
Jan
-17
May
-17
25
systemic risk is becoming Given the predictive power of CDS spreads this new
measure could be used by regulators and policymakers as an early-warning tool
However it remains an open question what is the threshold below which the
unification of systemic risk could consist a problem It is remarkable that the
most ldquolooserdquo links were observed during the post-Lehman collapse in late 2008
and reached its lowest price at the beginning of Greek crisis
Figure 4 Systemic risk range
Note The length of the window is 340 days and the step is 150 days
532 Global banking system
In this part we are interested in understanding the behavior of aggregate
contagion effects Total Systemic risk (TSR) is defined as the total of the off-
0
01
02
03
04
05
06
07
08
09
1
Jan
-08
May
-08
Sep
-08
Jan
-09
May
-09
Sep
-09
Jan
-10
May
-10
Sep
-10
Jan
-11
May
-11
Sep
-11
Jan
-12
May
-12
Sep
-12
Jan
-13
May
-13
Sep
-13
Jan
-14
May
-14
Sep
-14
Jan
-15
May
-15
Sep
-15
Jan
-16
May
-16
Sep
-16
Jan
-17
May
-17
26
diagonal entries in the connectedness matrix or as the sum of the ldquofromrdquo column
or ldquotordquo row measures total connectedness
N
ijji
H
ij
H IRTSR 1
We could plot a moving contagion measure defined as the sum of all IRFs ldquoto
others but we go one step further and we choose to present the Total Contagion
index (TCI) which is calculated as the average response per bank in the
connectedness matrix and is calculated as the sum of all non-diagonal cells
divided by the total number of entities
N
i j yy jiIR
NTCI
1 1
1
Cumulative IRs interval is [01] the index will be bound between 0 and 100
Higher contagion index implies a tightening of the nexus among banks (Figure
5)
Figure 5 Total Connectedness (TC)
Note The length of the window is 340 days and the step is 150 days
000
500
1000
1500
2000
2500
3000
3500
4000
4500
Jan
-08
May
-08
Sep
-08
Jan
-09
May
-09
Sep
-09
Jan
-10
May
-10
Sep
-10
Jan
-11
May
-11
Sep
-11
Jan
-12
May
-12
Sep
-12
Jan
-13
May
-13
Sep
-13
Jan
-14
May
-14
Sep
-14
Jan
-15
May
-15
Sep
-15
Jan
-16
May
-16
Sep
-16
Jan
-17
May
-17
27
Total connectedness reached its peak after Lehman collapse and was
severely affected by the developments in the European banking and sovereign
debt markets that shocked some EU member countries until mid-2012 The
Greek crisis and then the fact that in the early 2011 Italy and Spain joined the
countries with stressed banking systems pushed total connectedness upwards
After the early 2012 the actions taken by the ECB constrained total contagion
but after early 2015 higher political uncertainty following the outcomes of the
UK referendum on EU membership and the US election as well as market
concerns about euro area banksrsquo longer-term profitability prospects played their
role and contributed to the severe increase in the index At the same time
continued accommodative monetary policy in advanced economies and abating
market concerns about the possibility of a sharp slowdown in China have
dampened spikes in systemic stress Also a major concern for global markets
was the crisis in Deutsche Bank and its deep connections to global financial
institutions
From a policy perspective the most pressing issue for euro area financial
institutions remains the high level of NPLs which needs to be addressed The
resolution of systemic NPL problems will take time and requires a
comprehensive strategy involving coordination of all relevant stakeholders
533 Rolling Window ndash Regional Systemic Contribution (RSC)
We calculate the systemic contribution of each region as the ratio between
the total regional contagion effects and the total contagion in the system We
focus on Europe North America (US) and Euro-area since these regions
28
dominated in terms of systemic risk during the period Figure 8 compares the
systemic contribution of these regions Surprisingly the share of systemic risk
that European banks hold increased after 2014 while the contribution of US
banks remains increasingly lower than European banksrsquo contribution after mid-
2012 The difference between the systemic contribution of European and US
banks fluctuates between 40 and 55
Figure 8 European US and Euro-area banksrsquo contribution to total systemic risk
(as a of total systemic risk)
Note US banksrsquo contribution is presented in secondary axis
54 Principal Component Analysis
We use PCA analysis in which the banksrsquo CDS spreads are decomposed into
orthogonal factors of decreasing explanatory power to identify the increased
000
500
1000
1500
2000
2500
000
1000
2000
3000
4000
5000
6000
7000
8000
Jan
-08
May
-08
Sep
-08
Jan
-09
May
-09
Sep
-09
Jan
-10
May
-10
Sep
-10
Jan
-11
May
-11
Sep
-11
Jan
-12
May
-12
Sep
-12
Jan
-13
May
-13
Sep
-13
Jan
-14
May
-14
Sep
-14
Jan
-15
May
-15
Sep
-15
Jan
-16
May
-16
Sep
-16
Jan
-17
May
-17
EU Euroarea US
29
commonality among the default risk of banks (see Muirhead 1982 for an
exposition of PCA)
Let 119884119905 be the log difference of bankrsquos i CDS i=1hellip77 let the systemrsquos
aggregate credit risk be represented by the sum 119884119878 = sum 119884119894119894 and let 119864[119884119894] = 120583119894
and Var[119877119894] = 1205901198942 Then we have
1205901199042 = sum sum 120590119894120590119895120550[119911119894119911119895]
119873
119895=1
119873
119894=1
where 119911119896 = (119877119896 minus 120583119896)120590119896 k=ij
where 119911119896 is the CDS of bank k and 1205901199042 is the variance of the system
PCA produces the decomposition of the variance-covariance matrix of CDS
spreads of the 77 banks contained in the sample into the orthogonal matrix of
loadings L (eigenvector of the correlation matrix of CDS spreads) and the
diagonal matrix of eigenvalues Λ
We focus on the first three eigenvalues as they explain most of the variation
in the system These three eigenvalues are supposed to explain a larger portion
of the total volatility in the system when the CDS spreads are moving together or
in other words when systemic risk in more unified So periods when the first
three components explain most of the total volatility indicates the existence of
increased interconnectedness among banks The first component that is
extracted accounts for the maximum amount of total variance in the observed
variables In other words the proportion of explained variance by the first
component shows how much of the variations in the CDS spreads can be
explained by one common factor This result is in line with Fontana and
Scheicher (2010) who finds there to be a single large determinant dominating
the variation in the CDS spread where the proportion of explained variance by
30
factor 1 exceeds 80 According to Billio et al (2012) during periods of distress
fewer components explain larger part of the volatility which means that the
fluctuation of the first principal component while taking into account the
predictive power that CDS carry reveal periods of increased systemic risk
We run rolling window analysis where the length of the window is 200 days
and the step is 100 days over the period January 2008 to June 2017 and the
results indicate the existence of a single dominant component that determines
the fluctuations of CDS spreads (Figure 9)
Figure 9 Rolling Principal Components analysis
Note The length of the window is 200 days and the step is 100 days
Investigating the determinants of the loadings of each bank to the first
principal component through rolling cross-sectional analysis will reveal the
driving forces of systemic risk on a yearly basis over the period 2008-2016 For
that reason we use rolling cross-sectional analysis
0
10
20
30
40
50
60
Jan
-08
Jun
-08
No
v-0
8
Ap
r-0
9
Sep
-09
Feb
-10
Jul-
10
Dec
-10
May
-11
Oct
-11
Mar
-12
Au
g-1
2
Jan
-13
Jun
-13
No
v-1
3
Ap
r-1
4
Sep
-14
Feb
-15
Jul-
15
Dec
-15
May
-16
Oct
-16
comp1 comp2 comp3
31
ii
iiiiiii
Debt
SurplusGDPNIINPLsLoansAssetsay
7
654321
yi is each bankrsquos loading to the first component
We search among the following bank-specific characteristics total value of
bank assets (logs) retail orientation the total loanstotal assets (levels) NPLs
total loans (levels) and non-interest income total revenue and among the
following home-country specific characteristics GDP growth primary
surplusGDP (levels) public debtGDP (levels) We manage to match 47 banks to
bank-specific characteristics
Table 13 Determinants of each bankrsquos loadings in the first component over the nine
periods
2008 2009 2010 2011 2012 2013 2014 2015 2016
Size -0012 -0002 -0007 -0012 0001 0004 0001 -0002 -0003
(0008) (0007) (0006) (0006) (0007) (0006) (0010) (0008) (0009)
Loan-to-assets -0048 -0142 -0113 -0136 -0135 -0114 -0212 -0210 -0239
(0043) (0051) (0051) (0051) (0054) (0051) (0078) (0069) (0074)
NPLs 0844 0414 0352 0035 0004 -0097 0333 0304 0194
(0349) (0253) (0187) (0183) (0054) (0139) (0187) (0147) (0174)
Non-interest-income 0000 0000 0001 0000 0001 0000 0001 0000 0000
(0000) (0000) (0006) (0006) (0000) (0000) (0000) (0000) (0000)
GDP -0004 -0003 -0006 -0003 -0009 -0009 -0011 -0004 -0007
(0004) (0002) (0001) (0003) (0054) (0003) (0005) (0001) (0006)
Primary SurplusGDP 0000 -0002 0002 0000 -0002 -0004 -0009 -0014 -0012
(0002) (0001) (0001) (0170) (0054) (0003) (0004) (0004) (0005)
DebtGDP -0001 -00005 -00006 -0001 -00007 -00005 -00005 0000 -0000
(0000) (0000) (0000) (0000) (0054) (0000) (0000) (0000) (0000)
_cons 0300 0235 0297 0372 0248 0229 0252 0283 0323
(0080) (0076) (0068) (0078) (0054) (0072) (0111) (0094) (0107)
Note 1 510
32
6 Conclusions
Macroprudential policy is still in its infancy Much work is still needed on
developing good and timely analysis effective policy instrument tools and
effective implementation Our paper makes a contribution on the dimension of
analysis and measurement The key aim of macroprudential policy is to address
externalities and spillovers among financial institutions in an effort to safeguard
financial stability These interactions are complex We provide a tool for
clarifying and quantifying these interactions Our measures can guide
appropriate macroprudential policies that aim to internalize these externalities
A key conclusion from our study is that the focus on size does not adequately
address the systemic importance of banks
33
References
Acharya V Engle R Richardson M 2012 Capital Shortfall A New Approach to
Ranking and Regulating Systemic Risks American Economic Review Vol102 No
3
Acharya V Pedersen L Philippon T Richardson M 2010 Measuring systemic
risk Technical Report Department of Finance NYU
Acharya V Drechsler I Schnabl P 2014 A Pyrrhic Victory Bank Bailouts and
Sovereign Credit Risk Journal of Finance 2014 vol 69 issue 6 2689-2739
Adams Z Fuss R Gropp R 2014 Spillover Effects among Financial
Institutions A State-Dependent Sensitivity Value-at-Risk (SDSVaR) Approach
Journal of Financial and Quantitative Analysis (JFQA) Vol 49 No 3
Adrian T Brunnermeier M 2009 CoVaR Manuscript Princeton University
Aizenman J Hutchison H and JinjarakY (2013) lsquoWhat is the Risk of European
Sovereign Debt Defaults Fiscal Space CDS Spreads and Market Pricing of Riskrsquo
Journal of International Money and Finance 34 37-59
Allen F A Babus and E Carletti (2012) Asset commonality debt maturity and
systemic risk Journal of Financial Economics 104(3) 519ndash534
Alter A Beyer A 2013 The dynamics of spillover effects during the European
sovereign debt turmoil Journal of Banking and Finance 42 134-153
Altunbas Y Manganelli S Marques-Ibanez D 2011 Bank risk during the
financial crisis Do business models matter ECB Working Paper No 1394
Ang A Longstaff F 2011 Systemic sovereign credit risk Lessons from the US
and Europe NBER discussion paper 16983
Ayadi R Arbak E De Groen W 2011 Business Models in European Banking A
pre-and post-crisis screening CEPS Paperbacks
34
Banbura M Giannone D Reichlin L 2011 Nowcasting Oxford Handbook on
Economic Forecasting ed by M P Clements and D F Hendry pp 63ndash90 Oxford
University Press
Bank for Internaional Settlements 2010 Guidance for national authorities
operating the countercyclical capital buffer
Bank for Internaional Settlements 2011 Global systemically important banks
Assessment methodology and the additional loss absorbency requirement
Basel Committee on Banking Supervision 2010 Basel III A global regulatory
framework for more resilient banks and banking systems Bank for International
Settlements
Basu S Das S Michailidis G Purnanandam A 2017 A system-wide approach
to measure connectivity in the financial sector Unpublished
Benoit S Colliard J-E Hurlin C Perignon C 2015 Where the risks lie A
survey on systemic risk Unpublished working paper
Billio M Getmansky M Lo A W Pelizzon L 2012 Econometric measures of
systemic risk in the finance and insurance sectors Journal of Financial
Economics 104 535ndash559
Brownlees CT Engle RF 2010 Volatility correlation and tails for systemic
risk measurement Manuscript Stern School of Business New York University
Canova F and Pappa P 2007 Price Differentials in Monetary Unions The Role
of Fiscal Shocks Economic Journal 117 2007 713-737
Castro C Ferrari S 2014 Measuring and testing for the systemically important financial institutions Journal of Empirical Finance 2014 vol 25 issue C 1-14 Cerutti E Claessens S Laeven L 2015 The Use and Effectiveness of
Macroprudential Policies New Evidence IMF Working Paper No 1561
Crockett A 2000 Marrying the Micro- and Macro-prudential Dimensions of
Financial Stability Eleventh International Conference of Banking Supervisors
held in Basel 20-21
35
De Santis R (2012) ldquoThe euro area sovereign debt crisis Safe haven credit
rating agencies and the spread of the fever from Greece Ireland and Portugalrdquo
ECB Working Paper 1419
DellrsquoAriccia G Igan D Laeven L Tong H Bakker B Vandenbussche J 2012
Policies for Macrofinancial Stability How to Deal with Credit Booms IMF Staff
Discussion Note 1206
Demirer M Diebold F Liu L Yilmaz K 2017 Estimating global bank network
connectedness Journal of Applied Eeconometrics forthcoming
Diebold F X Yilmaz K 2009 Measuring Financial Asset Return and Volatility
Spillovers with Application to Global Equity Markets The Economic Journal
119(534) 158-171
Diebold F X Yilmaz K 2012 Better to give than to receive Predictive
directional measurement of volatility spillovers International Journal of
Forecasting Issue 28 pp 57-66
Doan T Litterman R Sims CA 1984 Forecasting and Conditional Projections
Using Realistic Prior Distributions Econometric Reviews 3(4) 1ndash 100
Elliott D J Feldberg G Lehnert A 2013 The History of Cyclical
Macroprudential Policy in the United States Office of Financial Research
Working Paper No 8
European Central Bank 2016 Macroprudential Bulletin Issue 12016
Financial Stability Board 2011 Measures to address systemically important
financial institutions
Fontana A Scheicher M 2010 An analyisis of euro area sovereign CDS and
their relation with government bonds ECB Working Paper Series Issue 1271
Fostel A Geanakoplos J 2008 Leverage Cycles and the Anxious Economy
American Economic Review 98 (4) 1211ndash1244 [2196]
36
Geanakoplos J Pedersen L H 2014 Monitoring leverage In Brunnermeier M
K Krishnamurthy A (Eds) Risk Topography Systemic Risk and Macro
Modeling NBER pp 175ndash182
Giannone D Lenza M Primiceri GE 2012 Prior Selection for Vector
Autoregressions CEPR Discussion Papers 8755 CEPR Discussion Papers
Giglio S Kelly B T Pruitt S 2015 Systemic risk and the macroeconomy An
empirical evaluation Journal of Financial Economics 2016 vol 119 issue 3 457-
471
Goacutemez-Puig M amp Sosvilla-Rivero S (2014) EMU sovereign debt markets crisis
Fundamental-based or pure contagion Institut de Recerca en Economia
Aplicada (IREA) Working Papers Universitat de Barcelona 201402
Huang X Zhou H Zhu H 2012 Systemic Risk Contributions Journal of
Financial Services Research 2012 vol 42 issue 1 55-83
International Monetary Fund 2013a The Interaction of Monetary and
Macroprudential Policies Washington International Monetary Fund
International Monetary Fund 2015a Financial Operations
Koumlhler M 2013 Does non-interest income make banks more risky Retail-
versus investment oriented banks Deutsche Bundesbank Discussion Paper
No172013
Koop G Korobilis D 2010 Bayesian Multivariate Time Series Methods for
Empirical Macroeconomics Foundations and Trends in Econometrics Vol 3 No
4 pp 267-358
Litterman Robert B 1979 Techniques of forecasting using vector
autoregressions Research Department Working Paper 115 Federal Reserve
Bank of Minneapolis Minnesota
37
Longstaff F Pan J Pedersen L Singleton K 201 How Sovereign Is Sovereign
Credit Risk American Economic Journal Macroeconomics 2011 vol 3 issue 2
75-103
Pesaran H Shin Y 1998 Generalized impulse response analysis in linear
mulitvariate models Economic Letters 58(1) 17-29
White H Kim TH Manganelli S 2008 Modeling autoregressive conditional
skewness and kurtosis with multi-quantile CAViaR In Russell J Watson M
(Eds) Volatility and Time Series Econometrics A Festschrift in Honor of Robert
F Engle
Part B
We study 77 banks from 26 developed and emerging economies Data are downloaded from Thomson-Reuters and cover the period from January 1st 2008 to June 30th 2017 The first sample contains 77 banks are from 19 developed economies while the rest are from 6 emerging economies (as of IMFrsquos list) The sample contains most of the banks that are designated as ldquoglobal systemically important banksrdquo (ldquoGSIBrsquosrdquo) as designated by the Basel Committee on Banking Supervision except for three Chinese banks (Agricultural Bank of China Bank of China and Industrial and Commercial Bank of China) and one French bank Group BPCE 43 out of the 77 banks (544) in the sample are from Europe while 28 of them (3544) are headquartered in Eurozone members The sample is extended by adding 19 smaller European banks
B Sample Presentation Bank Details Descriptive Statistics Tables 2a and b presents the 77 banks in the sample in the worldrsquos top 150 as they ordered by assets (Q4 2016) Table A3 presents the share of assets that each home-country holds in the sample as well as the share of assets per developed and emerging countries while Table A4 presents the share of assets per region Table A5 presents the 14 European banks that are added to the initial sample
Table 2a Banks ordered by Total Assets (in US $ billion)
Rank Bank Name Country Total assets
38
US$B
1 Bank of China China 2613 2 Mitsubishi UFJ Financial Group Japan 2597 3 JPMorgan Chase amp Co USA 2490 4 HSBC Holdings UK 2374 5 BNP Paribas France 2196
6 Bank of America USA 2187 7 Wells Fargo USA 1930 8 China Development Bank China 1904 9 Credit Agricole Group France 1821 10 Citigroup USA 1792
11 Mizuho Financial Group Japan 1757 12 Deutsche Bank Germany 1682 13 Sumitomo Mitsui Financial Group Japan 1654 14 Barclays PLC UK 1490 15 Societe Generale France 1461
16 Banco Santander Spain 1416 17 Lloyds Banking Group UK 1004 18 Norinchukin Bank Japan 984 19 Royal Bank of Scotland Group UK 981 20 UBS Group AG Switzerland 919
21 Unicredit SpA Italy 908 22 ING Groep NV Netherlands 893 23 Goldman Sachs Group USA 860 24 Morgan Stanley USA 814 25 Credit Suisse Group Switzerland 806
Table 2a ndash Continued from previous page
26 BBVA Spain 773 27 Intesa Sanpaolo Italy 766 28 Commonwealth Bank of Australia Australia 703 29 Rabobank Group Netherlands 700 30 Australia amp New Zealand Banking Group Australia 661
31 Nordea Sweden 651 32 Standard Chartered Plc UK 646 33 Westpac Banking Corp Australia 607 34 National Australia Bank Australia 562 35 Commerzbank Germany 549
36 Danske Denmark 495 37 State bank of India India 492 38 US Bancorp USA 445 39 The Export-Import Bank of China China 427 40 Sberbank of Russia Russia 420
41 Resona Japan 412 42 Sumitomo Mitsui TH Japan 406 43 Nomura Holdings Japan 370 44 PNC Financial Services USA 366 45 Capital One Financial Corporation USA 357
46 DBS Group Holdings Singapore 332 47 Shinhan Financial Group South Korea 328 48 KBC Group NV Belgium 291 49 Svenska Handelsbanken Sweden 289 50 Skandinaviska Enskilda Banken Sweden 289
51 Hana Financial Group South Korea 288 52 Nationwide Building Society UK 276 53 Korea Development Bank South Korea 268
39
54 Woori Bank South Korea 257 55 Landesbank Baden-Wurttemberg Germany 257
56 Cathay Financial Holding Taiwan 252 57 Swedbank Sweden 237 58 United Overseas Bank (UOB) Singapore 235 59 Dexia Belgium 225 60 Banco Sabadell Spain 224
61 Bayerische Landesbank Germany 224 62 Erste Group Bank AG Austria 220 63 Banco Popular Espanol Spain 204 64 Industrial Bank of Korea South Korea 196 65 Bank of Ireland Ireland 182
66 Malayan Malaysia 161 67 Standard Bank Group South Africa 161 68 Banca Monte dei Paschi di Siena Italy 161 69 American Express USA 158 70 National Bank of Greece Greece 153 71 Macquarie USA 143
72 Credit Lyonnais France 120 73 Comercial Portuguese Portuguese 113 74 Banco Espirito Santo Portugal 112 75 Turkiye is bankasi Turkey 112 76 Mediobanca Italy 95
77 Landesbank Hessen Germany 92
Table 2b Banks ordered by Country
Rank Bank Country Total assets
US$B
1 Commonwealth Bank of Australia Australia 703 2 Australia amp New Zealand Banking Group Australia 661 3 Westpac Banking Corp Australia 607 4 National Australia Bank Australia 562
5 Erste Group Bank AG Austria 220
6 KBC Group NV Belgium 291 7 Dexia Belgium 225
8 Bank of China China 2613 9 China Development Bank China 1904
10 The Export-Import Bank of China China 427
11 Danske Denmark 495
12 BNP Paribas France 2196 13 Credit Agricole Group France 1821 14 Societe Generale France 1461 15 Credit Lyonnais France 120
16 Deutsche Bank Germany 1682 17 Commerzbank Germany 549 18 Landesbank Baden-Wurttemberg Germany 257 19 Bayerische Landesbank Germany 224 20 Landesbank Hessen Germany 92
21 National Bank of Greece Greece 153
22 State bank of India India 492
23 Bank of Ireland Ireland 182
24 Unicredit SpA Italy 908 25 Intesa Sanpaolo Italy 766
40
26 Banca Monte dei Paschi di Siena Italy 161 27 Mediobanca Italy 95
28 Mitsubishi UFJ Financial Group Japan 2597 29 Mizuho Financial Group Japan 1757 30 Sumitomo Mitsui Financial Group Japan 1654 31 Norinchukin Bank Japan 984 32 Resona Japan 412 33 Sumitomo Mitsui TH Japan 406 34 Nomura Holdings Japan 370 35 Yamaguchi Financial Group Japan 93
36 ING Groep NV Netherlands 893 37 Rabobank Group Netherlands 700
38 Banco Espirito Santo Portugal 111
39 Sberbank of Russia Russia 420
40 DBS Group Holdings Singapore 332 41 United Overseas Bank (UOB) Singapore 235 42 Standard Bank Group South Africa 161
43 Shinhan Financial Group South Korea 328 44 Hana Financial Group South Korea 288 45 Korea Development Bank South Korea 268 46 Woori Bank South Korea 257 47 Industrial Bank of Korea South Korea 196
48 Banco Santander Spain 1416 49 BBVA Spain 773 50 Banco Sabadell Spain 224 51 Banco Popular Espanol Spain 204
Table 2b ndash Continued from previous page
53 Nordea Sweden 651 54 Svenska Handelsbanken Sweden 289 55 Skandinaviska Enskilda Banken Sweden 289 56 Swedbank Sweden 237
57 UBS Group AG Switzerland 919 58 Credit Suisse Group Switzerland 806
59 Cathay Financial Holding Taiwan 252
60 Turkiye is bankasi Turkey 112
61 HSBC Holdings UK 2374 62 Barclays PLC UK 1490 63 Lloyds Banking Group UK 1004 64 Royal Bank of Scotland Group UK 981 65 Standard Chartered Plc UK 646 66 Nationwide Building Society UK 276
68 JPMorgan Chase amp Co USA 2490 69 Bank of America USA 2187 70 Wells Fargo USA 1930 71 Citigroup USA 1792 72 Goldman Sachs Group USA 860 73 Morgan Stanley USA 814 74 US Bancorp USA 445 75 PNC Financial Services USA 366 76 Capital One Financial Corporation USA 357 77 American Express USA 158 78 Macquarie USA 143
41
Table 3a Banksrsquo home-countries ordered by the sum of total bank assets
Developed Total Assets Developing Total Assets USA 11547 China 4944 Japan 7867 India 492 UK 6936 Russia 420 France 5599 Taiwan 252 Germany 2994 South Africa 161 Spain 2617 Turkey 112
Australia 2534 Italy 1933 Switzerland 1725
Netherlands 1584 Sweden 1467 South Korea 1340 Singapore 568 Belgium 516 Denmark 495 Ireland 344 Austria 220 Greece 153 Portugal 111 Total Assets of banks that are headquartered in
Developed 5055366 Emerging 63823 of total assets 888 of total assets 112
42
Table 3b Regional details
Region Number of Banks Total bank
assets of total
assets
Europe 40 2669673 473
Asia 21 1557658 275
N America 11 1154724 204
Oceania 4 2534 45
Africa 1 161 03
B Data Definitions and Descriptive Statistics
Table 4 Data Definitions
Variable Description
Endogenous CDS CDS 5-year spread
Exogenous Systemic risk
CDX The family of CDS indeces covering North America
VIX The volatiliy index of SampP 500
US 3-month T Bill The short-term obligation backed by the Treasury Dept of the US goverment
Bank-specific Size Total assets
Retail orientation Total Loans Total assets
Diversification Non-interest income Total revenues
NPLs Non-performing loans Total Loans
Country-specific
GDP Each bankrsquos home-country GDP growth
Budget Balance Current AccountGDP
Public Debt Public DebtGDP
43
Table 5 Descriptive Statistics
Panel A Systemic risk factor
CDX VIX TED
Mean 269E-06 -0000123 -000121 Median 0000 -0001 0000 Maximum 0020 0176 0250 Minimum -0009 -0152 -0750
Std Dev 0001 0031 0033 Skewness 4689 0689 -17326
Kurtosis 106047 6789 377496 Jarque-Bera 1105896 1679364 14610377 Probability 0000 0000 0000
Sum 0007 -0304 -3000 Sum Sq Dev 0003 2427 2746
Note CDX and VIX are in log differences TED spread is in first differences
Panel B Bank specific
Assets Loans_to_Assets Non_Interest_Inc NPLs
Mean 732382 55596 2442 4601
Median 458009 59921 2378 2411
Maximum 3030645 8664 8640 35217
44
Minimum 4354387 9070 -5962 01082
Std Dev 7460013 17017 1481 5612
Skewness 1081 -0641 -0694 2376
Kurtosis 30129 2584 6193 9630
Jarque-Bera 7023 272888 182117 999501
Probability 0000 0000 0000 0000
Sum 264E+09 2003702 8803746 1658430 Sum Sq Dev 201E+15 1043392 7908036 1134867
Note Data are in levels
Part C ndash Global Sample
Table 7 Individual systemic importance
Panel A ndash Ranked by total score Rank by score
Rank by bank assets Bank Name
Home-Country Region
Assets (billion
US $) Score
To others (Aggr)
From others (Aggr)
1 27 Intesa Sanpaolo Italy Europe 766 1056 0505 0551
2 16 Banco Santander Spain Europe 1416 1038 0464 0574
3 26 BBVA Spain Europe 773 0987 0454 0533
4 5 BNP Paribas France Europe 2196 0982 0445 0537
5 21 Unicredit SpA Italy Europe 908 0975 0489 0485
6 14 Barclays PLC UK Europe 1490 0961 0454 0507
7 12 Deutsche Bank Germany Europe 1682 0954 0428 0526
8 9 Credit Agricole Group France Europe 1821 0942 0424 0518
9 15 Societe Generale France Europe 1461 0940 0427 0512
10 72 Credit Lyonnais France Europe 120 0938 0445 0493
11 17 Lloyds Banking Group UK Europe 1004 0925 0438 0487
12 25 Credit Suisse Group Switz Europe 806 0907 0376 0531
13 35 Commerzbank Germany Europe 549 0904 0410 0494
14 20 UBS Group AG Switz Europe 919 0890 0387 0503
15 32 Standard Chartered Plc UK Europe 646 0870 0419 0451
16 68 Banca Monte dei Paschi Italy Europe 161 0861 0429 0433
45
17 19
Royal Bank of Scotland Group
UK Europe 981 0845 0423 0423
18 29 Rabobank Group Netherl Europe 700 0841 0376 0465
19 22 ING Groep NV Netherl Europe 893 0823 0374 0449
20 76 Mediobanca Italy Europe 95 0821 0389 0433
21 24 Morgan Stanley USA N Amer 814 0752 0315 0437
22 69 American Express USA N Amer 158 0736 0332 0404
23 6 Bank of America USA N Amer 2187 0716 0318 0398
24 23 Goldman Sachs Group USA N Amer 860 0711 0302 0410
25 10 Citigroup USA N Amer 1792 0706 0313 0393
26 4 HSBC Holdings UK Europe 2374 0695 0372 0323
27 62 Erste Group Bank AG Austria Europe 220 0688 0314 0375
28 49 Svenska Handelsbanken Sweden Europe 289 0678 0281 0397
29 53
Korea Development Bank
S Korea Asia 268 0677 0393 0284
30 60 Banco Sabadell Spain Europe 224 0670 0295 0375
31 36 Danske Denmark Europe 495 0663 0296 0367
32 45
Capital One Financial Corp
USA N Amer 357 0662 0260 0401
33 3 JPMorgan Chase amp Co USA N Amer 2490 0658 0257 0401
34 7 Wells Fargo USA N Amer 1930 0653 0259 0394
35 34 National Australia Bank Australia Oceania 562 0622 0376 0247
Table continued on next page
Table 3- Panel A continued from previous page
36 2 Mitsubishi UFJ Financial Japan Asia 2597 0621 0223 0398
37 47 Shinhan Financial Group S Korea Asia 328 0615 0331 0283
38 54 Woori Bank S Korea Asia 257 0612 0333 0278
39 64 Industrial Bank of Korea S Korea Asia 196 0603 0341 0261
40 28 Commonwealth Bank Australia Oceania 703 0599 0388 0211
41 40 Sberbank of Russia Russia Europe 420 0598 0294 0305
42 30 Australia amp N Zealand Australia Oceania 661 0597 0383 0214
43 50 Skandinaviska Enskilda Sweden Europe 289 0578 0262 0316
44 31 Nordea Sweden Europe 651 0574 0289 0285
45 71 Macquarie USA N Amer 143 0572 0321 0251
46 48 KBC Group NV Belgium Europe 291 0568 0241 0327
47 63 Banco Popular Espanol Spain Europe 204 0558 0297 0261
48 61 Bayerische Landesbank Germany Europe 224 0552 0249 0303
49 39 The Export-Import Bank China Asia 427 0548 0284 0264
50 1 Bank of China China Asia 2613 0548 0276 0272
51 66 Malayan Malaysia Asia 171 0543 0321 0223
52 33 Westpac Banking Corp Australia Oceania 606 0540 0374 0166
53 37 State bank of India India Asia 492 0530 0238 0291
54 51 Hana Financial Group S Korea Asia 288 0518 0290 0227
55 57 Swedbank Sweden Europe 237 0486 0253 0233
56 8 China Development Bank China Asia 1904 0468 0260 0208
46
57 52 Nationwide Building Society UK Europe 276 0463 0217 0246
58 59 Dexia Belgium Europe 225 0409 0197 0212
59 46 DBS Group Holdings Singapore Asia 332 0397 0212 0186
60 65 Bank of Ireland Ireland Europe 182 0379 0197 0182
61 58 United Overseas Bank Singapore Asia 235 0373 0214 0159
62 11 Mizuho Financial Group Japan Asia 1757 0367 0271 0096
63 67 Standard Bank Group S Africa Africa 161 0365 0123 0242
64 74 Espirito Santos Portugal Europe 112 0362 0186 0176
65 41 Resona Japan Asia 412 0357 0263 0094
66 13 Sumitomo Mitsui Financial Japan Asia 1654 0355 0250 0104
67 38 US Bancorp USA N Amer 445 0353 0188 0165
68 55 Landesbank Baden-Wurtt Germany Europe 257 0340 0170 0171
69 42 Sumitomo Mitsui TH Japan Asia 406 0323 0273 0050
70 56 Cathay Financial Holding Taiwan Asia 252 0298 0189 0109
71 73 Comercial Portuguese Portugal Europe 113 0279 0268 0011
72 70 National Bank of Greece Greece Europe 153 0220 0176 0044
73 18 Norinchukin Bank Japan Asia 984 0215 0164 0050
74 43 Nomura Holdings Japan Asia 370 0197 0161 0035
75 77 Landesbank Hessen Germany Europe 92 0159 0089 0071
76 44 PNC Financial Services USA N Amer 366 0078 0034 0043
77 75 Turkiye is bankasi Turkey Europe 112 0037 0030 0007
Note Results concern the period January 2008 ndash June 2017 and are of daily frequency
Table 9 Systemic contribution per bank (January 2008 ndash June 2017)
Rank Bank Name SC Rank Bank Name SC Rank Bank Name SC Rank Bank Name SC
1 Intesa Sanpaolo
225 21 Morgan Stanley 160 41 Sberbank of Russia
128 61 United Overseas
080
2 Banco Santander
221 22 American Express
157 42 Australia amp N Zealand
127 62 Mizuho Financial
078
3 BBVA 210 23 Bank of America
153 43 Skandinaviska Enskilda
123 63 Standard Bank Group
078
4 BNP Paribas 209 24 Goldman Sachs Group
152 44 Nordea 122 64 Espirito Santos
077
5 Unicredit SpA
208 25 Citigroup 151 45 Macquarie 122 65 Resona 076
6 Barclays PLC 205 26 HSBC Holdings 148 46 KBC Group NV
121 66 Sumitomo Mitsui
076
7 Deutsche Bank
203 27 Erste Group 147 47 Banco Popular
119 67 US Bancorp
075
8 Credit Agricole
201 28 Svenska 145 48 Bayerische Landesbank
118 68 Landesbank 072
9 Societe Generale
200 29 Korea Development Bank
144 49 The Export-Import
117 69 Sumitomo Mitsui TH
069
10 Credit Lyonnais
200 30 Banco Sabadell 143 50 Bank of China 117 70 Cathay Financial
064
11 Lloyds Banking
197 31 Danske 141 51 Malayan 116 71 Comercial Portuguese
059
47
12 Credit Suisse Group
193 32 Capital One Financial Corp
141 52 Westpac Banking Corp
115 72 NBG 047
13 Commerzbank 193 33 JPMorgan Chase amp Co
140 53 State bank of India
113 73 Norinchukin Bank
046
14 UBS Group AG 190 34 Wells Fargo 139 54 Hana Financial Group
110 74 Nomura Holdings
042
15 Standard Chartered
186 35 National Australia Bank
133 55 Swedbank 104 75 Landesbank Hessen
034
16 Banca Monte dei
184 36 Mitsubishi UFJ Financial
132 56 China Development
100 76 PNC Financial Services
017
17 RBS 180 37 Shinhan Financial Group
131 57 Nationwide Building
099 77 Turkiye is bankasi
008
18 Rabobank Group
179 38 Woori Bank 130 58 Dexia 087
19 ING Groep NV 175 39 Industrial Bank of Korea
129 59 DBS Group Holdings
085
20 Mediobanca 175 40 Commonwealth Bank
128 60 Bank of Ireland
081
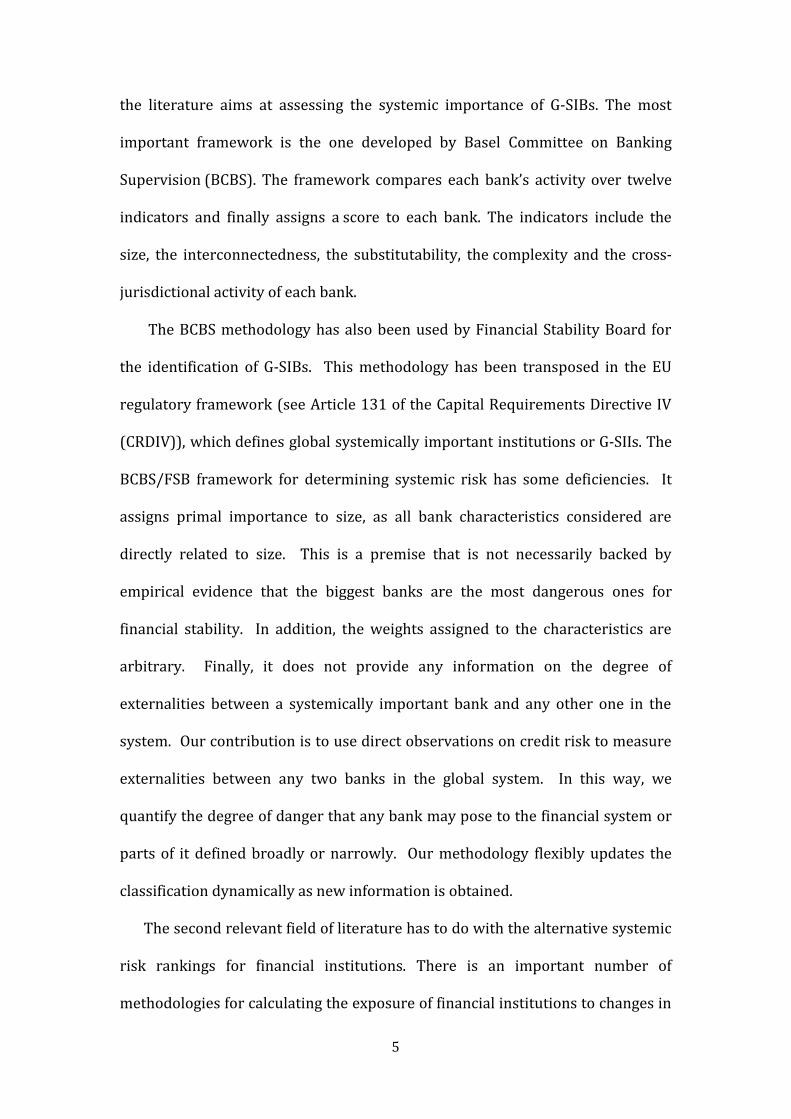
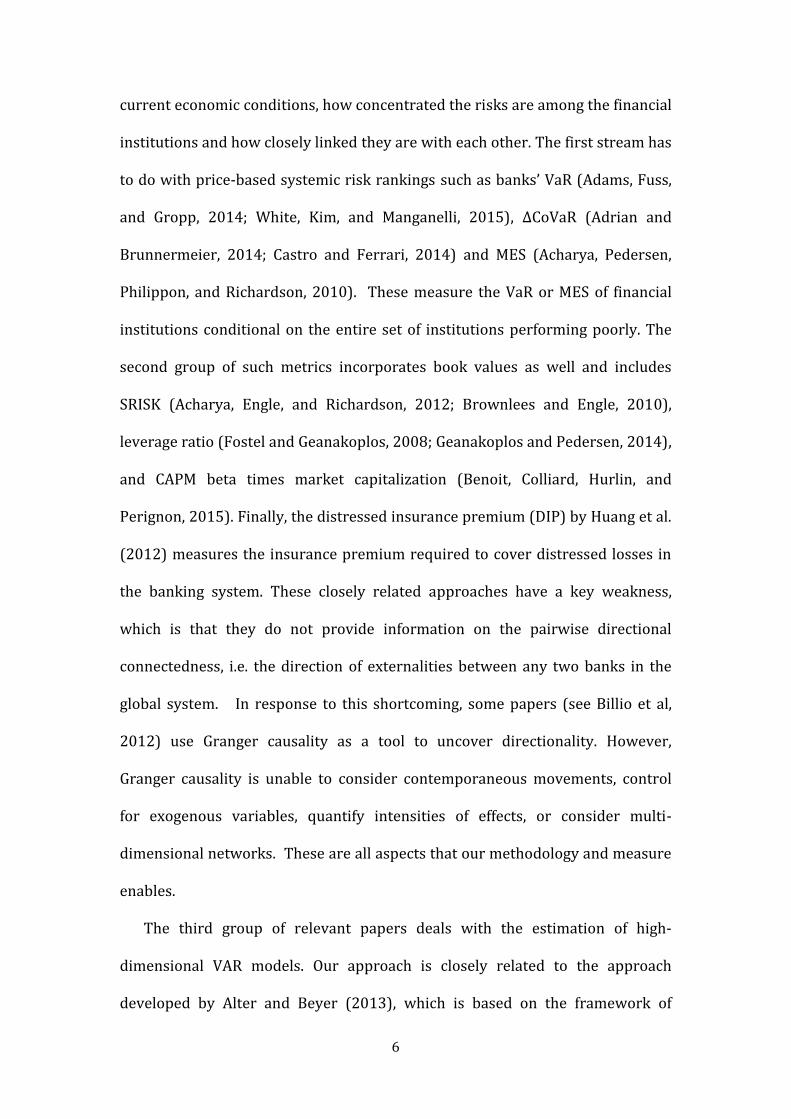
7
Diebold and Yilmaz (2009 2011) The high-dimensionality problem had forced
this research on global bank connectedness to limit their analysis to small
samples of banks Needless to say this is not appropriate when considering bank
importance for the global system A relevant methodology has been recently
suggested by Demirer Diebold Liu and Yilmaz (2017) who use LASSO methods
to shrink select and estimate the high-dimensional network linking the publicly-
traded subset of global banks In a similar vein Basu et al (2017) use Lasso
penalized Vector Autoregressive model to estimate a model that leverages a
system-wide approach to identify systemically important financial institutions in
the US Our distinct approach is to use Bayesian VAR in order to resolve the
dimensionality problem
Finally our paper relates to studies that apply principal components
methods to analyze systemic risk Billio et al (2012) suggested that an
important symptom of systemic risk is the presence of sudden regime shifts
Giglio et al (2015) proposed dimension-reduction estimators for constructing
systemic risk indexes from the cross section of measures and prove their
consistency in a factor model setting We differ by examining the individual bank
loadings on the dominant factor associated with fluctuations in bank CDS
spreads and determining which bank and country characteristics are related to
these This provides solid empirical basis for using relevant characteristics as
indicators to measure systemic importance indirectly
3 Definition of Systemic Importance
8
Systemic risk may originate in an endogenous build-up of financial
imbalances possibly associated with a booming financial cycle large aggregate
shocks hitting the economy or the financial system or contagion effects across
markets intermediaries or infrastructures Our study focuses on contagion
among banks and measures the systemic importance of a bank by the amount of
spillovers it receives from and sends to the rest of the banking system According
to Allen et al (2012) contagion refers to the risk that the failure of one financial
institution leads to the default of others through a domino effect in the interbank
market the payment system or through asset prices More precisely we adopt
the ldquopure-contagionrdquo (Gomez-Puig and Sosvilla Rivero 2013) definition by
controlling only for external common factors through the inclusion of a set of
common external systemic risk factors and assume that each bank could become
itself a source of systemic risk as a result of an idiosyncratic shock
The following example illustrates how we measure the systemic importance
of banks (see Figure 1) Assume that there exist three banks Focusing on bank A
as the source of shocks figure 1 presents the potential impact of an idiosyncratic
shock on bank A to bank B and to bank C respectively Bank A sends a ten-unit
shock to B and a seventeen-unit shock to C a total of 27 Next we focus on the
shocks received by bank A from the other banks in the system Bank A receives a
twenty-one-unit shock from bank B and a five-unit shock from bank C a total of
26 If we sum the shocks that bank A sends to and receives from the system we
obtain an estimate of the degree of connectedness for bank A This is a valid
measure of bank Arsquos systemic importance This procedure is repeated in order to
calculate the systemic importance of bank B and bank C
9
Figure 1 Example of pairwise directional connectedness
Transforming this figure into a table we construct the directional
connectedness matrix
Table 1 Directional connectedness matrix
ShockResponse Bank A Bank B Bank C To Others (Sum_Out)
Bank A - 10 17 27
Bank B 21 - 28 49
Bank C 5 19 - 24
From Other(Sum_In) 26 29 45 100
Score (Sum_Out+Sum_In) 53 78 69
Note Variables in the first column are the impulse origin while variables on the top row are the respondents to the shock
Table 1 presents the entire picture for all three banks in the system Shocks
emanate from row banks to column banks Each row shows the contagion effects
of an equal-sized impulse to the relevant bank in the first column In the last
column we aggregate the total externality effects of each row bank The columns
provide the picture of vulnerability of each bank to shocks in different banks
10
The second to last row is a measure of total vulnerability of a bank to all other
banks in the system It contains the answer to the question ldquoIf all other banks in
the system experienced an idiosyncratic shock of 100 basis points what would
be the impact on bank Xrdquo In the bottom row we aggregate the total externality
effect and the total vulnerability effect of each bank In other words we lump
together shocks sent and received by an individual bank as a measure of total
individual bank connectedness In calculating a bankrsquos systemic importance we
assign equal weights to shocks it sends as to shocks it receives as we are
agnostic as to whether one source of systemic instability is more dangerous than
the other
There are two aspects of financial contagion due to a bankrsquos participation in a
banking system that are of relevance to regulators externalities emanating from
a bankrsquos failure and individual bank vulnerability to financial contagion Both
components are important for regulators but their importance may not be equal
If they are of equal importance then the regulator would consider the sum of
these two However the clear decomposition in Table 1 as well as in our
econometric method allows the regulator to assign different weights in order to
capture the appropriate measure of systemic importance
4 Data and Methodology
41 Data
We study 77 banks from 19 developed and 7 emerging economies Our
selection procedure is as follows We started with the list of the worldrsquos top 150
banks in terms of total assets in Q42016 Using bank names we matched 77
banks to CDS prices from Thomson-Reuters Datastream and Bloomberg CDS
11
spreads cover the period from January 2008 to June 2017 and are at daily
frequency The sample contains all the banks that are designated as ldquoglobal
systemically important banksrdquo (ldquoGSIBrsquosrdquo) by the Basel Committee on Banking
Supervision except for three Chinese banks (Agricultural Bank of China Bank of
China and Industrial and Commercial Bank of China) and one French bank
(Group BPCE) Table 2a (in the Appendix) classifies banks by assets and provides
detail on the 77 banks in the sample such as home-country and total assets
while table 2b (in the Appendix) classifies banks by home-country We note that
40 out of the 77 banks (52) in the sample are from Europe while 28 of them
(34) are headquartered in Eurozone members Tables 3a and 3b (in the
Appendix) provide the regional characteristics of the sample
411 Systemic Risk factor
We will allow for the presence of a global systemic risk factor This permits
us to interpret robustly the results obtained from our model Longstaff et al
(2011) for instance has argued that credit risk appears related to global rather
than country-specific factors while Aizenman et al (2013) has established the
importance of international economic factors in the pricing of credit risk The
variables we chose to employ in order to capture global financial risk conditions
have been widely used in related studies as control variables (see among others
De Santis 2012 Aizenman et al 2013 Ang and Longstaff 2011) The global
default risk conditions are represented by the CDX which is the family of CDS
indices covering North America the VIX volatility index which captures the
global capital marketsrsquo ldquofearrdquo condition and the global liquidity conditions which
is represented by the US 3-month treasury bills The systemic factor is assumed
12
to affect the endogenous variables contemporaneously Table 4 contains the
variable definitions and Table 5 provides descriptive statistics
412 Bank-specific characteristics
A variety of bank- and country-specific variables are used for identifying the
determinants of systemic risk fluctuation over time The first bank-specific
variable is bank size expressed as each bankrsquos total assets (in log) According to
BIS (2011a) the larger a bank is the more likely it is to receive a bailout package
In this sense we also take into consideration the ldquotoo-big-to-failrdquo (TBTF) issue
(Acharya et al 2013) The second bank-specific variable is the loan-to-asset
ratio which provides information on the bankrsquos retail orientation Ayadi et al
(2011) and Koumlhler (2013) suggest that retail-orientated banks appeared to be
less risky than other banks during the recent financial crisis Also according to
Altunbas et al (2011) the non-interest income over total revenue is considered
to be a measure of each bankrsquos diversification since the less a bank relies on
interest income the less exposed the bank is to a negative shock Finally we
include each bankrsquos nonperforming loans over total loans (see Tables 4 and 5)
413 Country-specific characteristics
It is important to include country-specific factors since the impact of
macroprudential policy might differ depending on the underlying economic
conditions of each bankrsquos home country For example the impact of shocks may
be larger for economies that were under stress and hence rely more on rescue
packages and foreign financing (IMF 2015a) These economies would not have
the same ability to support effectively their banking systems in times of distress
13
We investigate the role of sovereigns by searching among each bankrsquos home-
country GDP growth the primary surplus over GDP and public debt over GDP
42 Connectedness matrix
We estimate a VARX model with two lags (p=2) for the endogenous variables
and contemporaneous exogenous variables (q=0)
The vector of endogenous variables (y) consists of log differences of daily CDS
spreads for the 77 banks By including the exogenous variables we account for
common factors that affect at the same time all bank CDS spreads (Bekaert et al
2005)
421 Bayesian VAR
The suggested model has many more parameters than observations overfits
the data in-sample and as a consequence could perform poorly Researchers
working in the relevant literature typically use prior shrinkage on the
parameters to overcome such over-parametrization concerns Most flexible
Bayesian priors that result in shrinkage of high-dimensional parameter spaces
rely on computationally intensive Markov Chain Monte Carlo (MCMC) methods
Their application to recursive forecasting exercises can as a consequence be
prohibitive or even infeasible The only exception is a variant of the Minnesota
prior that is based on the natural conjugate prior an idea that has recently been
exploited by Banbura Giannone and Reichlin (2010) and Giannone Lenza and
Primiceri (2012) among others While this prior allows for an analytical formula
ttttt uXBYAYAaY 122110
14
for the posterior there is a cost in terms of flexibility in that a priori all VAR
equations are treated in the same manner see Koop and Korobilis (2010) for a
further discussion of this aspect of the natural conjugate prior
The traditional ldquoMinnesota priorrdquo an empirical-Bayes prior which is due to
Littermann (1979) and co-authors (see eg Doan Litterman and Sims 1984)
still dominates many applications of VAR models in economics The recent
contribution of Giannone Lenza and Primiceri (2012) provides guidance on
selecting the prior hyperparameter controlling shrinkage of the VAR coefficients
Note that computational simplicity is a priority in this paper so that the
Gibbs sampler is preferred compared to other potentially more powerful and
elegant Markov Chain Monte Carlo (MCMC) and Sequential Monte Carlo (SMC)
algorithms for prior selection However we recognize that the flexibility of
choosing the prior freely is one of the main controversial issues associated with
Bayesian analysis and the reason why some researchers view the latter as
subjective It is also the reason why the Bayesian practice especially in the early
days was dominated by non-informative priors as these priors assign equal
probabilities to all possible states of the parameter space with the aim of
rectifying the subjectivity problem We estimate the coefficients of a VAR(2) for
78 banks using the arithmetic returns of each bankrsquos CDS As we explained
above a key concern of users of Bayesian statistics and criticism by critics is the
dependence of the posterior distribution on onersquos prior and for this reason we
specify hyperparameters for the prior
The Bayesian VAR(p) model can be written as
119910119905 = 1198860 + sum 119860119895119910119905minus119895 + 120576119905
119901
119895=1
15
where yt for t = 1 T is an M x 1 vector containing observations on M time series
variables εt is an M x 1 vector of errors α0 is an M x 1 vector of intercepts and Aj
is an M x M matrix of coefficients We assume εt to be iid N (0 Σ) Exogenous
variables are added to the VAR and included in all the derivations below but we
do not do so to keep the notation as simple as possible
422 The connectedness matrix framework
The construction of the diagnostic tool is based on a medium-size Bayesian
vector autoregressive model with exogenous variables (Bayesian VARX) that
accounts for common global and regional trends and is able to include even
bank-specific characteristics Then similar as the framework described by
Diebold and Yilmaz (2009 2012) and the one described by Alter and Beyer
(2013) we construct the spillover matrix in order to capture any potential
spillovers among banks This methodology relies on Generalized Forecast Error
Variance Decomposition (GFEVD) or on Generalized Impulse Response
Functions (GIRF) obtained as shown in Pesaran and Shin (1998) Therefore we
derive Generalized Impulse Response Functions as functions of residuals
together with the interdependent coefficients According to Alter and Beyer
(2012) it is of low importance which methodology we select since they produce
qualitatively similar results
16
Table 6 Contagionconnectedness matrix
Note Variables in the first column are the impulse origin while variables on the top row are the respondents to the shock The cumulative impact is bound between 0 and 1 A value of 05 means that the response variable would be impacted in the same direction with an intensity of 50 the initial unexpected shock in the impulse variable The last column presents the aggregated impact sent (Sum OUT) by each row variable and on the bottom row the aggregated spillover received (Sum IN) by each column variable The bottom-right cell shows total spillover in the system and by dividing this value to the total number of non-diagonal cells we obtain the connectedness index (CI)
In table 2 row variables are the origin of the unexpected shock Column
variables are the respondents of contagion receivers CI represents the
connectedness index calculated as the average response in the contagion matrix
The potential contagion effects are aggregated on each line and column and
represent the total to_others and the total from_others as potential contributions
to contagion from and to each bank The main diagonal values represent the
effect of a variablersquos shock on itself and they are excluded from any calculations
The possible contagion effects answer the question ldquoHow would bank B evolve in
the following period if bank A CDS increases by one unit shockrdquo
We use accumulated Impulse Response functions over a 10-step horizon (10-
days) Not all the banks respond to the shocks within the same period but the
majority of the shocks are absorbed within 10-days Nevertheless the
framework is flexible and it easily adapts to the needs of each study
5 Empirical results
17
51 Individual bank connectedness
We estimate the connectedness matrix as described in section 422 for the
whole sample period 1 January 2008 to 31 June 2017 and estimate the
individual bank connectedness (table 7) which reports several notable results
The evidence do not offer support to the argument that systemic importance of a
bank can be adequately captured by its size According to table 7 the bank that
creates the most systemic risk in the system is Intesa Sanpaolo a medium-sized
European bank that is ranked 27th in terms of total assets with total contagion
effects of 1056 which is further decomposed into 0505 vulnerability-score and
0551 externalities-score For instance the Intesa Sanpaolorsquos 0551 externalities
score implies that one-unit shock in Intesa Sanpaolo will have an impact of
551 to the system while the 0505 vulnerability score means that one-unit
shock to the market will affect Intesa Sanpaolo by 505 Among the top-20
most connected banks can also be found smaller banks like BBVA (3rd) Credit
Lyonnais (10th) Banca Monte dei Paschi (16th) and Mediobanca (20th) while the
largest bank in the sample is listed 50th in terms of systemic importance
The existing literature on the topic suggests that during crises periods large
banks behave differently than small or medium-sized banks (Laeven et al 2014)
This phenomenon could be partially attributed to some common characteristics
that are shared by large banks and are associated with higher levels of risk
namely the increased portion of market-based activities the reduced capital
adequacy the less stable funding and the higher organizational complexity
However it remains unidentified the bank-size threshold above or below which
these criteria are valid Results presented in table 8 provide a more narrow
response to the question whether systemic importance is related to size or not
18
Size per se is a determinant of systemic importance since when banks are
ranked by systemic importance the first quartile compiles the largest percentage
of total assets (34 of total assets) However when the sample is ranked by total
assets and not in terms of connectedness the first quartile represents 62 of
total assets indicating a severe leakage of assets to the other quartiles and
revealing the existence of structural variables that interact with size
The existing frameworks used by regulators and policy makers such as the
BCBSFSB framework rely heavily on size either through size-related indicators
or size per se to calculate the capital adequacy ratios Our results suggest that
the measures taking strong size-effect as granted should also focus on the large
banksrsquo idiosyncratic characteristics that place 50 of G-SIBs in the first quartile
of systemic importance
Table 8 Banks ranked by systemic importance and by assets ndash Number of banks per quartile
Quartile ranked by Number of G-SIBs per quartile
Score Assets
1st Quartile 34 62 48
2nd Quartile 33 224 28
3rd Quartile 18 105 10
4th Quartile 14 51 14
The next step is to calculate the systemic contribution of each bank in the
system as the ratio between the total individual contagion effects and the total
contagion in the system
100TC
TICTSC i
i
y
y
19
TSC is the total systemic contribution TIC is the total individual contagion
effects and TC is the total contagion in the system The bank with the highest
ranking contributes 225 of the total contagion effects while the bank at the
bottom of the table contributes almost 0 (table 9) This measure allows us to
compare the results among samples with different number of entities
We define each bankrsquos directional connectedness as the ratio between the
individual externalities and the total individual contagion
100
i
i
i
y
yOUT
yOUTTIC
IEID or
100
i
i
i
y
yIN
yINTIC
IVID
ID is the individual directionality IE is the individual externalities IV is the
individual vulnerabilities and TIC is total individual contagion The followings
should be always valid
1 ii yINyOUT IDID
ii yINyOUT IDID
In case iyOUTID is larger than 50 it means than the bank that the systemic score
of the bank it refers to is externalities-driven When breaking the results into
quartiles that represent the average individual directionality for all the banks
that belong in this quartile (table 10) we realize that banks with higher TIC tend
to have higher iyOUTID ratios (54) that their peers that belong in the last
quartile (30) We do not suggest that the directionality of contagion
determines the systemic importance of banks because this is beyond control and
difficult to interpret but that in terms of systemic importance that may be
20
interpreted into increased capital requirements is ldquobetter to receive shocks than
to send shocks to the systemrdquo
Table 10 Average Individual Directionality (OUT) per quartile
iyOUTID
1st Quartile 54
2nd Quartile 53
3rd Quartile 47
4th Quartile 30
Note banks are ranked by systemic importance
52 Regional network connectedness
Prior quantifying the transmission of contagion effects we focus on table 7
that reveals a very strong regional effect This is that the first quartile of systemic
importance is exclusively dominated by banks that are headquartered in Europe
implying the existence of a regional component and severe clustering Table 11a
shows the regional concentration per quartile and table 11b expresses the
regional concentration as a percentage of the total number of banks that exist
per region
Table 11a Concentration of banks per region
Quartile Europe Eurozone (as
of EU) N America Asia Oceania Africa
1st Quartile 100 75 - - - -
2nd Quartile 25 25 40 25 10 -
3rd Quartile 50 50 10 30 10 -
4th Quartile 35 75 12 48 - 5
Table 11b Regional concentration as a percentage of total banks per region
21
Quartile Europe N America Asia Oceania Africa
1st Quartile 47 - - - -
2nd Quartile 12 73 25 25 -
3rd Quartile 21 9 35 75 -
4th Quartile 16 18 40 - 100
The next step is to understand the flows of shocks among the different
regions the contagion effects and the degree of connectedness among the
different regions (Table 12a and b) We focus on four regions Europe North
America (expressed by US banks) Asia and Oceania Table 12a shows regionrsquos A
externalities to the other regions as a percentage of regionrsquos A total externalities
while table 12b focuses on the vulnerabilities side Combining the information
obtained by tables 12a and b European and US appear to be strongly
interconnected More precisely 58 of the aggregate shocks that are sent by US
banks are directed to Europe while 64 of the aggregate shocks received by US
banks are generated in Europe Also another important finding is that 69 of
the aggregate shocks that are sent by European banks remain within Europe
Table 12a Shocks sent per region as of total shocks sent per region
Asia Europe NAmerica Oceania
Sum
Asia 41 41 9 9
100
Europe 16 69 960 540
100
NAmerica 1950 58 16 650
100
Oceania 33 4450 950 12
100
22
Table 12b Shocks received per region as of total shocks received per region
Asia Europe NAmerica Oceania
Asia
28 10 13 21
Europe
54 75 64 59
NAmerica
12 12 20 13
Oceania
6 3 3 7
Sum
100 100 100 100
All in all it is obvious that there exists a regional factor that affects
significantly the bank connectedness However it is interesting to find out the
driving forces of this regional component especially in the case of Europe which
has been a special case due to the different transmission channels of the financial
crisis the highly interconnected banking system the feedback loops among
sovereigns and banks and the contagion from one country to the rest of Europe
53 National banking system connectedness
We approach the national banking system first of all by calculating the
average systemic risk per bank for each one of the countries in the sample
(Figure 2) Four out of the first five banks that contributed the most to the global
systemic risk belong to Eurozone French banks contributed the most to
systemic risk while Italy and Spain both of which suffered from banking
systems in distress followed at close range Banks in non-Euro-area countries
like Swiss and UK banks played an important role as well Surprisingly the
average contagion effects for German banks place them almost in the middle of
the table indicating that German banking system may acted as a stability factor
for the European region Both Portuguese and especially Greek banking system
appeared to be isolated from the global banking system
23
Figure 2 Average systemic risk per bank ndash Own shocks are excluded
Note results concern the period January 2008-June 2017
In figure 3 we approach the total contagion from a different perspective by
presenting the total contagion effects for each sovereign This approach may
depends on the number of banks per sovereign but illustrates that US-European
cluster dominates in terms of systemic importance
Figure 3 National systemic risk ndash Own shocks are excluded
Note results concern the period January 2008-June 2017
53 Rolling window
000
010
020
030
040
050
060
070
080
090
100
Fra
nce
Ital
y
Swit
z
Net
her
l
Spai
n
UK
Au
stri
a
Den
mar
k
S K
ore
a
USA
Ru
ssia
Au
stra
lia
Ger
man
y
Swed
en
Mal
aysi
a
Ind
ia
Ch
ina
Bel
giu
m
Sin
gap
ore
Irel
and
S A
fric
a
Jap
an
Po
rtu
gal
Tai
wan
Gre
ece
Tu
rkey
000
100
200
300
400
500
600
700
USA U
K
Fra
nce
Ital
y
Spai
n
S K
ore
a
Ger
man
y
Jap
an
Au
stra
lia
Swed
en
Swit
z
Net
her
l
Ch
ina
Bel
giu
m
Sin
gap
ore
Au
stri
a
Den
mar
k
Po
rtu
gal
Ru
ssia
Mal
aysi
a
Ind
ia
Irel
and
S A
fric
a
Tai
wan
Gre
ece
Tu
rkey
24
531 Individual Banks
In order to better understand the evolvement of systemic risk and how this
fluctuated over the whole period we use rolling-window analysis where the
length of the window is 340 days and the step is 150 days Figure 3 presents the
evolution of total contagion over time where strong co-movement and
interconnections among banks are obvious We also discriminate periods where
the cluster of TCI lines is shrinking and systemic risk is becoming more unified
which means that systemic and idiosyncratic shocks are propagated more
intensely via the network
Figure 3 Total Individual Contagion
Note The length of the window is 340 days and the step is 150 days
We introduce the range as a new metric of systemic risk unification Range at
each point in time is defined as the difference between the highest and the
lowest score in the system (Figure 4) The lowest the score the more unified the
000
020
040
060
080
100
120
Jan
-08
May
-08
Sep
-08
Jan
-09
May
-09
Sep
-09
Jan
-10
May
-10
Sep
-10
Jan
-11
May
-11
Sep
-11
Jan
-12
May
-12
Sep
-12
Jan
-13
May
-13
Sep
-13
Jan
-14
May
-14
Sep
-14
Jan
-15
May
-15
Sep
-15
Jan
-16
May
-16
Sep
-16
Jan
-17
May
-17
25
systemic risk is becoming Given the predictive power of CDS spreads this new
measure could be used by regulators and policymakers as an early-warning tool
However it remains an open question what is the threshold below which the
unification of systemic risk could consist a problem It is remarkable that the
most ldquolooserdquo links were observed during the post-Lehman collapse in late 2008
and reached its lowest price at the beginning of Greek crisis
Figure 4 Systemic risk range
Note The length of the window is 340 days and the step is 150 days
532 Global banking system
In this part we are interested in understanding the behavior of aggregate
contagion effects Total Systemic risk (TSR) is defined as the total of the off-
0
01
02
03
04
05
06
07
08
09
1
Jan
-08
May
-08
Sep
-08
Jan
-09
May
-09
Sep
-09
Jan
-10
May
-10
Sep
-10
Jan
-11
May
-11
Sep
-11
Jan
-12
May
-12
Sep
-12
Jan
-13
May
-13
Sep
-13
Jan
-14
May
-14
Sep
-14
Jan
-15
May
-15
Sep
-15
Jan
-16
May
-16
Sep
-16
Jan
-17
May
-17
26
diagonal entries in the connectedness matrix or as the sum of the ldquofromrdquo column
or ldquotordquo row measures total connectedness
N
ijji
H
ij
H IRTSR 1
We could plot a moving contagion measure defined as the sum of all IRFs ldquoto
others but we go one step further and we choose to present the Total Contagion
index (TCI) which is calculated as the average response per bank in the
connectedness matrix and is calculated as the sum of all non-diagonal cells
divided by the total number of entities
N
i j yy jiIR
NTCI
1 1
1
Cumulative IRs interval is [01] the index will be bound between 0 and 100
Higher contagion index implies a tightening of the nexus among banks (Figure
5)
Figure 5 Total Connectedness (TC)
Note The length of the window is 340 days and the step is 150 days
000
500
1000
1500
2000
2500
3000
3500
4000
4500
Jan
-08
May
-08
Sep
-08
Jan
-09
May
-09
Sep
-09
Jan
-10
May
-10
Sep
-10
Jan
-11
May
-11
Sep
-11
Jan
-12
May
-12
Sep
-12
Jan
-13
May
-13
Sep
-13
Jan
-14
May
-14
Sep
-14
Jan
-15
May
-15
Sep
-15
Jan
-16
May
-16
Sep
-16
Jan
-17
May
-17
27
Total connectedness reached its peak after Lehman collapse and was
severely affected by the developments in the European banking and sovereign
debt markets that shocked some EU member countries until mid-2012 The
Greek crisis and then the fact that in the early 2011 Italy and Spain joined the
countries with stressed banking systems pushed total connectedness upwards
After the early 2012 the actions taken by the ECB constrained total contagion
but after early 2015 higher political uncertainty following the outcomes of the
UK referendum on EU membership and the US election as well as market
concerns about euro area banksrsquo longer-term profitability prospects played their
role and contributed to the severe increase in the index At the same time
continued accommodative monetary policy in advanced economies and abating
market concerns about the possibility of a sharp slowdown in China have
dampened spikes in systemic stress Also a major concern for global markets
was the crisis in Deutsche Bank and its deep connections to global financial
institutions
From a policy perspective the most pressing issue for euro area financial
institutions remains the high level of NPLs which needs to be addressed The
resolution of systemic NPL problems will take time and requires a
comprehensive strategy involving coordination of all relevant stakeholders
533 Rolling Window ndash Regional Systemic Contribution (RSC)
We calculate the systemic contribution of each region as the ratio between
the total regional contagion effects and the total contagion in the system We
focus on Europe North America (US) and Euro-area since these regions
28
dominated in terms of systemic risk during the period Figure 8 compares the
systemic contribution of these regions Surprisingly the share of systemic risk
that European banks hold increased after 2014 while the contribution of US
banks remains increasingly lower than European banksrsquo contribution after mid-
2012 The difference between the systemic contribution of European and US
banks fluctuates between 40 and 55
Figure 8 European US and Euro-area banksrsquo contribution to total systemic risk
(as a of total systemic risk)
Note US banksrsquo contribution is presented in secondary axis
54 Principal Component Analysis
We use PCA analysis in which the banksrsquo CDS spreads are decomposed into
orthogonal factors of decreasing explanatory power to identify the increased
000
500
1000
1500
2000
2500
000
1000
2000
3000
4000
5000
6000
7000
8000
Jan
-08
May
-08
Sep
-08
Jan
-09
May
-09
Sep
-09
Jan
-10
May
-10
Sep
-10
Jan
-11
May
-11
Sep
-11
Jan
-12
May
-12
Sep
-12
Jan
-13
May
-13
Sep
-13
Jan
-14
May
-14
Sep
-14
Jan
-15
May
-15
Sep
-15
Jan
-16
May
-16
Sep
-16
Jan
-17
May
-17
EU Euroarea US
29
commonality among the default risk of banks (see Muirhead 1982 for an
exposition of PCA)
Let 119884119905 be the log difference of bankrsquos i CDS i=1hellip77 let the systemrsquos
aggregate credit risk be represented by the sum 119884119878 = sum 119884119894119894 and let 119864[119884119894] = 120583119894
and Var[119877119894] = 1205901198942 Then we have
1205901199042 = sum sum 120590119894120590119895120550[119911119894119911119895]
119873
119895=1
119873
119894=1
where 119911119896 = (119877119896 minus 120583119896)120590119896 k=ij
where 119911119896 is the CDS of bank k and 1205901199042 is the variance of the system
PCA produces the decomposition of the variance-covariance matrix of CDS
spreads of the 77 banks contained in the sample into the orthogonal matrix of
loadings L (eigenvector of the correlation matrix of CDS spreads) and the
diagonal matrix of eigenvalues Λ
We focus on the first three eigenvalues as they explain most of the variation
in the system These three eigenvalues are supposed to explain a larger portion
of the total volatility in the system when the CDS spreads are moving together or
in other words when systemic risk in more unified So periods when the first
three components explain most of the total volatility indicates the existence of
increased interconnectedness among banks The first component that is
extracted accounts for the maximum amount of total variance in the observed
variables In other words the proportion of explained variance by the first
component shows how much of the variations in the CDS spreads can be
explained by one common factor This result is in line with Fontana and
Scheicher (2010) who finds there to be a single large determinant dominating
the variation in the CDS spread where the proportion of explained variance by
30
factor 1 exceeds 80 According to Billio et al (2012) during periods of distress
fewer components explain larger part of the volatility which means that the
fluctuation of the first principal component while taking into account the
predictive power that CDS carry reveal periods of increased systemic risk
We run rolling window analysis where the length of the window is 200 days
and the step is 100 days over the period January 2008 to June 2017 and the
results indicate the existence of a single dominant component that determines
the fluctuations of CDS spreads (Figure 9)
Figure 9 Rolling Principal Components analysis
Note The length of the window is 200 days and the step is 100 days
Investigating the determinants of the loadings of each bank to the first
principal component through rolling cross-sectional analysis will reveal the
driving forces of systemic risk on a yearly basis over the period 2008-2016 For
that reason we use rolling cross-sectional analysis
0
10
20
30
40
50
60
Jan
-08
Jun
-08
No
v-0
8
Ap
r-0
9
Sep
-09
Feb
-10
Jul-
10
Dec
-10
May
-11
Oct
-11
Mar
-12
Au
g-1
2
Jan
-13
Jun
-13
No
v-1
3
Ap
r-1
4
Sep
-14
Feb
-15
Jul-
15
Dec
-15
May
-16
Oct
-16
comp1 comp2 comp3
31
ii
iiiiiii
Debt
SurplusGDPNIINPLsLoansAssetsay
7
654321
yi is each bankrsquos loading to the first component
We search among the following bank-specific characteristics total value of
bank assets (logs) retail orientation the total loanstotal assets (levels) NPLs
total loans (levels) and non-interest income total revenue and among the
following home-country specific characteristics GDP growth primary
surplusGDP (levels) public debtGDP (levels) We manage to match 47 banks to
bank-specific characteristics
Table 13 Determinants of each bankrsquos loadings in the first component over the nine
periods
2008 2009 2010 2011 2012 2013 2014 2015 2016
Size -0012 -0002 -0007 -0012 0001 0004 0001 -0002 -0003
(0008) (0007) (0006) (0006) (0007) (0006) (0010) (0008) (0009)
Loan-to-assets -0048 -0142 -0113 -0136 -0135 -0114 -0212 -0210 -0239
(0043) (0051) (0051) (0051) (0054) (0051) (0078) (0069) (0074)
NPLs 0844 0414 0352 0035 0004 -0097 0333 0304 0194
(0349) (0253) (0187) (0183) (0054) (0139) (0187) (0147) (0174)
Non-interest-income 0000 0000 0001 0000 0001 0000 0001 0000 0000
(0000) (0000) (0006) (0006) (0000) (0000) (0000) (0000) (0000)
GDP -0004 -0003 -0006 -0003 -0009 -0009 -0011 -0004 -0007
(0004) (0002) (0001) (0003) (0054) (0003) (0005) (0001) (0006)
Primary SurplusGDP 0000 -0002 0002 0000 -0002 -0004 -0009 -0014 -0012
(0002) (0001) (0001) (0170) (0054) (0003) (0004) (0004) (0005)
DebtGDP -0001 -00005 -00006 -0001 -00007 -00005 -00005 0000 -0000
(0000) (0000) (0000) (0000) (0054) (0000) (0000) (0000) (0000)
_cons 0300 0235 0297 0372 0248 0229 0252 0283 0323
(0080) (0076) (0068) (0078) (0054) (0072) (0111) (0094) (0107)
Note 1 510
32
6 Conclusions
Macroprudential policy is still in its infancy Much work is still needed on
developing good and timely analysis effective policy instrument tools and
effective implementation Our paper makes a contribution on the dimension of
analysis and measurement The key aim of macroprudential policy is to address
externalities and spillovers among financial institutions in an effort to safeguard
financial stability These interactions are complex We provide a tool for
clarifying and quantifying these interactions Our measures can guide
appropriate macroprudential policies that aim to internalize these externalities
A key conclusion from our study is that the focus on size does not adequately
address the systemic importance of banks
33
References
Acharya V Engle R Richardson M 2012 Capital Shortfall A New Approach to
Ranking and Regulating Systemic Risks American Economic Review Vol102 No
3
Acharya V Pedersen L Philippon T Richardson M 2010 Measuring systemic
risk Technical Report Department of Finance NYU
Acharya V Drechsler I Schnabl P 2014 A Pyrrhic Victory Bank Bailouts and
Sovereign Credit Risk Journal of Finance 2014 vol 69 issue 6 2689-2739
Adams Z Fuss R Gropp R 2014 Spillover Effects among Financial
Institutions A State-Dependent Sensitivity Value-at-Risk (SDSVaR) Approach
Journal of Financial and Quantitative Analysis (JFQA) Vol 49 No 3
Adrian T Brunnermeier M 2009 CoVaR Manuscript Princeton University
Aizenman J Hutchison H and JinjarakY (2013) lsquoWhat is the Risk of European
Sovereign Debt Defaults Fiscal Space CDS Spreads and Market Pricing of Riskrsquo
Journal of International Money and Finance 34 37-59
Allen F A Babus and E Carletti (2012) Asset commonality debt maturity and
systemic risk Journal of Financial Economics 104(3) 519ndash534
Alter A Beyer A 2013 The dynamics of spillover effects during the European
sovereign debt turmoil Journal of Banking and Finance 42 134-153
Altunbas Y Manganelli S Marques-Ibanez D 2011 Bank risk during the
financial crisis Do business models matter ECB Working Paper No 1394
Ang A Longstaff F 2011 Systemic sovereign credit risk Lessons from the US
and Europe NBER discussion paper 16983
Ayadi R Arbak E De Groen W 2011 Business Models in European Banking A
pre-and post-crisis screening CEPS Paperbacks
34
Banbura M Giannone D Reichlin L 2011 Nowcasting Oxford Handbook on
Economic Forecasting ed by M P Clements and D F Hendry pp 63ndash90 Oxford
University Press
Bank for Internaional Settlements 2010 Guidance for national authorities
operating the countercyclical capital buffer
Bank for Internaional Settlements 2011 Global systemically important banks
Assessment methodology and the additional loss absorbency requirement
Basel Committee on Banking Supervision 2010 Basel III A global regulatory
framework for more resilient banks and banking systems Bank for International
Settlements
Basu S Das S Michailidis G Purnanandam A 2017 A system-wide approach
to measure connectivity in the financial sector Unpublished
Benoit S Colliard J-E Hurlin C Perignon C 2015 Where the risks lie A
survey on systemic risk Unpublished working paper
Billio M Getmansky M Lo A W Pelizzon L 2012 Econometric measures of
systemic risk in the finance and insurance sectors Journal of Financial
Economics 104 535ndash559
Brownlees CT Engle RF 2010 Volatility correlation and tails for systemic
risk measurement Manuscript Stern School of Business New York University
Canova F and Pappa P 2007 Price Differentials in Monetary Unions The Role
of Fiscal Shocks Economic Journal 117 2007 713-737
Castro C Ferrari S 2014 Measuring and testing for the systemically important financial institutions Journal of Empirical Finance 2014 vol 25 issue C 1-14 Cerutti E Claessens S Laeven L 2015 The Use and Effectiveness of
Macroprudential Policies New Evidence IMF Working Paper No 1561
Crockett A 2000 Marrying the Micro- and Macro-prudential Dimensions of
Financial Stability Eleventh International Conference of Banking Supervisors
held in Basel 20-21
35
De Santis R (2012) ldquoThe euro area sovereign debt crisis Safe haven credit
rating agencies and the spread of the fever from Greece Ireland and Portugalrdquo
ECB Working Paper 1419
DellrsquoAriccia G Igan D Laeven L Tong H Bakker B Vandenbussche J 2012
Policies for Macrofinancial Stability How to Deal with Credit Booms IMF Staff
Discussion Note 1206
Demirer M Diebold F Liu L Yilmaz K 2017 Estimating global bank network
connectedness Journal of Applied Eeconometrics forthcoming
Diebold F X Yilmaz K 2009 Measuring Financial Asset Return and Volatility
Spillovers with Application to Global Equity Markets The Economic Journal
119(534) 158-171
Diebold F X Yilmaz K 2012 Better to give than to receive Predictive
directional measurement of volatility spillovers International Journal of
Forecasting Issue 28 pp 57-66
Doan T Litterman R Sims CA 1984 Forecasting and Conditional Projections
Using Realistic Prior Distributions Econometric Reviews 3(4) 1ndash 100
Elliott D J Feldberg G Lehnert A 2013 The History of Cyclical
Macroprudential Policy in the United States Office of Financial Research
Working Paper No 8
European Central Bank 2016 Macroprudential Bulletin Issue 12016
Financial Stability Board 2011 Measures to address systemically important
financial institutions
Fontana A Scheicher M 2010 An analyisis of euro area sovereign CDS and
their relation with government bonds ECB Working Paper Series Issue 1271
Fostel A Geanakoplos J 2008 Leverage Cycles and the Anxious Economy
American Economic Review 98 (4) 1211ndash1244 [2196]
36
Geanakoplos J Pedersen L H 2014 Monitoring leverage In Brunnermeier M
K Krishnamurthy A (Eds) Risk Topography Systemic Risk and Macro
Modeling NBER pp 175ndash182
Giannone D Lenza M Primiceri GE 2012 Prior Selection for Vector
Autoregressions CEPR Discussion Papers 8755 CEPR Discussion Papers
Giglio S Kelly B T Pruitt S 2015 Systemic risk and the macroeconomy An
empirical evaluation Journal of Financial Economics 2016 vol 119 issue 3 457-
471
Goacutemez-Puig M amp Sosvilla-Rivero S (2014) EMU sovereign debt markets crisis
Fundamental-based or pure contagion Institut de Recerca en Economia
Aplicada (IREA) Working Papers Universitat de Barcelona 201402
Huang X Zhou H Zhu H 2012 Systemic Risk Contributions Journal of
Financial Services Research 2012 vol 42 issue 1 55-83
International Monetary Fund 2013a The Interaction of Monetary and
Macroprudential Policies Washington International Monetary Fund
International Monetary Fund 2015a Financial Operations
Koumlhler M 2013 Does non-interest income make banks more risky Retail-
versus investment oriented banks Deutsche Bundesbank Discussion Paper
No172013
Koop G Korobilis D 2010 Bayesian Multivariate Time Series Methods for
Empirical Macroeconomics Foundations and Trends in Econometrics Vol 3 No
4 pp 267-358
Litterman Robert B 1979 Techniques of forecasting using vector
autoregressions Research Department Working Paper 115 Federal Reserve
Bank of Minneapolis Minnesota
37
Longstaff F Pan J Pedersen L Singleton K 201 How Sovereign Is Sovereign
Credit Risk American Economic Journal Macroeconomics 2011 vol 3 issue 2
75-103
Pesaran H Shin Y 1998 Generalized impulse response analysis in linear
mulitvariate models Economic Letters 58(1) 17-29
White H Kim TH Manganelli S 2008 Modeling autoregressive conditional
skewness and kurtosis with multi-quantile CAViaR In Russell J Watson M
(Eds) Volatility and Time Series Econometrics A Festschrift in Honor of Robert
F Engle
Part B
We study 77 banks from 26 developed and emerging economies Data are downloaded from Thomson-Reuters and cover the period from January 1st 2008 to June 30th 2017 The first sample contains 77 banks are from 19 developed economies while the rest are from 6 emerging economies (as of IMFrsquos list) The sample contains most of the banks that are designated as ldquoglobal systemically important banksrdquo (ldquoGSIBrsquosrdquo) as designated by the Basel Committee on Banking Supervision except for three Chinese banks (Agricultural Bank of China Bank of China and Industrial and Commercial Bank of China) and one French bank Group BPCE 43 out of the 77 banks (544) in the sample are from Europe while 28 of them (3544) are headquartered in Eurozone members The sample is extended by adding 19 smaller European banks
B Sample Presentation Bank Details Descriptive Statistics Tables 2a and b presents the 77 banks in the sample in the worldrsquos top 150 as they ordered by assets (Q4 2016) Table A3 presents the share of assets that each home-country holds in the sample as well as the share of assets per developed and emerging countries while Table A4 presents the share of assets per region Table A5 presents the 14 European banks that are added to the initial sample
Table 2a Banks ordered by Total Assets (in US $ billion)
Rank Bank Name Country Total assets
38
US$B
1 Bank of China China 2613 2 Mitsubishi UFJ Financial Group Japan 2597 3 JPMorgan Chase amp Co USA 2490 4 HSBC Holdings UK 2374 5 BNP Paribas France 2196
6 Bank of America USA 2187 7 Wells Fargo USA 1930 8 China Development Bank China 1904 9 Credit Agricole Group France 1821 10 Citigroup USA 1792
11 Mizuho Financial Group Japan 1757 12 Deutsche Bank Germany 1682 13 Sumitomo Mitsui Financial Group Japan 1654 14 Barclays PLC UK 1490 15 Societe Generale France 1461
16 Banco Santander Spain 1416 17 Lloyds Banking Group UK 1004 18 Norinchukin Bank Japan 984 19 Royal Bank of Scotland Group UK 981 20 UBS Group AG Switzerland 919
21 Unicredit SpA Italy 908 22 ING Groep NV Netherlands 893 23 Goldman Sachs Group USA 860 24 Morgan Stanley USA 814 25 Credit Suisse Group Switzerland 806
Table 2a ndash Continued from previous page
26 BBVA Spain 773 27 Intesa Sanpaolo Italy 766 28 Commonwealth Bank of Australia Australia 703 29 Rabobank Group Netherlands 700 30 Australia amp New Zealand Banking Group Australia 661
31 Nordea Sweden 651 32 Standard Chartered Plc UK 646 33 Westpac Banking Corp Australia 607 34 National Australia Bank Australia 562 35 Commerzbank Germany 549
36 Danske Denmark 495 37 State bank of India India 492 38 US Bancorp USA 445 39 The Export-Import Bank of China China 427 40 Sberbank of Russia Russia 420
41 Resona Japan 412 42 Sumitomo Mitsui TH Japan 406 43 Nomura Holdings Japan 370 44 PNC Financial Services USA 366 45 Capital One Financial Corporation USA 357
46 DBS Group Holdings Singapore 332 47 Shinhan Financial Group South Korea 328 48 KBC Group NV Belgium 291 49 Svenska Handelsbanken Sweden 289 50 Skandinaviska Enskilda Banken Sweden 289
51 Hana Financial Group South Korea 288 52 Nationwide Building Society UK 276 53 Korea Development Bank South Korea 268
39
54 Woori Bank South Korea 257 55 Landesbank Baden-Wurttemberg Germany 257
56 Cathay Financial Holding Taiwan 252 57 Swedbank Sweden 237 58 United Overseas Bank (UOB) Singapore 235 59 Dexia Belgium 225 60 Banco Sabadell Spain 224
61 Bayerische Landesbank Germany 224 62 Erste Group Bank AG Austria 220 63 Banco Popular Espanol Spain 204 64 Industrial Bank of Korea South Korea 196 65 Bank of Ireland Ireland 182
66 Malayan Malaysia 161 67 Standard Bank Group South Africa 161 68 Banca Monte dei Paschi di Siena Italy 161 69 American Express USA 158 70 National Bank of Greece Greece 153 71 Macquarie USA 143
72 Credit Lyonnais France 120 73 Comercial Portuguese Portuguese 113 74 Banco Espirito Santo Portugal 112 75 Turkiye is bankasi Turkey 112 76 Mediobanca Italy 95
77 Landesbank Hessen Germany 92
Table 2b Banks ordered by Country
Rank Bank Country Total assets
US$B
1 Commonwealth Bank of Australia Australia 703 2 Australia amp New Zealand Banking Group Australia 661 3 Westpac Banking Corp Australia 607 4 National Australia Bank Australia 562
5 Erste Group Bank AG Austria 220
6 KBC Group NV Belgium 291 7 Dexia Belgium 225
8 Bank of China China 2613 9 China Development Bank China 1904
10 The Export-Import Bank of China China 427
11 Danske Denmark 495
12 BNP Paribas France 2196 13 Credit Agricole Group France 1821 14 Societe Generale France 1461 15 Credit Lyonnais France 120
16 Deutsche Bank Germany 1682 17 Commerzbank Germany 549 18 Landesbank Baden-Wurttemberg Germany 257 19 Bayerische Landesbank Germany 224 20 Landesbank Hessen Germany 92
21 National Bank of Greece Greece 153
22 State bank of India India 492
23 Bank of Ireland Ireland 182
24 Unicredit SpA Italy 908 25 Intesa Sanpaolo Italy 766
40
26 Banca Monte dei Paschi di Siena Italy 161 27 Mediobanca Italy 95
28 Mitsubishi UFJ Financial Group Japan 2597 29 Mizuho Financial Group Japan 1757 30 Sumitomo Mitsui Financial Group Japan 1654 31 Norinchukin Bank Japan 984 32 Resona Japan 412 33 Sumitomo Mitsui TH Japan 406 34 Nomura Holdings Japan 370 35 Yamaguchi Financial Group Japan 93
36 ING Groep NV Netherlands 893 37 Rabobank Group Netherlands 700
38 Banco Espirito Santo Portugal 111
39 Sberbank of Russia Russia 420
40 DBS Group Holdings Singapore 332 41 United Overseas Bank (UOB) Singapore 235 42 Standard Bank Group South Africa 161
43 Shinhan Financial Group South Korea 328 44 Hana Financial Group South Korea 288 45 Korea Development Bank South Korea 268 46 Woori Bank South Korea 257 47 Industrial Bank of Korea South Korea 196
48 Banco Santander Spain 1416 49 BBVA Spain 773 50 Banco Sabadell Spain 224 51 Banco Popular Espanol Spain 204
Table 2b ndash Continued from previous page
53 Nordea Sweden 651 54 Svenska Handelsbanken Sweden 289 55 Skandinaviska Enskilda Banken Sweden 289 56 Swedbank Sweden 237
57 UBS Group AG Switzerland 919 58 Credit Suisse Group Switzerland 806
59 Cathay Financial Holding Taiwan 252
60 Turkiye is bankasi Turkey 112
61 HSBC Holdings UK 2374 62 Barclays PLC UK 1490 63 Lloyds Banking Group UK 1004 64 Royal Bank of Scotland Group UK 981 65 Standard Chartered Plc UK 646 66 Nationwide Building Society UK 276
68 JPMorgan Chase amp Co USA 2490 69 Bank of America USA 2187 70 Wells Fargo USA 1930 71 Citigroup USA 1792 72 Goldman Sachs Group USA 860 73 Morgan Stanley USA 814 74 US Bancorp USA 445 75 PNC Financial Services USA 366 76 Capital One Financial Corporation USA 357 77 American Express USA 158 78 Macquarie USA 143
41
Table 3a Banksrsquo home-countries ordered by the sum of total bank assets
Developed Total Assets Developing Total Assets USA 11547 China 4944 Japan 7867 India 492 UK 6936 Russia 420 France 5599 Taiwan 252 Germany 2994 South Africa 161 Spain 2617 Turkey 112
Australia 2534 Italy 1933 Switzerland 1725
Netherlands 1584 Sweden 1467 South Korea 1340 Singapore 568 Belgium 516 Denmark 495 Ireland 344 Austria 220 Greece 153 Portugal 111 Total Assets of banks that are headquartered in
Developed 5055366 Emerging 63823 of total assets 888 of total assets 112
42
Table 3b Regional details
Region Number of Banks Total bank
assets of total
assets
Europe 40 2669673 473
Asia 21 1557658 275
N America 11 1154724 204
Oceania 4 2534 45
Africa 1 161 03
B Data Definitions and Descriptive Statistics
Table 4 Data Definitions
Variable Description
Endogenous CDS CDS 5-year spread
Exogenous Systemic risk
CDX The family of CDS indeces covering North America
VIX The volatiliy index of SampP 500
US 3-month T Bill The short-term obligation backed by the Treasury Dept of the US goverment
Bank-specific Size Total assets
Retail orientation Total Loans Total assets
Diversification Non-interest income Total revenues
NPLs Non-performing loans Total Loans
Country-specific
GDP Each bankrsquos home-country GDP growth
Budget Balance Current AccountGDP
Public Debt Public DebtGDP
43
Table 5 Descriptive Statistics
Panel A Systemic risk factor
CDX VIX TED
Mean 269E-06 -0000123 -000121 Median 0000 -0001 0000 Maximum 0020 0176 0250 Minimum -0009 -0152 -0750
Std Dev 0001 0031 0033 Skewness 4689 0689 -17326
Kurtosis 106047 6789 377496 Jarque-Bera 1105896 1679364 14610377 Probability 0000 0000 0000
Sum 0007 -0304 -3000 Sum Sq Dev 0003 2427 2746
Note CDX and VIX are in log differences TED spread is in first differences
Panel B Bank specific
Assets Loans_to_Assets Non_Interest_Inc NPLs
Mean 732382 55596 2442 4601
Median 458009 59921 2378 2411
Maximum 3030645 8664 8640 35217
44
Minimum 4354387 9070 -5962 01082
Std Dev 7460013 17017 1481 5612
Skewness 1081 -0641 -0694 2376
Kurtosis 30129 2584 6193 9630
Jarque-Bera 7023 272888 182117 999501
Probability 0000 0000 0000 0000
Sum 264E+09 2003702 8803746 1658430 Sum Sq Dev 201E+15 1043392 7908036 1134867
Note Data are in levels
Part C ndash Global Sample
Table 7 Individual systemic importance
Panel A ndash Ranked by total score Rank by score
Rank by bank assets Bank Name
Home-Country Region
Assets (billion
US $) Score
To others (Aggr)
From others (Aggr)
1 27 Intesa Sanpaolo Italy Europe 766 1056 0505 0551
2 16 Banco Santander Spain Europe 1416 1038 0464 0574
3 26 BBVA Spain Europe 773 0987 0454 0533
4 5 BNP Paribas France Europe 2196 0982 0445 0537
5 21 Unicredit SpA Italy Europe 908 0975 0489 0485
6 14 Barclays PLC UK Europe 1490 0961 0454 0507
7 12 Deutsche Bank Germany Europe 1682 0954 0428 0526
8 9 Credit Agricole Group France Europe 1821 0942 0424 0518
9 15 Societe Generale France Europe 1461 0940 0427 0512
10 72 Credit Lyonnais France Europe 120 0938 0445 0493
11 17 Lloyds Banking Group UK Europe 1004 0925 0438 0487
12 25 Credit Suisse Group Switz Europe 806 0907 0376 0531
13 35 Commerzbank Germany Europe 549 0904 0410 0494
14 20 UBS Group AG Switz Europe 919 0890 0387 0503
15 32 Standard Chartered Plc UK Europe 646 0870 0419 0451
16 68 Banca Monte dei Paschi Italy Europe 161 0861 0429 0433
45
17 19
Royal Bank of Scotland Group
UK Europe 981 0845 0423 0423
18 29 Rabobank Group Netherl Europe 700 0841 0376 0465
19 22 ING Groep NV Netherl Europe 893 0823 0374 0449
20 76 Mediobanca Italy Europe 95 0821 0389 0433
21 24 Morgan Stanley USA N Amer 814 0752 0315 0437
22 69 American Express USA N Amer 158 0736 0332 0404
23 6 Bank of America USA N Amer 2187 0716 0318 0398
24 23 Goldman Sachs Group USA N Amer 860 0711 0302 0410
25 10 Citigroup USA N Amer 1792 0706 0313 0393
26 4 HSBC Holdings UK Europe 2374 0695 0372 0323
27 62 Erste Group Bank AG Austria Europe 220 0688 0314 0375
28 49 Svenska Handelsbanken Sweden Europe 289 0678 0281 0397
29 53
Korea Development Bank
S Korea Asia 268 0677 0393 0284
30 60 Banco Sabadell Spain Europe 224 0670 0295 0375
31 36 Danske Denmark Europe 495 0663 0296 0367
32 45
Capital One Financial Corp
USA N Amer 357 0662 0260 0401
33 3 JPMorgan Chase amp Co USA N Amer 2490 0658 0257 0401
34 7 Wells Fargo USA N Amer 1930 0653 0259 0394
35 34 National Australia Bank Australia Oceania 562 0622 0376 0247
Table continued on next page
Table 3- Panel A continued from previous page
36 2 Mitsubishi UFJ Financial Japan Asia 2597 0621 0223 0398
37 47 Shinhan Financial Group S Korea Asia 328 0615 0331 0283
38 54 Woori Bank S Korea Asia 257 0612 0333 0278
39 64 Industrial Bank of Korea S Korea Asia 196 0603 0341 0261
40 28 Commonwealth Bank Australia Oceania 703 0599 0388 0211
41 40 Sberbank of Russia Russia Europe 420 0598 0294 0305
42 30 Australia amp N Zealand Australia Oceania 661 0597 0383 0214
43 50 Skandinaviska Enskilda Sweden Europe 289 0578 0262 0316
44 31 Nordea Sweden Europe 651 0574 0289 0285
45 71 Macquarie USA N Amer 143 0572 0321 0251
46 48 KBC Group NV Belgium Europe 291 0568 0241 0327
47 63 Banco Popular Espanol Spain Europe 204 0558 0297 0261
48 61 Bayerische Landesbank Germany Europe 224 0552 0249 0303
49 39 The Export-Import Bank China Asia 427 0548 0284 0264
50 1 Bank of China China Asia 2613 0548 0276 0272
51 66 Malayan Malaysia Asia 171 0543 0321 0223
52 33 Westpac Banking Corp Australia Oceania 606 0540 0374 0166
53 37 State bank of India India Asia 492 0530 0238 0291
54 51 Hana Financial Group S Korea Asia 288 0518 0290 0227
55 57 Swedbank Sweden Europe 237 0486 0253 0233
56 8 China Development Bank China Asia 1904 0468 0260 0208
46
57 52 Nationwide Building Society UK Europe 276 0463 0217 0246
58 59 Dexia Belgium Europe 225 0409 0197 0212
59 46 DBS Group Holdings Singapore Asia 332 0397 0212 0186
60 65 Bank of Ireland Ireland Europe 182 0379 0197 0182
61 58 United Overseas Bank Singapore Asia 235 0373 0214 0159
62 11 Mizuho Financial Group Japan Asia 1757 0367 0271 0096
63 67 Standard Bank Group S Africa Africa 161 0365 0123 0242
64 74 Espirito Santos Portugal Europe 112 0362 0186 0176
65 41 Resona Japan Asia 412 0357 0263 0094
66 13 Sumitomo Mitsui Financial Japan Asia 1654 0355 0250 0104
67 38 US Bancorp USA N Amer 445 0353 0188 0165
68 55 Landesbank Baden-Wurtt Germany Europe 257 0340 0170 0171
69 42 Sumitomo Mitsui TH Japan Asia 406 0323 0273 0050
70 56 Cathay Financial Holding Taiwan Asia 252 0298 0189 0109
71 73 Comercial Portuguese Portugal Europe 113 0279 0268 0011
72 70 National Bank of Greece Greece Europe 153 0220 0176 0044
73 18 Norinchukin Bank Japan Asia 984 0215 0164 0050
74 43 Nomura Holdings Japan Asia 370 0197 0161 0035
75 77 Landesbank Hessen Germany Europe 92 0159 0089 0071
76 44 PNC Financial Services USA N Amer 366 0078 0034 0043
77 75 Turkiye is bankasi Turkey Europe 112 0037 0030 0007
Note Results concern the period January 2008 ndash June 2017 and are of daily frequency
Table 9 Systemic contribution per bank (January 2008 ndash June 2017)
Rank Bank Name SC Rank Bank Name SC Rank Bank Name SC Rank Bank Name SC
1 Intesa Sanpaolo
225 21 Morgan Stanley 160 41 Sberbank of Russia
128 61 United Overseas
080
2 Banco Santander
221 22 American Express
157 42 Australia amp N Zealand
127 62 Mizuho Financial
078
3 BBVA 210 23 Bank of America
153 43 Skandinaviska Enskilda
123 63 Standard Bank Group
078
4 BNP Paribas 209 24 Goldman Sachs Group
152 44 Nordea 122 64 Espirito Santos
077
5 Unicredit SpA
208 25 Citigroup 151 45 Macquarie 122 65 Resona 076
6 Barclays PLC 205 26 HSBC Holdings 148 46 KBC Group NV
121 66 Sumitomo Mitsui
076
7 Deutsche Bank
203 27 Erste Group 147 47 Banco Popular
119 67 US Bancorp
075
8 Credit Agricole
201 28 Svenska 145 48 Bayerische Landesbank
118 68 Landesbank 072
9 Societe Generale
200 29 Korea Development Bank
144 49 The Export-Import
117 69 Sumitomo Mitsui TH
069
10 Credit Lyonnais
200 30 Banco Sabadell 143 50 Bank of China 117 70 Cathay Financial
064
11 Lloyds Banking
197 31 Danske 141 51 Malayan 116 71 Comercial Portuguese
059
47
12 Credit Suisse Group
193 32 Capital One Financial Corp
141 52 Westpac Banking Corp
115 72 NBG 047
13 Commerzbank 193 33 JPMorgan Chase amp Co
140 53 State bank of India
113 73 Norinchukin Bank
046
14 UBS Group AG 190 34 Wells Fargo 139 54 Hana Financial Group
110 74 Nomura Holdings
042
15 Standard Chartered
186 35 National Australia Bank
133 55 Swedbank 104 75 Landesbank Hessen
034
16 Banca Monte dei
184 36 Mitsubishi UFJ Financial
132 56 China Development
100 76 PNC Financial Services
017
17 RBS 180 37 Shinhan Financial Group
131 57 Nationwide Building
099 77 Turkiye is bankasi
008
18 Rabobank Group
179 38 Woori Bank 130 58 Dexia 087
19 ING Groep NV 175 39 Industrial Bank of Korea
129 59 DBS Group Holdings
085
20 Mediobanca 175 40 Commonwealth Bank
128 60 Bank of Ireland
081
8
Systemic risk may originate in an endogenous build-up of financial
imbalances possibly associated with a booming financial cycle large aggregate
shocks hitting the economy or the financial system or contagion effects across
markets intermediaries or infrastructures Our study focuses on contagion
among banks and measures the systemic importance of a bank by the amount of
spillovers it receives from and sends to the rest of the banking system According
to Allen et al (2012) contagion refers to the risk that the failure of one financial
institution leads to the default of others through a domino effect in the interbank
market the payment system or through asset prices More precisely we adopt
the ldquopure-contagionrdquo (Gomez-Puig and Sosvilla Rivero 2013) definition by
controlling only for external common factors through the inclusion of a set of
common external systemic risk factors and assume that each bank could become
itself a source of systemic risk as a result of an idiosyncratic shock
The following example illustrates how we measure the systemic importance
of banks (see Figure 1) Assume that there exist three banks Focusing on bank A
as the source of shocks figure 1 presents the potential impact of an idiosyncratic
shock on bank A to bank B and to bank C respectively Bank A sends a ten-unit
shock to B and a seventeen-unit shock to C a total of 27 Next we focus on the
shocks received by bank A from the other banks in the system Bank A receives a
twenty-one-unit shock from bank B and a five-unit shock from bank C a total of
26 If we sum the shocks that bank A sends to and receives from the system we
obtain an estimate of the degree of connectedness for bank A This is a valid
measure of bank Arsquos systemic importance This procedure is repeated in order to
calculate the systemic importance of bank B and bank C
9
Figure 1 Example of pairwise directional connectedness
Transforming this figure into a table we construct the directional
connectedness matrix
Table 1 Directional connectedness matrix
ShockResponse Bank A Bank B Bank C To Others (Sum_Out)
Bank A - 10 17 27
Bank B 21 - 28 49
Bank C 5 19 - 24
From Other(Sum_In) 26 29 45 100
Score (Sum_Out+Sum_In) 53 78 69
Note Variables in the first column are the impulse origin while variables on the top row are the respondents to the shock
Table 1 presents the entire picture for all three banks in the system Shocks
emanate from row banks to column banks Each row shows the contagion effects
of an equal-sized impulse to the relevant bank in the first column In the last
column we aggregate the total externality effects of each row bank The columns
provide the picture of vulnerability of each bank to shocks in different banks
10
The second to last row is a measure of total vulnerability of a bank to all other
banks in the system It contains the answer to the question ldquoIf all other banks in
the system experienced an idiosyncratic shock of 100 basis points what would
be the impact on bank Xrdquo In the bottom row we aggregate the total externality
effect and the total vulnerability effect of each bank In other words we lump
together shocks sent and received by an individual bank as a measure of total
individual bank connectedness In calculating a bankrsquos systemic importance we
assign equal weights to shocks it sends as to shocks it receives as we are
agnostic as to whether one source of systemic instability is more dangerous than
the other
There are two aspects of financial contagion due to a bankrsquos participation in a
banking system that are of relevance to regulators externalities emanating from
a bankrsquos failure and individual bank vulnerability to financial contagion Both
components are important for regulators but their importance may not be equal
If they are of equal importance then the regulator would consider the sum of
these two However the clear decomposition in Table 1 as well as in our
econometric method allows the regulator to assign different weights in order to
capture the appropriate measure of systemic importance
4 Data and Methodology
41 Data
We study 77 banks from 19 developed and 7 emerging economies Our
selection procedure is as follows We started with the list of the worldrsquos top 150
banks in terms of total assets in Q42016 Using bank names we matched 77
banks to CDS prices from Thomson-Reuters Datastream and Bloomberg CDS
11
spreads cover the period from January 2008 to June 2017 and are at daily
frequency The sample contains all the banks that are designated as ldquoglobal
systemically important banksrdquo (ldquoGSIBrsquosrdquo) by the Basel Committee on Banking
Supervision except for three Chinese banks (Agricultural Bank of China Bank of
China and Industrial and Commercial Bank of China) and one French bank
(Group BPCE) Table 2a (in the Appendix) classifies banks by assets and provides
detail on the 77 banks in the sample such as home-country and total assets
while table 2b (in the Appendix) classifies banks by home-country We note that
40 out of the 77 banks (52) in the sample are from Europe while 28 of them
(34) are headquartered in Eurozone members Tables 3a and 3b (in the
Appendix) provide the regional characteristics of the sample
411 Systemic Risk factor
We will allow for the presence of a global systemic risk factor This permits
us to interpret robustly the results obtained from our model Longstaff et al
(2011) for instance has argued that credit risk appears related to global rather
than country-specific factors while Aizenman et al (2013) has established the
importance of international economic factors in the pricing of credit risk The
variables we chose to employ in order to capture global financial risk conditions
have been widely used in related studies as control variables (see among others
De Santis 2012 Aizenman et al 2013 Ang and Longstaff 2011) The global
default risk conditions are represented by the CDX which is the family of CDS
indices covering North America the VIX volatility index which captures the
global capital marketsrsquo ldquofearrdquo condition and the global liquidity conditions which
is represented by the US 3-month treasury bills The systemic factor is assumed
12
to affect the endogenous variables contemporaneously Table 4 contains the
variable definitions and Table 5 provides descriptive statistics
412 Bank-specific characteristics
A variety of bank- and country-specific variables are used for identifying the
determinants of systemic risk fluctuation over time The first bank-specific
variable is bank size expressed as each bankrsquos total assets (in log) According to
BIS (2011a) the larger a bank is the more likely it is to receive a bailout package
In this sense we also take into consideration the ldquotoo-big-to-failrdquo (TBTF) issue
(Acharya et al 2013) The second bank-specific variable is the loan-to-asset
ratio which provides information on the bankrsquos retail orientation Ayadi et al
(2011) and Koumlhler (2013) suggest that retail-orientated banks appeared to be
less risky than other banks during the recent financial crisis Also according to
Altunbas et al (2011) the non-interest income over total revenue is considered
to be a measure of each bankrsquos diversification since the less a bank relies on
interest income the less exposed the bank is to a negative shock Finally we
include each bankrsquos nonperforming loans over total loans (see Tables 4 and 5)
413 Country-specific characteristics
It is important to include country-specific factors since the impact of
macroprudential policy might differ depending on the underlying economic
conditions of each bankrsquos home country For example the impact of shocks may
be larger for economies that were under stress and hence rely more on rescue
packages and foreign financing (IMF 2015a) These economies would not have
the same ability to support effectively their banking systems in times of distress
13
We investigate the role of sovereigns by searching among each bankrsquos home-
country GDP growth the primary surplus over GDP and public debt over GDP
42 Connectedness matrix
We estimate a VARX model with two lags (p=2) for the endogenous variables
and contemporaneous exogenous variables (q=0)
The vector of endogenous variables (y) consists of log differences of daily CDS
spreads for the 77 banks By including the exogenous variables we account for
common factors that affect at the same time all bank CDS spreads (Bekaert et al
2005)
421 Bayesian VAR
The suggested model has many more parameters than observations overfits
the data in-sample and as a consequence could perform poorly Researchers
working in the relevant literature typically use prior shrinkage on the
parameters to overcome such over-parametrization concerns Most flexible
Bayesian priors that result in shrinkage of high-dimensional parameter spaces
rely on computationally intensive Markov Chain Monte Carlo (MCMC) methods
Their application to recursive forecasting exercises can as a consequence be
prohibitive or even infeasible The only exception is a variant of the Minnesota
prior that is based on the natural conjugate prior an idea that has recently been
exploited by Banbura Giannone and Reichlin (2010) and Giannone Lenza and
Primiceri (2012) among others While this prior allows for an analytical formula
ttttt uXBYAYAaY 122110
14
for the posterior there is a cost in terms of flexibility in that a priori all VAR
equations are treated in the same manner see Koop and Korobilis (2010) for a
further discussion of this aspect of the natural conjugate prior
The traditional ldquoMinnesota priorrdquo an empirical-Bayes prior which is due to
Littermann (1979) and co-authors (see eg Doan Litterman and Sims 1984)
still dominates many applications of VAR models in economics The recent
contribution of Giannone Lenza and Primiceri (2012) provides guidance on
selecting the prior hyperparameter controlling shrinkage of the VAR coefficients
Note that computational simplicity is a priority in this paper so that the
Gibbs sampler is preferred compared to other potentially more powerful and
elegant Markov Chain Monte Carlo (MCMC) and Sequential Monte Carlo (SMC)
algorithms for prior selection However we recognize that the flexibility of
choosing the prior freely is one of the main controversial issues associated with
Bayesian analysis and the reason why some researchers view the latter as
subjective It is also the reason why the Bayesian practice especially in the early
days was dominated by non-informative priors as these priors assign equal
probabilities to all possible states of the parameter space with the aim of
rectifying the subjectivity problem We estimate the coefficients of a VAR(2) for
78 banks using the arithmetic returns of each bankrsquos CDS As we explained
above a key concern of users of Bayesian statistics and criticism by critics is the
dependence of the posterior distribution on onersquos prior and for this reason we
specify hyperparameters for the prior
The Bayesian VAR(p) model can be written as
119910119905 = 1198860 + sum 119860119895119910119905minus119895 + 120576119905
119901
119895=1
15
where yt for t = 1 T is an M x 1 vector containing observations on M time series
variables εt is an M x 1 vector of errors α0 is an M x 1 vector of intercepts and Aj
is an M x M matrix of coefficients We assume εt to be iid N (0 Σ) Exogenous
variables are added to the VAR and included in all the derivations below but we
do not do so to keep the notation as simple as possible
422 The connectedness matrix framework
The construction of the diagnostic tool is based on a medium-size Bayesian
vector autoregressive model with exogenous variables (Bayesian VARX) that
accounts for common global and regional trends and is able to include even
bank-specific characteristics Then similar as the framework described by
Diebold and Yilmaz (2009 2012) and the one described by Alter and Beyer
(2013) we construct the spillover matrix in order to capture any potential
spillovers among banks This methodology relies on Generalized Forecast Error
Variance Decomposition (GFEVD) or on Generalized Impulse Response
Functions (GIRF) obtained as shown in Pesaran and Shin (1998) Therefore we
derive Generalized Impulse Response Functions as functions of residuals
together with the interdependent coefficients According to Alter and Beyer
(2012) it is of low importance which methodology we select since they produce
qualitatively similar results
16
Table 6 Contagionconnectedness matrix
Note Variables in the first column are the impulse origin while variables on the top row are the respondents to the shock The cumulative impact is bound between 0 and 1 A value of 05 means that the response variable would be impacted in the same direction with an intensity of 50 the initial unexpected shock in the impulse variable The last column presents the aggregated impact sent (Sum OUT) by each row variable and on the bottom row the aggregated spillover received (Sum IN) by each column variable The bottom-right cell shows total spillover in the system and by dividing this value to the total number of non-diagonal cells we obtain the connectedness index (CI)
In table 2 row variables are the origin of the unexpected shock Column
variables are the respondents of contagion receivers CI represents the
connectedness index calculated as the average response in the contagion matrix
The potential contagion effects are aggregated on each line and column and
represent the total to_others and the total from_others as potential contributions
to contagion from and to each bank The main diagonal values represent the
effect of a variablersquos shock on itself and they are excluded from any calculations
The possible contagion effects answer the question ldquoHow would bank B evolve in
the following period if bank A CDS increases by one unit shockrdquo
We use accumulated Impulse Response functions over a 10-step horizon (10-
days) Not all the banks respond to the shocks within the same period but the
majority of the shocks are absorbed within 10-days Nevertheless the
framework is flexible and it easily adapts to the needs of each study
5 Empirical results
17
51 Individual bank connectedness
We estimate the connectedness matrix as described in section 422 for the
whole sample period 1 January 2008 to 31 June 2017 and estimate the
individual bank connectedness (table 7) which reports several notable results
The evidence do not offer support to the argument that systemic importance of a
bank can be adequately captured by its size According to table 7 the bank that
creates the most systemic risk in the system is Intesa Sanpaolo a medium-sized
European bank that is ranked 27th in terms of total assets with total contagion
effects of 1056 which is further decomposed into 0505 vulnerability-score and
0551 externalities-score For instance the Intesa Sanpaolorsquos 0551 externalities
score implies that one-unit shock in Intesa Sanpaolo will have an impact of
551 to the system while the 0505 vulnerability score means that one-unit
shock to the market will affect Intesa Sanpaolo by 505 Among the top-20
most connected banks can also be found smaller banks like BBVA (3rd) Credit
Lyonnais (10th) Banca Monte dei Paschi (16th) and Mediobanca (20th) while the
largest bank in the sample is listed 50th in terms of systemic importance
The existing literature on the topic suggests that during crises periods large
banks behave differently than small or medium-sized banks (Laeven et al 2014)
This phenomenon could be partially attributed to some common characteristics
that are shared by large banks and are associated with higher levels of risk
namely the increased portion of market-based activities the reduced capital
adequacy the less stable funding and the higher organizational complexity
However it remains unidentified the bank-size threshold above or below which
these criteria are valid Results presented in table 8 provide a more narrow
response to the question whether systemic importance is related to size or not
18
Size per se is a determinant of systemic importance since when banks are
ranked by systemic importance the first quartile compiles the largest percentage
of total assets (34 of total assets) However when the sample is ranked by total
assets and not in terms of connectedness the first quartile represents 62 of
total assets indicating a severe leakage of assets to the other quartiles and
revealing the existence of structural variables that interact with size
The existing frameworks used by regulators and policy makers such as the
BCBSFSB framework rely heavily on size either through size-related indicators
or size per se to calculate the capital adequacy ratios Our results suggest that
the measures taking strong size-effect as granted should also focus on the large
banksrsquo idiosyncratic characteristics that place 50 of G-SIBs in the first quartile
of systemic importance
Table 8 Banks ranked by systemic importance and by assets ndash Number of banks per quartile
Quartile ranked by Number of G-SIBs per quartile
Score Assets
1st Quartile 34 62 48
2nd Quartile 33 224 28
3rd Quartile 18 105 10
4th Quartile 14 51 14
The next step is to calculate the systemic contribution of each bank in the
system as the ratio between the total individual contagion effects and the total
contagion in the system
100TC
TICTSC i
i
y
y
19
TSC is the total systemic contribution TIC is the total individual contagion
effects and TC is the total contagion in the system The bank with the highest
ranking contributes 225 of the total contagion effects while the bank at the
bottom of the table contributes almost 0 (table 9) This measure allows us to
compare the results among samples with different number of entities
We define each bankrsquos directional connectedness as the ratio between the
individual externalities and the total individual contagion
100
i
i
i
y
yOUT
yOUTTIC
IEID or
100
i
i
i
y
yIN
yINTIC
IVID
ID is the individual directionality IE is the individual externalities IV is the
individual vulnerabilities and TIC is total individual contagion The followings
should be always valid
1 ii yINyOUT IDID
ii yINyOUT IDID
In case iyOUTID is larger than 50 it means than the bank that the systemic score
of the bank it refers to is externalities-driven When breaking the results into
quartiles that represent the average individual directionality for all the banks
that belong in this quartile (table 10) we realize that banks with higher TIC tend
to have higher iyOUTID ratios (54) that their peers that belong in the last
quartile (30) We do not suggest that the directionality of contagion
determines the systemic importance of banks because this is beyond control and
difficult to interpret but that in terms of systemic importance that may be
20
interpreted into increased capital requirements is ldquobetter to receive shocks than
to send shocks to the systemrdquo
Table 10 Average Individual Directionality (OUT) per quartile
iyOUTID
1st Quartile 54
2nd Quartile 53
3rd Quartile 47
4th Quartile 30
Note banks are ranked by systemic importance
52 Regional network connectedness
Prior quantifying the transmission of contagion effects we focus on table 7
that reveals a very strong regional effect This is that the first quartile of systemic
importance is exclusively dominated by banks that are headquartered in Europe
implying the existence of a regional component and severe clustering Table 11a
shows the regional concentration per quartile and table 11b expresses the
regional concentration as a percentage of the total number of banks that exist
per region
Table 11a Concentration of banks per region
Quartile Europe Eurozone (as
of EU) N America Asia Oceania Africa
1st Quartile 100 75 - - - -
2nd Quartile 25 25 40 25 10 -
3rd Quartile 50 50 10 30 10 -
4th Quartile 35 75 12 48 - 5
Table 11b Regional concentration as a percentage of total banks per region
21
Quartile Europe N America Asia Oceania Africa
1st Quartile 47 - - - -
2nd Quartile 12 73 25 25 -
3rd Quartile 21 9 35 75 -
4th Quartile 16 18 40 - 100
The next step is to understand the flows of shocks among the different
regions the contagion effects and the degree of connectedness among the
different regions (Table 12a and b) We focus on four regions Europe North
America (expressed by US banks) Asia and Oceania Table 12a shows regionrsquos A
externalities to the other regions as a percentage of regionrsquos A total externalities
while table 12b focuses on the vulnerabilities side Combining the information
obtained by tables 12a and b European and US appear to be strongly
interconnected More precisely 58 of the aggregate shocks that are sent by US
banks are directed to Europe while 64 of the aggregate shocks received by US
banks are generated in Europe Also another important finding is that 69 of
the aggregate shocks that are sent by European banks remain within Europe
Table 12a Shocks sent per region as of total shocks sent per region
Asia Europe NAmerica Oceania
Sum
Asia 41 41 9 9
100
Europe 16 69 960 540
100
NAmerica 1950 58 16 650
100
Oceania 33 4450 950 12
100
22
Table 12b Shocks received per region as of total shocks received per region
Asia Europe NAmerica Oceania
Asia
28 10 13 21
Europe
54 75 64 59
NAmerica
12 12 20 13
Oceania
6 3 3 7
Sum
100 100 100 100
All in all it is obvious that there exists a regional factor that affects
significantly the bank connectedness However it is interesting to find out the
driving forces of this regional component especially in the case of Europe which
has been a special case due to the different transmission channels of the financial
crisis the highly interconnected banking system the feedback loops among
sovereigns and banks and the contagion from one country to the rest of Europe
53 National banking system connectedness
We approach the national banking system first of all by calculating the
average systemic risk per bank for each one of the countries in the sample
(Figure 2) Four out of the first five banks that contributed the most to the global
systemic risk belong to Eurozone French banks contributed the most to
systemic risk while Italy and Spain both of which suffered from banking
systems in distress followed at close range Banks in non-Euro-area countries
like Swiss and UK banks played an important role as well Surprisingly the
average contagion effects for German banks place them almost in the middle of
the table indicating that German banking system may acted as a stability factor
for the European region Both Portuguese and especially Greek banking system
appeared to be isolated from the global banking system
23
Figure 2 Average systemic risk per bank ndash Own shocks are excluded
Note results concern the period January 2008-June 2017
In figure 3 we approach the total contagion from a different perspective by
presenting the total contagion effects for each sovereign This approach may
depends on the number of banks per sovereign but illustrates that US-European
cluster dominates in terms of systemic importance
Figure 3 National systemic risk ndash Own shocks are excluded
Note results concern the period January 2008-June 2017
53 Rolling window
000
010
020
030
040
050
060
070
080
090
100
Fra
nce
Ital
y
Swit
z
Net
her
l
Spai
n
UK
Au
stri
a
Den
mar
k
S K
ore
a
USA
Ru
ssia
Au
stra
lia
Ger
man
y
Swed
en
Mal
aysi
a
Ind
ia
Ch
ina
Bel
giu
m
Sin
gap
ore
Irel
and
S A
fric
a
Jap
an
Po
rtu
gal
Tai
wan
Gre
ece
Tu
rkey
000
100
200
300
400
500
600
700
USA U
K
Fra
nce
Ital
y
Spai
n
S K
ore
a
Ger
man
y
Jap
an
Au
stra
lia
Swed
en
Swit
z
Net
her
l
Ch
ina
Bel
giu
m
Sin
gap
ore
Au
stri
a
Den
mar
k
Po
rtu
gal
Ru
ssia
Mal
aysi
a
Ind
ia
Irel
and
S A
fric
a
Tai
wan
Gre
ece
Tu
rkey
24
531 Individual Banks
In order to better understand the evolvement of systemic risk and how this
fluctuated over the whole period we use rolling-window analysis where the
length of the window is 340 days and the step is 150 days Figure 3 presents the
evolution of total contagion over time where strong co-movement and
interconnections among banks are obvious We also discriminate periods where
the cluster of TCI lines is shrinking and systemic risk is becoming more unified
which means that systemic and idiosyncratic shocks are propagated more
intensely via the network
Figure 3 Total Individual Contagion
Note The length of the window is 340 days and the step is 150 days
We introduce the range as a new metric of systemic risk unification Range at
each point in time is defined as the difference between the highest and the
lowest score in the system (Figure 4) The lowest the score the more unified the
000
020
040
060
080
100
120
Jan
-08
May
-08
Sep
-08
Jan
-09
May
-09
Sep
-09
Jan
-10
May
-10
Sep
-10
Jan
-11
May
-11
Sep
-11
Jan
-12
May
-12
Sep
-12
Jan
-13
May
-13
Sep
-13
Jan
-14
May
-14
Sep
-14
Jan
-15
May
-15
Sep
-15
Jan
-16
May
-16
Sep
-16
Jan
-17
May
-17
25
systemic risk is becoming Given the predictive power of CDS spreads this new
measure could be used by regulators and policymakers as an early-warning tool
However it remains an open question what is the threshold below which the
unification of systemic risk could consist a problem It is remarkable that the
most ldquolooserdquo links were observed during the post-Lehman collapse in late 2008
and reached its lowest price at the beginning of Greek crisis
Figure 4 Systemic risk range
Note The length of the window is 340 days and the step is 150 days
532 Global banking system
In this part we are interested in understanding the behavior of aggregate
contagion effects Total Systemic risk (TSR) is defined as the total of the off-
0
01
02
03
04
05
06
07
08
09
1
Jan
-08
May
-08
Sep
-08
Jan
-09
May
-09
Sep
-09
Jan
-10
May
-10
Sep
-10
Jan
-11
May
-11
Sep
-11
Jan
-12
May
-12
Sep
-12
Jan
-13
May
-13
Sep
-13
Jan
-14
May
-14
Sep
-14
Jan
-15
May
-15
Sep
-15
Jan
-16
May
-16
Sep
-16
Jan
-17
May
-17
26
diagonal entries in the connectedness matrix or as the sum of the ldquofromrdquo column
or ldquotordquo row measures total connectedness
N
ijji
H
ij
H IRTSR 1
We could plot a moving contagion measure defined as the sum of all IRFs ldquoto
others but we go one step further and we choose to present the Total Contagion
index (TCI) which is calculated as the average response per bank in the
connectedness matrix and is calculated as the sum of all non-diagonal cells
divided by the total number of entities
N
i j yy jiIR
NTCI
1 1
1
Cumulative IRs interval is [01] the index will be bound between 0 and 100
Higher contagion index implies a tightening of the nexus among banks (Figure
5)
Figure 5 Total Connectedness (TC)
Note The length of the window is 340 days and the step is 150 days
000
500
1000
1500
2000
2500
3000
3500
4000
4500
Jan
-08
May
-08
Sep
-08
Jan
-09
May
-09
Sep
-09
Jan
-10
May
-10
Sep
-10
Jan
-11
May
-11
Sep
-11
Jan
-12
May
-12
Sep
-12
Jan
-13
May
-13
Sep
-13
Jan
-14
May
-14
Sep
-14
Jan
-15
May
-15
Sep
-15
Jan
-16
May
-16
Sep
-16
Jan
-17
May
-17
27
Total connectedness reached its peak after Lehman collapse and was
severely affected by the developments in the European banking and sovereign
debt markets that shocked some EU member countries until mid-2012 The
Greek crisis and then the fact that in the early 2011 Italy and Spain joined the
countries with stressed banking systems pushed total connectedness upwards
After the early 2012 the actions taken by the ECB constrained total contagion
but after early 2015 higher political uncertainty following the outcomes of the
UK referendum on EU membership and the US election as well as market
concerns about euro area banksrsquo longer-term profitability prospects played their
role and contributed to the severe increase in the index At the same time
continued accommodative monetary policy in advanced economies and abating
market concerns about the possibility of a sharp slowdown in China have
dampened spikes in systemic stress Also a major concern for global markets
was the crisis in Deutsche Bank and its deep connections to global financial
institutions
From a policy perspective the most pressing issue for euro area financial
institutions remains the high level of NPLs which needs to be addressed The
resolution of systemic NPL problems will take time and requires a
comprehensive strategy involving coordination of all relevant stakeholders
533 Rolling Window ndash Regional Systemic Contribution (RSC)
We calculate the systemic contribution of each region as the ratio between
the total regional contagion effects and the total contagion in the system We
focus on Europe North America (US) and Euro-area since these regions
28
dominated in terms of systemic risk during the period Figure 8 compares the
systemic contribution of these regions Surprisingly the share of systemic risk
that European banks hold increased after 2014 while the contribution of US
banks remains increasingly lower than European banksrsquo contribution after mid-
2012 The difference between the systemic contribution of European and US
banks fluctuates between 40 and 55
Figure 8 European US and Euro-area banksrsquo contribution to total systemic risk
(as a of total systemic risk)
Note US banksrsquo contribution is presented in secondary axis
54 Principal Component Analysis
We use PCA analysis in which the banksrsquo CDS spreads are decomposed into
orthogonal factors of decreasing explanatory power to identify the increased
000
500
1000
1500
2000
2500
000
1000
2000
3000
4000
5000
6000
7000
8000
Jan
-08
May
-08
Sep
-08
Jan
-09
May
-09
Sep
-09
Jan
-10
May
-10
Sep
-10
Jan
-11
May
-11
Sep
-11
Jan
-12
May
-12
Sep
-12
Jan
-13
May
-13
Sep
-13
Jan
-14
May
-14
Sep
-14
Jan
-15
May
-15
Sep
-15
Jan
-16
May
-16
Sep
-16
Jan
-17
May
-17
EU Euroarea US
29
commonality among the default risk of banks (see Muirhead 1982 for an
exposition of PCA)
Let 119884119905 be the log difference of bankrsquos i CDS i=1hellip77 let the systemrsquos
aggregate credit risk be represented by the sum 119884119878 = sum 119884119894119894 and let 119864[119884119894] = 120583119894
and Var[119877119894] = 1205901198942 Then we have
1205901199042 = sum sum 120590119894120590119895120550[119911119894119911119895]
119873
119895=1
119873
119894=1
where 119911119896 = (119877119896 minus 120583119896)120590119896 k=ij
where 119911119896 is the CDS of bank k and 1205901199042 is the variance of the system
PCA produces the decomposition of the variance-covariance matrix of CDS
spreads of the 77 banks contained in the sample into the orthogonal matrix of
loadings L (eigenvector of the correlation matrix of CDS spreads) and the
diagonal matrix of eigenvalues Λ
We focus on the first three eigenvalues as they explain most of the variation
in the system These three eigenvalues are supposed to explain a larger portion
of the total volatility in the system when the CDS spreads are moving together or
in other words when systemic risk in more unified So periods when the first
three components explain most of the total volatility indicates the existence of
increased interconnectedness among banks The first component that is
extracted accounts for the maximum amount of total variance in the observed
variables In other words the proportion of explained variance by the first
component shows how much of the variations in the CDS spreads can be
explained by one common factor This result is in line with Fontana and
Scheicher (2010) who finds there to be a single large determinant dominating
the variation in the CDS spread where the proportion of explained variance by
30
factor 1 exceeds 80 According to Billio et al (2012) during periods of distress
fewer components explain larger part of the volatility which means that the
fluctuation of the first principal component while taking into account the
predictive power that CDS carry reveal periods of increased systemic risk
We run rolling window analysis where the length of the window is 200 days
and the step is 100 days over the period January 2008 to June 2017 and the
results indicate the existence of a single dominant component that determines
the fluctuations of CDS spreads (Figure 9)
Figure 9 Rolling Principal Components analysis
Note The length of the window is 200 days and the step is 100 days
Investigating the determinants of the loadings of each bank to the first
principal component through rolling cross-sectional analysis will reveal the
driving forces of systemic risk on a yearly basis over the period 2008-2016 For
that reason we use rolling cross-sectional analysis
0
10
20
30
40
50
60
Jan
-08
Jun
-08
No
v-0
8
Ap
r-0
9
Sep
-09
Feb
-10
Jul-
10
Dec
-10
May
-11
Oct
-11
Mar
-12
Au
g-1
2
Jan
-13
Jun
-13
No
v-1
3
Ap
r-1
4
Sep
-14
Feb
-15
Jul-
15
Dec
-15
May
-16
Oct
-16
comp1 comp2 comp3
31
ii
iiiiiii
Debt
SurplusGDPNIINPLsLoansAssetsay
7
654321
yi is each bankrsquos loading to the first component
We search among the following bank-specific characteristics total value of
bank assets (logs) retail orientation the total loanstotal assets (levels) NPLs
total loans (levels) and non-interest income total revenue and among the
following home-country specific characteristics GDP growth primary
surplusGDP (levels) public debtGDP (levels) We manage to match 47 banks to
bank-specific characteristics
Table 13 Determinants of each bankrsquos loadings in the first component over the nine
periods
2008 2009 2010 2011 2012 2013 2014 2015 2016
Size -0012 -0002 -0007 -0012 0001 0004 0001 -0002 -0003
(0008) (0007) (0006) (0006) (0007) (0006) (0010) (0008) (0009)
Loan-to-assets -0048 -0142 -0113 -0136 -0135 -0114 -0212 -0210 -0239
(0043) (0051) (0051) (0051) (0054) (0051) (0078) (0069) (0074)
NPLs 0844 0414 0352 0035 0004 -0097 0333 0304 0194
(0349) (0253) (0187) (0183) (0054) (0139) (0187) (0147) (0174)
Non-interest-income 0000 0000 0001 0000 0001 0000 0001 0000 0000
(0000) (0000) (0006) (0006) (0000) (0000) (0000) (0000) (0000)
GDP -0004 -0003 -0006 -0003 -0009 -0009 -0011 -0004 -0007
(0004) (0002) (0001) (0003) (0054) (0003) (0005) (0001) (0006)
Primary SurplusGDP 0000 -0002 0002 0000 -0002 -0004 -0009 -0014 -0012
(0002) (0001) (0001) (0170) (0054) (0003) (0004) (0004) (0005)
DebtGDP -0001 -00005 -00006 -0001 -00007 -00005 -00005 0000 -0000
(0000) (0000) (0000) (0000) (0054) (0000) (0000) (0000) (0000)
_cons 0300 0235 0297 0372 0248 0229 0252 0283 0323
(0080) (0076) (0068) (0078) (0054) (0072) (0111) (0094) (0107)
Note 1 510
32
6 Conclusions
Macroprudential policy is still in its infancy Much work is still needed on
developing good and timely analysis effective policy instrument tools and
effective implementation Our paper makes a contribution on the dimension of
analysis and measurement The key aim of macroprudential policy is to address
externalities and spillovers among financial institutions in an effort to safeguard
financial stability These interactions are complex We provide a tool for
clarifying and quantifying these interactions Our measures can guide
appropriate macroprudential policies that aim to internalize these externalities
A key conclusion from our study is that the focus on size does not adequately
address the systemic importance of banks
33
References
Acharya V Engle R Richardson M 2012 Capital Shortfall A New Approach to
Ranking and Regulating Systemic Risks American Economic Review Vol102 No
3
Acharya V Pedersen L Philippon T Richardson M 2010 Measuring systemic
risk Technical Report Department of Finance NYU
Acharya V Drechsler I Schnabl P 2014 A Pyrrhic Victory Bank Bailouts and
Sovereign Credit Risk Journal of Finance 2014 vol 69 issue 6 2689-2739
Adams Z Fuss R Gropp R 2014 Spillover Effects among Financial
Institutions A State-Dependent Sensitivity Value-at-Risk (SDSVaR) Approach
Journal of Financial and Quantitative Analysis (JFQA) Vol 49 No 3
Adrian T Brunnermeier M 2009 CoVaR Manuscript Princeton University
Aizenman J Hutchison H and JinjarakY (2013) lsquoWhat is the Risk of European
Sovereign Debt Defaults Fiscal Space CDS Spreads and Market Pricing of Riskrsquo
Journal of International Money and Finance 34 37-59
Allen F A Babus and E Carletti (2012) Asset commonality debt maturity and
systemic risk Journal of Financial Economics 104(3) 519ndash534
Alter A Beyer A 2013 The dynamics of spillover effects during the European
sovereign debt turmoil Journal of Banking and Finance 42 134-153
Altunbas Y Manganelli S Marques-Ibanez D 2011 Bank risk during the
financial crisis Do business models matter ECB Working Paper No 1394
Ang A Longstaff F 2011 Systemic sovereign credit risk Lessons from the US
and Europe NBER discussion paper 16983
Ayadi R Arbak E De Groen W 2011 Business Models in European Banking A
pre-and post-crisis screening CEPS Paperbacks
34
Banbura M Giannone D Reichlin L 2011 Nowcasting Oxford Handbook on
Economic Forecasting ed by M P Clements and D F Hendry pp 63ndash90 Oxford
University Press
Bank for Internaional Settlements 2010 Guidance for national authorities
operating the countercyclical capital buffer
Bank for Internaional Settlements 2011 Global systemically important banks
Assessment methodology and the additional loss absorbency requirement
Basel Committee on Banking Supervision 2010 Basel III A global regulatory
framework for more resilient banks and banking systems Bank for International
Settlements
Basu S Das S Michailidis G Purnanandam A 2017 A system-wide approach
to measure connectivity in the financial sector Unpublished
Benoit S Colliard J-E Hurlin C Perignon C 2015 Where the risks lie A
survey on systemic risk Unpublished working paper
Billio M Getmansky M Lo A W Pelizzon L 2012 Econometric measures of
systemic risk in the finance and insurance sectors Journal of Financial
Economics 104 535ndash559
Brownlees CT Engle RF 2010 Volatility correlation and tails for systemic
risk measurement Manuscript Stern School of Business New York University
Canova F and Pappa P 2007 Price Differentials in Monetary Unions The Role
of Fiscal Shocks Economic Journal 117 2007 713-737
Castro C Ferrari S 2014 Measuring and testing for the systemically important financial institutions Journal of Empirical Finance 2014 vol 25 issue C 1-14 Cerutti E Claessens S Laeven L 2015 The Use and Effectiveness of
Macroprudential Policies New Evidence IMF Working Paper No 1561
Crockett A 2000 Marrying the Micro- and Macro-prudential Dimensions of
Financial Stability Eleventh International Conference of Banking Supervisors
held in Basel 20-21
35
De Santis R (2012) ldquoThe euro area sovereign debt crisis Safe haven credit
rating agencies and the spread of the fever from Greece Ireland and Portugalrdquo
ECB Working Paper 1419
DellrsquoAriccia G Igan D Laeven L Tong H Bakker B Vandenbussche J 2012
Policies for Macrofinancial Stability How to Deal with Credit Booms IMF Staff
Discussion Note 1206
Demirer M Diebold F Liu L Yilmaz K 2017 Estimating global bank network
connectedness Journal of Applied Eeconometrics forthcoming
Diebold F X Yilmaz K 2009 Measuring Financial Asset Return and Volatility
Spillovers with Application to Global Equity Markets The Economic Journal
119(534) 158-171
Diebold F X Yilmaz K 2012 Better to give than to receive Predictive
directional measurement of volatility spillovers International Journal of
Forecasting Issue 28 pp 57-66
Doan T Litterman R Sims CA 1984 Forecasting and Conditional Projections
Using Realistic Prior Distributions Econometric Reviews 3(4) 1ndash 100
Elliott D J Feldberg G Lehnert A 2013 The History of Cyclical
Macroprudential Policy in the United States Office of Financial Research
Working Paper No 8
European Central Bank 2016 Macroprudential Bulletin Issue 12016
Financial Stability Board 2011 Measures to address systemically important
financial institutions
Fontana A Scheicher M 2010 An analyisis of euro area sovereign CDS and
their relation with government bonds ECB Working Paper Series Issue 1271
Fostel A Geanakoplos J 2008 Leverage Cycles and the Anxious Economy
American Economic Review 98 (4) 1211ndash1244 [2196]
36
Geanakoplos J Pedersen L H 2014 Monitoring leverage In Brunnermeier M
K Krishnamurthy A (Eds) Risk Topography Systemic Risk and Macro
Modeling NBER pp 175ndash182
Giannone D Lenza M Primiceri GE 2012 Prior Selection for Vector
Autoregressions CEPR Discussion Papers 8755 CEPR Discussion Papers
Giglio S Kelly B T Pruitt S 2015 Systemic risk and the macroeconomy An
empirical evaluation Journal of Financial Economics 2016 vol 119 issue 3 457-
471
Goacutemez-Puig M amp Sosvilla-Rivero S (2014) EMU sovereign debt markets crisis
Fundamental-based or pure contagion Institut de Recerca en Economia
Aplicada (IREA) Working Papers Universitat de Barcelona 201402
Huang X Zhou H Zhu H 2012 Systemic Risk Contributions Journal of
Financial Services Research 2012 vol 42 issue 1 55-83
International Monetary Fund 2013a The Interaction of Monetary and
Macroprudential Policies Washington International Monetary Fund
International Monetary Fund 2015a Financial Operations
Koumlhler M 2013 Does non-interest income make banks more risky Retail-
versus investment oriented banks Deutsche Bundesbank Discussion Paper
No172013
Koop G Korobilis D 2010 Bayesian Multivariate Time Series Methods for
Empirical Macroeconomics Foundations and Trends in Econometrics Vol 3 No
4 pp 267-358
Litterman Robert B 1979 Techniques of forecasting using vector
autoregressions Research Department Working Paper 115 Federal Reserve
Bank of Minneapolis Minnesota
37
Longstaff F Pan J Pedersen L Singleton K 201 How Sovereign Is Sovereign
Credit Risk American Economic Journal Macroeconomics 2011 vol 3 issue 2
75-103
Pesaran H Shin Y 1998 Generalized impulse response analysis in linear
mulitvariate models Economic Letters 58(1) 17-29
White H Kim TH Manganelli S 2008 Modeling autoregressive conditional
skewness and kurtosis with multi-quantile CAViaR In Russell J Watson M
(Eds) Volatility and Time Series Econometrics A Festschrift in Honor of Robert
F Engle
Part B
We study 77 banks from 26 developed and emerging economies Data are downloaded from Thomson-Reuters and cover the period from January 1st 2008 to June 30th 2017 The first sample contains 77 banks are from 19 developed economies while the rest are from 6 emerging economies (as of IMFrsquos list) The sample contains most of the banks that are designated as ldquoglobal systemically important banksrdquo (ldquoGSIBrsquosrdquo) as designated by the Basel Committee on Banking Supervision except for three Chinese banks (Agricultural Bank of China Bank of China and Industrial and Commercial Bank of China) and one French bank Group BPCE 43 out of the 77 banks (544) in the sample are from Europe while 28 of them (3544) are headquartered in Eurozone members The sample is extended by adding 19 smaller European banks
B Sample Presentation Bank Details Descriptive Statistics Tables 2a and b presents the 77 banks in the sample in the worldrsquos top 150 as they ordered by assets (Q4 2016) Table A3 presents the share of assets that each home-country holds in the sample as well as the share of assets per developed and emerging countries while Table A4 presents the share of assets per region Table A5 presents the 14 European banks that are added to the initial sample
Table 2a Banks ordered by Total Assets (in US $ billion)
Rank Bank Name Country Total assets
38
US$B
1 Bank of China China 2613 2 Mitsubishi UFJ Financial Group Japan 2597 3 JPMorgan Chase amp Co USA 2490 4 HSBC Holdings UK 2374 5 BNP Paribas France 2196
6 Bank of America USA 2187 7 Wells Fargo USA 1930 8 China Development Bank China 1904 9 Credit Agricole Group France 1821 10 Citigroup USA 1792
11 Mizuho Financial Group Japan 1757 12 Deutsche Bank Germany 1682 13 Sumitomo Mitsui Financial Group Japan 1654 14 Barclays PLC UK 1490 15 Societe Generale France 1461
16 Banco Santander Spain 1416 17 Lloyds Banking Group UK 1004 18 Norinchukin Bank Japan 984 19 Royal Bank of Scotland Group UK 981 20 UBS Group AG Switzerland 919
21 Unicredit SpA Italy 908 22 ING Groep NV Netherlands 893 23 Goldman Sachs Group USA 860 24 Morgan Stanley USA 814 25 Credit Suisse Group Switzerland 806
Table 2a ndash Continued from previous page
26 BBVA Spain 773 27 Intesa Sanpaolo Italy 766 28 Commonwealth Bank of Australia Australia 703 29 Rabobank Group Netherlands 700 30 Australia amp New Zealand Banking Group Australia 661
31 Nordea Sweden 651 32 Standard Chartered Plc UK 646 33 Westpac Banking Corp Australia 607 34 National Australia Bank Australia 562 35 Commerzbank Germany 549
36 Danske Denmark 495 37 State bank of India India 492 38 US Bancorp USA 445 39 The Export-Import Bank of China China 427 40 Sberbank of Russia Russia 420
41 Resona Japan 412 42 Sumitomo Mitsui TH Japan 406 43 Nomura Holdings Japan 370 44 PNC Financial Services USA 366 45 Capital One Financial Corporation USA 357
46 DBS Group Holdings Singapore 332 47 Shinhan Financial Group South Korea 328 48 KBC Group NV Belgium 291 49 Svenska Handelsbanken Sweden 289 50 Skandinaviska Enskilda Banken Sweden 289
51 Hana Financial Group South Korea 288 52 Nationwide Building Society UK 276 53 Korea Development Bank South Korea 268
39
54 Woori Bank South Korea 257 55 Landesbank Baden-Wurttemberg Germany 257
56 Cathay Financial Holding Taiwan 252 57 Swedbank Sweden 237 58 United Overseas Bank (UOB) Singapore 235 59 Dexia Belgium 225 60 Banco Sabadell Spain 224
61 Bayerische Landesbank Germany 224 62 Erste Group Bank AG Austria 220 63 Banco Popular Espanol Spain 204 64 Industrial Bank of Korea South Korea 196 65 Bank of Ireland Ireland 182
66 Malayan Malaysia 161 67 Standard Bank Group South Africa 161 68 Banca Monte dei Paschi di Siena Italy 161 69 American Express USA 158 70 National Bank of Greece Greece 153 71 Macquarie USA 143
72 Credit Lyonnais France 120 73 Comercial Portuguese Portuguese 113 74 Banco Espirito Santo Portugal 112 75 Turkiye is bankasi Turkey 112 76 Mediobanca Italy 95
77 Landesbank Hessen Germany 92
Table 2b Banks ordered by Country
Rank Bank Country Total assets
US$B
1 Commonwealth Bank of Australia Australia 703 2 Australia amp New Zealand Banking Group Australia 661 3 Westpac Banking Corp Australia 607 4 National Australia Bank Australia 562
5 Erste Group Bank AG Austria 220
6 KBC Group NV Belgium 291 7 Dexia Belgium 225
8 Bank of China China 2613 9 China Development Bank China 1904
10 The Export-Import Bank of China China 427
11 Danske Denmark 495
12 BNP Paribas France 2196 13 Credit Agricole Group France 1821 14 Societe Generale France 1461 15 Credit Lyonnais France 120
16 Deutsche Bank Germany 1682 17 Commerzbank Germany 549 18 Landesbank Baden-Wurttemberg Germany 257 19 Bayerische Landesbank Germany 224 20 Landesbank Hessen Germany 92
21 National Bank of Greece Greece 153
22 State bank of India India 492
23 Bank of Ireland Ireland 182
24 Unicredit SpA Italy 908 25 Intesa Sanpaolo Italy 766
40
26 Banca Monte dei Paschi di Siena Italy 161 27 Mediobanca Italy 95
28 Mitsubishi UFJ Financial Group Japan 2597 29 Mizuho Financial Group Japan 1757 30 Sumitomo Mitsui Financial Group Japan 1654 31 Norinchukin Bank Japan 984 32 Resona Japan 412 33 Sumitomo Mitsui TH Japan 406 34 Nomura Holdings Japan 370 35 Yamaguchi Financial Group Japan 93
36 ING Groep NV Netherlands 893 37 Rabobank Group Netherlands 700
38 Banco Espirito Santo Portugal 111
39 Sberbank of Russia Russia 420
40 DBS Group Holdings Singapore 332 41 United Overseas Bank (UOB) Singapore 235 42 Standard Bank Group South Africa 161
43 Shinhan Financial Group South Korea 328 44 Hana Financial Group South Korea 288 45 Korea Development Bank South Korea 268 46 Woori Bank South Korea 257 47 Industrial Bank of Korea South Korea 196
48 Banco Santander Spain 1416 49 BBVA Spain 773 50 Banco Sabadell Spain 224 51 Banco Popular Espanol Spain 204
Table 2b ndash Continued from previous page
53 Nordea Sweden 651 54 Svenska Handelsbanken Sweden 289 55 Skandinaviska Enskilda Banken Sweden 289 56 Swedbank Sweden 237
57 UBS Group AG Switzerland 919 58 Credit Suisse Group Switzerland 806
59 Cathay Financial Holding Taiwan 252
60 Turkiye is bankasi Turkey 112
61 HSBC Holdings UK 2374 62 Barclays PLC UK 1490 63 Lloyds Banking Group UK 1004 64 Royal Bank of Scotland Group UK 981 65 Standard Chartered Plc UK 646 66 Nationwide Building Society UK 276
68 JPMorgan Chase amp Co USA 2490 69 Bank of America USA 2187 70 Wells Fargo USA 1930 71 Citigroup USA 1792 72 Goldman Sachs Group USA 860 73 Morgan Stanley USA 814 74 US Bancorp USA 445 75 PNC Financial Services USA 366 76 Capital One Financial Corporation USA 357 77 American Express USA 158 78 Macquarie USA 143
41
Table 3a Banksrsquo home-countries ordered by the sum of total bank assets
Developed Total Assets Developing Total Assets USA 11547 China 4944 Japan 7867 India 492 UK 6936 Russia 420 France 5599 Taiwan 252 Germany 2994 South Africa 161 Spain 2617 Turkey 112
Australia 2534 Italy 1933 Switzerland 1725
Netherlands 1584 Sweden 1467 South Korea 1340 Singapore 568 Belgium 516 Denmark 495 Ireland 344 Austria 220 Greece 153 Portugal 111 Total Assets of banks that are headquartered in
Developed 5055366 Emerging 63823 of total assets 888 of total assets 112
42
Table 3b Regional details
Region Number of Banks Total bank
assets of total
assets
Europe 40 2669673 473
Asia 21 1557658 275
N America 11 1154724 204
Oceania 4 2534 45
Africa 1 161 03
B Data Definitions and Descriptive Statistics
Table 4 Data Definitions
Variable Description
Endogenous CDS CDS 5-year spread
Exogenous Systemic risk
CDX The family of CDS indeces covering North America
VIX The volatiliy index of SampP 500
US 3-month T Bill The short-term obligation backed by the Treasury Dept of the US goverment
Bank-specific Size Total assets
Retail orientation Total Loans Total assets
Diversification Non-interest income Total revenues
NPLs Non-performing loans Total Loans
Country-specific
GDP Each bankrsquos home-country GDP growth
Budget Balance Current AccountGDP
Public Debt Public DebtGDP
43
Table 5 Descriptive Statistics
Panel A Systemic risk factor
CDX VIX TED
Mean 269E-06 -0000123 -000121 Median 0000 -0001 0000 Maximum 0020 0176 0250 Minimum -0009 -0152 -0750
Std Dev 0001 0031 0033 Skewness 4689 0689 -17326
Kurtosis 106047 6789 377496 Jarque-Bera 1105896 1679364 14610377 Probability 0000 0000 0000
Sum 0007 -0304 -3000 Sum Sq Dev 0003 2427 2746
Note CDX and VIX are in log differences TED spread is in first differences
Panel B Bank specific
Assets Loans_to_Assets Non_Interest_Inc NPLs
Mean 732382 55596 2442 4601
Median 458009 59921 2378 2411
Maximum 3030645 8664 8640 35217
44
Minimum 4354387 9070 -5962 01082
Std Dev 7460013 17017 1481 5612
Skewness 1081 -0641 -0694 2376
Kurtosis 30129 2584 6193 9630
Jarque-Bera 7023 272888 182117 999501
Probability 0000 0000 0000 0000
Sum 264E+09 2003702 8803746 1658430 Sum Sq Dev 201E+15 1043392 7908036 1134867
Note Data are in levels
Part C ndash Global Sample
Table 7 Individual systemic importance
Panel A ndash Ranked by total score Rank by score
Rank by bank assets Bank Name
Home-Country Region
Assets (billion
US $) Score
To others (Aggr)
From others (Aggr)
1 27 Intesa Sanpaolo Italy Europe 766 1056 0505 0551
2 16 Banco Santander Spain Europe 1416 1038 0464 0574
3 26 BBVA Spain Europe 773 0987 0454 0533
4 5 BNP Paribas France Europe 2196 0982 0445 0537
5 21 Unicredit SpA Italy Europe 908 0975 0489 0485
6 14 Barclays PLC UK Europe 1490 0961 0454 0507
7 12 Deutsche Bank Germany Europe 1682 0954 0428 0526
8 9 Credit Agricole Group France Europe 1821 0942 0424 0518
9 15 Societe Generale France Europe 1461 0940 0427 0512
10 72 Credit Lyonnais France Europe 120 0938 0445 0493
11 17 Lloyds Banking Group UK Europe 1004 0925 0438 0487
12 25 Credit Suisse Group Switz Europe 806 0907 0376 0531
13 35 Commerzbank Germany Europe 549 0904 0410 0494
14 20 UBS Group AG Switz Europe 919 0890 0387 0503
15 32 Standard Chartered Plc UK Europe 646 0870 0419 0451
16 68 Banca Monte dei Paschi Italy Europe 161 0861 0429 0433
45
17 19
Royal Bank of Scotland Group
UK Europe 981 0845 0423 0423
18 29 Rabobank Group Netherl Europe 700 0841 0376 0465
19 22 ING Groep NV Netherl Europe 893 0823 0374 0449
20 76 Mediobanca Italy Europe 95 0821 0389 0433
21 24 Morgan Stanley USA N Amer 814 0752 0315 0437
22 69 American Express USA N Amer 158 0736 0332 0404
23 6 Bank of America USA N Amer 2187 0716 0318 0398
24 23 Goldman Sachs Group USA N Amer 860 0711 0302 0410
25 10 Citigroup USA N Amer 1792 0706 0313 0393
26 4 HSBC Holdings UK Europe 2374 0695 0372 0323
27 62 Erste Group Bank AG Austria Europe 220 0688 0314 0375
28 49 Svenska Handelsbanken Sweden Europe 289 0678 0281 0397
29 53
Korea Development Bank
S Korea Asia 268 0677 0393 0284
30 60 Banco Sabadell Spain Europe 224 0670 0295 0375
31 36 Danske Denmark Europe 495 0663 0296 0367
32 45
Capital One Financial Corp
USA N Amer 357 0662 0260 0401
33 3 JPMorgan Chase amp Co USA N Amer 2490 0658 0257 0401
34 7 Wells Fargo USA N Amer 1930 0653 0259 0394
35 34 National Australia Bank Australia Oceania 562 0622 0376 0247
Table continued on next page
Table 3- Panel A continued from previous page
36 2 Mitsubishi UFJ Financial Japan Asia 2597 0621 0223 0398
37 47 Shinhan Financial Group S Korea Asia 328 0615 0331 0283
38 54 Woori Bank S Korea Asia 257 0612 0333 0278
39 64 Industrial Bank of Korea S Korea Asia 196 0603 0341 0261
40 28 Commonwealth Bank Australia Oceania 703 0599 0388 0211
41 40 Sberbank of Russia Russia Europe 420 0598 0294 0305
42 30 Australia amp N Zealand Australia Oceania 661 0597 0383 0214
43 50 Skandinaviska Enskilda Sweden Europe 289 0578 0262 0316
44 31 Nordea Sweden Europe 651 0574 0289 0285
45 71 Macquarie USA N Amer 143 0572 0321 0251
46 48 KBC Group NV Belgium Europe 291 0568 0241 0327
47 63 Banco Popular Espanol Spain Europe 204 0558 0297 0261
48 61 Bayerische Landesbank Germany Europe 224 0552 0249 0303
49 39 The Export-Import Bank China Asia 427 0548 0284 0264
50 1 Bank of China China Asia 2613 0548 0276 0272
51 66 Malayan Malaysia Asia 171 0543 0321 0223
52 33 Westpac Banking Corp Australia Oceania 606 0540 0374 0166
53 37 State bank of India India Asia 492 0530 0238 0291
54 51 Hana Financial Group S Korea Asia 288 0518 0290 0227
55 57 Swedbank Sweden Europe 237 0486 0253 0233
56 8 China Development Bank China Asia 1904 0468 0260 0208
46
57 52 Nationwide Building Society UK Europe 276 0463 0217 0246
58 59 Dexia Belgium Europe 225 0409 0197 0212
59 46 DBS Group Holdings Singapore Asia 332 0397 0212 0186
60 65 Bank of Ireland Ireland Europe 182 0379 0197 0182
61 58 United Overseas Bank Singapore Asia 235 0373 0214 0159
62 11 Mizuho Financial Group Japan Asia 1757 0367 0271 0096
63 67 Standard Bank Group S Africa Africa 161 0365 0123 0242
64 74 Espirito Santos Portugal Europe 112 0362 0186 0176
65 41 Resona Japan Asia 412 0357 0263 0094
66 13 Sumitomo Mitsui Financial Japan Asia 1654 0355 0250 0104
67 38 US Bancorp USA N Amer 445 0353 0188 0165
68 55 Landesbank Baden-Wurtt Germany Europe 257 0340 0170 0171
69 42 Sumitomo Mitsui TH Japan Asia 406 0323 0273 0050
70 56 Cathay Financial Holding Taiwan Asia 252 0298 0189 0109
71 73 Comercial Portuguese Portugal Europe 113 0279 0268 0011
72 70 National Bank of Greece Greece Europe 153 0220 0176 0044
73 18 Norinchukin Bank Japan Asia 984 0215 0164 0050
74 43 Nomura Holdings Japan Asia 370 0197 0161 0035
75 77 Landesbank Hessen Germany Europe 92 0159 0089 0071
76 44 PNC Financial Services USA N Amer 366 0078 0034 0043
77 75 Turkiye is bankasi Turkey Europe 112 0037 0030 0007
Note Results concern the period January 2008 ndash June 2017 and are of daily frequency
Table 9 Systemic contribution per bank (January 2008 ndash June 2017)
Rank Bank Name SC Rank Bank Name SC Rank Bank Name SC Rank Bank Name SC
1 Intesa Sanpaolo
225 21 Morgan Stanley 160 41 Sberbank of Russia
128 61 United Overseas
080
2 Banco Santander
221 22 American Express
157 42 Australia amp N Zealand
127 62 Mizuho Financial
078
3 BBVA 210 23 Bank of America
153 43 Skandinaviska Enskilda
123 63 Standard Bank Group
078
4 BNP Paribas 209 24 Goldman Sachs Group
152 44 Nordea 122 64 Espirito Santos
077
5 Unicredit SpA
208 25 Citigroup 151 45 Macquarie 122 65 Resona 076
6 Barclays PLC 205 26 HSBC Holdings 148 46 KBC Group NV
121 66 Sumitomo Mitsui
076
7 Deutsche Bank
203 27 Erste Group 147 47 Banco Popular
119 67 US Bancorp
075
8 Credit Agricole
201 28 Svenska 145 48 Bayerische Landesbank
118 68 Landesbank 072
9 Societe Generale
200 29 Korea Development Bank
144 49 The Export-Import
117 69 Sumitomo Mitsui TH
069
10 Credit Lyonnais
200 30 Banco Sabadell 143 50 Bank of China 117 70 Cathay Financial
064
11 Lloyds Banking
197 31 Danske 141 51 Malayan 116 71 Comercial Portuguese
059
47
12 Credit Suisse Group
193 32 Capital One Financial Corp
141 52 Westpac Banking Corp
115 72 NBG 047
13 Commerzbank 193 33 JPMorgan Chase amp Co
140 53 State bank of India
113 73 Norinchukin Bank
046
14 UBS Group AG 190 34 Wells Fargo 139 54 Hana Financial Group
110 74 Nomura Holdings
042
15 Standard Chartered
186 35 National Australia Bank
133 55 Swedbank 104 75 Landesbank Hessen
034
16 Banca Monte dei
184 36 Mitsubishi UFJ Financial
132 56 China Development
100 76 PNC Financial Services
017
17 RBS 180 37 Shinhan Financial Group
131 57 Nationwide Building
099 77 Turkiye is bankasi
008
18 Rabobank Group
179 38 Woori Bank 130 58 Dexia 087
19 ING Groep NV 175 39 Industrial Bank of Korea
129 59 DBS Group Holdings
085
20 Mediobanca 175 40 Commonwealth Bank
128 60 Bank of Ireland
081
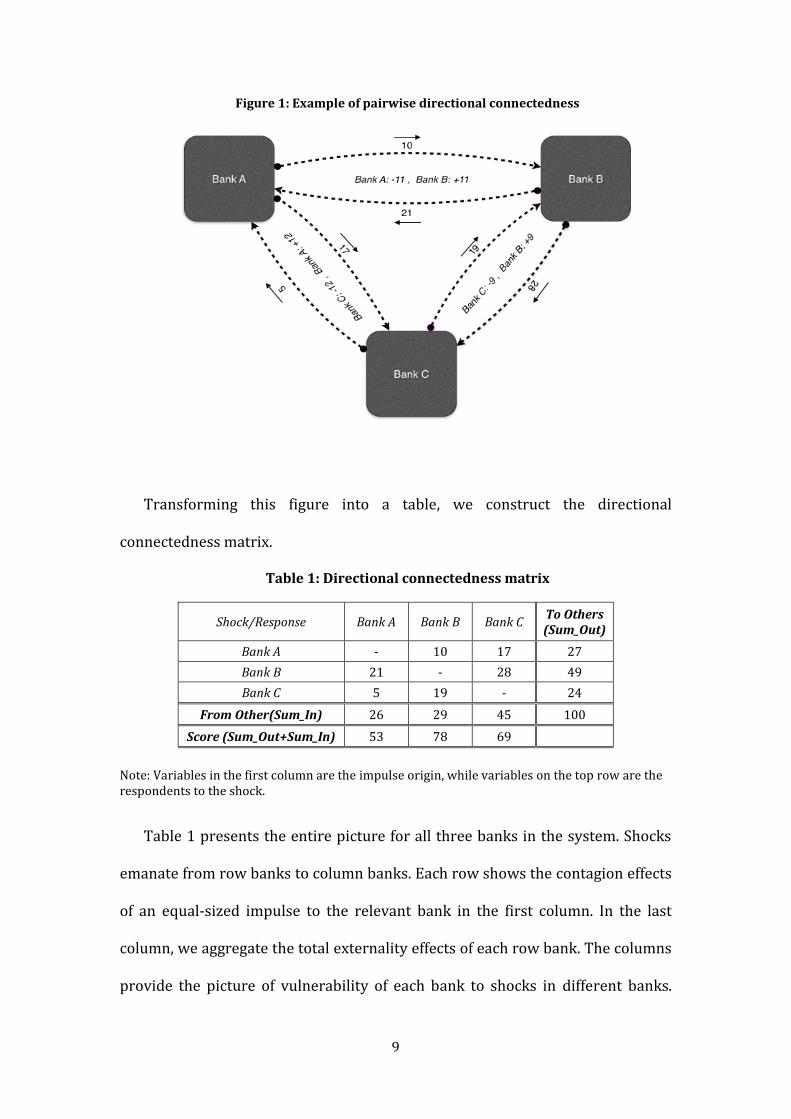
9
Figure 1 Example of pairwise directional connectedness
Transforming this figure into a table we construct the directional
connectedness matrix
Table 1 Directional connectedness matrix
ShockResponse Bank A Bank B Bank C To Others (Sum_Out)
Bank A - 10 17 27
Bank B 21 - 28 49
Bank C 5 19 - 24
From Other(Sum_In) 26 29 45 100
Score (Sum_Out+Sum_In) 53 78 69
Note Variables in the first column are the impulse origin while variables on the top row are the respondents to the shock
Table 1 presents the entire picture for all three banks in the system Shocks
emanate from row banks to column banks Each row shows the contagion effects
of an equal-sized impulse to the relevant bank in the first column In the last
column we aggregate the total externality effects of each row bank The columns
provide the picture of vulnerability of each bank to shocks in different banks
10
The second to last row is a measure of total vulnerability of a bank to all other
banks in the system It contains the answer to the question ldquoIf all other banks in
the system experienced an idiosyncratic shock of 100 basis points what would
be the impact on bank Xrdquo In the bottom row we aggregate the total externality
effect and the total vulnerability effect of each bank In other words we lump
together shocks sent and received by an individual bank as a measure of total
individual bank connectedness In calculating a bankrsquos systemic importance we
assign equal weights to shocks it sends as to shocks it receives as we are
agnostic as to whether one source of systemic instability is more dangerous than
the other
There are two aspects of financial contagion due to a bankrsquos participation in a
banking system that are of relevance to regulators externalities emanating from
a bankrsquos failure and individual bank vulnerability to financial contagion Both
components are important for regulators but their importance may not be equal
If they are of equal importance then the regulator would consider the sum of
these two However the clear decomposition in Table 1 as well as in our
econometric method allows the regulator to assign different weights in order to
capture the appropriate measure of systemic importance
4 Data and Methodology
41 Data
We study 77 banks from 19 developed and 7 emerging economies Our
selection procedure is as follows We started with the list of the worldrsquos top 150
banks in terms of total assets in Q42016 Using bank names we matched 77
banks to CDS prices from Thomson-Reuters Datastream and Bloomberg CDS
11
spreads cover the period from January 2008 to June 2017 and are at daily
frequency The sample contains all the banks that are designated as ldquoglobal
systemically important banksrdquo (ldquoGSIBrsquosrdquo) by the Basel Committee on Banking
Supervision except for three Chinese banks (Agricultural Bank of China Bank of
China and Industrial and Commercial Bank of China) and one French bank
(Group BPCE) Table 2a (in the Appendix) classifies banks by assets and provides
detail on the 77 banks in the sample such as home-country and total assets
while table 2b (in the Appendix) classifies banks by home-country We note that
40 out of the 77 banks (52) in the sample are from Europe while 28 of them
(34) are headquartered in Eurozone members Tables 3a and 3b (in the
Appendix) provide the regional characteristics of the sample
411 Systemic Risk factor
We will allow for the presence of a global systemic risk factor This permits
us to interpret robustly the results obtained from our model Longstaff et al
(2011) for instance has argued that credit risk appears related to global rather
than country-specific factors while Aizenman et al (2013) has established the
importance of international economic factors in the pricing of credit risk The
variables we chose to employ in order to capture global financial risk conditions
have been widely used in related studies as control variables (see among others
De Santis 2012 Aizenman et al 2013 Ang and Longstaff 2011) The global
default risk conditions are represented by the CDX which is the family of CDS
indices covering North America the VIX volatility index which captures the
global capital marketsrsquo ldquofearrdquo condition and the global liquidity conditions which
is represented by the US 3-month treasury bills The systemic factor is assumed
12
to affect the endogenous variables contemporaneously Table 4 contains the
variable definitions and Table 5 provides descriptive statistics
412 Bank-specific characteristics
A variety of bank- and country-specific variables are used for identifying the
determinants of systemic risk fluctuation over time The first bank-specific
variable is bank size expressed as each bankrsquos total assets (in log) According to
BIS (2011a) the larger a bank is the more likely it is to receive a bailout package
In this sense we also take into consideration the ldquotoo-big-to-failrdquo (TBTF) issue
(Acharya et al 2013) The second bank-specific variable is the loan-to-asset
ratio which provides information on the bankrsquos retail orientation Ayadi et al
(2011) and Koumlhler (2013) suggest that retail-orientated banks appeared to be
less risky than other banks during the recent financial crisis Also according to
Altunbas et al (2011) the non-interest income over total revenue is considered
to be a measure of each bankrsquos diversification since the less a bank relies on
interest income the less exposed the bank is to a negative shock Finally we
include each bankrsquos nonperforming loans over total loans (see Tables 4 and 5)
413 Country-specific characteristics
It is important to include country-specific factors since the impact of
macroprudential policy might differ depending on the underlying economic
conditions of each bankrsquos home country For example the impact of shocks may
be larger for economies that were under stress and hence rely more on rescue
packages and foreign financing (IMF 2015a) These economies would not have
the same ability to support effectively their banking systems in times of distress
13
We investigate the role of sovereigns by searching among each bankrsquos home-
country GDP growth the primary surplus over GDP and public debt over GDP
42 Connectedness matrix
We estimate a VARX model with two lags (p=2) for the endogenous variables
and contemporaneous exogenous variables (q=0)
The vector of endogenous variables (y) consists of log differences of daily CDS
spreads for the 77 banks By including the exogenous variables we account for
common factors that affect at the same time all bank CDS spreads (Bekaert et al
2005)
421 Bayesian VAR
The suggested model has many more parameters than observations overfits
the data in-sample and as a consequence could perform poorly Researchers
working in the relevant literature typically use prior shrinkage on the
parameters to overcome such over-parametrization concerns Most flexible
Bayesian priors that result in shrinkage of high-dimensional parameter spaces
rely on computationally intensive Markov Chain Monte Carlo (MCMC) methods
Their application to recursive forecasting exercises can as a consequence be
prohibitive or even infeasible The only exception is a variant of the Minnesota
prior that is based on the natural conjugate prior an idea that has recently been
exploited by Banbura Giannone and Reichlin (2010) and Giannone Lenza and
Primiceri (2012) among others While this prior allows for an analytical formula
ttttt uXBYAYAaY 122110
14
for the posterior there is a cost in terms of flexibility in that a priori all VAR
equations are treated in the same manner see Koop and Korobilis (2010) for a
further discussion of this aspect of the natural conjugate prior
The traditional ldquoMinnesota priorrdquo an empirical-Bayes prior which is due to
Littermann (1979) and co-authors (see eg Doan Litterman and Sims 1984)
still dominates many applications of VAR models in economics The recent
contribution of Giannone Lenza and Primiceri (2012) provides guidance on
selecting the prior hyperparameter controlling shrinkage of the VAR coefficients
Note that computational simplicity is a priority in this paper so that the
Gibbs sampler is preferred compared to other potentially more powerful and
elegant Markov Chain Monte Carlo (MCMC) and Sequential Monte Carlo (SMC)
algorithms for prior selection However we recognize that the flexibility of
choosing the prior freely is one of the main controversial issues associated with
Bayesian analysis and the reason why some researchers view the latter as
subjective It is also the reason why the Bayesian practice especially in the early
days was dominated by non-informative priors as these priors assign equal
probabilities to all possible states of the parameter space with the aim of
rectifying the subjectivity problem We estimate the coefficients of a VAR(2) for
78 banks using the arithmetic returns of each bankrsquos CDS As we explained
above a key concern of users of Bayesian statistics and criticism by critics is the
dependence of the posterior distribution on onersquos prior and for this reason we
specify hyperparameters for the prior
The Bayesian VAR(p) model can be written as
119910119905 = 1198860 + sum 119860119895119910119905minus119895 + 120576119905
119901
119895=1
15
where yt for t = 1 T is an M x 1 vector containing observations on M time series
variables εt is an M x 1 vector of errors α0 is an M x 1 vector of intercepts and Aj
is an M x M matrix of coefficients We assume εt to be iid N (0 Σ) Exogenous
variables are added to the VAR and included in all the derivations below but we
do not do so to keep the notation as simple as possible
422 The connectedness matrix framework
The construction of the diagnostic tool is based on a medium-size Bayesian
vector autoregressive model with exogenous variables (Bayesian VARX) that
accounts for common global and regional trends and is able to include even
bank-specific characteristics Then similar as the framework described by
Diebold and Yilmaz (2009 2012) and the one described by Alter and Beyer
(2013) we construct the spillover matrix in order to capture any potential
spillovers among banks This methodology relies on Generalized Forecast Error
Variance Decomposition (GFEVD) or on Generalized Impulse Response
Functions (GIRF) obtained as shown in Pesaran and Shin (1998) Therefore we
derive Generalized Impulse Response Functions as functions of residuals
together with the interdependent coefficients According to Alter and Beyer
(2012) it is of low importance which methodology we select since they produce
qualitatively similar results
16
Table 6 Contagionconnectedness matrix
Note Variables in the first column are the impulse origin while variables on the top row are the respondents to the shock The cumulative impact is bound between 0 and 1 A value of 05 means that the response variable would be impacted in the same direction with an intensity of 50 the initial unexpected shock in the impulse variable The last column presents the aggregated impact sent (Sum OUT) by each row variable and on the bottom row the aggregated spillover received (Sum IN) by each column variable The bottom-right cell shows total spillover in the system and by dividing this value to the total number of non-diagonal cells we obtain the connectedness index (CI)
In table 2 row variables are the origin of the unexpected shock Column
variables are the respondents of contagion receivers CI represents the
connectedness index calculated as the average response in the contagion matrix
The potential contagion effects are aggregated on each line and column and
represent the total to_others and the total from_others as potential contributions
to contagion from and to each bank The main diagonal values represent the
effect of a variablersquos shock on itself and they are excluded from any calculations
The possible contagion effects answer the question ldquoHow would bank B evolve in
the following period if bank A CDS increases by one unit shockrdquo
We use accumulated Impulse Response functions over a 10-step horizon (10-
days) Not all the banks respond to the shocks within the same period but the
majority of the shocks are absorbed within 10-days Nevertheless the
framework is flexible and it easily adapts to the needs of each study
5 Empirical results
17
51 Individual bank connectedness
We estimate the connectedness matrix as described in section 422 for the
whole sample period 1 January 2008 to 31 June 2017 and estimate the
individual bank connectedness (table 7) which reports several notable results
The evidence do not offer support to the argument that systemic importance of a
bank can be adequately captured by its size According to table 7 the bank that
creates the most systemic risk in the system is Intesa Sanpaolo a medium-sized
European bank that is ranked 27th in terms of total assets with total contagion
effects of 1056 which is further decomposed into 0505 vulnerability-score and
0551 externalities-score For instance the Intesa Sanpaolorsquos 0551 externalities
score implies that one-unit shock in Intesa Sanpaolo will have an impact of
551 to the system while the 0505 vulnerability score means that one-unit
shock to the market will affect Intesa Sanpaolo by 505 Among the top-20
most connected banks can also be found smaller banks like BBVA (3rd) Credit
Lyonnais (10th) Banca Monte dei Paschi (16th) and Mediobanca (20th) while the
largest bank in the sample is listed 50th in terms of systemic importance
The existing literature on the topic suggests that during crises periods large
banks behave differently than small or medium-sized banks (Laeven et al 2014)
This phenomenon could be partially attributed to some common characteristics
that are shared by large banks and are associated with higher levels of risk
namely the increased portion of market-based activities the reduced capital
adequacy the less stable funding and the higher organizational complexity
However it remains unidentified the bank-size threshold above or below which
these criteria are valid Results presented in table 8 provide a more narrow
response to the question whether systemic importance is related to size or not
18
Size per se is a determinant of systemic importance since when banks are
ranked by systemic importance the first quartile compiles the largest percentage
of total assets (34 of total assets) However when the sample is ranked by total
assets and not in terms of connectedness the first quartile represents 62 of
total assets indicating a severe leakage of assets to the other quartiles and
revealing the existence of structural variables that interact with size
The existing frameworks used by regulators and policy makers such as the
BCBSFSB framework rely heavily on size either through size-related indicators
or size per se to calculate the capital adequacy ratios Our results suggest that
the measures taking strong size-effect as granted should also focus on the large
banksrsquo idiosyncratic characteristics that place 50 of G-SIBs in the first quartile
of systemic importance
Table 8 Banks ranked by systemic importance and by assets ndash Number of banks per quartile
Quartile ranked by Number of G-SIBs per quartile
Score Assets
1st Quartile 34 62 48
2nd Quartile 33 224 28
3rd Quartile 18 105 10
4th Quartile 14 51 14
The next step is to calculate the systemic contribution of each bank in the
system as the ratio between the total individual contagion effects and the total
contagion in the system
100TC
TICTSC i
i
y
y
19
TSC is the total systemic contribution TIC is the total individual contagion
effects and TC is the total contagion in the system The bank with the highest
ranking contributes 225 of the total contagion effects while the bank at the
bottom of the table contributes almost 0 (table 9) This measure allows us to
compare the results among samples with different number of entities
We define each bankrsquos directional connectedness as the ratio between the
individual externalities and the total individual contagion
100
i
i
i
y
yOUT
yOUTTIC
IEID or
100
i
i
i
y
yIN
yINTIC
IVID
ID is the individual directionality IE is the individual externalities IV is the
individual vulnerabilities and TIC is total individual contagion The followings
should be always valid
1 ii yINyOUT IDID
ii yINyOUT IDID
In case iyOUTID is larger than 50 it means than the bank that the systemic score
of the bank it refers to is externalities-driven When breaking the results into
quartiles that represent the average individual directionality for all the banks
that belong in this quartile (table 10) we realize that banks with higher TIC tend
to have higher iyOUTID ratios (54) that their peers that belong in the last
quartile (30) We do not suggest that the directionality of contagion
determines the systemic importance of banks because this is beyond control and
difficult to interpret but that in terms of systemic importance that may be
20
interpreted into increased capital requirements is ldquobetter to receive shocks than
to send shocks to the systemrdquo
Table 10 Average Individual Directionality (OUT) per quartile
iyOUTID
1st Quartile 54
2nd Quartile 53
3rd Quartile 47
4th Quartile 30
Note banks are ranked by systemic importance
52 Regional network connectedness
Prior quantifying the transmission of contagion effects we focus on table 7
that reveals a very strong regional effect This is that the first quartile of systemic
importance is exclusively dominated by banks that are headquartered in Europe
implying the existence of a regional component and severe clustering Table 11a
shows the regional concentration per quartile and table 11b expresses the
regional concentration as a percentage of the total number of banks that exist
per region
Table 11a Concentration of banks per region
Quartile Europe Eurozone (as
of EU) N America Asia Oceania Africa
1st Quartile 100 75 - - - -
2nd Quartile 25 25 40 25 10 -
3rd Quartile 50 50 10 30 10 -
4th Quartile 35 75 12 48 - 5
Table 11b Regional concentration as a percentage of total banks per region
21
Quartile Europe N America Asia Oceania Africa
1st Quartile 47 - - - -
2nd Quartile 12 73 25 25 -
3rd Quartile 21 9 35 75 -
4th Quartile 16 18 40 - 100
The next step is to understand the flows of shocks among the different
regions the contagion effects and the degree of connectedness among the
different regions (Table 12a and b) We focus on four regions Europe North
America (expressed by US banks) Asia and Oceania Table 12a shows regionrsquos A
externalities to the other regions as a percentage of regionrsquos A total externalities
while table 12b focuses on the vulnerabilities side Combining the information
obtained by tables 12a and b European and US appear to be strongly
interconnected More precisely 58 of the aggregate shocks that are sent by US
banks are directed to Europe while 64 of the aggregate shocks received by US
banks are generated in Europe Also another important finding is that 69 of
the aggregate shocks that are sent by European banks remain within Europe
Table 12a Shocks sent per region as of total shocks sent per region
Asia Europe NAmerica Oceania
Sum
Asia 41 41 9 9
100
Europe 16 69 960 540
100
NAmerica 1950 58 16 650
100
Oceania 33 4450 950 12
100
22
Table 12b Shocks received per region as of total shocks received per region
Asia Europe NAmerica Oceania
Asia
28 10 13 21
Europe
54 75 64 59
NAmerica
12 12 20 13
Oceania
6 3 3 7
Sum
100 100 100 100
All in all it is obvious that there exists a regional factor that affects
significantly the bank connectedness However it is interesting to find out the
driving forces of this regional component especially in the case of Europe which
has been a special case due to the different transmission channels of the financial
crisis the highly interconnected banking system the feedback loops among
sovereigns and banks and the contagion from one country to the rest of Europe
53 National banking system connectedness
We approach the national banking system first of all by calculating the
average systemic risk per bank for each one of the countries in the sample
(Figure 2) Four out of the first five banks that contributed the most to the global
systemic risk belong to Eurozone French banks contributed the most to
systemic risk while Italy and Spain both of which suffered from banking
systems in distress followed at close range Banks in non-Euro-area countries
like Swiss and UK banks played an important role as well Surprisingly the
average contagion effects for German banks place them almost in the middle of
the table indicating that German banking system may acted as a stability factor
for the European region Both Portuguese and especially Greek banking system
appeared to be isolated from the global banking system
23
Figure 2 Average systemic risk per bank ndash Own shocks are excluded
Note results concern the period January 2008-June 2017
In figure 3 we approach the total contagion from a different perspective by
presenting the total contagion effects for each sovereign This approach may
depends on the number of banks per sovereign but illustrates that US-European
cluster dominates in terms of systemic importance
Figure 3 National systemic risk ndash Own shocks are excluded
Note results concern the period January 2008-June 2017
53 Rolling window
000
010
020
030
040
050
060
070
080
090
100
Fra
nce
Ital
y
Swit
z
Net
her
l
Spai
n
UK
Au
stri
a
Den
mar
k
S K
ore
a
USA
Ru
ssia
Au
stra
lia
Ger
man
y
Swed
en
Mal
aysi
a
Ind
ia
Ch
ina
Bel
giu
m
Sin
gap
ore
Irel
and
S A
fric
a
Jap
an
Po
rtu
gal
Tai
wan
Gre
ece
Tu
rkey
000
100
200
300
400
500
600
700
USA U
K
Fra
nce
Ital
y
Spai
n
S K
ore
a
Ger
man
y
Jap
an
Au
stra
lia
Swed
en
Swit
z
Net
her
l
Ch
ina
Bel
giu
m
Sin
gap
ore
Au
stri
a
Den
mar
k
Po
rtu
gal
Ru
ssia
Mal
aysi
a
Ind
ia
Irel
and
S A
fric
a
Tai
wan
Gre
ece
Tu
rkey
24
531 Individual Banks
In order to better understand the evolvement of systemic risk and how this
fluctuated over the whole period we use rolling-window analysis where the
length of the window is 340 days and the step is 150 days Figure 3 presents the
evolution of total contagion over time where strong co-movement and
interconnections among banks are obvious We also discriminate periods where
the cluster of TCI lines is shrinking and systemic risk is becoming more unified
which means that systemic and idiosyncratic shocks are propagated more
intensely via the network
Figure 3 Total Individual Contagion
Note The length of the window is 340 days and the step is 150 days
We introduce the range as a new metric of systemic risk unification Range at
each point in time is defined as the difference between the highest and the
lowest score in the system (Figure 4) The lowest the score the more unified the
000
020
040
060
080
100
120
Jan
-08
May
-08
Sep
-08
Jan
-09
May
-09
Sep
-09
Jan
-10
May
-10
Sep
-10
Jan
-11
May
-11
Sep
-11
Jan
-12
May
-12
Sep
-12
Jan
-13
May
-13
Sep
-13
Jan
-14
May
-14
Sep
-14
Jan
-15
May
-15
Sep
-15
Jan
-16
May
-16
Sep
-16
Jan
-17
May
-17
25
systemic risk is becoming Given the predictive power of CDS spreads this new
measure could be used by regulators and policymakers as an early-warning tool
However it remains an open question what is the threshold below which the
unification of systemic risk could consist a problem It is remarkable that the
most ldquolooserdquo links were observed during the post-Lehman collapse in late 2008
and reached its lowest price at the beginning of Greek crisis
Figure 4 Systemic risk range
Note The length of the window is 340 days and the step is 150 days
532 Global banking system
In this part we are interested in understanding the behavior of aggregate
contagion effects Total Systemic risk (TSR) is defined as the total of the off-
0
01
02
03
04
05
06
07
08
09
1
Jan
-08
May
-08
Sep
-08
Jan
-09
May
-09
Sep
-09
Jan
-10
May
-10
Sep
-10
Jan
-11
May
-11
Sep
-11
Jan
-12
May
-12
Sep
-12
Jan
-13
May
-13
Sep
-13
Jan
-14
May
-14
Sep
-14
Jan
-15
May
-15
Sep
-15
Jan
-16
May
-16
Sep
-16
Jan
-17
May
-17
26
diagonal entries in the connectedness matrix or as the sum of the ldquofromrdquo column
or ldquotordquo row measures total connectedness
N
ijji
H
ij
H IRTSR 1
We could plot a moving contagion measure defined as the sum of all IRFs ldquoto
others but we go one step further and we choose to present the Total Contagion
index (TCI) which is calculated as the average response per bank in the
connectedness matrix and is calculated as the sum of all non-diagonal cells
divided by the total number of entities
N
i j yy jiIR
NTCI
1 1
1
Cumulative IRs interval is [01] the index will be bound between 0 and 100
Higher contagion index implies a tightening of the nexus among banks (Figure
5)
Figure 5 Total Connectedness (TC)
Note The length of the window is 340 days and the step is 150 days
000
500
1000
1500
2000
2500
3000
3500
4000
4500
Jan
-08
May
-08
Sep
-08
Jan
-09
May
-09
Sep
-09
Jan
-10
May
-10
Sep
-10
Jan
-11
May
-11
Sep
-11
Jan
-12
May
-12
Sep
-12
Jan
-13
May
-13
Sep
-13
Jan
-14
May
-14
Sep
-14
Jan
-15
May
-15
Sep
-15
Jan
-16
May
-16
Sep
-16
Jan
-17
May
-17
27
Total connectedness reached its peak after Lehman collapse and was
severely affected by the developments in the European banking and sovereign
debt markets that shocked some EU member countries until mid-2012 The
Greek crisis and then the fact that in the early 2011 Italy and Spain joined the
countries with stressed banking systems pushed total connectedness upwards
After the early 2012 the actions taken by the ECB constrained total contagion
but after early 2015 higher political uncertainty following the outcomes of the
UK referendum on EU membership and the US election as well as market
concerns about euro area banksrsquo longer-term profitability prospects played their
role and contributed to the severe increase in the index At the same time
continued accommodative monetary policy in advanced economies and abating
market concerns about the possibility of a sharp slowdown in China have
dampened spikes in systemic stress Also a major concern for global markets
was the crisis in Deutsche Bank and its deep connections to global financial
institutions
From a policy perspective the most pressing issue for euro area financial
institutions remains the high level of NPLs which needs to be addressed The
resolution of systemic NPL problems will take time and requires a
comprehensive strategy involving coordination of all relevant stakeholders
533 Rolling Window ndash Regional Systemic Contribution (RSC)
We calculate the systemic contribution of each region as the ratio between
the total regional contagion effects and the total contagion in the system We
focus on Europe North America (US) and Euro-area since these regions
28
dominated in terms of systemic risk during the period Figure 8 compares the
systemic contribution of these regions Surprisingly the share of systemic risk
that European banks hold increased after 2014 while the contribution of US
banks remains increasingly lower than European banksrsquo contribution after mid-
2012 The difference between the systemic contribution of European and US
banks fluctuates between 40 and 55
Figure 8 European US and Euro-area banksrsquo contribution to total systemic risk
(as a of total systemic risk)
Note US banksrsquo contribution is presented in secondary axis
54 Principal Component Analysis
We use PCA analysis in which the banksrsquo CDS spreads are decomposed into
orthogonal factors of decreasing explanatory power to identify the increased
000
500
1000
1500
2000
2500
000
1000
2000
3000
4000
5000
6000
7000
8000
Jan
-08
May
-08
Sep
-08
Jan
-09
May
-09
Sep
-09
Jan
-10
May
-10
Sep
-10
Jan
-11
May
-11
Sep
-11
Jan
-12
May
-12
Sep
-12
Jan
-13
May
-13
Sep
-13
Jan
-14
May
-14
Sep
-14
Jan
-15
May
-15
Sep
-15
Jan
-16
May
-16
Sep
-16
Jan
-17
May
-17
EU Euroarea US
29
commonality among the default risk of banks (see Muirhead 1982 for an
exposition of PCA)
Let 119884119905 be the log difference of bankrsquos i CDS i=1hellip77 let the systemrsquos
aggregate credit risk be represented by the sum 119884119878 = sum 119884119894119894 and let 119864[119884119894] = 120583119894
and Var[119877119894] = 1205901198942 Then we have
1205901199042 = sum sum 120590119894120590119895120550[119911119894119911119895]
119873
119895=1
119873
119894=1
where 119911119896 = (119877119896 minus 120583119896)120590119896 k=ij
where 119911119896 is the CDS of bank k and 1205901199042 is the variance of the system
PCA produces the decomposition of the variance-covariance matrix of CDS
spreads of the 77 banks contained in the sample into the orthogonal matrix of
loadings L (eigenvector of the correlation matrix of CDS spreads) and the
diagonal matrix of eigenvalues Λ
We focus on the first three eigenvalues as they explain most of the variation
in the system These three eigenvalues are supposed to explain a larger portion
of the total volatility in the system when the CDS spreads are moving together or
in other words when systemic risk in more unified So periods when the first
three components explain most of the total volatility indicates the existence of
increased interconnectedness among banks The first component that is
extracted accounts for the maximum amount of total variance in the observed
variables In other words the proportion of explained variance by the first
component shows how much of the variations in the CDS spreads can be
explained by one common factor This result is in line with Fontana and
Scheicher (2010) who finds there to be a single large determinant dominating
the variation in the CDS spread where the proportion of explained variance by
30
factor 1 exceeds 80 According to Billio et al (2012) during periods of distress
fewer components explain larger part of the volatility which means that the
fluctuation of the first principal component while taking into account the
predictive power that CDS carry reveal periods of increased systemic risk
We run rolling window analysis where the length of the window is 200 days
and the step is 100 days over the period January 2008 to June 2017 and the
results indicate the existence of a single dominant component that determines
the fluctuations of CDS spreads (Figure 9)
Figure 9 Rolling Principal Components analysis
Note The length of the window is 200 days and the step is 100 days
Investigating the determinants of the loadings of each bank to the first
principal component through rolling cross-sectional analysis will reveal the
driving forces of systemic risk on a yearly basis over the period 2008-2016 For
that reason we use rolling cross-sectional analysis
0
10
20
30
40
50
60
Jan
-08
Jun
-08
No
v-0
8
Ap
r-0
9
Sep
-09
Feb
-10
Jul-
10
Dec
-10
May
-11
Oct
-11
Mar
-12
Au
g-1
2
Jan
-13
Jun
-13
No
v-1
3
Ap
r-1
4
Sep
-14
Feb
-15
Jul-
15
Dec
-15
May
-16
Oct
-16
comp1 comp2 comp3
31
ii
iiiiiii
Debt
SurplusGDPNIINPLsLoansAssetsay
7
654321
yi is each bankrsquos loading to the first component
We search among the following bank-specific characteristics total value of
bank assets (logs) retail orientation the total loanstotal assets (levels) NPLs
total loans (levels) and non-interest income total revenue and among the
following home-country specific characteristics GDP growth primary
surplusGDP (levels) public debtGDP (levels) We manage to match 47 banks to
bank-specific characteristics
Table 13 Determinants of each bankrsquos loadings in the first component over the nine
periods
2008 2009 2010 2011 2012 2013 2014 2015 2016
Size -0012 -0002 -0007 -0012 0001 0004 0001 -0002 -0003
(0008) (0007) (0006) (0006) (0007) (0006) (0010) (0008) (0009)
Loan-to-assets -0048 -0142 -0113 -0136 -0135 -0114 -0212 -0210 -0239
(0043) (0051) (0051) (0051) (0054) (0051) (0078) (0069) (0074)
NPLs 0844 0414 0352 0035 0004 -0097 0333 0304 0194
(0349) (0253) (0187) (0183) (0054) (0139) (0187) (0147) (0174)
Non-interest-income 0000 0000 0001 0000 0001 0000 0001 0000 0000
(0000) (0000) (0006) (0006) (0000) (0000) (0000) (0000) (0000)
GDP -0004 -0003 -0006 -0003 -0009 -0009 -0011 -0004 -0007
(0004) (0002) (0001) (0003) (0054) (0003) (0005) (0001) (0006)
Primary SurplusGDP 0000 -0002 0002 0000 -0002 -0004 -0009 -0014 -0012
(0002) (0001) (0001) (0170) (0054) (0003) (0004) (0004) (0005)
DebtGDP -0001 -00005 -00006 -0001 -00007 -00005 -00005 0000 -0000
(0000) (0000) (0000) (0000) (0054) (0000) (0000) (0000) (0000)
_cons 0300 0235 0297 0372 0248 0229 0252 0283 0323
(0080) (0076) (0068) (0078) (0054) (0072) (0111) (0094) (0107)
Note 1 510
32
6 Conclusions
Macroprudential policy is still in its infancy Much work is still needed on
developing good and timely analysis effective policy instrument tools and
effective implementation Our paper makes a contribution on the dimension of
analysis and measurement The key aim of macroprudential policy is to address
externalities and spillovers among financial institutions in an effort to safeguard
financial stability These interactions are complex We provide a tool for
clarifying and quantifying these interactions Our measures can guide
appropriate macroprudential policies that aim to internalize these externalities
A key conclusion from our study is that the focus on size does not adequately
address the systemic importance of banks
33
References
Acharya V Engle R Richardson M 2012 Capital Shortfall A New Approach to
Ranking and Regulating Systemic Risks American Economic Review Vol102 No
3
Acharya V Pedersen L Philippon T Richardson M 2010 Measuring systemic
risk Technical Report Department of Finance NYU
Acharya V Drechsler I Schnabl P 2014 A Pyrrhic Victory Bank Bailouts and
Sovereign Credit Risk Journal of Finance 2014 vol 69 issue 6 2689-2739
Adams Z Fuss R Gropp R 2014 Spillover Effects among Financial
Institutions A State-Dependent Sensitivity Value-at-Risk (SDSVaR) Approach
Journal of Financial and Quantitative Analysis (JFQA) Vol 49 No 3
Adrian T Brunnermeier M 2009 CoVaR Manuscript Princeton University
Aizenman J Hutchison H and JinjarakY (2013) lsquoWhat is the Risk of European
Sovereign Debt Defaults Fiscal Space CDS Spreads and Market Pricing of Riskrsquo
Journal of International Money and Finance 34 37-59
Allen F A Babus and E Carletti (2012) Asset commonality debt maturity and
systemic risk Journal of Financial Economics 104(3) 519ndash534
Alter A Beyer A 2013 The dynamics of spillover effects during the European
sovereign debt turmoil Journal of Banking and Finance 42 134-153
Altunbas Y Manganelli S Marques-Ibanez D 2011 Bank risk during the
financial crisis Do business models matter ECB Working Paper No 1394
Ang A Longstaff F 2011 Systemic sovereign credit risk Lessons from the US
and Europe NBER discussion paper 16983
Ayadi R Arbak E De Groen W 2011 Business Models in European Banking A
pre-and post-crisis screening CEPS Paperbacks
34
Banbura M Giannone D Reichlin L 2011 Nowcasting Oxford Handbook on
Economic Forecasting ed by M P Clements and D F Hendry pp 63ndash90 Oxford
University Press
Bank for Internaional Settlements 2010 Guidance for national authorities
operating the countercyclical capital buffer
Bank for Internaional Settlements 2011 Global systemically important banks
Assessment methodology and the additional loss absorbency requirement
Basel Committee on Banking Supervision 2010 Basel III A global regulatory
framework for more resilient banks and banking systems Bank for International
Settlements
Basu S Das S Michailidis G Purnanandam A 2017 A system-wide approach
to measure connectivity in the financial sector Unpublished
Benoit S Colliard J-E Hurlin C Perignon C 2015 Where the risks lie A
survey on systemic risk Unpublished working paper
Billio M Getmansky M Lo A W Pelizzon L 2012 Econometric measures of
systemic risk in the finance and insurance sectors Journal of Financial
Economics 104 535ndash559
Brownlees CT Engle RF 2010 Volatility correlation and tails for systemic
risk measurement Manuscript Stern School of Business New York University
Canova F and Pappa P 2007 Price Differentials in Monetary Unions The Role
of Fiscal Shocks Economic Journal 117 2007 713-737
Castro C Ferrari S 2014 Measuring and testing for the systemically important financial institutions Journal of Empirical Finance 2014 vol 25 issue C 1-14 Cerutti E Claessens S Laeven L 2015 The Use and Effectiveness of
Macroprudential Policies New Evidence IMF Working Paper No 1561
Crockett A 2000 Marrying the Micro- and Macro-prudential Dimensions of
Financial Stability Eleventh International Conference of Banking Supervisors
held in Basel 20-21
35
De Santis R (2012) ldquoThe euro area sovereign debt crisis Safe haven credit
rating agencies and the spread of the fever from Greece Ireland and Portugalrdquo
ECB Working Paper 1419
DellrsquoAriccia G Igan D Laeven L Tong H Bakker B Vandenbussche J 2012
Policies for Macrofinancial Stability How to Deal with Credit Booms IMF Staff
Discussion Note 1206
Demirer M Diebold F Liu L Yilmaz K 2017 Estimating global bank network
connectedness Journal of Applied Eeconometrics forthcoming
Diebold F X Yilmaz K 2009 Measuring Financial Asset Return and Volatility
Spillovers with Application to Global Equity Markets The Economic Journal
119(534) 158-171
Diebold F X Yilmaz K 2012 Better to give than to receive Predictive
directional measurement of volatility spillovers International Journal of
Forecasting Issue 28 pp 57-66
Doan T Litterman R Sims CA 1984 Forecasting and Conditional Projections
Using Realistic Prior Distributions Econometric Reviews 3(4) 1ndash 100
Elliott D J Feldberg G Lehnert A 2013 The History of Cyclical
Macroprudential Policy in the United States Office of Financial Research
Working Paper No 8
European Central Bank 2016 Macroprudential Bulletin Issue 12016
Financial Stability Board 2011 Measures to address systemically important
financial institutions
Fontana A Scheicher M 2010 An analyisis of euro area sovereign CDS and
their relation with government bonds ECB Working Paper Series Issue 1271
Fostel A Geanakoplos J 2008 Leverage Cycles and the Anxious Economy
American Economic Review 98 (4) 1211ndash1244 [2196]
36
Geanakoplos J Pedersen L H 2014 Monitoring leverage In Brunnermeier M
K Krishnamurthy A (Eds) Risk Topography Systemic Risk and Macro
Modeling NBER pp 175ndash182
Giannone D Lenza M Primiceri GE 2012 Prior Selection for Vector
Autoregressions CEPR Discussion Papers 8755 CEPR Discussion Papers
Giglio S Kelly B T Pruitt S 2015 Systemic risk and the macroeconomy An
empirical evaluation Journal of Financial Economics 2016 vol 119 issue 3 457-
471
Goacutemez-Puig M amp Sosvilla-Rivero S (2014) EMU sovereign debt markets crisis
Fundamental-based or pure contagion Institut de Recerca en Economia
Aplicada (IREA) Working Papers Universitat de Barcelona 201402
Huang X Zhou H Zhu H 2012 Systemic Risk Contributions Journal of
Financial Services Research 2012 vol 42 issue 1 55-83
International Monetary Fund 2013a The Interaction of Monetary and
Macroprudential Policies Washington International Monetary Fund
International Monetary Fund 2015a Financial Operations
Koumlhler M 2013 Does non-interest income make banks more risky Retail-
versus investment oriented banks Deutsche Bundesbank Discussion Paper
No172013
Koop G Korobilis D 2010 Bayesian Multivariate Time Series Methods for
Empirical Macroeconomics Foundations and Trends in Econometrics Vol 3 No
4 pp 267-358
Litterman Robert B 1979 Techniques of forecasting using vector
autoregressions Research Department Working Paper 115 Federal Reserve
Bank of Minneapolis Minnesota
37
Longstaff F Pan J Pedersen L Singleton K 201 How Sovereign Is Sovereign
Credit Risk American Economic Journal Macroeconomics 2011 vol 3 issue 2
75-103
Pesaran H Shin Y 1998 Generalized impulse response analysis in linear
mulitvariate models Economic Letters 58(1) 17-29
White H Kim TH Manganelli S 2008 Modeling autoregressive conditional
skewness and kurtosis with multi-quantile CAViaR In Russell J Watson M
(Eds) Volatility and Time Series Econometrics A Festschrift in Honor of Robert
F Engle
Part B
We study 77 banks from 26 developed and emerging economies Data are downloaded from Thomson-Reuters and cover the period from January 1st 2008 to June 30th 2017 The first sample contains 77 banks are from 19 developed economies while the rest are from 6 emerging economies (as of IMFrsquos list) The sample contains most of the banks that are designated as ldquoglobal systemically important banksrdquo (ldquoGSIBrsquosrdquo) as designated by the Basel Committee on Banking Supervision except for three Chinese banks (Agricultural Bank of China Bank of China and Industrial and Commercial Bank of China) and one French bank Group BPCE 43 out of the 77 banks (544) in the sample are from Europe while 28 of them (3544) are headquartered in Eurozone members The sample is extended by adding 19 smaller European banks
B Sample Presentation Bank Details Descriptive Statistics Tables 2a and b presents the 77 banks in the sample in the worldrsquos top 150 as they ordered by assets (Q4 2016) Table A3 presents the share of assets that each home-country holds in the sample as well as the share of assets per developed and emerging countries while Table A4 presents the share of assets per region Table A5 presents the 14 European banks that are added to the initial sample
Table 2a Banks ordered by Total Assets (in US $ billion)
Rank Bank Name Country Total assets
38
US$B
1 Bank of China China 2613 2 Mitsubishi UFJ Financial Group Japan 2597 3 JPMorgan Chase amp Co USA 2490 4 HSBC Holdings UK 2374 5 BNP Paribas France 2196
6 Bank of America USA 2187 7 Wells Fargo USA 1930 8 China Development Bank China 1904 9 Credit Agricole Group France 1821 10 Citigroup USA 1792
11 Mizuho Financial Group Japan 1757 12 Deutsche Bank Germany 1682 13 Sumitomo Mitsui Financial Group Japan 1654 14 Barclays PLC UK 1490 15 Societe Generale France 1461
16 Banco Santander Spain 1416 17 Lloyds Banking Group UK 1004 18 Norinchukin Bank Japan 984 19 Royal Bank of Scotland Group UK 981 20 UBS Group AG Switzerland 919
21 Unicredit SpA Italy 908 22 ING Groep NV Netherlands 893 23 Goldman Sachs Group USA 860 24 Morgan Stanley USA 814 25 Credit Suisse Group Switzerland 806
Table 2a ndash Continued from previous page
26 BBVA Spain 773 27 Intesa Sanpaolo Italy 766 28 Commonwealth Bank of Australia Australia 703 29 Rabobank Group Netherlands 700 30 Australia amp New Zealand Banking Group Australia 661
31 Nordea Sweden 651 32 Standard Chartered Plc UK 646 33 Westpac Banking Corp Australia 607 34 National Australia Bank Australia 562 35 Commerzbank Germany 549
36 Danske Denmark 495 37 State bank of India India 492 38 US Bancorp USA 445 39 The Export-Import Bank of China China 427 40 Sberbank of Russia Russia 420
41 Resona Japan 412 42 Sumitomo Mitsui TH Japan 406 43 Nomura Holdings Japan 370 44 PNC Financial Services USA 366 45 Capital One Financial Corporation USA 357
46 DBS Group Holdings Singapore 332 47 Shinhan Financial Group South Korea 328 48 KBC Group NV Belgium 291 49 Svenska Handelsbanken Sweden 289 50 Skandinaviska Enskilda Banken Sweden 289
51 Hana Financial Group South Korea 288 52 Nationwide Building Society UK 276 53 Korea Development Bank South Korea 268
39
54 Woori Bank South Korea 257 55 Landesbank Baden-Wurttemberg Germany 257
56 Cathay Financial Holding Taiwan 252 57 Swedbank Sweden 237 58 United Overseas Bank (UOB) Singapore 235 59 Dexia Belgium 225 60 Banco Sabadell Spain 224
61 Bayerische Landesbank Germany 224 62 Erste Group Bank AG Austria 220 63 Banco Popular Espanol Spain 204 64 Industrial Bank of Korea South Korea 196 65 Bank of Ireland Ireland 182
66 Malayan Malaysia 161 67 Standard Bank Group South Africa 161 68 Banca Monte dei Paschi di Siena Italy 161 69 American Express USA 158 70 National Bank of Greece Greece 153 71 Macquarie USA 143
72 Credit Lyonnais France 120 73 Comercial Portuguese Portuguese 113 74 Banco Espirito Santo Portugal 112 75 Turkiye is bankasi Turkey 112 76 Mediobanca Italy 95
77 Landesbank Hessen Germany 92
Table 2b Banks ordered by Country
Rank Bank Country Total assets
US$B
1 Commonwealth Bank of Australia Australia 703 2 Australia amp New Zealand Banking Group Australia 661 3 Westpac Banking Corp Australia 607 4 National Australia Bank Australia 562
5 Erste Group Bank AG Austria 220
6 KBC Group NV Belgium 291 7 Dexia Belgium 225
8 Bank of China China 2613 9 China Development Bank China 1904
10 The Export-Import Bank of China China 427
11 Danske Denmark 495
12 BNP Paribas France 2196 13 Credit Agricole Group France 1821 14 Societe Generale France 1461 15 Credit Lyonnais France 120
16 Deutsche Bank Germany 1682 17 Commerzbank Germany 549 18 Landesbank Baden-Wurttemberg Germany 257 19 Bayerische Landesbank Germany 224 20 Landesbank Hessen Germany 92
21 National Bank of Greece Greece 153
22 State bank of India India 492
23 Bank of Ireland Ireland 182
24 Unicredit SpA Italy 908 25 Intesa Sanpaolo Italy 766
40
26 Banca Monte dei Paschi di Siena Italy 161 27 Mediobanca Italy 95
28 Mitsubishi UFJ Financial Group Japan 2597 29 Mizuho Financial Group Japan 1757 30 Sumitomo Mitsui Financial Group Japan 1654 31 Norinchukin Bank Japan 984 32 Resona Japan 412 33 Sumitomo Mitsui TH Japan 406 34 Nomura Holdings Japan 370 35 Yamaguchi Financial Group Japan 93
36 ING Groep NV Netherlands 893 37 Rabobank Group Netherlands 700
38 Banco Espirito Santo Portugal 111
39 Sberbank of Russia Russia 420
40 DBS Group Holdings Singapore 332 41 United Overseas Bank (UOB) Singapore 235 42 Standard Bank Group South Africa 161
43 Shinhan Financial Group South Korea 328 44 Hana Financial Group South Korea 288 45 Korea Development Bank South Korea 268 46 Woori Bank South Korea 257 47 Industrial Bank of Korea South Korea 196
48 Banco Santander Spain 1416 49 BBVA Spain 773 50 Banco Sabadell Spain 224 51 Banco Popular Espanol Spain 204
Table 2b ndash Continued from previous page
53 Nordea Sweden 651 54 Svenska Handelsbanken Sweden 289 55 Skandinaviska Enskilda Banken Sweden 289 56 Swedbank Sweden 237
57 UBS Group AG Switzerland 919 58 Credit Suisse Group Switzerland 806
59 Cathay Financial Holding Taiwan 252
60 Turkiye is bankasi Turkey 112
61 HSBC Holdings UK 2374 62 Barclays PLC UK 1490 63 Lloyds Banking Group UK 1004 64 Royal Bank of Scotland Group UK 981 65 Standard Chartered Plc UK 646 66 Nationwide Building Society UK 276
68 JPMorgan Chase amp Co USA 2490 69 Bank of America USA 2187 70 Wells Fargo USA 1930 71 Citigroup USA 1792 72 Goldman Sachs Group USA 860 73 Morgan Stanley USA 814 74 US Bancorp USA 445 75 PNC Financial Services USA 366 76 Capital One Financial Corporation USA 357 77 American Express USA 158 78 Macquarie USA 143
41
Table 3a Banksrsquo home-countries ordered by the sum of total bank assets
Developed Total Assets Developing Total Assets USA 11547 China 4944 Japan 7867 India 492 UK 6936 Russia 420 France 5599 Taiwan 252 Germany 2994 South Africa 161 Spain 2617 Turkey 112
Australia 2534 Italy 1933 Switzerland 1725
Netherlands 1584 Sweden 1467 South Korea 1340 Singapore 568 Belgium 516 Denmark 495 Ireland 344 Austria 220 Greece 153 Portugal 111 Total Assets of banks that are headquartered in
Developed 5055366 Emerging 63823 of total assets 888 of total assets 112
42
Table 3b Regional details
Region Number of Banks Total bank
assets of total
assets
Europe 40 2669673 473
Asia 21 1557658 275
N America 11 1154724 204
Oceania 4 2534 45
Africa 1 161 03
B Data Definitions and Descriptive Statistics
Table 4 Data Definitions
Variable Description
Endogenous CDS CDS 5-year spread
Exogenous Systemic risk
CDX The family of CDS indeces covering North America
VIX The volatiliy index of SampP 500
US 3-month T Bill The short-term obligation backed by the Treasury Dept of the US goverment
Bank-specific Size Total assets
Retail orientation Total Loans Total assets
Diversification Non-interest income Total revenues
NPLs Non-performing loans Total Loans
Country-specific
GDP Each bankrsquos home-country GDP growth
Budget Balance Current AccountGDP
Public Debt Public DebtGDP
43
Table 5 Descriptive Statistics
Panel A Systemic risk factor
CDX VIX TED
Mean 269E-06 -0000123 -000121 Median 0000 -0001 0000 Maximum 0020 0176 0250 Minimum -0009 -0152 -0750
Std Dev 0001 0031 0033 Skewness 4689 0689 -17326
Kurtosis 106047 6789 377496 Jarque-Bera 1105896 1679364 14610377 Probability 0000 0000 0000
Sum 0007 -0304 -3000 Sum Sq Dev 0003 2427 2746
Note CDX and VIX are in log differences TED spread is in first differences
Panel B Bank specific
Assets Loans_to_Assets Non_Interest_Inc NPLs
Mean 732382 55596 2442 4601
Median 458009 59921 2378 2411
Maximum 3030645 8664 8640 35217
44
Minimum 4354387 9070 -5962 01082
Std Dev 7460013 17017 1481 5612
Skewness 1081 -0641 -0694 2376
Kurtosis 30129 2584 6193 9630
Jarque-Bera 7023 272888 182117 999501
Probability 0000 0000 0000 0000
Sum 264E+09 2003702 8803746 1658430 Sum Sq Dev 201E+15 1043392 7908036 1134867
Note Data are in levels
Part C ndash Global Sample
Table 7 Individual systemic importance
Panel A ndash Ranked by total score Rank by score
Rank by bank assets Bank Name
Home-Country Region
Assets (billion
US $) Score
To others (Aggr)
From others (Aggr)
1 27 Intesa Sanpaolo Italy Europe 766 1056 0505 0551
2 16 Banco Santander Spain Europe 1416 1038 0464 0574
3 26 BBVA Spain Europe 773 0987 0454 0533
4 5 BNP Paribas France Europe 2196 0982 0445 0537
5 21 Unicredit SpA Italy Europe 908 0975 0489 0485
6 14 Barclays PLC UK Europe 1490 0961 0454 0507
7 12 Deutsche Bank Germany Europe 1682 0954 0428 0526
8 9 Credit Agricole Group France Europe 1821 0942 0424 0518
9 15 Societe Generale France Europe 1461 0940 0427 0512
10 72 Credit Lyonnais France Europe 120 0938 0445 0493
11 17 Lloyds Banking Group UK Europe 1004 0925 0438 0487
12 25 Credit Suisse Group Switz Europe 806 0907 0376 0531
13 35 Commerzbank Germany Europe 549 0904 0410 0494
14 20 UBS Group AG Switz Europe 919 0890 0387 0503
15 32 Standard Chartered Plc UK Europe 646 0870 0419 0451
16 68 Banca Monte dei Paschi Italy Europe 161 0861 0429 0433
45
17 19
Royal Bank of Scotland Group
UK Europe 981 0845 0423 0423
18 29 Rabobank Group Netherl Europe 700 0841 0376 0465
19 22 ING Groep NV Netherl Europe 893 0823 0374 0449
20 76 Mediobanca Italy Europe 95 0821 0389 0433
21 24 Morgan Stanley USA N Amer 814 0752 0315 0437
22 69 American Express USA N Amer 158 0736 0332 0404
23 6 Bank of America USA N Amer 2187 0716 0318 0398
24 23 Goldman Sachs Group USA N Amer 860 0711 0302 0410
25 10 Citigroup USA N Amer 1792 0706 0313 0393
26 4 HSBC Holdings UK Europe 2374 0695 0372 0323
27 62 Erste Group Bank AG Austria Europe 220 0688 0314 0375
28 49 Svenska Handelsbanken Sweden Europe 289 0678 0281 0397
29 53
Korea Development Bank
S Korea Asia 268 0677 0393 0284
30 60 Banco Sabadell Spain Europe 224 0670 0295 0375
31 36 Danske Denmark Europe 495 0663 0296 0367
32 45
Capital One Financial Corp
USA N Amer 357 0662 0260 0401
33 3 JPMorgan Chase amp Co USA N Amer 2490 0658 0257 0401
34 7 Wells Fargo USA N Amer 1930 0653 0259 0394
35 34 National Australia Bank Australia Oceania 562 0622 0376 0247
Table continued on next page
Table 3- Panel A continued from previous page
36 2 Mitsubishi UFJ Financial Japan Asia 2597 0621 0223 0398
37 47 Shinhan Financial Group S Korea Asia 328 0615 0331 0283
38 54 Woori Bank S Korea Asia 257 0612 0333 0278
39 64 Industrial Bank of Korea S Korea Asia 196 0603 0341 0261
40 28 Commonwealth Bank Australia Oceania 703 0599 0388 0211
41 40 Sberbank of Russia Russia Europe 420 0598 0294 0305
42 30 Australia amp N Zealand Australia Oceania 661 0597 0383 0214
43 50 Skandinaviska Enskilda Sweden Europe 289 0578 0262 0316
44 31 Nordea Sweden Europe 651 0574 0289 0285
45 71 Macquarie USA N Amer 143 0572 0321 0251
46 48 KBC Group NV Belgium Europe 291 0568 0241 0327
47 63 Banco Popular Espanol Spain Europe 204 0558 0297 0261
48 61 Bayerische Landesbank Germany Europe 224 0552 0249 0303
49 39 The Export-Import Bank China Asia 427 0548 0284 0264
50 1 Bank of China China Asia 2613 0548 0276 0272
51 66 Malayan Malaysia Asia 171 0543 0321 0223
52 33 Westpac Banking Corp Australia Oceania 606 0540 0374 0166
53 37 State bank of India India Asia 492 0530 0238 0291
54 51 Hana Financial Group S Korea Asia 288 0518 0290 0227
55 57 Swedbank Sweden Europe 237 0486 0253 0233
56 8 China Development Bank China Asia 1904 0468 0260 0208
46
57 52 Nationwide Building Society UK Europe 276 0463 0217 0246
58 59 Dexia Belgium Europe 225 0409 0197 0212
59 46 DBS Group Holdings Singapore Asia 332 0397 0212 0186
60 65 Bank of Ireland Ireland Europe 182 0379 0197 0182
61 58 United Overseas Bank Singapore Asia 235 0373 0214 0159
62 11 Mizuho Financial Group Japan Asia 1757 0367 0271 0096
63 67 Standard Bank Group S Africa Africa 161 0365 0123 0242
64 74 Espirito Santos Portugal Europe 112 0362 0186 0176
65 41 Resona Japan Asia 412 0357 0263 0094
66 13 Sumitomo Mitsui Financial Japan Asia 1654 0355 0250 0104
67 38 US Bancorp USA N Amer 445 0353 0188 0165
68 55 Landesbank Baden-Wurtt Germany Europe 257 0340 0170 0171
69 42 Sumitomo Mitsui TH Japan Asia 406 0323 0273 0050
70 56 Cathay Financial Holding Taiwan Asia 252 0298 0189 0109
71 73 Comercial Portuguese Portugal Europe 113 0279 0268 0011
72 70 National Bank of Greece Greece Europe 153 0220 0176 0044
73 18 Norinchukin Bank Japan Asia 984 0215 0164 0050
74 43 Nomura Holdings Japan Asia 370 0197 0161 0035
75 77 Landesbank Hessen Germany Europe 92 0159 0089 0071
76 44 PNC Financial Services USA N Amer 366 0078 0034 0043
77 75 Turkiye is bankasi Turkey Europe 112 0037 0030 0007
Note Results concern the period January 2008 ndash June 2017 and are of daily frequency
Table 9 Systemic contribution per bank (January 2008 ndash June 2017)
Rank Bank Name SC Rank Bank Name SC Rank Bank Name SC Rank Bank Name SC
1 Intesa Sanpaolo
225 21 Morgan Stanley 160 41 Sberbank of Russia
128 61 United Overseas
080
2 Banco Santander
221 22 American Express
157 42 Australia amp N Zealand
127 62 Mizuho Financial
078
3 BBVA 210 23 Bank of America
153 43 Skandinaviska Enskilda
123 63 Standard Bank Group
078
4 BNP Paribas 209 24 Goldman Sachs Group
152 44 Nordea 122 64 Espirito Santos
077
5 Unicredit SpA
208 25 Citigroup 151 45 Macquarie 122 65 Resona 076
6 Barclays PLC 205 26 HSBC Holdings 148 46 KBC Group NV
121 66 Sumitomo Mitsui
076
7 Deutsche Bank
203 27 Erste Group 147 47 Banco Popular
119 67 US Bancorp
075
8 Credit Agricole
201 28 Svenska 145 48 Bayerische Landesbank
118 68 Landesbank 072
9 Societe Generale
200 29 Korea Development Bank
144 49 The Export-Import
117 69 Sumitomo Mitsui TH
069
10 Credit Lyonnais
200 30 Banco Sabadell 143 50 Bank of China 117 70 Cathay Financial
064
11 Lloyds Banking
197 31 Danske 141 51 Malayan 116 71 Comercial Portuguese
059
47
12 Credit Suisse Group
193 32 Capital One Financial Corp
141 52 Westpac Banking Corp
115 72 NBG 047
13 Commerzbank 193 33 JPMorgan Chase amp Co
140 53 State bank of India
113 73 Norinchukin Bank
046
14 UBS Group AG 190 34 Wells Fargo 139 54 Hana Financial Group
110 74 Nomura Holdings
042
15 Standard Chartered
186 35 National Australia Bank
133 55 Swedbank 104 75 Landesbank Hessen
034
16 Banca Monte dei
184 36 Mitsubishi UFJ Financial
132 56 China Development
100 76 PNC Financial Services
017
17 RBS 180 37 Shinhan Financial Group
131 57 Nationwide Building
099 77 Turkiye is bankasi
008
18 Rabobank Group
179 38 Woori Bank 130 58 Dexia 087
19 ING Groep NV 175 39 Industrial Bank of Korea
129 59 DBS Group Holdings
085
20 Mediobanca 175 40 Commonwealth Bank
128 60 Bank of Ireland
081
10
The second to last row is a measure of total vulnerability of a bank to all other
banks in the system It contains the answer to the question ldquoIf all other banks in
the system experienced an idiosyncratic shock of 100 basis points what would
be the impact on bank Xrdquo In the bottom row we aggregate the total externality
effect and the total vulnerability effect of each bank In other words we lump
together shocks sent and received by an individual bank as a measure of total
individual bank connectedness In calculating a bankrsquos systemic importance we
assign equal weights to shocks it sends as to shocks it receives as we are
agnostic as to whether one source of systemic instability is more dangerous than
the other
There are two aspects of financial contagion due to a bankrsquos participation in a
banking system that are of relevance to regulators externalities emanating from
a bankrsquos failure and individual bank vulnerability to financial contagion Both
components are important for regulators but their importance may not be equal
If they are of equal importance then the regulator would consider the sum of
these two However the clear decomposition in Table 1 as well as in our
econometric method allows the regulator to assign different weights in order to
capture the appropriate measure of systemic importance
4 Data and Methodology
41 Data
We study 77 banks from 19 developed and 7 emerging economies Our
selection procedure is as follows We started with the list of the worldrsquos top 150
banks in terms of total assets in Q42016 Using bank names we matched 77
banks to CDS prices from Thomson-Reuters Datastream and Bloomberg CDS
11
spreads cover the period from January 2008 to June 2017 and are at daily
frequency The sample contains all the banks that are designated as ldquoglobal
systemically important banksrdquo (ldquoGSIBrsquosrdquo) by the Basel Committee on Banking
Supervision except for three Chinese banks (Agricultural Bank of China Bank of
China and Industrial and Commercial Bank of China) and one French bank
(Group BPCE) Table 2a (in the Appendix) classifies banks by assets and provides
detail on the 77 banks in the sample such as home-country and total assets
while table 2b (in the Appendix) classifies banks by home-country We note that
40 out of the 77 banks (52) in the sample are from Europe while 28 of them
(34) are headquartered in Eurozone members Tables 3a and 3b (in the
Appendix) provide the regional characteristics of the sample
411 Systemic Risk factor
We will allow for the presence of a global systemic risk factor This permits
us to interpret robustly the results obtained from our model Longstaff et al
(2011) for instance has argued that credit risk appears related to global rather
than country-specific factors while Aizenman et al (2013) has established the
importance of international economic factors in the pricing of credit risk The
variables we chose to employ in order to capture global financial risk conditions
have been widely used in related studies as control variables (see among others
De Santis 2012 Aizenman et al 2013 Ang and Longstaff 2011) The global
default risk conditions are represented by the CDX which is the family of CDS
indices covering North America the VIX volatility index which captures the
global capital marketsrsquo ldquofearrdquo condition and the global liquidity conditions which
is represented by the US 3-month treasury bills The systemic factor is assumed
12
to affect the endogenous variables contemporaneously Table 4 contains the
variable definitions and Table 5 provides descriptive statistics
412 Bank-specific characteristics
A variety of bank- and country-specific variables are used for identifying the
determinants of systemic risk fluctuation over time The first bank-specific
variable is bank size expressed as each bankrsquos total assets (in log) According to
BIS (2011a) the larger a bank is the more likely it is to receive a bailout package
In this sense we also take into consideration the ldquotoo-big-to-failrdquo (TBTF) issue
(Acharya et al 2013) The second bank-specific variable is the loan-to-asset
ratio which provides information on the bankrsquos retail orientation Ayadi et al
(2011) and Koumlhler (2013) suggest that retail-orientated banks appeared to be
less risky than other banks during the recent financial crisis Also according to
Altunbas et al (2011) the non-interest income over total revenue is considered
to be a measure of each bankrsquos diversification since the less a bank relies on
interest income the less exposed the bank is to a negative shock Finally we
include each bankrsquos nonperforming loans over total loans (see Tables 4 and 5)
413 Country-specific characteristics
It is important to include country-specific factors since the impact of
macroprudential policy might differ depending on the underlying economic
conditions of each bankrsquos home country For example the impact of shocks may
be larger for economies that were under stress and hence rely more on rescue
packages and foreign financing (IMF 2015a) These economies would not have
the same ability to support effectively their banking systems in times of distress
13
We investigate the role of sovereigns by searching among each bankrsquos home-
country GDP growth the primary surplus over GDP and public debt over GDP
42 Connectedness matrix
We estimate a VARX model with two lags (p=2) for the endogenous variables
and contemporaneous exogenous variables (q=0)
The vector of endogenous variables (y) consists of log differences of daily CDS
spreads for the 77 banks By including the exogenous variables we account for
common factors that affect at the same time all bank CDS spreads (Bekaert et al
2005)
421 Bayesian VAR
The suggested model has many more parameters than observations overfits
the data in-sample and as a consequence could perform poorly Researchers
working in the relevant literature typically use prior shrinkage on the
parameters to overcome such over-parametrization concerns Most flexible
Bayesian priors that result in shrinkage of high-dimensional parameter spaces
rely on computationally intensive Markov Chain Monte Carlo (MCMC) methods
Their application to recursive forecasting exercises can as a consequence be
prohibitive or even infeasible The only exception is a variant of the Minnesota
prior that is based on the natural conjugate prior an idea that has recently been
exploited by Banbura Giannone and Reichlin (2010) and Giannone Lenza and
Primiceri (2012) among others While this prior allows for an analytical formula
ttttt uXBYAYAaY 122110
14
for the posterior there is a cost in terms of flexibility in that a priori all VAR
equations are treated in the same manner see Koop and Korobilis (2010) for a
further discussion of this aspect of the natural conjugate prior
The traditional ldquoMinnesota priorrdquo an empirical-Bayes prior which is due to
Littermann (1979) and co-authors (see eg Doan Litterman and Sims 1984)
still dominates many applications of VAR models in economics The recent
contribution of Giannone Lenza and Primiceri (2012) provides guidance on
selecting the prior hyperparameter controlling shrinkage of the VAR coefficients
Note that computational simplicity is a priority in this paper so that the
Gibbs sampler is preferred compared to other potentially more powerful and
elegant Markov Chain Monte Carlo (MCMC) and Sequential Monte Carlo (SMC)
algorithms for prior selection However we recognize that the flexibility of
choosing the prior freely is one of the main controversial issues associated with
Bayesian analysis and the reason why some researchers view the latter as
subjective It is also the reason why the Bayesian practice especially in the early
days was dominated by non-informative priors as these priors assign equal
probabilities to all possible states of the parameter space with the aim of
rectifying the subjectivity problem We estimate the coefficients of a VAR(2) for
78 banks using the arithmetic returns of each bankrsquos CDS As we explained
above a key concern of users of Bayesian statistics and criticism by critics is the
dependence of the posterior distribution on onersquos prior and for this reason we
specify hyperparameters for the prior
The Bayesian VAR(p) model can be written as
119910119905 = 1198860 + sum 119860119895119910119905minus119895 + 120576119905
119901
119895=1
15
where yt for t = 1 T is an M x 1 vector containing observations on M time series
variables εt is an M x 1 vector of errors α0 is an M x 1 vector of intercepts and Aj
is an M x M matrix of coefficients We assume εt to be iid N (0 Σ) Exogenous
variables are added to the VAR and included in all the derivations below but we
do not do so to keep the notation as simple as possible
422 The connectedness matrix framework
The construction of the diagnostic tool is based on a medium-size Bayesian
vector autoregressive model with exogenous variables (Bayesian VARX) that
accounts for common global and regional trends and is able to include even
bank-specific characteristics Then similar as the framework described by
Diebold and Yilmaz (2009 2012) and the one described by Alter and Beyer
(2013) we construct the spillover matrix in order to capture any potential
spillovers among banks This methodology relies on Generalized Forecast Error
Variance Decomposition (GFEVD) or on Generalized Impulse Response
Functions (GIRF) obtained as shown in Pesaran and Shin (1998) Therefore we
derive Generalized Impulse Response Functions as functions of residuals
together with the interdependent coefficients According to Alter and Beyer
(2012) it is of low importance which methodology we select since they produce
qualitatively similar results
16
Table 6 Contagionconnectedness matrix
Note Variables in the first column are the impulse origin while variables on the top row are the respondents to the shock The cumulative impact is bound between 0 and 1 A value of 05 means that the response variable would be impacted in the same direction with an intensity of 50 the initial unexpected shock in the impulse variable The last column presents the aggregated impact sent (Sum OUT) by each row variable and on the bottom row the aggregated spillover received (Sum IN) by each column variable The bottom-right cell shows total spillover in the system and by dividing this value to the total number of non-diagonal cells we obtain the connectedness index (CI)
In table 2 row variables are the origin of the unexpected shock Column
variables are the respondents of contagion receivers CI represents the
connectedness index calculated as the average response in the contagion matrix
The potential contagion effects are aggregated on each line and column and
represent the total to_others and the total from_others as potential contributions
to contagion from and to each bank The main diagonal values represent the
effect of a variablersquos shock on itself and they are excluded from any calculations
The possible contagion effects answer the question ldquoHow would bank B evolve in
the following period if bank A CDS increases by one unit shockrdquo
We use accumulated Impulse Response functions over a 10-step horizon (10-
days) Not all the banks respond to the shocks within the same period but the
majority of the shocks are absorbed within 10-days Nevertheless the
framework is flexible and it easily adapts to the needs of each study
5 Empirical results
17
51 Individual bank connectedness
We estimate the connectedness matrix as described in section 422 for the
whole sample period 1 January 2008 to 31 June 2017 and estimate the
individual bank connectedness (table 7) which reports several notable results
The evidence do not offer support to the argument that systemic importance of a
bank can be adequately captured by its size According to table 7 the bank that
creates the most systemic risk in the system is Intesa Sanpaolo a medium-sized
European bank that is ranked 27th in terms of total assets with total contagion
effects of 1056 which is further decomposed into 0505 vulnerability-score and
0551 externalities-score For instance the Intesa Sanpaolorsquos 0551 externalities
score implies that one-unit shock in Intesa Sanpaolo will have an impact of
551 to the system while the 0505 vulnerability score means that one-unit
shock to the market will affect Intesa Sanpaolo by 505 Among the top-20
most connected banks can also be found smaller banks like BBVA (3rd) Credit
Lyonnais (10th) Banca Monte dei Paschi (16th) and Mediobanca (20th) while the
largest bank in the sample is listed 50th in terms of systemic importance
The existing literature on the topic suggests that during crises periods large
banks behave differently than small or medium-sized banks (Laeven et al 2014)
This phenomenon could be partially attributed to some common characteristics
that are shared by large banks and are associated with higher levels of risk
namely the increased portion of market-based activities the reduced capital
adequacy the less stable funding and the higher organizational complexity
However it remains unidentified the bank-size threshold above or below which
these criteria are valid Results presented in table 8 provide a more narrow
response to the question whether systemic importance is related to size or not
18
Size per se is a determinant of systemic importance since when banks are
ranked by systemic importance the first quartile compiles the largest percentage
of total assets (34 of total assets) However when the sample is ranked by total
assets and not in terms of connectedness the first quartile represents 62 of
total assets indicating a severe leakage of assets to the other quartiles and
revealing the existence of structural variables that interact with size
The existing frameworks used by regulators and policy makers such as the
BCBSFSB framework rely heavily on size either through size-related indicators
or size per se to calculate the capital adequacy ratios Our results suggest that
the measures taking strong size-effect as granted should also focus on the large
banksrsquo idiosyncratic characteristics that place 50 of G-SIBs in the first quartile
of systemic importance
Table 8 Banks ranked by systemic importance and by assets ndash Number of banks per quartile
Quartile ranked by Number of G-SIBs per quartile
Score Assets
1st Quartile 34 62 48
2nd Quartile 33 224 28
3rd Quartile 18 105 10
4th Quartile 14 51 14
The next step is to calculate the systemic contribution of each bank in the
system as the ratio between the total individual contagion effects and the total
contagion in the system
100TC
TICTSC i
i
y
y
19
TSC is the total systemic contribution TIC is the total individual contagion
effects and TC is the total contagion in the system The bank with the highest
ranking contributes 225 of the total contagion effects while the bank at the
bottom of the table contributes almost 0 (table 9) This measure allows us to
compare the results among samples with different number of entities
We define each bankrsquos directional connectedness as the ratio between the
individual externalities and the total individual contagion
100
i
i
i
y
yOUT
yOUTTIC
IEID or
100
i
i
i
y
yIN
yINTIC
IVID
ID is the individual directionality IE is the individual externalities IV is the
individual vulnerabilities and TIC is total individual contagion The followings
should be always valid
1 ii yINyOUT IDID
ii yINyOUT IDID
In case iyOUTID is larger than 50 it means than the bank that the systemic score
of the bank it refers to is externalities-driven When breaking the results into
quartiles that represent the average individual directionality for all the banks
that belong in this quartile (table 10) we realize that banks with higher TIC tend
to have higher iyOUTID ratios (54) that their peers that belong in the last
quartile (30) We do not suggest that the directionality of contagion
determines the systemic importance of banks because this is beyond control and
difficult to interpret but that in terms of systemic importance that may be
20
interpreted into increased capital requirements is ldquobetter to receive shocks than
to send shocks to the systemrdquo
Table 10 Average Individual Directionality (OUT) per quartile
iyOUTID
1st Quartile 54
2nd Quartile 53
3rd Quartile 47
4th Quartile 30
Note banks are ranked by systemic importance
52 Regional network connectedness
Prior quantifying the transmission of contagion effects we focus on table 7
that reveals a very strong regional effect This is that the first quartile of systemic
importance is exclusively dominated by banks that are headquartered in Europe
implying the existence of a regional component and severe clustering Table 11a
shows the regional concentration per quartile and table 11b expresses the
regional concentration as a percentage of the total number of banks that exist
per region
Table 11a Concentration of banks per region
Quartile Europe Eurozone (as
of EU) N America Asia Oceania Africa
1st Quartile 100 75 - - - -
2nd Quartile 25 25 40 25 10 -
3rd Quartile 50 50 10 30 10 -
4th Quartile 35 75 12 48 - 5
Table 11b Regional concentration as a percentage of total banks per region
21
Quartile Europe N America Asia Oceania Africa
1st Quartile 47 - - - -
2nd Quartile 12 73 25 25 -
3rd Quartile 21 9 35 75 -
4th Quartile 16 18 40 - 100
The next step is to understand the flows of shocks among the different
regions the contagion effects and the degree of connectedness among the
different regions (Table 12a and b) We focus on four regions Europe North
America (expressed by US banks) Asia and Oceania Table 12a shows regionrsquos A
externalities to the other regions as a percentage of regionrsquos A total externalities
while table 12b focuses on the vulnerabilities side Combining the information
obtained by tables 12a and b European and US appear to be strongly
interconnected More precisely 58 of the aggregate shocks that are sent by US
banks are directed to Europe while 64 of the aggregate shocks received by US
banks are generated in Europe Also another important finding is that 69 of
the aggregate shocks that are sent by European banks remain within Europe
Table 12a Shocks sent per region as of total shocks sent per region
Asia Europe NAmerica Oceania
Sum
Asia 41 41 9 9
100
Europe 16 69 960 540
100
NAmerica 1950 58 16 650
100
Oceania 33 4450 950 12
100
22
Table 12b Shocks received per region as of total shocks received per region
Asia Europe NAmerica Oceania
Asia
28 10 13 21
Europe
54 75 64 59
NAmerica
12 12 20 13
Oceania
6 3 3 7
Sum
100 100 100 100
All in all it is obvious that there exists a regional factor that affects
significantly the bank connectedness However it is interesting to find out the
driving forces of this regional component especially in the case of Europe which
has been a special case due to the different transmission channels of the financial
crisis the highly interconnected banking system the feedback loops among
sovereigns and banks and the contagion from one country to the rest of Europe
53 National banking system connectedness
We approach the national banking system first of all by calculating the
average systemic risk per bank for each one of the countries in the sample
(Figure 2) Four out of the first five banks that contributed the most to the global
systemic risk belong to Eurozone French banks contributed the most to
systemic risk while Italy and Spain both of which suffered from banking
systems in distress followed at close range Banks in non-Euro-area countries
like Swiss and UK banks played an important role as well Surprisingly the
average contagion effects for German banks place them almost in the middle of
the table indicating that German banking system may acted as a stability factor
for the European region Both Portuguese and especially Greek banking system
appeared to be isolated from the global banking system
23
Figure 2 Average systemic risk per bank ndash Own shocks are excluded
Note results concern the period January 2008-June 2017
In figure 3 we approach the total contagion from a different perspective by
presenting the total contagion effects for each sovereign This approach may
depends on the number of banks per sovereign but illustrates that US-European
cluster dominates in terms of systemic importance
Figure 3 National systemic risk ndash Own shocks are excluded
Note results concern the period January 2008-June 2017
53 Rolling window
000
010
020
030
040
050
060
070
080
090
100
Fra
nce
Ital
y
Swit
z
Net
her
l
Spai
n
UK
Au
stri
a
Den
mar
k
S K
ore
a
USA
Ru
ssia
Au
stra
lia
Ger
man
y
Swed
en
Mal
aysi
a
Ind
ia
Ch
ina
Bel
giu
m
Sin
gap
ore
Irel
and
S A
fric
a
Jap
an
Po
rtu
gal
Tai
wan
Gre
ece
Tu
rkey
000
100
200
300
400
500
600
700
USA U
K
Fra
nce
Ital
y
Spai
n
S K
ore
a
Ger
man
y
Jap
an
Au
stra
lia
Swed
en
Swit
z
Net
her
l
Ch
ina
Bel
giu
m
Sin
gap
ore
Au
stri
a
Den
mar
k
Po
rtu
gal
Ru
ssia
Mal
aysi
a
Ind
ia
Irel
and
S A
fric
a
Tai
wan
Gre
ece
Tu
rkey
24
531 Individual Banks
In order to better understand the evolvement of systemic risk and how this
fluctuated over the whole period we use rolling-window analysis where the
length of the window is 340 days and the step is 150 days Figure 3 presents the
evolution of total contagion over time where strong co-movement and
interconnections among banks are obvious We also discriminate periods where
the cluster of TCI lines is shrinking and systemic risk is becoming more unified
which means that systemic and idiosyncratic shocks are propagated more
intensely via the network
Figure 3 Total Individual Contagion
Note The length of the window is 340 days and the step is 150 days
We introduce the range as a new metric of systemic risk unification Range at
each point in time is defined as the difference between the highest and the
lowest score in the system (Figure 4) The lowest the score the more unified the
000
020
040
060
080
100
120
Jan
-08
May
-08
Sep
-08
Jan
-09
May
-09
Sep
-09
Jan
-10
May
-10
Sep
-10
Jan
-11
May
-11
Sep
-11
Jan
-12
May
-12
Sep
-12
Jan
-13
May
-13
Sep
-13
Jan
-14
May
-14
Sep
-14
Jan
-15
May
-15
Sep
-15
Jan
-16
May
-16
Sep
-16
Jan
-17
May
-17
25
systemic risk is becoming Given the predictive power of CDS spreads this new
measure could be used by regulators and policymakers as an early-warning tool
However it remains an open question what is the threshold below which the
unification of systemic risk could consist a problem It is remarkable that the
most ldquolooserdquo links were observed during the post-Lehman collapse in late 2008
and reached its lowest price at the beginning of Greek crisis
Figure 4 Systemic risk range
Note The length of the window is 340 days and the step is 150 days
532 Global banking system
In this part we are interested in understanding the behavior of aggregate
contagion effects Total Systemic risk (TSR) is defined as the total of the off-
0
01
02
03
04
05
06
07
08
09
1
Jan
-08
May
-08
Sep
-08
Jan
-09
May
-09
Sep
-09
Jan
-10
May
-10
Sep
-10
Jan
-11
May
-11
Sep
-11
Jan
-12
May
-12
Sep
-12
Jan
-13
May
-13
Sep
-13
Jan
-14
May
-14
Sep
-14
Jan
-15
May
-15
Sep
-15
Jan
-16
May
-16
Sep
-16
Jan
-17
May
-17
26
diagonal entries in the connectedness matrix or as the sum of the ldquofromrdquo column
or ldquotordquo row measures total connectedness
N
ijji
H
ij
H IRTSR 1
We could plot a moving contagion measure defined as the sum of all IRFs ldquoto
others but we go one step further and we choose to present the Total Contagion
index (TCI) which is calculated as the average response per bank in the
connectedness matrix and is calculated as the sum of all non-diagonal cells
divided by the total number of entities
N
i j yy jiIR
NTCI
1 1
1
Cumulative IRs interval is [01] the index will be bound between 0 and 100
Higher contagion index implies a tightening of the nexus among banks (Figure
5)
Figure 5 Total Connectedness (TC)
Note The length of the window is 340 days and the step is 150 days
000
500
1000
1500
2000
2500
3000
3500
4000
4500
Jan
-08
May
-08
Sep
-08
Jan
-09
May
-09
Sep
-09
Jan
-10
May
-10
Sep
-10
Jan
-11
May
-11
Sep
-11
Jan
-12
May
-12
Sep
-12
Jan
-13
May
-13
Sep
-13
Jan
-14
May
-14
Sep
-14
Jan
-15
May
-15
Sep
-15
Jan
-16
May
-16
Sep
-16
Jan
-17
May
-17
27
Total connectedness reached its peak after Lehman collapse and was
severely affected by the developments in the European banking and sovereign
debt markets that shocked some EU member countries until mid-2012 The
Greek crisis and then the fact that in the early 2011 Italy and Spain joined the
countries with stressed banking systems pushed total connectedness upwards
After the early 2012 the actions taken by the ECB constrained total contagion
but after early 2015 higher political uncertainty following the outcomes of the
UK referendum on EU membership and the US election as well as market
concerns about euro area banksrsquo longer-term profitability prospects played their
role and contributed to the severe increase in the index At the same time
continued accommodative monetary policy in advanced economies and abating
market concerns about the possibility of a sharp slowdown in China have
dampened spikes in systemic stress Also a major concern for global markets
was the crisis in Deutsche Bank and its deep connections to global financial
institutions
From a policy perspective the most pressing issue for euro area financial
institutions remains the high level of NPLs which needs to be addressed The
resolution of systemic NPL problems will take time and requires a
comprehensive strategy involving coordination of all relevant stakeholders
533 Rolling Window ndash Regional Systemic Contribution (RSC)
We calculate the systemic contribution of each region as the ratio between
the total regional contagion effects and the total contagion in the system We
focus on Europe North America (US) and Euro-area since these regions
28
dominated in terms of systemic risk during the period Figure 8 compares the
systemic contribution of these regions Surprisingly the share of systemic risk
that European banks hold increased after 2014 while the contribution of US
banks remains increasingly lower than European banksrsquo contribution after mid-
2012 The difference between the systemic contribution of European and US
banks fluctuates between 40 and 55
Figure 8 European US and Euro-area banksrsquo contribution to total systemic risk
(as a of total systemic risk)
Note US banksrsquo contribution is presented in secondary axis
54 Principal Component Analysis
We use PCA analysis in which the banksrsquo CDS spreads are decomposed into
orthogonal factors of decreasing explanatory power to identify the increased
000
500
1000
1500
2000
2500
000
1000
2000
3000
4000
5000
6000
7000
8000
Jan
-08
May
-08
Sep
-08
Jan
-09
May
-09
Sep
-09
Jan
-10
May
-10
Sep
-10
Jan
-11
May
-11
Sep
-11
Jan
-12
May
-12
Sep
-12
Jan
-13
May
-13
Sep
-13
Jan
-14
May
-14
Sep
-14
Jan
-15
May
-15
Sep
-15
Jan
-16
May
-16
Sep
-16
Jan
-17
May
-17
EU Euroarea US
29
commonality among the default risk of banks (see Muirhead 1982 for an
exposition of PCA)
Let 119884119905 be the log difference of bankrsquos i CDS i=1hellip77 let the systemrsquos
aggregate credit risk be represented by the sum 119884119878 = sum 119884119894119894 and let 119864[119884119894] = 120583119894
and Var[119877119894] = 1205901198942 Then we have
1205901199042 = sum sum 120590119894120590119895120550[119911119894119911119895]
119873
119895=1
119873
119894=1
where 119911119896 = (119877119896 minus 120583119896)120590119896 k=ij
where 119911119896 is the CDS of bank k and 1205901199042 is the variance of the system
PCA produces the decomposition of the variance-covariance matrix of CDS
spreads of the 77 banks contained in the sample into the orthogonal matrix of
loadings L (eigenvector of the correlation matrix of CDS spreads) and the
diagonal matrix of eigenvalues Λ
We focus on the first three eigenvalues as they explain most of the variation
in the system These three eigenvalues are supposed to explain a larger portion
of the total volatility in the system when the CDS spreads are moving together or
in other words when systemic risk in more unified So periods when the first
three components explain most of the total volatility indicates the existence of
increased interconnectedness among banks The first component that is
extracted accounts for the maximum amount of total variance in the observed
variables In other words the proportion of explained variance by the first
component shows how much of the variations in the CDS spreads can be
explained by one common factor This result is in line with Fontana and
Scheicher (2010) who finds there to be a single large determinant dominating
the variation in the CDS spread where the proportion of explained variance by
30
factor 1 exceeds 80 According to Billio et al (2012) during periods of distress
fewer components explain larger part of the volatility which means that the
fluctuation of the first principal component while taking into account the
predictive power that CDS carry reveal periods of increased systemic risk
We run rolling window analysis where the length of the window is 200 days
and the step is 100 days over the period January 2008 to June 2017 and the
results indicate the existence of a single dominant component that determines
the fluctuations of CDS spreads (Figure 9)
Figure 9 Rolling Principal Components analysis
Note The length of the window is 200 days and the step is 100 days
Investigating the determinants of the loadings of each bank to the first
principal component through rolling cross-sectional analysis will reveal the
driving forces of systemic risk on a yearly basis over the period 2008-2016 For
that reason we use rolling cross-sectional analysis
0
10
20
30
40
50
60
Jan
-08
Jun
-08
No
v-0
8
Ap
r-0
9
Sep
-09
Feb
-10
Jul-
10
Dec
-10
May
-11
Oct
-11
Mar
-12
Au
g-1
2
Jan
-13
Jun
-13
No
v-1
3
Ap
r-1
4
Sep
-14
Feb
-15
Jul-
15
Dec
-15
May
-16
Oct
-16
comp1 comp2 comp3
31
ii
iiiiiii
Debt
SurplusGDPNIINPLsLoansAssetsay
7
654321
yi is each bankrsquos loading to the first component
We search among the following bank-specific characteristics total value of
bank assets (logs) retail orientation the total loanstotal assets (levels) NPLs
total loans (levels) and non-interest income total revenue and among the
following home-country specific characteristics GDP growth primary
surplusGDP (levels) public debtGDP (levels) We manage to match 47 banks to
bank-specific characteristics
Table 13 Determinants of each bankrsquos loadings in the first component over the nine
periods
2008 2009 2010 2011 2012 2013 2014 2015 2016
Size -0012 -0002 -0007 -0012 0001 0004 0001 -0002 -0003
(0008) (0007) (0006) (0006) (0007) (0006) (0010) (0008) (0009)
Loan-to-assets -0048 -0142 -0113 -0136 -0135 -0114 -0212 -0210 -0239
(0043) (0051) (0051) (0051) (0054) (0051) (0078) (0069) (0074)
NPLs 0844 0414 0352 0035 0004 -0097 0333 0304 0194
(0349) (0253) (0187) (0183) (0054) (0139) (0187) (0147) (0174)
Non-interest-income 0000 0000 0001 0000 0001 0000 0001 0000 0000
(0000) (0000) (0006) (0006) (0000) (0000) (0000) (0000) (0000)
GDP -0004 -0003 -0006 -0003 -0009 -0009 -0011 -0004 -0007
(0004) (0002) (0001) (0003) (0054) (0003) (0005) (0001) (0006)
Primary SurplusGDP 0000 -0002 0002 0000 -0002 -0004 -0009 -0014 -0012
(0002) (0001) (0001) (0170) (0054) (0003) (0004) (0004) (0005)
DebtGDP -0001 -00005 -00006 -0001 -00007 -00005 -00005 0000 -0000
(0000) (0000) (0000) (0000) (0054) (0000) (0000) (0000) (0000)
_cons 0300 0235 0297 0372 0248 0229 0252 0283 0323
(0080) (0076) (0068) (0078) (0054) (0072) (0111) (0094) (0107)
Note 1 510
32
6 Conclusions
Macroprudential policy is still in its infancy Much work is still needed on
developing good and timely analysis effective policy instrument tools and
effective implementation Our paper makes a contribution on the dimension of
analysis and measurement The key aim of macroprudential policy is to address
externalities and spillovers among financial institutions in an effort to safeguard
financial stability These interactions are complex We provide a tool for
clarifying and quantifying these interactions Our measures can guide
appropriate macroprudential policies that aim to internalize these externalities
A key conclusion from our study is that the focus on size does not adequately
address the systemic importance of banks
33
References
Acharya V Engle R Richardson M 2012 Capital Shortfall A New Approach to
Ranking and Regulating Systemic Risks American Economic Review Vol102 No
3
Acharya V Pedersen L Philippon T Richardson M 2010 Measuring systemic
risk Technical Report Department of Finance NYU
Acharya V Drechsler I Schnabl P 2014 A Pyrrhic Victory Bank Bailouts and
Sovereign Credit Risk Journal of Finance 2014 vol 69 issue 6 2689-2739
Adams Z Fuss R Gropp R 2014 Spillover Effects among Financial
Institutions A State-Dependent Sensitivity Value-at-Risk (SDSVaR) Approach
Journal of Financial and Quantitative Analysis (JFQA) Vol 49 No 3
Adrian T Brunnermeier M 2009 CoVaR Manuscript Princeton University
Aizenman J Hutchison H and JinjarakY (2013) lsquoWhat is the Risk of European
Sovereign Debt Defaults Fiscal Space CDS Spreads and Market Pricing of Riskrsquo
Journal of International Money and Finance 34 37-59
Allen F A Babus and E Carletti (2012) Asset commonality debt maturity and
systemic risk Journal of Financial Economics 104(3) 519ndash534
Alter A Beyer A 2013 The dynamics of spillover effects during the European
sovereign debt turmoil Journal of Banking and Finance 42 134-153
Altunbas Y Manganelli S Marques-Ibanez D 2011 Bank risk during the
financial crisis Do business models matter ECB Working Paper No 1394
Ang A Longstaff F 2011 Systemic sovereign credit risk Lessons from the US
and Europe NBER discussion paper 16983
Ayadi R Arbak E De Groen W 2011 Business Models in European Banking A
pre-and post-crisis screening CEPS Paperbacks
34
Banbura M Giannone D Reichlin L 2011 Nowcasting Oxford Handbook on
Economic Forecasting ed by M P Clements and D F Hendry pp 63ndash90 Oxford
University Press
Bank for Internaional Settlements 2010 Guidance for national authorities
operating the countercyclical capital buffer
Bank for Internaional Settlements 2011 Global systemically important banks
Assessment methodology and the additional loss absorbency requirement
Basel Committee on Banking Supervision 2010 Basel III A global regulatory
framework for more resilient banks and banking systems Bank for International
Settlements
Basu S Das S Michailidis G Purnanandam A 2017 A system-wide approach
to measure connectivity in the financial sector Unpublished
Benoit S Colliard J-E Hurlin C Perignon C 2015 Where the risks lie A
survey on systemic risk Unpublished working paper
Billio M Getmansky M Lo A W Pelizzon L 2012 Econometric measures of
systemic risk in the finance and insurance sectors Journal of Financial
Economics 104 535ndash559
Brownlees CT Engle RF 2010 Volatility correlation and tails for systemic
risk measurement Manuscript Stern School of Business New York University
Canova F and Pappa P 2007 Price Differentials in Monetary Unions The Role
of Fiscal Shocks Economic Journal 117 2007 713-737
Castro C Ferrari S 2014 Measuring and testing for the systemically important financial institutions Journal of Empirical Finance 2014 vol 25 issue C 1-14 Cerutti E Claessens S Laeven L 2015 The Use and Effectiveness of
Macroprudential Policies New Evidence IMF Working Paper No 1561
Crockett A 2000 Marrying the Micro- and Macro-prudential Dimensions of
Financial Stability Eleventh International Conference of Banking Supervisors
held in Basel 20-21
35
De Santis R (2012) ldquoThe euro area sovereign debt crisis Safe haven credit
rating agencies and the spread of the fever from Greece Ireland and Portugalrdquo
ECB Working Paper 1419
DellrsquoAriccia G Igan D Laeven L Tong H Bakker B Vandenbussche J 2012
Policies for Macrofinancial Stability How to Deal with Credit Booms IMF Staff
Discussion Note 1206
Demirer M Diebold F Liu L Yilmaz K 2017 Estimating global bank network
connectedness Journal of Applied Eeconometrics forthcoming
Diebold F X Yilmaz K 2009 Measuring Financial Asset Return and Volatility
Spillovers with Application to Global Equity Markets The Economic Journal
119(534) 158-171
Diebold F X Yilmaz K 2012 Better to give than to receive Predictive
directional measurement of volatility spillovers International Journal of
Forecasting Issue 28 pp 57-66
Doan T Litterman R Sims CA 1984 Forecasting and Conditional Projections
Using Realistic Prior Distributions Econometric Reviews 3(4) 1ndash 100
Elliott D J Feldberg G Lehnert A 2013 The History of Cyclical
Macroprudential Policy in the United States Office of Financial Research
Working Paper No 8
European Central Bank 2016 Macroprudential Bulletin Issue 12016
Financial Stability Board 2011 Measures to address systemically important
financial institutions
Fontana A Scheicher M 2010 An analyisis of euro area sovereign CDS and
their relation with government bonds ECB Working Paper Series Issue 1271
Fostel A Geanakoplos J 2008 Leverage Cycles and the Anxious Economy
American Economic Review 98 (4) 1211ndash1244 [2196]
36
Geanakoplos J Pedersen L H 2014 Monitoring leverage In Brunnermeier M
K Krishnamurthy A (Eds) Risk Topography Systemic Risk and Macro
Modeling NBER pp 175ndash182
Giannone D Lenza M Primiceri GE 2012 Prior Selection for Vector
Autoregressions CEPR Discussion Papers 8755 CEPR Discussion Papers
Giglio S Kelly B T Pruitt S 2015 Systemic risk and the macroeconomy An
empirical evaluation Journal of Financial Economics 2016 vol 119 issue 3 457-
471
Goacutemez-Puig M amp Sosvilla-Rivero S (2014) EMU sovereign debt markets crisis
Fundamental-based or pure contagion Institut de Recerca en Economia
Aplicada (IREA) Working Papers Universitat de Barcelona 201402
Huang X Zhou H Zhu H 2012 Systemic Risk Contributions Journal of
Financial Services Research 2012 vol 42 issue 1 55-83
International Monetary Fund 2013a The Interaction of Monetary and
Macroprudential Policies Washington International Monetary Fund
International Monetary Fund 2015a Financial Operations
Koumlhler M 2013 Does non-interest income make banks more risky Retail-
versus investment oriented banks Deutsche Bundesbank Discussion Paper
No172013
Koop G Korobilis D 2010 Bayesian Multivariate Time Series Methods for
Empirical Macroeconomics Foundations and Trends in Econometrics Vol 3 No
4 pp 267-358
Litterman Robert B 1979 Techniques of forecasting using vector
autoregressions Research Department Working Paper 115 Federal Reserve
Bank of Minneapolis Minnesota
37
Longstaff F Pan J Pedersen L Singleton K 201 How Sovereign Is Sovereign
Credit Risk American Economic Journal Macroeconomics 2011 vol 3 issue 2
75-103
Pesaran H Shin Y 1998 Generalized impulse response analysis in linear
mulitvariate models Economic Letters 58(1) 17-29
White H Kim TH Manganelli S 2008 Modeling autoregressive conditional
skewness and kurtosis with multi-quantile CAViaR In Russell J Watson M
(Eds) Volatility and Time Series Econometrics A Festschrift in Honor of Robert
F Engle
Part B
We study 77 banks from 26 developed and emerging economies Data are downloaded from Thomson-Reuters and cover the period from January 1st 2008 to June 30th 2017 The first sample contains 77 banks are from 19 developed economies while the rest are from 6 emerging economies (as of IMFrsquos list) The sample contains most of the banks that are designated as ldquoglobal systemically important banksrdquo (ldquoGSIBrsquosrdquo) as designated by the Basel Committee on Banking Supervision except for three Chinese banks (Agricultural Bank of China Bank of China and Industrial and Commercial Bank of China) and one French bank Group BPCE 43 out of the 77 banks (544) in the sample are from Europe while 28 of them (3544) are headquartered in Eurozone members The sample is extended by adding 19 smaller European banks
B Sample Presentation Bank Details Descriptive Statistics Tables 2a and b presents the 77 banks in the sample in the worldrsquos top 150 as they ordered by assets (Q4 2016) Table A3 presents the share of assets that each home-country holds in the sample as well as the share of assets per developed and emerging countries while Table A4 presents the share of assets per region Table A5 presents the 14 European banks that are added to the initial sample
Table 2a Banks ordered by Total Assets (in US $ billion)
Rank Bank Name Country Total assets
38
US$B
1 Bank of China China 2613 2 Mitsubishi UFJ Financial Group Japan 2597 3 JPMorgan Chase amp Co USA 2490 4 HSBC Holdings UK 2374 5 BNP Paribas France 2196
6 Bank of America USA 2187 7 Wells Fargo USA 1930 8 China Development Bank China 1904 9 Credit Agricole Group France 1821 10 Citigroup USA 1792
11 Mizuho Financial Group Japan 1757 12 Deutsche Bank Germany 1682 13 Sumitomo Mitsui Financial Group Japan 1654 14 Barclays PLC UK 1490 15 Societe Generale France 1461
16 Banco Santander Spain 1416 17 Lloyds Banking Group UK 1004 18 Norinchukin Bank Japan 984 19 Royal Bank of Scotland Group UK 981 20 UBS Group AG Switzerland 919
21 Unicredit SpA Italy 908 22 ING Groep NV Netherlands 893 23 Goldman Sachs Group USA 860 24 Morgan Stanley USA 814 25 Credit Suisse Group Switzerland 806
Table 2a ndash Continued from previous page
26 BBVA Spain 773 27 Intesa Sanpaolo Italy 766 28 Commonwealth Bank of Australia Australia 703 29 Rabobank Group Netherlands 700 30 Australia amp New Zealand Banking Group Australia 661
31 Nordea Sweden 651 32 Standard Chartered Plc UK 646 33 Westpac Banking Corp Australia 607 34 National Australia Bank Australia 562 35 Commerzbank Germany 549
36 Danske Denmark 495 37 State bank of India India 492 38 US Bancorp USA 445 39 The Export-Import Bank of China China 427 40 Sberbank of Russia Russia 420
41 Resona Japan 412 42 Sumitomo Mitsui TH Japan 406 43 Nomura Holdings Japan 370 44 PNC Financial Services USA 366 45 Capital One Financial Corporation USA 357
46 DBS Group Holdings Singapore 332 47 Shinhan Financial Group South Korea 328 48 KBC Group NV Belgium 291 49 Svenska Handelsbanken Sweden 289 50 Skandinaviska Enskilda Banken Sweden 289
51 Hana Financial Group South Korea 288 52 Nationwide Building Society UK 276 53 Korea Development Bank South Korea 268
39
54 Woori Bank South Korea 257 55 Landesbank Baden-Wurttemberg Germany 257
56 Cathay Financial Holding Taiwan 252 57 Swedbank Sweden 237 58 United Overseas Bank (UOB) Singapore 235 59 Dexia Belgium 225 60 Banco Sabadell Spain 224
61 Bayerische Landesbank Germany 224 62 Erste Group Bank AG Austria 220 63 Banco Popular Espanol Spain 204 64 Industrial Bank of Korea South Korea 196 65 Bank of Ireland Ireland 182
66 Malayan Malaysia 161 67 Standard Bank Group South Africa 161 68 Banca Monte dei Paschi di Siena Italy 161 69 American Express USA 158 70 National Bank of Greece Greece 153 71 Macquarie USA 143
72 Credit Lyonnais France 120 73 Comercial Portuguese Portuguese 113 74 Banco Espirito Santo Portugal 112 75 Turkiye is bankasi Turkey 112 76 Mediobanca Italy 95
77 Landesbank Hessen Germany 92
Table 2b Banks ordered by Country
Rank Bank Country Total assets
US$B
1 Commonwealth Bank of Australia Australia 703 2 Australia amp New Zealand Banking Group Australia 661 3 Westpac Banking Corp Australia 607 4 National Australia Bank Australia 562
5 Erste Group Bank AG Austria 220
6 KBC Group NV Belgium 291 7 Dexia Belgium 225
8 Bank of China China 2613 9 China Development Bank China 1904
10 The Export-Import Bank of China China 427
11 Danske Denmark 495
12 BNP Paribas France 2196 13 Credit Agricole Group France 1821 14 Societe Generale France 1461 15 Credit Lyonnais France 120
16 Deutsche Bank Germany 1682 17 Commerzbank Germany 549 18 Landesbank Baden-Wurttemberg Germany 257 19 Bayerische Landesbank Germany 224 20 Landesbank Hessen Germany 92
21 National Bank of Greece Greece 153
22 State bank of India India 492
23 Bank of Ireland Ireland 182
24 Unicredit SpA Italy 908 25 Intesa Sanpaolo Italy 766
40
26 Banca Monte dei Paschi di Siena Italy 161 27 Mediobanca Italy 95
28 Mitsubishi UFJ Financial Group Japan 2597 29 Mizuho Financial Group Japan 1757 30 Sumitomo Mitsui Financial Group Japan 1654 31 Norinchukin Bank Japan 984 32 Resona Japan 412 33 Sumitomo Mitsui TH Japan 406 34 Nomura Holdings Japan 370 35 Yamaguchi Financial Group Japan 93
36 ING Groep NV Netherlands 893 37 Rabobank Group Netherlands 700
38 Banco Espirito Santo Portugal 111
39 Sberbank of Russia Russia 420
40 DBS Group Holdings Singapore 332 41 United Overseas Bank (UOB) Singapore 235 42 Standard Bank Group South Africa 161
43 Shinhan Financial Group South Korea 328 44 Hana Financial Group South Korea 288 45 Korea Development Bank South Korea 268 46 Woori Bank South Korea 257 47 Industrial Bank of Korea South Korea 196
48 Banco Santander Spain 1416 49 BBVA Spain 773 50 Banco Sabadell Spain 224 51 Banco Popular Espanol Spain 204
Table 2b ndash Continued from previous page
53 Nordea Sweden 651 54 Svenska Handelsbanken Sweden 289 55 Skandinaviska Enskilda Banken Sweden 289 56 Swedbank Sweden 237
57 UBS Group AG Switzerland 919 58 Credit Suisse Group Switzerland 806
59 Cathay Financial Holding Taiwan 252
60 Turkiye is bankasi Turkey 112
61 HSBC Holdings UK 2374 62 Barclays PLC UK 1490 63 Lloyds Banking Group UK 1004 64 Royal Bank of Scotland Group UK 981 65 Standard Chartered Plc UK 646 66 Nationwide Building Society UK 276
68 JPMorgan Chase amp Co USA 2490 69 Bank of America USA 2187 70 Wells Fargo USA 1930 71 Citigroup USA 1792 72 Goldman Sachs Group USA 860 73 Morgan Stanley USA 814 74 US Bancorp USA 445 75 PNC Financial Services USA 366 76 Capital One Financial Corporation USA 357 77 American Express USA 158 78 Macquarie USA 143
41
Table 3a Banksrsquo home-countries ordered by the sum of total bank assets
Developed Total Assets Developing Total Assets USA 11547 China 4944 Japan 7867 India 492 UK 6936 Russia 420 France 5599 Taiwan 252 Germany 2994 South Africa 161 Spain 2617 Turkey 112
Australia 2534 Italy 1933 Switzerland 1725
Netherlands 1584 Sweden 1467 South Korea 1340 Singapore 568 Belgium 516 Denmark 495 Ireland 344 Austria 220 Greece 153 Portugal 111 Total Assets of banks that are headquartered in
Developed 5055366 Emerging 63823 of total assets 888 of total assets 112
42
Table 3b Regional details
Region Number of Banks Total bank
assets of total
assets
Europe 40 2669673 473
Asia 21 1557658 275
N America 11 1154724 204
Oceania 4 2534 45
Africa 1 161 03
B Data Definitions and Descriptive Statistics
Table 4 Data Definitions
Variable Description
Endogenous CDS CDS 5-year spread
Exogenous Systemic risk
CDX The family of CDS indeces covering North America
VIX The volatiliy index of SampP 500
US 3-month T Bill The short-term obligation backed by the Treasury Dept of the US goverment
Bank-specific Size Total assets
Retail orientation Total Loans Total assets
Diversification Non-interest income Total revenues
NPLs Non-performing loans Total Loans
Country-specific
GDP Each bankrsquos home-country GDP growth
Budget Balance Current AccountGDP
Public Debt Public DebtGDP
43
Table 5 Descriptive Statistics
Panel A Systemic risk factor
CDX VIX TED
Mean 269E-06 -0000123 -000121 Median 0000 -0001 0000 Maximum 0020 0176 0250 Minimum -0009 -0152 -0750
Std Dev 0001 0031 0033 Skewness 4689 0689 -17326
Kurtosis 106047 6789 377496 Jarque-Bera 1105896 1679364 14610377 Probability 0000 0000 0000
Sum 0007 -0304 -3000 Sum Sq Dev 0003 2427 2746
Note CDX and VIX are in log differences TED spread is in first differences
Panel B Bank specific
Assets Loans_to_Assets Non_Interest_Inc NPLs
Mean 732382 55596 2442 4601
Median 458009 59921 2378 2411
Maximum 3030645 8664 8640 35217
44
Minimum 4354387 9070 -5962 01082
Std Dev 7460013 17017 1481 5612
Skewness 1081 -0641 -0694 2376
Kurtosis 30129 2584 6193 9630
Jarque-Bera 7023 272888 182117 999501
Probability 0000 0000 0000 0000
Sum 264E+09 2003702 8803746 1658430 Sum Sq Dev 201E+15 1043392 7908036 1134867
Note Data are in levels
Part C ndash Global Sample
Table 7 Individual systemic importance
Panel A ndash Ranked by total score Rank by score
Rank by bank assets Bank Name
Home-Country Region
Assets (billion
US $) Score
To others (Aggr)
From others (Aggr)
1 27 Intesa Sanpaolo Italy Europe 766 1056 0505 0551
2 16 Banco Santander Spain Europe 1416 1038 0464 0574
3 26 BBVA Spain Europe 773 0987 0454 0533
4 5 BNP Paribas France Europe 2196 0982 0445 0537
5 21 Unicredit SpA Italy Europe 908 0975 0489 0485
6 14 Barclays PLC UK Europe 1490 0961 0454 0507
7 12 Deutsche Bank Germany Europe 1682 0954 0428 0526
8 9 Credit Agricole Group France Europe 1821 0942 0424 0518
9 15 Societe Generale France Europe 1461 0940 0427 0512
10 72 Credit Lyonnais France Europe 120 0938 0445 0493
11 17 Lloyds Banking Group UK Europe 1004 0925 0438 0487
12 25 Credit Suisse Group Switz Europe 806 0907 0376 0531
13 35 Commerzbank Germany Europe 549 0904 0410 0494
14 20 UBS Group AG Switz Europe 919 0890 0387 0503
15 32 Standard Chartered Plc UK Europe 646 0870 0419 0451
16 68 Banca Monte dei Paschi Italy Europe 161 0861 0429 0433
45
17 19
Royal Bank of Scotland Group
UK Europe 981 0845 0423 0423
18 29 Rabobank Group Netherl Europe 700 0841 0376 0465
19 22 ING Groep NV Netherl Europe 893 0823 0374 0449
20 76 Mediobanca Italy Europe 95 0821 0389 0433
21 24 Morgan Stanley USA N Amer 814 0752 0315 0437
22 69 American Express USA N Amer 158 0736 0332 0404
23 6 Bank of America USA N Amer 2187 0716 0318 0398
24 23 Goldman Sachs Group USA N Amer 860 0711 0302 0410
25 10 Citigroup USA N Amer 1792 0706 0313 0393
26 4 HSBC Holdings UK Europe 2374 0695 0372 0323
27 62 Erste Group Bank AG Austria Europe 220 0688 0314 0375
28 49 Svenska Handelsbanken Sweden Europe 289 0678 0281 0397
29 53
Korea Development Bank
S Korea Asia 268 0677 0393 0284
30 60 Banco Sabadell Spain Europe 224 0670 0295 0375
31 36 Danske Denmark Europe 495 0663 0296 0367
32 45
Capital One Financial Corp
USA N Amer 357 0662 0260 0401
33 3 JPMorgan Chase amp Co USA N Amer 2490 0658 0257 0401
34 7 Wells Fargo USA N Amer 1930 0653 0259 0394
35 34 National Australia Bank Australia Oceania 562 0622 0376 0247
Table continued on next page
Table 3- Panel A continued from previous page
36 2 Mitsubishi UFJ Financial Japan Asia 2597 0621 0223 0398
37 47 Shinhan Financial Group S Korea Asia 328 0615 0331 0283
38 54 Woori Bank S Korea Asia 257 0612 0333 0278
39 64 Industrial Bank of Korea S Korea Asia 196 0603 0341 0261
40 28 Commonwealth Bank Australia Oceania 703 0599 0388 0211
41 40 Sberbank of Russia Russia Europe 420 0598 0294 0305
42 30 Australia amp N Zealand Australia Oceania 661 0597 0383 0214
43 50 Skandinaviska Enskilda Sweden Europe 289 0578 0262 0316
44 31 Nordea Sweden Europe 651 0574 0289 0285
45 71 Macquarie USA N Amer 143 0572 0321 0251
46 48 KBC Group NV Belgium Europe 291 0568 0241 0327
47 63 Banco Popular Espanol Spain Europe 204 0558 0297 0261
48 61 Bayerische Landesbank Germany Europe 224 0552 0249 0303
49 39 The Export-Import Bank China Asia 427 0548 0284 0264
50 1 Bank of China China Asia 2613 0548 0276 0272
51 66 Malayan Malaysia Asia 171 0543 0321 0223
52 33 Westpac Banking Corp Australia Oceania 606 0540 0374 0166
53 37 State bank of India India Asia 492 0530 0238 0291
54 51 Hana Financial Group S Korea Asia 288 0518 0290 0227
55 57 Swedbank Sweden Europe 237 0486 0253 0233
56 8 China Development Bank China Asia 1904 0468 0260 0208
46
57 52 Nationwide Building Society UK Europe 276 0463 0217 0246
58 59 Dexia Belgium Europe 225 0409 0197 0212
59 46 DBS Group Holdings Singapore Asia 332 0397 0212 0186
60 65 Bank of Ireland Ireland Europe 182 0379 0197 0182
61 58 United Overseas Bank Singapore Asia 235 0373 0214 0159
62 11 Mizuho Financial Group Japan Asia 1757 0367 0271 0096
63 67 Standard Bank Group S Africa Africa 161 0365 0123 0242
64 74 Espirito Santos Portugal Europe 112 0362 0186 0176
65 41 Resona Japan Asia 412 0357 0263 0094
66 13 Sumitomo Mitsui Financial Japan Asia 1654 0355 0250 0104
67 38 US Bancorp USA N Amer 445 0353 0188 0165
68 55 Landesbank Baden-Wurtt Germany Europe 257 0340 0170 0171
69 42 Sumitomo Mitsui TH Japan Asia 406 0323 0273 0050
70 56 Cathay Financial Holding Taiwan Asia 252 0298 0189 0109
71 73 Comercial Portuguese Portugal Europe 113 0279 0268 0011
72 70 National Bank of Greece Greece Europe 153 0220 0176 0044
73 18 Norinchukin Bank Japan Asia 984 0215 0164 0050
74 43 Nomura Holdings Japan Asia 370 0197 0161 0035
75 77 Landesbank Hessen Germany Europe 92 0159 0089 0071
76 44 PNC Financial Services USA N Amer 366 0078 0034 0043
77 75 Turkiye is bankasi Turkey Europe 112 0037 0030 0007
Note Results concern the period January 2008 ndash June 2017 and are of daily frequency
Table 9 Systemic contribution per bank (January 2008 ndash June 2017)
Rank Bank Name SC Rank Bank Name SC Rank Bank Name SC Rank Bank Name SC
1 Intesa Sanpaolo
225 21 Morgan Stanley 160 41 Sberbank of Russia
128 61 United Overseas
080
2 Banco Santander
221 22 American Express
157 42 Australia amp N Zealand
127 62 Mizuho Financial
078
3 BBVA 210 23 Bank of America
153 43 Skandinaviska Enskilda
123 63 Standard Bank Group
078
4 BNP Paribas 209 24 Goldman Sachs Group
152 44 Nordea 122 64 Espirito Santos
077
5 Unicredit SpA
208 25 Citigroup 151 45 Macquarie 122 65 Resona 076
6 Barclays PLC 205 26 HSBC Holdings 148 46 KBC Group NV
121 66 Sumitomo Mitsui
076
7 Deutsche Bank
203 27 Erste Group 147 47 Banco Popular
119 67 US Bancorp
075
8 Credit Agricole
201 28 Svenska 145 48 Bayerische Landesbank
118 68 Landesbank 072
9 Societe Generale
200 29 Korea Development Bank
144 49 The Export-Import
117 69 Sumitomo Mitsui TH
069
10 Credit Lyonnais
200 30 Banco Sabadell 143 50 Bank of China 117 70 Cathay Financial
064
11 Lloyds Banking
197 31 Danske 141 51 Malayan 116 71 Comercial Portuguese
059
47
12 Credit Suisse Group
193 32 Capital One Financial Corp
141 52 Westpac Banking Corp
115 72 NBG 047
13 Commerzbank 193 33 JPMorgan Chase amp Co
140 53 State bank of India
113 73 Norinchukin Bank
046
14 UBS Group AG 190 34 Wells Fargo 139 54 Hana Financial Group
110 74 Nomura Holdings
042
15 Standard Chartered
186 35 National Australia Bank
133 55 Swedbank 104 75 Landesbank Hessen
034
16 Banca Monte dei
184 36 Mitsubishi UFJ Financial
132 56 China Development
100 76 PNC Financial Services
017
17 RBS 180 37 Shinhan Financial Group
131 57 Nationwide Building
099 77 Turkiye is bankasi
008
18 Rabobank Group
179 38 Woori Bank 130 58 Dexia 087
19 ING Groep NV 175 39 Industrial Bank of Korea
129 59 DBS Group Holdings
085
20 Mediobanca 175 40 Commonwealth Bank
128 60 Bank of Ireland
081
15
where yt for t = 1 T is an M x 1 vector containing observations on M time series
variables εt is an M x 1 vector of errors α0 is an M x 1 vector of intercepts and Aj
is an M x M matrix of coefficients We assume εt to be iid N (0 Σ) Exogenous
variables are added to the VAR and included in all the derivations below but we
do not do so to keep the notation as simple as possible
422 The connectedness matrix framework
The construction of the diagnostic tool is based on a medium-size Bayesian
vector autoregressive model with exogenous variables (Bayesian VARX) that
accounts for common global and regional trends and is able to include even
bank-specific characteristics Then similar as the framework described by
Diebold and Yilmaz (2009 2012) and the one described by Alter and Beyer
(2013) we construct the spillover matrix in order to capture any potential
spillovers among banks This methodology relies on Generalized Forecast Error
Variance Decomposition (GFEVD) or on Generalized Impulse Response
Functions (GIRF) obtained as shown in Pesaran and Shin (1998) Therefore we
derive Generalized Impulse Response Functions as functions of residuals
together with the interdependent coefficients According to Alter and Beyer
(2012) it is of low importance which methodology we select since they produce
qualitatively similar results
16
Table 6 Contagionconnectedness matrix
Note Variables in the first column are the impulse origin while variables on the top row are the respondents to the shock The cumulative impact is bound between 0 and 1 A value of 05 means that the response variable would be impacted in the same direction with an intensity of 50 the initial unexpected shock in the impulse variable The last column presents the aggregated impact sent (Sum OUT) by each row variable and on the bottom row the aggregated spillover received (Sum IN) by each column variable The bottom-right cell shows total spillover in the system and by dividing this value to the total number of non-diagonal cells we obtain the connectedness index (CI)
In table 2 row variables are the origin of the unexpected shock Column
variables are the respondents of contagion receivers CI represents the
connectedness index calculated as the average response in the contagion matrix
The potential contagion effects are aggregated on each line and column and
represent the total to_others and the total from_others as potential contributions
to contagion from and to each bank The main diagonal values represent the
effect of a variablersquos shock on itself and they are excluded from any calculations
The possible contagion effects answer the question ldquoHow would bank B evolve in
the following period if bank A CDS increases by one unit shockrdquo
We use accumulated Impulse Response functions over a 10-step horizon (10-
days) Not all the banks respond to the shocks within the same period but the
majority of the shocks are absorbed within 10-days Nevertheless the
framework is flexible and it easily adapts to the needs of each study
5 Empirical results
17
51 Individual bank connectedness
We estimate the connectedness matrix as described in section 422 for the
whole sample period 1 January 2008 to 31 June 2017 and estimate the
individual bank connectedness (table 7) which reports several notable results
The evidence do not offer support to the argument that systemic importance of a
bank can be adequately captured by its size According to table 7 the bank that
creates the most systemic risk in the system is Intesa Sanpaolo a medium-sized
European bank that is ranked 27th in terms of total assets with total contagion
effects of 1056 which is further decomposed into 0505 vulnerability-score and
0551 externalities-score For instance the Intesa Sanpaolorsquos 0551 externalities
score implies that one-unit shock in Intesa Sanpaolo will have an impact of
551 to the system while the 0505 vulnerability score means that one-unit
shock to the market will affect Intesa Sanpaolo by 505 Among the top-20
most connected banks can also be found smaller banks like BBVA (3rd) Credit
Lyonnais (10th) Banca Monte dei Paschi (16th) and Mediobanca (20th) while the
largest bank in the sample is listed 50th in terms of systemic importance
The existing literature on the topic suggests that during crises periods large
banks behave differently than small or medium-sized banks (Laeven et al 2014)
This phenomenon could be partially attributed to some common characteristics
that are shared by large banks and are associated with higher levels of risk
namely the increased portion of market-based activities the reduced capital
adequacy the less stable funding and the higher organizational complexity
However it remains unidentified the bank-size threshold above or below which
these criteria are valid Results presented in table 8 provide a more narrow
response to the question whether systemic importance is related to size or not
18
Size per se is a determinant of systemic importance since when banks are
ranked by systemic importance the first quartile compiles the largest percentage
of total assets (34 of total assets) However when the sample is ranked by total
assets and not in terms of connectedness the first quartile represents 62 of
total assets indicating a severe leakage of assets to the other quartiles and
revealing the existence of structural variables that interact with size
The existing frameworks used by regulators and policy makers such as the
BCBSFSB framework rely heavily on size either through size-related indicators
or size per se to calculate the capital adequacy ratios Our results suggest that
the measures taking strong size-effect as granted should also focus on the large
banksrsquo idiosyncratic characteristics that place 50 of G-SIBs in the first quartile
of systemic importance
Table 8 Banks ranked by systemic importance and by assets ndash Number of banks per quartile
Quartile ranked by Number of G-SIBs per quartile
Score Assets
1st Quartile 34 62 48
2nd Quartile 33 224 28
3rd Quartile 18 105 10
4th Quartile 14 51 14
The next step is to calculate the systemic contribution of each bank in the
system as the ratio between the total individual contagion effects and the total
contagion in the system
100TC
TICTSC i
i
y
y
19
TSC is the total systemic contribution TIC is the total individual contagion
effects and TC is the total contagion in the system The bank with the highest
ranking contributes 225 of the total contagion effects while the bank at the
bottom of the table contributes almost 0 (table 9) This measure allows us to
compare the results among samples with different number of entities
We define each bankrsquos directional connectedness as the ratio between the
individual externalities and the total individual contagion
100
i
i
i
y
yOUT
yOUTTIC
IEID or
100
i
i
i
y
yIN
yINTIC
IVID
ID is the individual directionality IE is the individual externalities IV is the
individual vulnerabilities and TIC is total individual contagion The followings
should be always valid
1 ii yINyOUT IDID
ii yINyOUT IDID
In case iyOUTID is larger than 50 it means than the bank that the systemic score
of the bank it refers to is externalities-driven When breaking the results into
quartiles that represent the average individual directionality for all the banks
that belong in this quartile (table 10) we realize that banks with higher TIC tend
to have higher iyOUTID ratios (54) that their peers that belong in the last
quartile (30) We do not suggest that the directionality of contagion
determines the systemic importance of banks because this is beyond control and
difficult to interpret but that in terms of systemic importance that may be
20
interpreted into increased capital requirements is ldquobetter to receive shocks than
to send shocks to the systemrdquo
Table 10 Average Individual Directionality (OUT) per quartile
iyOUTID
1st Quartile 54
2nd Quartile 53
3rd Quartile 47
4th Quartile 30
Note banks are ranked by systemic importance
52 Regional network connectedness
Prior quantifying the transmission of contagion effects we focus on table 7
that reveals a very strong regional effect This is that the first quartile of systemic
importance is exclusively dominated by banks that are headquartered in Europe
implying the existence of a regional component and severe clustering Table 11a
shows the regional concentration per quartile and table 11b expresses the
regional concentration as a percentage of the total number of banks that exist
per region
Table 11a Concentration of banks per region
Quartile Europe Eurozone (as
of EU) N America Asia Oceania Africa
1st Quartile 100 75 - - - -
2nd Quartile 25 25 40 25 10 -
3rd Quartile 50 50 10 30 10 -
4th Quartile 35 75 12 48 - 5
Table 11b Regional concentration as a percentage of total banks per region
21
Quartile Europe N America Asia Oceania Africa
1st Quartile 47 - - - -
2nd Quartile 12 73 25 25 -
3rd Quartile 21 9 35 75 -
4th Quartile 16 18 40 - 100
The next step is to understand the flows of shocks among the different
regions the contagion effects and the degree of connectedness among the
different regions (Table 12a and b) We focus on four regions Europe North
America (expressed by US banks) Asia and Oceania Table 12a shows regionrsquos A
externalities to the other regions as a percentage of regionrsquos A total externalities
while table 12b focuses on the vulnerabilities side Combining the information
obtained by tables 12a and b European and US appear to be strongly
interconnected More precisely 58 of the aggregate shocks that are sent by US
banks are directed to Europe while 64 of the aggregate shocks received by US
banks are generated in Europe Also another important finding is that 69 of
the aggregate shocks that are sent by European banks remain within Europe
Table 12a Shocks sent per region as of total shocks sent per region
Asia Europe NAmerica Oceania
Sum
Asia 41 41 9 9
100
Europe 16 69 960 540
100
NAmerica 1950 58 16 650
100
Oceania 33 4450 950 12
100
22
Table 12b Shocks received per region as of total shocks received per region
Asia Europe NAmerica Oceania
Asia
28 10 13 21
Europe
54 75 64 59
NAmerica
12 12 20 13
Oceania
6 3 3 7
Sum
100 100 100 100
All in all it is obvious that there exists a regional factor that affects
significantly the bank connectedness However it is interesting to find out the
driving forces of this regional component especially in the case of Europe which
has been a special case due to the different transmission channels of the financial
crisis the highly interconnected banking system the feedback loops among
sovereigns and banks and the contagion from one country to the rest of Europe
53 National banking system connectedness
We approach the national banking system first of all by calculating the
average systemic risk per bank for each one of the countries in the sample
(Figure 2) Four out of the first five banks that contributed the most to the global
systemic risk belong to Eurozone French banks contributed the most to
systemic risk while Italy and Spain both of which suffered from banking
systems in distress followed at close range Banks in non-Euro-area countries
like Swiss and UK banks played an important role as well Surprisingly the
average contagion effects for German banks place them almost in the middle of
the table indicating that German banking system may acted as a stability factor
for the European region Both Portuguese and especially Greek banking system
appeared to be isolated from the global banking system
23
Figure 2 Average systemic risk per bank ndash Own shocks are excluded
Note results concern the period January 2008-June 2017
In figure 3 we approach the total contagion from a different perspective by
presenting the total contagion effects for each sovereign This approach may
depends on the number of banks per sovereign but illustrates that US-European
cluster dominates in terms of systemic importance
Figure 3 National systemic risk ndash Own shocks are excluded
Note results concern the period January 2008-June 2017
53 Rolling window
000
010
020
030
040
050
060
070
080
090
100
Fra
nce
Ital
y
Swit
z
Net
her
l
Spai
n
UK
Au
stri
a
Den
mar
k
S K
ore
a
USA
Ru
ssia
Au
stra
lia
Ger
man
y
Swed
en
Mal
aysi
a
Ind
ia
Ch
ina
Bel
giu
m
Sin
gap
ore
Irel
and
S A
fric
a
Jap
an
Po
rtu
gal
Tai
wan
Gre
ece
Tu
rkey
000
100
200
300
400
500
600
700
USA U
K
Fra
nce
Ital
y
Spai
n
S K
ore
a
Ger
man
y
Jap
an
Au
stra
lia
Swed
en
Swit
z
Net
her
l
Ch
ina
Bel
giu
m
Sin
gap
ore
Au
stri
a
Den
mar
k
Po
rtu
gal
Ru
ssia
Mal
aysi
a
Ind
ia
Irel
and
S A
fric
a
Tai
wan
Gre
ece
Tu
rkey
24
531 Individual Banks
In order to better understand the evolvement of systemic risk and how this
fluctuated over the whole period we use rolling-window analysis where the
length of the window is 340 days and the step is 150 days Figure 3 presents the
evolution of total contagion over time where strong co-movement and
interconnections among banks are obvious We also discriminate periods where
the cluster of TCI lines is shrinking and systemic risk is becoming more unified
which means that systemic and idiosyncratic shocks are propagated more
intensely via the network
Figure 3 Total Individual Contagion
Note The length of the window is 340 days and the step is 150 days
We introduce the range as a new metric of systemic risk unification Range at
each point in time is defined as the difference between the highest and the
lowest score in the system (Figure 4) The lowest the score the more unified the
000
020
040
060
080
100
120
Jan
-08
May
-08
Sep
-08
Jan
-09
May
-09
Sep
-09
Jan
-10
May
-10
Sep
-10
Jan
-11
May
-11
Sep
-11
Jan
-12
May
-12
Sep
-12
Jan
-13
May
-13
Sep
-13
Jan
-14
May
-14
Sep
-14
Jan
-15
May
-15
Sep
-15
Jan
-16
May
-16
Sep
-16
Jan
-17
May
-17
25
systemic risk is becoming Given the predictive power of CDS spreads this new
measure could be used by regulators and policymakers as an early-warning tool
However it remains an open question what is the threshold below which the
unification of systemic risk could consist a problem It is remarkable that the
most ldquolooserdquo links were observed during the post-Lehman collapse in late 2008
and reached its lowest price at the beginning of Greek crisis
Figure 4 Systemic risk range
Note The length of the window is 340 days and the step is 150 days
532 Global banking system
In this part we are interested in understanding the behavior of aggregate
contagion effects Total Systemic risk (TSR) is defined as the total of the off-
0
01
02
03
04
05
06
07
08
09
1
Jan
-08
May
-08
Sep
-08
Jan
-09
May
-09
Sep
-09
Jan
-10
May
-10
Sep
-10
Jan
-11
May
-11
Sep
-11
Jan
-12
May
-12
Sep
-12
Jan
-13
May
-13
Sep
-13
Jan
-14
May
-14
Sep
-14
Jan
-15
May
-15
Sep
-15
Jan
-16
May
-16
Sep
-16
Jan
-17
May
-17
26
diagonal entries in the connectedness matrix or as the sum of the ldquofromrdquo column
or ldquotordquo row measures total connectedness
N
ijji
H
ij
H IRTSR 1
We could plot a moving contagion measure defined as the sum of all IRFs ldquoto
others but we go one step further and we choose to present the Total Contagion
index (TCI) which is calculated as the average response per bank in the
connectedness matrix and is calculated as the sum of all non-diagonal cells
divided by the total number of entities
N
i j yy jiIR
NTCI
1 1
1
Cumulative IRs interval is [01] the index will be bound between 0 and 100
Higher contagion index implies a tightening of the nexus among banks (Figure
5)
Figure 5 Total Connectedness (TC)
Note The length of the window is 340 days and the step is 150 days
000
500
1000
1500
2000
2500
3000
3500
4000
4500
Jan
-08
May
-08
Sep
-08
Jan
-09
May
-09
Sep
-09
Jan
-10
May
-10
Sep
-10
Jan
-11
May
-11
Sep
-11
Jan
-12
May
-12
Sep
-12
Jan
-13
May
-13
Sep
-13
Jan
-14
May
-14
Sep
-14
Jan
-15
May
-15
Sep
-15
Jan
-16
May
-16
Sep
-16
Jan
-17
May
-17
27
Total connectedness reached its peak after Lehman collapse and was
severely affected by the developments in the European banking and sovereign
debt markets that shocked some EU member countries until mid-2012 The
Greek crisis and then the fact that in the early 2011 Italy and Spain joined the
countries with stressed banking systems pushed total connectedness upwards
After the early 2012 the actions taken by the ECB constrained total contagion
but after early 2015 higher political uncertainty following the outcomes of the
UK referendum on EU membership and the US election as well as market
concerns about euro area banksrsquo longer-term profitability prospects played their
role and contributed to the severe increase in the index At the same time
continued accommodative monetary policy in advanced economies and abating
market concerns about the possibility of a sharp slowdown in China have
dampened spikes in systemic stress Also a major concern for global markets
was the crisis in Deutsche Bank and its deep connections to global financial
institutions
From a policy perspective the most pressing issue for euro area financial
institutions remains the high level of NPLs which needs to be addressed The
resolution of systemic NPL problems will take time and requires a
comprehensive strategy involving coordination of all relevant stakeholders
533 Rolling Window ndash Regional Systemic Contribution (RSC)
We calculate the systemic contribution of each region as the ratio between
the total regional contagion effects and the total contagion in the system We
focus on Europe North America (US) and Euro-area since these regions
28
dominated in terms of systemic risk during the period Figure 8 compares the
systemic contribution of these regions Surprisingly the share of systemic risk
that European banks hold increased after 2014 while the contribution of US
banks remains increasingly lower than European banksrsquo contribution after mid-
2012 The difference between the systemic contribution of European and US
banks fluctuates between 40 and 55
Figure 8 European US and Euro-area banksrsquo contribution to total systemic risk
(as a of total systemic risk)
Note US banksrsquo contribution is presented in secondary axis
54 Principal Component Analysis
We use PCA analysis in which the banksrsquo CDS spreads are decomposed into
orthogonal factors of decreasing explanatory power to identify the increased
000
500
1000
1500
2000
2500
000
1000
2000
3000
4000
5000
6000
7000
8000
Jan
-08
May
-08
Sep
-08
Jan
-09
May
-09
Sep
-09
Jan
-10
May
-10
Sep
-10
Jan
-11
May
-11
Sep
-11
Jan
-12
May
-12
Sep
-12
Jan
-13
May
-13
Sep
-13
Jan
-14
May
-14
Sep
-14
Jan
-15
May
-15
Sep
-15
Jan
-16
May
-16
Sep
-16
Jan
-17
May
-17
EU Euroarea US
29
commonality among the default risk of banks (see Muirhead 1982 for an
exposition of PCA)
Let 119884119905 be the log difference of bankrsquos i CDS i=1hellip77 let the systemrsquos
aggregate credit risk be represented by the sum 119884119878 = sum 119884119894119894 and let 119864[119884119894] = 120583119894
and Var[119877119894] = 1205901198942 Then we have
1205901199042 = sum sum 120590119894120590119895120550[119911119894119911119895]
119873
119895=1
119873
119894=1
where 119911119896 = (119877119896 minus 120583119896)120590119896 k=ij
where 119911119896 is the CDS of bank k and 1205901199042 is the variance of the system
PCA produces the decomposition of the variance-covariance matrix of CDS
spreads of the 77 banks contained in the sample into the orthogonal matrix of
loadings L (eigenvector of the correlation matrix of CDS spreads) and the
diagonal matrix of eigenvalues Λ
We focus on the first three eigenvalues as they explain most of the variation
in the system These three eigenvalues are supposed to explain a larger portion
of the total volatility in the system when the CDS spreads are moving together or
in other words when systemic risk in more unified So periods when the first
three components explain most of the total volatility indicates the existence of
increased interconnectedness among banks The first component that is
extracted accounts for the maximum amount of total variance in the observed
variables In other words the proportion of explained variance by the first
component shows how much of the variations in the CDS spreads can be
explained by one common factor This result is in line with Fontana and
Scheicher (2010) who finds there to be a single large determinant dominating
the variation in the CDS spread where the proportion of explained variance by
30
factor 1 exceeds 80 According to Billio et al (2012) during periods of distress
fewer components explain larger part of the volatility which means that the
fluctuation of the first principal component while taking into account the
predictive power that CDS carry reveal periods of increased systemic risk
We run rolling window analysis where the length of the window is 200 days
and the step is 100 days over the period January 2008 to June 2017 and the
results indicate the existence of a single dominant component that determines
the fluctuations of CDS spreads (Figure 9)
Figure 9 Rolling Principal Components analysis
Note The length of the window is 200 days and the step is 100 days
Investigating the determinants of the loadings of each bank to the first
principal component through rolling cross-sectional analysis will reveal the
driving forces of systemic risk on a yearly basis over the period 2008-2016 For
that reason we use rolling cross-sectional analysis
0
10
20
30
40
50
60
Jan
-08
Jun
-08
No
v-0
8
Ap
r-0
9
Sep
-09
Feb
-10
Jul-
10
Dec
-10
May
-11
Oct
-11
Mar
-12
Au
g-1
2
Jan
-13
Jun
-13
No
v-1
3
Ap
r-1
4
Sep
-14
Feb
-15
Jul-
15
Dec
-15
May
-16
Oct
-16
comp1 comp2 comp3
31
ii
iiiiiii
Debt
SurplusGDPNIINPLsLoansAssetsay
7
654321
yi is each bankrsquos loading to the first component
We search among the following bank-specific characteristics total value of
bank assets (logs) retail orientation the total loanstotal assets (levels) NPLs
total loans (levels) and non-interest income total revenue and among the
following home-country specific characteristics GDP growth primary
surplusGDP (levels) public debtGDP (levels) We manage to match 47 banks to
bank-specific characteristics
Table 13 Determinants of each bankrsquos loadings in the first component over the nine
periods
2008 2009 2010 2011 2012 2013 2014 2015 2016
Size -0012 -0002 -0007 -0012 0001 0004 0001 -0002 -0003
(0008) (0007) (0006) (0006) (0007) (0006) (0010) (0008) (0009)
Loan-to-assets -0048 -0142 -0113 -0136 -0135 -0114 -0212 -0210 -0239
(0043) (0051) (0051) (0051) (0054) (0051) (0078) (0069) (0074)
NPLs 0844 0414 0352 0035 0004 -0097 0333 0304 0194
(0349) (0253) (0187) (0183) (0054) (0139) (0187) (0147) (0174)
Non-interest-income 0000 0000 0001 0000 0001 0000 0001 0000 0000
(0000) (0000) (0006) (0006) (0000) (0000) (0000) (0000) (0000)
GDP -0004 -0003 -0006 -0003 -0009 -0009 -0011 -0004 -0007
(0004) (0002) (0001) (0003) (0054) (0003) (0005) (0001) (0006)
Primary SurplusGDP 0000 -0002 0002 0000 -0002 -0004 -0009 -0014 -0012
(0002) (0001) (0001) (0170) (0054) (0003) (0004) (0004) (0005)
DebtGDP -0001 -00005 -00006 -0001 -00007 -00005 -00005 0000 -0000
(0000) (0000) (0000) (0000) (0054) (0000) (0000) (0000) (0000)
_cons 0300 0235 0297 0372 0248 0229 0252 0283 0323
(0080) (0076) (0068) (0078) (0054) (0072) (0111) (0094) (0107)
Note 1 510
32
6 Conclusions
Macroprudential policy is still in its infancy Much work is still needed on
developing good and timely analysis effective policy instrument tools and
effective implementation Our paper makes a contribution on the dimension of
analysis and measurement The key aim of macroprudential policy is to address
externalities and spillovers among financial institutions in an effort to safeguard
financial stability These interactions are complex We provide a tool for
clarifying and quantifying these interactions Our measures can guide
appropriate macroprudential policies that aim to internalize these externalities
A key conclusion from our study is that the focus on size does not adequately
address the systemic importance of banks
33
References
Acharya V Engle R Richardson M 2012 Capital Shortfall A New Approach to
Ranking and Regulating Systemic Risks American Economic Review Vol102 No
3
Acharya V Pedersen L Philippon T Richardson M 2010 Measuring systemic
risk Technical Report Department of Finance NYU
Acharya V Drechsler I Schnabl P 2014 A Pyrrhic Victory Bank Bailouts and
Sovereign Credit Risk Journal of Finance 2014 vol 69 issue 6 2689-2739
Adams Z Fuss R Gropp R 2014 Spillover Effects among Financial
Institutions A State-Dependent Sensitivity Value-at-Risk (SDSVaR) Approach
Journal of Financial and Quantitative Analysis (JFQA) Vol 49 No 3
Adrian T Brunnermeier M 2009 CoVaR Manuscript Princeton University
Aizenman J Hutchison H and JinjarakY (2013) lsquoWhat is the Risk of European
Sovereign Debt Defaults Fiscal Space CDS Spreads and Market Pricing of Riskrsquo
Journal of International Money and Finance 34 37-59
Allen F A Babus and E Carletti (2012) Asset commonality debt maturity and
systemic risk Journal of Financial Economics 104(3) 519ndash534
Alter A Beyer A 2013 The dynamics of spillover effects during the European
sovereign debt turmoil Journal of Banking and Finance 42 134-153
Altunbas Y Manganelli S Marques-Ibanez D 2011 Bank risk during the
financial crisis Do business models matter ECB Working Paper No 1394
Ang A Longstaff F 2011 Systemic sovereign credit risk Lessons from the US
and Europe NBER discussion paper 16983
Ayadi R Arbak E De Groen W 2011 Business Models in European Banking A
pre-and post-crisis screening CEPS Paperbacks
34
Banbura M Giannone D Reichlin L 2011 Nowcasting Oxford Handbook on
Economic Forecasting ed by M P Clements and D F Hendry pp 63ndash90 Oxford
University Press
Bank for Internaional Settlements 2010 Guidance for national authorities
operating the countercyclical capital buffer
Bank for Internaional Settlements 2011 Global systemically important banks
Assessment methodology and the additional loss absorbency requirement
Basel Committee on Banking Supervision 2010 Basel III A global regulatory
framework for more resilient banks and banking systems Bank for International
Settlements
Basu S Das S Michailidis G Purnanandam A 2017 A system-wide approach
to measure connectivity in the financial sector Unpublished
Benoit S Colliard J-E Hurlin C Perignon C 2015 Where the risks lie A
survey on systemic risk Unpublished working paper
Billio M Getmansky M Lo A W Pelizzon L 2012 Econometric measures of
systemic risk in the finance and insurance sectors Journal of Financial
Economics 104 535ndash559
Brownlees CT Engle RF 2010 Volatility correlation and tails for systemic
risk measurement Manuscript Stern School of Business New York University
Canova F and Pappa P 2007 Price Differentials in Monetary Unions The Role
of Fiscal Shocks Economic Journal 117 2007 713-737
Castro C Ferrari S 2014 Measuring and testing for the systemically important financial institutions Journal of Empirical Finance 2014 vol 25 issue C 1-14 Cerutti E Claessens S Laeven L 2015 The Use and Effectiveness of
Macroprudential Policies New Evidence IMF Working Paper No 1561
Crockett A 2000 Marrying the Micro- and Macro-prudential Dimensions of
Financial Stability Eleventh International Conference of Banking Supervisors
held in Basel 20-21
35
De Santis R (2012) ldquoThe euro area sovereign debt crisis Safe haven credit
rating agencies and the spread of the fever from Greece Ireland and Portugalrdquo
ECB Working Paper 1419
DellrsquoAriccia G Igan D Laeven L Tong H Bakker B Vandenbussche J 2012
Policies for Macrofinancial Stability How to Deal with Credit Booms IMF Staff
Discussion Note 1206
Demirer M Diebold F Liu L Yilmaz K 2017 Estimating global bank network
connectedness Journal of Applied Eeconometrics forthcoming
Diebold F X Yilmaz K 2009 Measuring Financial Asset Return and Volatility
Spillovers with Application to Global Equity Markets The Economic Journal
119(534) 158-171
Diebold F X Yilmaz K 2012 Better to give than to receive Predictive
directional measurement of volatility spillovers International Journal of
Forecasting Issue 28 pp 57-66
Doan T Litterman R Sims CA 1984 Forecasting and Conditional Projections
Using Realistic Prior Distributions Econometric Reviews 3(4) 1ndash 100
Elliott D J Feldberg G Lehnert A 2013 The History of Cyclical
Macroprudential Policy in the United States Office of Financial Research
Working Paper No 8
European Central Bank 2016 Macroprudential Bulletin Issue 12016
Financial Stability Board 2011 Measures to address systemically important
financial institutions
Fontana A Scheicher M 2010 An analyisis of euro area sovereign CDS and
their relation with government bonds ECB Working Paper Series Issue 1271
Fostel A Geanakoplos J 2008 Leverage Cycles and the Anxious Economy
American Economic Review 98 (4) 1211ndash1244 [2196]
36
Geanakoplos J Pedersen L H 2014 Monitoring leverage In Brunnermeier M
K Krishnamurthy A (Eds) Risk Topography Systemic Risk and Macro
Modeling NBER pp 175ndash182
Giannone D Lenza M Primiceri GE 2012 Prior Selection for Vector
Autoregressions CEPR Discussion Papers 8755 CEPR Discussion Papers
Giglio S Kelly B T Pruitt S 2015 Systemic risk and the macroeconomy An
empirical evaluation Journal of Financial Economics 2016 vol 119 issue 3 457-
471
Goacutemez-Puig M amp Sosvilla-Rivero S (2014) EMU sovereign debt markets crisis
Fundamental-based or pure contagion Institut de Recerca en Economia
Aplicada (IREA) Working Papers Universitat de Barcelona 201402
Huang X Zhou H Zhu H 2012 Systemic Risk Contributions Journal of
Financial Services Research 2012 vol 42 issue 1 55-83
International Monetary Fund 2013a The Interaction of Monetary and
Macroprudential Policies Washington International Monetary Fund
International Monetary Fund 2015a Financial Operations
Koumlhler M 2013 Does non-interest income make banks more risky Retail-
versus investment oriented banks Deutsche Bundesbank Discussion Paper
No172013
Koop G Korobilis D 2010 Bayesian Multivariate Time Series Methods for
Empirical Macroeconomics Foundations and Trends in Econometrics Vol 3 No
4 pp 267-358
Litterman Robert B 1979 Techniques of forecasting using vector
autoregressions Research Department Working Paper 115 Federal Reserve
Bank of Minneapolis Minnesota
37
Longstaff F Pan J Pedersen L Singleton K 201 How Sovereign Is Sovereign
Credit Risk American Economic Journal Macroeconomics 2011 vol 3 issue 2
75-103
Pesaran H Shin Y 1998 Generalized impulse response analysis in linear
mulitvariate models Economic Letters 58(1) 17-29
White H Kim TH Manganelli S 2008 Modeling autoregressive conditional
skewness and kurtosis with multi-quantile CAViaR In Russell J Watson M
(Eds) Volatility and Time Series Econometrics A Festschrift in Honor of Robert
F Engle
Part B
We study 77 banks from 26 developed and emerging economies Data are downloaded from Thomson-Reuters and cover the period from January 1st 2008 to June 30th 2017 The first sample contains 77 banks are from 19 developed economies while the rest are from 6 emerging economies (as of IMFrsquos list) The sample contains most of the banks that are designated as ldquoglobal systemically important banksrdquo (ldquoGSIBrsquosrdquo) as designated by the Basel Committee on Banking Supervision except for three Chinese banks (Agricultural Bank of China Bank of China and Industrial and Commercial Bank of China) and one French bank Group BPCE 43 out of the 77 banks (544) in the sample are from Europe while 28 of them (3544) are headquartered in Eurozone members The sample is extended by adding 19 smaller European banks
B Sample Presentation Bank Details Descriptive Statistics Tables 2a and b presents the 77 banks in the sample in the worldrsquos top 150 as they ordered by assets (Q4 2016) Table A3 presents the share of assets that each home-country holds in the sample as well as the share of assets per developed and emerging countries while Table A4 presents the share of assets per region Table A5 presents the 14 European banks that are added to the initial sample
Table 2a Banks ordered by Total Assets (in US $ billion)
Rank Bank Name Country Total assets
38
US$B
1 Bank of China China 2613 2 Mitsubishi UFJ Financial Group Japan 2597 3 JPMorgan Chase amp Co USA 2490 4 HSBC Holdings UK 2374 5 BNP Paribas France 2196
6 Bank of America USA 2187 7 Wells Fargo USA 1930 8 China Development Bank China 1904 9 Credit Agricole Group France 1821 10 Citigroup USA 1792
11 Mizuho Financial Group Japan 1757 12 Deutsche Bank Germany 1682 13 Sumitomo Mitsui Financial Group Japan 1654 14 Barclays PLC UK 1490 15 Societe Generale France 1461
16 Banco Santander Spain 1416 17 Lloyds Banking Group UK 1004 18 Norinchukin Bank Japan 984 19 Royal Bank of Scotland Group UK 981 20 UBS Group AG Switzerland 919
21 Unicredit SpA Italy 908 22 ING Groep NV Netherlands 893 23 Goldman Sachs Group USA 860 24 Morgan Stanley USA 814 25 Credit Suisse Group Switzerland 806
Table 2a ndash Continued from previous page
26 BBVA Spain 773 27 Intesa Sanpaolo Italy 766 28 Commonwealth Bank of Australia Australia 703 29 Rabobank Group Netherlands 700 30 Australia amp New Zealand Banking Group Australia 661
31 Nordea Sweden 651 32 Standard Chartered Plc UK 646 33 Westpac Banking Corp Australia 607 34 National Australia Bank Australia 562 35 Commerzbank Germany 549
36 Danske Denmark 495 37 State bank of India India 492 38 US Bancorp USA 445 39 The Export-Import Bank of China China 427 40 Sberbank of Russia Russia 420
41 Resona Japan 412 42 Sumitomo Mitsui TH Japan 406 43 Nomura Holdings Japan 370 44 PNC Financial Services USA 366 45 Capital One Financial Corporation USA 357
46 DBS Group Holdings Singapore 332 47 Shinhan Financial Group South Korea 328 48 KBC Group NV Belgium 291 49 Svenska Handelsbanken Sweden 289 50 Skandinaviska Enskilda Banken Sweden 289
51 Hana Financial Group South Korea 288 52 Nationwide Building Society UK 276 53 Korea Development Bank South Korea 268
39
54 Woori Bank South Korea 257 55 Landesbank Baden-Wurttemberg Germany 257
56 Cathay Financial Holding Taiwan 252 57 Swedbank Sweden 237 58 United Overseas Bank (UOB) Singapore 235 59 Dexia Belgium 225 60 Banco Sabadell Spain 224
61 Bayerische Landesbank Germany 224 62 Erste Group Bank AG Austria 220 63 Banco Popular Espanol Spain 204 64 Industrial Bank of Korea South Korea 196 65 Bank of Ireland Ireland 182
66 Malayan Malaysia 161 67 Standard Bank Group South Africa 161 68 Banca Monte dei Paschi di Siena Italy 161 69 American Express USA 158 70 National Bank of Greece Greece 153 71 Macquarie USA 143
72 Credit Lyonnais France 120 73 Comercial Portuguese Portuguese 113 74 Banco Espirito Santo Portugal 112 75 Turkiye is bankasi Turkey 112 76 Mediobanca Italy 95
77 Landesbank Hessen Germany 92
Table 2b Banks ordered by Country
Rank Bank Country Total assets
US$B
1 Commonwealth Bank of Australia Australia 703 2 Australia amp New Zealand Banking Group Australia 661 3 Westpac Banking Corp Australia 607 4 National Australia Bank Australia 562
5 Erste Group Bank AG Austria 220
6 KBC Group NV Belgium 291 7 Dexia Belgium 225
8 Bank of China China 2613 9 China Development Bank China 1904
10 The Export-Import Bank of China China 427
11 Danske Denmark 495
12 BNP Paribas France 2196 13 Credit Agricole Group France 1821 14 Societe Generale France 1461 15 Credit Lyonnais France 120
16 Deutsche Bank Germany 1682 17 Commerzbank Germany 549 18 Landesbank Baden-Wurttemberg Germany 257 19 Bayerische Landesbank Germany 224 20 Landesbank Hessen Germany 92
21 National Bank of Greece Greece 153
22 State bank of India India 492
23 Bank of Ireland Ireland 182
24 Unicredit SpA Italy 908 25 Intesa Sanpaolo Italy 766
40
26 Banca Monte dei Paschi di Siena Italy 161 27 Mediobanca Italy 95
28 Mitsubishi UFJ Financial Group Japan 2597 29 Mizuho Financial Group Japan 1757 30 Sumitomo Mitsui Financial Group Japan 1654 31 Norinchukin Bank Japan 984 32 Resona Japan 412 33 Sumitomo Mitsui TH Japan 406 34 Nomura Holdings Japan 370 35 Yamaguchi Financial Group Japan 93
36 ING Groep NV Netherlands 893 37 Rabobank Group Netherlands 700
38 Banco Espirito Santo Portugal 111
39 Sberbank of Russia Russia 420
40 DBS Group Holdings Singapore 332 41 United Overseas Bank (UOB) Singapore 235 42 Standard Bank Group South Africa 161
43 Shinhan Financial Group South Korea 328 44 Hana Financial Group South Korea 288 45 Korea Development Bank South Korea 268 46 Woori Bank South Korea 257 47 Industrial Bank of Korea South Korea 196
48 Banco Santander Spain 1416 49 BBVA Spain 773 50 Banco Sabadell Spain 224 51 Banco Popular Espanol Spain 204
Table 2b ndash Continued from previous page
53 Nordea Sweden 651 54 Svenska Handelsbanken Sweden 289 55 Skandinaviska Enskilda Banken Sweden 289 56 Swedbank Sweden 237
57 UBS Group AG Switzerland 919 58 Credit Suisse Group Switzerland 806
59 Cathay Financial Holding Taiwan 252
60 Turkiye is bankasi Turkey 112
61 HSBC Holdings UK 2374 62 Barclays PLC UK 1490 63 Lloyds Banking Group UK 1004 64 Royal Bank of Scotland Group UK 981 65 Standard Chartered Plc UK 646 66 Nationwide Building Society UK 276
68 JPMorgan Chase amp Co USA 2490 69 Bank of America USA 2187 70 Wells Fargo USA 1930 71 Citigroup USA 1792 72 Goldman Sachs Group USA 860 73 Morgan Stanley USA 814 74 US Bancorp USA 445 75 PNC Financial Services USA 366 76 Capital One Financial Corporation USA 357 77 American Express USA 158 78 Macquarie USA 143
41
Table 3a Banksrsquo home-countries ordered by the sum of total bank assets
Developed Total Assets Developing Total Assets USA 11547 China 4944 Japan 7867 India 492 UK 6936 Russia 420 France 5599 Taiwan 252 Germany 2994 South Africa 161 Spain 2617 Turkey 112
Australia 2534 Italy 1933 Switzerland 1725
Netherlands 1584 Sweden 1467 South Korea 1340 Singapore 568 Belgium 516 Denmark 495 Ireland 344 Austria 220 Greece 153 Portugal 111 Total Assets of banks that are headquartered in
Developed 5055366 Emerging 63823 of total assets 888 of total assets 112
42
Table 3b Regional details
Region Number of Banks Total bank
assets of total
assets
Europe 40 2669673 473
Asia 21 1557658 275
N America 11 1154724 204
Oceania 4 2534 45
Africa 1 161 03
B Data Definitions and Descriptive Statistics
Table 4 Data Definitions
Variable Description
Endogenous CDS CDS 5-year spread
Exogenous Systemic risk
CDX The family of CDS indeces covering North America
VIX The volatiliy index of SampP 500
US 3-month T Bill The short-term obligation backed by the Treasury Dept of the US goverment
Bank-specific Size Total assets
Retail orientation Total Loans Total assets
Diversification Non-interest income Total revenues
NPLs Non-performing loans Total Loans
Country-specific
GDP Each bankrsquos home-country GDP growth
Budget Balance Current AccountGDP
Public Debt Public DebtGDP
43
Table 5 Descriptive Statistics
Panel A Systemic risk factor
CDX VIX TED
Mean 269E-06 -0000123 -000121 Median 0000 -0001 0000 Maximum 0020 0176 0250 Minimum -0009 -0152 -0750
Std Dev 0001 0031 0033 Skewness 4689 0689 -17326
Kurtosis 106047 6789 377496 Jarque-Bera 1105896 1679364 14610377 Probability 0000 0000 0000
Sum 0007 -0304 -3000 Sum Sq Dev 0003 2427 2746
Note CDX and VIX are in log differences TED spread is in first differences
Panel B Bank specific
Assets Loans_to_Assets Non_Interest_Inc NPLs
Mean 732382 55596 2442 4601
Median 458009 59921 2378 2411
Maximum 3030645 8664 8640 35217
44
Minimum 4354387 9070 -5962 01082
Std Dev 7460013 17017 1481 5612
Skewness 1081 -0641 -0694 2376
Kurtosis 30129 2584 6193 9630
Jarque-Bera 7023 272888 182117 999501
Probability 0000 0000 0000 0000
Sum 264E+09 2003702 8803746 1658430 Sum Sq Dev 201E+15 1043392 7908036 1134867
Note Data are in levels
Part C ndash Global Sample
Table 7 Individual systemic importance
Panel A ndash Ranked by total score Rank by score
Rank by bank assets Bank Name
Home-Country Region
Assets (billion
US $) Score
To others (Aggr)
From others (Aggr)
1 27 Intesa Sanpaolo Italy Europe 766 1056 0505 0551
2 16 Banco Santander Spain Europe 1416 1038 0464 0574
3 26 BBVA Spain Europe 773 0987 0454 0533
4 5 BNP Paribas France Europe 2196 0982 0445 0537
5 21 Unicredit SpA Italy Europe 908 0975 0489 0485
6 14 Barclays PLC UK Europe 1490 0961 0454 0507
7 12 Deutsche Bank Germany Europe 1682 0954 0428 0526
8 9 Credit Agricole Group France Europe 1821 0942 0424 0518
9 15 Societe Generale France Europe 1461 0940 0427 0512
10 72 Credit Lyonnais France Europe 120 0938 0445 0493
11 17 Lloyds Banking Group UK Europe 1004 0925 0438 0487
12 25 Credit Suisse Group Switz Europe 806 0907 0376 0531
13 35 Commerzbank Germany Europe 549 0904 0410 0494
14 20 UBS Group AG Switz Europe 919 0890 0387 0503
15 32 Standard Chartered Plc UK Europe 646 0870 0419 0451
16 68 Banca Monte dei Paschi Italy Europe 161 0861 0429 0433
45
17 19
Royal Bank of Scotland Group
UK Europe 981 0845 0423 0423
18 29 Rabobank Group Netherl Europe 700 0841 0376 0465
19 22 ING Groep NV Netherl Europe 893 0823 0374 0449
20 76 Mediobanca Italy Europe 95 0821 0389 0433
21 24 Morgan Stanley USA N Amer 814 0752 0315 0437
22 69 American Express USA N Amer 158 0736 0332 0404
23 6 Bank of America USA N Amer 2187 0716 0318 0398
24 23 Goldman Sachs Group USA N Amer 860 0711 0302 0410
25 10 Citigroup USA N Amer 1792 0706 0313 0393
26 4 HSBC Holdings UK Europe 2374 0695 0372 0323
27 62 Erste Group Bank AG Austria Europe 220 0688 0314 0375
28 49 Svenska Handelsbanken Sweden Europe 289 0678 0281 0397
29 53
Korea Development Bank
S Korea Asia 268 0677 0393 0284
30 60 Banco Sabadell Spain Europe 224 0670 0295 0375
31 36 Danske Denmark Europe 495 0663 0296 0367
32 45
Capital One Financial Corp
USA N Amer 357 0662 0260 0401
33 3 JPMorgan Chase amp Co USA N Amer 2490 0658 0257 0401
34 7 Wells Fargo USA N Amer 1930 0653 0259 0394
35 34 National Australia Bank Australia Oceania 562 0622 0376 0247
Table continued on next page
Table 3- Panel A continued from previous page
36 2 Mitsubishi UFJ Financial Japan Asia 2597 0621 0223 0398
37 47 Shinhan Financial Group S Korea Asia 328 0615 0331 0283
38 54 Woori Bank S Korea Asia 257 0612 0333 0278
39 64 Industrial Bank of Korea S Korea Asia 196 0603 0341 0261
40 28 Commonwealth Bank Australia Oceania 703 0599 0388 0211
41 40 Sberbank of Russia Russia Europe 420 0598 0294 0305
42 30 Australia amp N Zealand Australia Oceania 661 0597 0383 0214
43 50 Skandinaviska Enskilda Sweden Europe 289 0578 0262 0316
44 31 Nordea Sweden Europe 651 0574 0289 0285
45 71 Macquarie USA N Amer 143 0572 0321 0251
46 48 KBC Group NV Belgium Europe 291 0568 0241 0327
47 63 Banco Popular Espanol Spain Europe 204 0558 0297 0261
48 61 Bayerische Landesbank Germany Europe 224 0552 0249 0303
49 39 The Export-Import Bank China Asia 427 0548 0284 0264
50 1 Bank of China China Asia 2613 0548 0276 0272
51 66 Malayan Malaysia Asia 171 0543 0321 0223
52 33 Westpac Banking Corp Australia Oceania 606 0540 0374 0166
53 37 State bank of India India Asia 492 0530 0238 0291
54 51 Hana Financial Group S Korea Asia 288 0518 0290 0227
55 57 Swedbank Sweden Europe 237 0486 0253 0233
56 8 China Development Bank China Asia 1904 0468 0260 0208
46
57 52 Nationwide Building Society UK Europe 276 0463 0217 0246
58 59 Dexia Belgium Europe 225 0409 0197 0212
59 46 DBS Group Holdings Singapore Asia 332 0397 0212 0186
60 65 Bank of Ireland Ireland Europe 182 0379 0197 0182
61 58 United Overseas Bank Singapore Asia 235 0373 0214 0159
62 11 Mizuho Financial Group Japan Asia 1757 0367 0271 0096
63 67 Standard Bank Group S Africa Africa 161 0365 0123 0242
64 74 Espirito Santos Portugal Europe 112 0362 0186 0176
65 41 Resona Japan Asia 412 0357 0263 0094
66 13 Sumitomo Mitsui Financial Japan Asia 1654 0355 0250 0104
67 38 US Bancorp USA N Amer 445 0353 0188 0165
68 55 Landesbank Baden-Wurtt Germany Europe 257 0340 0170 0171
69 42 Sumitomo Mitsui TH Japan Asia 406 0323 0273 0050
70 56 Cathay Financial Holding Taiwan Asia 252 0298 0189 0109
71 73 Comercial Portuguese Portugal Europe 113 0279 0268 0011
72 70 National Bank of Greece Greece Europe 153 0220 0176 0044
73 18 Norinchukin Bank Japan Asia 984 0215 0164 0050
74 43 Nomura Holdings Japan Asia 370 0197 0161 0035
75 77 Landesbank Hessen Germany Europe 92 0159 0089 0071
76 44 PNC Financial Services USA N Amer 366 0078 0034 0043
77 75 Turkiye is bankasi Turkey Europe 112 0037 0030 0007
Note Results concern the period January 2008 ndash June 2017 and are of daily frequency
Table 9 Systemic contribution per bank (January 2008 ndash June 2017)
Rank Bank Name SC Rank Bank Name SC Rank Bank Name SC Rank Bank Name SC
1 Intesa Sanpaolo
225 21 Morgan Stanley 160 41 Sberbank of Russia
128 61 United Overseas
080
2 Banco Santander
221 22 American Express
157 42 Australia amp N Zealand
127 62 Mizuho Financial
078
3 BBVA 210 23 Bank of America
153 43 Skandinaviska Enskilda
123 63 Standard Bank Group
078
4 BNP Paribas 209 24 Goldman Sachs Group
152 44 Nordea 122 64 Espirito Santos
077
5 Unicredit SpA
208 25 Citigroup 151 45 Macquarie 122 65 Resona 076
6 Barclays PLC 205 26 HSBC Holdings 148 46 KBC Group NV
121 66 Sumitomo Mitsui
076
7 Deutsche Bank
203 27 Erste Group 147 47 Banco Popular
119 67 US Bancorp
075
8 Credit Agricole
201 28 Svenska 145 48 Bayerische Landesbank
118 68 Landesbank 072
9 Societe Generale
200 29 Korea Development Bank
144 49 The Export-Import
117 69 Sumitomo Mitsui TH
069
10 Credit Lyonnais
200 30 Banco Sabadell 143 50 Bank of China 117 70 Cathay Financial
064
11 Lloyds Banking
197 31 Danske 141 51 Malayan 116 71 Comercial Portuguese
059
47
12 Credit Suisse Group
193 32 Capital One Financial Corp
141 52 Westpac Banking Corp
115 72 NBG 047
13 Commerzbank 193 33 JPMorgan Chase amp Co
140 53 State bank of India
113 73 Norinchukin Bank
046
14 UBS Group AG 190 34 Wells Fargo 139 54 Hana Financial Group
110 74 Nomura Holdings
042
15 Standard Chartered
186 35 National Australia Bank
133 55 Swedbank 104 75 Landesbank Hessen
034
16 Banca Monte dei
184 36 Mitsubishi UFJ Financial
132 56 China Development
100 76 PNC Financial Services
017
17 RBS 180 37 Shinhan Financial Group
131 57 Nationwide Building
099 77 Turkiye is bankasi
008
18 Rabobank Group
179 38 Woori Bank 130 58 Dexia 087
19 ING Groep NV 175 39 Industrial Bank of Korea
129 59 DBS Group Holdings
085
20 Mediobanca 175 40 Commonwealth Bank
128 60 Bank of Ireland
081
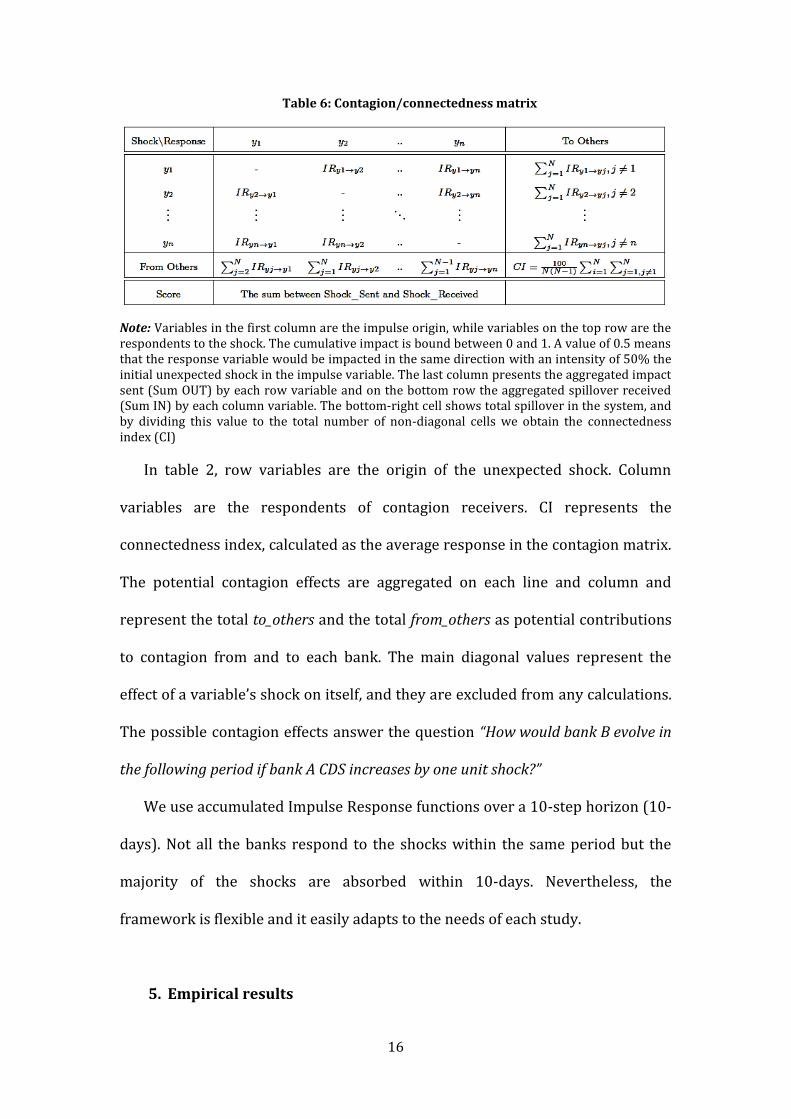
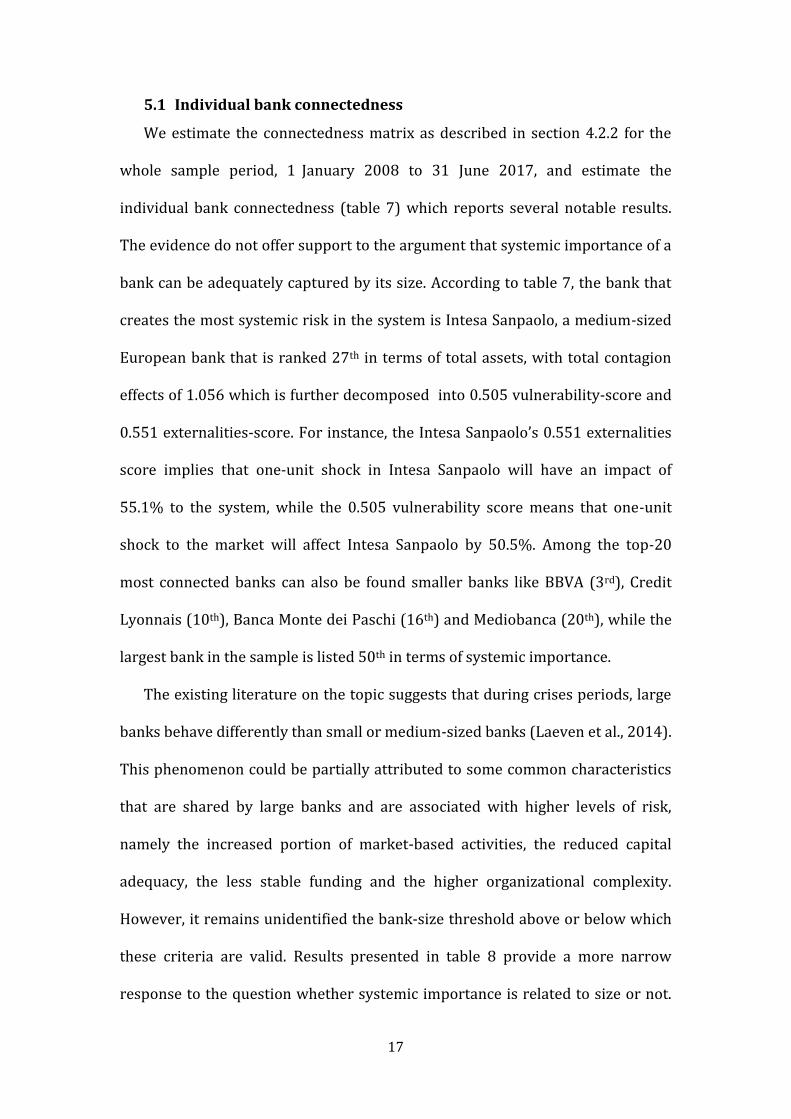
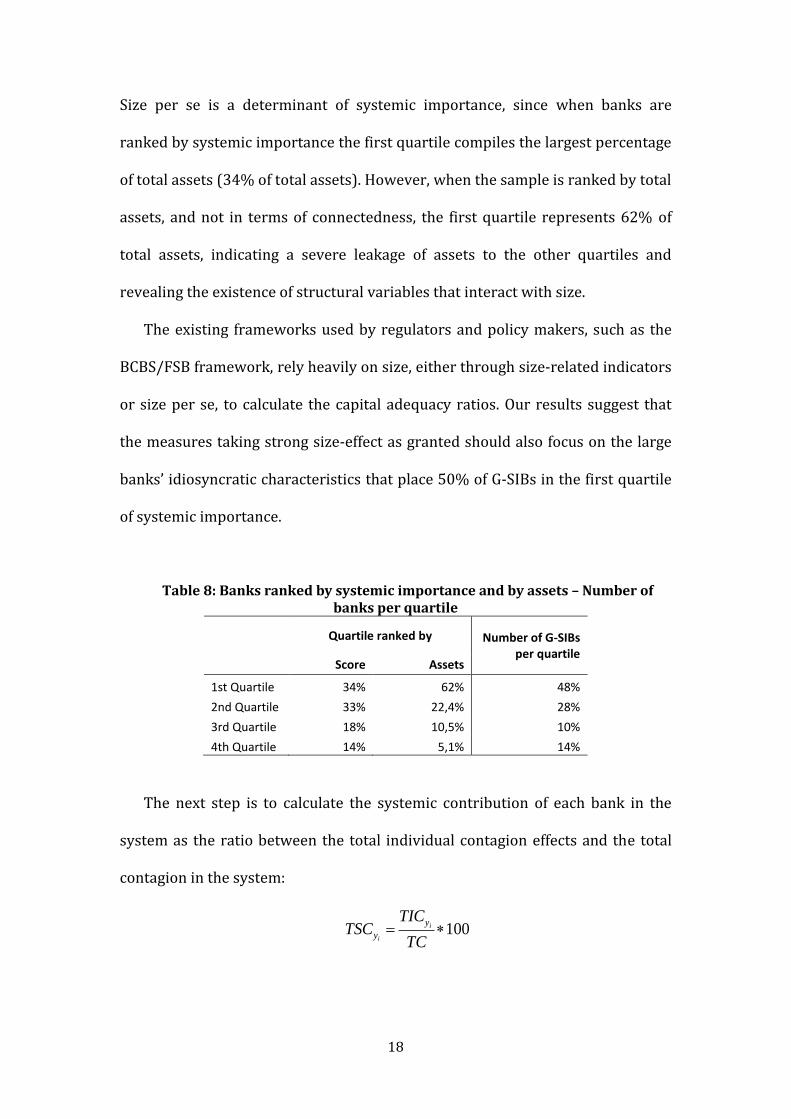
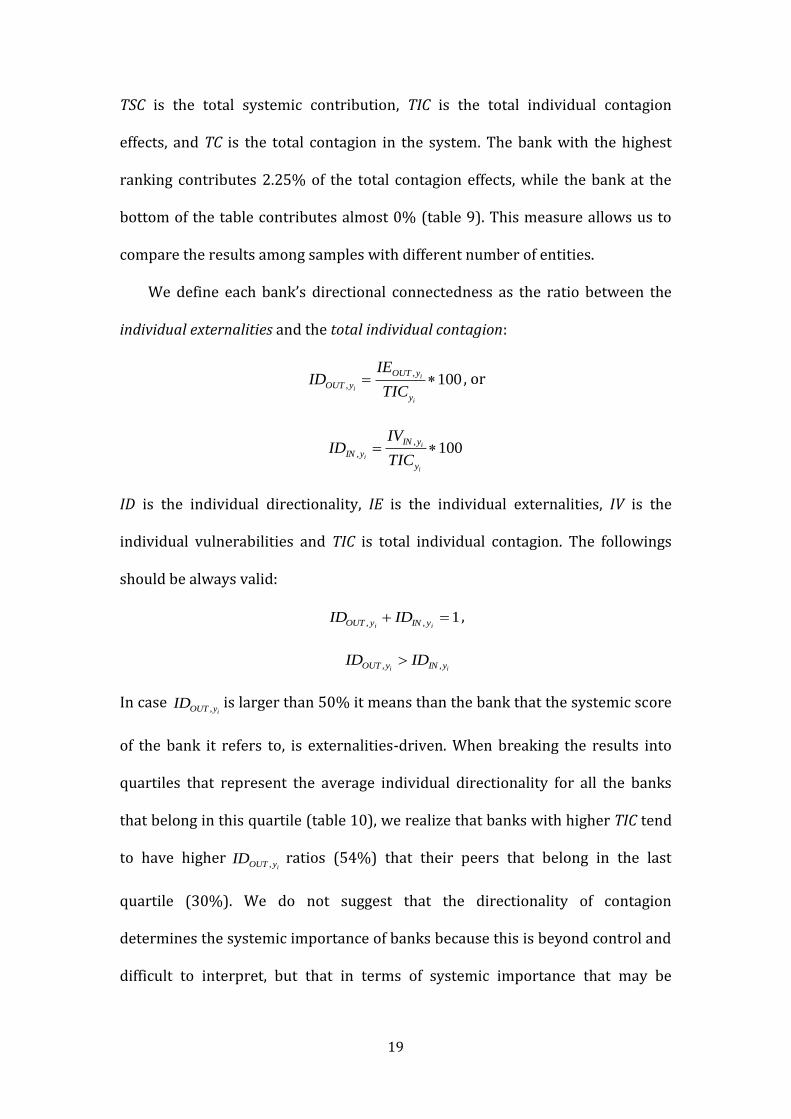
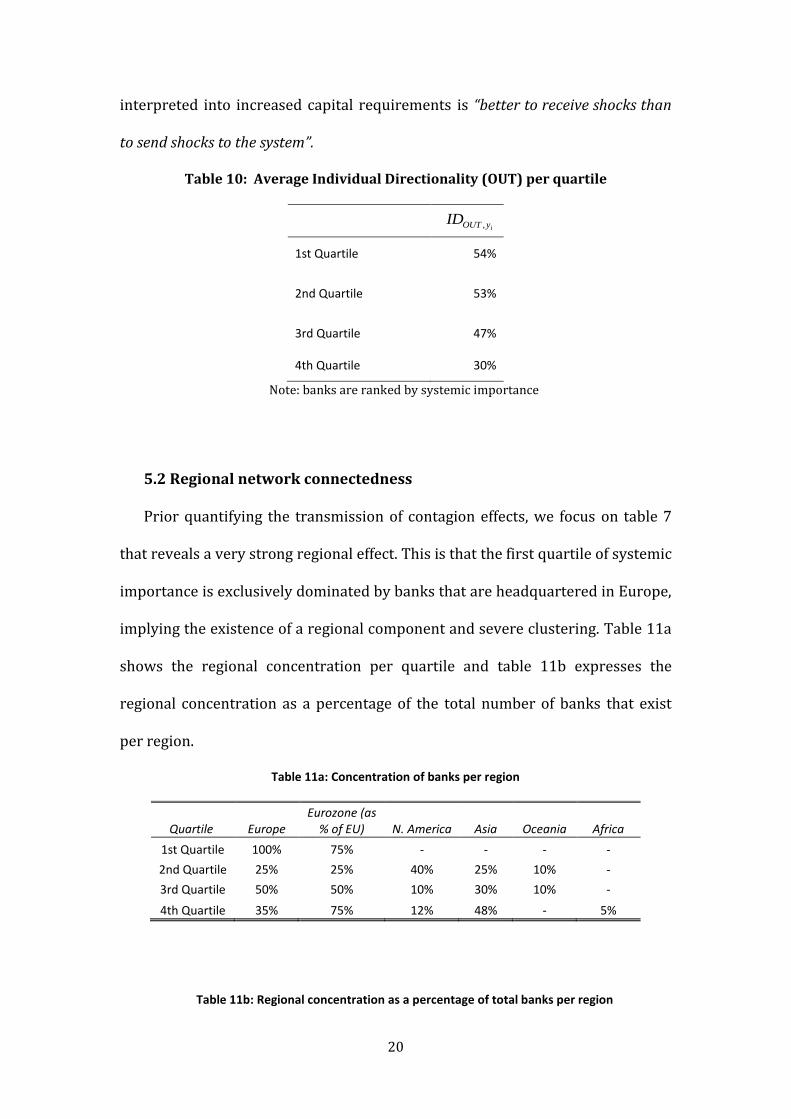
20
interpreted into increased capital requirements is ldquobetter to receive shocks than
to send shocks to the systemrdquo
Table 10 Average Individual Directionality (OUT) per quartile
iyOUTID
1st Quartile 54
2nd Quartile 53
3rd Quartile 47
4th Quartile 30
Note banks are ranked by systemic importance
52 Regional network connectedness
Prior quantifying the transmission of contagion effects we focus on table 7
that reveals a very strong regional effect This is that the first quartile of systemic
importance is exclusively dominated by banks that are headquartered in Europe
implying the existence of a regional component and severe clustering Table 11a
shows the regional concentration per quartile and table 11b expresses the
regional concentration as a percentage of the total number of banks that exist
per region
Table 11a Concentration of banks per region
Quartile Europe Eurozone (as
of EU) N America Asia Oceania Africa
1st Quartile 100 75 - - - -
2nd Quartile 25 25 40 25 10 -
3rd Quartile 50 50 10 30 10 -
4th Quartile 35 75 12 48 - 5
Table 11b Regional concentration as a percentage of total banks per region
21
Quartile Europe N America Asia Oceania Africa
1st Quartile 47 - - - -
2nd Quartile 12 73 25 25 -
3rd Quartile 21 9 35 75 -
4th Quartile 16 18 40 - 100
The next step is to understand the flows of shocks among the different
regions the contagion effects and the degree of connectedness among the
different regions (Table 12a and b) We focus on four regions Europe North
America (expressed by US banks) Asia and Oceania Table 12a shows regionrsquos A
externalities to the other regions as a percentage of regionrsquos A total externalities
while table 12b focuses on the vulnerabilities side Combining the information
obtained by tables 12a and b European and US appear to be strongly
interconnected More precisely 58 of the aggregate shocks that are sent by US
banks are directed to Europe while 64 of the aggregate shocks received by US
banks are generated in Europe Also another important finding is that 69 of
the aggregate shocks that are sent by European banks remain within Europe
Table 12a Shocks sent per region as of total shocks sent per region
Asia Europe NAmerica Oceania
Sum
Asia 41 41 9 9
100
Europe 16 69 960 540
100
NAmerica 1950 58 16 650
100
Oceania 33 4450 950 12
100
22
Table 12b Shocks received per region as of total shocks received per region
Asia Europe NAmerica Oceania
Asia
28 10 13 21
Europe
54 75 64 59
NAmerica
12 12 20 13
Oceania
6 3 3 7
Sum
100 100 100 100
All in all it is obvious that there exists a regional factor that affects
significantly the bank connectedness However it is interesting to find out the
driving forces of this regional component especially in the case of Europe which
has been a special case due to the different transmission channels of the financial
crisis the highly interconnected banking system the feedback loops among
sovereigns and banks and the contagion from one country to the rest of Europe
53 National banking system connectedness
We approach the national banking system first of all by calculating the
average systemic risk per bank for each one of the countries in the sample
(Figure 2) Four out of the first five banks that contributed the most to the global
systemic risk belong to Eurozone French banks contributed the most to
systemic risk while Italy and Spain both of which suffered from banking
systems in distress followed at close range Banks in non-Euro-area countries
like Swiss and UK banks played an important role as well Surprisingly the
average contagion effects for German banks place them almost in the middle of
the table indicating that German banking system may acted as a stability factor
for the European region Both Portuguese and especially Greek banking system
appeared to be isolated from the global banking system
23
Figure 2 Average systemic risk per bank ndash Own shocks are excluded
Note results concern the period January 2008-June 2017
In figure 3 we approach the total contagion from a different perspective by
presenting the total contagion effects for each sovereign This approach may
depends on the number of banks per sovereign but illustrates that US-European
cluster dominates in terms of systemic importance
Figure 3 National systemic risk ndash Own shocks are excluded
Note results concern the period January 2008-June 2017
53 Rolling window
000
010
020
030
040
050
060
070
080
090
100
Fra
nce
Ital
y
Swit
z
Net
her
l
Spai
n
UK
Au
stri
a
Den
mar
k
S K
ore
a
USA
Ru
ssia
Au
stra
lia
Ger
man
y
Swed
en
Mal
aysi
a
Ind
ia
Ch
ina
Bel
giu
m
Sin
gap
ore
Irel
and
S A
fric
a
Jap
an
Po
rtu
gal
Tai
wan
Gre
ece
Tu
rkey
000
100
200
300
400
500
600
700
USA U
K
Fra
nce
Ital
y
Spai
n
S K
ore
a
Ger
man
y
Jap
an
Au
stra
lia
Swed
en
Swit
z
Net
her
l
Ch
ina
Bel
giu
m
Sin
gap
ore
Au
stri
a
Den
mar
k
Po
rtu
gal
Ru
ssia
Mal
aysi
a
Ind
ia
Irel
and
S A
fric
a
Tai
wan
Gre
ece
Tu
rkey
24
531 Individual Banks
In order to better understand the evolvement of systemic risk and how this
fluctuated over the whole period we use rolling-window analysis where the
length of the window is 340 days and the step is 150 days Figure 3 presents the
evolution of total contagion over time where strong co-movement and
interconnections among banks are obvious We also discriminate periods where
the cluster of TCI lines is shrinking and systemic risk is becoming more unified
which means that systemic and idiosyncratic shocks are propagated more
intensely via the network
Figure 3 Total Individual Contagion
Note The length of the window is 340 days and the step is 150 days
We introduce the range as a new metric of systemic risk unification Range at
each point in time is defined as the difference between the highest and the
lowest score in the system (Figure 4) The lowest the score the more unified the
000
020
040
060
080
100
120
Jan
-08
May
-08
Sep
-08
Jan
-09
May
-09
Sep
-09
Jan
-10
May
-10
Sep
-10
Jan
-11
May
-11
Sep
-11
Jan
-12
May
-12
Sep
-12
Jan
-13
May
-13
Sep
-13
Jan
-14
May
-14
Sep
-14
Jan
-15
May
-15
Sep
-15
Jan
-16
May
-16
Sep
-16
Jan
-17
May
-17
25
systemic risk is becoming Given the predictive power of CDS spreads this new
measure could be used by regulators and policymakers as an early-warning tool
However it remains an open question what is the threshold below which the
unification of systemic risk could consist a problem It is remarkable that the
most ldquolooserdquo links were observed during the post-Lehman collapse in late 2008
and reached its lowest price at the beginning of Greek crisis
Figure 4 Systemic risk range
Note The length of the window is 340 days and the step is 150 days
532 Global banking system
In this part we are interested in understanding the behavior of aggregate
contagion effects Total Systemic risk (TSR) is defined as the total of the off-
0
01
02
03
04
05
06
07
08
09
1
Jan
-08
May
-08
Sep
-08
Jan
-09
May
-09
Sep
-09
Jan
-10
May
-10
Sep
-10
Jan
-11
May
-11
Sep
-11
Jan
-12
May
-12
Sep
-12
Jan
-13
May
-13
Sep
-13
Jan
-14
May
-14
Sep
-14
Jan
-15
May
-15
Sep
-15
Jan
-16
May
-16
Sep
-16
Jan
-17
May
-17
26
diagonal entries in the connectedness matrix or as the sum of the ldquofromrdquo column
or ldquotordquo row measures total connectedness
N
ijji
H
ij
H IRTSR 1
We could plot a moving contagion measure defined as the sum of all IRFs ldquoto
others but we go one step further and we choose to present the Total Contagion
index (TCI) which is calculated as the average response per bank in the
connectedness matrix and is calculated as the sum of all non-diagonal cells
divided by the total number of entities
N
i j yy jiIR
NTCI
1 1
1
Cumulative IRs interval is [01] the index will be bound between 0 and 100
Higher contagion index implies a tightening of the nexus among banks (Figure
5)
Figure 5 Total Connectedness (TC)
Note The length of the window is 340 days and the step is 150 days
000
500
1000
1500
2000
2500
3000
3500
4000
4500
Jan
-08
May
-08
Sep
-08
Jan
-09
May
-09
Sep
-09
Jan
-10
May
-10
Sep
-10
Jan
-11
May
-11
Sep
-11
Jan
-12
May
-12
Sep
-12
Jan
-13
May
-13
Sep
-13
Jan
-14
May
-14
Sep
-14
Jan
-15
May
-15
Sep
-15
Jan
-16
May
-16
Sep
-16
Jan
-17
May
-17
27
Total connectedness reached its peak after Lehman collapse and was
severely affected by the developments in the European banking and sovereign
debt markets that shocked some EU member countries until mid-2012 The
Greek crisis and then the fact that in the early 2011 Italy and Spain joined the
countries with stressed banking systems pushed total connectedness upwards
After the early 2012 the actions taken by the ECB constrained total contagion
but after early 2015 higher political uncertainty following the outcomes of the
UK referendum on EU membership and the US election as well as market
concerns about euro area banksrsquo longer-term profitability prospects played their
role and contributed to the severe increase in the index At the same time
continued accommodative monetary policy in advanced economies and abating
market concerns about the possibility of a sharp slowdown in China have
dampened spikes in systemic stress Also a major concern for global markets
was the crisis in Deutsche Bank and its deep connections to global financial
institutions
From a policy perspective the most pressing issue for euro area financial
institutions remains the high level of NPLs which needs to be addressed The
resolution of systemic NPL problems will take time and requires a
comprehensive strategy involving coordination of all relevant stakeholders
533 Rolling Window ndash Regional Systemic Contribution (RSC)
We calculate the systemic contribution of each region as the ratio between
the total regional contagion effects and the total contagion in the system We
focus on Europe North America (US) and Euro-area since these regions
28
dominated in terms of systemic risk during the period Figure 8 compares the
systemic contribution of these regions Surprisingly the share of systemic risk
that European banks hold increased after 2014 while the contribution of US
banks remains increasingly lower than European banksrsquo contribution after mid-
2012 The difference between the systemic contribution of European and US
banks fluctuates between 40 and 55
Figure 8 European US and Euro-area banksrsquo contribution to total systemic risk
(as a of total systemic risk)
Note US banksrsquo contribution is presented in secondary axis
54 Principal Component Analysis
We use PCA analysis in which the banksrsquo CDS spreads are decomposed into
orthogonal factors of decreasing explanatory power to identify the increased
000
500
1000
1500
2000
2500
000
1000
2000
3000
4000
5000
6000
7000
8000
Jan
-08
May
-08
Sep
-08
Jan
-09
May
-09
Sep
-09
Jan
-10
May
-10
Sep
-10
Jan
-11
May
-11
Sep
-11
Jan
-12
May
-12
Sep
-12
Jan
-13
May
-13
Sep
-13
Jan
-14
May
-14
Sep
-14
Jan
-15
May
-15
Sep
-15
Jan
-16
May
-16
Sep
-16
Jan
-17
May
-17
EU Euroarea US
29
commonality among the default risk of banks (see Muirhead 1982 for an
exposition of PCA)
Let 119884119905 be the log difference of bankrsquos i CDS i=1hellip77 let the systemrsquos
aggregate credit risk be represented by the sum 119884119878 = sum 119884119894119894 and let 119864[119884119894] = 120583119894
and Var[119877119894] = 1205901198942 Then we have
1205901199042 = sum sum 120590119894120590119895120550[119911119894119911119895]
119873
119895=1
119873
119894=1
where 119911119896 = (119877119896 minus 120583119896)120590119896 k=ij
where 119911119896 is the CDS of bank k and 1205901199042 is the variance of the system
PCA produces the decomposition of the variance-covariance matrix of CDS
spreads of the 77 banks contained in the sample into the orthogonal matrix of
loadings L (eigenvector of the correlation matrix of CDS spreads) and the
diagonal matrix of eigenvalues Λ
We focus on the first three eigenvalues as they explain most of the variation
in the system These three eigenvalues are supposed to explain a larger portion
of the total volatility in the system when the CDS spreads are moving together or
in other words when systemic risk in more unified So periods when the first
three components explain most of the total volatility indicates the existence of
increased interconnectedness among banks The first component that is
extracted accounts for the maximum amount of total variance in the observed
variables In other words the proportion of explained variance by the first
component shows how much of the variations in the CDS spreads can be
explained by one common factor This result is in line with Fontana and
Scheicher (2010) who finds there to be a single large determinant dominating
the variation in the CDS spread where the proportion of explained variance by
30
factor 1 exceeds 80 According to Billio et al (2012) during periods of distress
fewer components explain larger part of the volatility which means that the
fluctuation of the first principal component while taking into account the
predictive power that CDS carry reveal periods of increased systemic risk
We run rolling window analysis where the length of the window is 200 days
and the step is 100 days over the period January 2008 to June 2017 and the
results indicate the existence of a single dominant component that determines
the fluctuations of CDS spreads (Figure 9)
Figure 9 Rolling Principal Components analysis
Note The length of the window is 200 days and the step is 100 days
Investigating the determinants of the loadings of each bank to the first
principal component through rolling cross-sectional analysis will reveal the
driving forces of systemic risk on a yearly basis over the period 2008-2016 For
that reason we use rolling cross-sectional analysis
0
10
20
30
40
50
60
Jan
-08
Jun
-08
No
v-0
8
Ap
r-0
9
Sep
-09
Feb
-10
Jul-
10
Dec
-10
May
-11
Oct
-11
Mar
-12
Au
g-1
2
Jan
-13
Jun
-13
No
v-1
3
Ap
r-1
4
Sep
-14
Feb
-15
Jul-
15
Dec
-15
May
-16
Oct
-16
comp1 comp2 comp3
31
ii
iiiiiii
Debt
SurplusGDPNIINPLsLoansAssetsay
7
654321
yi is each bankrsquos loading to the first component
We search among the following bank-specific characteristics total value of
bank assets (logs) retail orientation the total loanstotal assets (levels) NPLs
total loans (levels) and non-interest income total revenue and among the
following home-country specific characteristics GDP growth primary
surplusGDP (levels) public debtGDP (levels) We manage to match 47 banks to
bank-specific characteristics
Table 13 Determinants of each bankrsquos loadings in the first component over the nine
periods
2008 2009 2010 2011 2012 2013 2014 2015 2016
Size -0012 -0002 -0007 -0012 0001 0004 0001 -0002 -0003
(0008) (0007) (0006) (0006) (0007) (0006) (0010) (0008) (0009)
Loan-to-assets -0048 -0142 -0113 -0136 -0135 -0114 -0212 -0210 -0239
(0043) (0051) (0051) (0051) (0054) (0051) (0078) (0069) (0074)
NPLs 0844 0414 0352 0035 0004 -0097 0333 0304 0194
(0349) (0253) (0187) (0183) (0054) (0139) (0187) (0147) (0174)
Non-interest-income 0000 0000 0001 0000 0001 0000 0001 0000 0000
(0000) (0000) (0006) (0006) (0000) (0000) (0000) (0000) (0000)
GDP -0004 -0003 -0006 -0003 -0009 -0009 -0011 -0004 -0007
(0004) (0002) (0001) (0003) (0054) (0003) (0005) (0001) (0006)
Primary SurplusGDP 0000 -0002 0002 0000 -0002 -0004 -0009 -0014 -0012
(0002) (0001) (0001) (0170) (0054) (0003) (0004) (0004) (0005)
DebtGDP -0001 -00005 -00006 -0001 -00007 -00005 -00005 0000 -0000
(0000) (0000) (0000) (0000) (0054) (0000) (0000) (0000) (0000)
_cons 0300 0235 0297 0372 0248 0229 0252 0283 0323
(0080) (0076) (0068) (0078) (0054) (0072) (0111) (0094) (0107)
Note 1 510
32
6 Conclusions
Macroprudential policy is still in its infancy Much work is still needed on
developing good and timely analysis effective policy instrument tools and
effective implementation Our paper makes a contribution on the dimension of
analysis and measurement The key aim of macroprudential policy is to address
externalities and spillovers among financial institutions in an effort to safeguard
financial stability These interactions are complex We provide a tool for
clarifying and quantifying these interactions Our measures can guide
appropriate macroprudential policies that aim to internalize these externalities
A key conclusion from our study is that the focus on size does not adequately
address the systemic importance of banks
33
References
Acharya V Engle R Richardson M 2012 Capital Shortfall A New Approach to
Ranking and Regulating Systemic Risks American Economic Review Vol102 No
3
Acharya V Pedersen L Philippon T Richardson M 2010 Measuring systemic
risk Technical Report Department of Finance NYU
Acharya V Drechsler I Schnabl P 2014 A Pyrrhic Victory Bank Bailouts and
Sovereign Credit Risk Journal of Finance 2014 vol 69 issue 6 2689-2739
Adams Z Fuss R Gropp R 2014 Spillover Effects among Financial
Institutions A State-Dependent Sensitivity Value-at-Risk (SDSVaR) Approach
Journal of Financial and Quantitative Analysis (JFQA) Vol 49 No 3
Adrian T Brunnermeier M 2009 CoVaR Manuscript Princeton University
Aizenman J Hutchison H and JinjarakY (2013) lsquoWhat is the Risk of European
Sovereign Debt Defaults Fiscal Space CDS Spreads and Market Pricing of Riskrsquo
Journal of International Money and Finance 34 37-59
Allen F A Babus and E Carletti (2012) Asset commonality debt maturity and
systemic risk Journal of Financial Economics 104(3) 519ndash534
Alter A Beyer A 2013 The dynamics of spillover effects during the European
sovereign debt turmoil Journal of Banking and Finance 42 134-153
Altunbas Y Manganelli S Marques-Ibanez D 2011 Bank risk during the
financial crisis Do business models matter ECB Working Paper No 1394
Ang A Longstaff F 2011 Systemic sovereign credit risk Lessons from the US
and Europe NBER discussion paper 16983
Ayadi R Arbak E De Groen W 2011 Business Models in European Banking A
pre-and post-crisis screening CEPS Paperbacks
34
Banbura M Giannone D Reichlin L 2011 Nowcasting Oxford Handbook on
Economic Forecasting ed by M P Clements and D F Hendry pp 63ndash90 Oxford
University Press
Bank for Internaional Settlements 2010 Guidance for national authorities
operating the countercyclical capital buffer
Bank for Internaional Settlements 2011 Global systemically important banks
Assessment methodology and the additional loss absorbency requirement
Basel Committee on Banking Supervision 2010 Basel III A global regulatory
framework for more resilient banks and banking systems Bank for International
Settlements
Basu S Das S Michailidis G Purnanandam A 2017 A system-wide approach
to measure connectivity in the financial sector Unpublished
Benoit S Colliard J-E Hurlin C Perignon C 2015 Where the risks lie A
survey on systemic risk Unpublished working paper
Billio M Getmansky M Lo A W Pelizzon L 2012 Econometric measures of
systemic risk in the finance and insurance sectors Journal of Financial
Economics 104 535ndash559
Brownlees CT Engle RF 2010 Volatility correlation and tails for systemic
risk measurement Manuscript Stern School of Business New York University
Canova F and Pappa P 2007 Price Differentials in Monetary Unions The Role
of Fiscal Shocks Economic Journal 117 2007 713-737
Castro C Ferrari S 2014 Measuring and testing for the systemically important financial institutions Journal of Empirical Finance 2014 vol 25 issue C 1-14 Cerutti E Claessens S Laeven L 2015 The Use and Effectiveness of
Macroprudential Policies New Evidence IMF Working Paper No 1561
Crockett A 2000 Marrying the Micro- and Macro-prudential Dimensions of
Financial Stability Eleventh International Conference of Banking Supervisors
held in Basel 20-21
35
De Santis R (2012) ldquoThe euro area sovereign debt crisis Safe haven credit
rating agencies and the spread of the fever from Greece Ireland and Portugalrdquo
ECB Working Paper 1419
DellrsquoAriccia G Igan D Laeven L Tong H Bakker B Vandenbussche J 2012
Policies for Macrofinancial Stability How to Deal with Credit Booms IMF Staff
Discussion Note 1206
Demirer M Diebold F Liu L Yilmaz K 2017 Estimating global bank network
connectedness Journal of Applied Eeconometrics forthcoming
Diebold F X Yilmaz K 2009 Measuring Financial Asset Return and Volatility
Spillovers with Application to Global Equity Markets The Economic Journal
119(534) 158-171
Diebold F X Yilmaz K 2012 Better to give than to receive Predictive
directional measurement of volatility spillovers International Journal of
Forecasting Issue 28 pp 57-66
Doan T Litterman R Sims CA 1984 Forecasting and Conditional Projections
Using Realistic Prior Distributions Econometric Reviews 3(4) 1ndash 100
Elliott D J Feldberg G Lehnert A 2013 The History of Cyclical
Macroprudential Policy in the United States Office of Financial Research
Working Paper No 8
European Central Bank 2016 Macroprudential Bulletin Issue 12016
Financial Stability Board 2011 Measures to address systemically important
financial institutions
Fontana A Scheicher M 2010 An analyisis of euro area sovereign CDS and
their relation with government bonds ECB Working Paper Series Issue 1271
Fostel A Geanakoplos J 2008 Leverage Cycles and the Anxious Economy
American Economic Review 98 (4) 1211ndash1244 [2196]
36
Geanakoplos J Pedersen L H 2014 Monitoring leverage In Brunnermeier M
K Krishnamurthy A (Eds) Risk Topography Systemic Risk and Macro
Modeling NBER pp 175ndash182
Giannone D Lenza M Primiceri GE 2012 Prior Selection for Vector
Autoregressions CEPR Discussion Papers 8755 CEPR Discussion Papers
Giglio S Kelly B T Pruitt S 2015 Systemic risk and the macroeconomy An
empirical evaluation Journal of Financial Economics 2016 vol 119 issue 3 457-
471
Goacutemez-Puig M amp Sosvilla-Rivero S (2014) EMU sovereign debt markets crisis
Fundamental-based or pure contagion Institut de Recerca en Economia
Aplicada (IREA) Working Papers Universitat de Barcelona 201402
Huang X Zhou H Zhu H 2012 Systemic Risk Contributions Journal of
Financial Services Research 2012 vol 42 issue 1 55-83
International Monetary Fund 2013a The Interaction of Monetary and
Macroprudential Policies Washington International Monetary Fund
International Monetary Fund 2015a Financial Operations
Koumlhler M 2013 Does non-interest income make banks more risky Retail-
versus investment oriented banks Deutsche Bundesbank Discussion Paper
No172013
Koop G Korobilis D 2010 Bayesian Multivariate Time Series Methods for
Empirical Macroeconomics Foundations and Trends in Econometrics Vol 3 No
4 pp 267-358
Litterman Robert B 1979 Techniques of forecasting using vector
autoregressions Research Department Working Paper 115 Federal Reserve
Bank of Minneapolis Minnesota
37
Longstaff F Pan J Pedersen L Singleton K 201 How Sovereign Is Sovereign
Credit Risk American Economic Journal Macroeconomics 2011 vol 3 issue 2
75-103
Pesaran H Shin Y 1998 Generalized impulse response analysis in linear
mulitvariate models Economic Letters 58(1) 17-29
White H Kim TH Manganelli S 2008 Modeling autoregressive conditional
skewness and kurtosis with multi-quantile CAViaR In Russell J Watson M
(Eds) Volatility and Time Series Econometrics A Festschrift in Honor of Robert
F Engle
Part B
We study 77 banks from 26 developed and emerging economies Data are downloaded from Thomson-Reuters and cover the period from January 1st 2008 to June 30th 2017 The first sample contains 77 banks are from 19 developed economies while the rest are from 6 emerging economies (as of IMFrsquos list) The sample contains most of the banks that are designated as ldquoglobal systemically important banksrdquo (ldquoGSIBrsquosrdquo) as designated by the Basel Committee on Banking Supervision except for three Chinese banks (Agricultural Bank of China Bank of China and Industrial and Commercial Bank of China) and one French bank Group BPCE 43 out of the 77 banks (544) in the sample are from Europe while 28 of them (3544) are headquartered in Eurozone members The sample is extended by adding 19 smaller European banks
B Sample Presentation Bank Details Descriptive Statistics Tables 2a and b presents the 77 banks in the sample in the worldrsquos top 150 as they ordered by assets (Q4 2016) Table A3 presents the share of assets that each home-country holds in the sample as well as the share of assets per developed and emerging countries while Table A4 presents the share of assets per region Table A5 presents the 14 European banks that are added to the initial sample
Table 2a Banks ordered by Total Assets (in US $ billion)
Rank Bank Name Country Total assets
38
US$B
1 Bank of China China 2613 2 Mitsubishi UFJ Financial Group Japan 2597 3 JPMorgan Chase amp Co USA 2490 4 HSBC Holdings UK 2374 5 BNP Paribas France 2196
6 Bank of America USA 2187 7 Wells Fargo USA 1930 8 China Development Bank China 1904 9 Credit Agricole Group France 1821 10 Citigroup USA 1792
11 Mizuho Financial Group Japan 1757 12 Deutsche Bank Germany 1682 13 Sumitomo Mitsui Financial Group Japan 1654 14 Barclays PLC UK 1490 15 Societe Generale France 1461
16 Banco Santander Spain 1416 17 Lloyds Banking Group UK 1004 18 Norinchukin Bank Japan 984 19 Royal Bank of Scotland Group UK 981 20 UBS Group AG Switzerland 919
21 Unicredit SpA Italy 908 22 ING Groep NV Netherlands 893 23 Goldman Sachs Group USA 860 24 Morgan Stanley USA 814 25 Credit Suisse Group Switzerland 806
Table 2a ndash Continued from previous page
26 BBVA Spain 773 27 Intesa Sanpaolo Italy 766 28 Commonwealth Bank of Australia Australia 703 29 Rabobank Group Netherlands 700 30 Australia amp New Zealand Banking Group Australia 661
31 Nordea Sweden 651 32 Standard Chartered Plc UK 646 33 Westpac Banking Corp Australia 607 34 National Australia Bank Australia 562 35 Commerzbank Germany 549
36 Danske Denmark 495 37 State bank of India India 492 38 US Bancorp USA 445 39 The Export-Import Bank of China China 427 40 Sberbank of Russia Russia 420
41 Resona Japan 412 42 Sumitomo Mitsui TH Japan 406 43 Nomura Holdings Japan 370 44 PNC Financial Services USA 366 45 Capital One Financial Corporation USA 357
46 DBS Group Holdings Singapore 332 47 Shinhan Financial Group South Korea 328 48 KBC Group NV Belgium 291 49 Svenska Handelsbanken Sweden 289 50 Skandinaviska Enskilda Banken Sweden 289
51 Hana Financial Group South Korea 288 52 Nationwide Building Society UK 276 53 Korea Development Bank South Korea 268
39
54 Woori Bank South Korea 257 55 Landesbank Baden-Wurttemberg Germany 257
56 Cathay Financial Holding Taiwan 252 57 Swedbank Sweden 237 58 United Overseas Bank (UOB) Singapore 235 59 Dexia Belgium 225 60 Banco Sabadell Spain 224
61 Bayerische Landesbank Germany 224 62 Erste Group Bank AG Austria 220 63 Banco Popular Espanol Spain 204 64 Industrial Bank of Korea South Korea 196 65 Bank of Ireland Ireland 182
66 Malayan Malaysia 161 67 Standard Bank Group South Africa 161 68 Banca Monte dei Paschi di Siena Italy 161 69 American Express USA 158 70 National Bank of Greece Greece 153 71 Macquarie USA 143
72 Credit Lyonnais France 120 73 Comercial Portuguese Portuguese 113 74 Banco Espirito Santo Portugal 112 75 Turkiye is bankasi Turkey 112 76 Mediobanca Italy 95
77 Landesbank Hessen Germany 92
Table 2b Banks ordered by Country
Rank Bank Country Total assets
US$B
1 Commonwealth Bank of Australia Australia 703 2 Australia amp New Zealand Banking Group Australia 661 3 Westpac Banking Corp Australia 607 4 National Australia Bank Australia 562
5 Erste Group Bank AG Austria 220
6 KBC Group NV Belgium 291 7 Dexia Belgium 225
8 Bank of China China 2613 9 China Development Bank China 1904
10 The Export-Import Bank of China China 427
11 Danske Denmark 495
12 BNP Paribas France 2196 13 Credit Agricole Group France 1821 14 Societe Generale France 1461 15 Credit Lyonnais France 120
16 Deutsche Bank Germany 1682 17 Commerzbank Germany 549 18 Landesbank Baden-Wurttemberg Germany 257 19 Bayerische Landesbank Germany 224 20 Landesbank Hessen Germany 92
21 National Bank of Greece Greece 153
22 State bank of India India 492
23 Bank of Ireland Ireland 182
24 Unicredit SpA Italy 908 25 Intesa Sanpaolo Italy 766
40
26 Banca Monte dei Paschi di Siena Italy 161 27 Mediobanca Italy 95
28 Mitsubishi UFJ Financial Group Japan 2597 29 Mizuho Financial Group Japan 1757 30 Sumitomo Mitsui Financial Group Japan 1654 31 Norinchukin Bank Japan 984 32 Resona Japan 412 33 Sumitomo Mitsui TH Japan 406 34 Nomura Holdings Japan 370 35 Yamaguchi Financial Group Japan 93
36 ING Groep NV Netherlands 893 37 Rabobank Group Netherlands 700
38 Banco Espirito Santo Portugal 111
39 Sberbank of Russia Russia 420
40 DBS Group Holdings Singapore 332 41 United Overseas Bank (UOB) Singapore 235 42 Standard Bank Group South Africa 161
43 Shinhan Financial Group South Korea 328 44 Hana Financial Group South Korea 288 45 Korea Development Bank South Korea 268 46 Woori Bank South Korea 257 47 Industrial Bank of Korea South Korea 196
48 Banco Santander Spain 1416 49 BBVA Spain 773 50 Banco Sabadell Spain 224 51 Banco Popular Espanol Spain 204
Table 2b ndash Continued from previous page
53 Nordea Sweden 651 54 Svenska Handelsbanken Sweden 289 55 Skandinaviska Enskilda Banken Sweden 289 56 Swedbank Sweden 237
57 UBS Group AG Switzerland 919 58 Credit Suisse Group Switzerland 806
59 Cathay Financial Holding Taiwan 252
60 Turkiye is bankasi Turkey 112
61 HSBC Holdings UK 2374 62 Barclays PLC UK 1490 63 Lloyds Banking Group UK 1004 64 Royal Bank of Scotland Group UK 981 65 Standard Chartered Plc UK 646 66 Nationwide Building Society UK 276
68 JPMorgan Chase amp Co USA 2490 69 Bank of America USA 2187 70 Wells Fargo USA 1930 71 Citigroup USA 1792 72 Goldman Sachs Group USA 860 73 Morgan Stanley USA 814 74 US Bancorp USA 445 75 PNC Financial Services USA 366 76 Capital One Financial Corporation USA 357 77 American Express USA 158 78 Macquarie USA 143
41
Table 3a Banksrsquo home-countries ordered by the sum of total bank assets
Developed Total Assets Developing Total Assets USA 11547 China 4944 Japan 7867 India 492 UK 6936 Russia 420 France 5599 Taiwan 252 Germany 2994 South Africa 161 Spain 2617 Turkey 112
Australia 2534 Italy 1933 Switzerland 1725
Netherlands 1584 Sweden 1467 South Korea 1340 Singapore 568 Belgium 516 Denmark 495 Ireland 344 Austria 220 Greece 153 Portugal 111 Total Assets of banks that are headquartered in
Developed 5055366 Emerging 63823 of total assets 888 of total assets 112
42
Table 3b Regional details
Region Number of Banks Total bank
assets of total
assets
Europe 40 2669673 473
Asia 21 1557658 275
N America 11 1154724 204
Oceania 4 2534 45
Africa 1 161 03
B Data Definitions and Descriptive Statistics
Table 4 Data Definitions
Variable Description
Endogenous CDS CDS 5-year spread
Exogenous Systemic risk
CDX The family of CDS indeces covering North America
VIX The volatiliy index of SampP 500
US 3-month T Bill The short-term obligation backed by the Treasury Dept of the US goverment
Bank-specific Size Total assets
Retail orientation Total Loans Total assets
Diversification Non-interest income Total revenues
NPLs Non-performing loans Total Loans
Country-specific
GDP Each bankrsquos home-country GDP growth
Budget Balance Current AccountGDP
Public Debt Public DebtGDP
43
Table 5 Descriptive Statistics
Panel A Systemic risk factor
CDX VIX TED
Mean 269E-06 -0000123 -000121 Median 0000 -0001 0000 Maximum 0020 0176 0250 Minimum -0009 -0152 -0750
Std Dev 0001 0031 0033 Skewness 4689 0689 -17326
Kurtosis 106047 6789 377496 Jarque-Bera 1105896 1679364 14610377 Probability 0000 0000 0000
Sum 0007 -0304 -3000 Sum Sq Dev 0003 2427 2746
Note CDX and VIX are in log differences TED spread is in first differences
Panel B Bank specific
Assets Loans_to_Assets Non_Interest_Inc NPLs
Mean 732382 55596 2442 4601
Median 458009 59921 2378 2411
Maximum 3030645 8664 8640 35217
44
Minimum 4354387 9070 -5962 01082
Std Dev 7460013 17017 1481 5612
Skewness 1081 -0641 -0694 2376
Kurtosis 30129 2584 6193 9630
Jarque-Bera 7023 272888 182117 999501
Probability 0000 0000 0000 0000
Sum 264E+09 2003702 8803746 1658430 Sum Sq Dev 201E+15 1043392 7908036 1134867
Note Data are in levels
Part C ndash Global Sample
Table 7 Individual systemic importance
Panel A ndash Ranked by total score Rank by score
Rank by bank assets Bank Name
Home-Country Region
Assets (billion
US $) Score
To others (Aggr)
From others (Aggr)
1 27 Intesa Sanpaolo Italy Europe 766 1056 0505 0551
2 16 Banco Santander Spain Europe 1416 1038 0464 0574
3 26 BBVA Spain Europe 773 0987 0454 0533
4 5 BNP Paribas France Europe 2196 0982 0445 0537
5 21 Unicredit SpA Italy Europe 908 0975 0489 0485
6 14 Barclays PLC UK Europe 1490 0961 0454 0507
7 12 Deutsche Bank Germany Europe 1682 0954 0428 0526
8 9 Credit Agricole Group France Europe 1821 0942 0424 0518
9 15 Societe Generale France Europe 1461 0940 0427 0512
10 72 Credit Lyonnais France Europe 120 0938 0445 0493
11 17 Lloyds Banking Group UK Europe 1004 0925 0438 0487
12 25 Credit Suisse Group Switz Europe 806 0907 0376 0531
13 35 Commerzbank Germany Europe 549 0904 0410 0494
14 20 UBS Group AG Switz Europe 919 0890 0387 0503
15 32 Standard Chartered Plc UK Europe 646 0870 0419 0451
16 68 Banca Monte dei Paschi Italy Europe 161 0861 0429 0433
45
17 19
Royal Bank of Scotland Group
UK Europe 981 0845 0423 0423
18 29 Rabobank Group Netherl Europe 700 0841 0376 0465
19 22 ING Groep NV Netherl Europe 893 0823 0374 0449
20 76 Mediobanca Italy Europe 95 0821 0389 0433
21 24 Morgan Stanley USA N Amer 814 0752 0315 0437
22 69 American Express USA N Amer 158 0736 0332 0404
23 6 Bank of America USA N Amer 2187 0716 0318 0398
24 23 Goldman Sachs Group USA N Amer 860 0711 0302 0410
25 10 Citigroup USA N Amer 1792 0706 0313 0393
26 4 HSBC Holdings UK Europe 2374 0695 0372 0323
27 62 Erste Group Bank AG Austria Europe 220 0688 0314 0375
28 49 Svenska Handelsbanken Sweden Europe 289 0678 0281 0397
29 53
Korea Development Bank
S Korea Asia 268 0677 0393 0284
30 60 Banco Sabadell Spain Europe 224 0670 0295 0375
31 36 Danske Denmark Europe 495 0663 0296 0367
32 45
Capital One Financial Corp
USA N Amer 357 0662 0260 0401
33 3 JPMorgan Chase amp Co USA N Amer 2490 0658 0257 0401
34 7 Wells Fargo USA N Amer 1930 0653 0259 0394
35 34 National Australia Bank Australia Oceania 562 0622 0376 0247
Table continued on next page
Table 3- Panel A continued from previous page
36 2 Mitsubishi UFJ Financial Japan Asia 2597 0621 0223 0398
37 47 Shinhan Financial Group S Korea Asia 328 0615 0331 0283
38 54 Woori Bank S Korea Asia 257 0612 0333 0278
39 64 Industrial Bank of Korea S Korea Asia 196 0603 0341 0261
40 28 Commonwealth Bank Australia Oceania 703 0599 0388 0211
41 40 Sberbank of Russia Russia Europe 420 0598 0294 0305
42 30 Australia amp N Zealand Australia Oceania 661 0597 0383 0214
43 50 Skandinaviska Enskilda Sweden Europe 289 0578 0262 0316
44 31 Nordea Sweden Europe 651 0574 0289 0285
45 71 Macquarie USA N Amer 143 0572 0321 0251
46 48 KBC Group NV Belgium Europe 291 0568 0241 0327
47 63 Banco Popular Espanol Spain Europe 204 0558 0297 0261
48 61 Bayerische Landesbank Germany Europe 224 0552 0249 0303
49 39 The Export-Import Bank China Asia 427 0548 0284 0264
50 1 Bank of China China Asia 2613 0548 0276 0272
51 66 Malayan Malaysia Asia 171 0543 0321 0223
52 33 Westpac Banking Corp Australia Oceania 606 0540 0374 0166
53 37 State bank of India India Asia 492 0530 0238 0291
54 51 Hana Financial Group S Korea Asia 288 0518 0290 0227
55 57 Swedbank Sweden Europe 237 0486 0253 0233
56 8 China Development Bank China Asia 1904 0468 0260 0208
46
57 52 Nationwide Building Society UK Europe 276 0463 0217 0246
58 59 Dexia Belgium Europe 225 0409 0197 0212
59 46 DBS Group Holdings Singapore Asia 332 0397 0212 0186
60 65 Bank of Ireland Ireland Europe 182 0379 0197 0182
61 58 United Overseas Bank Singapore Asia 235 0373 0214 0159
62 11 Mizuho Financial Group Japan Asia 1757 0367 0271 0096
63 67 Standard Bank Group S Africa Africa 161 0365 0123 0242
64 74 Espirito Santos Portugal Europe 112 0362 0186 0176
65 41 Resona Japan Asia 412 0357 0263 0094
66 13 Sumitomo Mitsui Financial Japan Asia 1654 0355 0250 0104
67 38 US Bancorp USA N Amer 445 0353 0188 0165
68 55 Landesbank Baden-Wurtt Germany Europe 257 0340 0170 0171
69 42 Sumitomo Mitsui TH Japan Asia 406 0323 0273 0050
70 56 Cathay Financial Holding Taiwan Asia 252 0298 0189 0109
71 73 Comercial Portuguese Portugal Europe 113 0279 0268 0011
72 70 National Bank of Greece Greece Europe 153 0220 0176 0044
73 18 Norinchukin Bank Japan Asia 984 0215 0164 0050
74 43 Nomura Holdings Japan Asia 370 0197 0161 0035
75 77 Landesbank Hessen Germany Europe 92 0159 0089 0071
76 44 PNC Financial Services USA N Amer 366 0078 0034 0043
77 75 Turkiye is bankasi Turkey Europe 112 0037 0030 0007
Note Results concern the period January 2008 ndash June 2017 and are of daily frequency
Table 9 Systemic contribution per bank (January 2008 ndash June 2017)
Rank Bank Name SC Rank Bank Name SC Rank Bank Name SC Rank Bank Name SC
1 Intesa Sanpaolo
225 21 Morgan Stanley 160 41 Sberbank of Russia
128 61 United Overseas
080
2 Banco Santander
221 22 American Express
157 42 Australia amp N Zealand
127 62 Mizuho Financial
078
3 BBVA 210 23 Bank of America
153 43 Skandinaviska Enskilda
123 63 Standard Bank Group
078
4 BNP Paribas 209 24 Goldman Sachs Group
152 44 Nordea 122 64 Espirito Santos
077
5 Unicredit SpA
208 25 Citigroup 151 45 Macquarie 122 65 Resona 076
6 Barclays PLC 205 26 HSBC Holdings 148 46 KBC Group NV
121 66 Sumitomo Mitsui
076
7 Deutsche Bank
203 27 Erste Group 147 47 Banco Popular
119 67 US Bancorp
075
8 Credit Agricole
201 28 Svenska 145 48 Bayerische Landesbank
118 68 Landesbank 072
9 Societe Generale
200 29 Korea Development Bank
144 49 The Export-Import
117 69 Sumitomo Mitsui TH
069
10 Credit Lyonnais
200 30 Banco Sabadell 143 50 Bank of China 117 70 Cathay Financial
064
11 Lloyds Banking
197 31 Danske 141 51 Malayan 116 71 Comercial Portuguese
059
47
12 Credit Suisse Group
193 32 Capital One Financial Corp
141 52 Westpac Banking Corp
115 72 NBG 047
13 Commerzbank 193 33 JPMorgan Chase amp Co
140 53 State bank of India
113 73 Norinchukin Bank
046
14 UBS Group AG 190 34 Wells Fargo 139 54 Hana Financial Group
110 74 Nomura Holdings
042
15 Standard Chartered
186 35 National Australia Bank
133 55 Swedbank 104 75 Landesbank Hessen
034
16 Banca Monte dei
184 36 Mitsubishi UFJ Financial
132 56 China Development
100 76 PNC Financial Services
017
17 RBS 180 37 Shinhan Financial Group
131 57 Nationwide Building
099 77 Turkiye is bankasi
008
18 Rabobank Group
179 38 Woori Bank 130 58 Dexia 087
19 ING Groep NV 175 39 Industrial Bank of Korea
129 59 DBS Group Holdings
085
20 Mediobanca 175 40 Commonwealth Bank
128 60 Bank of Ireland
081
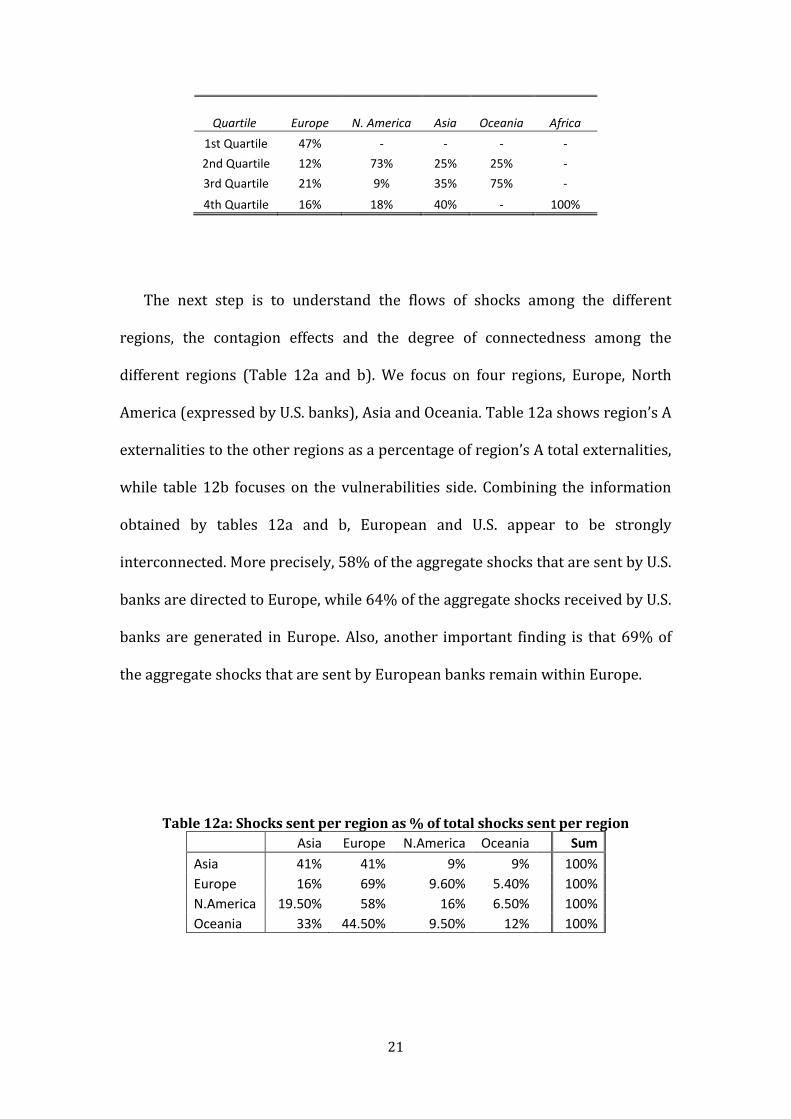
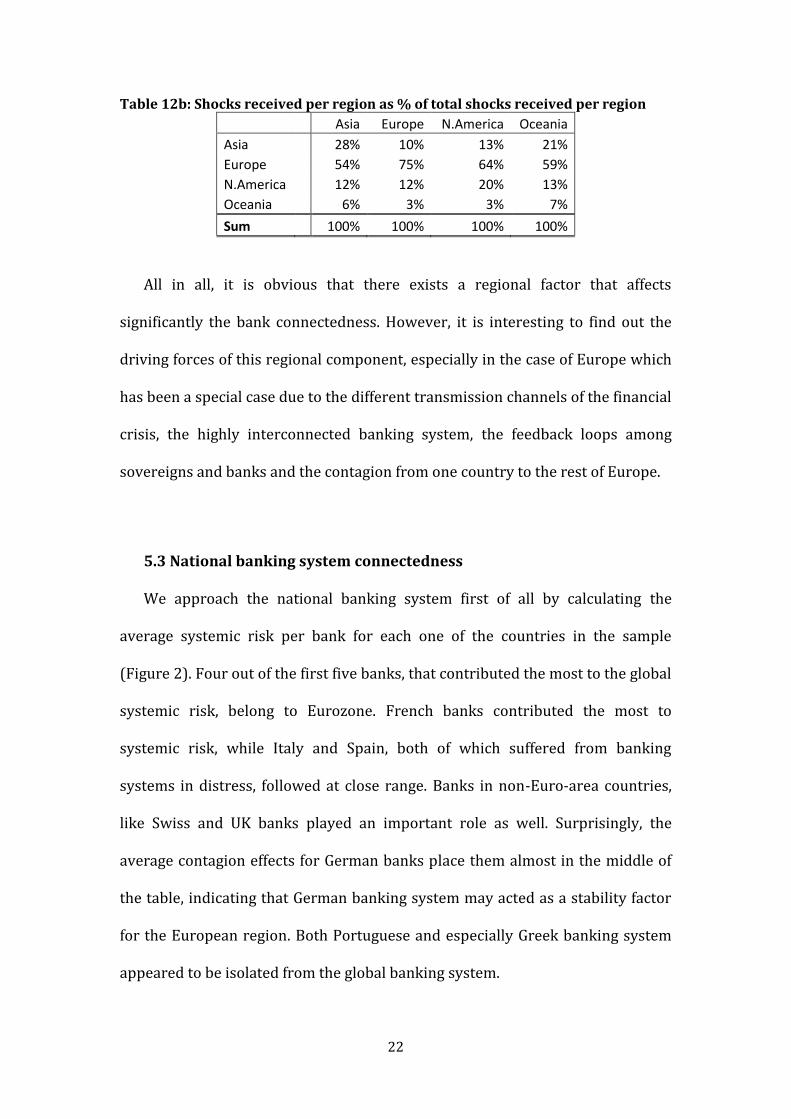
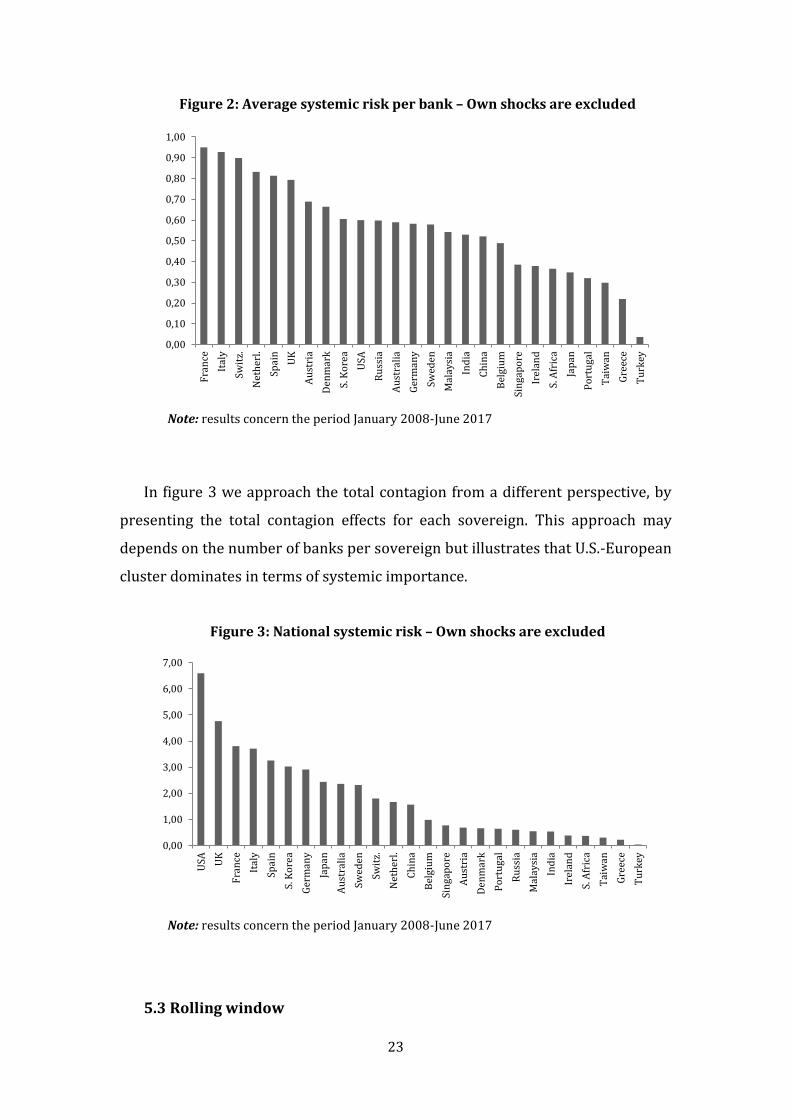
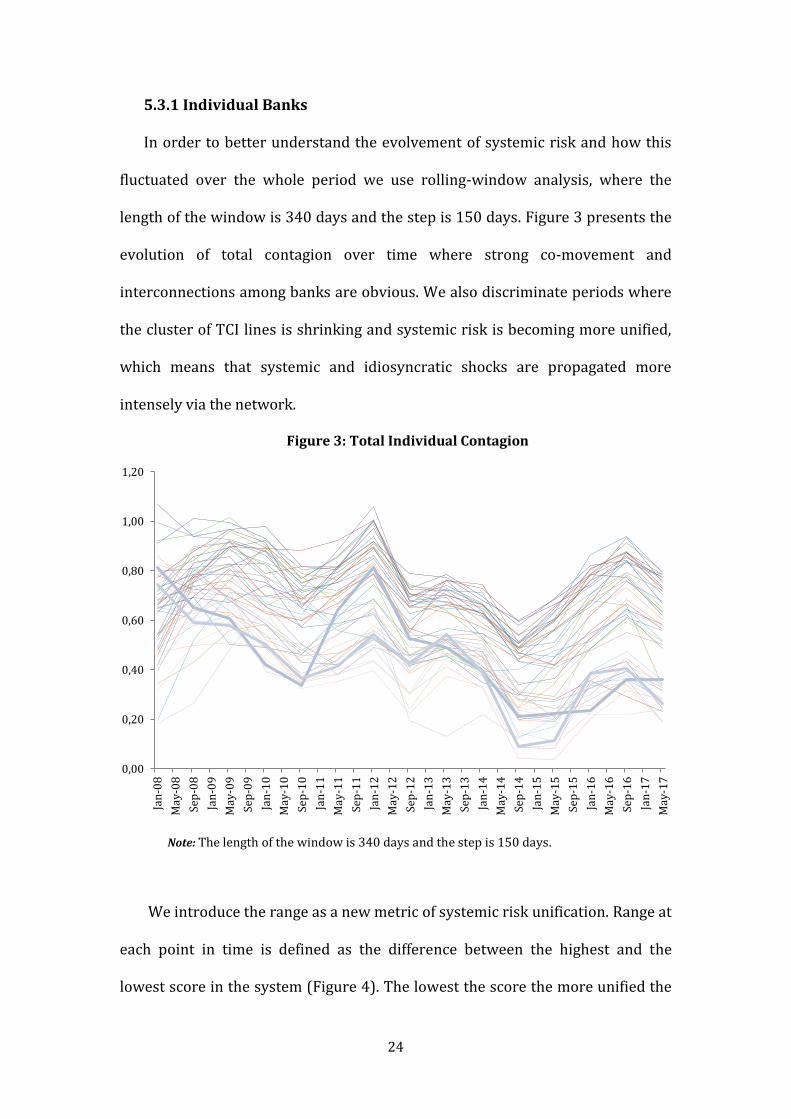
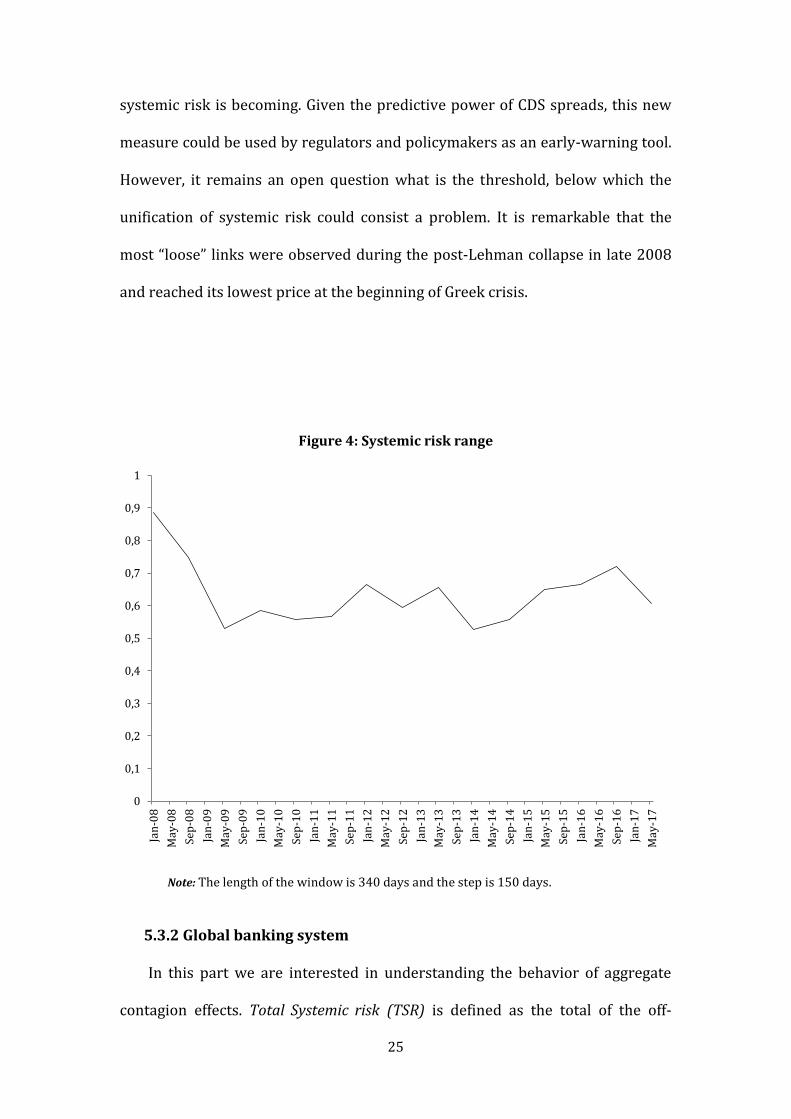
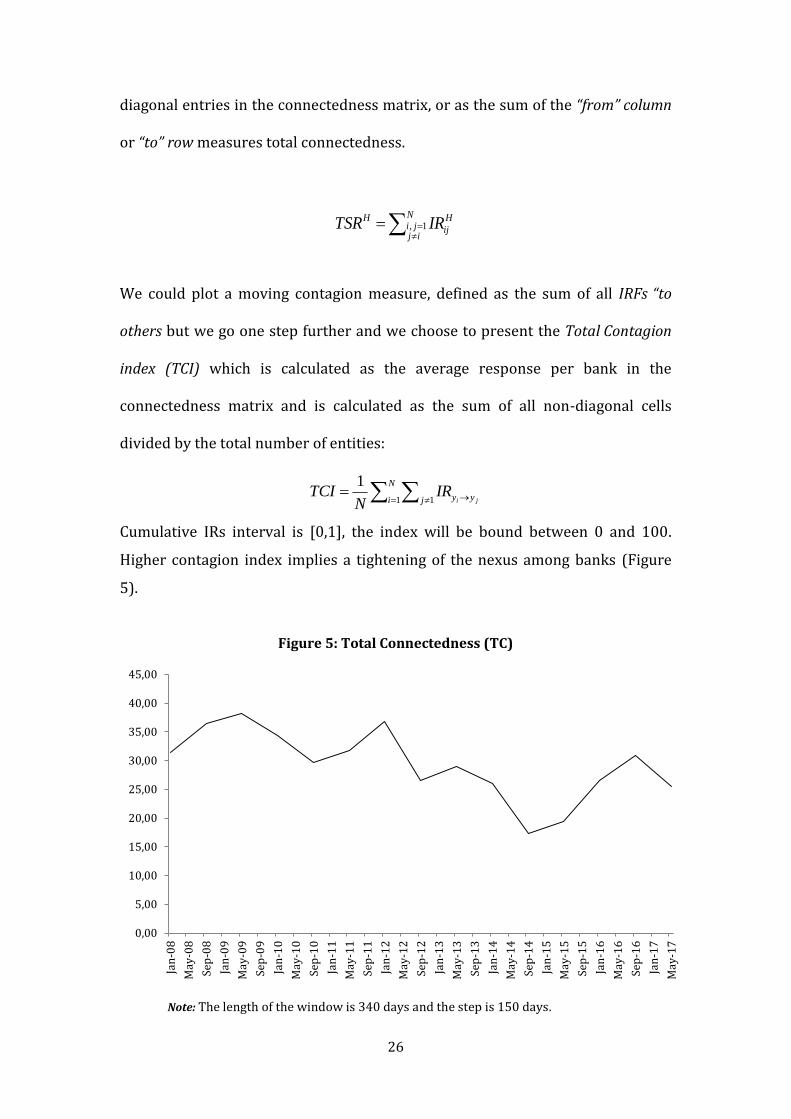
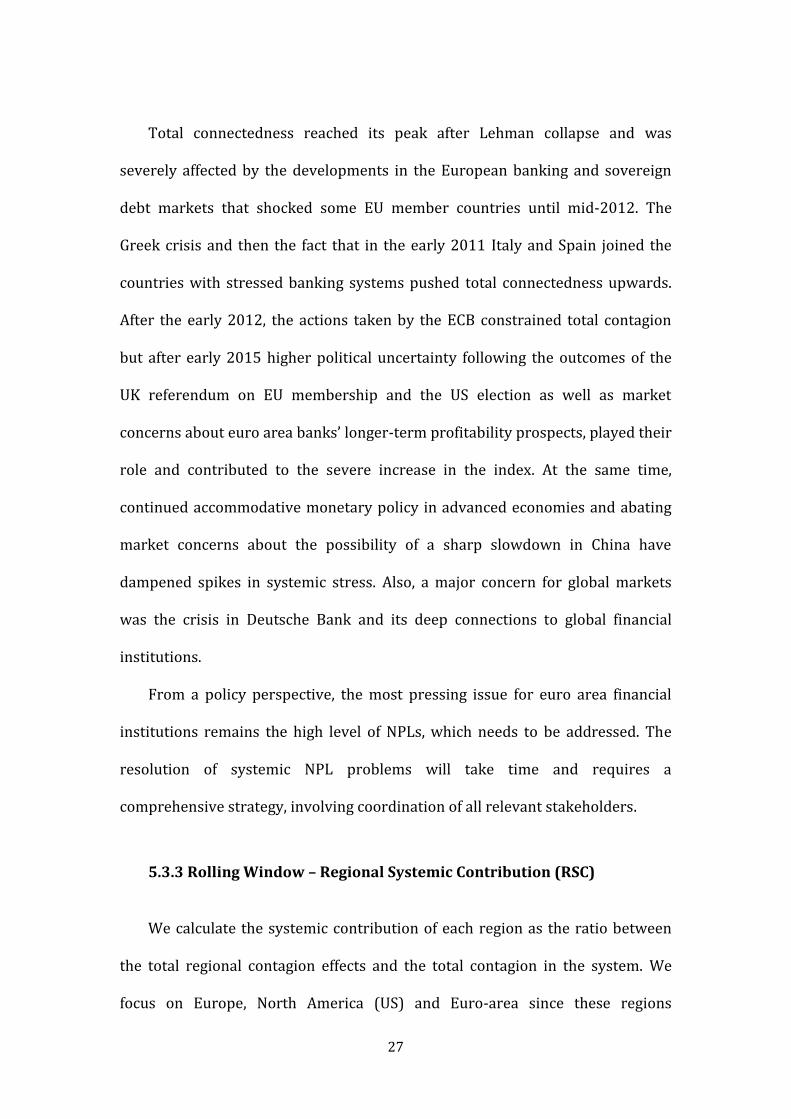
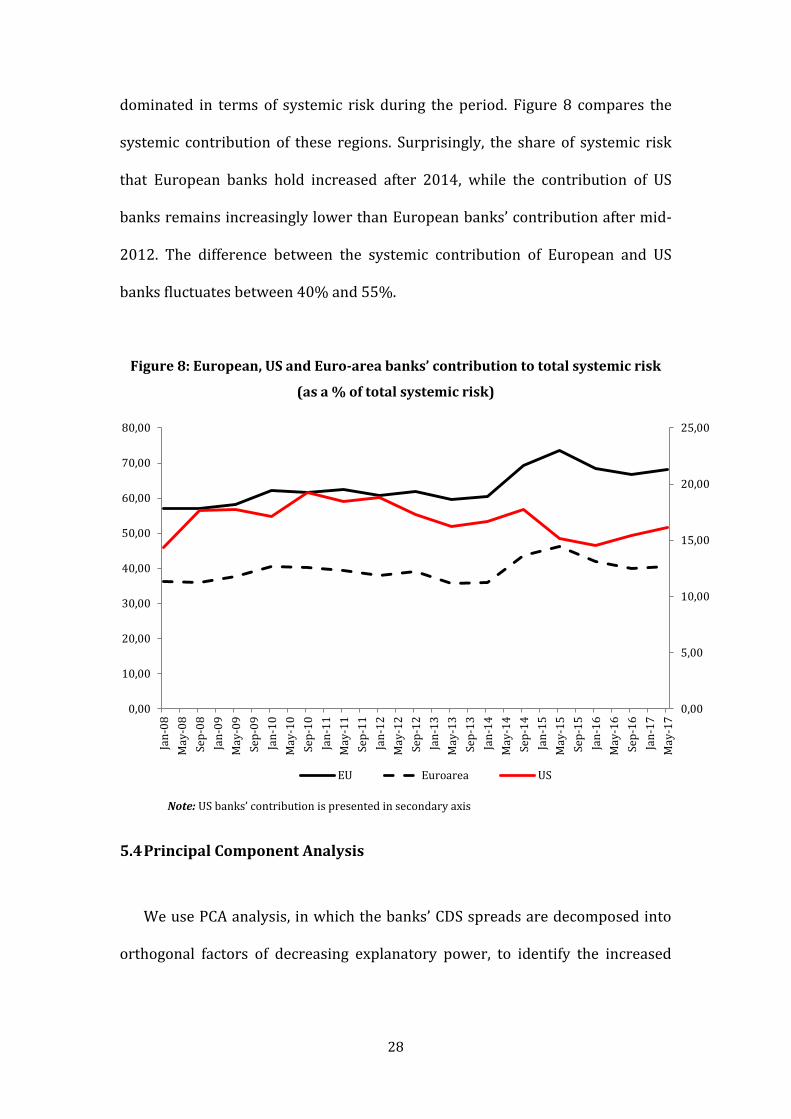
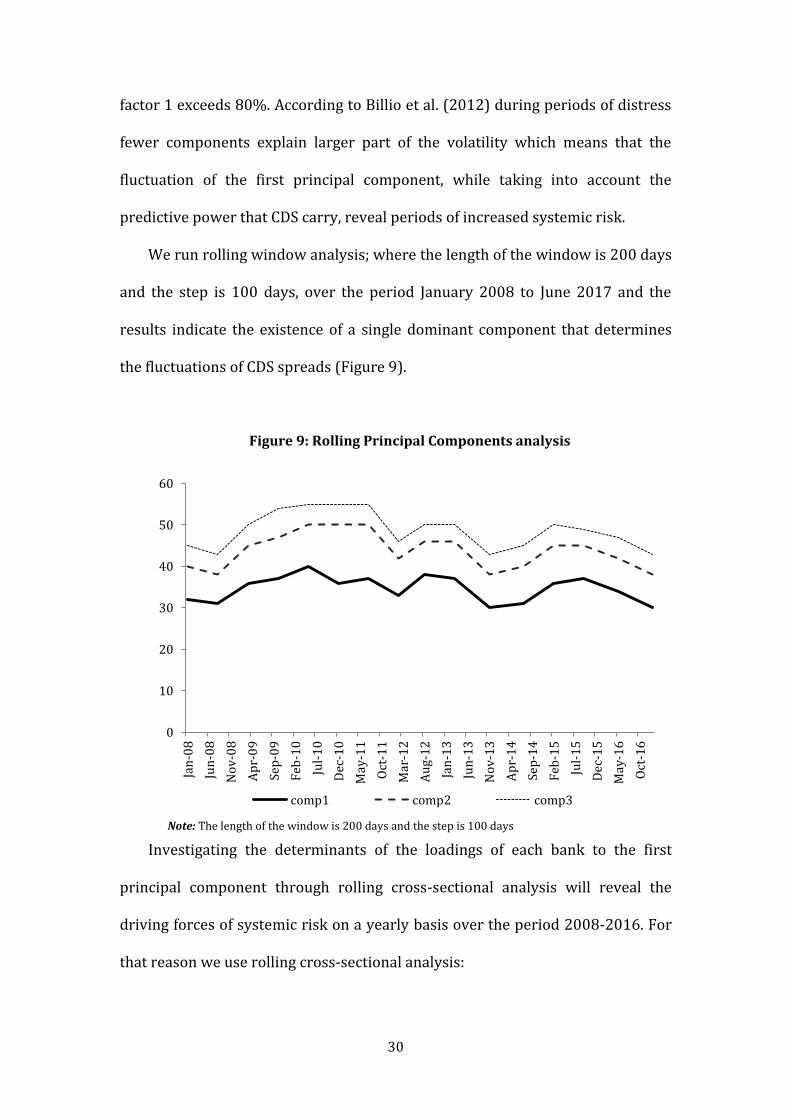
30
factor 1 exceeds 80 According to Billio et al (2012) during periods of distress
fewer components explain larger part of the volatility which means that the
fluctuation of the first principal component while taking into account the
predictive power that CDS carry reveal periods of increased systemic risk
We run rolling window analysis where the length of the window is 200 days
and the step is 100 days over the period January 2008 to June 2017 and the
results indicate the existence of a single dominant component that determines
the fluctuations of CDS spreads (Figure 9)
Figure 9 Rolling Principal Components analysis
Note The length of the window is 200 days and the step is 100 days
Investigating the determinants of the loadings of each bank to the first
principal component through rolling cross-sectional analysis will reveal the
driving forces of systemic risk on a yearly basis over the period 2008-2016 For
that reason we use rolling cross-sectional analysis
0
10
20
30
40
50
60
Jan
-08
Jun
-08
No
v-0
8
Ap
r-0
9
Sep
-09
Feb
-10
Jul-
10
Dec
-10
May
-11
Oct
-11
Mar
-12
Au
g-1
2
Jan
-13
Jun
-13
No
v-1
3
Ap
r-1
4
Sep
-14
Feb
-15
Jul-
15
Dec
-15
May
-16
Oct
-16
comp1 comp2 comp3
31
ii
iiiiiii
Debt
SurplusGDPNIINPLsLoansAssetsay
7
654321
yi is each bankrsquos loading to the first component
We search among the following bank-specific characteristics total value of
bank assets (logs) retail orientation the total loanstotal assets (levels) NPLs
total loans (levels) and non-interest income total revenue and among the
following home-country specific characteristics GDP growth primary
surplusGDP (levels) public debtGDP (levels) We manage to match 47 banks to
bank-specific characteristics
Table 13 Determinants of each bankrsquos loadings in the first component over the nine
periods
2008 2009 2010 2011 2012 2013 2014 2015 2016
Size -0012 -0002 -0007 -0012 0001 0004 0001 -0002 -0003
(0008) (0007) (0006) (0006) (0007) (0006) (0010) (0008) (0009)
Loan-to-assets -0048 -0142 -0113 -0136 -0135 -0114 -0212 -0210 -0239
(0043) (0051) (0051) (0051) (0054) (0051) (0078) (0069) (0074)
NPLs 0844 0414 0352 0035 0004 -0097 0333 0304 0194
(0349) (0253) (0187) (0183) (0054) (0139) (0187) (0147) (0174)
Non-interest-income 0000 0000 0001 0000 0001 0000 0001 0000 0000
(0000) (0000) (0006) (0006) (0000) (0000) (0000) (0000) (0000)
GDP -0004 -0003 -0006 -0003 -0009 -0009 -0011 -0004 -0007
(0004) (0002) (0001) (0003) (0054) (0003) (0005) (0001) (0006)
Primary SurplusGDP 0000 -0002 0002 0000 -0002 -0004 -0009 -0014 -0012
(0002) (0001) (0001) (0170) (0054) (0003) (0004) (0004) (0005)
DebtGDP -0001 -00005 -00006 -0001 -00007 -00005 -00005 0000 -0000
(0000) (0000) (0000) (0000) (0054) (0000) (0000) (0000) (0000)
_cons 0300 0235 0297 0372 0248 0229 0252 0283 0323
(0080) (0076) (0068) (0078) (0054) (0072) (0111) (0094) (0107)
Note 1 510
32
6 Conclusions
Macroprudential policy is still in its infancy Much work is still needed on
developing good and timely analysis effective policy instrument tools and
effective implementation Our paper makes a contribution on the dimension of
analysis and measurement The key aim of macroprudential policy is to address
externalities and spillovers among financial institutions in an effort to safeguard
financial stability These interactions are complex We provide a tool for
clarifying and quantifying these interactions Our measures can guide
appropriate macroprudential policies that aim to internalize these externalities
A key conclusion from our study is that the focus on size does not adequately
address the systemic importance of banks
33
References
Acharya V Engle R Richardson M 2012 Capital Shortfall A New Approach to
Ranking and Regulating Systemic Risks American Economic Review Vol102 No
3
Acharya V Pedersen L Philippon T Richardson M 2010 Measuring systemic
risk Technical Report Department of Finance NYU
Acharya V Drechsler I Schnabl P 2014 A Pyrrhic Victory Bank Bailouts and
Sovereign Credit Risk Journal of Finance 2014 vol 69 issue 6 2689-2739
Adams Z Fuss R Gropp R 2014 Spillover Effects among Financial
Institutions A State-Dependent Sensitivity Value-at-Risk (SDSVaR) Approach
Journal of Financial and Quantitative Analysis (JFQA) Vol 49 No 3
Adrian T Brunnermeier M 2009 CoVaR Manuscript Princeton University
Aizenman J Hutchison H and JinjarakY (2013) lsquoWhat is the Risk of European
Sovereign Debt Defaults Fiscal Space CDS Spreads and Market Pricing of Riskrsquo
Journal of International Money and Finance 34 37-59
Allen F A Babus and E Carletti (2012) Asset commonality debt maturity and
systemic risk Journal of Financial Economics 104(3) 519ndash534
Alter A Beyer A 2013 The dynamics of spillover effects during the European
sovereign debt turmoil Journal of Banking and Finance 42 134-153
Altunbas Y Manganelli S Marques-Ibanez D 2011 Bank risk during the
financial crisis Do business models matter ECB Working Paper No 1394
Ang A Longstaff F 2011 Systemic sovereign credit risk Lessons from the US
and Europe NBER discussion paper 16983
Ayadi R Arbak E De Groen W 2011 Business Models in European Banking A
pre-and post-crisis screening CEPS Paperbacks
34
Banbura M Giannone D Reichlin L 2011 Nowcasting Oxford Handbook on
Economic Forecasting ed by M P Clements and D F Hendry pp 63ndash90 Oxford
University Press
Bank for Internaional Settlements 2010 Guidance for national authorities
operating the countercyclical capital buffer
Bank for Internaional Settlements 2011 Global systemically important banks
Assessment methodology and the additional loss absorbency requirement
Basel Committee on Banking Supervision 2010 Basel III A global regulatory
framework for more resilient banks and banking systems Bank for International
Settlements
Basu S Das S Michailidis G Purnanandam A 2017 A system-wide approach
to measure connectivity in the financial sector Unpublished
Benoit S Colliard J-E Hurlin C Perignon C 2015 Where the risks lie A
survey on systemic risk Unpublished working paper
Billio M Getmansky M Lo A W Pelizzon L 2012 Econometric measures of
systemic risk in the finance and insurance sectors Journal of Financial
Economics 104 535ndash559
Brownlees CT Engle RF 2010 Volatility correlation and tails for systemic
risk measurement Manuscript Stern School of Business New York University
Canova F and Pappa P 2007 Price Differentials in Monetary Unions The Role
of Fiscal Shocks Economic Journal 117 2007 713-737
Castro C Ferrari S 2014 Measuring and testing for the systemically important financial institutions Journal of Empirical Finance 2014 vol 25 issue C 1-14 Cerutti E Claessens S Laeven L 2015 The Use and Effectiveness of
Macroprudential Policies New Evidence IMF Working Paper No 1561
Crockett A 2000 Marrying the Micro- and Macro-prudential Dimensions of
Financial Stability Eleventh International Conference of Banking Supervisors
held in Basel 20-21
35
De Santis R (2012) ldquoThe euro area sovereign debt crisis Safe haven credit
rating agencies and the spread of the fever from Greece Ireland and Portugalrdquo
ECB Working Paper 1419
DellrsquoAriccia G Igan D Laeven L Tong H Bakker B Vandenbussche J 2012
Policies for Macrofinancial Stability How to Deal with Credit Booms IMF Staff
Discussion Note 1206
Demirer M Diebold F Liu L Yilmaz K 2017 Estimating global bank network
connectedness Journal of Applied Eeconometrics forthcoming
Diebold F X Yilmaz K 2009 Measuring Financial Asset Return and Volatility
Spillovers with Application to Global Equity Markets The Economic Journal
119(534) 158-171
Diebold F X Yilmaz K 2012 Better to give than to receive Predictive
directional measurement of volatility spillovers International Journal of
Forecasting Issue 28 pp 57-66
Doan T Litterman R Sims CA 1984 Forecasting and Conditional Projections
Using Realistic Prior Distributions Econometric Reviews 3(4) 1ndash 100
Elliott D J Feldberg G Lehnert A 2013 The History of Cyclical
Macroprudential Policy in the United States Office of Financial Research
Working Paper No 8
European Central Bank 2016 Macroprudential Bulletin Issue 12016
Financial Stability Board 2011 Measures to address systemically important
financial institutions
Fontana A Scheicher M 2010 An analyisis of euro area sovereign CDS and
their relation with government bonds ECB Working Paper Series Issue 1271
Fostel A Geanakoplos J 2008 Leverage Cycles and the Anxious Economy
American Economic Review 98 (4) 1211ndash1244 [2196]
36
Geanakoplos J Pedersen L H 2014 Monitoring leverage In Brunnermeier M
K Krishnamurthy A (Eds) Risk Topography Systemic Risk and Macro
Modeling NBER pp 175ndash182
Giannone D Lenza M Primiceri GE 2012 Prior Selection for Vector
Autoregressions CEPR Discussion Papers 8755 CEPR Discussion Papers
Giglio S Kelly B T Pruitt S 2015 Systemic risk and the macroeconomy An
empirical evaluation Journal of Financial Economics 2016 vol 119 issue 3 457-
471
Goacutemez-Puig M amp Sosvilla-Rivero S (2014) EMU sovereign debt markets crisis
Fundamental-based or pure contagion Institut de Recerca en Economia
Aplicada (IREA) Working Papers Universitat de Barcelona 201402
Huang X Zhou H Zhu H 2012 Systemic Risk Contributions Journal of
Financial Services Research 2012 vol 42 issue 1 55-83
International Monetary Fund 2013a The Interaction of Monetary and
Macroprudential Policies Washington International Monetary Fund
International Monetary Fund 2015a Financial Operations
Koumlhler M 2013 Does non-interest income make banks more risky Retail-
versus investment oriented banks Deutsche Bundesbank Discussion Paper
No172013
Koop G Korobilis D 2010 Bayesian Multivariate Time Series Methods for
Empirical Macroeconomics Foundations and Trends in Econometrics Vol 3 No
4 pp 267-358
Litterman Robert B 1979 Techniques of forecasting using vector
autoregressions Research Department Working Paper 115 Federal Reserve
Bank of Minneapolis Minnesota
37
Longstaff F Pan J Pedersen L Singleton K 201 How Sovereign Is Sovereign
Credit Risk American Economic Journal Macroeconomics 2011 vol 3 issue 2
75-103
Pesaran H Shin Y 1998 Generalized impulse response analysis in linear
mulitvariate models Economic Letters 58(1) 17-29
White H Kim TH Manganelli S 2008 Modeling autoregressive conditional
skewness and kurtosis with multi-quantile CAViaR In Russell J Watson M
(Eds) Volatility and Time Series Econometrics A Festschrift in Honor of Robert
F Engle
Part B
We study 77 banks from 26 developed and emerging economies Data are downloaded from Thomson-Reuters and cover the period from January 1st 2008 to June 30th 2017 The first sample contains 77 banks are from 19 developed economies while the rest are from 6 emerging economies (as of IMFrsquos list) The sample contains most of the banks that are designated as ldquoglobal systemically important banksrdquo (ldquoGSIBrsquosrdquo) as designated by the Basel Committee on Banking Supervision except for three Chinese banks (Agricultural Bank of China Bank of China and Industrial and Commercial Bank of China) and one French bank Group BPCE 43 out of the 77 banks (544) in the sample are from Europe while 28 of them (3544) are headquartered in Eurozone members The sample is extended by adding 19 smaller European banks
B Sample Presentation Bank Details Descriptive Statistics Tables 2a and b presents the 77 banks in the sample in the worldrsquos top 150 as they ordered by assets (Q4 2016) Table A3 presents the share of assets that each home-country holds in the sample as well as the share of assets per developed and emerging countries while Table A4 presents the share of assets per region Table A5 presents the 14 European banks that are added to the initial sample
Table 2a Banks ordered by Total Assets (in US $ billion)
Rank Bank Name Country Total assets
38
US$B
1 Bank of China China 2613 2 Mitsubishi UFJ Financial Group Japan 2597 3 JPMorgan Chase amp Co USA 2490 4 HSBC Holdings UK 2374 5 BNP Paribas France 2196
6 Bank of America USA 2187 7 Wells Fargo USA 1930 8 China Development Bank China 1904 9 Credit Agricole Group France 1821 10 Citigroup USA 1792
11 Mizuho Financial Group Japan 1757 12 Deutsche Bank Germany 1682 13 Sumitomo Mitsui Financial Group Japan 1654 14 Barclays PLC UK 1490 15 Societe Generale France 1461
16 Banco Santander Spain 1416 17 Lloyds Banking Group UK 1004 18 Norinchukin Bank Japan 984 19 Royal Bank of Scotland Group UK 981 20 UBS Group AG Switzerland 919
21 Unicredit SpA Italy 908 22 ING Groep NV Netherlands 893 23 Goldman Sachs Group USA 860 24 Morgan Stanley USA 814 25 Credit Suisse Group Switzerland 806
Table 2a ndash Continued from previous page
26 BBVA Spain 773 27 Intesa Sanpaolo Italy 766 28 Commonwealth Bank of Australia Australia 703 29 Rabobank Group Netherlands 700 30 Australia amp New Zealand Banking Group Australia 661
31 Nordea Sweden 651 32 Standard Chartered Plc UK 646 33 Westpac Banking Corp Australia 607 34 National Australia Bank Australia 562 35 Commerzbank Germany 549
36 Danske Denmark 495 37 State bank of India India 492 38 US Bancorp USA 445 39 The Export-Import Bank of China China 427 40 Sberbank of Russia Russia 420
41 Resona Japan 412 42 Sumitomo Mitsui TH Japan 406 43 Nomura Holdings Japan 370 44 PNC Financial Services USA 366 45 Capital One Financial Corporation USA 357
46 DBS Group Holdings Singapore 332 47 Shinhan Financial Group South Korea 328 48 KBC Group NV Belgium 291 49 Svenska Handelsbanken Sweden 289 50 Skandinaviska Enskilda Banken Sweden 289
51 Hana Financial Group South Korea 288 52 Nationwide Building Society UK 276 53 Korea Development Bank South Korea 268
39
54 Woori Bank South Korea 257 55 Landesbank Baden-Wurttemberg Germany 257
56 Cathay Financial Holding Taiwan 252 57 Swedbank Sweden 237 58 United Overseas Bank (UOB) Singapore 235 59 Dexia Belgium 225 60 Banco Sabadell Spain 224
61 Bayerische Landesbank Germany 224 62 Erste Group Bank AG Austria 220 63 Banco Popular Espanol Spain 204 64 Industrial Bank of Korea South Korea 196 65 Bank of Ireland Ireland 182
66 Malayan Malaysia 161 67 Standard Bank Group South Africa 161 68 Banca Monte dei Paschi di Siena Italy 161 69 American Express USA 158 70 National Bank of Greece Greece 153 71 Macquarie USA 143
72 Credit Lyonnais France 120 73 Comercial Portuguese Portuguese 113 74 Banco Espirito Santo Portugal 112 75 Turkiye is bankasi Turkey 112 76 Mediobanca Italy 95
77 Landesbank Hessen Germany 92
Table 2b Banks ordered by Country
Rank Bank Country Total assets
US$B
1 Commonwealth Bank of Australia Australia 703 2 Australia amp New Zealand Banking Group Australia 661 3 Westpac Banking Corp Australia 607 4 National Australia Bank Australia 562
5 Erste Group Bank AG Austria 220
6 KBC Group NV Belgium 291 7 Dexia Belgium 225
8 Bank of China China 2613 9 China Development Bank China 1904
10 The Export-Import Bank of China China 427
11 Danske Denmark 495
12 BNP Paribas France 2196 13 Credit Agricole Group France 1821 14 Societe Generale France 1461 15 Credit Lyonnais France 120
16 Deutsche Bank Germany 1682 17 Commerzbank Germany 549 18 Landesbank Baden-Wurttemberg Germany 257 19 Bayerische Landesbank Germany 224 20 Landesbank Hessen Germany 92
21 National Bank of Greece Greece 153
22 State bank of India India 492
23 Bank of Ireland Ireland 182
24 Unicredit SpA Italy 908 25 Intesa Sanpaolo Italy 766
40
26 Banca Monte dei Paschi di Siena Italy 161 27 Mediobanca Italy 95
28 Mitsubishi UFJ Financial Group Japan 2597 29 Mizuho Financial Group Japan 1757 30 Sumitomo Mitsui Financial Group Japan 1654 31 Norinchukin Bank Japan 984 32 Resona Japan 412 33 Sumitomo Mitsui TH Japan 406 34 Nomura Holdings Japan 370 35 Yamaguchi Financial Group Japan 93
36 ING Groep NV Netherlands 893 37 Rabobank Group Netherlands 700
38 Banco Espirito Santo Portugal 111
39 Sberbank of Russia Russia 420
40 DBS Group Holdings Singapore 332 41 United Overseas Bank (UOB) Singapore 235 42 Standard Bank Group South Africa 161
43 Shinhan Financial Group South Korea 328 44 Hana Financial Group South Korea 288 45 Korea Development Bank South Korea 268 46 Woori Bank South Korea 257 47 Industrial Bank of Korea South Korea 196
48 Banco Santander Spain 1416 49 BBVA Spain 773 50 Banco Sabadell Spain 224 51 Banco Popular Espanol Spain 204
Table 2b ndash Continued from previous page
53 Nordea Sweden 651 54 Svenska Handelsbanken Sweden 289 55 Skandinaviska Enskilda Banken Sweden 289 56 Swedbank Sweden 237
57 UBS Group AG Switzerland 919 58 Credit Suisse Group Switzerland 806
59 Cathay Financial Holding Taiwan 252
60 Turkiye is bankasi Turkey 112
61 HSBC Holdings UK 2374 62 Barclays PLC UK 1490 63 Lloyds Banking Group UK 1004 64 Royal Bank of Scotland Group UK 981 65 Standard Chartered Plc UK 646 66 Nationwide Building Society UK 276
68 JPMorgan Chase amp Co USA 2490 69 Bank of America USA 2187 70 Wells Fargo USA 1930 71 Citigroup USA 1792 72 Goldman Sachs Group USA 860 73 Morgan Stanley USA 814 74 US Bancorp USA 445 75 PNC Financial Services USA 366 76 Capital One Financial Corporation USA 357 77 American Express USA 158 78 Macquarie USA 143
41
Table 3a Banksrsquo home-countries ordered by the sum of total bank assets
Developed Total Assets Developing Total Assets USA 11547 China 4944 Japan 7867 India 492 UK 6936 Russia 420 France 5599 Taiwan 252 Germany 2994 South Africa 161 Spain 2617 Turkey 112
Australia 2534 Italy 1933 Switzerland 1725
Netherlands 1584 Sweden 1467 South Korea 1340 Singapore 568 Belgium 516 Denmark 495 Ireland 344 Austria 220 Greece 153 Portugal 111 Total Assets of banks that are headquartered in
Developed 5055366 Emerging 63823 of total assets 888 of total assets 112
42
Table 3b Regional details
Region Number of Banks Total bank
assets of total
assets
Europe 40 2669673 473
Asia 21 1557658 275
N America 11 1154724 204
Oceania 4 2534 45
Africa 1 161 03
B Data Definitions and Descriptive Statistics
Table 4 Data Definitions
Variable Description
Endogenous CDS CDS 5-year spread
Exogenous Systemic risk
CDX The family of CDS indeces covering North America
VIX The volatiliy index of SampP 500
US 3-month T Bill The short-term obligation backed by the Treasury Dept of the US goverment
Bank-specific Size Total assets
Retail orientation Total Loans Total assets
Diversification Non-interest income Total revenues
NPLs Non-performing loans Total Loans
Country-specific
GDP Each bankrsquos home-country GDP growth
Budget Balance Current AccountGDP
Public Debt Public DebtGDP
43
Table 5 Descriptive Statistics
Panel A Systemic risk factor
CDX VIX TED
Mean 269E-06 -0000123 -000121 Median 0000 -0001 0000 Maximum 0020 0176 0250 Minimum -0009 -0152 -0750
Std Dev 0001 0031 0033 Skewness 4689 0689 -17326
Kurtosis 106047 6789 377496 Jarque-Bera 1105896 1679364 14610377 Probability 0000 0000 0000
Sum 0007 -0304 -3000 Sum Sq Dev 0003 2427 2746
Note CDX and VIX are in log differences TED spread is in first differences
Panel B Bank specific
Assets Loans_to_Assets Non_Interest_Inc NPLs
Mean 732382 55596 2442 4601
Median 458009 59921 2378 2411
Maximum 3030645 8664 8640 35217
44
Minimum 4354387 9070 -5962 01082
Std Dev 7460013 17017 1481 5612
Skewness 1081 -0641 -0694 2376
Kurtosis 30129 2584 6193 9630
Jarque-Bera 7023 272888 182117 999501
Probability 0000 0000 0000 0000
Sum 264E+09 2003702 8803746 1658430 Sum Sq Dev 201E+15 1043392 7908036 1134867
Note Data are in levels
Part C ndash Global Sample
Table 7 Individual systemic importance
Panel A ndash Ranked by total score Rank by score
Rank by bank assets Bank Name
Home-Country Region
Assets (billion
US $) Score
To others (Aggr)
From others (Aggr)
1 27 Intesa Sanpaolo Italy Europe 766 1056 0505 0551
2 16 Banco Santander Spain Europe 1416 1038 0464 0574
3 26 BBVA Spain Europe 773 0987 0454 0533
4 5 BNP Paribas France Europe 2196 0982 0445 0537
5 21 Unicredit SpA Italy Europe 908 0975 0489 0485
6 14 Barclays PLC UK Europe 1490 0961 0454 0507
7 12 Deutsche Bank Germany Europe 1682 0954 0428 0526
8 9 Credit Agricole Group France Europe 1821 0942 0424 0518
9 15 Societe Generale France Europe 1461 0940 0427 0512
10 72 Credit Lyonnais France Europe 120 0938 0445 0493
11 17 Lloyds Banking Group UK Europe 1004 0925 0438 0487
12 25 Credit Suisse Group Switz Europe 806 0907 0376 0531
13 35 Commerzbank Germany Europe 549 0904 0410 0494
14 20 UBS Group AG Switz Europe 919 0890 0387 0503
15 32 Standard Chartered Plc UK Europe 646 0870 0419 0451
16 68 Banca Monte dei Paschi Italy Europe 161 0861 0429 0433
45
17 19
Royal Bank of Scotland Group
UK Europe 981 0845 0423 0423
18 29 Rabobank Group Netherl Europe 700 0841 0376 0465
19 22 ING Groep NV Netherl Europe 893 0823 0374 0449
20 76 Mediobanca Italy Europe 95 0821 0389 0433
21 24 Morgan Stanley USA N Amer 814 0752 0315 0437
22 69 American Express USA N Amer 158 0736 0332 0404
23 6 Bank of America USA N Amer 2187 0716 0318 0398
24 23 Goldman Sachs Group USA N Amer 860 0711 0302 0410
25 10 Citigroup USA N Amer 1792 0706 0313 0393
26 4 HSBC Holdings UK Europe 2374 0695 0372 0323
27 62 Erste Group Bank AG Austria Europe 220 0688 0314 0375
28 49 Svenska Handelsbanken Sweden Europe 289 0678 0281 0397
29 53
Korea Development Bank
S Korea Asia 268 0677 0393 0284
30 60 Banco Sabadell Spain Europe 224 0670 0295 0375
31 36 Danske Denmark Europe 495 0663 0296 0367
32 45
Capital One Financial Corp
USA N Amer 357 0662 0260 0401
33 3 JPMorgan Chase amp Co USA N Amer 2490 0658 0257 0401
34 7 Wells Fargo USA N Amer 1930 0653 0259 0394
35 34 National Australia Bank Australia Oceania 562 0622 0376 0247
Table continued on next page
Table 3- Panel A continued from previous page
36 2 Mitsubishi UFJ Financial Japan Asia 2597 0621 0223 0398
37 47 Shinhan Financial Group S Korea Asia 328 0615 0331 0283
38 54 Woori Bank S Korea Asia 257 0612 0333 0278
39 64 Industrial Bank of Korea S Korea Asia 196 0603 0341 0261
40 28 Commonwealth Bank Australia Oceania 703 0599 0388 0211
41 40 Sberbank of Russia Russia Europe 420 0598 0294 0305
42 30 Australia amp N Zealand Australia Oceania 661 0597 0383 0214
43 50 Skandinaviska Enskilda Sweden Europe 289 0578 0262 0316
44 31 Nordea Sweden Europe 651 0574 0289 0285
45 71 Macquarie USA N Amer 143 0572 0321 0251
46 48 KBC Group NV Belgium Europe 291 0568 0241 0327
47 63 Banco Popular Espanol Spain Europe 204 0558 0297 0261
48 61 Bayerische Landesbank Germany Europe 224 0552 0249 0303
49 39 The Export-Import Bank China Asia 427 0548 0284 0264
50 1 Bank of China China Asia 2613 0548 0276 0272
51 66 Malayan Malaysia Asia 171 0543 0321 0223
52 33 Westpac Banking Corp Australia Oceania 606 0540 0374 0166
53 37 State bank of India India Asia 492 0530 0238 0291
54 51 Hana Financial Group S Korea Asia 288 0518 0290 0227
55 57 Swedbank Sweden Europe 237 0486 0253 0233
56 8 China Development Bank China Asia 1904 0468 0260 0208
46
57 52 Nationwide Building Society UK Europe 276 0463 0217 0246
58 59 Dexia Belgium Europe 225 0409 0197 0212
59 46 DBS Group Holdings Singapore Asia 332 0397 0212 0186
60 65 Bank of Ireland Ireland Europe 182 0379 0197 0182
61 58 United Overseas Bank Singapore Asia 235 0373 0214 0159
62 11 Mizuho Financial Group Japan Asia 1757 0367 0271 0096
63 67 Standard Bank Group S Africa Africa 161 0365 0123 0242
64 74 Espirito Santos Portugal Europe 112 0362 0186 0176
65 41 Resona Japan Asia 412 0357 0263 0094
66 13 Sumitomo Mitsui Financial Japan Asia 1654 0355 0250 0104
67 38 US Bancorp USA N Amer 445 0353 0188 0165
68 55 Landesbank Baden-Wurtt Germany Europe 257 0340 0170 0171
69 42 Sumitomo Mitsui TH Japan Asia 406 0323 0273 0050
70 56 Cathay Financial Holding Taiwan Asia 252 0298 0189 0109
71 73 Comercial Portuguese Portugal Europe 113 0279 0268 0011
72 70 National Bank of Greece Greece Europe 153 0220 0176 0044
73 18 Norinchukin Bank Japan Asia 984 0215 0164 0050
74 43 Nomura Holdings Japan Asia 370 0197 0161 0035
75 77 Landesbank Hessen Germany Europe 92 0159 0089 0071
76 44 PNC Financial Services USA N Amer 366 0078 0034 0043
77 75 Turkiye is bankasi Turkey Europe 112 0037 0030 0007
Note Results concern the period January 2008 ndash June 2017 and are of daily frequency
Table 9 Systemic contribution per bank (January 2008 ndash June 2017)
Rank Bank Name SC Rank Bank Name SC Rank Bank Name SC Rank Bank Name SC
1 Intesa Sanpaolo
225 21 Morgan Stanley 160 41 Sberbank of Russia
128 61 United Overseas
080
2 Banco Santander
221 22 American Express
157 42 Australia amp N Zealand
127 62 Mizuho Financial
078
3 BBVA 210 23 Bank of America
153 43 Skandinaviska Enskilda
123 63 Standard Bank Group
078
4 BNP Paribas 209 24 Goldman Sachs Group
152 44 Nordea 122 64 Espirito Santos
077
5 Unicredit SpA
208 25 Citigroup 151 45 Macquarie 122 65 Resona 076
6 Barclays PLC 205 26 HSBC Holdings 148 46 KBC Group NV
121 66 Sumitomo Mitsui
076
7 Deutsche Bank
203 27 Erste Group 147 47 Banco Popular
119 67 US Bancorp
075
8 Credit Agricole
201 28 Svenska 145 48 Bayerische Landesbank
118 68 Landesbank 072
9 Societe Generale
200 29 Korea Development Bank
144 49 The Export-Import
117 69 Sumitomo Mitsui TH
069
10 Credit Lyonnais
200 30 Banco Sabadell 143 50 Bank of China 117 70 Cathay Financial
064
11 Lloyds Banking
197 31 Danske 141 51 Malayan 116 71 Comercial Portuguese
059
47
12 Credit Suisse Group
193 32 Capital One Financial Corp
141 52 Westpac Banking Corp
115 72 NBG 047
13 Commerzbank 193 33 JPMorgan Chase amp Co
140 53 State bank of India
113 73 Norinchukin Bank
046
14 UBS Group AG 190 34 Wells Fargo 139 54 Hana Financial Group
110 74 Nomura Holdings
042
15 Standard Chartered
186 35 National Australia Bank
133 55 Swedbank 104 75 Landesbank Hessen
034
16 Banca Monte dei
184 36 Mitsubishi UFJ Financial
132 56 China Development
100 76 PNC Financial Services
017
17 RBS 180 37 Shinhan Financial Group
131 57 Nationwide Building
099 77 Turkiye is bankasi
008
18 Rabobank Group
179 38 Woori Bank 130 58 Dexia 087
19 ING Groep NV 175 39 Industrial Bank of Korea
129 59 DBS Group Holdings
085
20 Mediobanca 175 40 Commonwealth Bank
128 60 Bank of Ireland
081
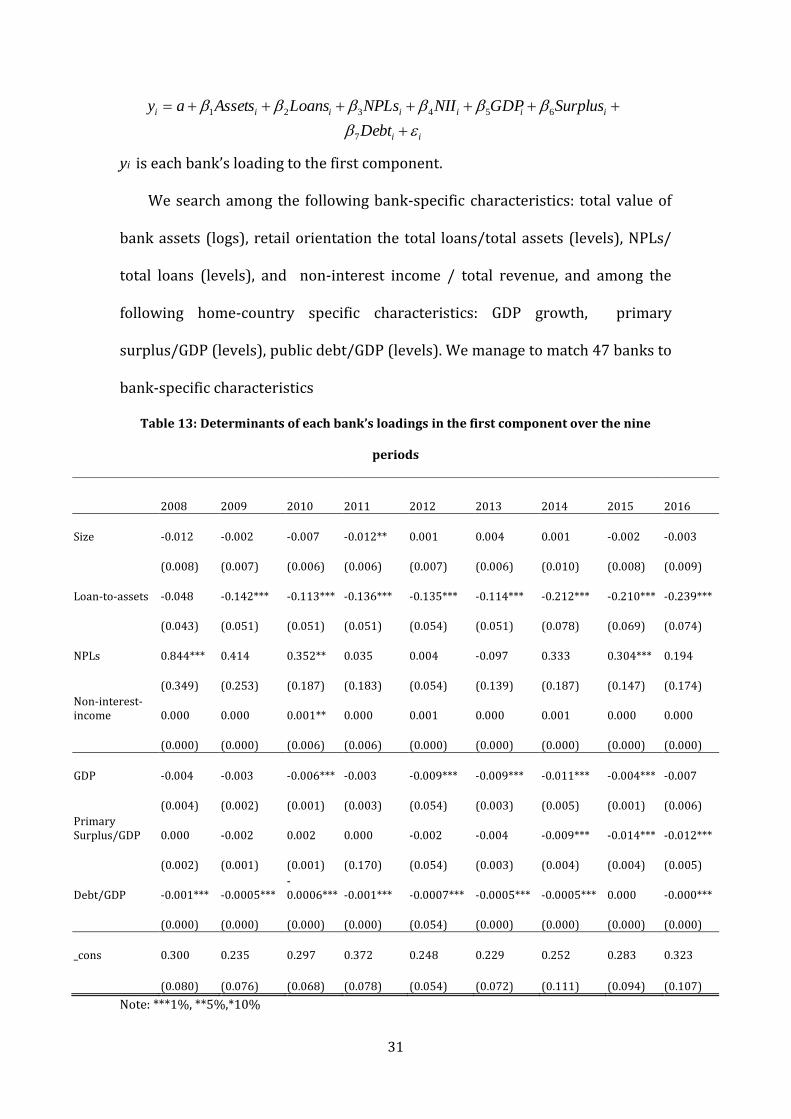
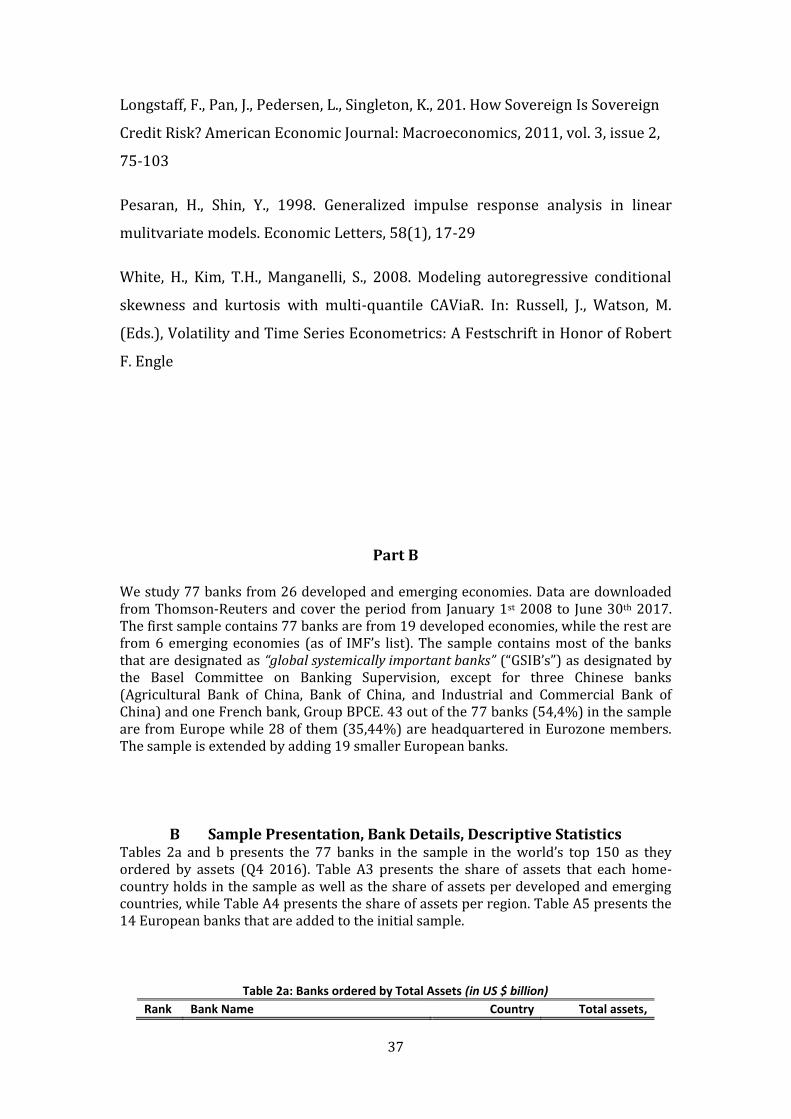
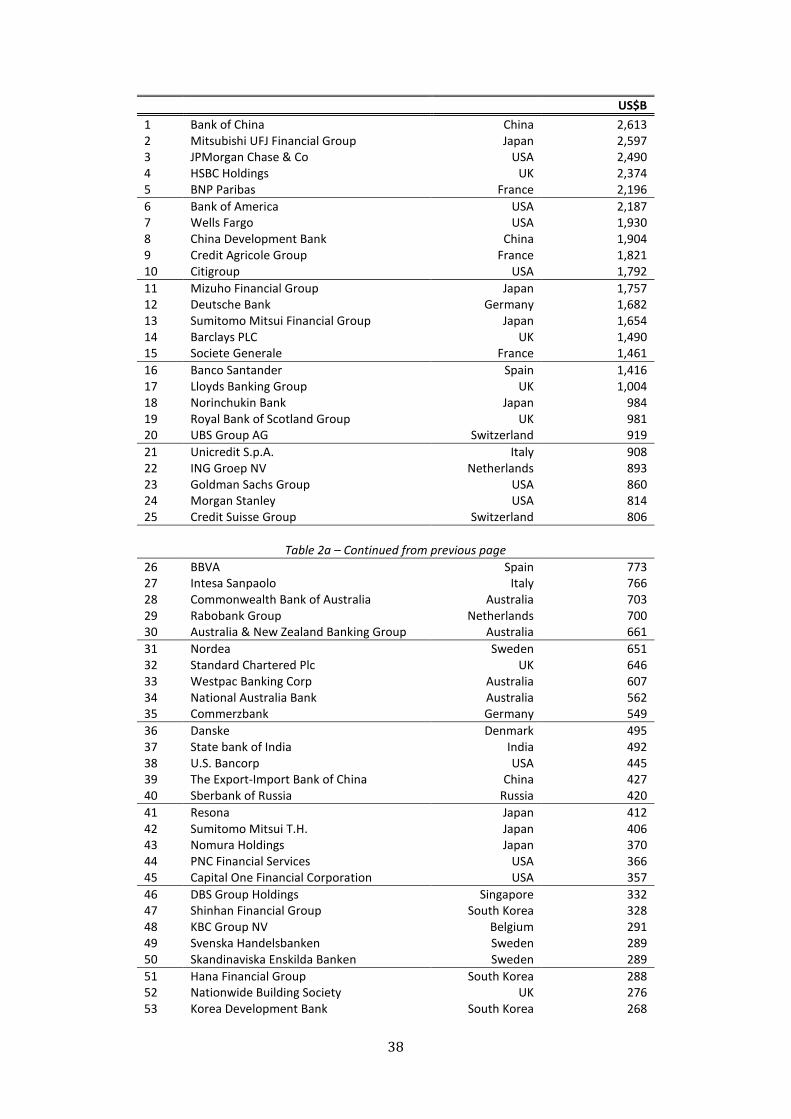
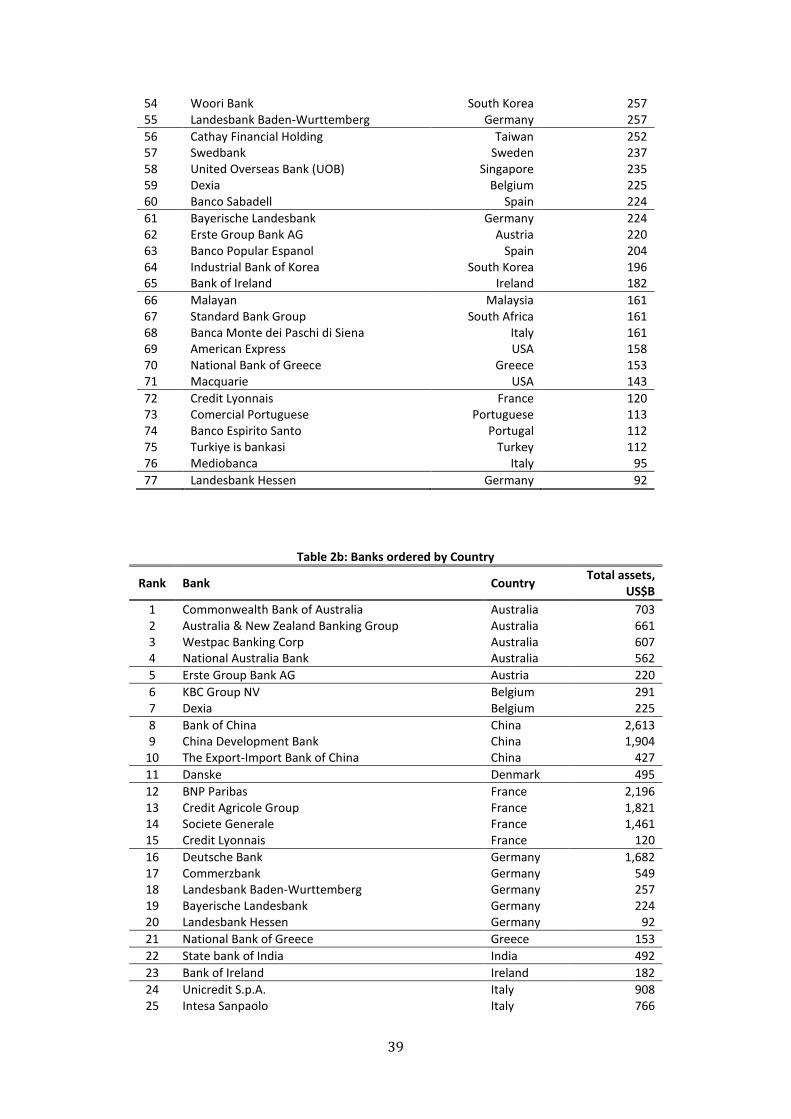
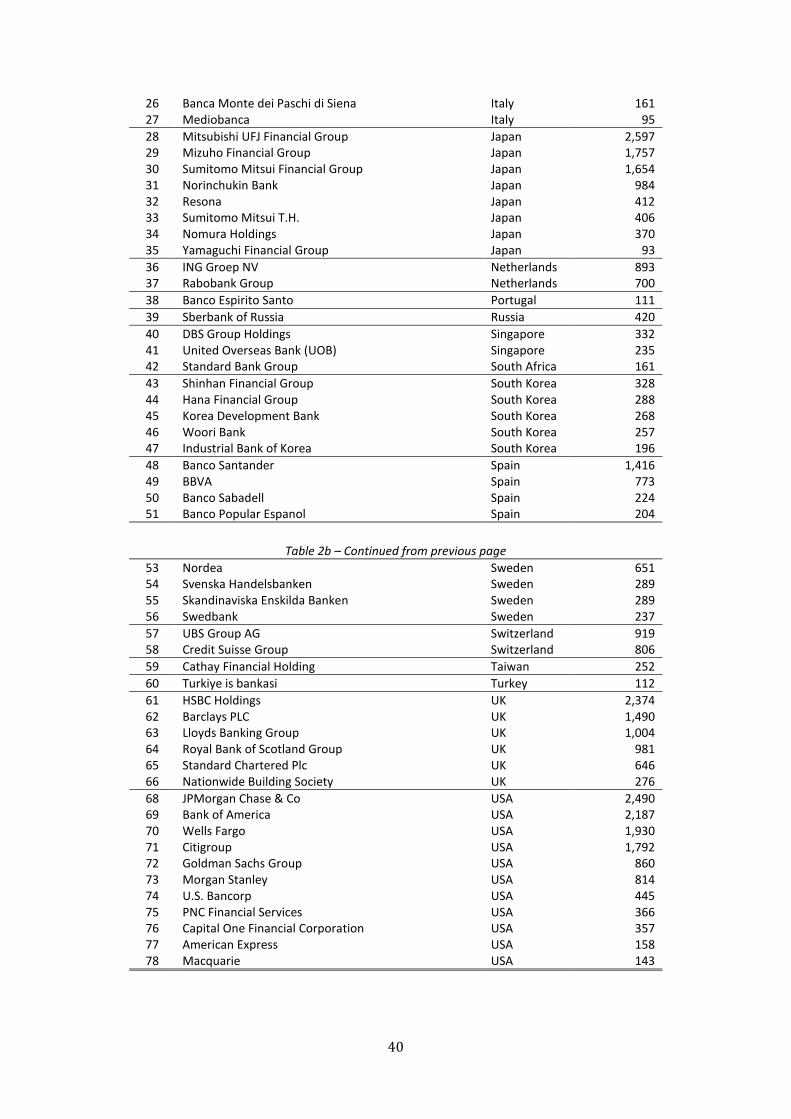
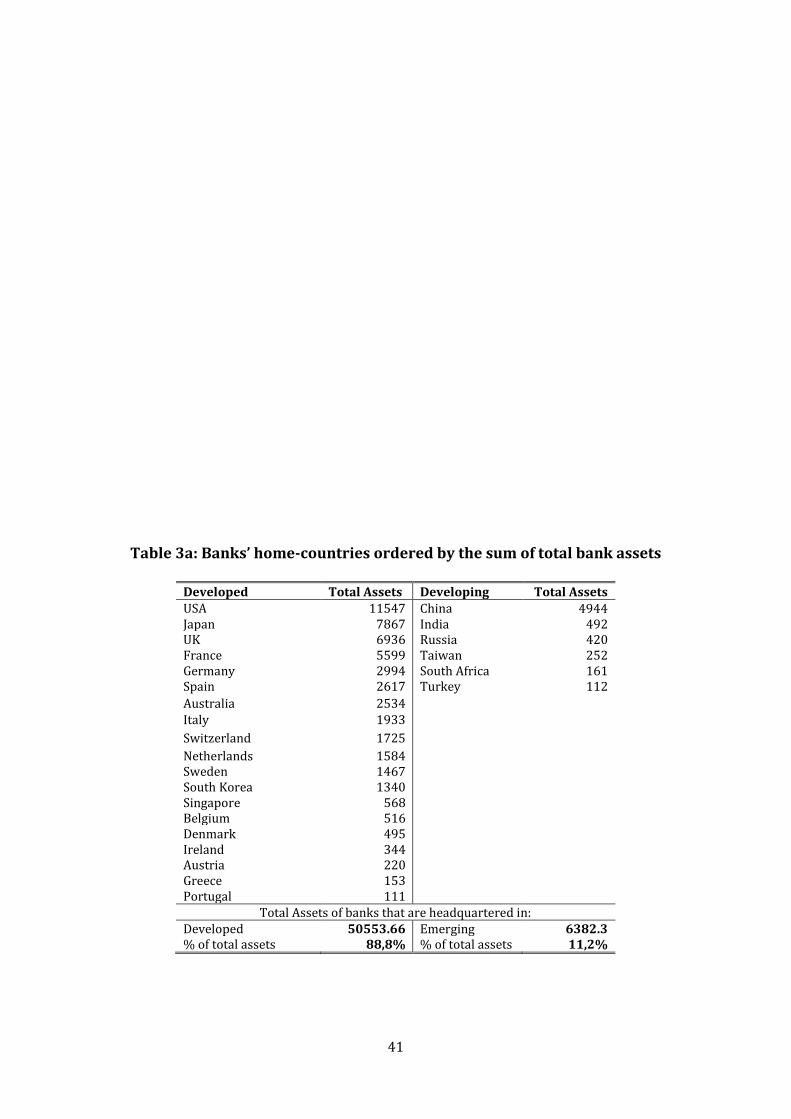
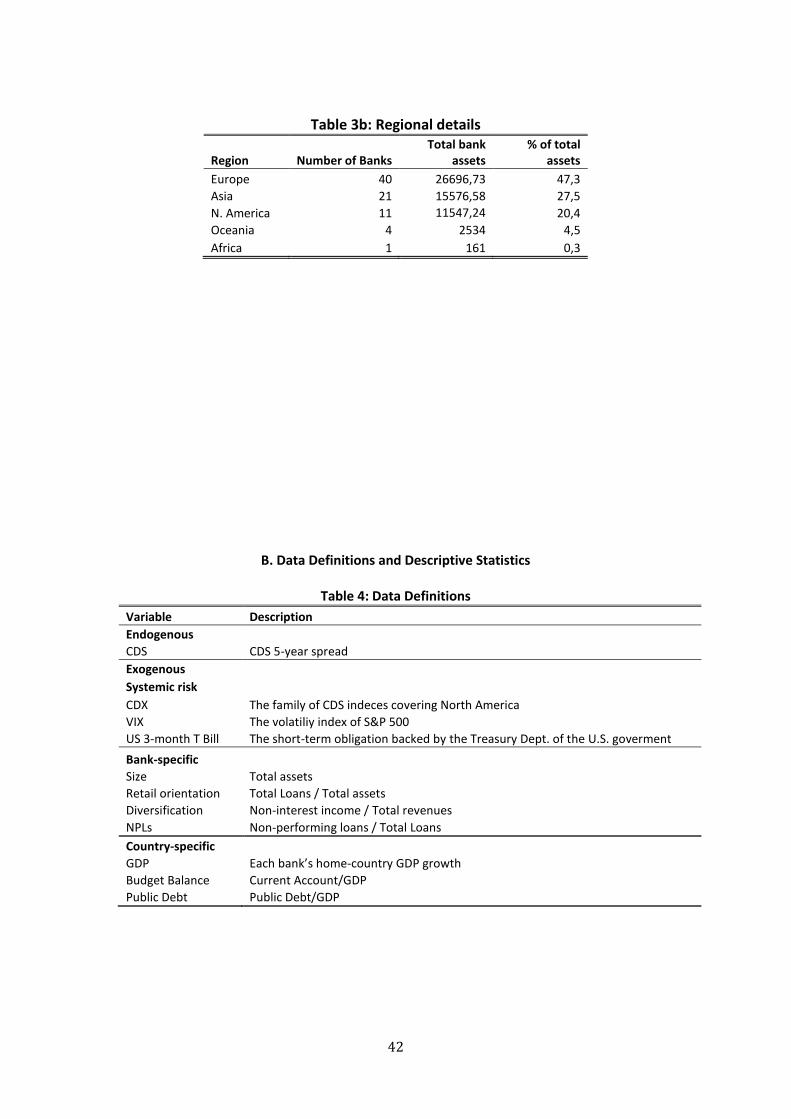
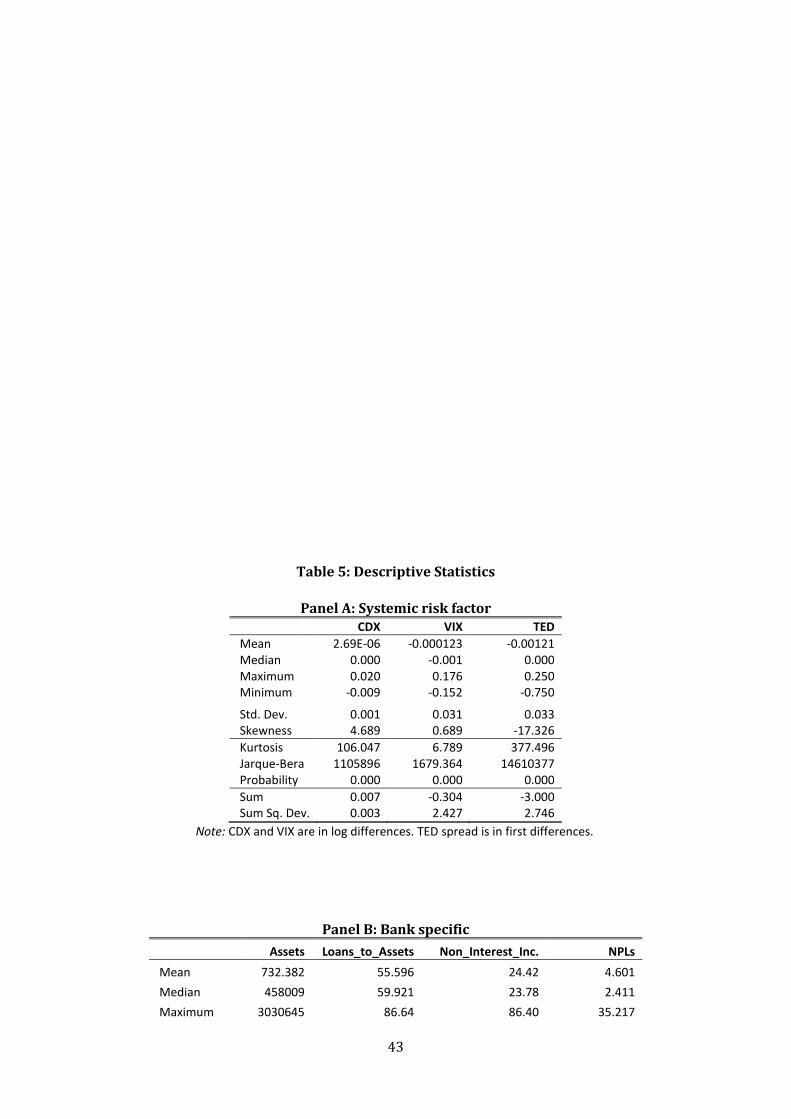
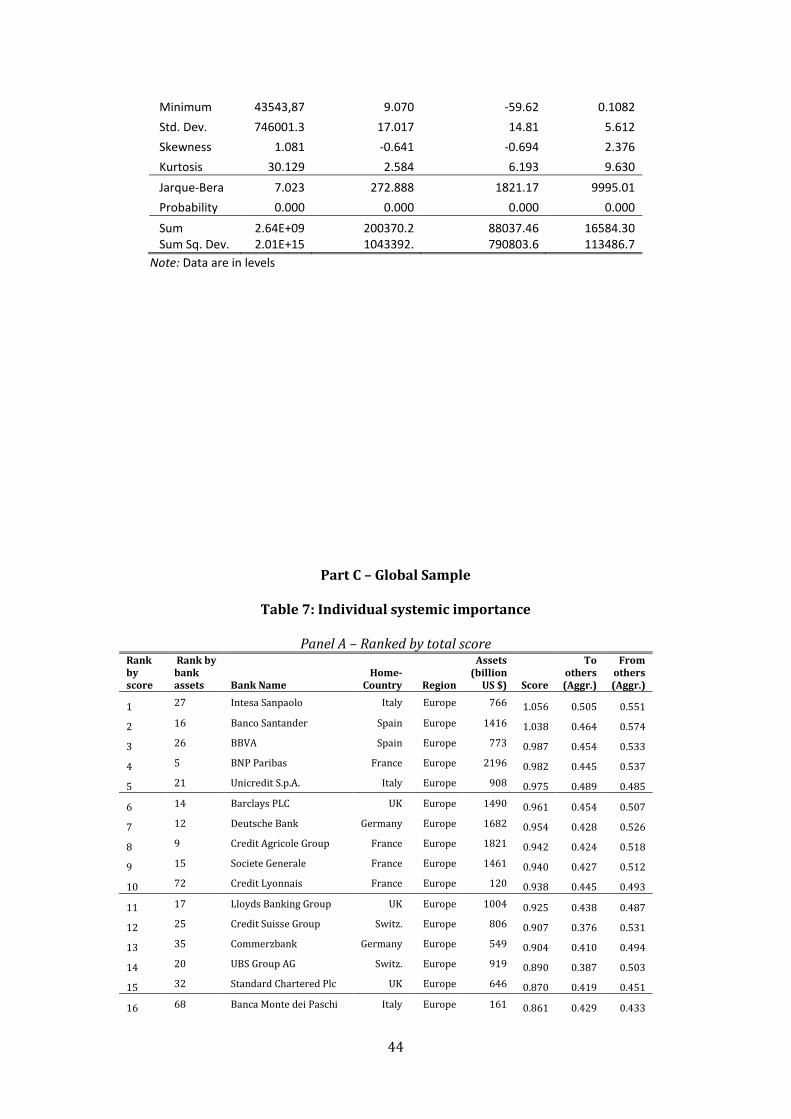
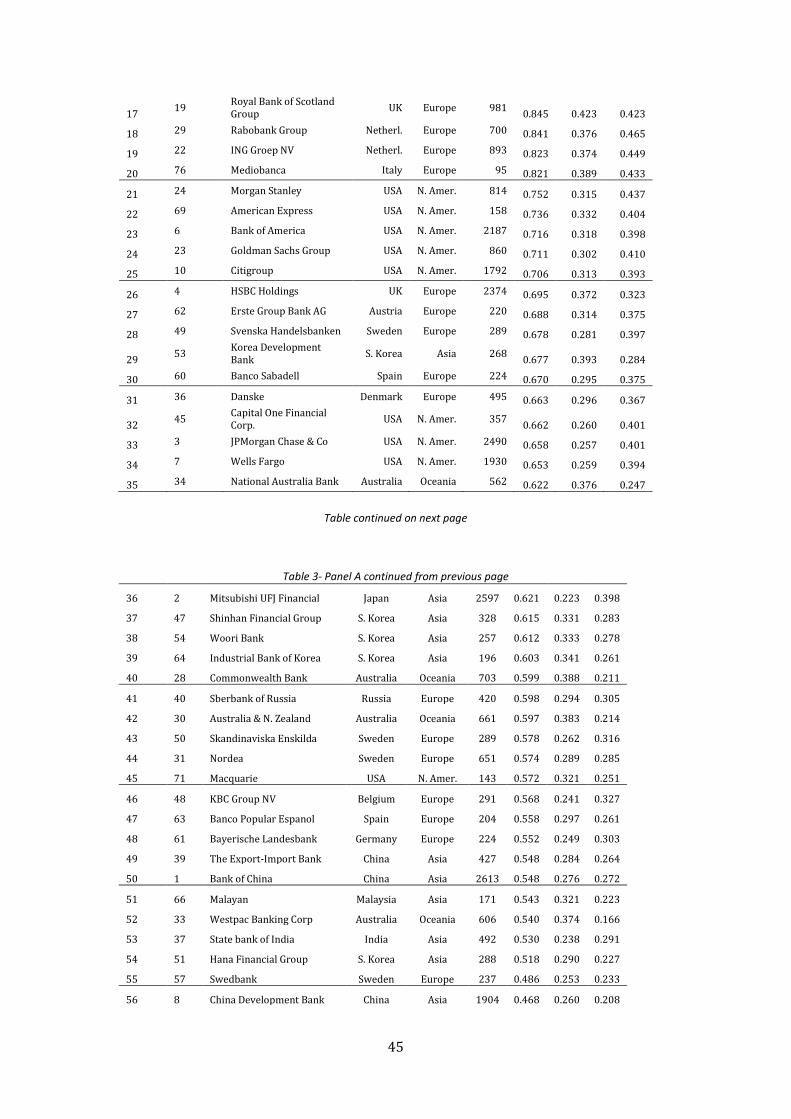
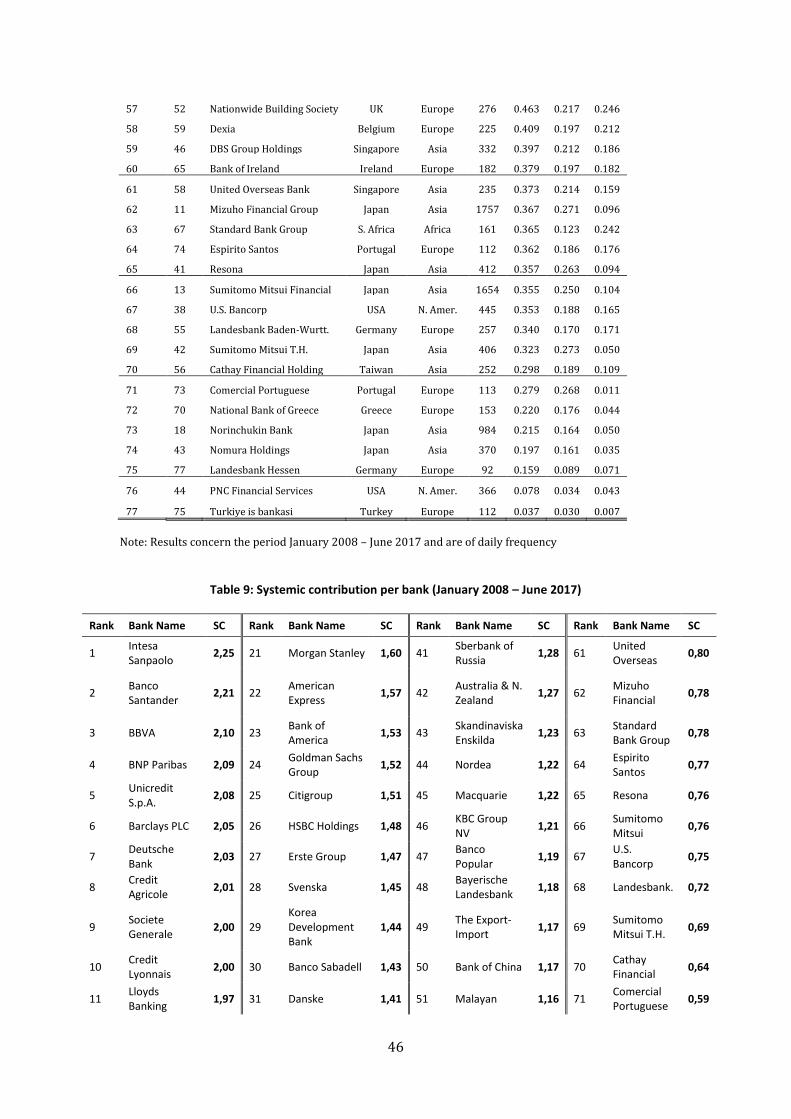
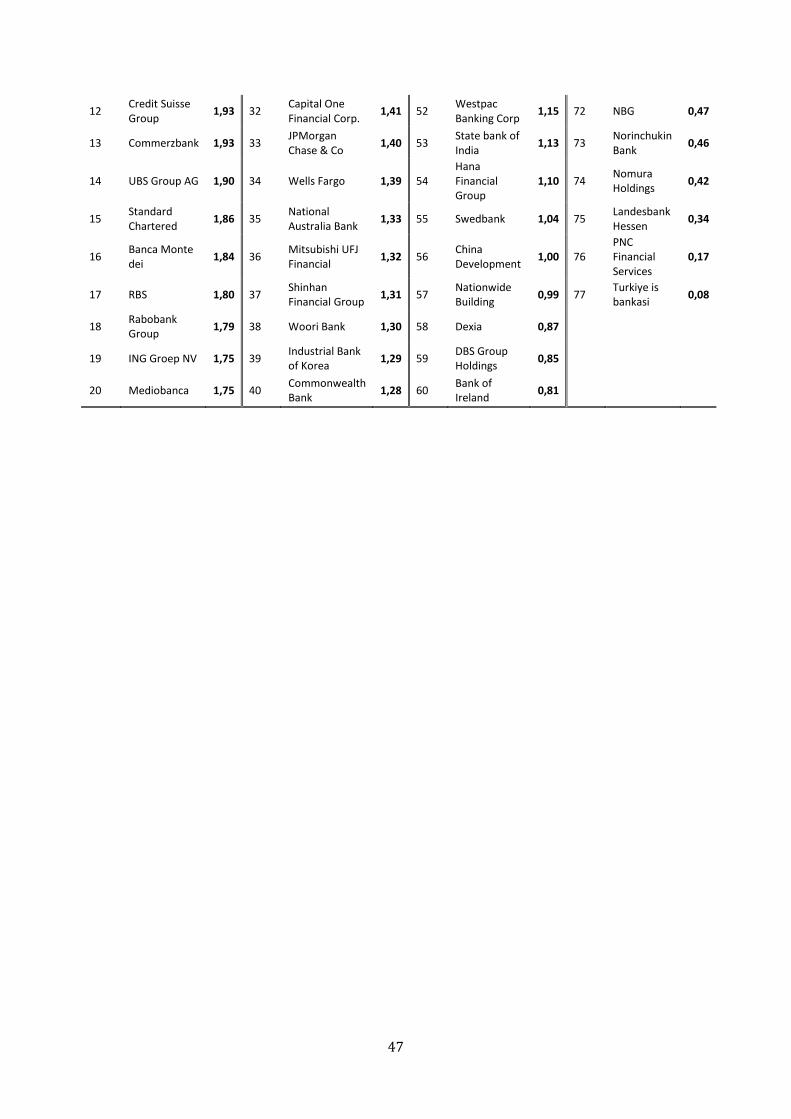