Embed Size (px)
Citation preview

Mechanical and hydraulic characterization ofplastic concrete for seepage cut-off walls
S. Hinchberger, J. Weck, and T. Newson
Abstract: This paper describes a series of laboratory tests performed to characterize the mechanical and hydraulic proper-ties of plastic concrete (PL-C). PL-C is used in the construction of seepage cut-off walls in dams and it comprises cement,aggregate, and water mixed with sodium bentonite. The addition of sodium bentonite causes a reduction in strength andimproved ductility after failure compared with normal concrete. The mechanical properties of PL-C are studied using aseries of unconfined compression tests and confined compression tests performed while simultaneously permeating waterthrough PL-C specimens. Stress relaxation and controlled rate of loading tests are also performed to investigate the rate-sensitivity and time-dependency of plastic concrete. The test results show that the hydraulic conductivity of PL-C increasesbetween two and three orders of magnitude during triaxial compression due to yielding, crack formation, and dilation ofthe cracks. Such changes in the behaviour of PL-C should be minimized during design by controlling the working strainsand using erosion-resistant mixes. In addition to these findings, PL-C exhibits significant time-dependent behaviour similarto that observed for clays, and the variation of compressive strength versus confining stress is comparable to normalstrength concrete.
Key words: plastic concrete, stress relaxation, hydraulic conductivity, axial strain, dams.
Resume : Cet article decrit une serie d’essais en laboratoire effectues dans le but de caracteriser les proprietes mecaniqueset hydrauliques du beton plastique (BP). Le BP est utilise dans la construction de systemes de coupure dans les barrages.Il est constitue du ciment, de l’agregat et de l’eau melange avec de la bentonite de sodium. L’ajout de bentonite de sodiumentraıne une reduction de la resistance et une amelioration de la ductilite suite a la rupture, comparativement au betonstandard. Les proprietes mecaniques du BP sont etudiees a l’aide d’essais en compression non confines et confines effec-tues en meme temps que l’eau penetre a travers les echantillons de BP. Des essais de relaxation des contraintes et de char-gement a taux controle ont aussi ete effectues pour investiguer la sensibilite au taux et la dependance au temps des BP.Les resultats des essais montrent que la conductivite hydraulique du beton plastique augmente de deux a trois ordres degrandeur durant la compression triaxiale en raison de l’ecoulement, de la formation de fissures et de la dilatation dans lesfissures. Ces changements dans le comportement du BP devraient etre minimises durant la conception par un controle desdeformations et par l’utilisation de melanges resistants a l?erosion. De plus, le beton plastique demontre un comportementdependant du temps de facon significative, comme ce qui est observe pour les argiles, et la variation de la contrainte com-pressive versus la contrainte de confinement est comparable a la resistance normale d’un beton.
Mots-cles : beton plastique, relaxation des contraintes, conductivite hydraulique, deformation axiale, barrages.
[Traduit par la Redaction]
Introduction
Advancements in the construction of plastic concrete(PL-C) cut-off walls have enabled the construction of largezoned earthfill embankment dams on deep pervious founda-tions (Davidson et al. 1992; Balian 2007). In some cases,PL-C cut-off walls have also been used to rehabilitate agingstructures (e.g., Rigbey 2006). PL-C comprises a mixture ofcement, water, aggregate, and bentonite, which has low
hydraulic conductivity and excellent ductility after reachingfailure compared with conventional concrete. Figure 1shows typical normalized stress–strain curves for conven-tional concrete and PL-C.
The primary function of a PL-C cut-off wall is to controlor eliminate foundation seepage below dams from upstreamto downstream. For dams that require a foundation cut-off,the cut-off wall is typically constructed in the foundation bythe slurry trench method, then the dam is built on top of thecut-off wall and foundation. Figure 2 shows the typicalgeometry. During embankment construction, both the foun-dation and PL-C compress under the weight of the earthfillstructure. Consequently, the PL-C may undergo significantplastic straining potentially leading to (i) cracking and(ii) an increase in the hydraulic conductivity. Increases inthe hydraulic conductivity of PL-C can reduce the hydraulicefficiency of a cut-off wall and affect the distribution of thepiezometric head downstream of the wall; cracking canmake the wall susceptible to hydraulic erosion (Davidson etal. 1992). So far, the influence of compressive strain on the
Received 18 September 2007. Accepted 25 August 2009.Published on the NRC Research Press Web site at cgj.nrc.ca on7 April 2010.
S. Hinchberger1 and T. Newson. Department of Civil andEnvironmental Engineering, The University of Western Ontario,London, ON N6A 5B9, Canada.J. Weck. Hatch Energy, 4342 Queen Street, Niagara Falls, ONL2E 6W1, Canada.
1Corresponding author (e-mail: [email protected]).
461
Can. Geotech. J. 47: 461–471 (2010) doi:10.1139/T09-103 Published by NRC Research Press
Can
. Geo
tech
. J. D
ownl
oade
d fr
om w
ww
.nrc
rese
arch
pres
s.co
m b
y U
nive
rsity
of
Wes
tern
Ont
ario
on
05/1
7/11
For
pers
onal
use
onl
y.

hydraulic conductivity of PL-C has not been reported in theliterature.
This paper describes a series of unconfined compressiontests and triaxial compression tests with simultaneous hy-draulic conductivity measurements that were performed tocharacterize the mechanical and hydraulic properties ofPL-C. PL-C specimens were prepared from three differentconcrete mixes and cured for at least 28 days to achieve un-confined compressive strengths ( fcu) ranging from 0.65 to2.5 MPa. The specimens were compressed to failure at con-fining pressures (sc) ranging from 0 to 100, 400, and900 kPa. During the confined tests (sc = 0), compressionwas halted at axial strains (3a) of 0.5%, 1%, 2%, 4%, 6%,8%, and 10% and 3a was held constant while water was si-multaneously permeated through the specimens. These testswere used to characterize the influence of strain on the hy-draulic conductivity of PL-C and study the stress-relaxationof PL-C during periods of constant strain. The primary ob-jectives of this paper are to (i) describe an approach tomeasure the effect of 3a during triaxial compression on thehydraulic conductivity of PL-C, (ii) characterize the effectsof time and compression rate on the response of PL-C, and(iii) characterize the effect of 3a on the hydraulic conductiv-ity of PL-C. The results of this study are considered to be ofinterest to geotechnical engineers and dam engineers.
Methods and materials
MaterialsThe PL-C mixes prepared in this study were batched us-
ing type 10 Portland cement (PC). Sodium (Na) bentonite(Halliburton–Quik Gel) was added to the PC, aggregate,and water as described below to create PL-C. The specificgravity, liquid limit, and plastic limit of the Na–bentoniteare 2.75, 570%, and 52%, respectively. Both fine and coarseaggregates were used in the PL-C mixes. Figure 3 shows thegradation curves for coarse and fine aggregates. The maxi-mum aggregate size was 12 mm, which is acceptable for
the 75 mm diameter specimens prepared for use in thisstudy (see Issa et al. 2000).
Batching methodsInitially, PL-C mix proportions corresponding to fcu of
0.65, 0.9, and 2.5 MPa were estimated using design chartsfrom the U.S. Army Corps of Engineers (Kahl et al. 1991).However, some adjustments to the water to cement ratio(w:c) were required as described below. The following de-scribes the batching process.
First, fine and coarse aggregates were spread out on aconcrete floor and air-dried at room temperature (21 8C) forat least 24 h. Simultaneously, water and Na–bentonite wereblended together in a 10 L plastic container using a high-speed mixer until a smooth and consistent slurry wasachieved. Then the bentonite–water slurry was allowed tohydrate for 24 h. After 24 h, the fine and coarse aggregateswere placed in a concrete mixer (Stow, Model CMC65) andmixed for 5 min to ensure adequate blending of the aggre-gates. Then, type 10 PC was added to the mixer and blendedwith the aggregate for 3 min. Lastly, the slurry (bentoniteplus water) was added and the entire batch was mixed untila uniform consistency was achieved. Table 1 lists the slurrydensity.
Typically, PL-C is placed by the tremmie method. Forthis placement method, the concrete slump must be at least200 mm (Kahl et al. 1991). Consequently, prior to castingthe PL-C specimens, a slump test was done according toASTM C143 (ASTM 1998a). If the slump was less than200 mm, additional slurry was added to the mixer until 200to 225 mm slump was achieved.
After mixing and adjusting the slump, PL-C was placedinto 75 mm � 150 mm plastic cylinder moulds withoutprodding or vibrating. As such, the results presented in thispaper correspond to the behaviour of PL-C cured at negli-gible confining stresses; whereas the in situ confiningstresses are significantly higher. This will be discussed atthe end of the paper. The specimens were immediatelyplaced in a wet room to cure for a minimum of 28 days anda maximum of 65 days. Specimens were taken from the wetroom on the third day after casting, removed from the plas-tic cylinder moulds, and then returned to the wet room.75 mm � 150 mm (diameter to height) specimens wereused in this study due to limitations of the axial load cellused with the triaxial compression machine (25 kN maxi-mum load).
Batch proportionsIn total, 26 PL-C specimens were prepared from three
separate batches for compression testing. As noted above,the initial batch proportions were estimated from Kahl et al.(1991) and then adjusted by adding additional slurry to givea slump between 200 and 225 mm. Table 1 summarizes thefinal mix proportions after adjustments for the slump andTable 2 summarizes the specimens. It is noted that forPL-C (i) w:c is the mass of water divided by the mass ofcement plus Na–bentonite and (ii) the bentonite content isthe mass of Na–bentonite divided by the mass of Na–bentonite plus cement expressed as a percent (Kahl et al.1991). In addition, as shown in Table 1, the density of theslurries during mixing varied from 1.052 g/cm3 for batch
Fig. 1. Stress–strain response of normal strength concrete comparedwith plastic concrete. saxial, axial stress; speak, peak stress at failure.
462 Can. Geotech. J. Vol. 47, 2010
Published by NRC Research Press
Can
. Geo
tech
. J. D
ownl
oade
d fr
om w
ww
.nrc
rese
arch
pres
s.co
m b
y U
nive
rsity
of
Wes
tern
Ont
ario
on
05/1
7/11
For
pers
onal
use
onl
y.

B2 to 1.071 g/cm3 for batch B1, which are near the upperrange used in situ (e.g., Soroush and Soroush 2005). Assuch, the test results presented in this paper correspond tothe behaviour of PL-C mixes with a high bentonite contentand relatively high ductility.
Finally, the additional slurry added to the PL-C batches toadjust the slump caused a 35%–41% reduction in fcu com-pared with the design charts (Kahl et al. 1991). The amountof reduction of fcu (measured versus design) is shown in thelast column of Table 1. Discrepancies in the slump, fcu, andw:c ratios in this study compared with those in Kahl et al.(1991) can be attributed to differences in properties of thebentonite used herein, such as the dielectric constant, spe-cific surface, and cation exchange capacity. Also, as notedby Hutchinson et al. (1975), the method of mixing and hyd-rating bentonite slurry can affect the slurry rheology andhave some effect on the fcu.
Testing and proceduresThis section describes the tests and procedures used to
characterize the mechanical and hydraulic properties of PL-C. As noted above, Table 2 summarizes the test speciments.
Unconfined compression testsThe fcu of PL-C was measured in accordance with ASTM
standard D2166 (ASTM 2005) using either (i) a 90 tonneAvery compression machine or (ii) a Global Digital Systems(GDS) computer controlled triaxial system similar to thatdescribed by Menzies (1988). For each of the PL-C batcheslisted in Table 1, three unconfined compression tests wereperformed using a compression rate of 0.012 mm/min: twotests were performed using the Avery compression machineon specimens with sulfur end caps prepared according toASTM standard C617 (ASTM 1998b) and one test was per-formed using the GDS triaxial system on specimens thatwere cut using a diamond blade rock saw to achieve flat or-thogonal ends. The purpose was to assess if the saw cut endshad an effect on fcu.
For unconfined compression tests performed using theGDS apparatus, axial strain (3a) was measured using the fol-lowing two methods:
(1) A linear voltage displacement transducer (LVDT) wasmounted on the load frame so that it came to rest on thetriaxial cell and 3a was deduced from the relative displa-cement between the load frame and triaxial cell. Such anapproach gives the global strain neglecting compressionof the porous stones, load cell, and load cap.
(2) Strain gauges were bonded to the specimens to measurelocal axial strain during compression.
The strains obtained using methods (1) and (2) were within0.1% for loads up to 15 kN as shown in Table 3.
Triaxial compression and hydraulic conductivity testsA series of triaxial compression tests were performed on
PL-C specimens using the GDS computer-controlled triaxialsystem (Menzies 1988), which allowed constant rate ofstrain (CRS) loading in compression and simultaneous hy-draulic conductivity measurement. These tests were per-formed using confining pressures (sc) of 100, 400, and900k Pa and top and bottom cap pressures of 65 and55 kPa, respectively, as summarized in Table 2. The rangeof sc used during these tests was established from a seriesof finite element analyses and it corresponds to the range oflateral confining pressure acting in situ on a PL-C cut-off
Fig. 2. Typical dam geometry with cut-off wall (cross section).
Fig. 3. Grain size of concrete aggregates.
Hinchberger et al. 463
Published by NRC Research Press
Can
. Geo
tech
. J. D
ownl
oade
d fr
om w
ww
.nrc
rese
arch
pres
s.co
m b
y U
nive
rsity
of
Wes
tern
Ont
ario
on
05/1
7/11
For
pers
onal
use
onl
y.

wall situated below a 30 m high zoned embankment damfounded on a 50 m deep deposit of cohesionless soil. Fulldetails of the finite element analyses can be found in Weck(2007).
Preliminary tests performed with combined compressionand permeation indicated the need to eliminate sidewallleakage during compression. This was done by coating thePL-C specimens with a layer of Na–bentonite as describednext. First, the cured PL-C specimens were cut with a dia-mond blade rock saw to achieve flat orthogonal ends and a
Table 1. Plastic concrete mix proportions.
BatchCement factor*(kg/m3)
Bentonitecontent{ (%)
Slurry density(g/cm3) w:c ratio{
Fine:coarseaggregate ratio
fcu
(MPa) fcu/fcu-d
B1 166 30 1.071 2.25 1:1 0.6 0.60B2 130 20 1.052 2.35 1:1 0.95 0.59B3 214 20 1.068 1.7 1:1 2.5 0.65
Note: fcu and fcu-d, measured and design compressive strength, respectively.*Bentonite and cement by mass per cubic metre of PL-C.{Percent bentonite by mass in the cement factor.{Ratio of water to cement plus bentonite by mass.
Table 2. Test specimens.
Permeation pres-sures (kPa) Compressive strength (MPa)
Specimen*Age(days){ Apparatus sc (kPa) Top Bottom Test type 0.012 mm/min 8 h relaxed
B1-1 28 A 0 — — UCSC 0.62 —B1-2 28 A 0 — — UCSC 0.66 —B1-3 28 GDS 0 — — UCDC 0.54 —B1-4 30 GDS 100 65 55 CC/P 1.0 0.7B1-5 32 GDS 100 65 55 CC/P 1.0 0.7B1-6 35 GDS 400 65 55 CC/P 2.1 1.2B1-7 57 GDS 400 65 55 CC/P 1.7 1.2B1-8 65 GDS 900 65 55 CC/P 4.1 2.86B2-1 28 A 0 — — UCSC 0.96 —B2-2 28 A 0 — — UCSC 0.93 —B2-3 28 GDS 0 — — UCDS 0.97 —B2-4 37 GDS 100 65 55 CC/P 1.3 0.84B2-5 39 GDS 100 65 55 CC/P 1.2 0.84B2-6 41 GDS 400 65 55 CC/P 2.6 1.7B2-7 45 GDS 400 65 55 CC/P 2.5 1.7B2-8 59 GDS 400 — — Confirmation 1.7{ —B2-9 61 GDS 900 65 55 CC/P 4.6 3.3B3-1 28 A 0 — — UCSC 2.4 —B3-2 28 A 0 — — UCSC 2.5 —B3-3 28 GDS 0 — — UCDS 2.5 —B3-4 47 GDS 100 65 55 CC/P 3.1 2.1B3-5 49 GDS 100 65 55 CC/P 2.9 2.1B3-6 51 GDS 400 65 55 CC/P 3.4 2.2B3-7 55 GDS 400 65 55 CC/P 3.2 2.2B3-8 57 GDS 900 65 55 CC/P 5.2 3.4B3-9 63 GDS 900 — — Confirmation 5.5 3.2
Note: A, Avery compression machine; GDS, Global Digital Systems triaxial apparatus; UC, unconfined compression (subscripts SC and DSrepresent sulfur-capped and diamond saw–cut end treatments, respectively); CC/P, compression with permeation.
*Specimens are labeled using batch–specimen number.{Time of testing after mixing.{Compressed at a constant rate of 0.001 mm/min.
Table 3. Comparison of local and global strain mea-surements in GDS apparatus ( fcu = 8.3 MPa).
Load (kN) Local strain (%) Global strain (%)5 0.03 0.0310 0.09 0.0915 0.17 0.1720 0.28 0.2925 0.38 0.41
464 Can. Geotech. J. Vol. 47, 2010
Published by NRC Research Press
Can
. Geo
tech
. J. D
ownl
oade
d fr
om w
ww
.nrc
rese
arch
pres
s.co
m b
y U
nive
rsity
of
Wes
tern
Ont
ario
on
05/1
7/11
For
pers
onal
use
onl
y.
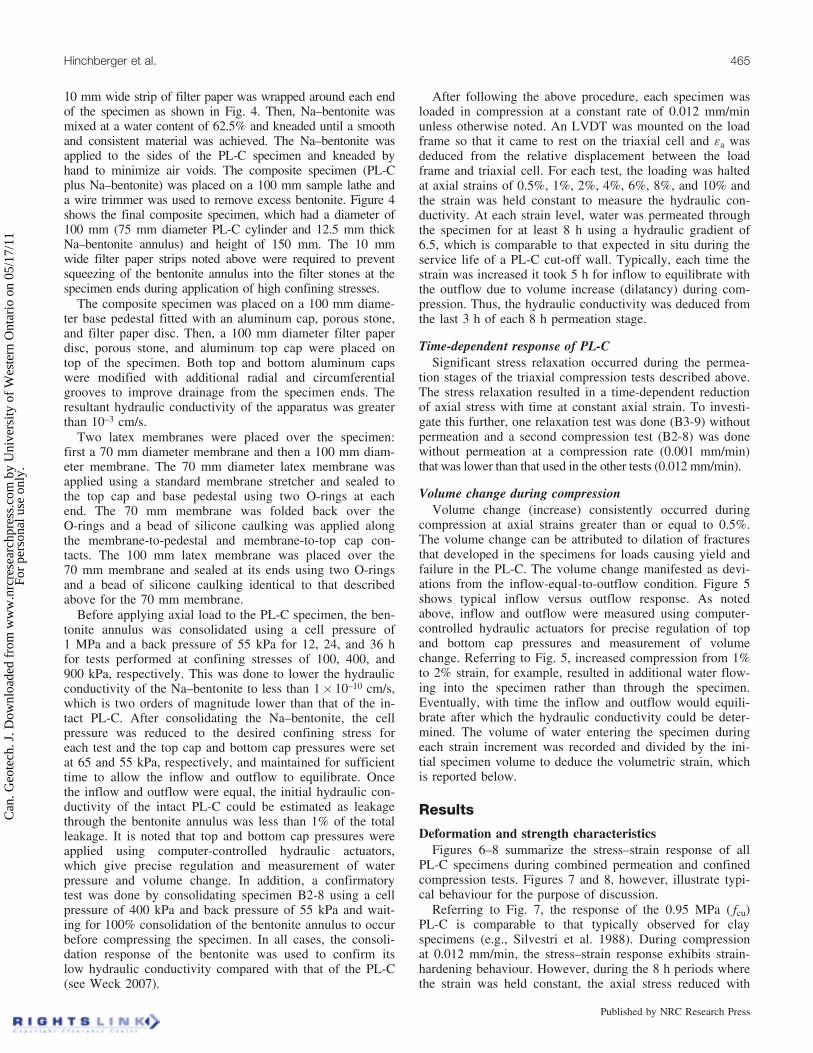
10 mm wide strip of filter paper was wrapped around each endof the specimen as shown in Fig. 4. Then, Na–bentonite wasmixed at a water content of 62.5% and kneaded until a smoothand consistent material was achieved. The Na–bentonite wasapplied to the sides of the PL-C specimen and kneaded byhand to minimize air voids. The composite specimen (PL-Cplus Na–bentonite) was placed on a 100 mm sample lathe anda wire trimmer was used to remove excess bentonite. Figure 4shows the final composite specimen, which had a diameter of100 mm (75 mm diameter PL-C cylinder and 12.5 mm thickNa–bentonite annulus) and height of 150 mm. The 10 mmwide filter paper strips noted above were required to preventsqueezing of the bentonite annulus into the filter stones at thespecimen ends during application of high confining stresses.
The composite specimen was placed on a 100 mm diame-ter base pedestal fitted with an aluminum cap, porous stone,and filter paper disc. Then, a 100 mm diameter filter paperdisc, porous stone, and aluminum top cap were placed ontop of the specimen. Both top and bottom aluminum capswere modified with additional radial and circumferentialgrooves to improve drainage from the specimen ends. Theresultant hydraulic conductivity of the apparatus was greaterthan 10–3 cm/s.
Two latex membranes were placed over the specimen:first a 70 mm diameter membrane and then a 100 mm diam-eter membrane. The 70 mm diameter latex membrane wasapplied using a standard membrane stretcher and sealed tothe top cap and base pedestal using two O-rings at eachend. The 70 mm membrane was folded back over theO-rings and a bead of silicone caulking was applied alongthe membrane-to-pedestal and membrane-to-top cap con-tacts. The 100 mm latex membrane was placed over the70 mm membrane and sealed at its ends using two O-ringsand a bead of silicone caulking identical to that describedabove for the 70 mm membrane.
Before applying axial load to the PL-C specimen, the ben-tonite annulus was consolidated using a cell pressure of1 MPa and a back pressure of 55 kPa for 12, 24, and 36 hfor tests performed at confining stresses of 100, 400, and900 kPa, respectively. This was done to lower the hydraulicconductivity of the Na–bentonite to less than 1� 10–10 cm/s,which is two orders of magnitude lower than that of the in-tact PL-C. After consolidating the Na–bentonite, the cellpressure was reduced to the desired confining stress foreach test and the top cap and bottom cap pressures were setat 65 and 55 kPa, respectively, and maintained for sufficienttime to allow the inflow and outflow to equilibrate. Oncethe inflow and outflow were equal, the initial hydraulic con-ductivity of the intact PL-C could be estimated as leakagethrough the bentonite annulus was less than 1% of the totalleakage. It is noted that top and bottom cap pressures wereapplied using computer-controlled hydraulic actuators,which give precise regulation and measurement of waterpressure and volume change. In addition, a confirmatorytest was done by consolidating specimen B2-8 using a cellpressure of 400 kPa and back pressure of 55 kPa and wait-ing for 100% consolidation of the bentonite annulus to occurbefore compressing the specimen. In all cases, the consoli-dation response of the bentonite was used to confirm itslow hydraulic conductivity compared with that of the PL-C(see Weck 2007).
After following the above procedure, each specimen wasloaded in compression at a constant rate of 0.012 mm/minunless otherwise noted. An LVDT was mounted on the loadframe so that it came to rest on the triaxial cell and 3a wasdeduced from the relative displacement between the loadframe and triaxial cell. For each test, the loading was haltedat axial strains of 0.5%, 1%, 2%, 4%, 6%, 8%, and 10% andthe strain was held constant to measure the hydraulic con-ductivity. At each strain level, water was permeated throughthe specimen for at least 8 h using a hydraulic gradient of6.5, which is comparable to that expected in situ during theservice life of a PL-C cut-off wall. Typically, each time thestrain was increased it took 5 h for inflow to equilibrate withthe outflow due to volume increase (dilatancy) during com-pression. Thus, the hydraulic conductivity was deduced fromthe last 3 h of each 8 h permeation stage.
Time-dependent response of PL-CSignificant stress relaxation occurred during the permea-
tion stages of the triaxial compression tests described above.The stress relaxation resulted in a time-dependent reductionof axial stress with time at constant axial strain. To investi-gate this further, one relaxation test was done (B3-9) withoutpermeation and a second compression test (B2-8) was donewithout permeation at a compression rate (0.001 mm/min)that was lower than that used in the other tests (0.012 mm/min).
Volume change during compressionVolume change (increase) consistently occurred during
compression at axial strains greater than or equal to 0.5%.The volume change can be attributed to dilation of fracturesthat developed in the specimens for loads causing yield andfailure in the PL-C. The volume change manifested as devi-ations from the inflow-equal-to-outflow condition. Figure 5shows typical inflow versus outflow response. As notedabove, inflow and outflow were measured using computer-controlled hydraulic actuators for precise regulation of topand bottom cap pressures and measurement of volumechange. Referring to Fig. 5, increased compression from 1%to 2% strain, for example, resulted in additional water flow-ing into the specimen rather than through the specimen.Eventually, with time the inflow and outflow would equili-brate after which the hydraulic conductivity could be deter-mined. The volume of water entering the specimen duringeach strain increment was recorded and divided by the ini-tial specimen volume to deduce the volumetric strain, whichis reported below.
Results
Deformation and strength characteristicsFigures 6–8 summarize the stress–strain response of all
PL-C specimens during combined permeation and confinedcompression tests. Figures 7 and 8, however, illustrate typi-cal behaviour for the purpose of discussion.
Referring to Fig. 7, the response of the 0.95 MPa ( fcu)PL-C is comparable to that typically observed for clayspecimens (e.g., Silvestri et al. 1988). During compressionat 0.012 mm/min, the stress–strain response exhibits strain-hardening behaviour. However, during the 8 h periods wherethe strain was held constant, the axial stress reduced with
Hinchberger et al. 465
Published by NRC Research Press
Can
. Geo
tech
. J. D
ownl
oade
d fr
om w
ww
.nrc
rese
arch
pres
s.co
m b
y U
nive
rsity
of
Wes
tern
Ont
ario
on
05/1
7/11
For
pers
onal
use
onl
y.
time as illustrated by the data labeled SR8hr in Figs. 7 and 8.From the data shown in Fig. 7, upper bound and lowerbound compression curves can be deduced. The upper curvedenotes the stress–strain response at a compression rate of0.012 mm/min, while the lower curve denotes the 8 h re-laxed stress–strain response.
For comparison purposes, the stress–strain response of0.95 MPa ( fcu) PL-C during a compression test performedat a constant rate of 0.001 mm/min (specimen B2-8) is alsoshown in Fig. 7. This test, which was undertaken in the ab-sence of permeation, confirms the sensitivity of plastic con-crete to compression rate and it suggests that the 8 h relaxedstress–strain curve is roughly equivalent to that obtained at aslower strain rate of 0.001 mm/min.
Figure 8 shows similar stress–strain response for 2.5 MPa( fcu) PL-C corresponding to a confining pressure of 900 kPa.Again, upper and lower stress–strain curves can be deducedfor the 2.5 MPa PL-C specimens. Referring to Fig. 8 andTable 2, it can also be seen that similar results were ob-tained with or without permeation (see specimens B3-8 andB3-9). Table 2 summarizes the PL-C specimen strength at acompression rate of 0.012 mm/m and the strength deduced
after 8 h of relaxation, which is labeled the relaxed strength.On average, the relaxed strength is about 33% lower thanthat measured at 0.012 mm/min.
Figures 9 and 10 summarize the axial stress versus log-time response of 0.95 MPa ( fcu) and 2.5 MPa ( fcu) speci-mens during each of the stress relaxation stages labeledSR8hr in Figs. 7 and 8. From the stress-relaxation response,it can be seen that the relaxation process does not appear tostabilize after the 8 h and as such, the long-term strength ofPL-C is likely to be lower than observed in this study and asdenoted by the relaxed curves.
Figure 11 shows the normalized compressive strength(ffiffiffi3
ptoct=fcu) of PL-C versus normalized mean stress,
(ffiffiffi3
psoct=fcu) from tests performed at a compression rate of
0.012 mm/min. In addition, strength data for normal strengthconcrete (Seow and Swaddiwudhipong 2005) is also plottedin this figure, where
toct ¼ffiffiffiffiffiffiffiffiffiffiffiffiffiffiffiffiffiffiffiffiffiffiffiffiffiffiffiffiffiffiffiffiffiffiffiffiffiffiffiffiffiffiffiffiffiffiffiffiffiffiffiffiffiffiffiffiffiffiffiffiffiffiffiffiffiffiffiffiffiffiffiffiffiffiffiffiffiffiffiffiffiffiffi1=2½ðs1 � s2Þ2 þ ðs2 � s3Þ2 þ ðs3 � s1Þ2�
p
is the octahedral shear stress at failure, soct = (s1 + s2 + s3)/3 is the octahedral normal stress at failure, and s1, s2, and s3
Fig. 4. Details of plastic concrete specimens: (a) drawings; (b) photograph – side view; (c) photograph – top view.
466 Can. Geotech. J. Vol. 47, 2010
Published by NRC Research Press
Can
. Geo
tech
. J. D
ownl
oade
d fr
om w
ww
.nrc
rese
arch
pres
s.co
m b
y U
nive
rsity
of
Wes
tern
Ont
ario
on
05/1
7/11
For
pers
onal
use
onl
y.

are the major, intermediate, and minor principle stresses, re-spectively. Figure 11 shows that the variation of PL-C com-pressive strength versus confining pressure is comparable tothat of normal strength concrete. Thus, the failure criteria fornormal strength concrete (e.g., Seow and Swaddiwudhipong2005; Hinchberger 2009) appear to be suitable for PL-C, atleast in compression.
Fig. 5. Typical volume in and out during triaxial tests with per-meation: (a) full test; (b) response during compression from 1% to2% axial strain, 3.
Fig. 6. Summary of stress–strain and stress-relaxation response ofplastic concrete.
Fig. 7. Stress–strain response of 0.95 MPa ( fcu) plastic concrete(sc = 400 kPa).
Fig. 8. Stress–strain response of 2.5 MPa ( fcu) plastic concrete(sc = 900 kPa).
Fig. 9. Stress relaxation versus log-time response of 0.95 MPa ( fcu)plastic concrete (sc = 400 kPa).
Hinchberger et al. 467
Published by NRC Research Press
Can
. Geo
tech
. J. D
ownl
oade
d fr
om w
ww
.nrc
rese
arch
pres
s.co
m b
y U
nive
rsity
of
Wes
tern
Ont
ario
on
05/1
7/11
For
pers
onal
use
onl
y.

The ratio of elastic modulus to unconfined compressivestrength, E/fcu, is summarized in Fig. 12. Overall, the stiff-ness of the 0.6 MPa ( fcu) and 0.95 MPa ( fcu) PL-C isstrongly influenced by sc as shown in this figure. The E/fcuratio of both the 0.6 and 0.95 MPa specimens roughly dou-bles as sc is increased from the unconfined state to sc =900 kPa. To put this into context, sc typically has a stronginfluence on the elastic modulus, E, of soils (e.g., Janbu1963). For the 2.5 MPa PL-C specimens, however, there isa change in behaviour. The influence of sc on the E/fcu ratioof the 2.5 MPa PL-C is quite small and more comparable tothat normally observed for conventional concrete (see Scottet al. 1982). It is noted that the Janbu (1963) parameters forthe 0.6 and 0.95 MPa ( fcu) PL-C mixes are also presented inFig. 12.
Lastly, Fig. 13 summarizes the volumetric response ofPL-C during triaxial compression and the corresponding
tangent incremental Poisson’s ratio (ni). The tangent ni isshown in this figure as nonlinear elastic constitutive modelsare often employed in practice to model the response ofPL-C. Based on Fig. 13, the following observations can bemade. First, all specimens underwent initial volumetric con-traction followed by volumetric expansion, which is attrib-uted to yielding and dilation (note that compression ispositive). Second, the magnitude of volumetric expansion atfailure decreases with increasing sc, which is consistent withthat observed for normal strength concrete (e.g., Montoya2003). Third, ni increases from about 0.2 to 0.95 immedi-ately after reaching the peak strength, which is indicative ofvolumetric expansion due to the formation of roughirregular-shaped cracks in the specimens after yield followedby dilation of these cracks with continued compression.Such dilation causes an increase in the crack volume.Finally, ni decreases to 0.5 at axial strains in excess of 6%,which corresponds to the constant volume state. Generally,the volumetric response of PL-C during triaxial compressionis similar to that observed for other frictional materials. Inthe following sections, it will be shown that the dilatantbehaviour depicted in Fig. 13 leads to comparable variationsin the hydraulic conductivity with axial strain.
Fig. 10. Stress relaxation versus log-time response of 2.5 MPa ( fcu)plastic concrete (sc = 900 kPa).
Fig. 11. Comparison of the compressive strength of plastic concretewith normal strength concrete.
Fig. 12. Modulus ratio (E/fcu) of plastic concrete versus confine-ment pressure. pa, atmospheric pressure.
Fig. 13. Volumetric strain versus axial strain.
468 Can. Geotech. J. Vol. 47, 2010
Published by NRC Research Press
Can
. Geo
tech
. J. D
ownl
oade
d fr
om w
ww
.nrc
rese
arch
pres
s.co
m b
y U
nive
rsity
of
Wes
tern
Ont
ario
on
05/1
7/11
For
pers
onal
use
onl
y.
Hydraulic conductivity
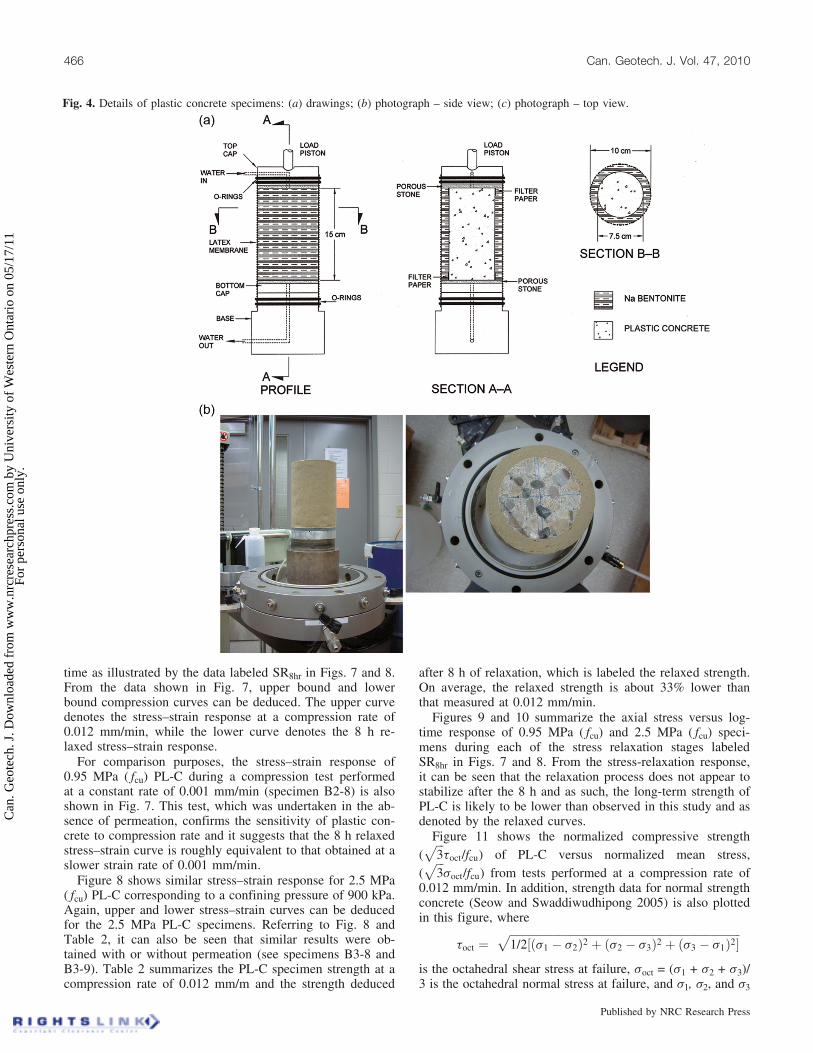
Low confinement (sc = 100 kPa)Figure 14 shows the impact of axial strain on the
hydraulic conductivity of PL-C at 100 kPa confining stress.Although there is some variation in the test results, it can beseen that there is a consistent trend of increasing hydraulicconductivity with increasing axial strain and dilatancy (seeFig. 13). For most specimens, the hydraulic conductivity in-creased from the intact value of 1� 10–8 cm/s to between3.5� 10–7 and 7.0� 10–7 cm/s at 1% axial strain. There is afurther increase in the hydraulic conductivity to between3.5 � 10–6 and 6.0 � 10–6 cm/s for axial strains in excess ofabout 6%. Considering the intact hydraulic conductivity ofPL-C (1� 10–8 cm/s), these increases are significant andmay affect the performance and interpretation of thehydraulic efficiency of PL-C cut-off walls at low confiningstresses. The impact of the specimen failure mode on theseresults will be discussed below.
Intermediate confinement (sc = 400 kPa)Figure 15 shows the effect of axial strain on the hydraulic
conductivity of PL-C at 400 kPa confining stress, which iscomparable to the stresses expected in the upper portions ofcut-off walls below embankment dams between 30 and 50 min height (see Weck 2007). Similar to that observed at lowconfining stress, there is a comparable increase in hydraulicconductivity versus increasing axial strain. The hydraulicconductivity increases from 1� 10–8 cm/s for the intactspecimens to between 1.8� 10–7 and 5.0� 10–7 cm/s for 0.6and 0.95 MPa specimens at 1% axial strain. It is interestingthat the hydraulic conductivity of 2.5 MPa PL-C increasedless than that observed for 0.6 and 0.95 MPa mixes withvalues ranging from 3� 10–8 to 9� 10–8 cm/s at 1% axialstrain. The higher strength PL-C appears to be somewhatmore resistant to increases in hydraulic conductivity duringcompressive straining, possibly due to reduced dilatancy.For axial strains in excess of 6%, the hydraulic conductivityis consistently higher than 9� 10–7 cm/s for all specimensregardless of the compressive strength.
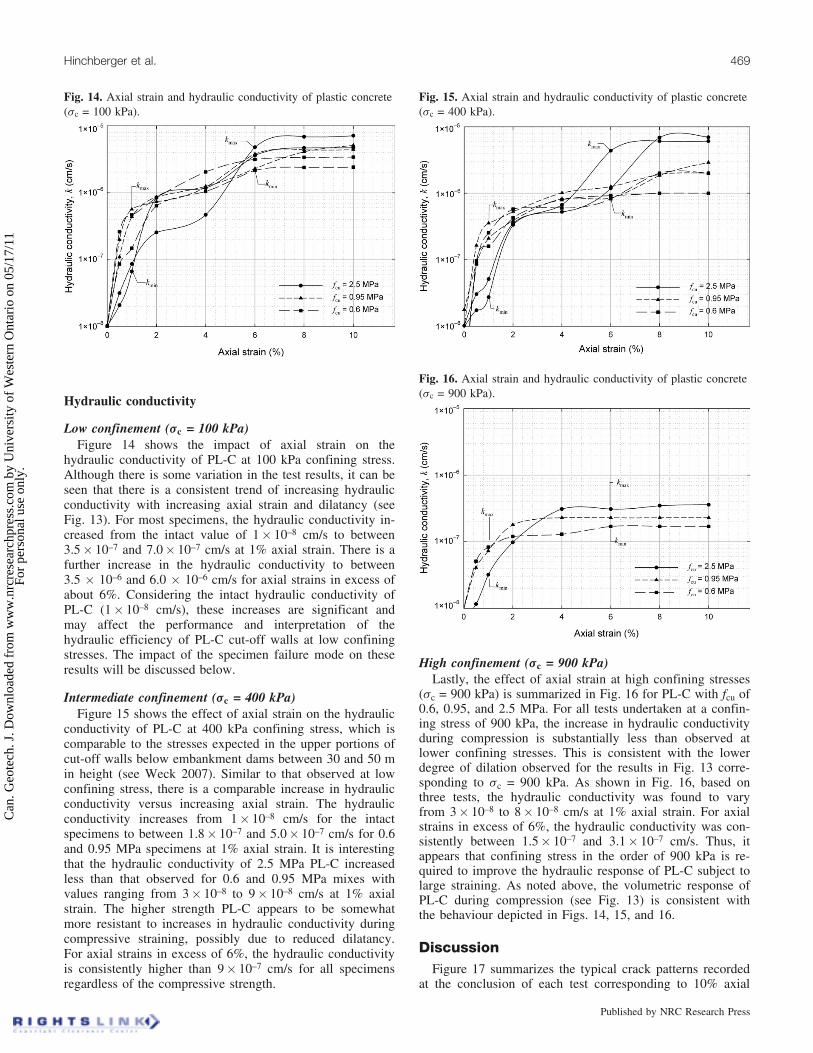
High confinement (sc = 900 kPa)Lastly, the effect of axial strain at high confining stresses
(sc = 900 kPa) is summarized in Fig. 16 for PL-C with fcu of0.6, 0.95, and 2.5 MPa. For all tests undertaken at a confin-ing stress of 900 kPa, the increase in hydraulic conductivityduring compression is substantially less than observed atlower confining stresses. This is consistent with the lowerdegree of dilation observed for the results in Fig. 13 corre-sponding to sc = 900 kPa. As shown in Fig. 16, based onthree tests, the hydraulic conductivity was found to varyfrom 3� 10–8 to 8� 10–8 cm/s at 1% axial strain. For axialstrains in excess of 6%, the hydraulic conductivity was con-sistently between 1.5� 10–7 and 3.1� 10–7 cm/s. Thus, itappears that confining stress in the order of 900 kPa is re-quired to improve the hydraulic response of PL-C subject tolarge straining. As noted above, the volumetric response ofPL-C during compression (see Fig. 13) is consistent withthe behaviour depicted in Figs. 14, 15, and 16.
DiscussionFigure 17 summarizes the typical crack patterns recorded
at the conclusion of each test corresponding to 10% axial
Fig. 14. Axial strain and hydraulic conductivity of plastic concrete(sc = 100 kPa).
Fig. 15. Axial strain and hydraulic conductivity of plastic concrete(sc = 400 kPa).
Fig. 16. Axial strain and hydraulic conductivity of plastic concrete(sc = 900 kPa).
Hinchberger et al. 469
Published by NRC Research Press
Can
. Geo
tech
. J. D
ownl
oade
d fr
om w
ww
.nrc
rese
arch
pres
s.co
m b
y U
nive
rsity
of
Wes
tern
Ont
ario
on
05/1
7/11
For
pers
onal
use
onl
y.
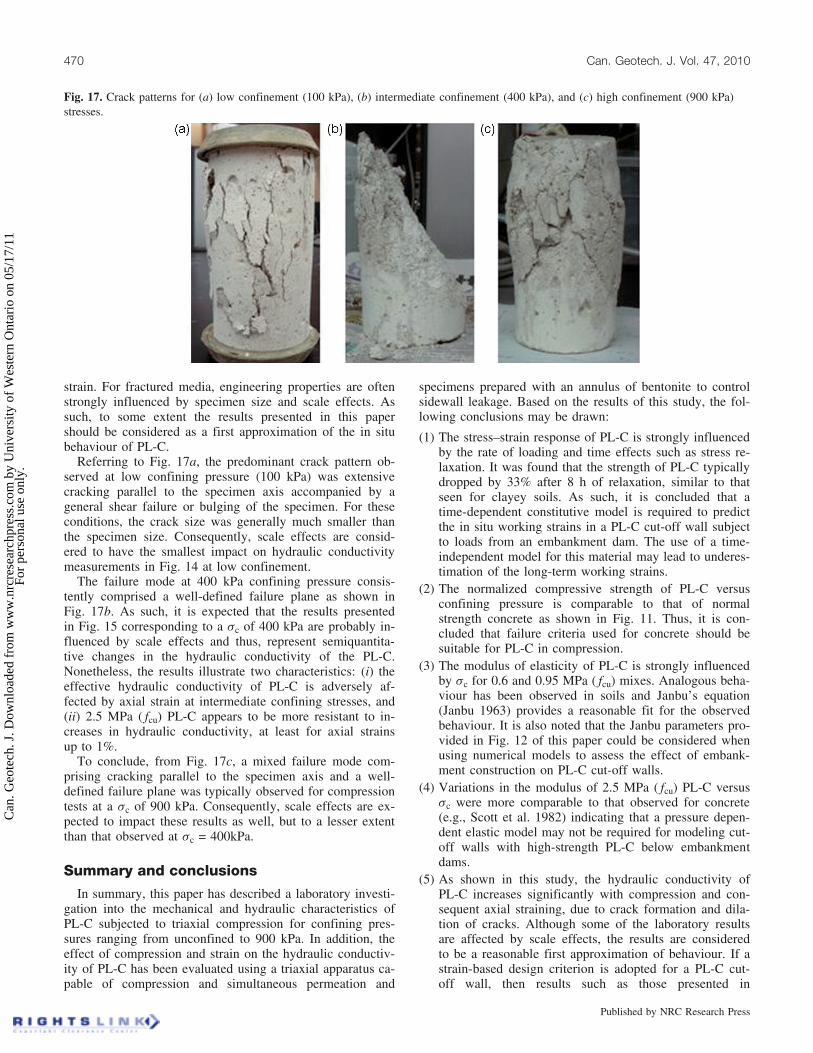
strain. For fractured media, engineering properties are oftenstrongly influenced by specimen size and scale effects. Assuch, to some extent the results presented in this papershould be considered as a first approximation of the in situbehaviour of PL-C.
Referring to Fig. 17a, the predominant crack pattern ob-served at low confining pressure (100 kPa) was extensivecracking parallel to the specimen axis accompanied by ageneral shear failure or bulging of the specimen. For theseconditions, the crack size was generally much smaller thanthe specimen size. Consequently, scale effects are consid-ered to have the smallest impact on hydraulic conductivitymeasurements in Fig. 14 at low confinement.
The failure mode at 400 kPa confining pressure consis-tently comprised a well-defined failure plane as shown inFig. 17b. As such, it is expected that the results presentedin Fig. 15 corresponding to a sc of 400 kPa are probably in-fluenced by scale effects and thus, represent semiquantita-tive changes in the hydraulic conductivity of the PL-C.Nonetheless, the results illustrate two characteristics: (i) theeffective hydraulic conductivity of PL-C is adversely af-fected by axial strain at intermediate confining stresses, and(ii) 2.5 MPa ( fcu) PL-C appears to be more resistant to in-creases in hydraulic conductivity, at least for axial strainsup to 1%.
To conclude, from Fig. 17c, a mixed failure mode com-prising cracking parallel to the specimen axis and a well-defined failure plane was typically observed for compressiontests at a sc of 900 kPa. Consequently, scale effects are ex-pected to impact these results as well, but to a lesser extentthan that observed at sc = 400kPa.
Summary and conclusions
In summary, this paper has described a laboratory investi-gation into the mechanical and hydraulic characteristics ofPL-C subjected to triaxial compression for confining pres-sures ranging from unconfined to 900 kPa. In addition, theeffect of compression and strain on the hydraulic conductiv-ity of PL-C has been evaluated using a triaxial apparatus ca-pable of compression and simultaneous permeation and
specimens prepared with an annulus of bentonite to controlsidewall leakage. Based on the results of this study, the fol-lowing conclusions may be drawn:
(1) The stress–strain response of PL-C is strongly influencedby the rate of loading and time effects such as stress re-laxation. It was found that the strength of PL-C typicallydropped by 33% after 8 h of relaxation, similar to thatseen for clayey soils. As such, it is concluded that atime-dependent constitutive model is required to predictthe in situ working strains in a PL-C cut-off wall subjectto loads from an embankment dam. The use of a time-independent model for this material may lead to underes-timation of the long-term working strains.
(2) The normalized compressive strength of PL-C versusconfining pressure is comparable to that of normalstrength concrete as shown in Fig. 11. Thus, it is con-cluded that failure criteria used for concrete should besuitable for PL-C in compression.
(3) The modulus of elasticity of PL-C is strongly influencedby sc for 0.6 and 0.95 MPa ( fcu) mixes. Analogous beha-viour has been observed in soils and Janbu’s equation(Janbu 1963) provides a reasonable fit for the observedbehaviour. It is also noted that the Janbu parameters pro-vided in Fig. 12 of this paper could be considered whenusing numerical models to assess the effect of embank-ment construction on PL-C cut-off walls.
(4) Variations in the modulus of 2.5 MPa ( fcu) PL-C versussc were more comparable to that observed for concrete(e.g., Scott et al. 1982) indicating that a pressure depen-dent elastic model may not be required for modeling cut-off walls with high-strength PL-C below embankmentdams.
(5) As shown in this study, the hydraulic conductivity ofPL-C increases significantly with compression and con-sequent axial straining, due to crack formation and dila-tion of cracks. Although some of the laboratory resultsare affected by scale effects, the results are consideredto be a reasonable first approximation of behaviour. If astrain-based design criterion is adopted for a PL-C cut-off wall, then results such as those presented in
Fig. 17. Crack patterns for (a) low confinement (100 kPa), (b) intermediate confinement (400 kPa), and (c) high confinement (900 kPa)stresses.
470 Can. Geotech. J. Vol. 47, 2010
Published by NRC Research Press
Can
. Geo
tech
. J. D
ownl
oade
d fr
om w
ww
.nrc
rese
arch
pres
s.co
m b
y U
nive
rsity
of
Wes
tern
Ont
ario
on
05/1
7/11
For
pers
onal
use
onl
y.
Figs. 14–16 should provide a basis for developing a sui-table working-strain limit.
(6) Mahboubi and Ajorloo (2004) have shown that PL-C haslower porosity, lower intact permeability, and a higherelastic modulus when it is cured at high sc comparedwith no confinement as done in this study. As such, itshould be noted that the stiffness and intact permeabilityof the PL-C tested in the current study are likely lowerand higher, respectively, than the corresponding materialcured in situ where the confining pressures are signifi-cant. However, the post-yield dilation of PL-C and theresultant increase in hydraulic conductivity is probablynot that sensitive to the stress state during curing as thisbehaviour is governed by the geometry and roughness ofcracks that develop after yield and failure, which is dic-tated by the aggregate.
(7) Finally, the tests performed in this study indicate thatrough irregular cracks form in PL-C after yielding incompression in spite of its ductility relative to normalstrength cement. Depending on the axial strain inducedby dam construction, significant cracking and dilationcould occur resulting in increased hydraulic conductiv-ity, which is independent of the PL-C strength. Thecrack patterns observed in this study suggest that leakagethrough such a material would follow tortuous flowpaths, which could increase the likelihood of hydraulicerosion (Davidson et al. 1992). As such, mix designsthat are more resistant to hydraulic erosion should beconsidered for situations where high strains are expectedand the head across the cut-off wall is high.
AcknowledgementsThe research presented in this paper has been undertaken
with Discovery Grants awarded to Drs. S. Hinchberger andT.A. Newson by the Natural Sciences and Engineering Re-search Council of Canada. The authors would also like toacknowledge the financial support and assistance of Dr.Rob Dawson (Hatch Ltd.) over the course of this investiga-tion.
ReferencesASTM. 1998a. Standard test method for slump of hydraulic-cement
concrete. ASTM standard C143. Annual Book of ASTM Stan-dards. American Society for Testing and Materials, West Con-shohocken, Pa.
ASTM. 1998b. Standard practice for capping cylindrical concretespecimens. ASTM standard C617. American Society for Testingand Materials, West Conshohocken, Pa.
ASTM. 2005. Standard test methods for laboratory determinationof water (moisture) content of soil and rock by mass. ASTMstandard D2216. American Society for Testing and Materials,West Conshohocken, Pa.
Balian, S. 2007. Cut-off wall construction (Peribonka Dam). Inter-national Water Power and Dam Construction, 59(2): 42–44.
Davidson, R.R., Levallois, J., and Graybeal, K. 1992. Seepage cut-off walls for mud mountain dam. In Slurry walls: design, con-
struction, and quality control. ASTM Special TechnicalPublication No. 1129. American Society for Testing and Materi-als, Philadelphia, Pa. pp. 309–323.
Hinchberger, S.D. 2009. A simple single-surface failure criterionfor concrete. Journal of Engineering Mechanics, 135(7): 729–732. doi:10.1061/(ASCE)0733-9399(2009)135:7(729).
Hutchinson, M.T., Daw, G.P., Shotton, P.G., and James, A.N. 1975.The properties of bentonite slurries used in diaphragm walls andtheir control. In Diaphragm Walls and Anchorage, Proceedingsof the Conference organized by the Institution of Civil Engi-neers, London, England, 18–20 September 1974. Institution ofCivil Engineers, London. pp. 33–39.
Issa, S.A., Islam, M.A., Issa, M.A., Youssif, A.A., and Issa, M.A.2000. Specimen and aggregate size effect on concrete compres-sive strength. Journal of Cement, Concrete and Aggregates,22(2): 103–115. doi:10.1520/CCA10470J.
Janbu, N. 1963. Soil compressibility as determined by oedometerand triaxial tests. In Proceedings of the European Conferenceon Soil Mechanics and Foundation Engineering, Weisbaden,Germany, 15–18 October 1963. Deutsche Gesellschaft fur Erd-und Grundbau, Essen, Germany. Vol. 1, pp. 19–25.
Kahl, T., Kauschinger, J.L., and Perry, E.B. 1991. Plastic concretecutoff walls for earth dams. U.S. Army Engineering WaterwaysExperimental Station, Vicksburg, Miss.
Mahboubi, A., and Ajorloo, A. 2004. Experimental study of themechanical behavior of plastic concrete in triaxial compression.Cement and Concrete Research, 35(2): 412–419. doi:10.1016/j.cemconres.2004.09.011.
Menzies, B. 1988. A computer controlled hydraulic triaxial testingsystem. In Advanced triaxial testing of soil and rock. ASTMSTP 977. Edited by R.T. Donaghe, R.C. Chaney, and M.L. Sil-ver. American Society for Testing and Materials (ASTM), Phila-delphia, Pa. pp. 82–94.
Montoya, E. 2003. Behaviour and analysis of confined concrete.Ph.D. thesis, University of Toronto, Toronto, Ont.
Rigbey, S. 2006. Shikwamkwa dam replacement project. In Pro-ceedings of the Hatch Energy Symposium on Dams, NiagaraFalls, Ont., 18 April 2006. [CD-ROM]. Hatch Ltd., NiagaraFalls, Ont.
Scott, B.D., Park, R., and Priestley, M.J. 1982. Stress-strain beha-viour of concrete confined by overlapping hoops at low andhigh strain rates. ACI Journal, 79(2): 13–27.
Seow, P., and Swaddiwudhipong, S. 2005. Failure surface for con-crete under multiaxial load — a unified approach. Journal ofMaterials in Civil Engineering, 17(2): 219–228. doi:10.1061/(ASCE)0899-1561(2005)17:2(219).
Silvestri, V., Soulie, M., Touchan, Z., and Fay, B. 1988. Triaxialrelaxation tests on a soft clay. In Advanced triaxial testing ofsoil and rock. ASTM STP 977. Edited by R.T. Donaghe, R.C.Chaney, and M.L. Silver. American Society for Testing and Ma-terials, Philadelphia, Pa. pp. 321–337.
Soroush, A., and Soroush, M. 2005. Parameters affecting the thick-ness of bentonite cake in cutoff wall construction: case studyand physical modeling. Canadian Geotechnical Journal, 42(2):646–654. doi:10.1139/t04-090.
Weck, J.V. 2007. Mechanical and hydraulic characterization ofplastic concrete. M.E.Sc. thesis, The University of WesternOntario, London, Ont.
Hinchberger et al. 471
Published by NRC Research Press
Can
. Geo
tech
. J. D
ownl
oade
d fr
om w
ww
.nrc
rese
arch
pres
s.co
m b
y U
nive
rsity
of
Wes
tern
Ont
ario
on
05/1
7/11
For
pers
onal
use
onl
y.