Embed Size (px)
Citation preview
Mechanism of Immobilized Protein A Binding to Immunoglobulin Gon Nanosensor Array SurfacesJustin T. Nelson,† Sojin Kim,† Nigel F. Reuel, Daniel P. Salem, Gili Bisker, Markita P. Landry,Sebastian Kruss, Paul W. Barone, Seonyeong Kwak, and Michael S. Strano*
Department of Chemical Engineering, Massachusetts Institute of Technology, Cambridge, Massachusetts 02139, United States
ABSTRACT: Protein A is often used for the purification anddetection of antibodies such as immunoglobulin G (IgG)because of its quadrivalent domains that bind to the Fc region ofthese macromolecules. However, the kinetics and thermody-namics of the binding to many sensor surfaces have eludedmechanistic description due to complexities associated withmultivalent interactions. In this work, we use a near-infrared(nIR) fluorescent single-walled carbon nanotube sensor array toobtain the kinetics of IgG binding to protein A, immobilizedusing a chelated Cu2+/His-tag chemistry to hydrogel dispersedsensors. A bivalent binding mechanism is able to describe theconcentration dependence of the effective dissociation constant,KD,eff, which varies from 100 pM to 1 μM for IgG concentrationsfrom 1 ng mL−1 to 100 μg mL−1, respectively. The mechanism isshown to describe the unusual concentration-dependent scaling demonstrated by other sensor platforms in the literature as well,and a comparison is made between resulting parameters. For comparison, we contrast IgG binding with that of human growthhormone (hGH) to its receptor (hGH−R) which displays an invariant dissociation constant at KD = 9 μM. These results shouldaid in the use of protein A and other recognition elements in a variety of sensor types.
Antibodies have emerged as a promising class of biologicaltools for therapeutic and diagnostic applications.1−5
Affinity chromatography is widely used for antibody recoveryand purification; however, fundamental questions regarding thebinding mechanisms involved in these processes still remain.6−8
For many classes of antibodies, protein A affinity chromatog-raphy is chosen due to the high affinity and selectivity thatprotein A has for antibodies such as human immunoglobulin G(IgG). Protein A contains four structurally similar binding siteswith high affinity for the Fc region of most subclasses of humanIgG, and the Fc region of human IgG has two sites which canbe bound by protein A.9
Surface sensors such as surface plasmon resonance (SPR)and quartz-crystal microbalance (QCM), functionalized todisplay protein A, are useful tools for immunoassays as they arecapable of measuring kinetic and thermodynamic bindingparameters. However, as a result of the multivalent nature ofboth protein A and human IgG, analysis of such bindingexperiments is complicated and a meaningful interpretation ofthese parameters has been lacking.10 Others have measuredapparent equilibrium binding affinities which demonstrateconcentration dependence, with significantly greater affinityobserved at low human IgG concentrations.6,7 These have beengenerally attributed to the multivalent interactions that arepossible at large protein A/IgG ratios; however, mosttechniques lack the sensitivity to measure interactions at verylow IgG concentrations.
Herein we demonstrate a protein A-modified near-infrared(nIR) fluorescent single-walled carbon nanotube (SWNT)platform using a Cu2+/Nα,Nα-bis(carboxymethyl)-L-lysine hy-drate (NTA)/histidine-tagged (His-tagged) protein mecha-nism. In general, His-tagged proteins strongly bind to divalentmetal cations chelated to nitrilotriacetate groups, whichprovides a convenient chemistry for real-time label-free sensorapplications.11−14 With this system, a calibration curve wasprepared for picomolar to nearly micromolar IgG concen-trations, and the binding dynamics were measured. From thesedata, we constructed a multivalent binding mechanism which isconsistent with the kinetics and equilibrium state of binding.The mechanism described the unusual concentration-depend-ent scaling demonstrated by other sensor platforms in theliterature, and a comparison is made between resultingparameters. To rule out the possibility that the sensor platformitself is nonlinear, human growth hormone (hGH) binding toits receptor protein (hGH−R) was also examined. This workhighlights the necessity to consider binding models morecomplicated than the simple monovalent case when analyzingcomplex biologics.
Received: March 3, 2015Accepted: July 6, 2015Published: July 6, 2015
Article
pubs.acs.org/ac
© 2015 American Chemical Society 8186 DOI: 10.1021/acs.analchem.5b00843Anal. Chem. 2015, 87, 8186−8193
■ EXPERIMENTAL SECTION
Materials. Agarose and succinic anhydride were purchasedfrom Bio-Rad Laboratories and Alfa Aesar, respectively. RawHiPco SWNTs were bought from Unidym. The followingchemicals were purchased from Sigma Aldrich: chitosan,sodium dodecyl sulfate (SDS), acetic acid, phosphate-bufferedsaline (PBS), N-ethyl-N′-(3-(dimethylamino)propyl) carbodii-mide hydrochloride (EDC), N-hydroxysuccinimide (NHS),copper(II) chloride dihydrate, and Nα,Nα-bis(carboxymethyl)-L-lysine hydrate (NTA). Purified human IgG and recombinantprotein A were purchased from Bethyl Laboratories and SinoBiological Inc., respectively. Recombinant human growthhormone (hGH) and its receptor protein (hGH−R) wereobtained from Novo Nordisk and ACRO Biosystems,respectively.Chitosan-Wrapped SWNT Preparation. A gel-based
separation was used to obtain high-purity (6,5) SWNTsuspended in 2% SDS.15 In order to flocculate SWNT fromthe suspension, 15 mL of 5 mg L−1 SWNT/SDS suspensionand 15 mL of methanol were mixed and shaken. The mixturewas then centrifuged at 3200g for 15 min. The collected SWNTmass was dispersed in water and centrifuged several times towash away residual SDS and methanol. After the finalcentrifugation, the SWNT mass was transferred to 10 mL of2.5 mg mL−1 chitosan in water containing 1 vol % acetic acid.The SWNTs were suspended via tip sonication at 10 W for 45min. The resulting mixture was centrifuged two times at 16000g for 1.5 h to remove SWNT aggregates. The resultingsupernatant (containing the stable chitosan-wrapped SWNTsuspension) was collected and used for sensor fabrication.Sensor Fabrication. First, 2 mg mL−1 (0.2 wt %) of
agarose was melted in water by heating until the solutionbecame clear. Care was taken to avoid boiling. The solution wascooled to approximately 40 °C, and 50 μL of gel was depositedto the bottom of each well of a 96-well flat-bottomed plate. Thegels were cured in a humid environment for 30 min. Then, 15μL of chitosan-wrapped SWNT solution (5 mg L−1) wasspotted onto each gel and incubated in a humidified chamber at
37 °C. After 45 min of incubation, each well was gently washedwith water to remove any excess SWNT solution.Sensor functionalization was similar to the procedure
outlined before.14 Briefly, 5 mg mL−1 of succinic anhydride in300 mM PBS was added to each well and incubated overnight.After being washed with water, the carboxylic acids wereactivated with 20 mg mL−1 EDC and 60 mg mL−1 NHS inMES buffer for 2 h. The wells were again washed with water.Cu−NTA was then coupled to the NHS esters.12 The reactionwas carried out in a HEPES buffer for 5 h. The wells werewashed with PBS and were ready for testing.
Sensor Testing. Sensors were equilibrated in 180 μL ofPBS and loaded with 20 μL of the appropriate His-taggedreceptor protein (1 mg mL−1 protein A for IgG binding, 100 μgmL−1 hGH−R for hGH binding), as described before.16 Thewell was then washed with PBS to remove excess receptorprotein. Binding was measured as 20 μL of the desired analytewas added to the receptor-functionalized sensor. SWNTfluorescence intensity was monitored for the duration of theexperiment to record binding events in real time.
■ RESULTS AND DISCUSSION
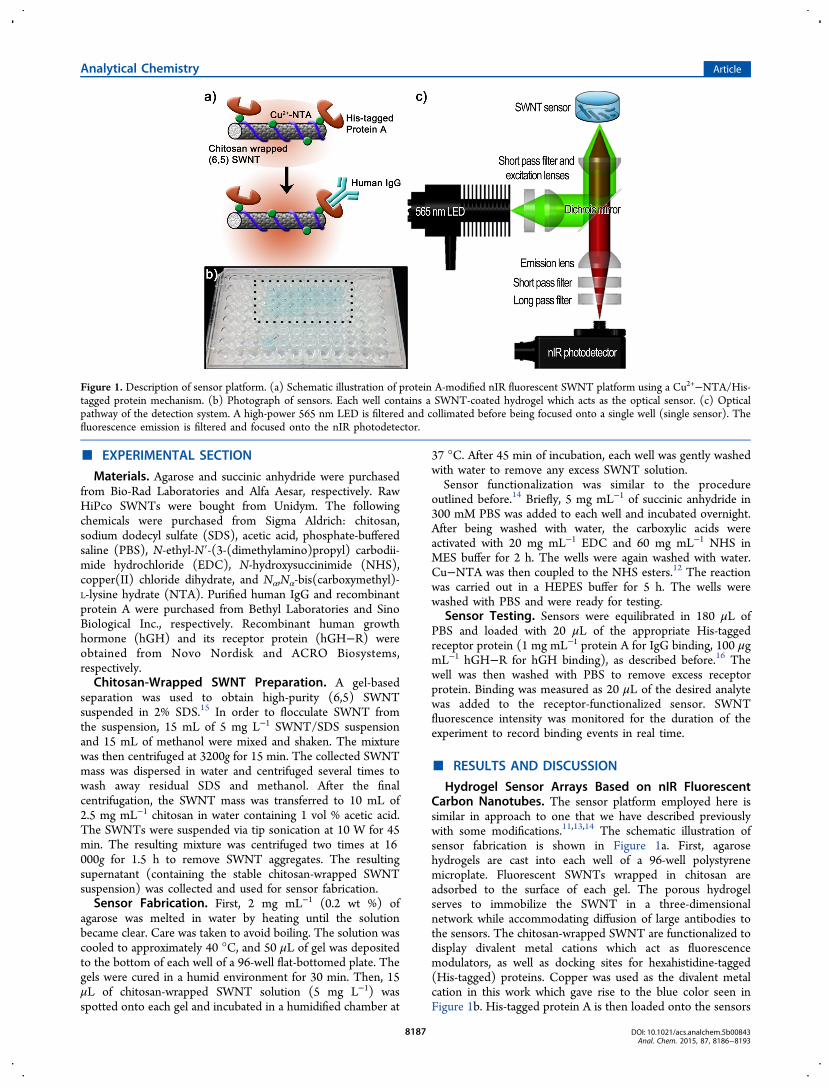
Hydrogel Sensor Arrays Based on nIR FluorescentCarbon Nanotubes. The sensor platform employed here issimilar in approach to one that we have described previouslywith some modifications.11,13,14 The schematic illustration ofsensor fabrication is shown in Figure 1a. First, agarosehydrogels are cast into each well of a 96-well polystyrenemicroplate. Fluorescent SWNTs wrapped in chitosan areadsorbed to the surface of each gel. The porous hydrogelserves to immobilize the SWNT in a three-dimensionalnetwork while accommodating diffusion of large antibodies tothe sensors. The chitosan-wrapped SWNT are functionalized todisplay divalent metal cations which act as fluorescencemodulators, as well as docking sites for hexahistidine-tagged(His-tagged) proteins. Copper was used as the divalent metalcation in this work which gave rise to the blue color seen inFigure 1b. His-tagged protein A is then loaded onto the sensors
Figure 1. Description of sensor platform. (a) Schematic illustration of protein A-modified nIR fluorescent SWNT platform using a Cu2+−NTA/His-tagged protein mechanism. (b) Photograph of sensors. Each well contains a SWNT-coated hydrogel which acts as the optical sensor. (c) Opticalpathway of the detection system. A high-power 565 nm LED is filtered and collimated before being focused onto a single well (single sensor). Thefluorescence emission is filtered and focused onto the nIR photodetector.
Analytical Chemistry Article
DOI: 10.1021/acs.analchem.5b00843Anal. Chem. 2015, 87, 8186−8193
8187
for detection of human IgG. Loading of protein A andsubsequent binding to human IgG both cause increases inSWNT fluorescence intensity by displacing the position of thecopper ions.A simplified nIR fluorescence detection system was also built
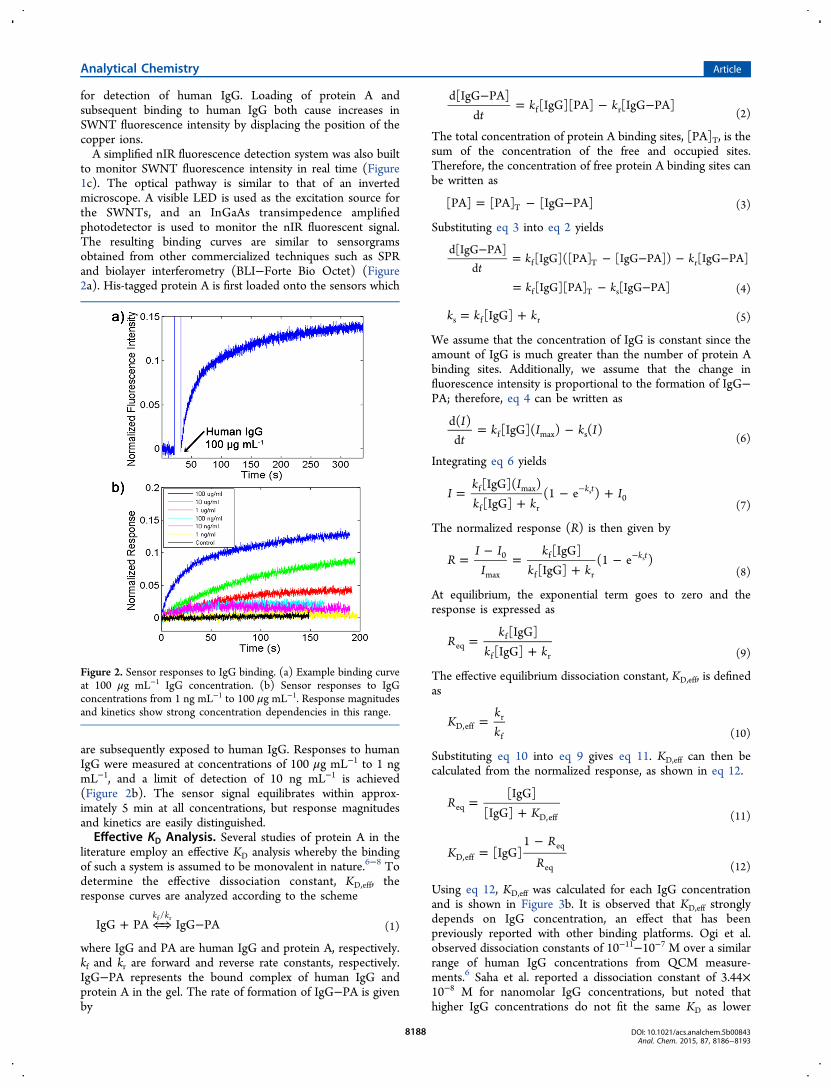
to monitor SWNT fluorescence intensity in real time (Figure1c). The optical pathway is similar to that of an invertedmicroscope. A visible LED is used as the excitation source forthe SWNTs, and an InGaAs transimpedence amplifiedphotodetector is used to monitor the nIR fluorescent signal.The resulting binding curves are similar to sensorgramsobtained from other commercialized techniques such as SPRand biolayer interferometry (BLI−Forte Bio Octet) (Figure2a). His-tagged protein A is first loaded onto the sensors which
are subsequently exposed to human IgG. Responses to humanIgG were measured at concentrations of 100 μg mL−1 to 1 ngmL−1, and a limit of detection of 10 ng mL−1 is achieved(Figure 2b). The sensor signal equilibrates within approx-imately 5 min at all concentrations, but response magnitudesand kinetics are easily distinguished.Effective KD Analysis. Several studies of protein A in the
literature employ an effective KD analysis whereby the bindingof such a system is assumed to be monovalent in nature.6−8 Todetermine the effective dissociation constant, KD,eff, theresponse curves are analyzed according to the scheme
+ ⇐⇒ −IgG PA IgG PAk k/f r
(1)
where IgG and PA are human IgG and protein A, respectively.kf and kr are forward and reverse rate constants, respectively.IgG−PA represents the bound complex of human IgG andprotein A in the gel. The rate of formation of IgG−PA is givenby
−= − −
tk k
d[IgG PA]d
[IgG][PA] [IgG PA]f r (2)
The total concentration of protein A binding sites, [PA]T, is thesum of the concentration of the free and occupied sites.Therefore, the concentration of free protein A binding sites canbe written as
= − −[PA] [PA] [IgG PA]T (3)
Substituting eq 3 into eq 2 yields
−= − − − −
= − −t
k k
k k
d[IgG PA]d
[IgG]([PA] [IgG PA]) [IgG PA]
[IgG][PA] [IgG PA]
f T r
f T s (4)
= +k k k[IgG]s f r (5)
We assume that the concentration of IgG is constant since theamount of IgG is much greater than the number of protein Abinding sites. Additionally, we assume that the change influorescence intensity is proportional to the formation of IgG−PA; therefore, eq 4 can be written as
= −It
k I k Id( )
d[IgG]( ) ( )f max s (6)
Integrating eq 6 yields
=+
− +−Ik Ik k
I[IgG]( )[IgG]
(1 e )k tf max
f r0
s
(7)
The normalized response (R) is then given by
=−
=+
− −RI I
Ik
k k[IgG]
[IgG](1 e )k t0
max
f
f r
s
(8)
At equilibrium, the exponential term goes to zero and theresponse is expressed as
=+
Rk
k k[IgG]
[IgG]eqf
f r (9)
The effective equilibrium dissociation constant, KD,eff, is definedas
=KkkD,eff
r
f (10)
Substituting eq 10 into eq 9 gives eq 11. KD,eff can then becalculated from the normalized response, as shown in eq 12.
=+
RK
[IgG][IgG]eq
D,eff (11)
=−
KR
R[IgG]
1D,eff
eq
eq (12)
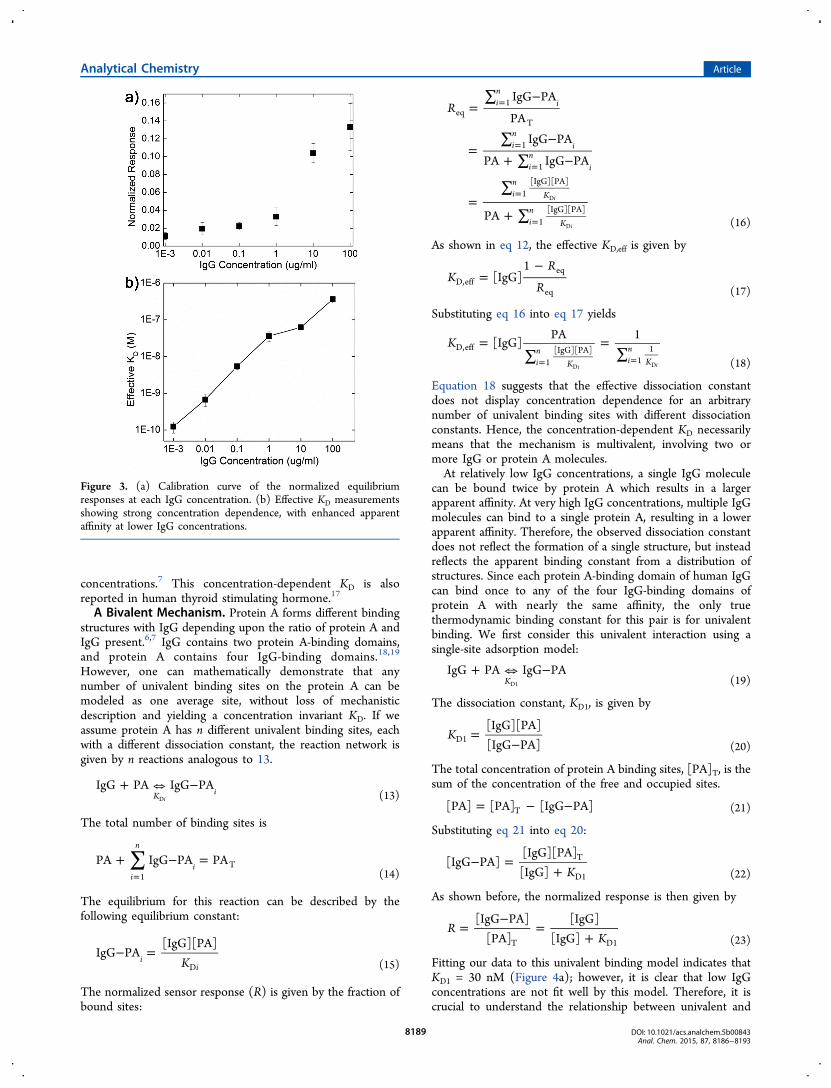
Using eq 12, KD,eff was calculated for each IgG concentrationand is shown in Figure 3b. It is observed that KD,eff stronglydepends on IgG concentration, an effect that has beenpreviously reported with other binding platforms. Ogi et al.observed dissociation constants of 10−11−10−7 M over a similarrange of human IgG concentrations from QCM measure-ments.6 Saha et al. reported a dissociation constant of 3.44×10⁻⁸ M for nanomolar IgG concentrations, but noted thathigher IgG concentrations do not fit the same KD as lower
Figure 2. Sensor responses to IgG binding. (a) Example binding curveat 100 μg mL−1 IgG concentration. (b) Sensor responses to IgGconcentrations from 1 ng mL−1 to 100 μg mL−1. Response magnitudesand kinetics show strong concentration dependencies in this range.
Analytical Chemistry Article
DOI: 10.1021/acs.analchem.5b00843Anal. Chem. 2015, 87, 8186−8193
8188
concentrations.7 This concentration-dependent KD is alsoreported in human thyroid stimulating hormone.17
A Bivalent Mechanism. Protein A forms different bindingstructures with IgG depending upon the ratio of protein A andIgG present.6,7 IgG contains two protein A-binding domains,and protein A contains four IgG-binding domains.18,19
However, one can mathematically demonstrate that anynumber of univalent binding sites on the protein A can bemodeled as one average site, without loss of mechanisticdescription and yielding a concentration invariant KD. If weassume protein A has n different univalent binding sites, eachwith a different dissociation constant, the reaction network isgiven by n reactions analogous to 13.
⇔+ −IgG PA IgG PAK i
iD (13)
The total number of binding sites is
∑+ − ==
PA IgG PA PAi
n
i1
T(14)
The equilibrium for this reaction can be described by thefollowing equilibrium constant:
− =K
IgG PA[IgG][PA]
iiD (15)
The normalized sensor response (R) is given by the fraction ofbound sites:
=∑ −
=∑ −+ ∑ −
=∑
+ ∑
=
=
=
=
=
RIgG PA
PAIgG PA
PA IgG PA
PA
in
i
in
i
in
i
in
K
in
K
eq1
T
1
1
1[IgG][PA]
1[IgG][PA]
i
i
D
D (16)
As shown in eq 12, the effective KD,eff is given by
=−
KR
R[IgG]
1D,eff
eq
eq (17)
Substituting eq 16 into eq 17 yields
=∑
=∑
= =
K [IgG]PA 1
in
K in
KD,eff
1[IgG][PA]
11
i iD D (18)
Equation 18 suggests that the effective dissociation constantdoes not display concentration dependence for an arbitrarynumber of univalent binding sites with different dissociationconstants. Hence, the concentration-dependent KD necessarilymeans that the mechanism is multivalent, involving two ormore IgG or protein A molecules.At relatively low IgG concentrations, a single IgG molecule
can be bound twice by protein A which results in a largerapparent affinity. At very high IgG concentrations, multiple IgGmolecules can bind to a single protein A, resulting in a lowerapparent affinity. Therefore, the observed dissociation constantdoes not reflect the formation of a single structure, but insteadreflects the apparent binding constant from a distribution ofstructures. Since each protein A-binding domain of human IgGcan bind once to any of the four IgG-binding domains ofprotein A with nearly the same affinity, the only truethermodynamic binding constant for this pair is for univalentbinding. We first consider this univalent interaction using asingle-site adsorption model:
⇔+ −IgG PA IgG PAKD1 (19)
The dissociation constant, KD1, is given by
=−
K[IgG][PA][IgG PA]D1
(20)
The total concentration of protein A binding sites, [PA]T, is thesum of the concentration of the free and occupied sites.
= − −[PA] [PA] [IgG PA]T (21)
Substituting eq 21 into eq 20:
− =+ K
[IgG PA][IgG][PA]
[IgG]T
D1 (22)
As shown before, the normalized response is then given by
=−
=+
RK
[IgG PA][PA]
[IgG][IgG]T D1 (23)
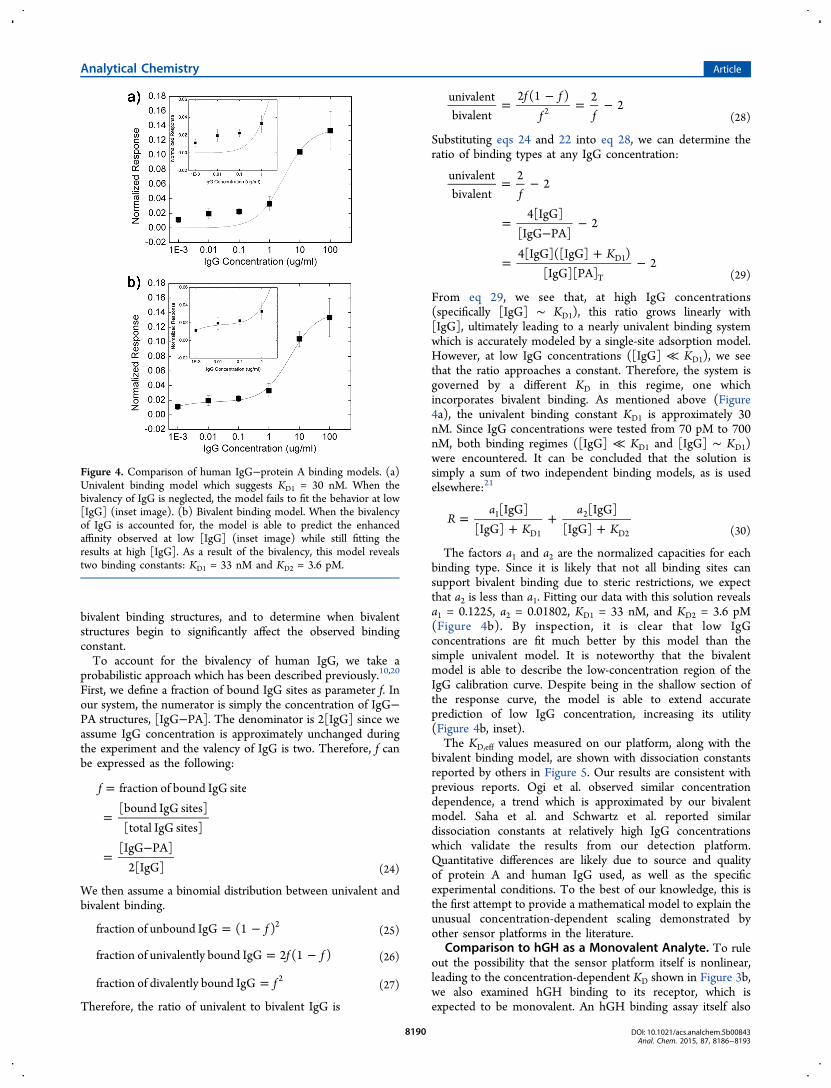
Fitting our data to this univalent binding model indicates thatKD1 = 30 nM (Figure 4a); however, it is clear that low IgGconcentrations are not fit well by this model. Therefore, it iscrucial to understand the relationship between univalent and
Figure 3. (a) Calibration curve of the normalized equilibriumresponses at each IgG concentration. (b) Effective KD measurementsshowing strong concentration dependence, with enhanced apparentaffinity at lower IgG concentrations.
Analytical Chemistry Article
DOI: 10.1021/acs.analchem.5b00843Anal. Chem. 2015, 87, 8186−8193
8189
bivalent binding structures, and to determine when bivalentstructures begin to significantly affect the observed bindingconstant.To account for the bivalency of human IgG, we take a
probabilistic approach which has been described previously.10,20
First, we define a fraction of bound IgG sites as parameter f. Inour system, the numerator is simply the concentration of IgG−PA structures, [IgG−PA]. The denominator is 2[IgG] since weassume IgG concentration is approximately unchanged duringthe experiment and the valency of IgG is two. Therefore, f canbe expressed as the following:
=
=
=−
f fraction of bound IgG site[bound IgG sites][total IgG sites]
[IgG PA]2[IgG] (24)
We then assume a binomial distribution between univalent andbivalent binding.
= − ffraction of unbound IgG (1 )2(25)
= −f ffraction of univalently bound IgG 2 (1 ) (26)
= ffraction of divalently bound IgG 2(27)
Therefore, the ratio of univalent to bivalent IgG is
=−
= −f f
f funivalentbivalent
2 (1 ) 222
(28)
Substituting eqs 24 and 22 into eq 28, we can determine theratio of binding types at any IgG concentration:
= −
=−
−
=+
−
f
K
univalentbivalent
22
4[IgG][IgG PA]
2
4[IgG]([IgG] )[IgG][PA]
2D1
T (29)
From eq 29, we see that, at high IgG concentrations(specifically [IgG] ∼ KD1), this ratio grows linearly with[IgG], ultimately leading to a nearly univalent binding systemwhich is accurately modeled by a single-site adsorption model.However, at low IgG concentrations ([IgG] ≪ KD1), we seethat the ratio approaches a constant. Therefore, the system isgoverned by a different KD in this regime, one whichincorporates bivalent binding. As mentioned above (Figure4a), the univalent binding constant KD1 is approximately 30nM. Since IgG concentrations were tested from 70 pM to 700nM, both binding regimes ([IgG] ≪ KD1 and [IgG] ∼ KD1)were encountered. It can be concluded that the solution issimply a sum of two independent binding models, as is usedelsewhere:21
=+
++
Ra
Ka
K[IgG]
[IgG][IgG]
[IgG]1
D1
2
D2 (30)
The factors a1 and a2 are the normalized capacities for eachbinding type. Since it is likely that not all binding sites cansupport bivalent binding due to steric restrictions, we expectthat a2 is less than a1. Fitting our data with this solution revealsa1 = 0.1225, a2 = 0.01802, KD1 = 33 nM, and KD2 = 3.6 pM(Figure 4b). By inspection, it is clear that low IgGconcentrations are fit much better by this model than thesimple univalent model. It is noteworthy that the bivalentmodel is able to describe the low-concentration region of theIgG calibration curve. Despite being in the shallow section ofthe response curve, the model is able to extend accurateprediction of low IgG concentration, increasing its utility(Figure 4b, inset).The KD,eff values measured on our platform, along with the
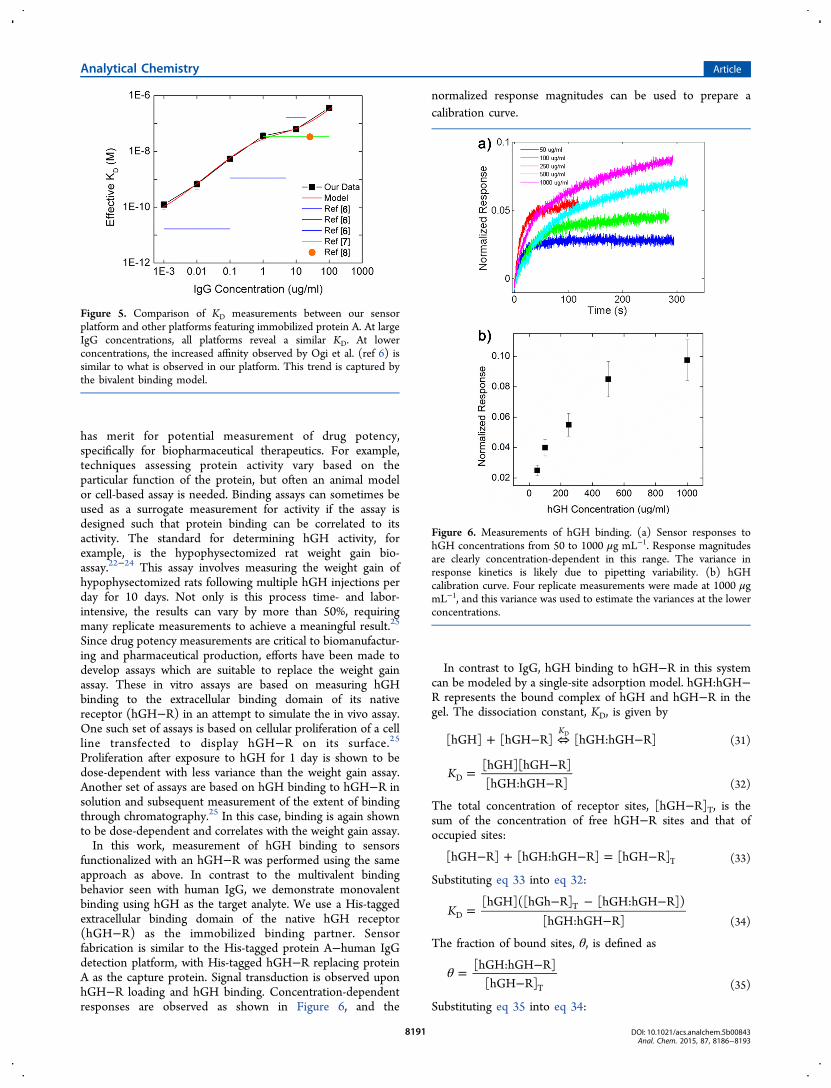
bivalent binding model, are shown with dissociation constantsreported by others in Figure 5. Our results are consistent withprevious reports. Ogi et al. observed similar concentrationdependence, a trend which is approximated by our bivalentmodel. Saha et al. and Schwartz et al. reported similardissociation constants at relatively high IgG concentrationswhich validate the results from our detection platform.Quantitative differences are likely due to source and qualityof protein A and human IgG used, as well as the specificexperimental conditions. To the best of our knowledge, this isthe first attempt to provide a mathematical model to explain theunusual concentration-dependent scaling demonstrated byother sensor platforms in the literature.
Comparison to hGH as a Monovalent Analyte. To ruleout the possibility that the sensor platform itself is nonlinear,leading to the concentration-dependent KD shown in Figure 3b,we also examined hGH binding to its receptor, which isexpected to be monovalent. An hGH binding assay itself also
Figure 4. Comparison of human IgG−protein A binding models. (a)Univalent binding model which suggests KD1 = 30 nM. When thebivalency of IgG is neglected, the model fails to fit the behavior at low[IgG] (inset image). (b) Bivalent binding model. When the bivalencyof IgG is accounted for, the model is able to predict the enhancedaffinity observed at low [IgG] (inset image) while still fitting theresults at high [IgG]. As a result of the bivalency, this model revealstwo binding constants: KD1 = 33 nM and KD2 = 3.6 pM.
Analytical Chemistry Article
DOI: 10.1021/acs.analchem.5b00843Anal. Chem. 2015, 87, 8186−8193
8190
has merit for potential measurement of drug potency,specifically for biopharmaceutical therapeutics. For example,techniques assessing protein activity vary based on theparticular function of the protein, but often an animal modelor cell-based assay is needed. Binding assays can sometimes beused as a surrogate measurement for activity if the assay isdesigned such that protein binding can be correlated to itsactivity. The standard for determining hGH activity, forexample, is the hypophysectomized rat weight gain bio-assay.22−24 This assay involves measuring the weight gain ofhypophysectomized rats following multiple hGH injections perday for 10 days. Not only is this process time- and labor-intensive, the results can vary by more than 50%, requiringmany replicate measurements to achieve a meaningful result.25
Since drug potency measurements are critical to biomanufactur-ing and pharmaceutical production, efforts have been made todevelop assays which are suitable to replace the weight gainassay. These in vitro assays are based on measuring hGHbinding to the extracellular binding domain of its nativereceptor (hGH−R) in an attempt to simulate the in vivo assay.One such set of assays is based on cellular proliferation of a cellline transfected to display hGH−R on its surface.25
Proliferation after exposure to hGH for 1 day is shown to bedose-dependent with less variance than the weight gain assay.Another set of assays are based on hGH binding to hGH−R insolution and subsequent measurement of the extent of bindingthrough chromatography.25 In this case, binding is again shownto be dose-dependent and correlates with the weight gain assay.In this work, measurement of hGH binding to sensors
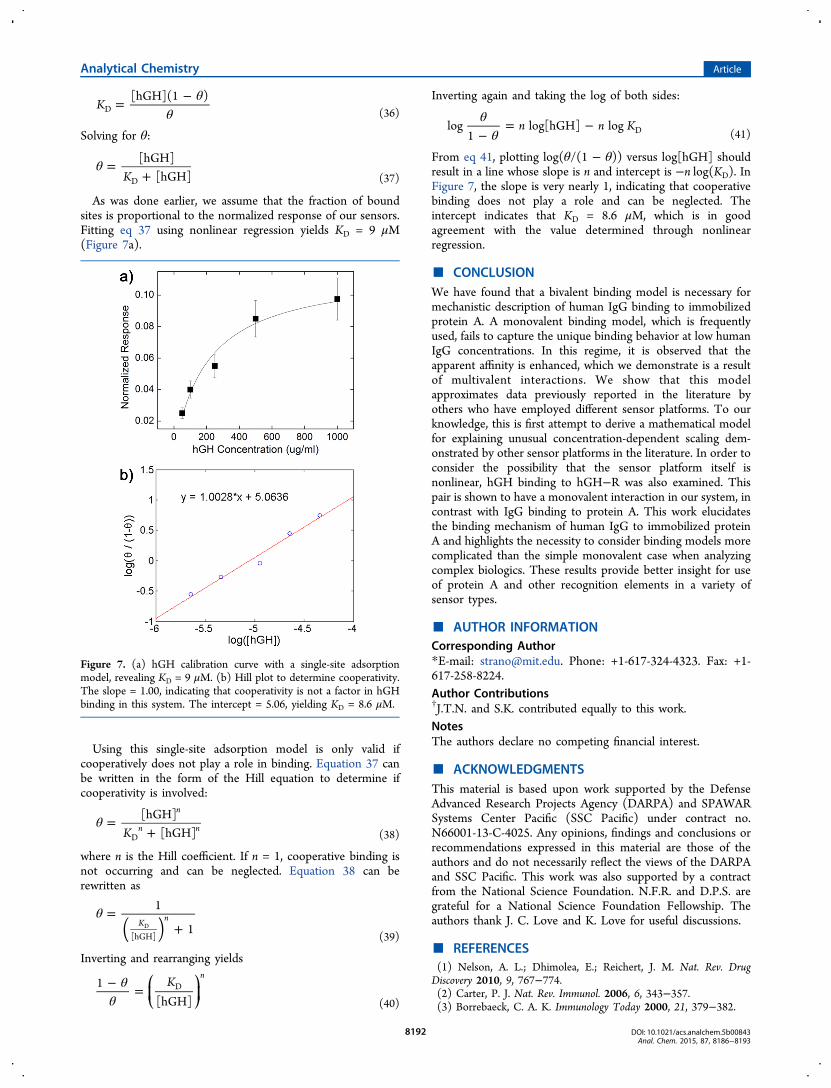
functionalized with an hGH−R was performed using the sameapproach as above. In contrast to the multivalent bindingbehavior seen with human IgG, we demonstrate monovalentbinding using hGH as the target analyte. We use a His-taggedextracellular binding domain of the native hGH receptor(hGH−R) as the immobilized binding partner. Sensorfabrication is similar to the His-tagged protein A−human IgGdetection platform, with His-tagged hGH−R replacing proteinA as the capture protein. Signal transduction is observed uponhGH−R loading and hGH binding. Concentration-dependentresponses are observed as shown in Figure 6, and the
normalized response magnitudes can be used to prepare acalibration curve.
In contrast to IgG, hGH binding to hGH−R in this systemcan be modeled by a single-site adsorption model. hGH:hGH−R represents the bound complex of hGH and hGH−R in thegel. The dissociation constant, KD, is given by
+ − ⇔ −[hGH] [hGH R] [hGH:hGH R]KD
(31)
= −−
K[hGH][hGH R][hGH:hGH R]D
(32)
The total concentration of receptor sites, [hGH−R]T, is thesum of the concentration of free hGH−R sites and that ofoccupied sites:
− + − = −[hGH R] [hGH:hGH R] [hGH R]T (33)
Substituting eq 33 into eq 32:
=− − −
−K
[hGH]([hGh R] [hGH:hGH R])[hGH:hGH R]D
T
(34)
The fraction of bound sites, θ, is defined as
θ = −−
[hGH:hGH R][hGH R]T (35)
Substituting eq 35 into eq 34:
Figure 5. Comparison of KD measurements between our sensorplatform and other platforms featuring immobilized protein A. At largeIgG concentrations, all platforms reveal a similar KD. At lowerconcentrations, the increased affinity observed by Ogi et al. (ref 6) issimilar to what is observed in our platform. This trend is captured bythe bivalent binding model.
Figure 6. Measurements of hGH binding. (a) Sensor responses tohGH concentrations from 50 to 1000 μg mL−1. Response magnitudesare clearly concentration-dependent in this range. The variance inresponse kinetics is likely due to pipetting variability. (b) hGHcalibration curve. Four replicate measurements were made at 1000 μgmL−1, and this variance was used to estimate the variances at the lowerconcentrations.
Analytical Chemistry Article
DOI: 10.1021/acs.analchem.5b00843Anal. Chem. 2015, 87, 8186−8193
8191
θθ
= −K
[hGH](1 )D (36)
Solving for θ:
θ =+K
[hGH][hGH]D (37)
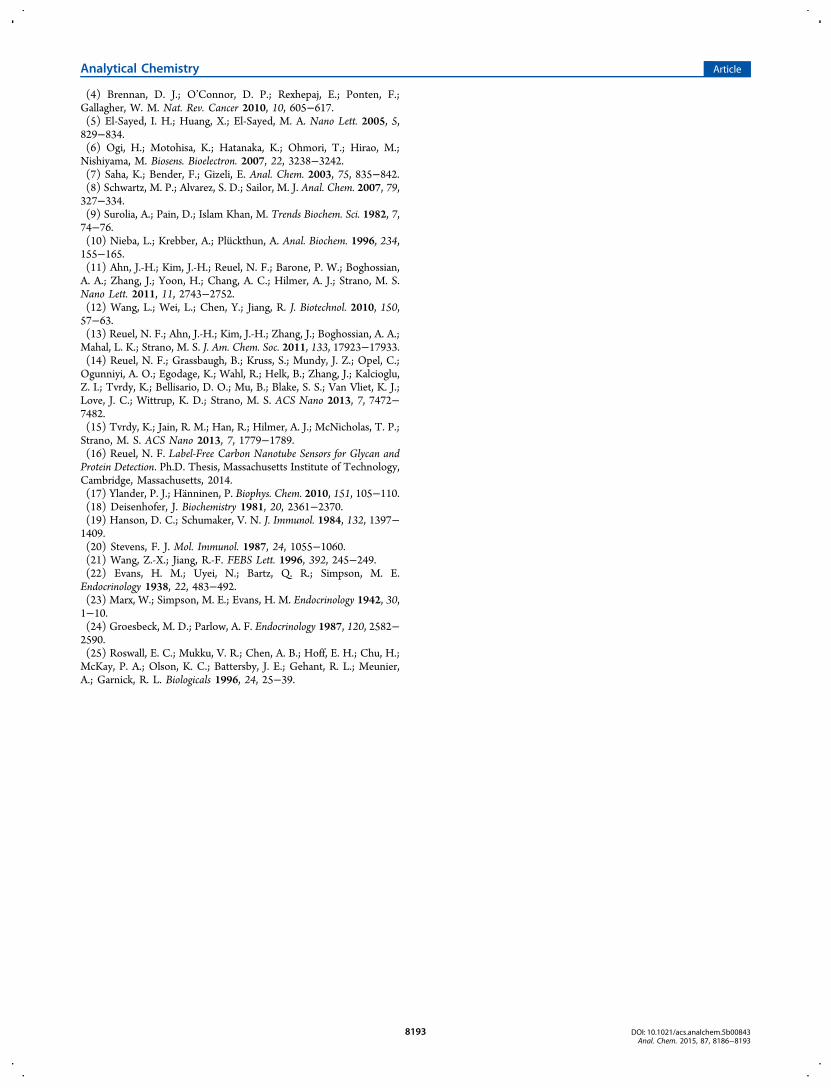
As was done earlier, we assume that the fraction of boundsites is proportional to the normalized response of our sensors.Fitting eq 37 using nonlinear regression yields KD = 9 μM(Figure 7a).
Using this single-site adsorption model is only valid ifcooperatively does not play a role in binding. Equation 37 canbe written in the form of the Hill equation to determine ifcooperativity is involved:
θ =+K
[hGH][hGH]
n
n nD (38)
where n is the Hill coefficient. If n = 1, cooperative binding isnot occurring and can be neglected. Equation 38 can berewritten as
θ =+( )
1
1K n
[hGH]D
(39)
Inverting and rearranging yields
θθ− =
⎛⎝⎜
⎞⎠⎟
K1[hGH]
nD
(40)
Inverting again and taking the log of both sides:
θθ−
= −n n Klog1
log[hGH] log D (41)
From eq 41, plotting log(θ/(1 − θ)) versus log[hGH] shouldresult in a line whose slope is n and intercept is −n log(KD). InFigure 7, the slope is very nearly 1, indicating that cooperativebinding does not play a role and can be neglected. Theintercept indicates that KD = 8.6 μM, which is in goodagreement with the value determined through nonlinearregression.
■ CONCLUSIONWe have found that a bivalent binding model is necessary formechanistic description of human IgG binding to immobilizedprotein A. A monovalent binding model, which is frequentlyused, fails to capture the unique binding behavior at low humanIgG concentrations. In this regime, it is observed that theapparent affinity is enhanced, which we demonstrate is a resultof multivalent interactions. We show that this modelapproximates data previously reported in the literature byothers who have employed different sensor platforms. To ourknowledge, this is first attempt to derive a mathematical modelfor explaining unusual concentration-dependent scaling dem-onstrated by other sensor platforms in the literature. In order toconsider the possibility that the sensor platform itself isnonlinear, hGH binding to hGH−R was also examined. Thispair is shown to have a monovalent interaction in our system, incontrast with IgG binding to protein A. This work elucidatesthe binding mechanism of human IgG to immobilized proteinA and highlights the necessity to consider binding models morecomplicated than the simple monovalent case when analyzingcomplex biologics. These results provide better insight for useof protein A and other recognition elements in a variety ofsensor types.
■ AUTHOR INFORMATIONCorresponding Author*E-mail: [email protected]. Phone: +1-617-324-4323. Fax: +1-617-258-8224.Author Contributions†J.T.N. and S.K. contributed equally to this work.NotesThe authors declare no competing financial interest.
■ ACKNOWLEDGMENTSThis material is based upon work supported by the DefenseAdvanced Research Projects Agency (DARPA) and SPAWARSystems Center Pacific (SSC Pacific) under contract no.N66001-13-C-4025. Any opinions, findings and conclusions orrecommendations expressed in this material are those of theauthors and do not necessarily reflect the views of the DARPAand SSC Pacific. This work was also supported by a contractfrom the National Science Foundation. N.F.R. and D.P.S. aregrateful for a National Science Foundation Fellowship. Theauthors thank J. C. Love and K. Love for useful discussions.
■ REFERENCES(1) Nelson, A. L.; Dhimolea, E.; Reichert, J. M. Nat. Rev. DrugDiscovery 2010, 9, 767−774.(2) Carter, P. J. Nat. Rev. Immunol. 2006, 6, 343−357.(3) Borrebaeck, C. A. K. Immunology Today 2000, 21, 379−382.
Figure 7. (a) hGH calibration curve with a single-site adsorptionmodel, revealing KD = 9 μM. (b) Hill plot to determine cooperativity.The slope = 1.00, indicating that cooperativity is not a factor in hGHbinding in this system. The intercept = 5.06, yielding KD = 8.6 μM.
Analytical Chemistry Article
DOI: 10.1021/acs.analchem.5b00843Anal. Chem. 2015, 87, 8186−8193
8192
(4) Brennan, D. J.; O’Connor, D. P.; Rexhepaj, E.; Ponten, F.;Gallagher, W. M. Nat. Rev. Cancer 2010, 10, 605−617.(5) El-Sayed, I. H.; Huang, X.; El-Sayed, M. A. Nano Lett. 2005, 5,829−834.(6) Ogi, H.; Motohisa, K.; Hatanaka, K.; Ohmori, T.; Hirao, M.;Nishiyama, M. Biosens. Bioelectron. 2007, 22, 3238−3242.(7) Saha, K.; Bender, F.; Gizeli, E. Anal. Chem. 2003, 75, 835−842.(8) Schwartz, M. P.; Alvarez, S. D.; Sailor, M. J. Anal. Chem. 2007, 79,327−334.(9) Surolia, A.; Pain, D.; Islam Khan, M. Trends Biochem. Sci. 1982, 7,74−76.(10) Nieba, L.; Krebber, A.; Pluckthun, A. Anal. Biochem. 1996, 234,155−165.(11) Ahn, J.-H.; Kim, J.-H.; Reuel, N. F.; Barone, P. W.; Boghossian,A. A.; Zhang, J.; Yoon, H.; Chang, A. C.; Hilmer, A. J.; Strano, M. S.Nano Lett. 2011, 11, 2743−2752.(12) Wang, L.; Wei, L.; Chen, Y.; Jiang, R. J. Biotechnol. 2010, 150,57−63.(13) Reuel, N. F.; Ahn, J.-H.; Kim, J.-H.; Zhang, J.; Boghossian, A. A.;Mahal, L. K.; Strano, M. S. J. Am. Chem. Soc. 2011, 133, 17923−17933.(14) Reuel, N. F.; Grassbaugh, B.; Kruss, S.; Mundy, J. Z.; Opel, C.;Ogunniyi, A. O.; Egodage, K.; Wahl, R.; Helk, B.; Zhang, J.; Kalcioglu,Z. I.; Tvrdy, K.; Bellisario, D. O.; Mu, B.; Blake, S. S.; Van Vliet, K. J.;Love, J. C.; Wittrup, K. D.; Strano, M. S. ACS Nano 2013, 7, 7472−7482.(15) Tvrdy, K.; Jain, R. M.; Han, R.; Hilmer, A. J.; McNicholas, T. P.;Strano, M. S. ACS Nano 2013, 7, 1779−1789.(16) Reuel, N. F. Label-Free Carbon Nanotube Sensors for Glycan andProtein Detection. Ph.D. Thesis, Massachusetts Institute of Technology,Cambridge, Massachusetts, 2014.(17) Ylander, P. J.; Hanninen, P. Biophys. Chem. 2010, 151, 105−110.(18) Deisenhofer, J. Biochemistry 1981, 20, 2361−2370.(19) Hanson, D. C.; Schumaker, V. N. J. Immunol. 1984, 132, 1397−1409.(20) Stevens, F. J. Mol. Immunol. 1987, 24, 1055−1060.(21) Wang, Z.-X.; Jiang, R.-F. FEBS Lett. 1996, 392, 245−249.(22) Evans, H. M.; Uyei, N.; Bartz, Q. R.; Simpson, M. E.Endocrinology 1938, 22, 483−492.(23) Marx, W.; Simpson, M. E.; Evans, H. M. Endocrinology 1942, 30,1−10.(24) Groesbeck, M. D.; Parlow, A. F. Endocrinology 1987, 120, 2582−2590.(25) Roswall, E. C.; Mukku, V. R.; Chen, A. B.; Hoff, E. H.; Chu, H.;McKay, P. A.; Olson, K. C.; Battersby, J. E.; Gehant, R. L.; Meunier,A.; Garnick, R. L. Biologicals 1996, 24, 25−39.
Analytical Chemistry Article
DOI: 10.1021/acs.analchem.5b00843Anal. Chem. 2015, 87, 8186−8193
8193