Embed Size (px)
Citation preview

Yale UniversityEliScholar – A Digital Platform for Scholarly Publishing at Yale
Yale Medicine Thesis Digital Library School of Medicine
January 2018
Mechanisms Of Decreased Brainstem Arousal InLimbic Seizures: In Vivo Whole-Cell RecordingsJohn Paul Andrews
Follow this and additional works at: https://elischolar.library.yale.edu/ymtdl
This Open Access Thesis is brought to you for free and open access by the School of Medicine at EliScholar – A Digital Platform for ScholarlyPublishing at Yale. It has been accepted for inclusion in Yale Medicine Thesis Digital Library by an authorized administrator of EliScholar – A DigitalPlatform for Scholarly Publishing at Yale. For more information, please contact [email protected].
Recommended CitationAndrews, John Paul, "Mechanisms Of Decreased Brainstem Arousal In Limbic Seizures: In Vivo Whole-Cell Recordings" (2018). YaleMedicine Thesis Digital Library. 3371.https://elischolar.library.yale.edu/ymtdl/3371

Mechanisms of decreased brainstem arousal in limbic seizures:
in vivo whole-cell recordings
A Thesis Submitted to the Yale University School of Medicine
in Partial Fulfillment of the Requirements for the Degree of Doctor of Medicine
by
John Paul Andrews
2018

Andrews JP, et al 2
Abstract
Seizures are commonly regarded as disorders of neuronal hyperactivity, but evidence shows that
temporal lobe seizures also cause reduced activity in subcortical arousal nuclei, including
cholinergic neurons in the pedunculopontine tegmental nucleus (PPT), a key node of the reticular
activating system. The synaptic mechanisms underlying the reduced ictal activity of cholinergic
neurons in the PPT are unknown. Whole-cell in vivo recordings were made from PPT neurons in
head-fixed rats to distinguish active inhibition from withdrawal of excitatory input as the driver
of reduced ictal neuronal firing. A subset of PPT neurons exhibited reduced firing and
hyperpolarization during seizures and stained positive for choline acetyltransferase. These PPT
cholinergic neurons also showed increased input resistance, reduced membrane potential
variance and fewer EPSP-like events during seizures. These data weigh against active ictal
inhibition and support withdrawal of excitatory input as the dominant mechanism of decreased
activity of cholinergic neurons in the PPT.

Andrews JP, et al 3
Acknowledgements
The author thanks his collaborators, without whom this work would not have been
possible, including Zongwei Yue, Jun Hwan Ryu, Garrett Neske, and David McCormick. Many
thanks to Quentin Perrenoud and Jessica Cardin for helpful suggestions on whole-cell in vivo
recordings.
A special thanks and unquantifiable gratitude to my mentor, Hal Blumenfeld, for
everything—including jumping up and down with me in the lab after I broke into my first
neuron.
This work was supported by NIH R01 NS066974, R01 NS096088 (H.B.) and by an
HHMI-CURE fellowship (J.A.).

Andrews JP, et al 4
Table of Contents
2 – Abstract
3 - Acknowledgements
5 – Introduction
7 – Statement of Purpose & Hypothesis
7 – Experimental Methods 7 - Animal Preparation and Surgery
9 - LFP and MUA Electrophysiology
10 - Whole-cell recordings
16 - Histology
16 - Data Analysis
17 - Neuronal spiking rate analysis
17 - Vm hyperpolarization during seizures vs. baseline
18 - Input resistance (Rin)
19 - Analysis of EPSP-like events and voltage histograms
20 – Results 20 - Reduced-firing, hyperpolarizing neurons of the PPT
21 - Figure 1
22 - Figure 2
24 - Figure 3
25 - Figure 4
26 - Figure 5
27 - Input resistance and voltage fluctuation during seizures
28 - Figure 6
31 – Discussion
37 – References

Andrews JP, et al 5
Introduction
The mechanisms by which subcortical activating networks regulate states of arousal have long
been a subject of debate and experimentation, with evidence pointing to the pedunculopontine
tegmental nucleus (PPT) as a crucial node in this far-reaching system 1, 2, 3, 4. Historically, the
study of pathologic function to delineate normal physiology has been the rule, rather than the
exception, and recent work has shown that PPT neuronal activity is decreased during focal
temporal lobe seizures that impair level of cortical arousal 5. The afferent signaling regulating
PPT activity and the mechanisms by which PPT neurons integrate signaling has yet to be clearly
elucidated 4.
On a brain-wide scale, prior work has dissected out areas of inhibitory and excitatory
activity during seizures 6, 7, 8, 9. On a cellular level, extracellular recordings have revealed that
neurons of specific nuclei exhibit reduced neuronal firing during seizures 5, 10. In the present
study, we delve into the intracellular membrane potential (Vm) level using in vivo whole-cell
recordings from areas deep in the pedunculopontine brainstem in order to elucidate the synaptic
mechanisms underlying ictal changes in neuronal activity of the PPT.
A subset of cholinergic PPT neurons, identified previously5 using extracellular recording
techniques, exhibit reduced firing during focal limbic seizures. How limbic seizures lead to
reduced firing of ChAT-positive neurons in the PPT is unknown. Prior studies suggest that the
activity of these neurons is likely modified by contributions of both excitatory and inhibitory
input 11, 12, 13, however, the afferent synaptic changes resulting in decreased firing can be
conceptually dichotomized into either an increase in inhibitory input, or a withdrawal of baseline
excitatory input.

Andrews JP, et al 6
Tight-seal whole-cell intracellular recording (WCR) is a powerful tool for investigating
membrane properties and synaptic input on individual neurons that has expanded from in vitro
and slice preparations to the realm of in vivo studies 14, 15. The targeting of deep brain structures
and brainstem nuclei has been limited by technical complications of their access, with prior
reports removing large sections of brain tissue (e.g. cerebellectomy) in order to patch brainstem
neurons 16, 17. The network of brain circuitry involved in seizures likely extends far beyond areas
of canonical seizure activity 5, 9, 10, 18, thus techniques such as slice preparations or in vivo studies
that involve removal of large swaths of brain are less likely to produce meaningful data
regarding distant seizure networks. In addition, the PPT receives afferent input from many
different areas of the brain and the functional contribution of each is not well known 4, 19, 20, 21.
In the present study, a minimally invasive technique was used to access deep brainstem
nuclei of the rat midbrain tegmentum, with negligible disturbance of brain architecture. In brief,
borosilicate patch pipettes were fabricated with a 9-10mm taper and passed through ~200-300µm
diameter craniotomies to the area of the pedunculopontine tegmental nucleus (PPT). Using this
technique, we attained stable, in vivo whole-cell recordings from neurons in the area of the PPT
while triggering focal limbic seizures.
The contributions of excitatory versus inhibitory input as regulators of neuronal activity
are integral to answering questions regarding mechanisms by which neurons process information
11, 12, 22, 23. We identified a subset of reduced-firing hyperpolarizing (RfHp) neurons in the PPT,
putatively cholinergic by histology. In addition to the RfHP phenotype, these PPT neurons
exhibit a rise of input resistance during seizures as well as a reduction in ictal membrane
potential variance (σ2) and reduced frequency of EPSP-like events. Such characteristics could be

Andrews JP, et al 7
explained by a mechanism of reduced excitatory synaptic input on cholinergic neurons in the
PPT during seizures.
Statement of Purpose & Hypothesis
The purpose of this work is to describe the synaptic mechanisms underlying the reduced ictal
activity of cholinergic neurons in the PPT during focal limbic seizures. The following
experiments were performed with the hypothesis is that measures of membrane potential, input
resistance and EPSP-like activity will show different patterns ictally compared to baseline,
pointing to either active inhibition or a withdrawal of excitatory input as the primary mechanism
of reduced neuronal firing rates.
Experimental Methods
All experiments were performed by John Andrews. Zongwei Yue assisted John Andrews with
histology and spike-sorting analyses. Matlab data analysis was performed in collaboration with
Jun Hwan Ryu. Garrett Neske provided helpful experimental technique advice regarding whole-
cell recordings as well as providing protocols for making intracellular solutions.
Animal Preparation and Surgery
All procedures were conducted in compliance with approved institutional animal care and use
protocols. A total of 54 female Sprague Dawley rats (Charles River Laboratories) age 6 – 10
weeks, weighing 180 - 275g were used in these experiments. All surgeries were performed under
deep anesthesia using a ketamine (90 mg/kg) and xylazine (15 mg/kg) mixture. A summary of
the technical aspects of these initial surgeries under deep anesthesia are as follows. The animal
was weighed, scalp was shaved, and head was pinned into a stereotactic frame with dual

Andrews JP, et al 8
microelectrode manipulator arms (Kopf Instruments, CA). Scalp was incised and retracted
bilaterally to expose underlying tissue and periosteum. Tissue and periosteum were subsequently
removed using blunt dissection to expose the dorsum of the skull, including the bregma and
lambda sutures. Stereotactic coordinates of these sutures were recorded and used to mark
locations for craniotomies over the right lateral orbital frontal cortex (LO), hippocampi (Hc)
bilaterally, and bilateral micro craniotomies over the PPT. Stereotactic coordinates are detailed
below. Initial craniotomies were made at all locations and dura was left intact to protect
underlying brain as long as possible. Craniotomies over LO and Hc were made with a diameter
of roughly 1.5-2mm. Electrodes were inserted rostrally to caudally, as such the first to be
inserted was the 3-4MΩ tungsten (UEWMGGSEDNNM, FHC) electrode in the LO. Dura,
arachnoid and pia were removed immediately prior to electrode insertion using tungsten needles
of 1µm tip diameter.
Following initial surgery for electrode implantation, a low-dose ketamine (40 mg/kg) and
xylazine (7 mg/kg) mixture was used to produce a state of “light” ketamine/xylazine anesthesia
in which slow waves occur less than approximately once per 10 s, but animals remain
unresponsive to toe pinch as described previously, prior to induction of seizures in our acute
seizure model5, 9.Stereotactic coordinates of brain structures and nuclei were calculated based on
Paxinos and Watson (1998) and were measured in millimeters relative to bregma. Following
acute experiments, animals were sacrificed with Euthasol (Virbac). Brains were resected for
histological analysis and to verify electrode locations.
LFP and MUA Electrophysiology

Andrews JP, et al 9
Local field potential (LFP) and multiunit activity (MUA) from lateral orbitofrontal cortex (Ctx
LFP & Ctx MUA), as well as LFP from hippocampi (Hc) were acquired and amplified as
previously described5, 10. Briefly, a unipolar, 3-4MΩ tungsten (UEWMGGSEDNNM, FHC)
electrode was placed in the lateral orbitofrontal cortex (AP +4.2; ML 2.2; SI -4.0) (Paxinos and
Watson, 1998). Twisted bipolar, stainless steel recording/stimulating electrodes (E363-2-2TW-
SPC, PlasticsOne) were placed bilaterally in hippocampi (Hc) at anteroposterior (AP) -3.8;
mediolateral (ML) ±2.5; superior-inferior (SI) -2.5mm (Paxinos and Watson, 1998). Seizures
were induced as described previously5, 9 in either the right or left Hc, using a 2s, 60Hz square
biphasic wave (1ms per phase) Hc stimulus and current amplitude titrated to produce focal
hippocampal seizure activity based on polyspike discharges without propagation to frontal
cortex. LFP and MUA recordings were amplified using a microelectrode AC amplifier (model
1800 A-M Systems) and broadband filtered from 0.1Hz to 10 kHz (x1000 gain). A model 3363
Krohn-Hite filter was used to low-pass filter LFP at 0.1 - 100Hz and high pass filter MUA at
400Hz – 10kHz5, 8, 9. A Micro1401 (CED) A/D converter was used with a sampling rate of 1,000
Hz for Ctx LFP, 25,000 Hz for Ctx-MUA, 1,000 Hz for Hc LFP, and 25,000 Hz for whole-cell
recordings of PPT neurons (below). Continuous recordings were made using Spike2 v8.06
(CED) software.
Whole-cell recordings
For whole-cell recordings from PPT we modified procedures used previously for WCR from
more superficial targets (Neske et al., 2015). Care was taken to make craniotomies over the PPT
as small as possible to enable the skull and dura to stabilize the brain, but just large enough to
allow the micropipettes to pass. The PPT was targeted at coordinates (relative to bregma) AP -

Andrews JP, et al 10
7.8; ML ±1.8; SI 7.0 mm. The skull was thinned in a ~1mm diameter depression at the
craniotomy target using a hand drill and tungsten microneedles were then used to carefully
dissect a 200-300 µm craniotomy from the thinned bone under a microscope to expose the
underlying dura. A saline bath was then constructed around the craniotomy using dental cement,
and the dura and pia were carefully removed using tungsten needles of 1µm tip diameter (10130-
05, Fine Science Tools) prior to micropipette insertion. The saline bath was made around the
craniotomy to serve as a reservoir communicating with the cerebrospinal fluid in which to put
the Ag-Cl reference electrode.
A potassium-gluconate-based intracellular solution was used for micropipettes with a
composition consisting of 130mM K-gluconate, 0.2mM EGTA, 4mM KCl, 2mM NaCl, 10mM
HEPES, 4mM ATP-Mg, 0.3mM GTP-Na, 14mM phosphocreatine-2K, 0.5% Biocytin and
titrated to a pH of 7.25 and 290 mOsm (Neske et al., 2015).
One aspect limiting the depth of whole-cell recordings is reproducible creation of long,
narrow glass pipets with sufficiently low resistance. This problem was solved by using an extra-
wide, 2.5 x 4.5mm filament in a P-1000 micropipette puller (Sutter Instruments) and creating a
multi-line program with 1 high velocity line followed by 3 low velocity lines while keeping pull,
heat, time and pressure settings constant. Borosilicate glass (1B150F-4, World Precision
instruments) of outer diameter 1.5mm and inner diameter of 0.84mm was used to make pipets
with this multi-line program. Pipets were produced to have a long 9-10mm taper to allow
recordings deep below the cortical surface, and a resistance of 3.5 – 6 MΩ.
Even in the most optimal state of the pipette pulling program, only 1 in 4 to 1 in 5 pulls
resulted in pipettes meeting the standard of 3.5 – 6 MΩ. There may be variation of many MΩ
between pipettes pulled from different pulls, even run through the identical program. This is

Andrews JP, et al 11
because there is a very narrow window of parameters that will produce a pipette to have a 9-
10mm taper while retaining a low resistance tip. Visual inspection and microscopic measurement
of tip diameter can provide some information about the tip resistance, but experience has shown
this to be unreliable in the context of these very long, tapered pipets where a not insignificant
portion of the resistance may be from the long, tapered path. The best way to definitively test the
resistance of any pipette is to fill it with a solution, insert it into a bath and run current through
the pipette to the reference electrode. This pipette may not be withdrawn from a solution once it
is inserted because the contaminants on the surface film of the liquid will contaminate the tip.
Because the tip of a pipette must not be contaminated in order to form a giga-seal with a neuron,
one cannot test the resistance of any particular pipette before actually using it. If one were to try
every pipette during each experiment one would end up using 4-6x the intracellular solution as if
every pipette were usable. This testing every pipette at the time of the experiment is also hugely
time-intensive in the context of an experiment that takes ~16 hours at a time when things run
smoothly. Thus, the problem was addressed in the following manner.
When a glass capillary is pulled, it is pulled from both ends with the heat filament in the
middle, resulting in a pair of two pipettes for each pull, referred to from here on as “twins.”
Moreover, these twin pipettes saw the exact same parameters and experienced the same break to
result in their tips. Thus, the twin pipettes should have very similar resistances. This was
confirmed over many trials (data not shown). In light of this, when pulling pipettes the day prior
to an experiment, the pipettes were separated so that the pairs to which they belong is
identifiable. One pipette from each twin-pair was filled with saline, attached to the head stage
with the electrode, and lowered into a saline bath that also contained the reference electrode. A
current was run through the electrodes and a resistance of the pipette was calculated. This was

Andrews JP, et al 12
done for one of each twin-pair, so that approximations of the resistance of the other twin in the
pair were attained. Only the pipettes with twins whose resistances were within the specified
range were used on the day of the experiment. This greatly reduced the amount of intracellular
solution used during each experiment and increased the ratio of usable to non-usable pipettes at
the time of the experiment.
Regarding the technique of pipette insertion into the brain of an animal, the first pipette
lowered into the craniotomy down to the target region was used to create a micro-canal through
which subsequent pipettes might pass with less likelihood of damage/contamination of the tip.
This pathfinder pipette contained saline, was under 0 mbar intrapipette pressure and was only
lowered until 150 µm superficial to the target region—all of these changes were made in order to
minimize damage to surrounding tissue and the target region while making the micro-canal. The
pathfinder pipette was left in place for 25 minutes under no pressure to allow formation of the
micro-canal. To prevent contamination of subsequent recording pipette tips during descent into
the brain, 500mbar positive intrapipette pressure was maintained throughout the 30-50 µm/s
descent to target region. Once at the most ventral aspect of the PPT, pressure was lowered to 24-
28mbar and descent slowed to ~1 µm/s.
A thin rubber tubing system was custom made to connect to the space in the electrode
holding head-stage proximal to the glass pipet, such that pressure in the glass pipet could be
measured and controlled. This tubing had another end attached to an electric manometer
(EXTECH, item# 407910) as well as a three-way stopcock with an opening to which a syringe or
mouthpiece could be attached. In this way, air could be introduced into the closed system to
increase the intra-pipette pressure to protect the pipette tip, as well as carefully titrate the
pressure while searching for neurons.
Andrews JP, et al 13
Recordings were made using a Multiclamp 700B (Axon) amplifier and digitized at 25kHz
using a Micro1401 (CED) and Spike2 v8.06 (CED) software. The neuron-searching step of
acquiring WCR was undertaken in voltage-clamp mode, using 5mV 50Hz 10 ms voltage steps
with current response visualized in real-time both in Spike2 software and on an external
oscilloscope for blind-patching.
In search mode, the experimenter would watch the square current response (inversely
related to resistance) to the 5mV 50Hz 10 ms voltage steps on the oscilloscope, looking for
changes indicative of a pipette juxtaposed to a neuron. While in vitro patch clamping protocols
have described the visualization of this peri-neuron change as a sudden, sustained increase in
resistance (i.e. decrease in current response), neurons in vivo do not show this static signature.
The signature of being next to a neuron in vivo with a patch pipette is best described as a rapid,
flapping oscillation in current-response. One explanation for this flapping, or fluttering signal is
the heartbeat of the animal causing microscopic movements of these single neurons relative to
the more stable pipette and micromanipulator apparatus, with the neuron covering and then
uncovering the pipette tip in rapid sequence. In the experience of this experimenter, the best way
to proceed is to advance the micromanipulator an additional 1µm immediately after first
encountering this a neuron in this manner. If the signal stops, then it is likely the pipet tip was
not in optimal position to form a tight seal with the neuron, and searching may continue as long
as the intrapipette pressure (24-28mbar in search mode) was not released. If following this 1µm
advance, the flapping signal either enhances or continues as is, then within 5-10s the
experimenter should release the positive pressure (open stop-cock to air) and observe the
subsequent current response for evidence of forming a seal with the membrane. Evidence for a
seal forming are an immediate drop in current response such that the signal on the oscilloscope

Andrews JP, et al 14
drops to what appears as a thin, straight line, despite the 5mV voltage steps continuing. The
Axon MultiClamp 700B Commander software interface allows for the experimenter to calculate
real-time resistance from voltage steps for. Ideally, the resistance will rise to over 1 GΩ
immediately after releasing positive pressure. It is best if magnitude of resistance is learned to be
evaluated by sight-reading of the oscilloscope wave-form, so that calculations need not be made
on the fly. If the resistance rises substantially, but is still in the hundreds of MΩ immediately
after release of positive pressure, very gentle negative pressure should be applied through the
mouthpiece connected to the stop-cock tubing system (-8 to -13mbar). This may facilitate
formation of the giga seal. Another adjunct for seal-formation is clamping the pipette voltage to a
hyperpolarized potential (e.g. -60mV). The best seals form immediately, but viable seal may also
mature over the course of ~ 1 minute. In the experience of this experimenter a seal is unlikely to
form after several minutes of having not formed an adequate seal.
Once a seal is formed with the neuron, in order to rupture the patch of membrane
circumscribed by the tip of the pipette either brief oral suction, or a current pulse were applied. If
successful, whole-cell configuration was evidenced by a change in the current-response on the
oscilloscope from the flat, minimal response of a giga-seal to the sharp rise and exponential
decay indicative of having access to the interior of a neuron with the cell membrane acting as a
capacitor to produce such an RC charging curve. If neither of these break-in strategies were
successful in isolation, when applied at the same time they sometimes met with success.
As mentioned in the Results section, of 295 electrode passes, 36 neurons were recorded
from, a success rate of ~10%, and of these approximately half were recovered histologically. The
295 electrode passes include only pipettes with the appropriate resistance (3.5 – 6 MΩ, measured
upon lowering into the bath) and which were lowered into the craniotomy without adverse event.

Andrews JP, et al 15
The majority of failed passes occurred either while searching for neurons in the target region or
at the step of forming a gigaseal. Increases in pipette tip resistance of >20% while in search-
mode were interpreted as a clogged pipette tip and the pass was abandoned and pipette removed,
accounting for roughly 50% of failures. Most of the remaining 50% of failures were at the step of
forming a gigaseal, where a gigaseal did not fully form upon release of positive pressure and
application of gentle (~10-15mbar) suction by mouth, despite being preceded by the fast-
fluctuating tip-resistance profile characteristic of a neuron positioned at the tip of one’s pipette.
Other failures include forming a gigaseal and then failing during the brief suction pulses to attain
whole-cell configuration, or upon attaining an RC charging profile consistent with WCR, the
neuron would begin firing uncontrollably and die. In addition, there were several instances of
breaking into whole-cell configuration, but the RC charging curve demonstrated high initial
access resistance, which could not be remedied through further suction or manipulation. Initial
access resistance was measured in voltage clamp upon attaining whole-cell configuration. Cells
were discarded if initial access resistance was above 70 MΩ. Recordings were conducted in
current clamp mode soon after attaining WCR and the bridge was balanced in current clamp
mode periodically throughout recordings. If bridge balance rose above 70 MΩ during recordings,
intracellular data regarding resting potential changes and subthreshold fluctuations in membrane
potential during baseline vs. seizures were discarded.
After attaining a stable whole-cell recording from a neuron in PPT, focal hippocampal
seizures were induced using the protocol described above5, 9. Moment-to-moment input
resistance was measured in some neurons in current clamp using 20 - 30pA, 50 or 100ms
hyperpolarizing current steps at 5 or 10Hz before, during and after seizures. At the conclusion of
recordings, animals were euthanized and perfused for histology.

Andrews JP, et al 16
Histology
Brains were fixed with 4% paraformaldehyde and cut in 60µm slices for histology. Brains were
then stained for biocytin cy3-streptavidin construct and co-stained using an antibody to Choline-
acetyltransferase (ChAT) as previously described in detail5. A Zeiss LSM 710 Duo
NLO/multiphoton confocal microscope with a C-Apochromat 40x/63x/1.2 W Corr objective was
used for imaging.
Data Analysis
Data analysis was performed using Spike2 (CED, v5.20a), and in-house software written on
MATLAB (R2009a, Mathworks). Analysis epoch were defined as follows: 1. Baseline: 20–0 s
before stimulus; 2. Ictal: the first 20 s of hippocampal seizure activity (or the entire period of
seizure activity where indicated), based on large amplitude, polyspike activity in the
hippocampal LFP recordings; 3. Postictal: 0–20 s after seizure; 4. Recovery: 20 s following the
postictal period. Analyses were performed only on neurons identified by intracellular staining as
well as one RfHp neuron that was not histologically recovered. In addition, all included neurons
had RC charging curve compatible with transition to intracellular recordings, access resistance
<70 MΩ, exhibited reproducible action potentials, and stable resting potential. Note that one
RfHp and one non-RfHp cell were excluded from Vm, EPSP-like event, variance and Rin
analyses due to access resistance >70 MΩ. One non-RfHp neuron exhibited artifact from pulse-
subtraction (of current-steps for Rin measurement) and thus was also excluded from Vm, variance
and EPSP analyses requiring such subtraction.

Andrews JP, et al 17
Statistics were calculated using MATLAB, Excel and Graphpad Prism software.
Repeated-measures ANOVA and two-tailed student’s t-tests were used, paired where
appropriate, with cut-off for statistical significance of p < 0.05. Significance is corrected for
multiple comparisons where appropriate using the Holm-Bonferroni method.
Neuronal spiking rate analysis. Spike sorting on the WCR recordings was performed in Spike 2
using template-matching based on waveform shapes to identify single units. Raster plots of
neuronal firing were generated for each neuron, and then histograms of mean firing rate were
calculated across neurons in 1s non-overlapping bins for each epoch (Figures 2, S3).
Vm hyperpolarization during seizures vs. baseline. To calculate amplitude of membrane
potential hyperpolarization during seizures, membrane potentials in baseline and ictal epochs
were averaged in 3s bins after excluding the 20ms period surrounding each action potential (5ms
prior, 15ms following) and subtracting pulses from those neurons receiving them as described
below. The bin just prior to seizure stimulation (within the baseline period) was compared to the
bin of most negative membrane potential during the ictal period. The difference between the
baseline bin prior to seizure onset and the ictal bin with the most negative membrane potential is
reported as the amplitude of ictal hyperpolarization.
Input resistance (Rin). Input resistance was measured by delivering repeated hyperpolarizing
square current pulses and measuring the change in membrane potential for each step, as
resistance (R) is related to change in voltage (∆V) and current (∆I) through Ohm’s law R=∆V/∆I.
Square hyperpolarizing pulses were delivered at a constant frequency and amplitude during the

Andrews JP, et al 18
recording of each neuron, either at 5 or 10Hz (100ms or 50ms pulse duration) with amplitudes of
-30 or -50pA (Figure 6A). ∆V was calculated in Spike2 by taking the mean Vm during the last
25ms prior to each positive or negative step (when voltage had reached steady-state) and taking
the difference between mean Vm in all pairs of these 25ms epochs. Current steps overlapping
within 5ms prior to or 15ms following an action potential were discarded. Rin measurements
within individual neurons were compared from the 20s baseline epoch prior to seizure onset, to
those during the entirety of the ictal period, and the 20s recovery epoch beginning 20s following
cessation of hippocampal ictal activity, using a two-tailed t-test (Figure 6C, D). Time course
graphs of mean ictal changes in Rin were constructed using 3s bins of Rin data (Figure 6B).
Because one seizure in one RfHp neuron was significantly longer than all comparison seizures in
both RfHp and non-RfHp neurons with pulses, later bins from that seizure extending beyond
other ictal periods were not included in the graphical time course analysis, although all ictal
values were included for Rin analyses in 6C and 6D. Normalization to baseline Rin was carried
out by calculating the mean Rin for the 20s prior to seizure onset, and then dividing all Rin values
for the 3s bins by the mean baseline Rin.
Analysis of EPSP-like events and voltage histograms. Prior to analysis of EPSP-like events,
hyperpolarization and voltage histograms, we first removed the exponential RC pulses from
neurons in which repeated 5 Hz or 10 Hz current steps were applied to measure Rin. This was
done by obtaining an average RC pulse signal for each such neuron during the baseline and ictal
periods, and then subtracting these average pulses from the raw signal. This procedure
effectively and smoothly removed the pulse artifacts from all neurons except for one non-RfHp
neuron, which was therefore excluded from these analyses.

Andrews JP, et al 19
EPSP-like events were identified in MATLAB as positive fluctuations in membrane
potential of >0.4mV with a rise-time of <2ms 24, 25, excluding the time periods from 5 ms before
to 15 ms after any action potentials (Figure 6E). Mean amplitude and frequency of EPSP-like
events were then calculated for the baseline (20s before seizure onset) and full ictal periods.
To investigate the variance of voltage distributions before, during and after seizures, we
again excluded signal from a 20ms block around action potentials (5ms prior and 15ms after),
subtracted pulses from pulsed neurons and then high-pass filtered (>0.5Hz) the Vm signal for
these epochs to remove slow drift and select for higher frequency fluctuation. Variance was then
calculated from the resulting membrane potential values and the mean σ2 values were compared
using paired two-tailed t-tests. To graphically depict the distribution from which this membrane
potential variance was calculated, we created histograms of the voltage values during the
Baseline (0 to 20s before seizure onset), Ictal (entire ictal period) and Recovery (20 to 40 s after
seizure end) epochs. We fit the histogram with a Gaussian curve to center the histograms to the
mean of the fitted Gaussian. Each histogram was normalized by the maximum height and the
resulting histograms were summed across neurons, with equal weight. The final histogram was
normalized again by dividing the values by the maximum height (Figure 6F, G).
Results
Reduced-firing, hyperpolarizing neurons of the PPT
The present study aims to find the mechanism underlying a reduction in firing rate observed in
cholinergic neurons in the PPT 5. To this end, established techniques for in vivo patch clamping
were modified (see Methods) and combined with a rat model of focal limbic seizures that impair

Andrews JP, et al 20
level of cortical arousal 5, 8, 9, 26 so as to attain whole-cell recordings from neurons in the area of
the PPT during seizures.
Whole-cell configuration was attained from 36 neurons in the stereotactic area of the
PPT, after a total of 295 pipette passes into the brains of 54 rats. 5 neurons showed a distinct
phenotype of reduced firing and hyperpolarization (RfHp), as seen in Figure 1A, and are the
focus of this study. 4 out of 5 of these RfHp neurons were histologically recovered by identifying
neurons filled with biocytin (from the intracellular solution within the WCR pipette) using a
fluorescent streptavidin construct and co-staining for choline-acetyltransferase (ChAT) using
immunohistochemistry. All recovered RfHp neurons (4 of 4) expressed ChAT positivity (figure
1B), whereas none of the recovered non-RfHp neurons (0 of 12) were ChAT positive (P<0.001,
Fisher’s exact test). An example of a non-RfHp, non-ChAT neuron is shown in Figure 2B, and
the locations of all histologically recovered neurons are shown in Figure 3.

Andrews JP, et al 21
Figure 1
Figure 1. Reduced-firing hyperpolarizing (RfHp) neuron in the pedunculopontine tegmental nucleus (PPT) during a focal limbic seizure. (A) Whole-cell current clamp recording of membrane potential (Vm) in PPT neuron shows reduced firing and hyperpolarization (see inset) during a focal seizure induced in the hippocampus by a 2s, 60 Hz stimulus (gray bar). Concomitant recording of local field potential (LFP) shows polyspike seizure activity in the hippocampus (Hc). Orbital frontal cortex (Ctx) LFP exhibit slow-waves and multiunit activity (MUA) recordings show Up/Down state firing at seizure onset lasting into the postictal period. (B) Histology demonstrates co-localization of biocytin (from intracellular electrode solution) staining and ChAT immunohistochemistry for neuron recorded in A. Scale bar is 20 microns.
A representative whole-cell recording from an RfHp neuron in PPT is shown in Figure 1
A. As seen in the top trace in cyan, prior to seizure initiation the neuron exhibits a continuous

Andrews JP, et al 22
firing pattern. Hippocampal local field potential (Hc LFP) is shown in the pink trace second from
the top with frontal cortical multiple unit activity (Ctx MUA) and cortical LFP (Ctx LFP) in the
bottom black traces. Following hippocampal stimulation (Hc stim, gray bar), high amplitude
seizure activity is seen localized to the hippocampus. In addition, there is a sharp transition from
low-voltage fast activity with sparse slow waves in cortical LFP to synchronized cortical slow
waves and MUA Up/Down firing states at the time of seizure onset as reported previously 5, 9.
Concomitant with seizure onset, the PPT neuron’s
Figure 2
Figure 2. Non-RfHP neuron in the pedunculopontine tegmental nucleus (PPT) during a focal limbic seizure. (A) Whole-cell current clamp recording of membrane potential (Vm) in PPT neuron shows continued tonic firing and no significant hyperpolarization of the resting membrane potential during a focal seizure induced in the hippocampus by a 2s, 60 Hz stimulus (gray bar). Concomitant recording of local field

Andrews JP, et al 23
potential (LFP) shows polyspike seizure activity in the hippocampus (Hc). Orbital frontal cortex (Ctx) LFP and multiunit activity (MUA) show slow-wave and Up/Down state activity during and following the seizure. (B) Histology demonstrates biocytin staining (from intracellular electrode solution) but no ChAT staining by immunohistochemistry staining of the recorded neuron from A. Scale bar is 20 microns.
firing tapers off and is silenced for the majority of the seizure before resuming a regular firing
pattern as the seizure ends. The expanded view of the cyan whole-cell recording of the PPT
neuron during the seizure shows a hyperpolarization of roughly 5mV at its nadir over the course
of the seizure before resuming firing at the seizure’s end. In comparison, non-RfHp neurons
recorded from the same region did not show reduced tonic firing or hyperpolarization during
seizures (example shown in Figure 2). Figure 1B shows the biocytin-filled RfHp neuron (same
neuron as Figure 1A), which stained positive for choline-acetlytransferase like all other
histologically-recovered RfHp neurons (Figure 3). This finding is consistent with the notion that
these are the same subset of neurons previously identified in the PPT and shown to consistently
reduce their firing during seizures 5.
The action potential firing of RfHp neurons before, during and after focal seizures is
depicted in the raster plots in Figure 4A. Histograms in Figure 4B present the average firing rate
in 1s bins over the course of each 20-second epoch. Baseline rate of firing varied among neurons,
but there was a consistent reduction in firing rate during the ictal period relative to baseline with
a mean of -51.6% (SEM 12.8%, P = 0.016).
Non-RfHp, ChAT-negative neurons showed moderately variable responses as expected
for this heterogenous group of neurons 4, trending toward increased rates of firing during the ictal
period (Figure 5) with a mean change relative to baseline of +465.9% (SEM±192.2%, P =
0.096).

Andrews JP, et al 24
Figure 3
Figure 3. Anatomical locations of histologically recovered neurons. 16 neurons were recovered in the region of the pedunculopontine tegmental nucleus (PPT) based on biocytin staining following whole-cell recordings. Red dots indicate the 4 reduced firing hyperpolarizing (RfHp) neurons that were recovered, all of which were verified to be choline acetyl transferase (ChAT)-positive. One RfHp neuron was not histologically recovered. Blue dots indicate the 12 histologically recovered non-RfHp neurons, all of which were ChAT-negative. AP coordinate of coronal sections are in millimeters relative to bregma. Schematics taken with permission from Paxinos and Watson, 1998.
Having demonstrated reduced-firing in a subset of putatively cholinergic PPT neurons
using whole-cell in vivo recordings from the PPT in a model of focal hippocampal seizures, the

Andrews JP, et al 25
next step was to interrogate the intracellular properties of these neurons that might offer clues as
to the mechanism of reduced firing. One aspect visible on the expanded WCR trace from Figure
1 is the hyperpolarization—all RfHp neurons exhibited an ictal hyperpolarization relative to
baseline pre-ictal membrane voltages. The mean membrane potential of RfHp neurons during the
20s baseline prior to seizure onset ranged from -53.73mV to -64.67mV (SEM±2.13), adjusted for
junction potential. The average amplitude of ictal hyperpolarization for RfHp neurons was -
3.82mV (n=4, SEM±0.81, P=0.026) relative to the pre-ictal baseline membrane potential. In
contrast, for non-RfHp neurons, the most hyperpolarized ictal Vm during seizures was on average
no different than baseline: +0.85mV (SEM±0.43, n=10, P = 0.097).
Figure 4
Figure 4. Reduced action potential firing in RfHp neurons during seizures. (A) Raster plots (five cells from five animals) show decreased firing during the Ictal period compared with Baseline. Boxes in ictal panel indicate duration of seizures up to the first 20 s. (B) Histograms of firing rate in 1 s bins across neurons. Mean reduction in firing rate of Ictal compared to Baseline epochs was -51.6% (SEM 12.8%, P = 0.016, paired t-

Andrews JP, et al 26
test). Baseline is defined as the 20 s preceding seizure onset. Ictal is defined as up to the first 20 s following seizure onset. Postictal is the first 20 s following seizure end. Recovery is the 20 s following the Postictal period.
Figure 5
Figure 5. Non-RfHp neurons showed variable pattern of firing during seizures. (A) Raster plots of 12 cells from 10 animals show variable pattern firing during the Ictal period with an overall increase compared with Baseline. Boxes in ictal panel indicate duration of seizures up to the first 20 s. (B) Histograms of firing rate in 1 s bins across neurons. Mean change in firing rate trended upward during Ictal periods compared to Baseline, with high levels variation among non-RfHp neurons resulting in no statistically significant mean change (+465.9%, SEM 192.2%, P = 0.096, t-test). 1 non-RfHp neuron showed no action potentials during the Baseline, Ictal, Postictal and Recovery periods, represented by the blank base at the bottom of part (A). Baseline is 20 s prior to seizure

Andrews JP, et al 27
onset. Ictal is the first 20 s following seizure onset. Postictal is the first 20 s following seizure end. Recovery is the 20 s following the Postictal period.
Input resistance and voltage fluctuation during seizures
Dichotomizing the mechanistic options underlying a phenotype of reduced firing and
hyperpolarization offers two simplified extremes: active inhibition versus a withdrawal of
baseline excitatory input. During active inhibition, for example through increased GABAergic
input, one would expect to see a reduction in a neuron’s input resistance 12, 27.
Because the RfHp neurons were electrophysiologically identified by properties
measurable in current-clamp mode, experiments were continued in current-clamp with the
addition of low-amplitude, continuous, square current-steps to measure moment-to-moment
input resistance. Input resistance was chosen as a non-specific marker of channels opening and
closing. While input resistance lacks the specificity to distinguish between excitatory and
inhibitory currents, it offers the experimental advantage of being measurable while the neuron is
functioning at physiological membrane potentials and without compromising data-rich current-
clamp recordings.
3 RfHp neurons and 4 non-RfHp neurons were recorded with repeated brief current
pulses to quantify input resistance before, during and after seizures. Figure 6A shows a current-
clamp recording of an RfHp ChAT-positive neuron while 30pA 50ms current pulses are
delivered at a rate of 10Hz. Spikes seen in the baseline (black) trace of Figure 6A are truncated
to allow an expanded view of the Vm response to current steps (and action potentials were
excluded from analysis; see Methods). The ictal trace (cyan) shows reduced firing and
hyperpolarization characteristic of the RfHp neurons. As illustrated in the expanded overlay of
voltage responses to square current steps, the ictal period of RfHp neurons is accompanied by an

Andrews JP, et al 28
Figure 6
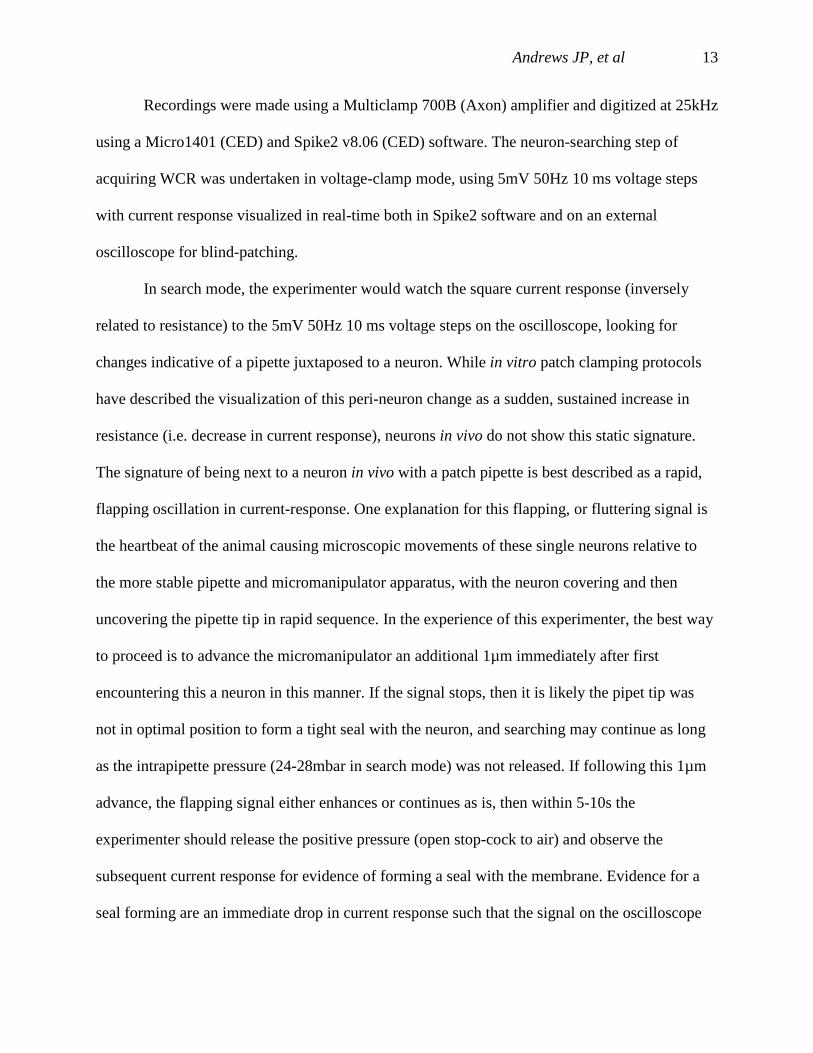
Figure 6. Increased input resistance and reduced membrane potential fluctuations in RfHp neurons during seizures. (A) Example of response to continuous 10Hz 30pA square current pulses in an RfHp neuron (top trace, Voltage; bottom trace, Current). Action potentials are truncated. The
Andrews JP, et al 29
trace shows reduced firing and hyperpolarization in the ictal period (cyan), as well as a larger magnitude of Vm response to constant current steps, indicating an increase in ictal input resistance. Inset on right shows expanded view of baseline (black) and ictal (cyan) Vm responses to current pulses, with resting potentials aligned vertically to enable differences in response amplitude to be compared more easily. (B) Mean time course of relative input resistance (Rin) during seizures reveal that RfHp neurons (cyan) showed a significant difference from mean baseline and from non-RfHp neurons during the ictal period (* P<0.05, two-factor ANOVA). Seizure onset was at time 0, and ends of seizure epochs are indicated by vertical dashed lines for RfHp (cyan, n=3) and non-RfHp (pink, n=4) neurons. Traces show mean Rin relative to (divided by) baseline with standard error of mean (SEM). (C, D) Changes in input resistance (Rin) for individual RfHp and non-RfHp neurons. RfHp neurons (C) show consistent increases in Rin during the ictal period compared to baseline, whereas none of the non-RfHp neurons (D) show an increase in Rin during seizures. Mean and SEM are shown across each neuron that received current pulses (* P < 0.05, paired, two-tailed t-test). (E) Examples of EPSP-like events defined as positive fluctuations in membrane potential of >0.4mV with a rise-time of <2ms 24, 25. Top (black) trace shows the baseline Vm of an RfHp neuron, while the lower (cyan) trace shows ictal Vm of the same RfHp neuron. Orange markings overly areas meeting criteria for EPSP-like events, with each event also marked as a black (baseline) or cyan (ictal) tick-mark for easier comparison of relative frequency. In group analysis, frequency of EPSP-like events was significantly decreased during the ictal periods of RfHp neurons compared to baseline (see text). (F,G) Average membrane potential histograms for RfHp neurons (n=4) (F) and non-RfHp neurons (n=10) (G) in the Baseline, Ictal and Recovery periods. Mean histogram for RfHp neurons was narrower for the ictal period (cyan), and the corresponding membrane potential variance of RfHp neurons was significantly decreased during seizures compared to baseline (see text for statistics).
increase in magnitude of voltage response to constant current pulses, indicating an increase in
input resistance.
The mean time course of input resistance fold-change during seizures is shown for RfHp
vs non-RfHp neurons in Figure 6B. The RfHp curve deflects upward during the ictal period,
indicating higher input resistance during the ictal period. This contrasts with the slightly
downward deflecting curve of the non-RfHp neurons. The RfHp curve was significantly different
from its own baseline (P = 0.001, two-factor ANOVA) in addition to differing from the non-
RfHp curve during the ictal period (P = 3.98e-10, two-factor ANOVA). Input resistance changes

Andrews JP, et al 30
for individual RfHp and non-RfHp neurons are shown in Figure 6C, D. 3 of 3 RfHp neurons
showed a significant (P = 4.53e-9, P = 4.05e-5, P = 0.015; neuron 1, 2, & 3 respectively, baseline
vs ictal; paired two-tailed t-test) increase in mean input resistance during the ictal phase, whereas
0 of 4 non-RfHp neurons exhibited significant ictal increases in input resistance (P = 0.029,
Fisher’s exact test). Because hyperpolarization could potentially contribute to changes in input
resistance due to closure of voltage-gated ion channels, we repeated the input resistance
measurements in 2 of the RfHp neurons both during seizures, and in non-ictal periods (one prior
to seizure onset, one following seizure end) in which the membrane potential was hyperpolarized
to the same voltage measured during the ictal period (data not shown). In both instances, ictal
input resistance was still significantly higher than these non-ictal periods with comparable
hyperpolarization, suggesting that the change in input resistance observed ictally is not fully
explained by hyperpolarization.
As additional means of evaluating changes in synaptic input during the ictal vs. interictal
periods, we examined EPSP-like events and membrane potential fluctuations at baseline and
during seizures (Figure 6E-G). While definitive identification of EPSP’s is difficult without
voltage-channel blockers in the recording solution or a timed stimulus to follow, EPSP’s have
been described in detail morphologically 24, 25. We interrogated our data for positive deflections
of >0.4mV in a time-frame of <2ms 24, 25 to look for discrete EPSP-like events within our current
clamp data—excluding action-potentials and subtracting out current-steps, and compared the
baseline to ictal periods (Figure 6E). The frequency of EPSP-like events was significantly
decreased during the ictal periods of RfHp neurons compared to baseline (mean Baseline
frequency: 97.6 Hz, SEM±20.7; mean Ictal frequency: 88.7 Hz, SEM±19.0; n=4; P = 0.022
paired, two-tailed t-test). Mean amplitude of EPSP-like events in RfHp neurons was not

Andrews JP, et al 31
significantly different between baseline and ictal periods (mean Baseline amplitude: 0.59mV,
SEM±0.07; mean Ictal amplitude 0.55mV, SEM±0.04; n=4; P = 0.113 paired, two-tailed t-test).
Non-RfHp neurons showed no consistent or significant differences between frequency or
amplitude of EPSP-like events in the ictal period compared to baseline (data not shown).
We also plotted the distribution of membrane potential fluctuations at baseline compared
to during seizures (Figure 6 F, G). After high pass filtering for signal over 0.5Hz to account for
slower changes in membrane potential documented during seizures, the mean membrane
potential variance of RfHp neurons was decreased during seizures (mean σ2=1.79 mV2,
SEM±0.48) compared to baseline (mean σ2±2.64 mV2, SEM 0.52, n=4; P = 0.003 paired, two-
tailed t-test). In contrast, the membrane potential variance in non-RfHp neurons tended to
increase during seizures (mean σ2=2.15 mV2, SEM±0.40) compared to baseline (mean σ2=1.64
mV, SEM±0.53) but was not statistically significant (n=10; P = 0.213). These changes in
membrane potential fluctuations and EPSP-like events, along with increased input resistance
suggest that synaptic input may be reduced to RfHp neurons during seizures.
Discussion
In this study, we overcame the technical challenges of deep brain surface-to-target whole cell
recordings to attain the first in vivo WCR of neurons in the PPT, revealing the membrane
property changes in this key arousal nucleus during focal seizures. In addition to replicating prior
extracellular data documenting a subset of cholinergic neurons with reduced firing during
seizures 5, we found membrane potential hyperpolarization accompanied by increased input
resistance, decreased spontaneous membrane potential fluctuations and reduced EPSP-like

Andrews JP, et al 32
events during seizures. These results suggest that reduced firing in putative cholinergic (RfHp)
PPT neurons may arise from decreased excitatory synaptic input during seizures.
Specifically, on the presumption that changes in synaptic input to these neurons sufficient
to change firing and membrane potential would produce measurable changes in input resistance,
continuous measurement of input resistance during the transition from baseline to seizure activity
were made. These measurements reveal an increase in the ictal Rin of RfHp neurons that is not
seen in non-ChAT, non-RfHp neurons. In addition, subthreshold synaptic input was probed by
analyzing membrane potential variance, depicted graphically through voltage histograms, and by
identifying EPSP-like events morphologically. These analyses found a decrease in membrane
potential variance and reduced EPSP-like events in RfHp neurons during seizures. Taken
together, hyperpolarization coupled with increased Rin, less Vm variance and reduced EPSP-like
activity is consistent with—though not specific for—a withdrawal of excitatory synaptic input
underlying the reduced activity of these PPT neurons.
The reduction in firing of RfHp neurons during seizures was a robust validation of prior
work illustrating the reduction in cholinergic arousal observed in focal hippocampal seizures 5.
The hyperpolarization accompanying the reduction in firing was the first clue as to the
physiologic changes underlying the changes in neuronal firing. Postsynaptic hyperpolarization of
a neuron could be caused by active inhibition, for example by receiving GABAergic input
opening chloride channels. If the dominant input causing this hyperpolarization was increased
GABAergic input, one would anticipate a decrease in Rin to accompany the opening of channels
28. Another possibility for hyperpolarization to occur downstream of changes in synaptic input is
for a sudden decrease in baseline excitatory synaptic input, which could lead to reduction in
depolarizing current. The consistent increases in Rin observed accompanying the

Andrews JP, et al 33
hyperpolarization of RfHp neurons present a cogent argument against direct GABAergic input
on these neurons as the dominant mechanism of their reduced activity.
Neurons in vivo are bombarded by synaptic activity that is integrated into that neuron’s
rate of firing 29, 30. Because one explanation for the increase in Rin observed during seizures is a
reduction in excitatory synaptic input, it follows that measures of synaptic input on RfHp
neurons might show a decrease during seizures. A voltage histogram of a neuron with no
synaptic input and which could perfectly maintain its physiologic Vm would appear as a single
narrow impulse at the constant Vm value. The more synaptic input on this hypothetical neuron,
the more its Vm would fluctuate, and the wider the histogram would spread from the mean,
increasing measures of variance. Thus, Vm variance was used as one measure of synaptic input,
visually depicted in Vm histograms. In agreement with our hypothesis, there was indeed a
significant reduction in Vm variance during seizures, supporting the notion that a reduction in
synaptic input may underlie the changes in firing activity seen in RfHp neurons during seizures.
When studying postsynaptic potentials (PSPs), excitatory postsynaptic potentials (EPSPs)
or mini-EPSPs (mEPSPs), distinguishing these events in current-clamp recordings can be made
clearer by the uses of voltage-gated channel blockers to reduce the contamination of data by
action potentials, as well as having a known stimulus—e.g. an external input or an action
potential from a nearby neuron—after which to focus data analysis 24, 31. While we did not have
these advantages, EPSP and mEPSP morphology has been described in detail and is the
centerpiece of many PSP analyses of current-clamp data 24, 25, 32, 33. Although amplitude of PSPs
can vary widely based on experimental conditions like cellular distance for synaptic event from
recording pipette, the impact of these conditions on rate of rise appears less pronounced. A
positive deflection of ≥0.4mV in ≤2ms was chosen as criteria for EPSP-like events based on rise-

Andrews JP, et al 34
times and amplitudes of EPSPs reported in the literature 24, 25, 34. Despite the shortcomings
previously mentioned, advantages of such morphological analyses of discrete positive
fluctuations Vm include protection from biases from slower changes in membrane potential, such
as those associated after-hyperpolarizations of action potentials, as those contributions may be
difficult to eliminate from broader analyses of membrane potential variance. The finding of
decreased EPSP-like events during the ictal period of RfHp neurons provides additional evidence
in favor of reduced excitatory input underlying the increased in Rin and concomitant reduction in
both membrane potential and neuronal firing observed during seizures in RfHp neurons.
Evidence continues to build suggesting that impairments in consciousness accompanying
seizures are not simply a function of acute over-activation of cortical neurons, but rather involve
far-reaching effects of seizures on subcortical arousal systems 5, 8, 9, 18, 35. Neurons of the PPT are
the major source of cholinergic input to the thalamus 20, 21, 36 and have been shown to play a role
in cortical transitions between slow-wave, low-arousal states to a higher arousal state 2, 4, as well
as the opposite direction, from cortical fast-to-slow activity associated with acute depression in
arousal in a seizure model 5. In addition, activation through electrical or optogenetic stimulation
of ascending cholinergic nuclei such as the PPT has been shown to abolish spindles and slow-
waves on EEG and induce fast-activity, mirroring transitions from sleep to wake 37, 38, 39.
Building on prior work that identified PPT and forebrain cholinergic nuclei as elements of the
subcortical arousal system showing evidence of functional impairment during seizures 5, the
purpose of this study was to uncover synaptic mechanisms of reduced firing in cholinergic
neurons in the PPT.
While this study does answer to calls for more in vivo WCR to contribute to
understanding or relative contributions of excitation and inhibition in regulation of single neuron
Andrews JP, et al 35
electrophysiology 12, it does not do so through distinguishing excitatory from inhibitory
conductance in voltage clamp. A short-coming of the model and technique developed in this
study is that because seizures must be spaced out in time to avoid inducing a refractory state in
the hippocampus, neurons often were lost or had increased access resistance while waiting for
the hippocampus to recover to trigger a second seizure. With only a single seizure available to
analyze the phenotype of a neuron, compounded by a search for comparatively sparse
cholinergic neurons in a heterogenous nucleus 4 using a low-yield, time-intensive technique,
emphasis was placed on current-clamp recordings for the ability to characterize the neuronal
membrane properties.
Of course, when making inferences about synaptic input, a limitation of input resistance
is its lack of specificity—one cannot distinguish excitatory from inhibitory currents based on Rin
alone. However, Rin does become useful in the presence of other physiological data to provide
clues as to the source and effect of these changes in resistance—namely changes in membrane
potential and firing profiles, to which the current-clamp recordings carried out in this study
offered convenient access. Moreover, direct measurements of input resistance can also give clues
as to possible contributions of shunting inhibition 22, 23, which, as evidenced by the increase in
Rin, does not appear to be the mechanism of inhibition in this case.
Using Vm histograms as a measure of synaptic input is another non-specific marker. It
does not take into consideration morphology or directionality of Vm fluctuations that might give
clues as to whether they are due to EPSPs or IPSPs. This shortcoming was addressed by
buttressing this evidence with a morphologically-based analysis to identify positive fluctuations
in membrane potential consistent with EPSPs, and conservatively referred to here as EPSP-like
events. Another limitation to the present study is the sample size of RfHp neurons recorded. This

Andrews JP, et al 36
is a function of the time-intensive, low-yield experiments that follow from combining an acute in
vivo model of limbic seizures with performing WCR deep below the brain’s surface. More
neurons are presumably always better, but in the presence of strong prior work with which to
correlate functional neuronal characteristics and clear trends in firing activity and Rin, the authors
believe that the present results are nevertheless of value to the field.
The question now looms as to where the baseline excitatory input that is purportedly
withdrawn during seizures might originate. The PPT receives afferents from many areas,
including the basal ganglia, thalamus, limbic system and cortex 19, 21, 40, 41. Theorizing as to which
of these specifically underlie the ictal withdrawal of excitatory tone would be premature.
However, these findings fit with prior work suggesting that network inhibition during focal
limbic seizures arises from a polysynaptic mechanism, based on the latencies observed between
activation of inhibitory lateral septal regions and initiation of slow waves in the cortex 8.
In summary, putative cholinergic neurons of the PPT show a pattern of reduced firing and
hyperpolarization, accompanied by increased input resistance, reduced Vm variance and reduced
EPSP-like activity during seizures. These properties of RfHp neurons support a mechanism of
decreased excitatory input as the basis for decreased subcortical arousal originating in PPT.
These results run against prevailing conceptions of seizures as carrying out their main effects
through barrages of synchronized neuronal firing and provide subcellular evidence of ictal
alterations of neurophysiology through reductions in synaptic activity. This is an early step
toward understanding the afferent drive of the PPT and its contribution to PPT activity 4.
As clinical advances in treatment of neurophysiologic disorders begin to rely more on
neuromodulation 42, 43, 44, studies of the basic neuronal mechanisms of functional pathology
become less esotericisms and closer to clinical targets for disease-modifying therapies. Deep

Andrews JP, et al 37
brain stimulation for Parkinson’s disease is one example of clear translation from basic,
functional neuroscience to new disease therapies45. Finer and more selective control over
neuronal function continues to grow46 and, as it does, the limiting factor to developing new
neurophysiology-based treatments is the detailed information on how neurons are perturbed in
pathologic states. Single-neuron studies such as presented in the present study will inform
innovative ways to understand and address depressed arousal circuits in temporal lobe epilepsy.
References
1. Moruzzi G, Magoun HW. Brain stem reticular formation and activation of the EEG.
Electroencephalography and clinical neurophysiology 1, 455-473 (1949).
2. Steriade M, Datta S, Pare D, Oakson G, Dossi RC. Neuronal activities in brain-stem
cholinergic nuclei related to tonic activation processes in thalamocortical systems.
Journal of Neuroscience 10, 2541-2559 (1990).
3. Mena-Segovia J, Sims HM, Magill PJ, Bolam JP. Cholinergic brainstem neurons
modulate cortical gamma activity during slow oscillations. The Journal of physiology
586, 2947-2960 (2008).
4. Mena-Segovia J, Bolam JP. Rethinking the Pedunculopontine Nucleus: From Cellular
Organization to Function. Neuron 94, 7-18 (2017).

Andrews JP, et al 38
5. Motelow Joshua E, et al. Decreased Subcortical Cholinergic Arousal in Focal Seizures.
Neuron 85, 561-572 (2015).
6. Mishra AM, et al. Where fMRI and electrophysiology agree to disagree: corticothalamic
and striatal activity patterns in the WAG/Rij rat. Journal of Neuroscience 31, 15053-
15064 (2011).
7. Blumenfeld H. Functional MRI studies of animal models in epilepsy. Epilepsia 48, 18-26
(2007).
8. Englot DJ, Modi B, Mishra AM, DeSalvo M, Hyder F, Blumenfeld H. Cortical
deactivation induced by subcortical network dysfunction in limbic seizures. The Journal
of neuroscience : the official journal of the Society for Neuroscience 29, 13006-13018
(2009).
9. Englot DJ, Mishra AM, Mansuripur PK, Herman P, Hyder F, Blumenfeld H. Remote
effects of focal hippocampal seizures on the rat neocortex. The Journal of neuroscience :
the official journal of the Society for Neuroscience 28, 9066-9081 (2008).

Andrews JP, et al 39
10. Zhan Q, et al. Impaired Serotonergic Brainstem Function during and after Seizures. The
Journal of Neuroscience 36, 2711 (2016).
11. Wehr M, Zador AM. Balanced inhibition underlies tuning and sharpens spike timing in
auditory cortex. Nature 426, 442-446 (2003).
12. Isaacson Jeffry S, Scanziani M. How Inhibition Shapes Cortical Activity. Neuron 72,
231-243 (2011).
13. Higley MJ, Contreras D. Balanced excitation and inhibition determine spike timing
during frequency adaptation. The Journal of neuroscience : the official journal of the
Society for Neuroscience 26, 448-457 (2006).
14. Neher E, Sakmann B. Single-channel currents recorded from membrane of denervated
frog muscle fibres. (1976).
15. Sakmann B. Patch pipettes are more useful than initially thought: simultaneous pre‐ and
postsynaptic recording from mammalian CNS synapses in vitro and in vivo. Pflügers
Archiv 453, 249-259 (2006).

Andrews JP, et al 40
16. Sugiyama D, et al. In vivo patch-clamp recording from locus coeruleus neurones in the
rat brainstem. The Journal of physiology 590, 2225-2231 (2012).
17. Martins ARO, Froemke RC. Coordinated forms of noradrenergic plasticity in the locus
coeruleus and primary auditory cortex. Nature Neuroscience 18, 1483-1492 (2015).
18. Blumenfeld H. Impaired consciousness in epilepsy. The Lancet Neurology 11, 814-826
(2012).
19. Benarroch EE. Pedunculopontine nucleus: functional organization and clinical
implications. Neurology 80, 1148-1155 (2013).
20. Mesulam M, Mufson E, Wainer B, Levey A. Central cholinergic pathways in the rat: an
overview based on an alternative nomenclature (Ch1–Ch6). Neuroscience 10, 1185-1201
(1983).
21. Mesulam M, Geula C, Bothwell MA, Hersh LB. Human reticular formation: cholinergic
neurons of the pedunculopontine and laterodorsal tegmental nuclei and some
cytochemical comparisons to forebrain cholinergic neurons. Journal of Comparative
Neurology 283, 611-633 (1989).

Andrews JP, et al 41
22. Mitchell SJ, Silver RA. Shunting Inhibition Modulates Neuronal Gain during Synaptic
Excitation. Neuron 38, 433-445 (2003).
23. Holt GR, Koch C. Shunting inhibition does not have a divisive effect on firing rates.
Neural computation 9, 1001-1013 (1997).
24. Mason A, Nicoll A, Stratford K. Synaptic transmission between individual pyramidal
neurons of the rat visual cortex in vitro. Journal of Neuroscience 11, 72-84 (1991).
25. Koch C. Biophysics of computation: information processing in single neurons. Oxford
university press (2004).
26. Kundishora AJ, et al. Restoring Conscious Arousal During Focal Limbic Seizures with
Deep Brain Stimulation. Cereb Cortex 27, 1964-1975 (2017).
27. Paladini CA, Iribe Y, Tepper JM. GABA(A) receptor stimulation blocks NMDA-induced
bursting of dopaminergic neurons in vitro by decreasing input resistance. Brain Research
832, 145-151 (1999).
28. Steriade M. Acetylcholine systems and rhythmic activities during the waking–sleep
cycle. Progress in brain research 145, 179-196 (2004).

Andrews JP, et al 42
29. Destexhe A, Paré D. Impact of network activity on the integrative properties of
neocortical pyramidal neurons in vivo. Journal of neurophysiology 81, 1531-1547
(1999).
30. Chance FS, Abbott L, Reyes AD. Gain modulation from background synaptic input.
Neuron 35, 773-782 (2002).
31. Deweese MR, Zador AM. Shared and private variability in the auditory cortex. Journal of
neurophysiology 92, 1840-1855 (2004).
32. Okun M, Lampl I. Instantaneous correlation of excitation and inhibition during ongoing
and sensory-evoked activities. Nat Neurosci 11, 535-537 (2008).
33. DeWeese MR, Zador AM. Non-Gaussian Membrane Potential Dynamics Imply Sparse,
Synchronous Activity in Auditory Cortex. The Journal of Neuroscience 26, 12206-12218
(2006).
34. Magee JC, Cook EP. Somatic EPSP amplitude is independent of synapse location in
hippocampal pyramidal neurons. Nature neuroscience 3, 895 (2000).

Andrews JP, et al 43
35. Englot DJ, Blumenfeld H. Consciousness and epilepsy: why are complex-partial seizures
complex? Progress in brain research 177, 147-170 (2009).
36. Williams JA, Comisarow J, Day J, Fibiger HC, Reiner PB. State-dependent release of
acetylcholine in rat thalamus measured by in vivo microdialysis. Journal of Neuroscience
14, 5236-5242 (1994).
37. McCormick DA, Bal T. Sleep and arousal: thalamocortical mechanisms. Annual review
of neuroscience 20, 185-215 (1997).
38. Steriade M, Amzica F, Nunez A. Cholinergic and noradrenergic modulation of the slow
(approximately 0.3 Hz) oscillation in neocortical cells. Journal of neurophysiology 70,
1385-1400 (1993).
39. Furman M, et al. Optogenetic stimulation of cholinergic brainstem neurons during focal
limbic seizures: Effects on cortical physiology. Epilepsia 56, e198-202 (2015).
40. Usunoff KG, Itzev DE, Lolov SR, Wree A. Pedunculopontine tegmental nucleus. Part I:
Cytoarchitecture, transmitters, development and connections. Biomedical Reviews 14, 95-
120 (2003).

Andrews JP, et al 44
41. Pahapill PA, Lozano AM. The pedunculopontine nucleus and Parkinson's disease. Brain
123, 1767-1783 (2000).
42. Theodore WH, Fisher RS. Brain stimulation for epilepsy. The Lancet Neurology 3, 111-
118 (2004).
43. Gummadavelli A, et al. Neurostimulation to improve level of consciousness in patients
with epilepsy. Neurosurgical focus 38, E10 (2015).
44. Shah SA, Schiff ND. Central thalamic deep brain stimulation for cognitive
neuromodulation–a review of proposed mechanisms and investigational studies.
European Journal of Neuroscience 32, 1135-1144 (2010).
45. Bergman H, Wichmann T, DeLong MR. Reversal of experimental parkinsonism by
lesions of the subthalamic nucleus. Science 249, 1436-1438 (1990).
46. Gradinaru V, et al. Molecular and cellular approaches for diversifying and extending
optogenetics. Cell 141, 154-165 (2010).


![Healing the Body, Healing the Mind Trauma Summit 2018 ... · The Triune Brain[McLean, 1967] Reptilian Brain: Autonomic arousal, instinctive responses Mammalian Brain: or Limbic System:](https://img.pdfslide.net/doc/110x75/5c19d7c709d3f237118bbfb7/healing-the-body-healing-the-mind-trauma-summit-2018-the-triune-brainmclean.jpg)