Embed Size (px)
Citation preview
Mechanisms of European Summer Drying under Climate Change
ALEXANDRE TUELaAND ELFATIH A. B. ELTAHIR
b
a Institute of Geography, Oeschger Centre for Climate Change Research, University of Bern, Bern, SwitzerlandbRalph M. Parsons Laboratory, Massachusetts Institute of Technology, Cambridge, Massachusetts
(Manuscript received 17 December 2020, in final form 16 August 2021)
ABSTRACT: The geography of Europe as a continental landmass, located between the arid Sahara and the cold high
latitudes (both are dry in terms of absolute humidity), dictates the reliance during summer of southern Europe (south of
458N) on stored water from winter and spring, and of northwestern Europe on a small concentrated low-level moisture jet
from the North Atlantic. In a recent study, we explained the projected winter precipitation decline over the Mediterranean
under climate change as due to shifts in upper tropospheric stationary waves and to the regional-scale land–water warming
contrast. Here, based on the analysis of observations and output from models from phase 5 of the Coupled Model
Intercomparison Project, we expand this theory further, documenting how the winter precipitation decline expands into
southern Europe during spring, dictated by similar dynamical mechanisms, depleting soil moisture and setting the stage for
drier summers via soil moisture–precipitation feedbacks. Over northwestern Europe, an anomalous anticyclonic circulation
west of the British Isles displaces the low-level moisture jet northward, limiting moisture supply, and reducing low-level
relative humidity and rainfall. Finally, we discuss how this comprehensive perspective of European summer climate change
can help us better understand the variations across model projections, and pave the way for their reduction.
KEYWORDS: Europe; Atmosphere-land interaction; Atmospheric circulation; Hydrologic cycle; Precipitation; Climate
prediction
1. Introduction
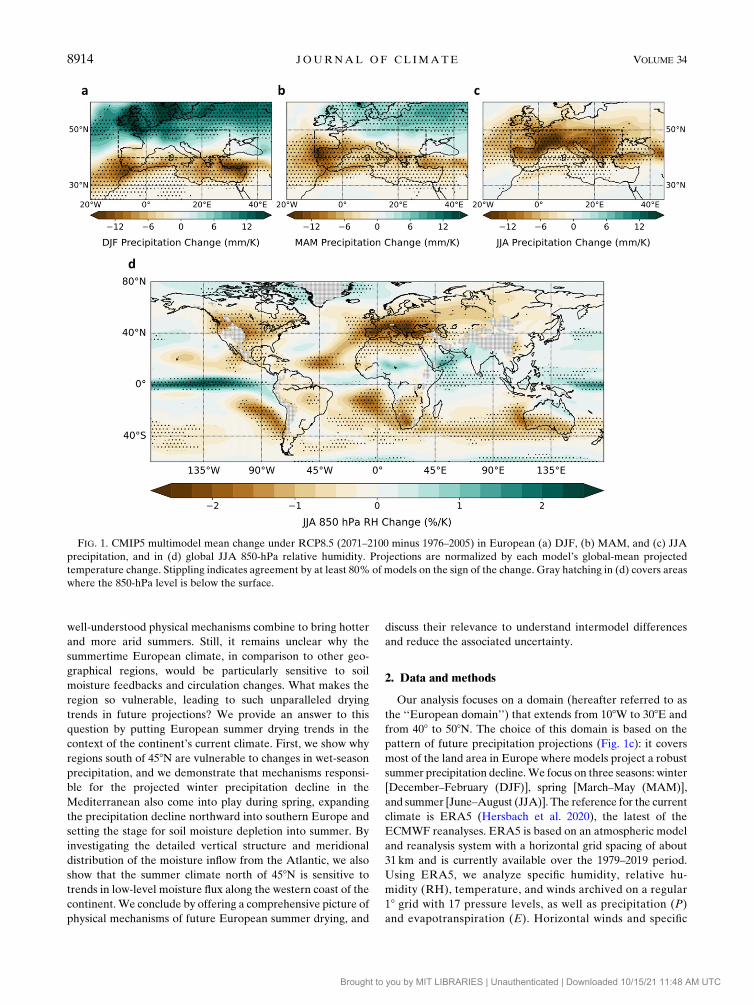
A largemajority of climate models have long projected drier
summers over much of southern and western Europe under
future climate scenarios (Rowell and Jones 2006; Seager et al.
2014; Brogli et al. 2019; Grillakis 2019), the result of intense
surface warming and a widespread decrease in precipitation,
most intense between 408 and 508N (Fig. 1c). Such trends
threaten to put significant stress on human health, water re-
sources, and agriculture (Samaniego et al. 2018), particularly in
the regions of southern Europe where precipitation will also
decline during winter (Fig. 1a). While drying trends over
Europe occur in the bigger context of widespread subtropical
drying, they stand out by their magnitude, much larger than
over any other region (Fig. 1d).
Projections of summer drying in Europe have thus attracted
significant attention in the literature, notably in the context of
the recent record-breaking heatwaves and droughts that the
continent experienced (Stott et al. 2004; Fischer et al. 2007;
Bador et al. 2016; Kew et al. 2019; Vautard et al. 2020). It is now
understood that positive feedbacks between a decline in soil
moisture, precipitation, and surface temperature play a major
role in explaining the robustness of European summer trends
(Schär et al. 2004; Rowell and Jones 2006; Seneviratne et al.
2006).As the surfacewarms, so does evapotranspirative demand,
leading to reduced cloud cover and precipitation, and enhanced
surface warming (Rowell and Jones 2006; Boé and Terray 2014).
These feedbacks are largely triggered by decreases in precipita-
tion during winter and spring over much of southern Europe,
which increase soil moisture deficits at the beginning of summer
(Vautard et al. 2007; Haarsma et al. 2009;Wang et al. 2011). Still,
the mechanism triggering this initial drying is not fully under-
stood, in particular what determines its spatial extent.
In addition, changes in the regional circulation, character-
ized by higher sea level pressure (SLP) over the Atlantic
Ocean and northern Europe, are thought to contribute to the
regional drying (Boé et al. 2009; Bladé et al. 2012; Belleflamme
et al. 2015) by enhancing low-level moisture divergence over
Europe (Seager et al. 2014) and shifting the North Atlantic jet
poleward (Haarsma et al. 2015). The contribution of circula-
tion trends appears to be limited to northwestern Europe
(Rowell and Jones 2006; Belleflamme et al. 2015), where it may
account for more than half of the precipitation decline and
much of intermodel spread (Boé et al. 2009; Haarsma et al.
2015), although other results have suggested it may extend to
most of the continent (Seager et al. 2014). As such, the relative
importance of these circulation trends in explaining the pro-
jected drying along different latitudinal belts across Europe is
not fully understood, and deserves further study. The projected
SLP increase in the North Atlantic results from reduced rates
of ocean surface warming in that region, linked to a weakening
of the Atlantic meridional overturning circulation (AMOC)
(Haarsma et al. 2015). Large-scale continent–ocean warming
contrasts may also further depress land relative humidity
through lesser rates of increase in evaporation above oceans
(Byrne and O’Gorman 2018; Brogli et al. 2019).
A complex picture of European summer climate change
thus emerges (Zappa 2019), in which several robust and
Supplemental information related to this paper is available
at the Journals Online website: https://doi.org/10.1175/JCLI-D-20-
0968.s1.
Corresponding author: Alexandre Tuel, alexandre.tuel@giub.
unibe.ch
15 NOVEMBER 2021 TUEL AND ELTAH IR 8913
DOI: 10.1175/JCLI-D-20-0968.1
� 2021 American Meteorological Society. For information regarding reuse of this content and general copyright information, consult the AMS CopyrightPolicy (www.ametsoc.org/PUBSReuseLicenses).
Brought to you by MIT LIBRARIES | Unauthenticated | Downloaded 10/15/21 11:48 AM UTC
well-understood physical mechanisms combine to bring hotter
and more arid summers. Still, it remains unclear why the
summertime European climate, in comparison to other geo-
graphical regions, would be particularly sensitive to soil
moisture feedbacks and circulation changes. What makes the
region so vulnerable, leading to such unparalleled drying
trends in future projections? We provide an answer to this
question by putting European summer drying trends in the
context of the continent’s current climate. First, we show why
regions south of 458N are vulnerable to changes in wet-season
precipitation, and we demonstrate that mechanisms responsi-
ble for the projected winter precipitation decline in the
Mediterranean also come into play during spring, expanding
the precipitation decline northward into southern Europe and
setting the stage for soil moisture depletion into summer. By
investigating the detailed vertical structure and meridional
distribution of the moisture inflow from the Atlantic, we also
show that the summer climate north of 458N is sensitive to
trends in low-level moisture flux along the western coast of the
continent.We conclude by offering a comprehensive picture of
physical mechanisms of future European summer drying, and
discuss their relevance to understand intermodel differences
and reduce the associated uncertainty.
2. Data and methods
Our analysis focuses on a domain (hereafter referred to as
the ‘‘European domain’’) that extends from 108W to 308E and
from 408 to 508N. The choice of this domain is based on the
pattern of future precipitation projections (Fig. 1c): it covers
most of the land area in Europe where models project a robust
summer precipitation decline.We focus on three seasons: winter
[December–February (DJF)], spring [March–May (MAM)],
and summer [June–August (JJA)]. The reference for the current
climate is ERA5 (Hersbach et al. 2020), the latest of the
ECMWF reanalyses. ERA5 is based on an atmospheric model
and reanalysis system with a horizontal grid spacing of about
31 km and is currently available over the 1979–2019 period.
Using ERA5, we analyze specific humidity, relative hu-
midity (RH), temperature, and winds archived on a regular
18 grid with 17 pressure levels, as well as precipitation (P)
and evapotranspiration (E). Horizontal winds and specific
FIG. 1. CMIP5 multimodel mean change under RCP8.5 (2071–2100 minus 1976–2005) in European (a) DJF, (b) MAM, and (c) JJA
precipitation, and in (d) global JJA 850-hPa relative humidity. Projections are normalized by each model’s global-mean projected
temperature change. Stippling indicates agreement by at least 80% of models on the sign of the change. Gray hatching in (d) covers areas
where the 850-hPa level is below the surface.
8914 JOURNAL OF CL IMATE VOLUME 34
Brought to you by MIT LIBRARIES | Unauthenticated | Downloaded 10/15/21 11:48 AM UTC
humidity are downloaded at a 6-hourly resolution to calculate
time-mean horizontal moisture fluxes, while other variables
are extracted at monthly resolution only. Because P in ERA5
is a prognostic variable (i.e., not directly assimilated), we also
use observation-based P datasets at the monthly time scale:
the Global Precipitation Climatology Project version 2.3
dataset (GPCP; 2.58 resolution) (Adler et al. 2003), and the
two land-only datasets CRU TS4.04 (0.58 resolution) (Harris
et al. 2020) and EOBS (0.258 resolution) (Cornes et al. 2018).Evaporation in ERA5 is also not assimilated, and thus is
influenced by inevitable biases in precipitation and soil
moisture data. Finally, soil moisture observations (top 1m)
are taken from the ESA CCI Soil Moisture v05.2 combined
product (Gruber et al. 2019). Monthly-mean soil moisture
values are calculated by averaging all nonmissing observa-
tions at each grid cell and for each available month. For
purposes of comparison, we also analyze top 1-m soil mois-
ture from ERA5.
Climate model output data from CMIP5 models (Taylor
et al. 2012) are also analyzed, under the historical (1976–2005)
and RCP8.5 (2071–2100) scenarios. We retained all 29 models
that provided SLP, P, E, and RH at monthly resolution. For
analyses involving moisture fluxes, we use a subset of 23
models for which horizontal wind and specific humidity
data on pressure levels were available at daily resolution.
Similarly, soil moisture data are only available for 19 of the
29 models. A detailed list of the selected models can be
found inTable S1 in the online supplementalmaterial (expansions
of model acronyms are available at https://www.ametsoc.org/
PubsAcronymList). All model output is bilinearly regridded
to a common 18 3 18 grid, with land and ocean values re-
gridded separately for surface/1000-hPa variables only.
Future changes are defined under RCP8.5 with respect to
the 1976–2005 historical average. We normalize them by
each GCM’s annual- and global-mean temperature change
to remove, at first order, the effect of varying climate sen-
sitivity across models. This is important to avoid over-
estimating intermodel correlations in long-term changes.
Given q(p) the specific humidity (kg kg21) and u(p) the hor-
izontal wind (m s21) at pressure p (Pa), at a 6-hourly (in ERA5)
and daily (in CMIP5) resolution, we compute the seasonal-mean
tropospheric moisture flux as the vertical integral of the
seasonal-averaged moisture flux qu between p0 5 1000 and
p1 5 100 hPa:
F521
g
ðp1p0
qu dp , (1)
where � stands for the seasonal average and g5 9.81m s22. For
the GCM simulations, we also define estimates of future
summertimemoisture fluxes under a ‘‘constant-wind-and-RH’’
assumption as follows. For each model, pressure level p and
grid point, we note rhhist, the JJA-mean RH in the historical
scenario; uhist(t) and Thist(t), the daily horizontal wind and air
temperature in the historical scenario; and TRCP85(t), the daily
air temperature in the RCP8.5 scenario. We first sort JJA-only
dailyTRCP85 values in the same order as those of JJA-onlyThist.
This yields the seriesTRCP85(t0). Then, we calculate at time step
t a future specific humidity value assuming no change in mean
seasonal RH as follows:
q̂RCP85
(t)5 �es[T
RCP85(t0)]
prh
hist, (2)
where es(T) is the saturation vapor pressure of water at tem-
perature T and �5 0.622 is the molecular weight ratio of water
vapor to dry air. The estimated horizontal moisture flux F̂RCP85
is then obtained by
F̂RCP85
521
g
ðp1p0
q̂RCP85
uhist
dp . (3)
The seasonal atmospheric water budget for an atmospheric
column above area A can then be written as
P2E52= � F , (4)
with P, E, and F being the area-integrated seasonal-mean
values of precipitation, evapotranspiration, and horizontal
moisture flux respectively. The two moisture sources for the
atmospheric column above area A are E and the incoming
moisture flux Fin, defined as the horizontal advection of
moisture into the column from all sides:
Fin5
þ›A
2F � n3 1(F � n, 0) , (5)
where n is the unit vector normal to ›A. We use Fin to assess
the role of horizontal moisture fluxes against that of E in the
seasonal atmospheric moisture budget over the previously
defined European domain. Finally, the seasonal surface water
budget for area A is given by
P2E5DWs1R , (6)
where DWs is the area-integrated change in water storage and
R the runoff flowing out of area A.
As in Tuel and Eltahir (2020), to which we refer the reader for a
more complete description of the methodology, we estimate the
impact of upper-tropospheric (300hPa) wind trends on Northern
Hemisphere SLP during MAM with a dynamical adjustment
techniquebasedonconstructed circulationanalogs. For eachGCM,
analogs of each future MAM 300-hPa zonal wind anomaly field
between 2071 and 2100 are identified in that model’s historical run,
and the corresponding SLP anomalies are linearly combined with
optimal weights. The domain used to identify analogs and compute
the weights is the latitude band extending from 158 to 658N.We also make use of the regional simulations developed by
Tuel and Eltahir (2020) to assess the impact of reduced rates of
warming of near-surface air above the Mediterranean Sea
compared to surrounding continents. The simulations extend
over a domain coveringmost of Europe and theMediterranean
Basin, spanning approximately 248–538N, 208W–458E, at a
horizontal resolution of 35 km and using 40 vertical levels.
They are run with theMITRegional ClimateModel (MRCM).
MRCM is based on the Abdus Salam International Centre
for Theoretical Physics Regional Climate Model, version 3
(RegCM3) (Pal et al. 2007) and includes several improvements
achieved through incorporation of new physical schemes or
15 NOVEMBER 2021 TUEL AND ELTAH IR 8915
Brought to you by MIT LIBRARIES | Unauthenticated | Downloaded 10/15/21 11:48 AM UTC
modification of original schemes [see Tuel and Eltahir (2020)
and references therein]. Two sets of simulations were con-
ducted (Im et al. 2014): one forced using ERA-Interim as
boundary conditions over the 1981–2011 period, and one forced
with output from the MPI-ESM-MR model under the RCP8.5
scenario between 2070 and 2100. Each set consists of a reference
(unperturbed) experiment (designated by ‘‘0C’’) and a per-
turbed experiment in which Mediterranean SSTs are uniformly
warmed by 1.58C year-round (designated by ‘‘11.5C’’). The
impact of the relative SST cooling on the regional climate can
then be estimated by subtracting the results from the 11.5C
simulation to those of the 0C simulation. The MPI experiments
are intended to assess the impact of a relative Mediterranean
cooling in a climate change context. Since any GCM presents a
number of biases in its background climate, whichmaymodulate
the impact of the relative cooling, the ERA experiments thus
allow us to assess the circulation impact of a relative cooling in
the current Mediterranean climate with no land warming.
3. Europe’s summer moisture budget in the currentclimate
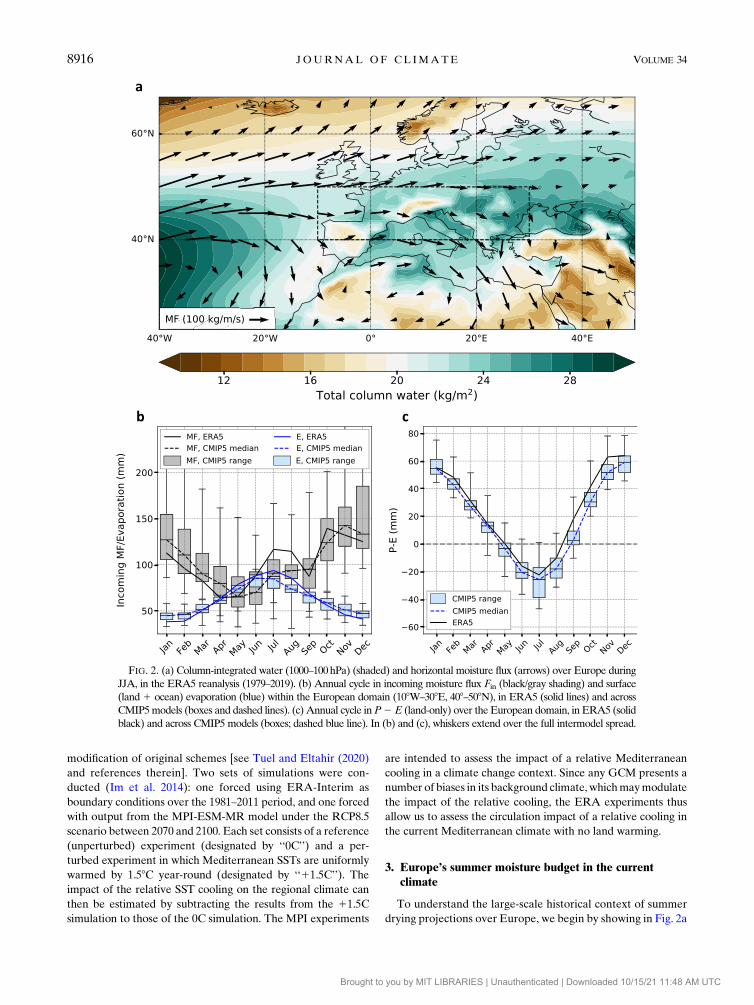
To understand the large-scale historical context of summer
drying projections over Europe, we begin by showing in Fig. 2a
FIG. 2. (a) Column-integrated water (1000–100hPa) (shaded) and horizontal moisture flux (arrows) over Europe during
JJA, in the ERA5 reanalysis (1979–2019). (b) Annual cycle in incoming moisture flux Fin (black/gray shading) and surface
(land1 ocean) evaporation (blue) within the European domain (108W–308E, 408–508N), in ERA5 (solid lines) and across
CMIP5models (boxes and dashed lines). (c) Annual cycle inP2 E (land-only) over the European domain, in ERA5 (solid
black) and across CMIP5 models (boxes; dashed blue line). In (b) and (c), whiskers extend over the full intermodel spread.
8916 JOURNAL OF CL IMATE VOLUME 34
Brought to you by MIT LIBRARIES | Unauthenticated | Downloaded 10/15/21 11:48 AM UTC

tropospheric horizontal moisture fluxes and total columnwater
(TCW) during the summer (JJA) season. The European do-
main stands out as a local TCW maximum, particularly its
eastern part (the Balkans). TCW in regions to the north of the
domain, poleward of 558N, is about as low as over the Sahara
Desert to the south (15–20 kgm22). To the west, over the
Atlantic Ocean, TCW is also comparatively lower over an
elongated coastal band between 208W and 08. The summer
horizontal moisture flux is characterized by a narrow, westerly
low-level jet extending between 458 and 558N, and stretching
from the North Atlantic into northern Europe, up to 208–308E. As a consequence, the incoming moisture flux into the
European domain Fin is largely westerly, with the western
border of the domain accounting for 80% of the magnitude
of Fin.
How does Europe maintain its humidity under such condi-
tions? On the one hand, atmospheric moisture fluxes advect
moisture onto the continent, but mainly northward of 458N(Seager et al. 2014). In addition, the moisture supply coming
directly from surface (land and ocean) evapotranspiration E
within the domain makes up a substantial fraction of incoming
moisture into the lower troposphere (Fig. 2b). Note that E
reaches its minimum in January and its maximum in July, and
its share in the total moisture supply (Fin1E) goes from;30%
during winter to ;50% during summer, a phenomenon gen-
erally well reflected in CMIP5models (Fig. 2b). In ERA5, Fin is
about as large in summer as in winter, despite higher specific
humidity, since the storm track is displaced poleward. In
CMIP5 models, however, the summer Fin tends to be smaller
than in winter, possibly a consequence of the zonal bias in the
North Atlantic storm track in GCMs. The value of E is maxi-
mal during summer, even exceeding P, which leads to negative
P2 E (Fig. 2c) from June to August. Negative P2 E can only
be sustained by the depletion of soil and surface water storage
[DWs; Eq. (6)]. The latter is replenished fromOctober to April,
when P exceeds E.
The analysis of Fig. 2 concerns the European domain as a
whole. However, the two halves of the domain (northern, from
458 to 508N, and southern, from 408 to 458N) behave differently
(Figs. 3a,b). During summer, the northern half stands under the
influence of the midlatitude storm track, which advects sig-
nificant amounts of moisture and results in substantial P (its
annual maximum is reached in June) (Fig. 3a). Consequently,
while E is high, P 2 E remains close to zero from June to
August, and soil moisture in the ESA data hardly decreases.
Still, ERA5 is in disagreement as it points toward a substantial
soil moisture decline in the same period (down to 220mm in
June). Soil moisture increases again in September as P 2 E
becomes positive. By contrast, southward of 458N, P drops
during summer, just as E reaches its maximum (Fig. 3b). Thus
P2E is strongly negative fromMay to September, which leads
to soil moisture depletion. ESA and ERA5 data are in agree-
ment on the sign of soil moisture changes, but the magnitude is
about twice as large in ERA5 as in ESA. Both datasets also
agree that soil moisture changes during summer are more
negative than in the northern half. Again, soil moisture in-
creases from September onward, when P 2 E becomes posi-
tive. This suggests that, south of 458N, a larger fraction of
summer E (and runoff) comes from soil moisture depletion
compared to regions north of 458N.
The relationship between winter/spring P, P 2 E, soil
moisture anomalies, and summer evaporation also emerges in
the analysis of interannual variability (Figs. 3c–e). While P in
DJF is not significantly correlated to June soil moisture (Fig. 3c),
it is for MAM in many parts of the European domain: the
Iberian Peninsula, large parts of France, Italy, and the Balkans
(Fig. 3d). May soil moisture anomalies in turn significantly im-
pact JJAE over the same regions (Fig. 3e). Consequently,P2E
during spring (and to a lesser extent winter), which replenishes
soil moisture levels before the summer, is positively correlated
to summer 850-hPa RH over much of the southern half of the
European domain (Fig. 4a; see also Fig. S1 in the online sup-
plemental material). Poleward of 458N, the connection between
winter and summer conditions appears reversed, though not
significant.A similar pattern is also present in observation-based
P datasets (Figs. 4c,d) but with weaker magnitude and no sta-
tistical significance, which might be due to the fact that P is less
relevant than P 2 E for the soil moisture budget. The correla-
tions between spring P 2 E summer and 850-hPa RH are sig-
nificant over much of the Iberian Peninsula and locally over the
Balkans, regions where summer E is most reliant on soil mois-
ture accumulated during the cold season. While correlation
significance is limited in observations, CMIP5models reproduce
the overall correlation pattern over southern Europe, with
strong intermodel agreement over the Iberian Peninsula and the
Balkans (Fig. 4b). This increases our confidence in the physical
interpretation of the observation-based correlations.
During summer, the European domain is therefore depen-
dent on wet-season water storage and on the narrow low-level
Atlantic moisture jet to maintain its humidity. As such, any
change in either of these moisture sources driven by climate
change can impact summer moisture availability over Europe
and, consequently, precipitation. Based on this perspective, we
consider in the following each moisture source in turn, look at
its projected trends under future climate scenarios, and explain
how these trends contribute to projections of summer drying
over Europe.
4. Wet season precipitation decline and impact onEuropean summer climate
a. Changes in the surface water balance: Winter, spring,and summer
Climate models have long projected a significant decline in
precipitation during winter and spring over southern Europe
and the Mediterranean Basin (Seager et al. 2014; Lionello and
Scarascia 2018). In winter, absolute changes are most negative
over northwestern Africa, the southern Iberian Peninsula, and
along the eastern Mediterranean coastline (Tuel and Eltahir
2020), whereas over northern Europe precipitation is expected
to increase substantially (Fig. 1a). During spring, the decline in
precipitation shifts northward into southern Europe, extending
up to 458N, while from 458 to 508N precipitation is projected to
remain roughly constant (Fig. 1b). These patterns are reflected
in P 2 E projections. During winter, the P 2 E decline is es-
sentially limited to the Mediterranean coastline, and is robust
15 NOVEMBER 2021 TUEL AND ELTAH IR 8917
Brought to you by MIT LIBRARIES | Unauthenticated | Downloaded 10/15/21 11:48 AM UTC

in the southern half of our domain (Fig. 5a). During spring, it
extends northward into western and central Europe, up to 508N(Fig. 5b). In summer, the decline progresses farther northward:
it is mainly concentrated at latitudes higher than 458N, while
P 2 E is projected to remain constant, or even to increase
slightly, in the regions to the south (Fig. 5c).
In winter and spring, the projected decreases in P 2 E over
the western half of the European domain (the Iberian Peninsula
and Italy in DJF/MAM, France in MAM) are mainly driven by
negative P trends, since projections show relatively constant or
increasing E in these regions (Figs. 5d,e). In the eastern half,
however (the Balkans), the P decline is mostly restricted to
Greece; higher north it is the increase in E that explains the
negative P 2 E trend. In summer, the P decline between 408and 458N is roughly compensated by a decline in E, which is
particularly strong over the Balkans and the Iberian Peninsula
(Fig. 5f), leading to the weak P 2 E trends of Fig. 5c. By
contrast, E remains relatively unchanged north of 458N, and it
is the decrease in P that explains the negative P2E change. In
terms of soil moisture, changes within our domain are mainly
negative (Figs. 5g–i). Large year-round declines are projected
for the Iberian Peninsula and the Balkans. For the rest of the
domain, the decline mainly occurs during summer, in parallel
with that in P2 E (Fig. 5c). Soil moisture trends during winter
and spring, though less robust, also point to a slight decline as
well, despite P2 E remaining about constant there (Fig. 5a), a
likely consequence of the summer decline whose impact is felt
throughout the year.
b. Mechanisms of spring precipitation and P 2 E change
The robust precipitation decline during winter, centered
over the southwestern and eastern Mediterranean, is the result
FIG. 3. (a) Annual cycle in land-onlyP (blue),E (red),P2E (purple), andmonthly soil moisture changes (black)
for the southern half of the European domain (108W–308E, 408–458N).All data are fromERA5 except soil moisture
(solid black) from the ESA dataset. (b) As in (a), but for the northern half of the domain (108W–308E, 458–508N).
Pointwise correlation coefficient between (c) DJF and (d) MAM P (from EOBS dataset) and June soil moisture
(from ESA dataset). (e) Pointwise correlation coefficient between May soil moisture (from ESA dataset) and JJA
E (from ERA5). Stippling in (c)–(e) indicates significance at the 10% level, after correcting for the false discovery
rate according to Wilks (2016).
8918 JOURNAL OF CL IMATE VOLUME 34
Brought to you by MIT LIBRARIES | Unauthenticated | Downloaded 10/15/21 11:48 AM UTC
of an increase in average SLP over the Mediterranean Basin
(Seager et al. 2014; Tuel andEltahir 2020). HigherMediterranean
SLP indeed drives anomalous northerlies and the associated cold
(and dry) advection over the eastern Mediterranean, which, fol-
lowing the energy balance, triggers adiabatic warming and a re-
duction in precipitation through anomalous subsidence. To the
west, the SLP anomaly generates anomalous dry advection from
the Sahara Desert toward Morocco and the southern Iberian
Peninsula, in addition to weakening the Atlantic moisture supply,
which reduces RH in the lower troposphere and decreases con-
vective instability (Tuel et al. 2021a). The pronounced SLP in-
crease is itself a response to shifts in the upper-tropospheric
planetary circulation and to the regional-scale warming contrast
between the Mediterranean and surrounding land (Tuel and
Eltahir 2020). The strengthening of upper-tropospheric zonal
winds, linked to enhanced warming at upper levels in the tropical
troposphere, lengthens the wavelength of stationary planetary
waves (Simpsonet al. 2016;Wills et al. 2019). This leads to a robust
anticyclonic anomaly over theMediterranean,which, due to zonal
asymmetries in the vertical structure of stationary waves, is
transmitted down to the surface with limited dampening (Tuel
et al. 2021b). Additionally, the surface heating anomaly due to
reduced rates of warming of Mediterranean SSTs compared to
land also leads to higher SLP over the basin.
During spring, southern Europe and the Mediterranean
are also characterized by significant positive SLP trends and
associated anticyclonic circulation (Fig. 6a). While winter
trends are characterized by a strong anomalous ridge over the
Mediterranean, European SLP trends during spring are
weaker (roughly 1 hPa compared to 2 hPa) and displaced to
the west, where they connect with an area of robust enhanced
SLP over the North Atlantic. Still, as is the case during winter
(Tuel and Eltahir 2020), southern European andMediterranean
precipitation trends across CMIP5 models are primarily con-
nected to SLP changes over southern Europe (southward of
458N), and not over northwestern Europe and the Atlantic
Ocean (Fig. 6b; see also Fig. S2), even though the latter are also
robust. The relationship between spring Mediterranean (108W–
408E, 358–458N) precipitation projections and the SLP increase
over southern France and Italy in particular is very strong and
explains half of intermodel scatter in precipitation projections
(r2 5 0.55). The reason, as in winter, can be found in the circu-
lation anomaly triggered by such SLP trends. The robust SLP
increase centered around 408N, 108E generates a substantial
anticyclonic anomaly associated with anomalous southeasterlies
and dry advection over southwestern Europe (Fig. 6c), and
anomalous northerlies, cold and dry advection, as well as sub-
sidence, over southeastern Europe and Turkey (Fig. 6d).
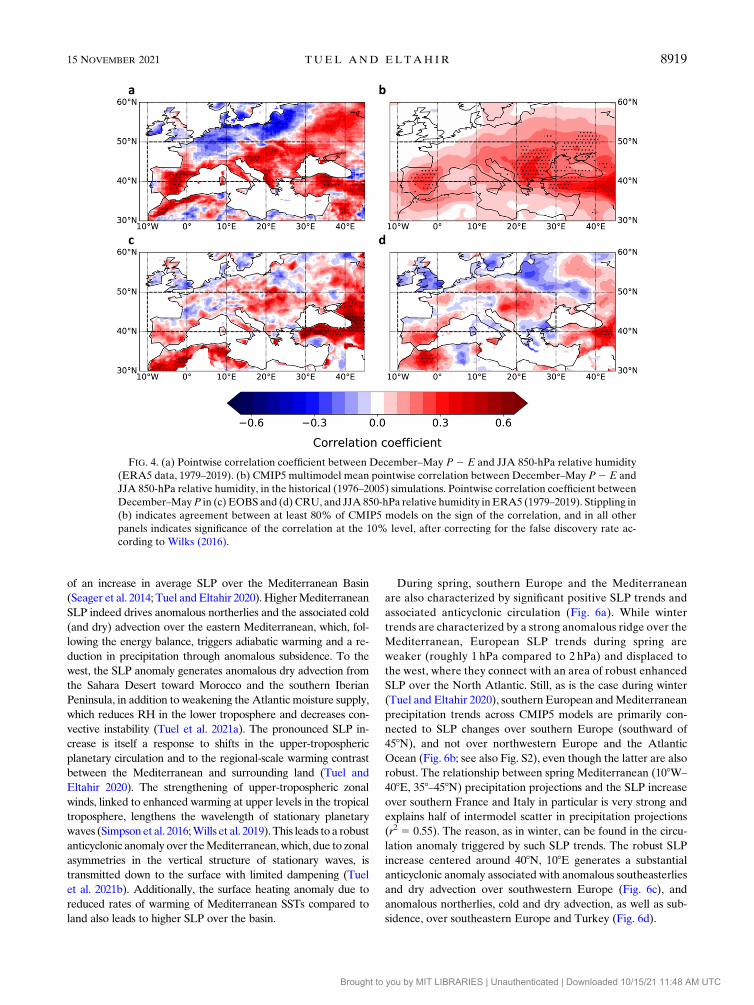
FIG. 4. (a) Pointwise correlation coefficient between December–May P 2 E and JJA 850-hPa relative humidity
(ERA5 data, 1979–2019). (b) CMIP5 multimodel mean pointwise correlation between December–May P2 E and
JJA 850-hPa relative humidity, in the historical (1976–2005) simulations. Pointwise correlation coefficient between
December–MayP in (c) EOBS and (d) CRU, and JJA850-hPa relative humidity in ERA5 (1979–2019). Stippling in
(b) indicates agreement between at least 80% of CMIP5 models on the sign of the correlation, and in all other
panels indicates significance of the correlation at the 10% level, after correcting for the false discovery rate ac-
cording to Wilks (2016).
15 NOVEMBER 2021 TUEL AND ELTAH IR 8919
Brought to you by MIT LIBRARIES | Unauthenticated | Downloaded 10/15/21 11:48 AM UTC

Comparing spring (Fig. 6) to winter (Fig. S3), the P and P2 E
declines shift northward during spring, particularly over the
western Mediterranean. This shift is partly related to a similar
northwarddrift of the anomalous SLP ridge from the central to the
northwestern Mediterranean (Fig. 6a). Anomalous SLP gradients
over the western Mediterranean are weaker during spring, but
low-level wind trends are of a similarmagnitude to those projected
for winter (1–1.5ms21). In addition, the projected low-level RH
decline is stronger than during winter (Fig. 6c; see also Fig. S3c).
This may result from the fact that the humidity difference (both
absolute and relative) between the Sahara Desert and the Iberian
Peninsula is larger during spring, and also from the storm track and
associated moisture transport being more poleward during spring.
To the east, anomalous subsidence trends are noticeably
weaker in MAM than in DJF, possibly a consequence of
precipitation being smaller in this region during spring. Indeed,
lower precipitation means less latent heating of the atmo-
spheric column, which limits the possibility for reduced precip-
itation to enhance the subsidence signal through diabatic cooling
feedbacks (Rodwell and Hoskins 2001). The location of en-
hanced subsidence is not significantly different in spring com-
pared to winter, and in both seasons the precipitation decline
remains centered over Greece and Turkey while regions around
the Black Sea see little change in precipitation during either
season (Figs. 1a,b). The P 2 E decline expands northward
during spring, however (Fig. 5b), driven by an increase in E.
c. Origins of spring SLP trends
The SLP increase over continental Europe is therefore the
key driver of the projected P decline south of 458N during
FIG. 5. CMIP5multimodelmean change (2071–2100minus 1976–2005) in (a)–(c)P2 E, (d)–(f)E, and (g)–(i) soil moisture (top 1m) over Europe
(land only), in (left) DJF, (center) MAM, and (right) JJA. Stippling indicates agreement by at least 80% of models on the sign of the change.
8920 JOURNAL OF CL IMATE VOLUME 34
Brought to you by MIT LIBRARIES | Unauthenticated | Downloaded 10/15/21 11:48 AM UTC
spring, itself amajor contributor to the concurrentP2E decline
over the same region (and beyond, over southern and eastern
Europe). To understand what drives springtime SLP trends, and
in particular whether similar mechanisms are at play as during
winter, we first show in Figs. 7a and 7b the upper- and lower-
tropospheric meridional wind trends projected for MAM by the
CMIP5 multimodel ensemble. As in winter, a clear anticyclonic
anomaly occurs right above the Mediterranean Basin, but of a
magnitude about two-thirds that projected for winter (Tuel
et al. 2021b). Near the surface, the anomalous northerly wind
component is evident east of 208E. The empirical approach of
dynamical adjustment reveals that, similar to winter, upper-
tropospheric dynamical trends during spring are linked to
positive SLP anomalies over much of the Mediterranean
Basin, particularly its western half, accounting for about half
the projected CMIP5 multimodel trend over the 358–458N,
08–208E domain (10.12 against 10.23 hPaK21; Figs. 7c,d).
Compared to DJF, estimated SLP anomalies during MAM
are shifted northwestwards, extending into southern France,
consistent with projected upper-tropospheric circulation changes
(Fig. S4). This shift between winter and spring is likely due to
the concurrent poleward drift and weakening of the upper-
tropospheric jet.
In spring, Mediterranean SSTs also experience a relative cool-
ing with respect to the surrounding continents, due to the reduced
rate of warming of ocean temperatures compared to land (Sutton
et al. 2007). Its impact on the regional circulation, as estimated by
the difference between the 0C and 11.5C MRCM experiments,
is a basinwide SLP increase, reaching amaximumof 0.75hPa over
the central Mediterranean (208E), and averaging 10.5 hPa over
the previously defined southern European domain (358–458N/08–208E) (Fig. 8a). The wind response is essentially confined to
the southeastern and southern Mediterranean, with very weak
changes over southwestern Europe (#0.1ms21). It is also asso-
ciated with a broad decrease in precipitation (Fig. 8b), mostly
eastward of 108E, extending into the Balkans, where it amounts to
about 10% of seasonal precipitation. In keeping with the previous
discussion, very little difference in precipitation is seen over
southern France and the Iberian Peninsula, where winds are
roughly the same in the perturbed and unperturbed experiments.
Overall, the two mechanisms seem to explain most of
the SLP change projected by CMIP5 models over southern
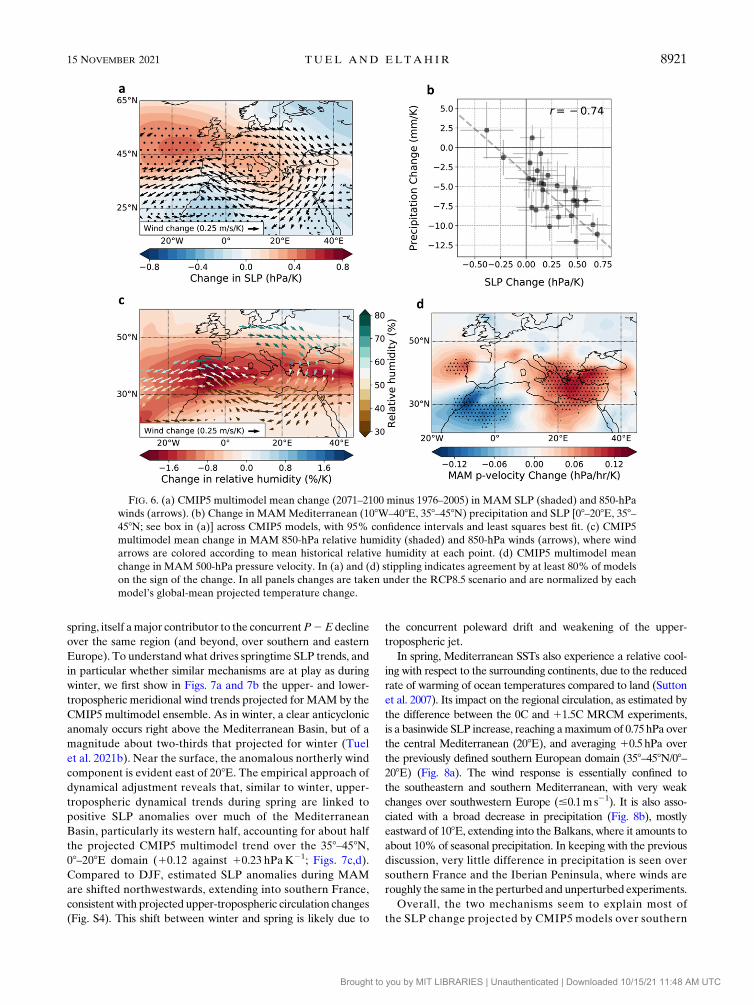
FIG. 6. (a) CMIP5 multimodel mean change (2071–2100 minus 1976–2005) in MAM SLP (shaded) and 850-hPa
winds (arrows). (b) Change in MAMMediterranean (108W–408E, 358–458N) precipitation and SLP [08–208E, 358–458N; see box in (a)] across CMIP5 models, with 95% confidence intervals and least squares best fit. (c) CMIP5
multimodel mean change in MAM 850-hPa relative humidity (shaded) and 850-hPa winds (arrows), where wind
arrows are colored according to mean historical relative humidity at each point. (d) CMIP5 multimodel mean
change in MAM 500-hPa pressure velocity. In (a) and (d) stippling indicates agreement by at least 80% of models
on the sign of the change. In all panels changes are taken under the RCP8.5 scenario and are normalized by each
model’s global-mean projected temperature change.
15 NOVEMBER 2021 TUEL AND ELTAH IR 8921
Brought to you by MIT LIBRARIES | Unauthenticated | Downloaded 10/15/21 11:48 AM UTC
Europe. Compared to winter, the spring SLP anomalies linked
to each mechanism appear to be displaced westward (Tuel and
Eltahir 2020), consistent with CMIP5 projections. It is impor-
tant to note that neither mechanism can account for the robust
SLP increase projected west of France and the British Isles
(Fig. 6a). This positive SLP anomaly is generally thought to be
the response to reduced SST warming over the North Atlantic
(Haarsma et al. 2015; Gervais et al. 2019). While this SLP feature
is not expected to have much influence over southern European
and Mediterranean precipitation trends during spring, it may still
matter by preventing the strengthening of midlatitude westerlies
over northwestern Europe that would be expected from the SLP
anomalies fromFigs. 7c and 8a. Indeed, Fig. 6a shows the lack of a
robust wind response over northwestern Europe, an important
difference with winter projections (Tuel and Eltahir 2020). In
winter, a strengthening in westerlies and in the associated mois-
ture transport likely contributes to the large increase of precipi-
tation projected for northern Europe, down to 508N. Its absence
during spring may therefore be linked to the much weaker and
less robust precipitation signal over northern Europe, contribut-
ing to the overall stagnation in P 2 E trends (Fig. 5b).
5. Moisture flux changes and impact on Europeansummer moisture
a. Analysis of projected moisture flux trends
Atmospheric circulation changes during winter and spring
lead to decreases in P and P 2 E south of 458N within the
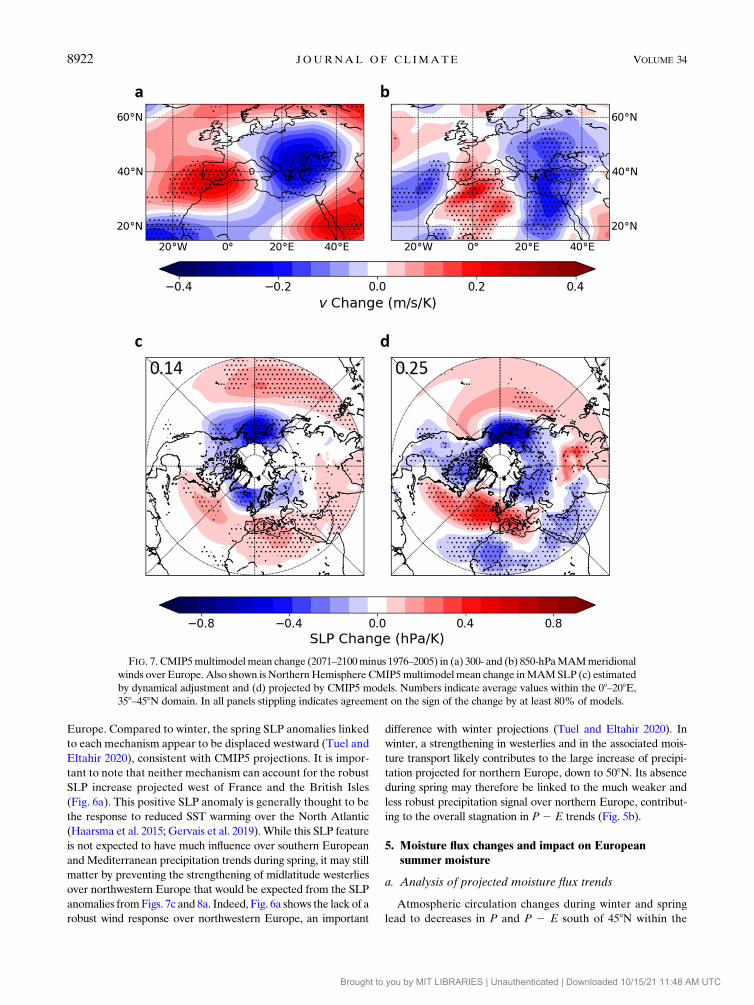
FIG. 7. CMIP5multimodelmean change (2071–2100minus 1976–2005) in (a) 300- and (b) 850-hPaMAMmeridional
winds over Europe. Also shown is NorthernHemisphere CMIP5multimodelmean change inMAMSLP (c) estimated
by dynamical adjustment and (d) projected by CMIP5 models. Numbers indicate average values within the 08–208E,358–458N domain. In all panels stippling indicates agreement on the sign of the change by at least 80% of models.
8922 JOURNAL OF CL IMATE VOLUME 34
Brought to you by MIT LIBRARIES | Unauthenticated | Downloaded 10/15/21 11:48 AM UTC
domain, setting the stage for a summertime P decline through
soil moisture–rainfall feedbacks. North of 458N, however,
winter and spring trends in P 2 E are weak (Figs. 5a,b), while
summer P and low-level RH still exhibit sharp negative trends
(Figs. 1c,d). In addition, summer E remains approximatively
constant in future projections (Fig. 5f), which is inconsistent
with a strong role for land–atmosphere coupling in the P de-
cline. To understand summer P and RH trends, we analyze
future horizontal moisture fluxes, particularly along the west-
ern border of the European domain (108W, between 408 and508N), where the majority of moisture advection into the do-
main occurs (Fig. 2a). The vertically integrated moisture flux
increases on average in future projections, leading to enhanced
zonal moisture advection into Europe (Fig. 9a). However, we
find, first, that the moisture flux increase along the western
border of the domain is lower than what would be expected
under an assumption of fixed circulation and RH (Fig. 9a) and,
second, that at low levels (below 800 hPa) the zonal moisture
flux along that same border even decreases in absolute terms
(Fig. 9c), although the trend is not robust southward of 458N.
Northward of 608N, by contrast, zonal moisture fluxes increase
across the depth of the troposphere, slightly beyond the fixed-
circulation/fixed-RH estimates (Fig. 9).
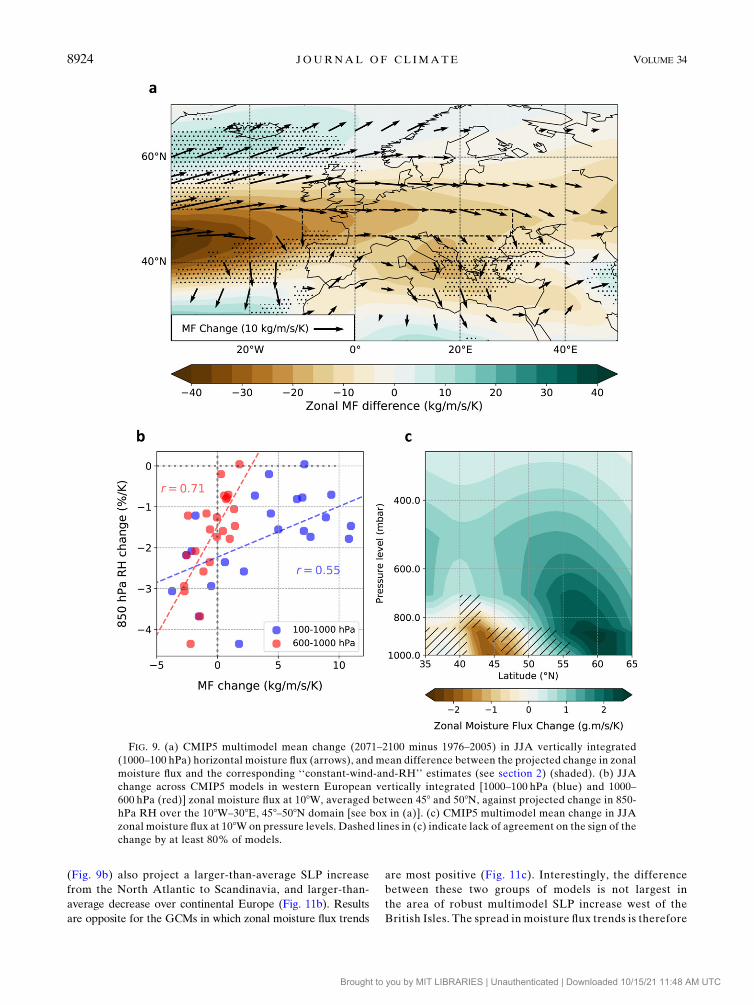
The weak increase in vertically integrated zonal moisture
advection has direct implications for the summertime moisture
budget over the European domain. Over the northern half of
the European domain (see box in Fig. 9a), where we expect
moisture flux trends to matter most for changes in the moisture
budget, 850-hPa RH trends are found to be significantly con-
nected to changes in vertically integrated zonal moisture inflow
at 108W (r2 5 0.3; Fig. 9b). The correlation is even stronger
when restricting the moisture flux to the 1000–600-hPa layer
(r2 5 0.5). Intermodel spread in projections remains large,
however; six GCMs (a fourth of analyzed models) even project
an absolute decline in vertically integrated zonal moisture in-
flow at 108W.
Figure 10 shows 850-hPa RH and moisture flux projec-
tions for the six models with the most positive (Figs. 10a,b)
and the most negative (Figs. 10c,d) moisture flux change
in Fig. 9b. Clearly, the outlook for regions north of 508Nis very different between these two groups of models
(Fig. 10e). Southern Europe (including the southern half of
our domain, below 458N), on the other hand, experiences
sharp drying in either case, particularly over the Iberian
Peninsula, the Balkans, and Turkey. These are precisely the
regions where our previous results suggest that land–
atmosphere coupling dominates both for interannual and
long-term climate variability. The difference in RH trends
between the two model groups confirms that uncertainties
in moisture flux changes play only a limited role in RH
projections (Fig. 10e).
b. Role of dynamical trends
Future moisture flux trends are determined by changes in
specific humidity and circulation. The fact that zonal mois-
ture fluxes between 408 and 508N increase less than expected,
assuming fixed circulation and RH, implies a decline in RH
and/or a change in atmospheric circulation. Though robustly
negative, RH trends west of 108Ware weak (Fig. 1d). Thus, while
they undoubtedly contribute to the decline in zonal moisture
fluxes relative to the ‘‘fixed-circulation, fixed-RH’’ baseline,
they are unlikely to fully account for it. It is also unclear to
what extent the RH decline west of 108W is related to the
concurrent decline over the European continent. Low-level
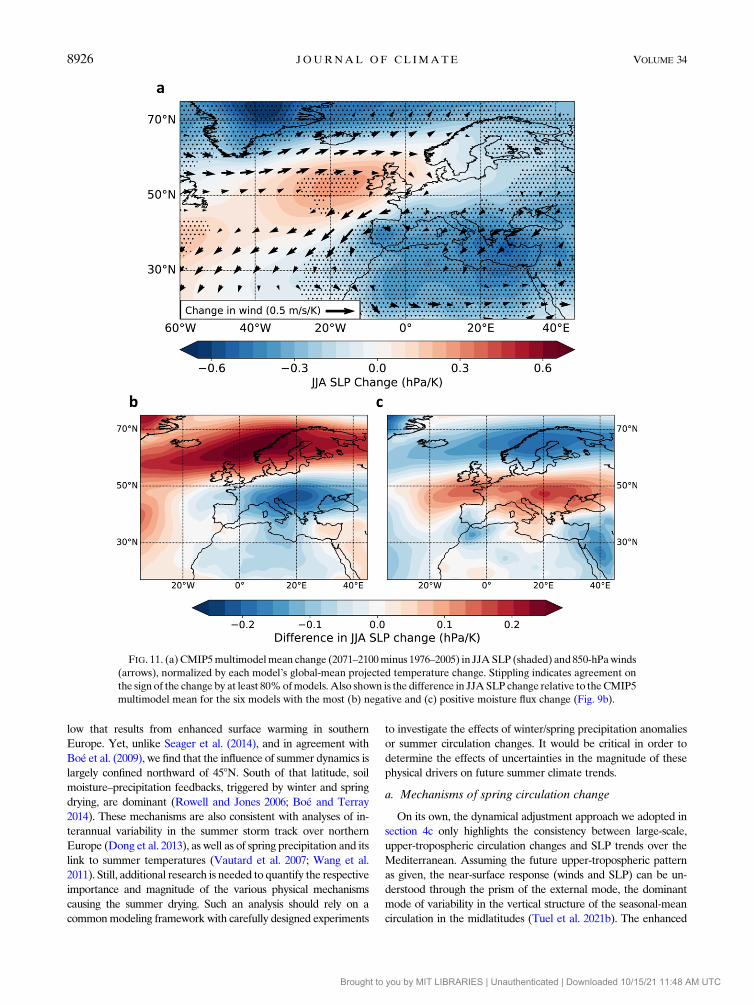
circulation trends, on the other hand, clearly show anoma-
lous easterlies over the 308W–08, 408–458N domain—where
zonal moisture fluxes are projected to decline (Fig. 9c)—and
anomalous westerlies northward of 558N (Fig. 11a). Both are
linked to positive SLP anomalies west of the British Isles,
around 508N, 208W. An area of robust SLP decline also ex-
tends over the whole Mediterranean Basin and northern
Africa, and it strengthens the anomalous SLP gradient over
western Europe, thus enhancing the circulation response.
Overall, uncertainties in moisture flux projections are
linked to the magnitude of this SLP gradient. GCMs pro-
jecting an absolute decline in zonal moisture advection
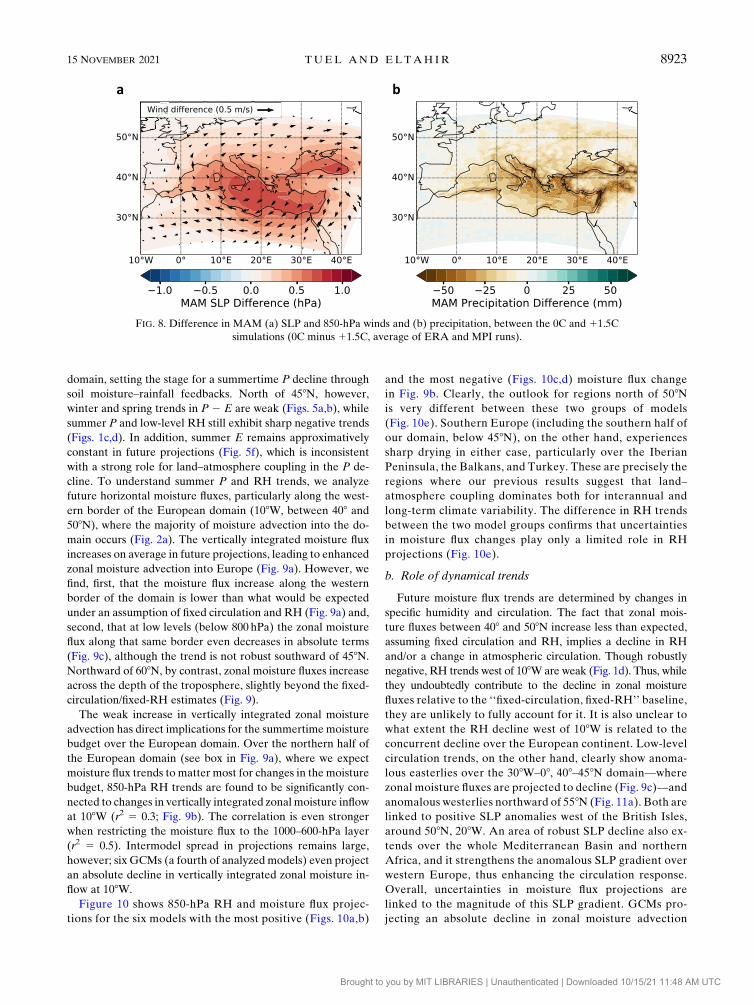
FIG. 8. Difference in MAM (a) SLP and 850-hPa winds and (b) precipitation, between the 0C and 11.5C
simulations (0C minus 11.5C, average of ERA and MPI runs).
15 NOVEMBER 2021 TUEL AND ELTAH IR 8923
Brought to you by MIT LIBRARIES | Unauthenticated | Downloaded 10/15/21 11:48 AM UTC
(Fig. 9b) also project a larger-than-average SLP increase
from the North Atlantic to Scandinavia, and larger-than-
average decrease over continental Europe (Fig. 11b). Results
are opposite for the GCMs in which zonal moisture flux trends
are most positive (Fig. 11c). Interestingly, the difference
between these two groups of models is not largest in
the area of robust multimodel SLP increase west of the
British Isles. The spread in moisture flux trends is therefore
FIG. 9. (a) CMIP5 multimodel mean change (2071–2100 minus 1976–2005) in JJA vertically integrated
(1000–100 hPa) horizontal moisture flux (arrows), and mean difference between the projected change in zonal
moisture flux and the corresponding ‘‘constant-wind-and-RH’’ estimates (see section 2) (shaded). (b) JJA
change across CMIP5 models in western European vertically integrated [1000–100 hPa (blue) and 1000–
600 hPa (red)] zonal moisture flux at 108W, averaged between 458 and 508N, against projected change in 850-
hPa RH over the 108W–308E, 458–508N domain [see box in (a)]. (c) CMIP5 multimodel mean change in JJA
zonal moisture flux at 108Won pressure levels. Dashed lines in (c) indicate lack of agreement on the sign of the
change by at least 80% of models.
8924 JOURNAL OF CL IMATE VOLUME 34
Brought to you by MIT LIBRARIES | Unauthenticated | Downloaded 10/15/21 11:48 AM UTC

related both to the magnitude and the pattern of future
JJA SLP changes.
6. Discussion
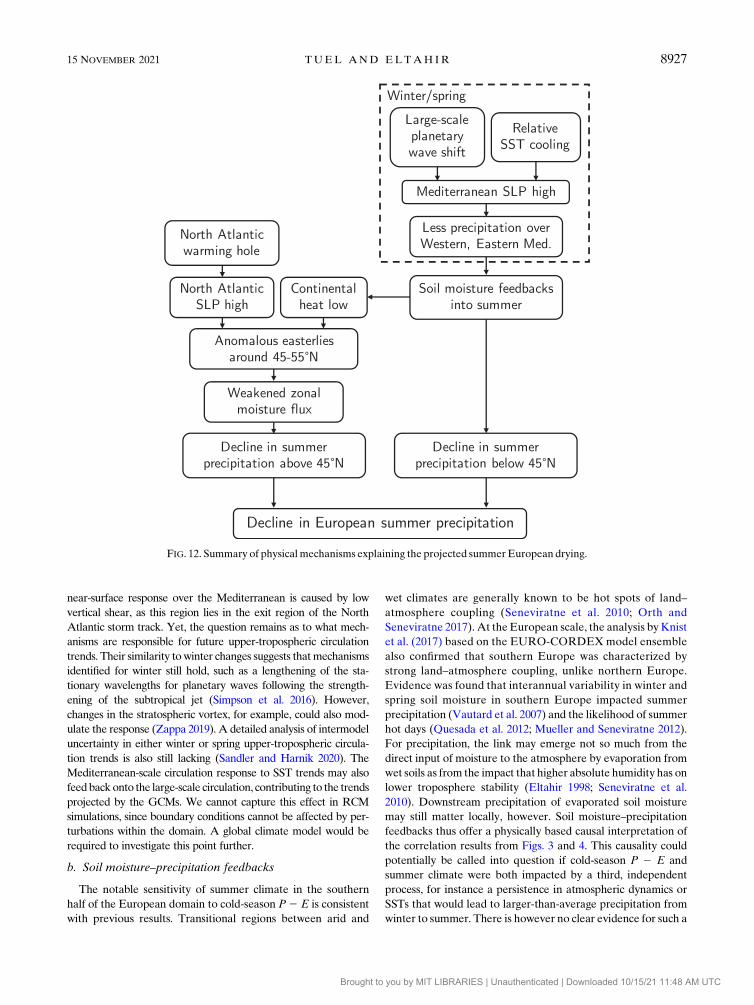
Results from the present study confirm the complexity behind
summer drying projections over Europe, but also suggest a
comprehensive understanding of the physical mechanisms
responsible, as shown in Fig. 12. In keeping with Brogli et al.
(2019), our results suggest a prominent role for the land–
ocean warming contrast, specifically the reduced North
Atlantic warming, although primarily through its impact on
regional circulation rather than through thermodynamics
exclusively. Indeed, like Haarsma et al. (2015), we find a
critical influence of North Atlantic SLP trends on northern
European precipitation, which we interpret through their
impact on incoming moisture fluxes into Europe. However,
we argue also for an important effect from theMediterranean heat
FIG. 10. Change in JJA (a)mean 850-hPaRH (shaded) and 925–600-hPamoisture flux (arrows), and (b) zonalmoisture
flux averagedbetween 108W–08, for the sixCMIP5modelswith themost positivemoisture flux change inFig. 9b. (c),(d)As
in (a) and (b), but for the sixmodelswith themost negativemoisture flux change. (e)Difference between (c) and (a). In
(a)–(d), stippling indicates agreement on the sign of the change by all the models of the respective group.
15 NOVEMBER 2021 TUEL AND ELTAH IR 8925
Brought to you by MIT LIBRARIES | Unauthenticated | Downloaded 10/15/21 11:48 AM UTC
low that results from enhanced surface warming in southern
Europe. Yet, unlike Seager et al. (2014), and in agreement with
Boé et al. (2009), we find that the influence of summer dynamics is
largely confined northward of 458N. South of that latitude, soil
moisture–precipitation feedbacks, triggered by winter and spring
drying, are dominant (Rowell and Jones 2006; Boé and Terray
2014). These mechanisms are also consistent with analyses of in-
terannual variability in the summer storm track over northern
Europe (Dong et al. 2013), as well as of spring precipitation and its
link to summer temperatures (Vautard et al. 2007; Wang et al.
2011). Still, additional research is needed to quantify the respective
importance and magnitude of the various physical mechanisms
causing the summer drying. Such an analysis should rely on a
commonmodeling frameworkwith carefully designed experiments
to investigate the effects of winter/spring precipitation anomalies
or summer circulation changes. It would be critical in order to
determine the effects of uncertainties in the magnitude of these
physical drivers on future summer climate trends.
a. Mechanisms of spring circulation change
On its own, the dynamical adjustment approach we adopted in
section 4c only highlights the consistency between large-scale,
upper-tropospheric circulation changes and SLP trends over the
Mediterranean. Assuming the future upper-tropospheric pattern
as given, the near-surface response (winds and SLP) can be un-
derstood through the prism of the external mode, the dominant
mode of variability in the vertical structure of the seasonal-mean
circulation in the midlatitudes (Tuel et al. 2021b). The enhanced
FIG. 11. (a)CMIP5multimodelmean change (2071–2100minus 1976–2005) in JJASLP (shaded) and850-hPawinds
(arrows), normalized by each model’s global-mean projected temperature change. Stippling indicates agreement on
the sign of the change by at least 80%ofmodels.Also shown is the difference in JJASLP change relative to theCMIP5
multimodel mean for the six models with the most (b) negative and (c) positive moisture flux change (Fig. 9b).
8926 JOURNAL OF CL IMATE VOLUME 34
Brought to you by MIT LIBRARIES | Unauthenticated | Downloaded 10/15/21 11:48 AM UTC
near-surface response over the Mediterranean is caused by low
vertical shear, as this region lies in the exit region of the North
Atlantic storm track. Yet, the question remains as to what mech-
anisms are responsible for future upper-tropospheric circulation
trends. Their similarity towinter changes suggests thatmechanisms
identified for winter still hold, such as a lengthening of the sta-
tionary wavelengths for planetary waves following the strength-
ening of the subtropical jet (Simpson et al. 2016). However,
changes in the stratospheric vortex, for example, could also mod-
ulate the response (Zappa 2019). A detailed analysis of intermodel
uncertainty in either winter or spring upper-tropospheric circula-
tion trends is also still lacking (Sandler and Harnik 2020). The
Mediterranean-scale circulation response to SST trends may also
feedbackonto the large-scale circulation, contributing to the trends
projected by the GCMs. We cannot capture this effect in RCM
simulations, since boundary conditions cannot be affected by per-
turbations within the domain. A global climate model would be
required to investigate this point further.
b. Soil moisture–precipitation feedbacks
The notable sensitivity of summer climate in the southern
half of the European domain to cold-season P2 E is consistent
with previous results. Transitional regions between arid and
wet climates are generally known to be hot spots of land–
atmosphere coupling (Seneviratne et al. 2010; Orth and
Seneviratne 2017). At the European scale, the analysis byKnist
et al. (2017) based on the EURO-CORDEXmodel ensemble
also confirmed that southern Europe was characterized by
strong land–atmosphere coupling, unlike northern Europe.
Evidence was found that interannual variability in winter and
spring soil moisture in southern Europe impacted summer
precipitation (Vautard et al. 2007) and the likelihood of summer
hot days (Quesada et al. 2012; Mueller and Seneviratne 2012).
For precipitation, the link may emerge not so much from the
direct input of moisture to the atmosphere by evaporation from
wet soils as from the impact that higher absolute humidity has on
lower troposphere stability (Eltahir 1998; Seneviratne et al.
2010). Downstream precipitation of evaporated soil moisture
may still matter locally, however. Soil moisture–precipitation
feedbacks thus offer a physically based causal interpretation of
the correlation results from Figs. 3 and 4. This causality could
potentially be called into question if cold-season P 2 E and
summer climate were both impacted by a third, independent
process, for instance a persistence in atmospheric dynamics or
SSTs that would lead to larger-than-average precipitation from
winter to summer. There is however no clear evidence for such a
FIG. 12. Summary of physicalmechanisms explaining the projected summerEuropean drying.
15 NOVEMBER 2021 TUEL AND ELTAH IR 8927
Brought to you by MIT LIBRARIES | Unauthenticated | Downloaded 10/15/21 11:48 AM UTC
process. The large contribution of surface evaporation to the
summertime European moisture budget supports the idea
that the correlation is linked to soil moisture–precipitation
feedbacks. Simulations in which spring and summer soil
moisture are set to a baseline value (and thus decoupled from
cold-season P 2 E variability) could help shed more light on
this point.
Results from section 4 suggest that land–atmosphere cou-
pling also explains much of the projected summer P decline in
the southern part of our domain. There, the projected summer
decline in E and soil moisture, and the weak P 2 E trends
(Fig. 5), are consistent with soil moisture–precipitation feed-
backs being responsible for the concurrent P decline. Summer
E notably decreases most over the Iberian Peninsula and the
Balkans, the regions of our domain that experience the most
severe P, P 2 E, and soil moisture declines during the cold
season. These are also regions with notable land–atmosphere
coupling in the present-day climate, that is, where summer E
and low-level RH are most constrained by late spring soil
moisture and winter/spring P 2 E (Figs. 3e and 4). Notably,
over the Iberian Peninsula (and northwestern Africa, outside
of our domain), E is even projected to decline during MAM.
This suggests that soil moisture constraints on E will in the
future already be felt during spring, and that soil moisture
depletion will occur earlier in the year.
By contrast, the fact that, over the northern half of the do-
main, summerE remains constant in future projections (Fig. 5f),
despite lower P and soil moisture, is evidence that soil moisture
feedbacks play a limited role there. Water saturation at the
surface decreases, but likely remains high enough, combined
with the enhanced evaporative demand in a warmer and drier
climate, tomaintainE at its historical value. TheP2E decline is
driven by the decline in P. Future summer P 2 E becomes
clearly negative (as opposed to a historical value close to 0;
Fig. 3a), a change sustained by enhanced depletion of soil
moisture. This suggests that land–atmosphere coupling will
strengthen over the northern half of the domain, as summer
climate becomes increasingly reliant on cold-season accumu-
lated soil moisture.
Still, it should be noted that CMIP5 GCMs may overesti-
mate the strength of soil moisture–precipitation feedbacks due
to their coarse resolution (Hohenegger et al. 2009). Biases in
cloud parameterization or in the effect of anthropogenic
aerosols in GCMs could also matter, and explain in particular
why regional simulations may exhibit weaker warming and
drying trends than their driving GCMs (Boé et al. 2020a).
c. Future trends in summer circulation
Section 5 showed that future summer circulation trends
strongly constrained changes in zonal moisture advection, thus
impacting the future European domain moisture budget.
First, positive SLP anomalies over the North Atlantic are
thought to result from the weak SST warming trends in the
region, also known as the North Atlantic warming hole
(NAWH). The NAWH is believed to follow from a slowdown
of the Atlantic meridional overturning circulation, although
other forcings are not to be excluded (Hu and Fedorov 2020).
Numerical simulations in which global climate models were
forced with negative SST anomalies mimicking the NAWH
exhibited an SLP response generally consistent in pattern and
magnitude with the projected CMIP5 multimodel average
(Fig. 11a) (Haarsma et al. 2015; Gervais et al. 2019). Still, the
SLP response to the NAWH has only been analyzed in single-
GCM experiments with one NAWH-like SST anomaly pattern
only. Consequently, we still do not know what fraction of the
spread in SLP trends across CMIP5 GCMs could be related to
differences in NAWH trends themselves, or in the response to
the NAWH itself. This is all the more difficult to determine as
the NAWH SLP response resembles the positive phase of the
summer NAO, changes in which also influence mean JJA SLP
(Bladé et al. 2012). In particular, it remains unclear why some
GCMswould project SLP increases over Scandinavia (Fig. 11b).
Second, negative SLP trends over the Mediterranean region
have been shown to result from a heat low phenomenon: as the
intense surface warming, caused by the decrease in summer
precipitation, extends into the lower troposphere, it triggers an
overall cyclonic anomaly around the area (Haarsma et al.
2009). This is in sharp contrast with winter and spring trends
(Fig. 6a; see also Fig. S3a). Indeed, land surface warming
around the Mediterranean is by far largest during summer
(Lionello and Scarascia 2018). In addition, near-surface static
stability over land is lowest during summer (Fig. S5), thus fa-
voring the upward propagation of the surface warming and the
associated circulation response. By contrast, in winter, near-
surface static stability is large over land, but low over the
Mediterranean Sea. This explains why the relative SST cooling
spreads upward into the lower troposphere during winter only,
generating an anomalous SLP ridge (Tuel et al. 2021b).
d. Summer RH and precipitation
Our focus here has been primarily on moisture fluxes and
near-surface RH, instead of precipitation. This is in part
physically motivated (e.g., since dynamics act on precipitation
through their effect on themoisture budget) but is also because
CMIP5 models are known to differ widely in their represen-
tation of feedbacks between atmospheric humidity, clouds, and
surface processes. Indeed, differences in the representation of
land–atmosphere coupling, notably cloud feedbacks, were
found to be related to uncertainties in projections of summer
precipitation across global and regional climate models (Boéand Terray 2014), with evidence pointing toward noticeable
model deficiencies likely impacting future projections (Boberg
and Christensen 2012; Orth et al. 2016; Boé et al. 2020a,b). Thisadded uncertainty might therefore complicate the analysis of
intermodel scatter. We show in Fig. 13a interannual variability
in summer precipitation and 850-hPa RH across observational,
reanalysis, and CMIP5 data. It is striking to observe that the
CMIP5 models neatly divide themselves into two groups with
similar precipitation–RH relationships, one consistent with
ERA5 and various precipitation datasets and the other not. In
addition, CMIP5 models vary widely in their mean summer
climate, in particular in average 850-hPa RH. This matters
because the precipitation–RH relationship is not linear, pre-
cipitation being less sensitive to RH variability as mean RH
decreases (Fig. 13a). This leads to poor correlation between
JJA RH and precipitation changes in CMIP5 projections
8928 JOURNAL OF CL IMATE VOLUME 34
Brought to you by MIT LIBRARIES | Unauthenticated | Downloaded 10/15/21 11:48 AM UTC
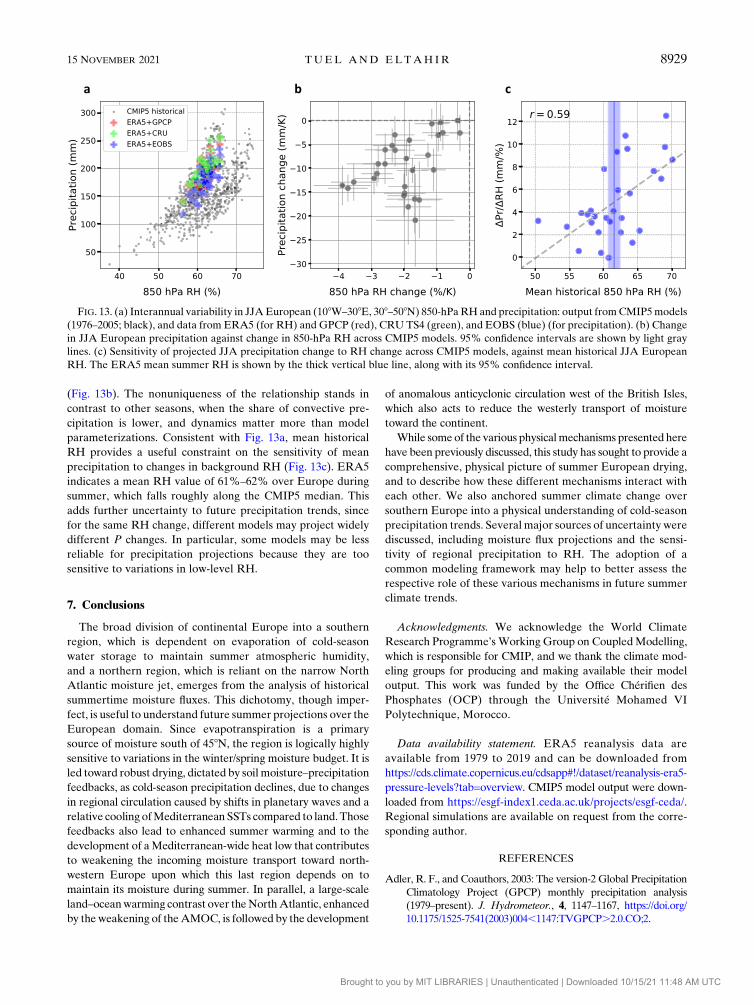
(Fig. 13b). The nonuniqueness of the relationship stands in
contrast to other seasons, when the share of convective pre-
cipitation is lower, and dynamics matter more than model
parameterizations. Consistent with Fig. 13a, mean historical
RH provides a useful constraint on the sensitivity of mean
precipitation to changes in background RH (Fig. 13c). ERA5
indicates a mean RH value of 61%–62% over Europe during
summer, which falls roughly along the CMIP5 median. This
adds further uncertainty to future precipitation trends, since
for the same RH change, different models may project widely
different P changes. In particular, some models may be less
reliable for precipitation projections because they are too
sensitive to variations in low-level RH.
7. Conclusions
The broad division of continental Europe into a southern
region, which is dependent on evaporation of cold-season
water storage to maintain summer atmospheric humidity,
and a northern region, which is reliant on the narrow North
Atlantic moisture jet, emerges from the analysis of historical
summertime moisture fluxes. This dichotomy, though imper-
fect, is useful to understand future summer projections over the
European domain. Since evapotranspiration is a primary
source of moisture south of 458N, the region is logically highly
sensitive to variations in the winter/spring moisture budget. It is
led toward robust drying, dictated by soil moisture–precipitation
feedbacks, as cold-season precipitation declines, due to changes
in regional circulation caused by shifts in planetary waves and a
relative cooling ofMediterranean SSTs compared to land.Those
feedbacks also lead to enhanced summer warming and to the
development of aMediterranean-wide heat low that contributes
to weakening the incoming moisture transport toward north-
western Europe upon which this last region depends on to
maintain its moisture during summer. In parallel, a large-scale
land–oceanwarming contrast over theNorthAtlantic, enhanced
by theweakening of theAMOC, is followed by the development
of anomalous anticyclonic circulation west of the British Isles,
which also acts to reduce the westerly transport of moisture
toward the continent.
While someof the various physicalmechanisms presented here
have been previously discussed, this study has sought to provide a
comprehensive, physical picture of summer European drying,
and to describe how these different mechanisms interact with
each other. We also anchored summer climate change over
southern Europe into a physical understanding of cold-season
precipitation trends. Severalmajor sources of uncertainty were
discussed, including moisture flux projections and the sensi-
tivity of regional precipitation to RH. The adoption of a
common modeling framework may help to better assess the
respective role of these various mechanisms in future summer
climate trends.
Acknowledgments. We acknowledge the World Climate
Research Programme’s Working Group on CoupledModelling,
which is responsible for CMIP, and we thank the climate mod-
eling groups for producing and making available their model
output. This work was funded by the Office Chérifien des
Phosphates (OCP) through the Université Mohamed VI
Polytechnique, Morocco.
Data availability statement. ERA5 reanalysis data are
available from 1979 to 2019 and can be downloaded from
https://cds.climate.copernicus.eu/cdsapp#!/dataset/reanalysis-era5-
pressure-levels?tab=overview. CMIP5 model output were down-
loaded from https://esgf-index1.ceda.ac.uk/projects/esgf-ceda/.
Regional simulations are available on request from the corre-
sponding author.
REFERENCES
Adler, R. F., and Coauthors, 2003: The version-2 Global Precipitation
Climatology Project (GPCP) monthly precipitation analysis
(1979–present). J. Hydrometeor., 4, 1147–1167, https://doi.org/
10.1175/1525-7541(2003)004,1147:TVGPCP.2.0.CO;2.
FIG. 13. (a) Interannual variability in JJAEuropean (108W–308E, 308–508N) 850-hPaRH and precipitation: output fromCMIP5models
(1976–2005; black), and data from ERA5 (for RH) and GPCP (red), CRU TS4 (green), and EOBS (blue) (for precipitation). (b) Change
in JJA European precipitation against change in 850-hPa RH across CMIP5 models. 95% confidence intervals are shown by light gray
lines. (c) Sensitivity of projected JJA precipitation change to RH change across CMIP5 models, against mean historical JJA European
RH. The ERA5 mean summer RH is shown by the thick vertical blue line, along with its 95% confidence interval.
15 NOVEMBER 2021 TUEL AND ELTAH IR 8929
Brought to you by MIT LIBRARIES | Unauthenticated | Downloaded 10/15/21 11:48 AM UTC
Bador, M., L. Terray, and J. Boé, 2016: Emergence of human in-
fluence on summer record–breaking temperatures over Europe.
Geophys. Res. Lett., 43, 404–412, https://doi.org/10.1002/
2015GL066560.
Belleflamme, A., X. Fettweis, and M. Erpicum, 2015: Do global
warming–induced circulation pattern changes affect temper-
ature and precipitation over Europe during summer? Int.
J. Climatol., 35, 1484–1499, https://doi.org/10.1002/joc.4070.
Bladé, I., D. Fortuny, G. J. van Oldenborgh, and B. Liebmann,
2012: The summer North Atlantic Oscillation in CMIP3
models and related uncertainties in projected summer drying
in Europe. J. Geophys. Res. Atmos., 117, D16104, https://
doi.org/10.1029/2012JD017816.
Boberg, F., and J. H. Christensen, 2012: Overestimation of
Mediterranean summer temperature projections due tomodel
deficiencies. Nat. Climate Change, 2, 433–436, https://doi.org/
10.1038/nclimate1454.
Boé, J., and L. Terray, 2014: Land–sea contrast, soil-atmosphere
and cloud-temperature interactions: Interplays and roles in
future summer European climate change. Climate Dyn., 42,
683–699, https://doi.org/10.1007/s00382-013-1868-8.
——, ——, C. Cassou, and J. Najac, 2009: Uncertainties in
European summer precipitation changes: Role of large scale
circulation. Climate Dyn., 33, 265–276, https://doi.org/10.1007/
s00382-008-0474-7.
——, S. Somot, L. Corre, and P. Nabat, 2020a: Large discrepancies
in summer climate change over Europe as projected by global
and regional climate models: Causes and consequences.
Climate Dyn., 54, 2981–3002, https://doi.org/10.1007/s00382-
020-05153-1.
——, and Coauthors, 2020b: Past long-term summer warming over
western Europe in new generation climate models: Role of
large-scale atmospheric circulation. Environ. Res. Lett., 15,
084038, https://doi.org/10.1088/1748-9326/ab8a89.
Brogli, R., S. L. Sørland, N. Kröner, and C. Schär, 2019: Causes offuture Mediterranean precipitation decline depend on the
season.Environ. Res. Lett., 14, 114017, https://doi.org/10.1088/
1748-9326/ab4438.
Byrne, M. P., and P. A. O’Gorman, 2018: Trends in continental
temperature and humidity directly linked to ocean warming.
Proc. Natl. Acad. Sci. USA, 115, 4863–4868, https://doi.org/
10.1073/pnas.1722312115.
Cornes, R. C., G. van der Schrier, E. J. M. van den Besselaar, and
P. D. Jones, 2018: An ensemble version of the E-OBS tem-
perature and precipitation data sets. J. Geophys. Res. Atmos.,
123, 9391–9409, https://doi.org/10.1029/2017JD028200.
Dong, B., R. T. Sutton, T.Woollings, andK.Hodges, 2013: Variability
of the North Atlantic summer storm track: Mechanisms and
impacts on European climate. Environ. Res. Lett., 8, 034037,
https://doi.org/10.1088/1748-9326/8/3/034037.
Eltahir, E. A. B., 1998: A soil moisture–rainfall feedback mecha-
nism: 1. Theory and observations.Water Resour. Res., 34, 765–
776, https://doi.org/10.1029/97WR03499.
Fischer, E. M., S. I. Seneviratne, P. L. Vidale, D. Lüthi, and
C. Schär, 2007: Soil moisture–atmosphere interactions during
the 2003 European summer heat wave. J. Climate, 20, 5081–
5099, https://doi.org/10.1175/JCLI4288.1.
Gervais,M., J. Shaman, andY. Kushnir, 2019: Impacts of theNorth
Atlantic warming hole in future climate projections: Mean
atmospheric circulation and the North Atlantic jet. J. Climate,
32, 2673–2689, https://doi.org/10.1175/JCLI-D-18-0647.1.
Grillakis, M. G., 2019: Increase in severe and extreme soil
moisture droughts for Europe under climate change. Sci.
Total Environ., 660, 1245–1255, https://doi.org/10.1016/
j.scitotenv.2019.01.001.
Gruber, A., T. Scanlon, R. van der Schalie, W. Wagner, and
W. Dorigo, 2019: Evolution of the ESA CCI soil moisture
climate data records and their underlying merging method-
ology. Earth Syst. Sci. Data, 11, 717–739, https://doi.org/
10.5194/essd-11-717-2019.
Haarsma,R. J., F. Selten,B. vandenHurk,W.Hazeleger, andX.Wang,
2009: Drier Mediterranean soils due to greenhouse warming bring
easterly winds over summertime central Europe. Geophys. Res.
Lett., 36, L04705, https://doi.org/10.1029/2008GL036617.
——, ——, and S. S. Drijfhout, 2015: Decelerating Atlantic me-
ridional overturning circulation main cause of future west
European summer atmospheric circulation changes. Environ.
Res. Lett., 10, 094007, https://doi.org/10.1088/1748-9326/10/9/
094007.
Harris, I., T. J. Osborn, P. Jones, and D. Lister, 2020: Version 4 of
the CRU TS monthly high-resolution gridded multivariate
climate dataset. Sci. Data, 7, 109, https://doi.org/10.1038/
s41597-020-0453-3.
Hersbach, H., and Coauthors, 2020: The ERA5 global reanalysis.
Quart. J. Roy. Meteor. Soc., 146, 1999–2049, https://doi.org/
10.1002/qj.3803.
Hohenegger, C., P. Brockhaus, C. S. Bretherton, and C. Schär,2009: The soil moisture–precipitation feedback in simulations
with explicit and parameterized convection. J. Climate, 22,
5003–5020, https://doi.org/10.1175/2009JCLI2604.1.
Hu, S., and A. V. Fedorov, 2020: Indian Ocean warming as a driver
of the North Atlantic warming hole. Nat. Commun., 11, 4785,
https://doi.org/10.1038/s41467-020-18522-5.
Im, E. S., R. L. Gianotti, and E. A. B. Eltahir, 2014: Improving
the simulation of the West African monsoon using the MIT
regional climate model. J. Climate, 27, 2209–2229, https://
doi.org/10.1175/JCLI-D-13-00188.1.
Kew, S., S. Y. Philip, G. Jan van Oldenborgh, G. van der Schrier,
F. E. L. Otto, and R. Vautard, 2019: The exceptional summer
heat wave in southern Europe 2017. Bull. Amer. Meteor. Soc.,
100 (1), S49–S53, https://doi.org/10.1175/BAMS-D-18-0109.1.
Knist, S., and Coauthors, 2017: Land–atmosphere coupling in
EURO-CORDEX evaluation experiments. J. Geophys. Res.
Atmos., 122, 79–103, https://doi.org/10.1002/2016JD025476.
Lionello, P., and L. Scarascia, 2018: The relation between climate
change in the Mediterranean region and global warming.
Reg. Environ. Change, 18, 1481–1493, https://doi.org/10.1007/
s10113-018-1290-1.
Mueller, B., and S. I. Seneviratne, 2012: Hot days induced by pre-
cipitation deficits at the global scale.Proc. Natl. Acad. Sci. USA,
109, 12 398–12 403, https://doi.org/10.1073/pnas.1204330109.
Orth, R., and S. I. Seneviratne, 2017: Variability of soil moisture
and sea surface temperatures similarly important for warm-
season land climate in the Community Earth System Model.
J. Climate, 30, 2141–2162, https://doi.org/10.1175/JCLI-D-15-
0567.1.
——, J. Zscheischler, and S. I. Seneviratne, 2016: Record dry
summer in 2015 challenges precipitation projections in
Central Europe. Sci. Rep., 6, 28334, https://doi.org/10.1038/
srep28334.
Pal, J. S., and Coauthors, 2007: Regional climate modeling for the
developing world: The ICTP RegCM3 and RegCNET. Bull.
Amer. Meteor. Soc., 88, 1395–1410, https://doi.org/10.1175/
BAMS-88-9-1395.
Quesada, B., R. Vautard, P. Yiou,M.Hirschi, and S. I. Seneviratne,
2012: Asymmetric European summer heat predictability from
8930 JOURNAL OF CL IMATE VOLUME 34
Brought to you by MIT LIBRARIES | Unauthenticated | Downloaded 10/15/21 11:48 AM UTC
wet and dry southern winters and springs. Nat. Climate
Change, 2, 736–741, https://doi.org/10.1038/nclimate1536.
Rodwell, M. J., andB. J. Hoskins, 2001: Subtropical anticyclones and
summer monsoons. J. Climate, 14, 3192–3211, https://doi.org/10.1175/1520-0442(2001)014,3192:SAASM.2.0.CO;2.
Rowell, D. P., and R. G. Jones, 2006: Causes and uncertainty of
future summer drying over Europe.ClimateDyn., 27, 281–299,
https://doi.org/10.1007/s00382-006-0125-9.
Samaniego, L., and Coauthors, 2018: Anthropogenic warming
exacerbates European soil moisture droughts. Nat. Climate
Change, 8, 421–426, https://doi.org/10.1038/s41558-018-0138-5.
Sandler, D., and N. Harnik, 2020: Future wintertime meridional
wind trends through the lens of subseasonal teleconnections.
Wea. Climate Dyn., 1, 427–443, https://doi.org/10.5194/wcd-1-
427-2020.
Schär, C., P. L. Vidale, D. Lüthi, C. Frei, C. Häberli, M. A. Liniger,
and C. Appenzeller, 2004: The role of increasing temperature
variability in European summer heatwaves. Nature, 427, 332–
336, https://doi.org/10.1038/nature02300.
Seager, R., H. Liu, N. Henderson, I. R. Simpson, C. Kelley,
T. Shaw, Y. Kushnir, and M. Ting, 2014: Causes of increasing
aridification of the Mediterranean region in response to rising
greenhouse gases. J. Climate, 27, 4655–4676, https://doi.org/10.1175/JCLI-D-13-00446.1.
Seneviratne, S. I., D. Lüthi, M. Litschi, and C. Schär, 2006: Land–atmosphere coupling and climate change in Europe. Nature,
443, 205–209, https://doi.org/10.1038/nature05095.
——, T. Corti, E. L. Davin, M. Hirschi, E. B. Jaeger, I. Lehner,
B. Orlowsky, andA. J. Teuling, 2010: Investigating soil moisture–
climate interactions in a changing climate: A review. Earth-Sci.
Rev., 99, 125–161, https://doi.org/10.1016/j.earscirev.2010.02.004.
Simpson, I. R., R. Seager,M. Ting, and T. A. Shaw, 2016: Causes of
change in Northern Hemisphere winter meridional winds and
regional hydroclimate. Nat. Climate Change, 6, 65–70, https://doi.org/10.1038/nclimate2783.
Stott, P. A., D.A. Stone, andM.R.Allen, 2004: Human contribution
to the European heatwave of 2003.Nature, 432, 610–614, https://doi.org/10.1038/nature03089.
Sutton, R. T., B. Dong, and J. M. Gregory, 2007: Land/sea warming
ratio in response to climate change: IPCC AR4 model results
and comparison with observations. Geophys. Res. Lett., 34,
L02701, https://doi.org/10.1029/2006GL028164.
Taylor, K. E., R. J. Stouffer, andG.A.Meehl, 2012:An overview of
CMIP5 and the experiment design. Bull. Amer. Meteor. Soc.,
93, 485–498, https://doi.org/10.1175/BAMS-D-11-00094.1.
Tuel, A., and E. A. B. Eltahir, 2020: Why is the Mediterranean a
climate change hot spot? J. Climate, 33, 5829–5843, https://
doi.org/10.1175/JCLI-D-19-0910.1.
——, S. Kang, and E. A. B. Eltahir, 2021a: Understanding climate
change over the southwestern Mediterranean using high-
resolution simulations. Climate Dyn., 56, 985–1001, https://
doi.org/10.1007/s00382-020-05516-8.
——, P. A. O’Gorman, and E. A. B. Eltahir, 2021b: Elements of the
dynamical response to climate change over the Mediterranean.
J. Climate, 34, 1135–1146, https://doi.org/10.1175/JCLI-D-20-
0429.1.
Vautard, R., and Coauthors, 2007: Summertime European heat
and drought waves induced by wintertime Mediterranean
rainfall deficit.Geophys. Res. Lett., 34, L07711, https://doi.org/10.1029/2006GL028001.
——, and Coauthors, 2020: Human contribution to the record-
breaking June and July 2019 heatwaves in Western Europe.
Environ. Res. Lett., 15, 094077, https://doi.org/10.1088/1748-9326/aba3d4.
Wang, G., A. J. Dolman, and A. Alessandri, 2011: A summer cli-
mate regime over Europe modulated by the North Atlantic
Oscillation.Hydrol. Earth Syst. Sci., 15, 57–64, https://doi.org/
10.5194/hess-15-57-2011.
Wilks, D. S., 2016: ‘‘The stippling shows statistically significant grid
points’’: How research results are routinely overstated and
overinterpreted, and what to do about it. Bull. Amer. Meteor.
Soc., 97, 2263–2273, https://doi.org/10.1175/BAMS-D-15-00267.1.
Wills, R. C., R. H. White, and X. J. Levine, 2019: Northern
Hemisphere stationary waves in a changing climate. Curr.
Climate Change Rep., 5, 372–389, https://doi.org/10.1007/
s40641-019-00147-6.
Zappa, G., 2019: Regional climate impacts of future changes in the
mid-latitude atmospheric circulation: A storyline view. Curr.
Climate Change Rep., 5, 358–371, https://doi.org/10.1007/
s40641-019-00146-7.
15 NOVEMBER 2021 TUEL AND ELTAH IR 8931
Brought to you by MIT LIBRARIES | Unauthenticated | Downloaded 10/15/21 11:48 AM UTC
![Mechanisms of Bonding Effected by Nanopar- ticles in ... · and Xiao [2] minimized drying stress and cracking of ZrO 2 coatings during drying by adding sub-µm or µm particles to](https://img.pdfslide.net/doc/110x75/6060465131c3cc46af357dff/mechanisms-of-bonding-effected-by-nanopar-ticles-in-and-xiao-2-minimized.jpg)