Embed Size (px)
Citation preview

Standard Eurobarometer 80
Autumn 2013
MEDIA USE IN THE
EUROPEAN UNION
REPORT
Fieldwork: November 2013
This survey has been requested and co-ordinated by the European Commission,
Directorate-General for Communication.
http://ec.europa.eu/public_opinion/index_en.htm
This document does not represent the point of view of the European Commission. The interpretations and opinions contained in it are solely those of the authors.
Standard Eurobarometer 80 / Autumn 2013 – TNS opinion & social
Standard Eurobarometer 80 Autumn 2013
Media use
in the European Union
Survey conducted by TNS Opinion & Social at the request of
the European Commission, Directorate-General for Communication
Survey co-ordinated by the European Commission, Directorate-General for Communication (DG COMM "Strategy, Corporate Communication Actions and Eurobarometer" Unit)

STANDARD EUROBAROMETER 80 MEDIA USE – AUTUMN 2013
1
TABLE OF CONTENTS
INTRODUCTION .................................................................................................. 2
I. MEDIA USE AND TRUST IN THE MEDIA ...................................................... 5
1. MEDIA USE ................................................................................................... 5
2. TRUST IN THE MEDIA .................................................................................... 18
II. INFORMATION ON EUROPEAN MATTERS ................................................. 33
III. SOURCES OF NEWS ON POLITICAL MATTERS AND
THE EUROPEAN UNION ..................................................................................... 37
1. NATIONAL POLITICAL MATTERS ....................................................................... 37
2. EUROPEAN POLITICAL MATTERS ....................................................................... 41
3. THE ACTIVE SEARCH FOR INFORMATION ON THE EUROPEAN UNION .......................... 46
4. MEDIA COVERAGE OF THE EUROPEAN UNION ...................................................... 49
IV. SOCIAL NETWORKS ................................................................................. 61
ANNEXES
Technical specifications
STANDARD EUROBAROMETER 80 MEDIA USE – AUTUMN 2013
2
INTRODUCTION
The Standard Eurobarometer 80 survey was conducted between 2 and 17 November
20131 in 34 countries or territories: the European Union's 28 Member States2, the five
candidate countries (the former Yugoslav Republic of Macedonia, Turkey, Iceland,
Montenegro and Serbia), and in the Turkish Cypriot community in the part of the country
that is not controlled by the government of the Republic of Cyprus.
This report examines the media use by Europeans, their views regarding how informed
they are about the European Union and the changes observed in these areas since
autumn 2012 (Standard Eurobarometer 783 survey).
For the record, the Standard Eurobarometer survey of autumn 2012 (EB78) had shown
an increase in the use of the Internet and social networks by Europeans. We also
observed an increase in television viewing by Europeans, but this coincided with a decline
in trust in the media.
This report will successively examine:
- Europeans' media use;
- Their trust in the various media, and the credibility of various sources of
information available on the Internet;
- How well-informed Europeans feel that they and their fellow citizens are on
European matters;
- Preferred information sources for national and European affairs, and for finding
information on the European Union;
- Public opinion of how the European Union is covered in the national media: does it
receive too much or not enough coverage? Is the coverage too positive, too
negative, or objective?
- Expectations in terms of Internet sources of information on the European Union;
- Opinions of social networks and what they contribute to political information and
the relationship that citizens have with politics.
1 Please refer to the technical specifications for the exact dates of the interviews in each country. 2 This is the first Standard Eurobarometer since Croatia joined the EU on 1 July 2013. The results presented in this report therefore represent the weighted average of the 28 Member States. 3 http://ec.europa.eu/public_opinion/archives/eb/eb78/eb78_media_en.pdf
STANDARD EUROBAROMETER 80 MEDIA USE – AUTUMN 2013
3
The full Standard Eurobarometer 80 survey report consists of several volumes. The first
volume presents the state of public opinion in the European Union. Four other volumes
present the views of Europeans on other issues: European citizenship, the financial and
economic crisis, the Europe 2020 strategy, and this volume, which is devoted to media
use within the European Union.
The overall analysis and the socio-demographic analyses are based on the average
results within the 28 Member States. This average is weighted to reflect the population of
each Member State. The averages for previous years represent the results obtained
within all the Member States of the European Union as it was composed when the study
was conducted. Some questions were also asked in the European Union candidate
countries and in the Turkish Cypriot community.
The methodology used is that of the Eurobarometer surveys conducted by the
Directorate-General for Communication ("Strategy, Corporate Communication Actions
and Eurobarometer" Unit)4. A technical note describing how the interviews are conducted
by the TNS Opinion & Social network's institutes is appended to this report. This note
also indicates the confidence intervals5.
4 http://ec.europa.eu/public_opinion/index_en.htm 5 The results tables are included in the appendices. It should be noted that the sums of the percentages shown in the tables in this report may exceed 100% in cases where respondents could choose more than one answer to a question.
STANDARD EUROBAROMETER 80 MEDIA USE – AUTUMN 2013
4
The abbreviations used in this report and their corresponding territories or entities are as
follows:
ABBRÉVIATIONS BE Belgium LV Latvia BG Bulgaria LU Luxembourg CZ Czech Republic HU Hungary DK Denmark MT Malta DE Germany NL Netherlands EE Estonia AT Austria EL Greece PL Poland ES Spain PT Portugal FR France RO Romania
HR Croatia SI Slovenia IE Ireland SK Slovakia IT Italy FI Finland CY Republic of Cyprus* SE Sweden LT Lithuania UK United Kingdom CY (tcc)
Turkish Cypriot community EU28 European Union - weighted average for the 28 Member States
TR Turkey Euro area
BE, FR, IT, LU, DE, AT, ES, PT, IE, NL, FI, EL, EE, SI, CY,
MT, SK
MK Former Yugoslav Republic of Macedonia** Non-euro area
BG, CZ, DK, HR, LV, LT, HU, PL, RO, SE, UK
IS Iceland
ME Montenegro
RS Serbia
* Cyprus as a whole is one of the 28 European Union Member States. However, the "acquis communautaire"
has been suspended in the part of the country that is not controlled by the government of the Republic of
Cyprus. For practical reasons, only the interviews conducted in the part of the country controlled by the
government of the Republic of Cyprus are included in the "CY" category and in the EU28 average. The
interviews conducted in the part of the country not controlled by the government of the Republic of Cyprus are
included in the "CY (tcc)" category [tcc: Turkish Cypriot Community].
** Provisional abbreviation which in no way prejudges the definitive name of this country, which will be agreed
once the current negotiations at the United Nations have been completed.
* * * * *
We wish to thank all the respondents across Europe who took the time to participate in
this survey.
Without their active participation, this study would not have been possible.

STANDARD EUROBAROMETER 80 MEDIA USE – AUTUMN 2013
5
I. MEDIA USE AND TRUST IN THE MEDIA
- Television remains the medium used most by Europeans. Internet use is
increasing. -
1. MEDIA USE
Television is the medium used most by Europeans: 87% say they watch it (either on a
TV set or via the Internet) every day or almost every day (unchanged since the Standard
Eurobarometer survey of autumn 2012, EB78) and 97% at least once a week (no
change)6.
Television is still primarily viewed on a television set, even though Internet television has
gained a little ground: more than nine in ten Europeans say they watch on a TV set at
least once a week (95%, -2 percentage points), while a little less than two in ten say
they do so over the Internet (18%, +1).
6 QE3. Could you tell me to what extent you…? Watch television on a TV set / Watch television via the Internet / Use the Internet / Listen to the radio / Read the written press / Use online social networks

STANDARD EUROBAROMETER 80 MEDIA USE – AUTUMN 2013
6
A large majority of Europeans say they watch television every day or almost regardless
of age or socio-professional category. However, there are some nuances:
Watching television on a TV set:
- Increases with age: 75% of 15-24 year-olds, 80% of 25-39 year-olds, 86% of 40-
54 year-olds and 93% of those aged 55 and over;
- Is more widespread among Europeans who left school at the age of 15 or earlier
(94%) than among those who studied until the age of 20 and beyond (81%);
- Students are least likely to watch television on a TV set every day or almost
(71%);
- Television viewing on a TV set does not vary according to the financial situation of
the household (85% of Europeans watch TV every day or almost whether or not
they have difficulties paying their bills).
STANDARD EUROBAROMETER 80 MEDIA USE – AUTUMN 2013
7
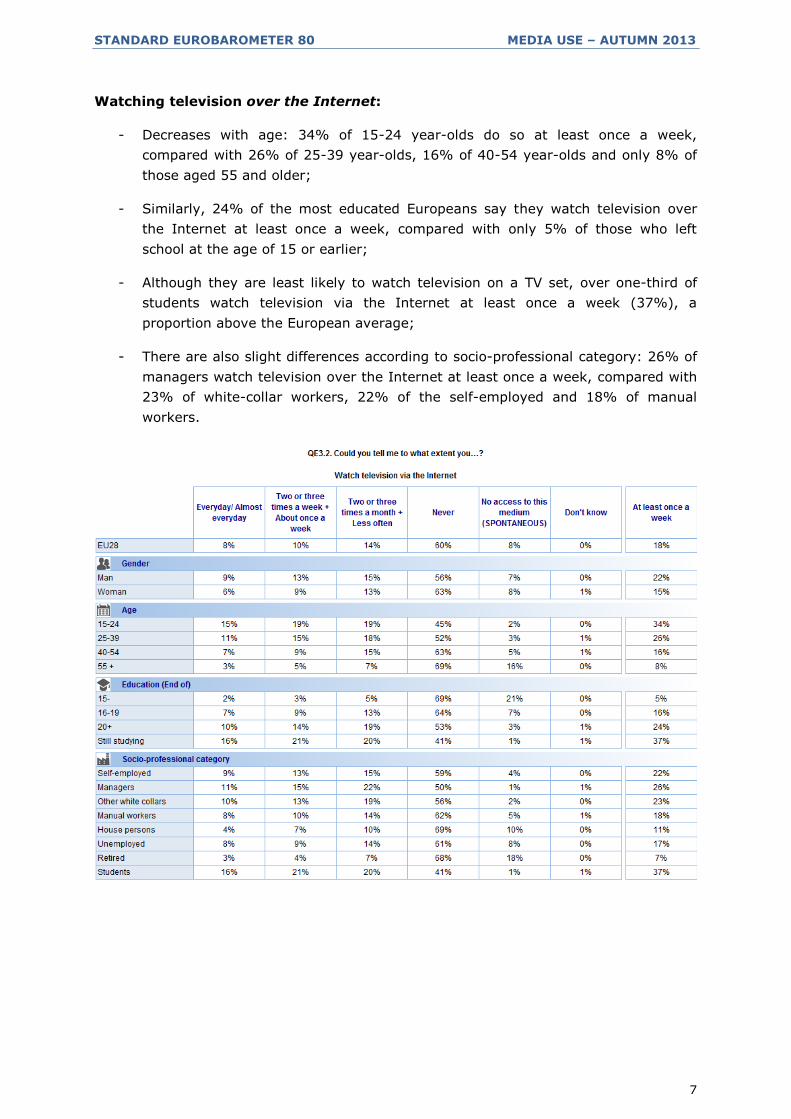
Watching television over the Internet:
- Decreases with age: 34% of 15-24 year-olds do so at least once a week,
compared with 26% of 25-39 year-olds, 16% of 40-54 year-olds and only 8% of
those aged 55 and older;
- Similarly, 24% of the most educated Europeans say they watch television over
the Internet at least once a week, compared with only 5% of those who left
school at the age of 15 or earlier;
- Although they are least likely to watch television on a TV set, over one-third of
students watch television via the Internet at least once a week (37%), a
proportion above the European average;
- There are also slight differences according to socio-professional category: 26% of
managers watch television over the Internet at least once a week, compared with
23% of white-collar workers, 22% of the self-employed and 18% of manual
workers.
STANDARD EUROBAROMETER 80 MEDIA USE – AUTUMN 2013
8
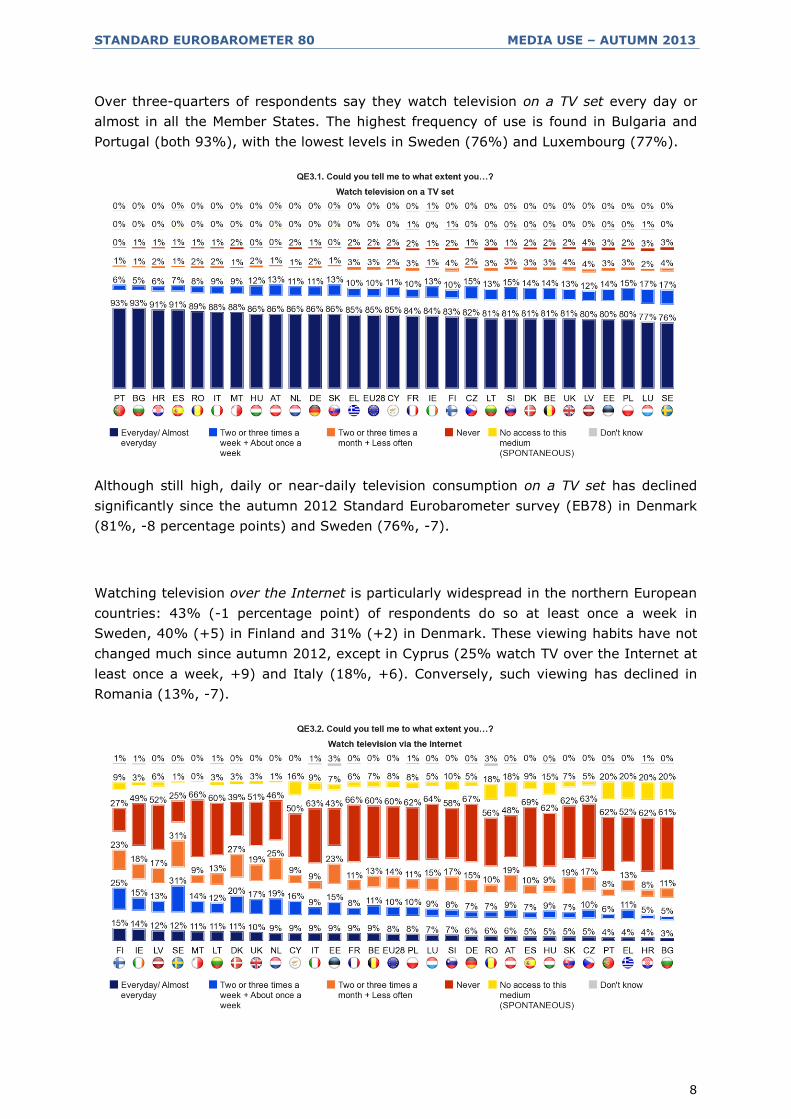
Over three-quarters of respondents say they watch television on a TV set every day or
almost in all the Member States. The highest frequency of use is found in Bulgaria and
Portugal (both 93%), with the lowest levels in Sweden (76%) and Luxembourg (77%).
Although still high, daily or near-daily television consumption on a TV set has declined
significantly since the autumn 2012 Standard Eurobarometer survey (EB78) in Denmark
(81%, -8 percentage points) and Sweden (76%, -7).
Watching television over the Internet is particularly widespread in the northern European
countries: 43% (-1 percentage point) of respondents do so at least once a week in
Sweden, 40% (+5) in Finland and 31% (+2) in Denmark. These viewing habits have not
changed much since autumn 2012, except in Cyprus (25% watch TV over the Internet at
least once a week, +9) and Italy (18%, +6). Conversely, such viewing has declined in
Romania (13%, -7).

STANDARD EUROBAROMETER 80 MEDIA USE – AUTUMN 2013
9
Radio is the second most popular medium accessed at least once a week by Europeans:
half of them say that they listen to it every day or almost. This represents a three-point
decline since the autumn 2012 Eurobarometer (EB78) which had recorded a slight
increase of two points on autumn 2011. In all, 74% (-3) of Europeans say they listen to
the radio at least once a week.
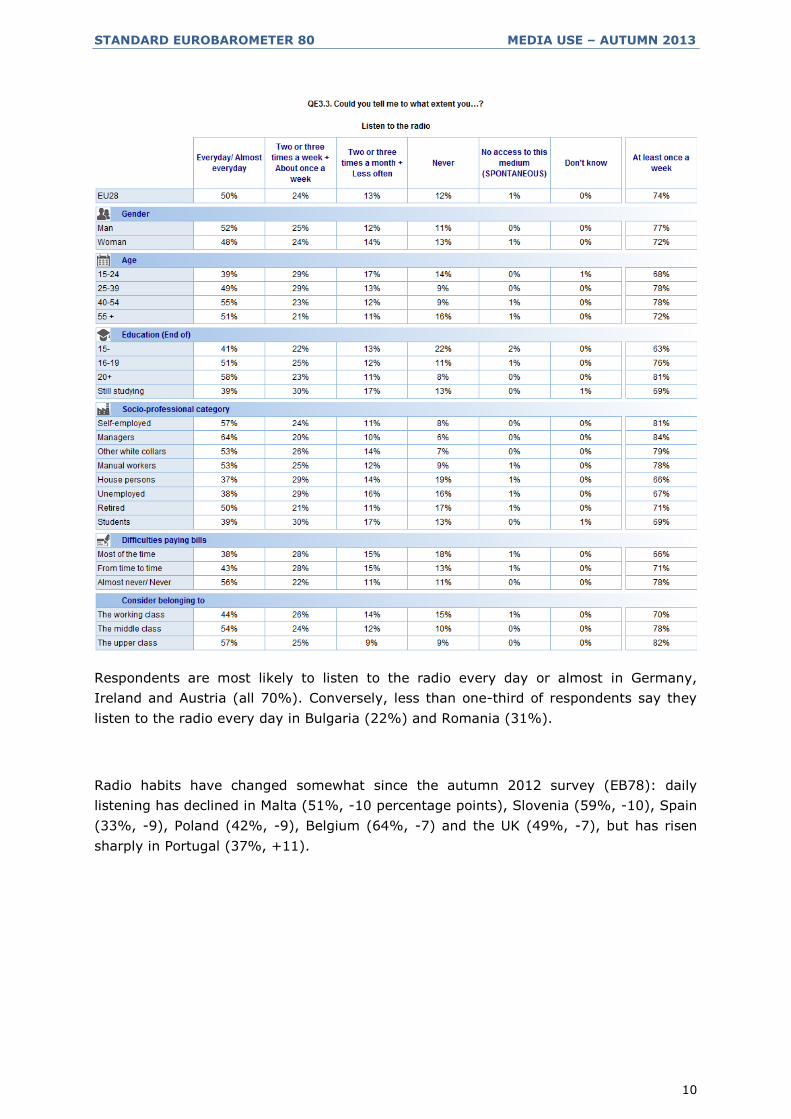
Radio listening varies significantly according to age, education and occupation:
- Although 55% of 40-54 year-olds and 51% of those aged 55 and older listen to
the radio every day or almost, only 39% of 15-24 year-olds do so;
- 58% of Europeans who studied until the age of 20 or beyond listen to the radio
daily or almost, compared with only 41% of those who left school at the age of 15
or before;
- Managers (64%) are more likely to listen to the radio on a daily basis than the
self-employed (57%) or white-collar or manual workers (both 53%), and far more
than the unemployed (38%) and house persons (37%);
- The most notable difference is between Europeans who almost never have
difficulties paying their bills (56%), who use the radio much more than those who
say they usually have difficulties paying their bills (38%).
STANDARD EUROBAROMETER 80 MEDIA USE – AUTUMN 2013
10
Respondents are most likely to listen to the radio every day or almost in Germany,
Ireland and Austria (all 70%). Conversely, less than one-third of respondents say they
listen to the radio every day in Bulgaria (22%) and Romania (31%).
Radio habits have changed somewhat since the autumn 2012 survey (EB78): daily
listening has declined in Malta (51%, -10 percentage points), Slovenia (59%, -10), Spain
(33%, -9), Poland (42%, -9), Belgium (64%, -7) and the UK (49%, -7), but has risen
sharply in Portugal (37%, +11).

STANDARD EUROBAROMETER 80 MEDIA USE – AUTUMN 2013
11
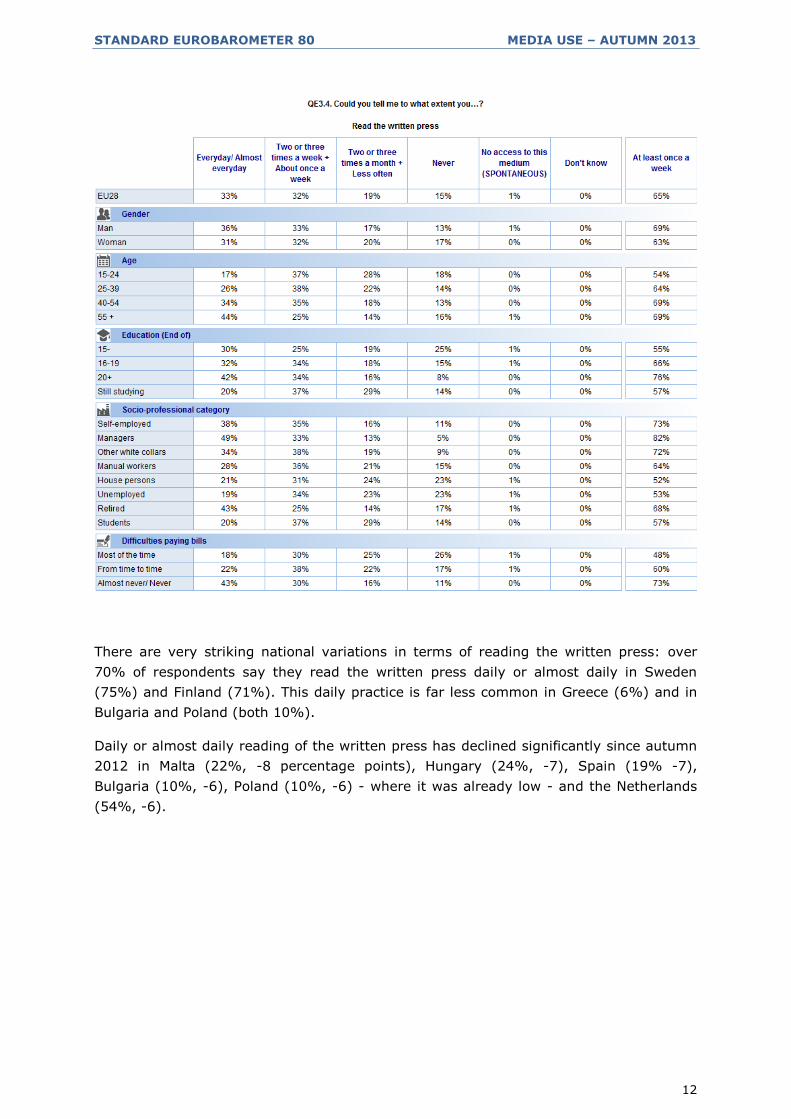
The written press is the medium whose consumption has changed the most since
autumn 2012: today, 65% of Europeans say they read the written press at least once a
week, a decline of six percentage points, and 33% say they do so every day or almost
(-4).
This medium also records significant differences in use by different categories of
Europeans:
- Reading the written press varies widely by age: although 44% of Europeans aged
55 and over say they read the written press every day or almost, only 34% of 40-
54 year-olds, 26% of 25-39 year-olds and 17% of 15-24 year-olds do so;
- The proportion of respondents who read the written press every day or almost is
also higher among managers (49%) than among white-collar workers (34%) or
manual workers (28%). There is also a significant gap between those who almost
never have difficulties paying their bills (43%) and those who often have such
difficulties (18%);
- In virtually all demographic categories, more than half the respondents reported
that they read the written press at least once a week: this is more often the case
among managers (82%), the most educated (76%) and Europeans aged 40 or
older (69%) than among house persons (52%), the unemployed (53%), those
who left school at age 15 or earlier (55%) or the youngest respondents (54%).
Although nearly three-quarters of Europeans who almost never have difficulties
paying their bills read the press at least once a week (73%), less than half of
those who frequently experience financial difficulties do so (48%).
STANDARD EUROBAROMETER 80 MEDIA USE – AUTUMN 2013
12
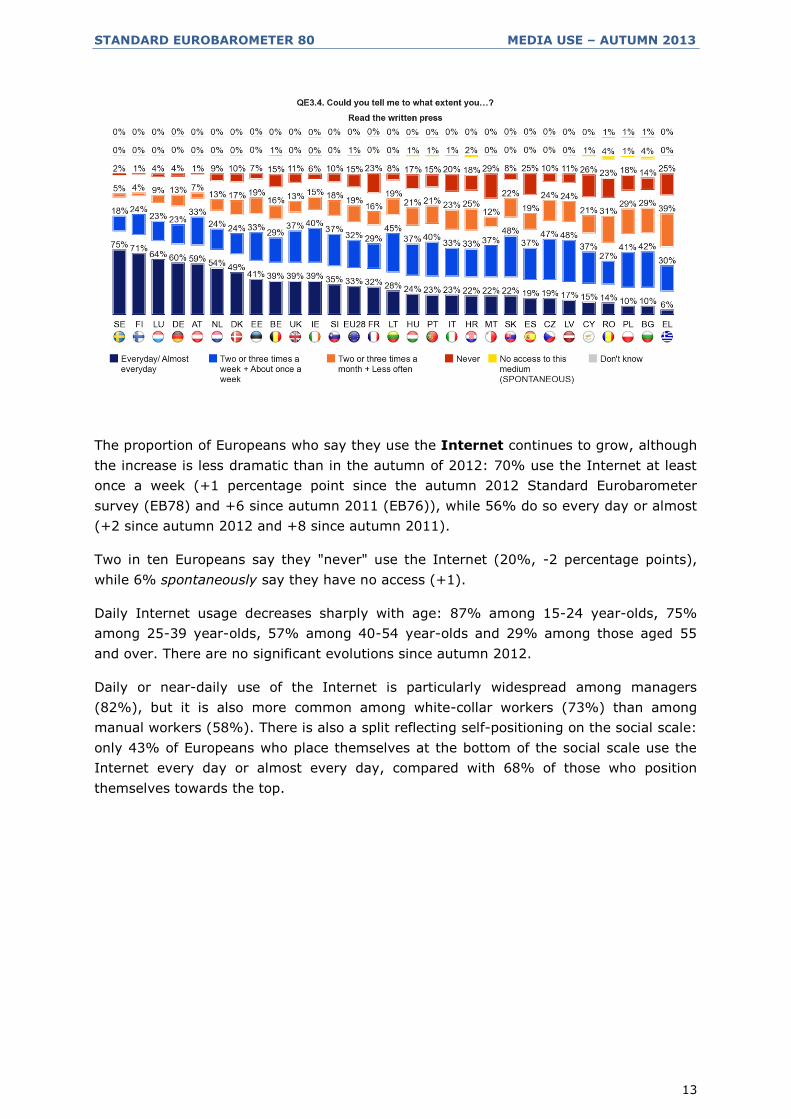
There are very striking national variations in terms of reading the written press: over
70% of respondents say they read the written press daily or almost daily in Sweden
(75%) and Finland (71%). This daily practice is far less common in Greece (6%) and in
Bulgaria and Poland (both 10%).
Daily or almost daily reading of the written press has declined significantly since autumn
2012 in Malta (22%, -8 percentage points), Hungary (24%, -7), Spain (19% -7),
Bulgaria (10%, -6), Poland (10%, -6) - where it was already low - and the Netherlands
(54%, -6).
STANDARD EUROBAROMETER 80 MEDIA USE – AUTUMN 2013
13
The proportion of Europeans who say they use the Internet continues to grow, although
the increase is less dramatic than in the autumn of 2012: 70% use the Internet at least
once a week (+1 percentage point since the autumn 2012 Standard Eurobarometer
survey (EB78) and +6 since autumn 2011 (EB76)), while 56% do so every day or almost
(+2 since autumn 2012 and +8 since autumn 2011).
Two in ten Europeans say they "never" use the Internet (20%, -2 percentage points),
while 6% spontaneously say they have no access (+1).
Daily Internet usage decreases sharply with age: 87% among 15-24 year-olds, 75%
among 25-39 year-olds, 57% among 40-54 year-olds and 29% among those aged 55
and over. There are no significant evolutions since autumn 2012.
Daily or near-daily use of the Internet is particularly widespread among managers
(82%), but it is also more common among white-collar workers (73%) than among
manual workers (58%). There is also a split reflecting self-positioning on the social scale:
only 43% of Europeans who place themselves at the bottom of the social scale use the
Internet every day or almost every day, compared with 68% of those who position
themselves towards the top.

STANDARD EUROBAROMETER 80 MEDIA USE – AUTUMN 2013
14
STANDARD EUROBAROMETER 80 MEDIA USE – AUTUMN 2013
15
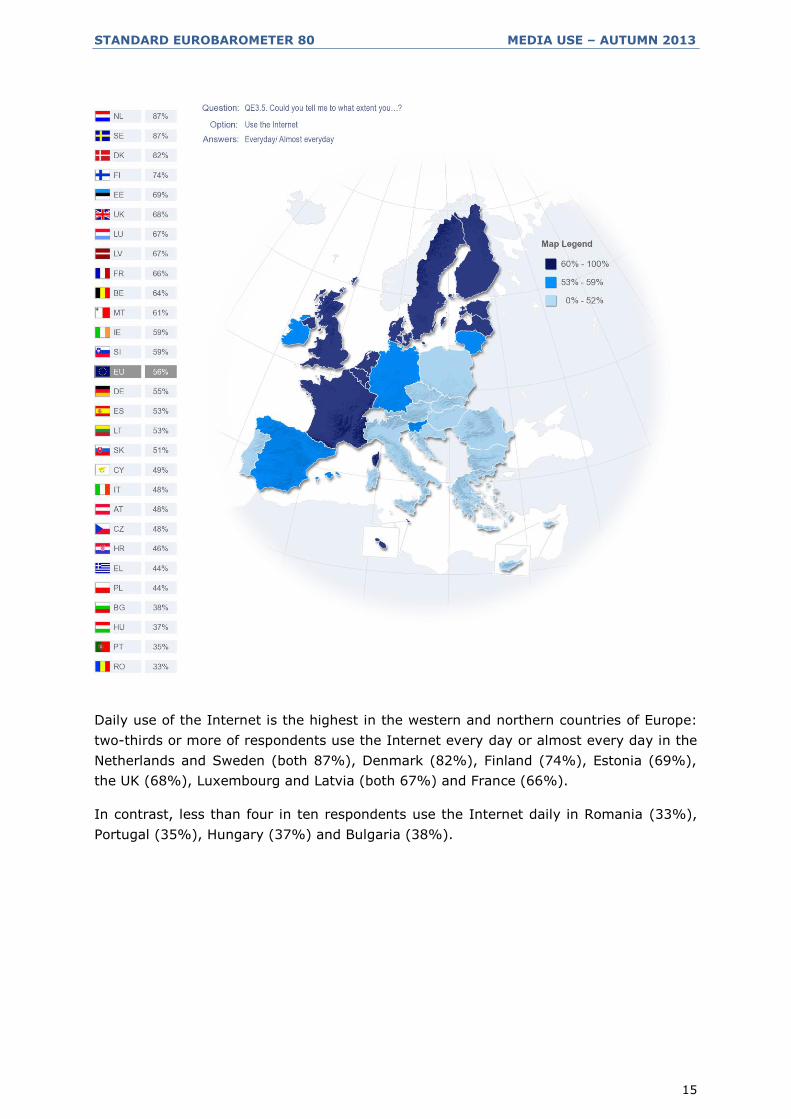
Daily use of the Internet is the highest in the western and northern countries of Europe:
two-thirds or more of respondents use the Internet every day or almost every day in the
Netherlands and Sweden (both 87%), Denmark (82%), Finland (74%), Estonia (69%),
the UK (68%), Luxembourg and Latvia (both 67%) and France (66%).
In contrast, less than four in ten respondents use the Internet daily in Romania (33%),
Portugal (35%), Hungary (37%) and Bulgaria (38%).

STANDARD EUROBAROMETER 80 MEDIA USE – AUTUMN 2013
16
Significant evolutions since autumn 2012 (EB78) include an increase in the daily or
almost daily use of the Internet in Cyprus (49%, +11 percentage points), Slovakia
(51%, +8), Malta (61%, +6, following an 11-point rise between autumn 2011 (EB76)
and autumn 2012), Portugal (35%, +6 since autumn 2012 and +12 since autumn 2011)
and Greece (44%, +6 and +13).
The use of online social networks is also rising within the European Union, although
the evolutions are less marked than they were between autumn 2011 and autumn 2012.
44% of Europeans now say they use social networks at least once a week, an increase of
two percentage points since autumn 2012 and nine points since autumn 2011. Three in
ten Europeans say they frequent social networks every day or almost (30%, +3 and +10
since autumn 2011).
Differences in use according to age are even more pronounced for social networks than
they are for the Internet generally, with virtually no evolutions in the oldest group: 70%
of 15-24 year-olds say they use social networks daily or almost daily
(+4 percentage points since the EB78), compared with 44% of 25-39 year-olds (+4),
24% of 40-54 year-olds (+3) and 7% of those aged 55 and older (+1).
In terms of socio-professional categories, white-collar workers are most likely to say they
use social networks daily or almost daily (38%), ahead of managers (33%) and manual
workers (32%). The gaps between occupational categories are thus narrower than for
Internet use as a whole.
STANDARD EUROBAROMETER 80 MEDIA USE – AUTUMN 2013
17
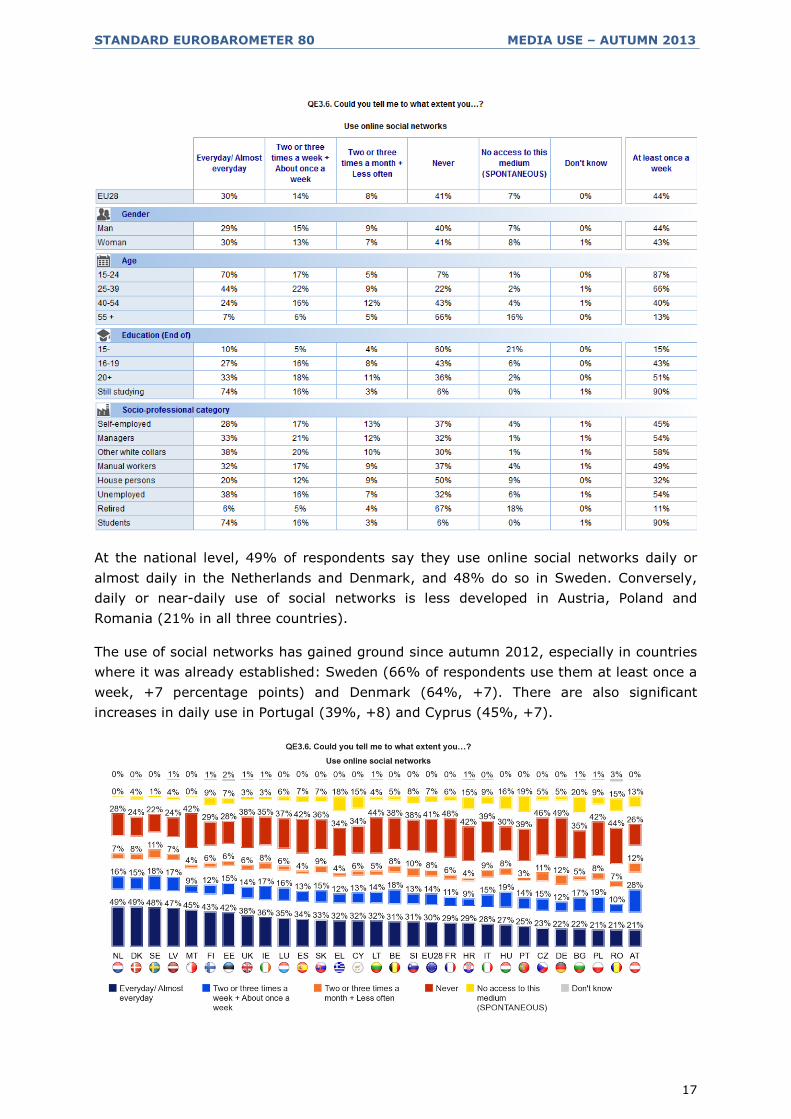
At the national level, 49% of respondents say they use online social networks daily or
almost daily in the Netherlands and Denmark, and 48% do so in Sweden. Conversely,
daily or near-daily use of social networks is less developed in Austria, Poland and
Romania (21% in all three countries).
The use of social networks has gained ground since autumn 2012, especially in countries
where it was already established: Sweden (66% of respondents use them at least once a
week, +7 percentage points) and Denmark (64%, +7). There are also significant
increases in daily use in Portugal (39%, +8) and Cyprus (45%, +7).

STANDARD EUROBAROMETER 80 MEDIA USE – AUTUMN 2013
18
2. TRUST IN THE MEDIA
- Trust in the media remains stable; radio remains the only medium that enjoys
the trust of a majority of Europeans -
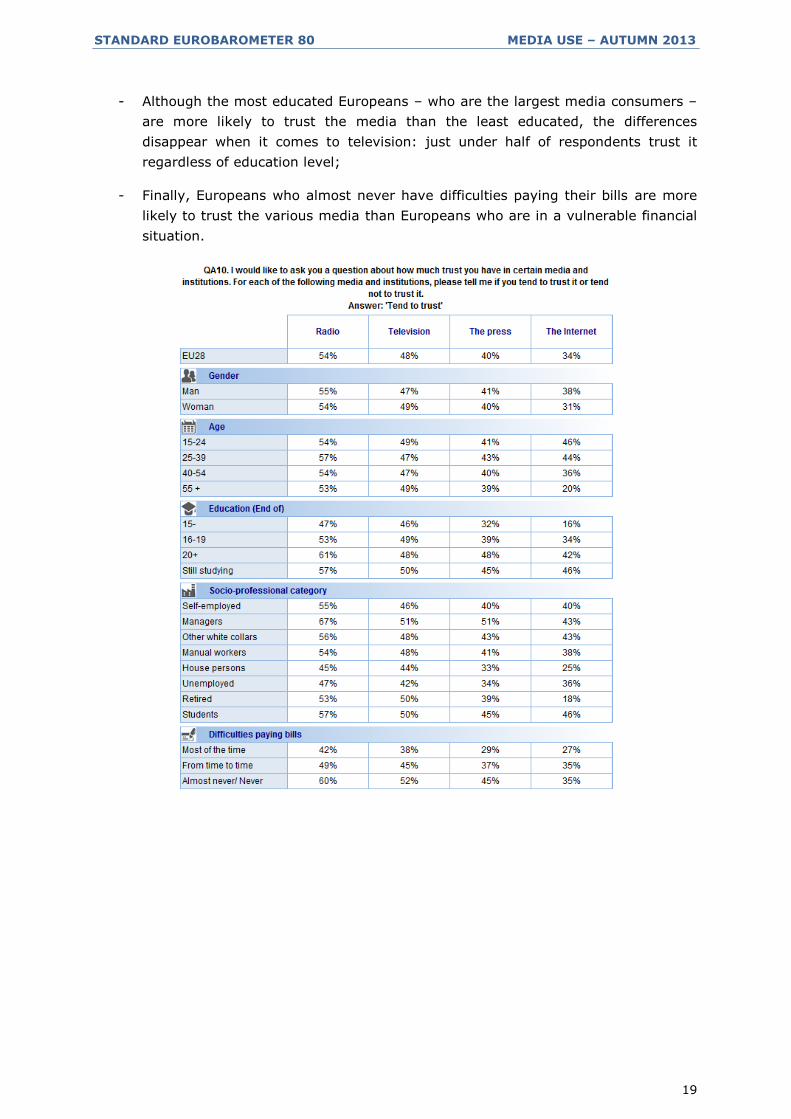
Public trust in the media7 has stabilised somewhat after a deterioration between
autumn 2011 (EB76) and autumn 2012 (EB78). The hierarchy of the media which
Europeans trust most remains unchanged:
- Radio remains the medium
which Europeans trust the
most (54%, unchanged,
compared with 37% "tend
not to trust", -1 percentage
point);
- Television follows, but with
sharply mixed opinions
(48% trust it, unchanged,
compared with 48%, +1);
- Only a minority trust the
written press (41%, +1,
compared with 53%, -1);
- The same applies to the
Internet, where distrust has
even risen slightly (34%, -
1, compared with 46%,
+2).
A socio-demographic analysis shows that:
- Age has little influence on trust in radio, the press and television. In the case of
the Internet, however, trust sharply declines with age, in line with the differences
measured for use: 46% among 15-24 year-olds, who are the main users of the
Internet, 44% among 25-39 year-olds, 36% among 40-54 year-olds and only
20% among those aged 55 and over.
Trust has declined in the categories that use the Internet the most: young
respondents (46%, -3, compared with 48%, +3), and students in particular
(46%, -8, compared with 47%, +6). Due to these changes, distrust is now
expressed by majorities in these categories, whereas this was not the case in the
autumn of 2012;
7 QA10. I would like to ask you a question about how much trust you have in certain media and institutions. For each of the following media and institutions, please tell me if you tend to trust it or tend not to trust it.
STANDARD EUROBAROMETER 80 MEDIA USE – AUTUMN 2013
19
- Although the most educated Europeans – who are the largest media consumers –
are more likely to trust the media than the least educated, the differences
disappear when it comes to television: just under half of respondents trust it
regardless of education level;
- Finally, Europeans who almost never have difficulties paying their bills are more
likely to trust the various media than Europeans who are in a vulnerable financial
situation.
STANDARD EUROBAROMETER 80 MEDIA USE – AUTUMN 2013
20
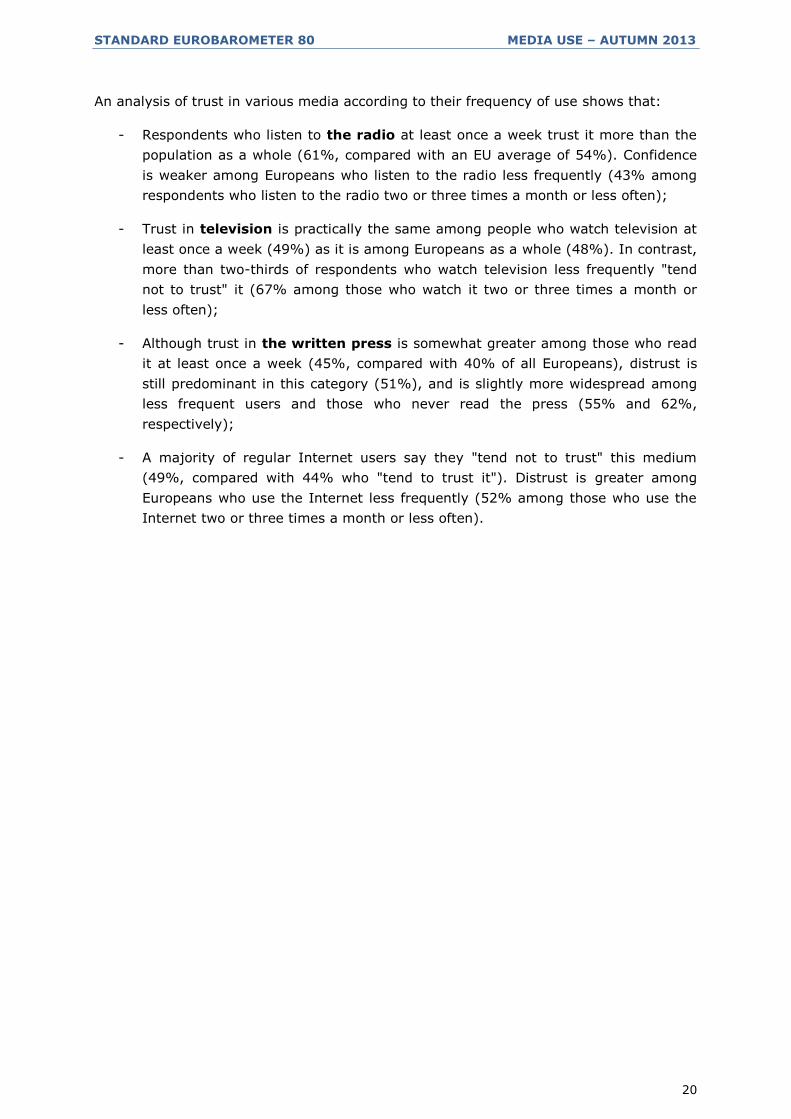
An analysis of trust in various media according to their frequency of use shows that:
- Respondents who listen to the radio at least once a week trust it more than the
population as a whole (61%, compared with an EU average of 54%). Confidence
is weaker among Europeans who listen to the radio less frequently (43% among
respondents who listen to the radio two or three times a month or less often);
- Trust in television is practically the same among people who watch television at
least once a week (49%) as it is among Europeans as a whole (48%). In contrast,
more than two-thirds of respondents who watch television less frequently "tend
not to trust" it (67% among those who watch it two or three times a month or
less often);
- Although trust in the written press is somewhat greater among those who read
it at least once a week (45%, compared with 40% of all Europeans), distrust is
still predominant in this category (51%), and is slightly more widespread among
less frequent users and those who never read the press (55% and 62%,
respectively);
- A majority of regular Internet users say they "tend not to trust" this medium
(49%, compared with 44% who "tend to trust it"). Distrust is greater among
Europeans who use the Internet less frequently (52% among those who use the
Internet two or three times a month or less often).
STANDARD EUROBAROMETER 80 MEDIA USE – AUTUMN 2013
21
STANDARD EUROBAROMETER 80 MEDIA USE – AUTUMN 2013
22
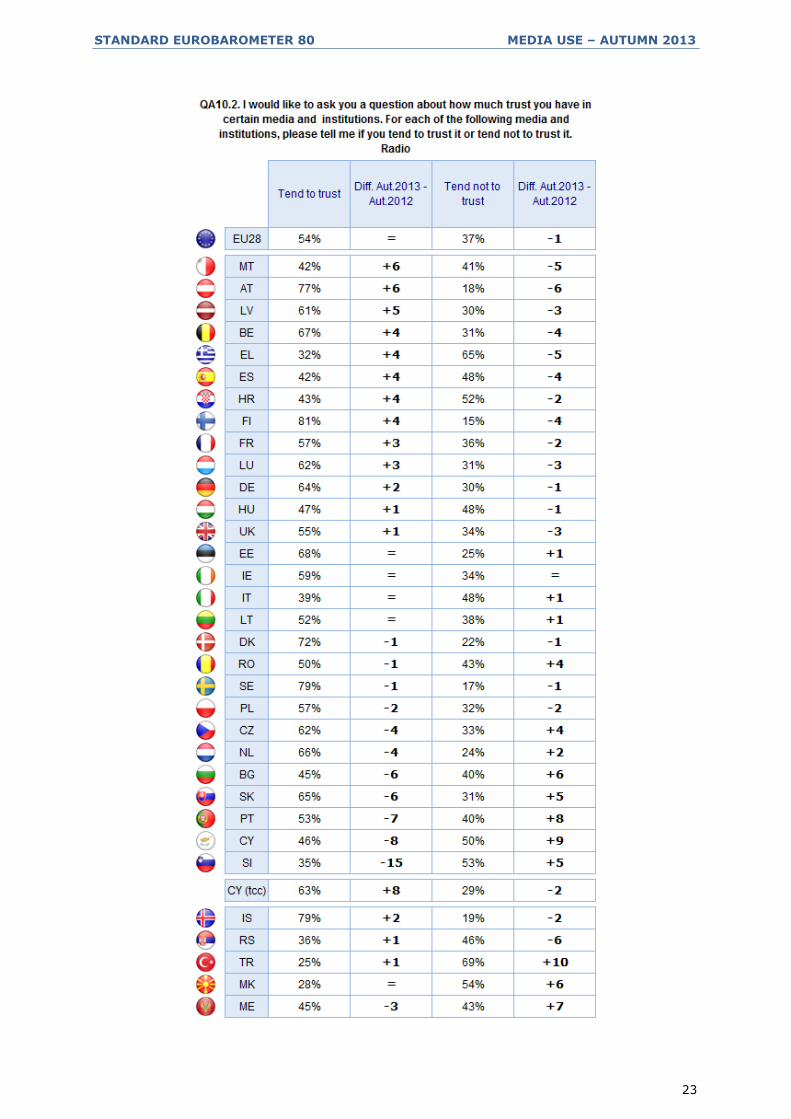
Majorities trust radio in 21 of the 28 Member States. This was the case in 23 of the 27
Member States in the autumn 2011 Standard Eurobarometer (EB76). The exceptions are
Greece (32% trust, vs 65%), Slovenia (35%, vs 53%), Italy (39%, vs 48%), Spain
(42%, vs 48%), Croatia (43%, vs 52%), Cyprus (46%, vs 50%) and Hungary
(47%, vs 48%). Trust in radio is most marked in Finland (81%), Sweden (79%) and
Austria (77%), one of the countries where radio use is most widespread. In the other
countries with most frequent use, majorities also trust this medium, but to a slightly
lesser extent: 64% in Germany and 59% in Ireland.
In terms of evolutions, Slovenia has recorded a significant decline in trust in the radio
(35%, -15 percentage points), a decline that is also observed for other media. Trust has
also fallen in Cyprus (46%, -8), but has risen sharply in Malta (42%, +6) and Austria
(77%, +6).
STANDARD EUROBAROMETER 80 MEDIA USE – AUTUMN 2013
23

STANDARD EUROBAROMETER 80 MEDIA USE – AUTUMN 2013
24
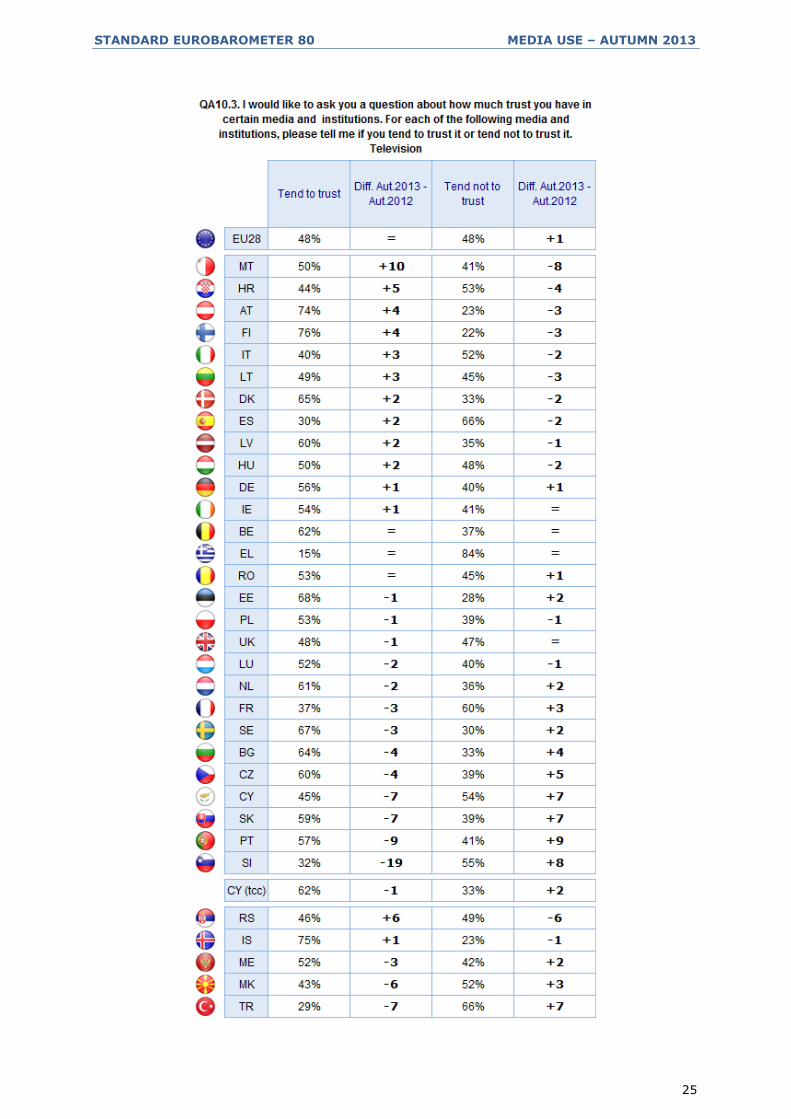
Majorities of respondents trust television in 21 Member States, led by Finland (76%)
and Austria (74%).
Countries that express distrust in television also distrust radio, with the exception of
Hungary, where a narrow majority trust television (50% trust, vs 48%). In France,
where radio is predominantly trusted, a clear majority of respondents distrust television
(37% "tend to trust", vs 60% "tend not to trust").
Trust in television has fallen sharply in Slovenia (32%, -19 percentage points), Portugal
(57%, -9), Slovakia (59%, -7) and Cyprus (45%, -7). However, it has risen steeply in
Malta (50%, +10).
STANDARD EUROBAROMETER 80 MEDIA USE – AUTUMN 2013
25
STANDARD EUROBAROMETER 80 MEDIA USE – AUTUMN 2013
26
Trust in the written press is predominant in 13 Member States, up from nine in autumn
2012. This trust is particularly marked in Finland (68%), Austria (64%) and the
Netherlands (61%), which are among the countries with the highest consumption of the
written press. In Sweden, where large numbers of respondents read the written press, a
scant majority trust it (49% trust, vs 48%), and in Germany only a minority do so
(46% vs 49%).
The country in which distrust of the press is most pronounced is the United Kingdom
(78%), even though more than three-quarters of respondents say they read the written
press at least once a week. The UK is followed by Greece (74%) and Slovenia (70%).
Opinions on this topic have changed the most in Slovenia, where distrust has grown by
15 percentage points since autumn 2012. It also increased in Cyprus (56%, +7) and the
Czech Republic (49%, +7). Conversely, trust in the written press gained ground in
Belgium (58%, +8) and Malta (37%, +8).

STANDARD EUROBAROMETER 80 MEDIA USE – AUTUMN 2013
27
STANDARD EUROBAROMETER 80 MEDIA USE – AUTUMN 2013
28
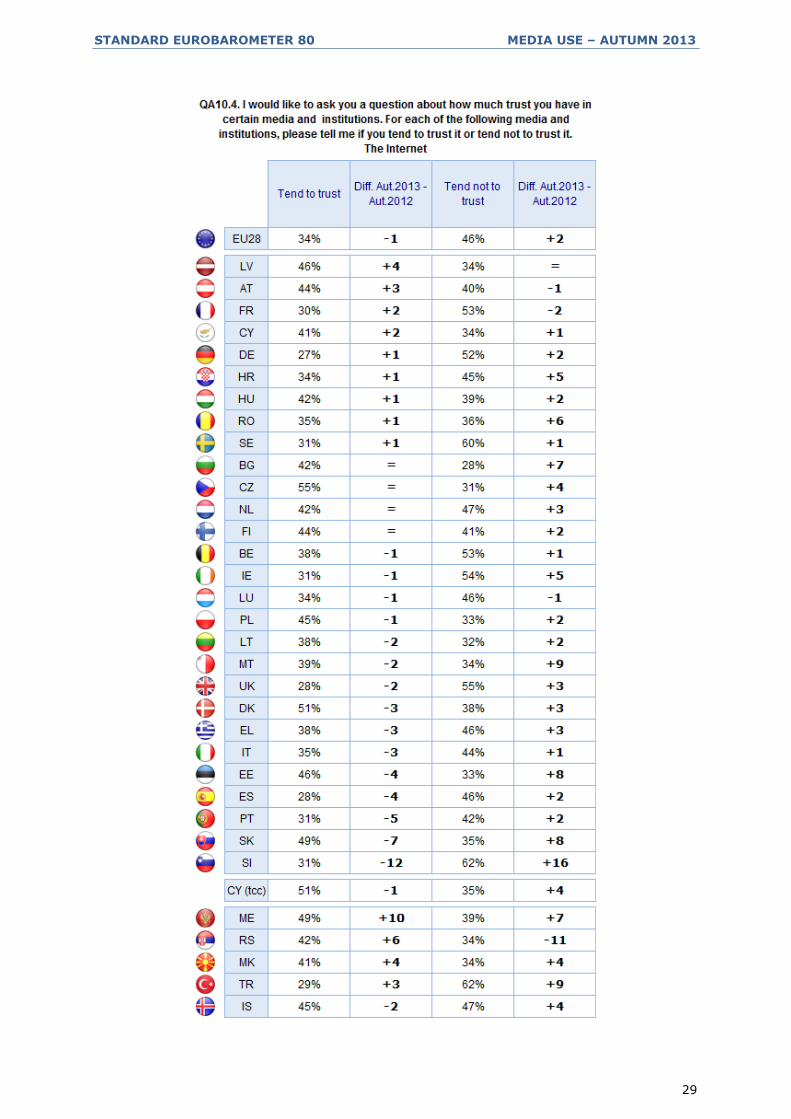
Trust in the Internet is expressed by majorities in 13 Member States, as was the case in
autumn 2012. It is strongest in the Czech Republic (55%, where it is higher than trust in
the written press), Denmark (51%) and Slovakia (49%).
Distrust in the Internet is particularly widespread in Slovenia (62%), where it has
increased by 16 percentage points since autumn 2012 and in Sweden (60%, +1), the
United Kingdom (55%, +3) and Ireland (54%, +5).
STANDARD EUROBAROMETER 80 MEDIA USE – AUTUMN 2013
29
STANDARD EUROBAROMETER 80 MEDIA USE – AUTUMN 2013
30
In the candidate countries:
- In Iceland, majorities trust the written press, radio and television, but trust in
the Internet is now narrowly in the minority (45% trust, -2 percentage points,
vs 47%, +4);
- In Montenegro, trust in the written press has fallen sharply and is now the
minority position (44%, -9). Conversely, trust in the Internet has gained
significant ground (49%, +10), but so also has distrust (39%, +7), suggesting
that opinions are gradually hardening;
- In Turkey, respondents distrust all the media. Distrust in radio has reached 69%
(+10);
- The Internet is the only medium which is trusted by a majority in the former
Yugoslav Republic of Macedonia (41% trust, vs 34%) and Serbia (42%
vs 34%): in the latter country, however, a majority distrusted the Internet in
autumn 2012 (45% distrust vs 36%).
STANDARD EUROBAROMETER 80 MEDIA USE – AUTUMN 2013
31
THE CREDIBILITY OF INTERNET SOURCES
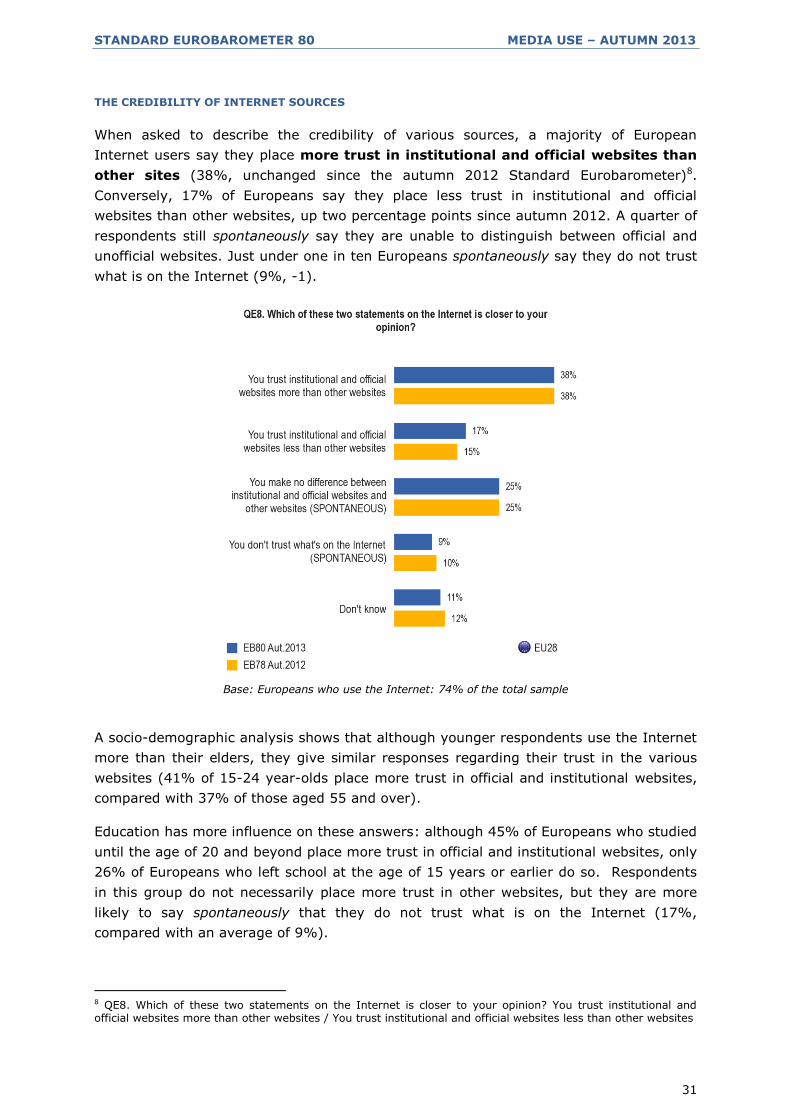
When asked to describe the credibility of various sources, a majority of European
Internet users say they place more trust in institutional and official websites than
other sites (38%, unchanged since the autumn 2012 Standard Eurobarometer)8.
Conversely, 17% of Europeans say they place less trust in institutional and official
websites than other websites, up two percentage points since autumn 2012. A quarter of
respondents still spontaneously say they are unable to distinguish between official and
unofficial websites. Just under one in ten Europeans spontaneously say they do not trust
what is on the Internet (9%, -1).
Base: Europeans who use the Internet: 74% of the total sample
A socio-demographic analysis shows that although younger respondents use the Internet
more than their elders, they give similar responses regarding their trust in the various
websites (41% of 15-24 year-olds place more trust in official and institutional websites,
compared with 37% of those aged 55 and over).
Education has more influence on these answers: although 45% of Europeans who studied
until the age of 20 and beyond place more trust in official and institutional websites, only
26% of Europeans who left school at the age of 15 years or earlier do so. Respondents
in this group do not necessarily place more trust in other websites, but they are more
likely to say spontaneously that they do not trust what is on the Internet (17%,
compared with an average of 9%).
8 QE8. Which of these two statements on the Internet is closer to your opinion? You trust institutional and official websites more than other websites / You trust institutional and official websites less than other websites

STANDARD EUROBAROMETER 80 MEDIA USE – AUTUMN 2013
32
Base: Europeans who use the Internet: 74% of the total sample
The countries with most frequent Internet use are also those in which trust in official and
institutional websites appears to be the highest: 70% in Denmark, 69% in Sweden and
60% in the Netherlands and Finland.
This trust is predominant in all countries of the European Union, including Greece (24%,
+4 percentage points), which was not the case in autumn 2012. In this country, a third
of respondents (33%, -8) nevertheless spontaneously say they make no difference
between official websites and others. There was a sharp decline in the trust placed in
official websites in Luxembourg (38%, -12) and Bulgaria (24%, -11). Conversely, trust in
these websites has increased sharply among respondents in Croatia (30%, +9).

STANDARD EUROBAROMETER 80 MEDIA USE – AUTUMN 2013
33
II. INFORMATION ON EUROPEAN MATTERS
- More than two-thirds of Europeans feel ill-informed about European matters -
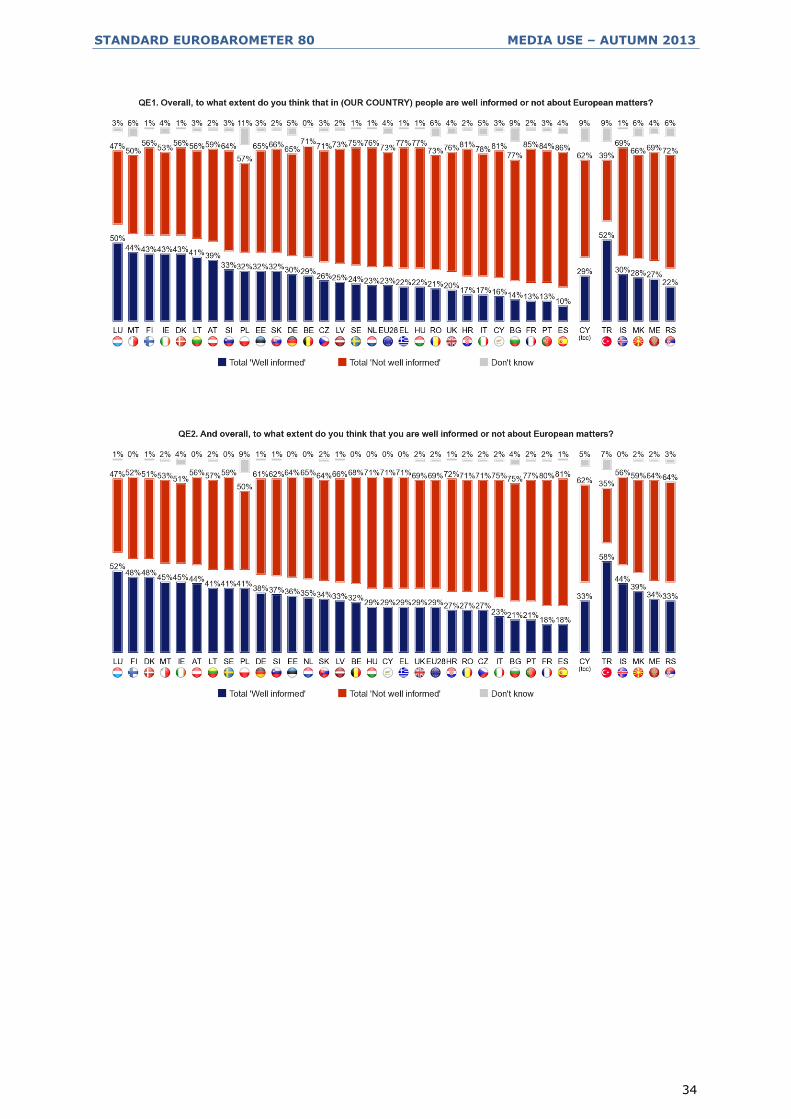
Nearly three-quarters of
Europeans consider that in
their country, people are ill-
informed about European
matters, although this
proportion is slightly lower than
in autumn 2012 (73%, -2
percentage points)9. Nearly
seven in Europeans feel the
same about their own level of
information (69%, +1).
Majorities have the impression
that they, or their compatriots,
are "ill-informed" about
European matters in all
Member States except
Luxembourg: 50% of
respondents in Luxembourg think that people in their country are well-informed on these
issues, and 52% feel well-informed themselves. However, these proportions are lower
than in the autumn 2012 EB78 survey (by -6 and -2 percentage points respectively).
Judgments are most severe in Spain (86% believe that people in their country are "ill-
informed", and 81% say they are ill-informed themselves), France (85% and 80%) and
Portugal (84% and 77%).
Some evolutions should be noted:
- Respondents' impression that they themselves are well-informed about European
issues has declined sharply since autumn 2012 in Croatia (27%, -13 percentage
points), as the country's entry into the European Union may have raised
expectations on this subject. Conversely, this feeling has gained ground in Austria
(44%, +8) and Lithuania (41%, +8);
- The feeling that one's fellow citizens are well-informed has gained ground in
several countries: Lithuania (41%, +8 percentage points), Greece (22%, +7),
Austria (39%, +7), the Netherlands (23%, +7), Romania (21%, +6) and
Germany (30%, +6). However, it has declined in the United Kingdom (20%, -7).
9 QE1. Overall, to what extent do you think that in (OUR COUNTRY) people are well informed or not about European matters?
STANDARD EUROBAROMETER 80 MEDIA USE – AUTUMN 2013
34
STANDARD EUROBAROMETER 80 MEDIA USE – AUTUMN 2013
35
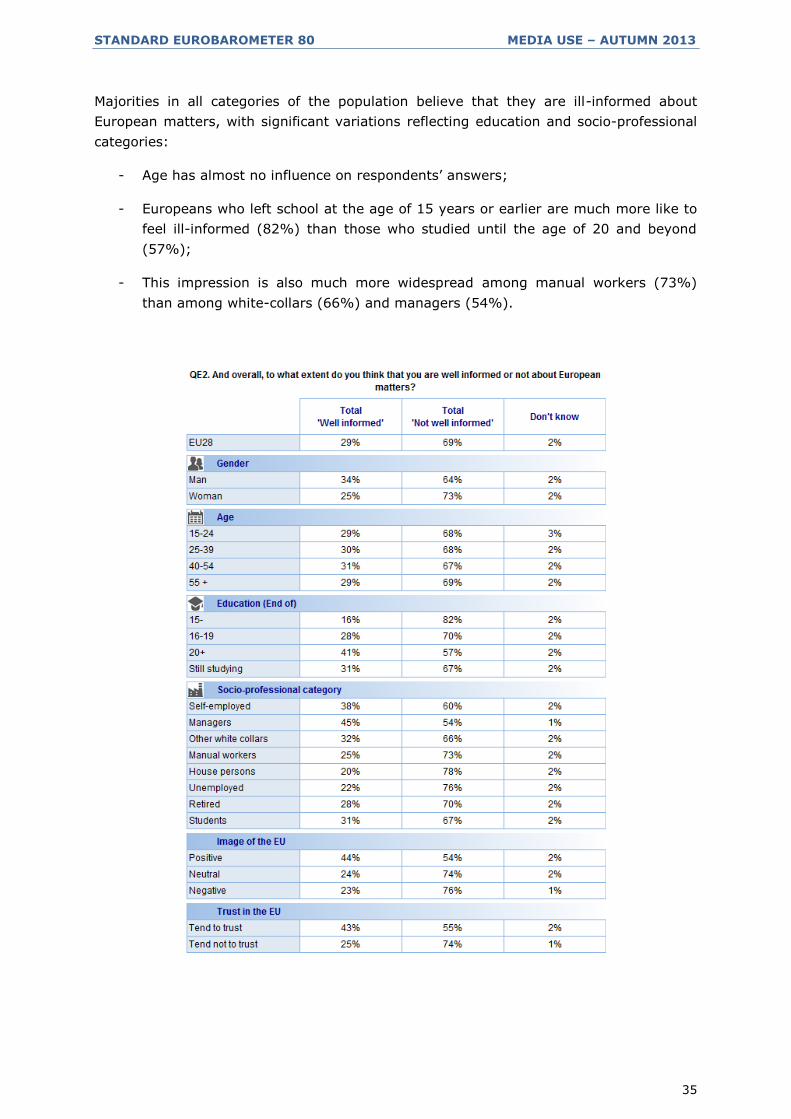
Majorities in all categories of the population believe that they are ill-informed about
European matters, with significant variations reflecting education and socio-professional
categories:
- Age has almost no influence on respondents’ answers;
- Europeans who left school at the age of 15 years or earlier are much more like to
feel ill-informed (82%) than those who studied until the age of 20 and beyond
(57%);
- This impression is also much more widespread among manual workers (73%)
than among white-collars (66%) and managers (54%).

STANDARD EUROBAROMETER 80 MEDIA USE – AUTUMN 2013
36
The table below also shows the socio-demographic results for the European Union's six
largest countries, and for four countries that have been particularly badly affected by the
economic and financial crisis.

STANDARD EUROBAROMETER 80 MEDIA USE – AUTUMN 2013
37
III. SOURCES OF NEWS ON POLITICAL MATTERS AND THE
EUROPEAN UNION
- Internet gains ground as a preferred source of national and European political
news -
1. NATIONAL POLITICAL MATTERS
Television remains Europeans'
preferred source of news on
national political affairs despite a
slight decrease since the autumn
2012 Standard Eurobarometer survey
(82%, -2 percentage points)10. It is
followed by the written press,
although this is mentioned far less
(43%, -4, or -7 points since the
autumn 2011 survey (EB76)).
Radio is the third preferred source of
news (36%, -1), now only a few
points ahead of the Internet, which is
the only source of news on national
political affairs that has gained
ground (33%, +2 and +4 since
autumn 2011).
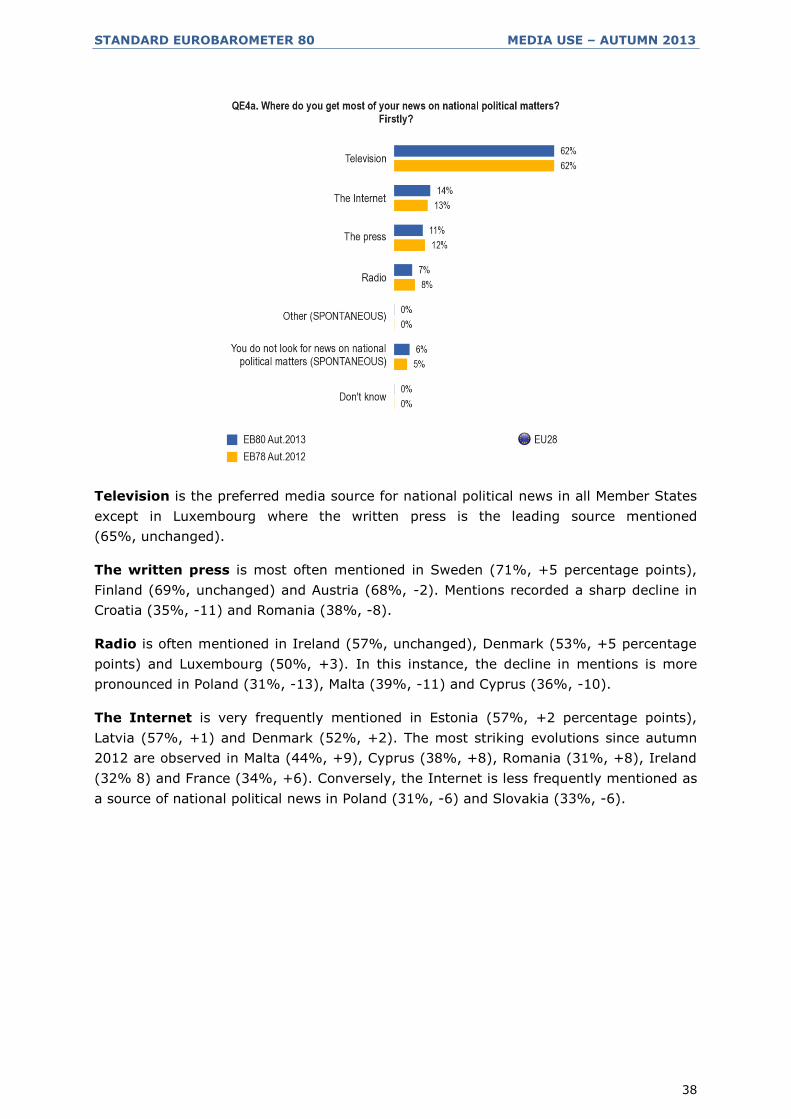
When we consider the "first" news source mentioned by Europeans, television
remains well ahead (62%, unchanged), but the Internet has consolidated its second
position a little (14%, +1 percentage point), ahead of the press (11%, -1) and radio
(7%, -1), both of which have lost ground.
10 QE4T. Where do you get most of your news on national political matters?
STANDARD EUROBAROMETER 80 MEDIA USE – AUTUMN 2013
38
Television is the preferred media source for national political news in all Member States
except in Luxembourg where the written press is the leading source mentioned
(65%, unchanged).
The written press is most often mentioned in Sweden (71%, +5 percentage points),
Finland (69%, unchanged) and Austria (68%, -2). Mentions recorded a sharp decline in
Croatia (35%, -11) and Romania (38%, -8).
Radio is often mentioned in Ireland (57%, unchanged), Denmark (53%, +5 percentage
points) and Luxembourg (50%, +3). In this instance, the decline in mentions is more
pronounced in Poland (31%, -13), Malta (39%, -11) and Cyprus (36%, -10).
The Internet is very frequently mentioned in Estonia (57%, +2 percentage points),
Latvia (57%, +1) and Denmark (52%, +2). The most striking evolutions since autumn
2012 are observed in Malta (44%, +9), Cyprus (38%, +8), Romania (31%, +8), Ireland
(32% 8) and France (34%, +6). Conversely, the Internet is less frequently mentioned as
a source of national political news in Poland (31%, -6) and Slovakia (33%, -6).
STANDARD EUROBAROMETER 80 MEDIA USE – AUTUMN 2013
39
THE HIERARCHY OF PREFERRED INTERNET SOURCES
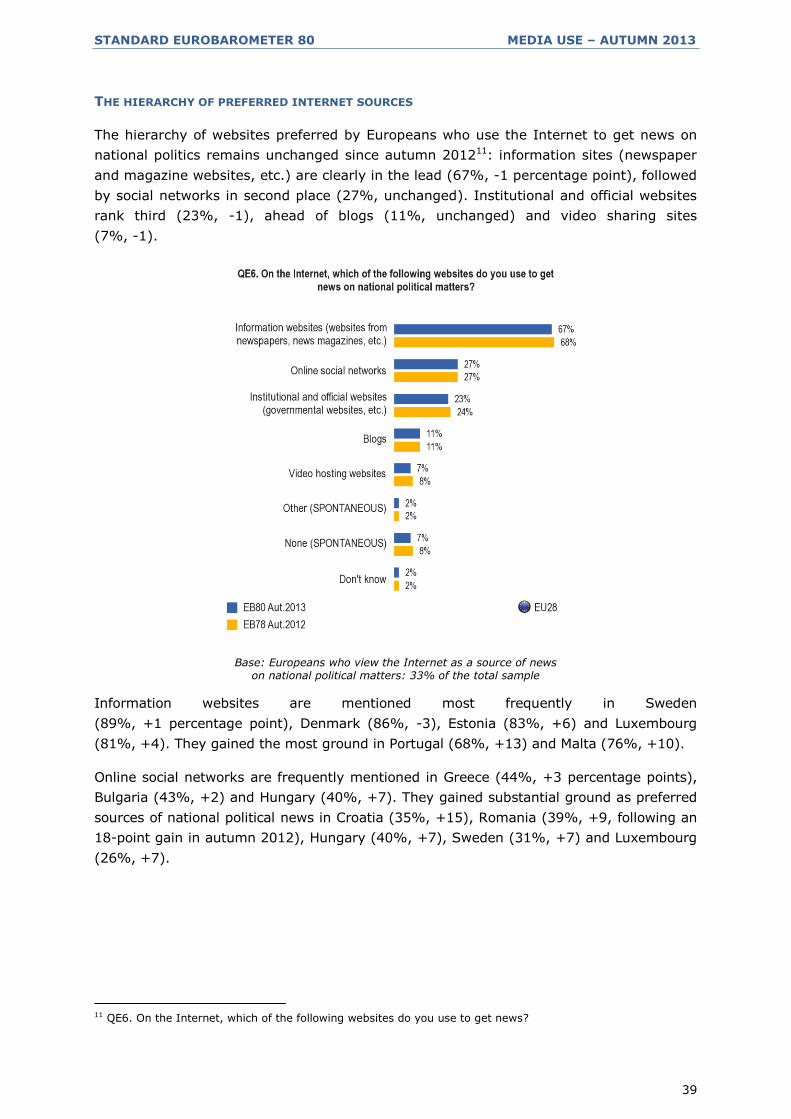
The hierarchy of websites preferred by Europeans who use the Internet to get news on
national politics remains unchanged since autumn 201211: information sites (newspaper
and magazine websites, etc.) are clearly in the lead (67%, -1 percentage point), followed
by social networks in second place (27%, unchanged). Institutional and official websites
rank third (23%, -1), ahead of blogs (11%, unchanged) and video sharing sites
(7%, -1).
Base: Europeans who view the Internet as a source of news on national political matters: 33% of the total sample
Information websites are mentioned most frequently in Sweden
(89%, +1 percentage point), Denmark (86%, -3), Estonia (83%, +6) and Luxembourg
(81%, +4). They gained the most ground in Portugal (68%, +13) and Malta (76%, +10).
Online social networks are frequently mentioned in Greece (44%, +3 percentage points),
Bulgaria (43%, +2) and Hungary (40%, +7). They gained substantial ground as preferred
sources of national political news in Croatia (35%, +15), Romania (39%, +9, following an
18-point gain in autumn 2012), Hungary (40%, +7), Sweden (31%, +7) and Luxembourg
(26%, +7).
11 QE6. On the Internet, which of the following websites do you use to get news?

STANDARD EUROBAROMETER 80 MEDIA USE – AUTUMN 2013
40
Socio-demographic analysis reveals that:
- Online social networks are used most by 15-24 year-olds (38%), in addition to
25-39 year-olds (29%), Europeans who left school before the age of 20
(33% of those who left school at the age of 15 or earlier, and 29% of those who
left between the ages of 16 and 19), manual workers (31%), the unemployed
(33%) and Europeans who say they often have difficulties paying their bills
(34%). These social networks represent the second leading source of news on
national political matters for these categories.
- In the other age or education categories, institutional and official websites are
preferred over online social networks as a source of news on national politics.
Base: Europeans who view the Internet as a source of news
on national political matters: 33% of the total sample

STANDARD EUROBAROMETER 80 MEDIA USE – AUTUMN 2013
41
2. EUROPEAN POLITICAL MATTERS
As in the case of national political
issues, Europeans prefer
television as a source of news on
European political matters
despite a slight decline (75%, -3
percentage points since the
autumn 2012 Standard
Eurobarometer survey)12.
The written press comes in
second place but with fewer
mentions (40%, -4 since autumn
2012 and -7 since autumn 2011).
Radio ranks third, and is also
mentioned less frequently (31%,
-3 and -4). The Internet is close
behind, and is mentioned a little
more often (29%, +1 and +3).
As in the case of national political
news, the Internet is the only
medium that is gaining ground.
When we consider the respondents’
first response, television remains
the preferred news medium for
European political matters (58%,
unchanged), but the Internet is once
again in second place
(13%, +1 percentage point),
followed by the written press (10%,
-1) and radio (6%, -1).
12 QE5. Where do you get most of your news on European political matters?

STANDARD EUROBAROMETER 80 MEDIA USE – AUTUMN 2013
42
This question, like the question on sources of national political news, reveals the same
socio-demographic divisions that were recorded in respect of media use in the
broadest sense:
- Younger respondents and students mention the Internet most often, placing it in
second position after television as a preferred source of information;
- The most educated Europeans and managers also mention the Internet more
often than average; however they rank it after television and the written press.

STANDARD EUROBAROMETER 80 MEDIA USE – AUTUMN 2013
43
THE HIERARCHY OF PREFERRED INTERNET SOURCES
The hierarchy of websites which are preferred for obtaining European political news on
the Internet is slightly modified13:
- Information websites continue to be consulted most (65%, -1 percentage point);
- Institutional and official websites come in second place
(25%, +1 percentage point) and are joined by online social networks (25%, +2);
- Blogs have fallen behind and are mentioned less often than in autumn 2012
(10%, -2 percentage points);
- They are followed by video sharing platforms (7%, unchanged);
- The proportion of respondents who spontaneously respond that they do not use
any websites to get news on European political matters has lost one percentage
point since autumn 2012 (7%).
Base: Europeans who view the Internet as a source of news
on European political matters: 29% of the sample
13 QE7. On the Internet, which of the following websites do you use to get news on European political matters?
STANDARD EUROBAROMETER 80 MEDIA USE – AUTUMN 2013
44
Information websites are mentioned most frequently in Sweden
(85%, +1 percentage point), Denmark (81%, -3) and Luxembourg (81%, +3). The
sharpest increases are recorded in Malta (77%, +9) and Spain (70%, +9); conversely,
these sites lost ground significantly in Greece (59%, - 15), Croatia (61%, -10) and
Germany (61%, -10).
Respondents in Austria (41%, -2 points) and Luxembourg (36%, -6) are the most likely
to mention institutional or official websites. The greatest evolutions are negative:
institutional websites have lost 14 percentage points in Bulgaria (18%) and seven in
Poland (16%).
Online social networks are most often mentioned as a source of news on European
political matters in Romania (42%, +12 percentage points) and Bulgaria (39%, -5).
Other significant evolutions are observed in Croatia (31%, +10), France (25%, +9), Italy
(25%, +8) and Portugal (34%, +8).
STANDARD EUROBAROMETER 80 MEDIA USE – AUTUMN 2013
45
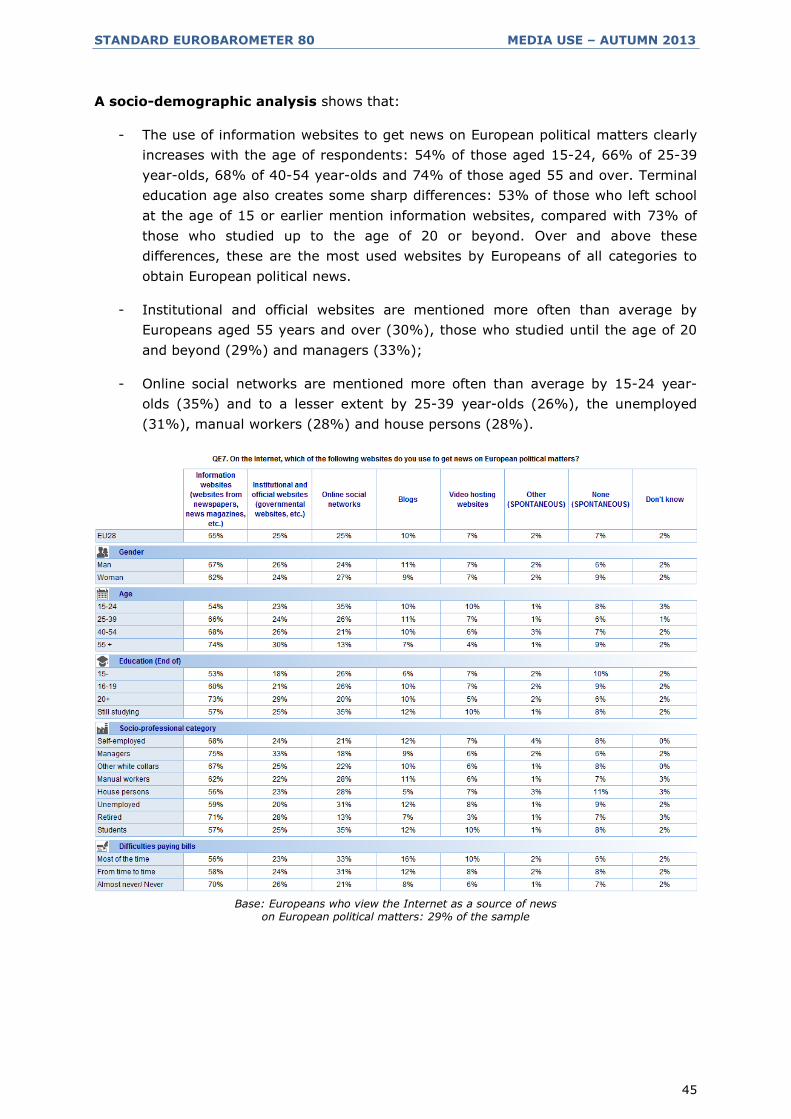
A socio-demographic analysis shows that:
- The use of information websites to get news on European political matters clearly
increases with the age of respondents: 54% of those aged 15-24, 66% of 25-39
year-olds, 68% of 40-54 year-olds and 74% of those aged 55 and over. Terminal
education age also creates some sharp differences: 53% of those who left school
at the age of 15 or earlier mention information websites, compared with 73% of
those who studied up to the age of 20 or beyond. Over and above these
differences, these are the most used websites by Europeans of all categories to
obtain European political news.
- Institutional and official websites are mentioned more often than average by
Europeans aged 55 years and over (30%), those who studied until the age of 20
and beyond (29%) and managers (33%);
- Online social networks are mentioned more often than average by 15-24 year-
olds (35%) and to a lesser extent by 25-39 year-olds (26%), the unemployed
(31%), manual workers (28%) and house persons (28%).
Base: Europeans who view the Internet as a source of news
on European political matters: 29% of the sample

STANDARD EUROBAROMETER 80 MEDIA USE – AUTUMN 2013
46
3. THE ACTIVE SEARCH FOR INFORMATION ON THE EUROPEAN UNION
The hierarchy of preferred sources when searching for information on the European
Union is similar to that found in autumn 201214:
- Television remains the
first source mentioned
(48%, -1 percentage
point);
- The Internet ranks
second (33%,
unchanged);
- Daily newspapers come in
third place but again
record a significant
decline in responses
(26%, -4, or -7 since
autumn 2011);
- Discussions with
relatives, friends and
colleagues remain in
fourth place (19% of
responses, -1), followed
by radio (17%, -1);
- These are followed by
other newspapers and
magazines (10%, -1),
books, brochures and information leaflets (6%, unchanged) and meetings or
conferences (3%, unchanged);
- Over a fifth of Europeans spontaneously responded that they never search for this
type of information (21%, +1).
The Internet tops the list of sources preferred when looking for information about the
EU, its policies and institutions in six Member States: Sweden (62%), the Netherlands
(59%), Finland (58%), Denmark (57%), Estonia (52%) and Latvia (44%).
Mentions have gained significant ground in Cyprus (37%, +8 percentage points) and
Malta (40%, +7), but have declined in Poland (22%, -8).
14 QE9. When you are looking for information about the EU, its policies, its institutions, which of the following sources do you use?

STANDARD EUROBAROMETER 80 MEDIA USE – AUTUMN 2013
47
In all other Member States, television is the preferred medium when seeking
information about the European Union.
Daily newspapers are mentioned very often in Austria (53%), Luxembourg (50%),
Germany (44%), Finland (42%) and Sweden (40%).
The largest evolutions are recorded in Bulgaria (18%, -9 percentage points), Croatia
(18%, -8), Slovakia (19%, -8) and Cyprus (20%, -8).
Discussions with relatives are very often mentioned in Cyprus (48%), Austria (47%),
Greece (40%) and Denmark (40%).
They are mentioned more frequently than in autumn 2012 in Portugal
(19%, +10 percentage points), Hungary (27%, +8) and Belgium (23%, +7). Conversely,
mentions have fallen in Croatia (19%, -9) and Slovenia (26%, -8).
Conferences, talks and meetings are mentioned more frequently in Greece
(11%, -4 percentage points) and Portugal (10%, +4).
Over a quarter of respondents spontaneously say they never look for information on the
European Union in Poland (36%), the UK (30%), Bulgaria (28%), Portugal (28%) and
Latvia (26%).
In the candidate countries, television tops the list of preferred media used to look for
information about the EU, its policies and institutions, except in Iceland, where the
Internet is the leading source (69%).
A socio-demographic analysis reveals the divisions that were recorded previously for
media use: the Internet is preferred by younger respondents, the most educated and
managers. In other categories, television is the top choice.

STANDARD EUROBAROMETER 80 MEDIA USE – AUTUMN 2013
48
First four responses given
STANDARD EUROBAROMETER 80 MEDIA USE – AUTUMN 2013
49
4. MEDIA COVERAGE OF THE EUROPEAN UNION
- A majority of Europeans believe that their national media cover the European
Union sufficiently and objectively -
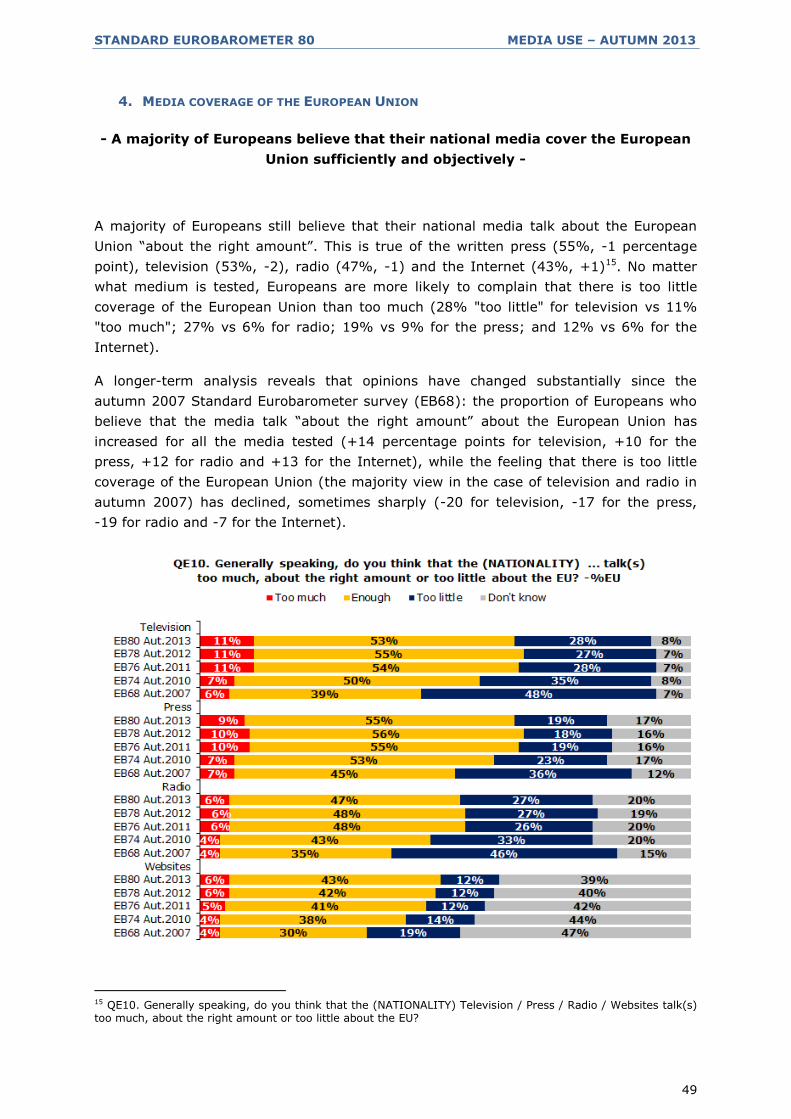
A majority of Europeans still believe that their national media talk about the European
Union “about the right amount”. This is true of the written press (55%, -1 percentage
point), television (53%, -2), radio (47%, -1) and the Internet (43%, +1)15. No matter
what medium is tested, Europeans are more likely to complain that there is too little
coverage of the European Union than too much (28% "too little" for television vs 11%
"too much"; 27% vs 6% for radio; 19% vs 9% for the press; and 12% vs 6% for the
Internet).
A longer-term analysis reveals that opinions have changed substantially since the
autumn 2007 Standard Eurobarometer survey (EB68): the proportion of Europeans who
believe that the media talk “about the right amount” about the European Union has
increased for all the media tested (+14 percentage points for television, +10 for the
press, +12 for radio and +13 for the Internet), while the feeling that there is too little
coverage of the European Union (the majority view in the case of television and radio in
autumn 2007) has declined, sometimes sharply (-20 for television, -17 for the press,
-19 for radio and -7 for the Internet).
15 QE10. Generally speaking, do you think that the (NATIONALITY) Television / Press / Radio / Websites talk(s) too much, about the right amount or too little about the EU?

STANDARD EUROBAROMETER 80 MEDIA USE – AUTUMN 2013
50
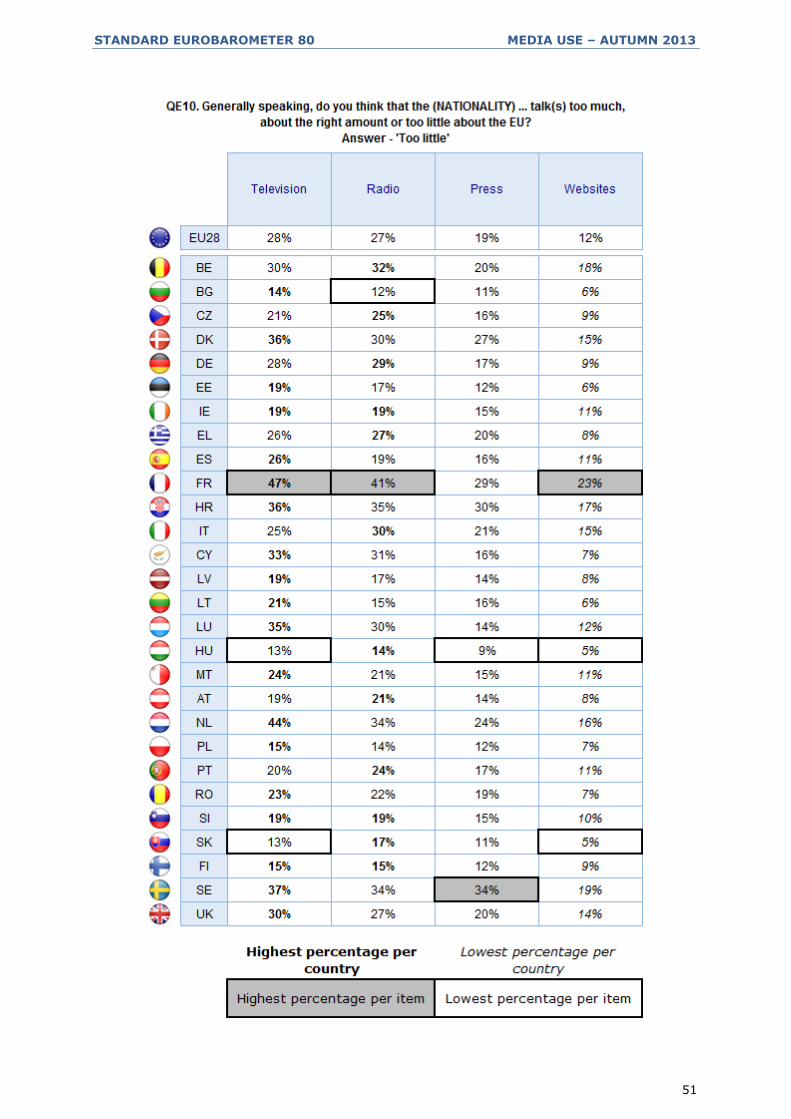
Respondents in Finland are among the most likely to feel that their national media talk
“about the right amount” about the European Union (76% in the case of television, 66%
for radio, 81% for the press and 61% for the Internet). This is also the case in Estonia
(70% / 66% / 73% / 64%) and Slovakia (72% / 68% / 70% / 57%).
Respondents are more likely than average to sat that their media talk too little about the
European Union in France (47% in the case of television, 41% for radio, 29% for the
press, and 23% for the Internet), the Netherlands (44% / 34% / 24% / 16%), Sweden
(37% / 34% / 34% / 19%) and Denmark (36% / 30% / 27% / 15%).
STANDARD EUROBAROMETER 80 MEDIA USE – AUTUMN 2013
51
STANDARD EUROBAROMETER 80 MEDIA USE – AUTUMN 2013
52
Croatia is another of the countries in which respondents complain that the media do not
talk enough about the European Union, though this feeling has declined sharply since the
country joined the EU (36%, -8 percentage points / 35%, -9 / 30%, -10 / 17%, -4).
Respondents are more likely than average to say that the media talk too much about the
European Union in Greece (36% for television, 16% for radio, 22% for the press and 8%
for the Internet), Spain (17% / 12% / 14% / 15%), Cyprus (20% / 11% / 13% / 8%)
and Romania (21% / 11% / 15% / but an average score for the Internet, 7%).
Evolutions include a growing impression that television does not talk enough about the
European Union in France (47%, +7 percentage points) and Greece (26%, +7), while
increasing numbers of respondents believe that there is too much TV coverage in Italy
(14%, +7) and Slovenia (17%, +6). The feeling that radio does not talk enough about
the European Union is gaining ground in Portugal (24%, +8).
The Europeans who are most educated and have a strong interest in politics are more
likely than average to say that their media talk "too little" about the European Union.
However, within these categories, as in others, majorities nevertheless believe that the
national media cover the European Union sufficiently.

STANDARD EUROBAROMETER 80 MEDIA USE – AUTUMN 2013
53
STANDARD EUROBAROMETER 80 MEDIA USE – AUTUMN 2013
54
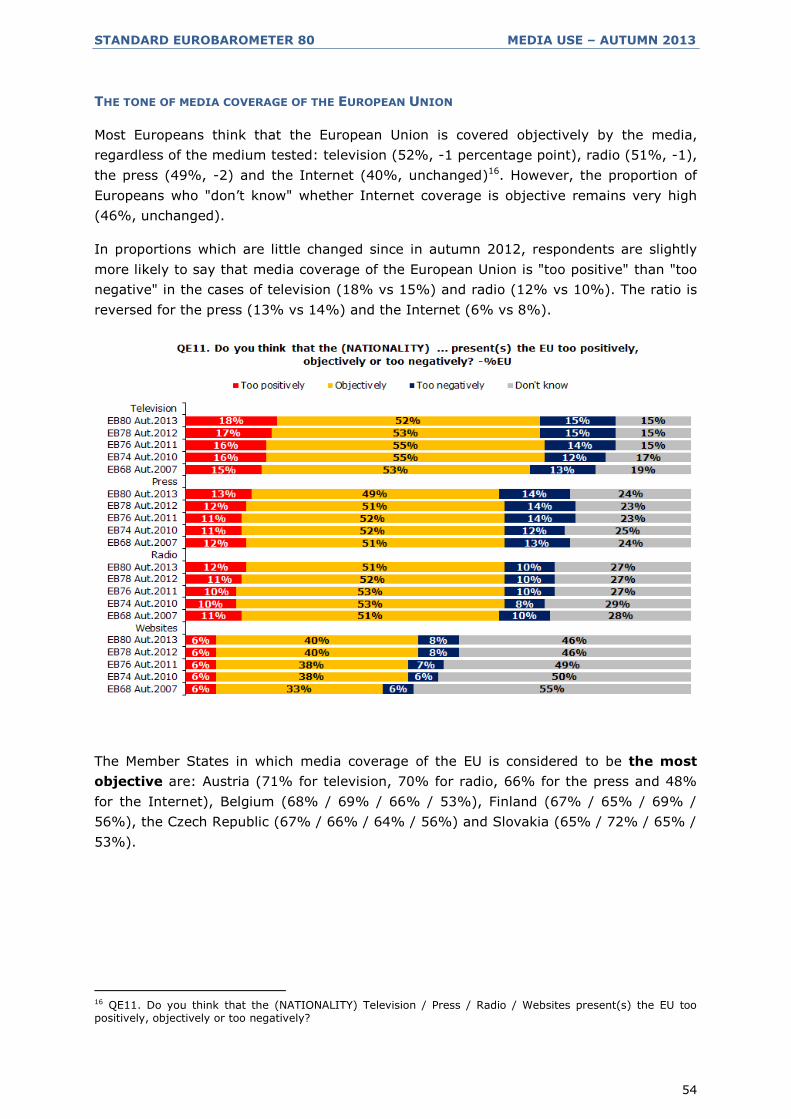
THE TONE OF MEDIA COVERAGE OF THE EUROPEAN UNION
Most Europeans think that the European Union is covered objectively by the media,
regardless of the medium tested: television (52%, -1 percentage point), radio (51%, -1),
the press (49%, -2) and the Internet (40%, unchanged)16. However, the proportion of
Europeans who "don’t know" whether Internet coverage is objective remains very high
(46%, unchanged).
In proportions which are little changed since in autumn 2012, respondents are slightly
more likely to say that media coverage of the European Union is "too positive" than "too
negative" in the cases of television (18% vs 15%) and radio (12% vs 10%). The ratio is
reversed for the press (13% vs 14%) and the Internet (6% vs 8%).
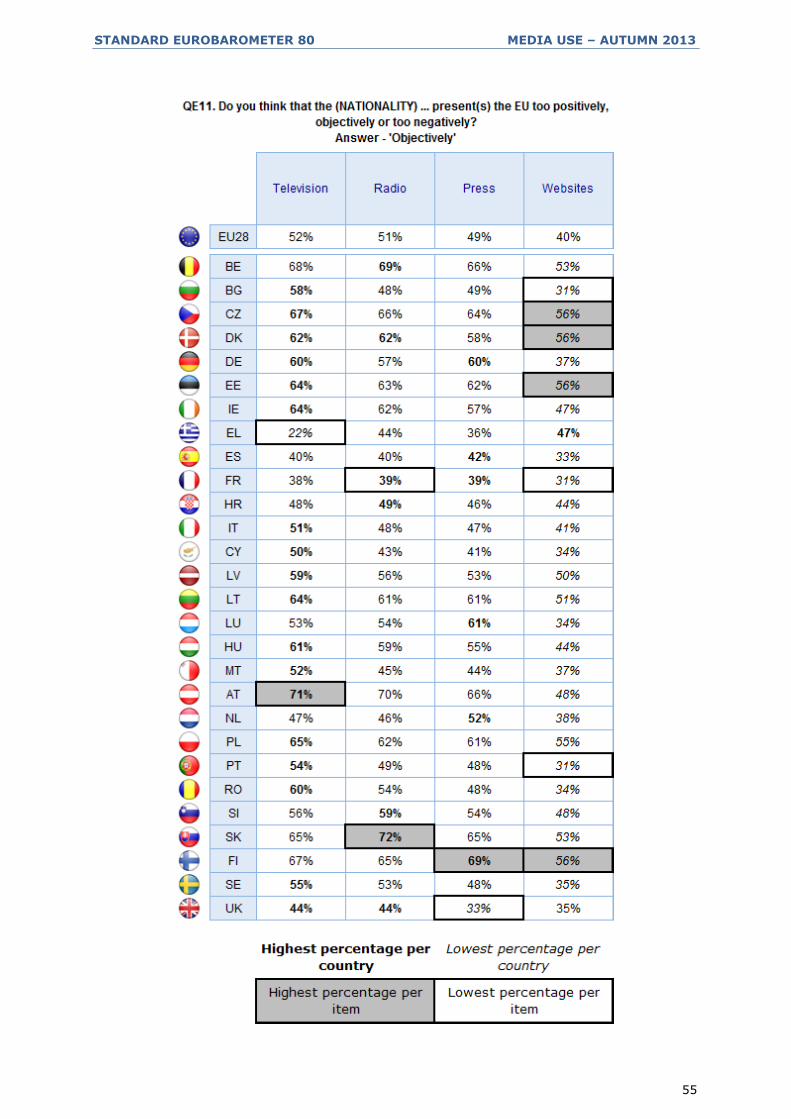
The Member States in which media coverage of the EU is considered to be the most
objective are: Austria (71% for television, 70% for radio, 66% for the press and 48%
for the Internet), Belgium (68% / 69% / 66% / 53%), Finland (67% / 65% / 69% /
56%), the Czech Republic (67% / 66% / 64% / 56%) and Slovakia (65% / 72% / 65% /
53%).
16 QE11. Do you think that the (NATIONALITY) Television / Press / Radio / Websites present(s) the EU too positively, objectively or too negatively?
STANDARD EUROBAROMETER 80 MEDIA USE – AUTUMN 2013
55
STANDARD EUROBAROMETER 80 MEDIA USE – AUTUMN 2013
56
Respondents in Greece remain more critical than average of media coverage of the
European Union in their country, which they describe both as too positive and too
negative, especially in the case of television, radio and the press. Judgments of the
Internet are less critical. France is the country in which respondents are most likely to
say that the media are too negative in their coverage of the EU (27% for television, 20%
for radio and 14% for the Internet). They are most likely to criticise the press in the
United Kingdom (30% "too negative") and Sweden (24%).
Croatia, which joined the European Union on 1 July 2013, is among the countries in
which respondents are most likely to describe media coverage of the European Union as
"too positive", although this criticism has declined significantly since autumn 2012,
whether for television (43%, -17 percentage points), radio (33%, -15), the press
(31%, -17) or the Internet (21%, -7).
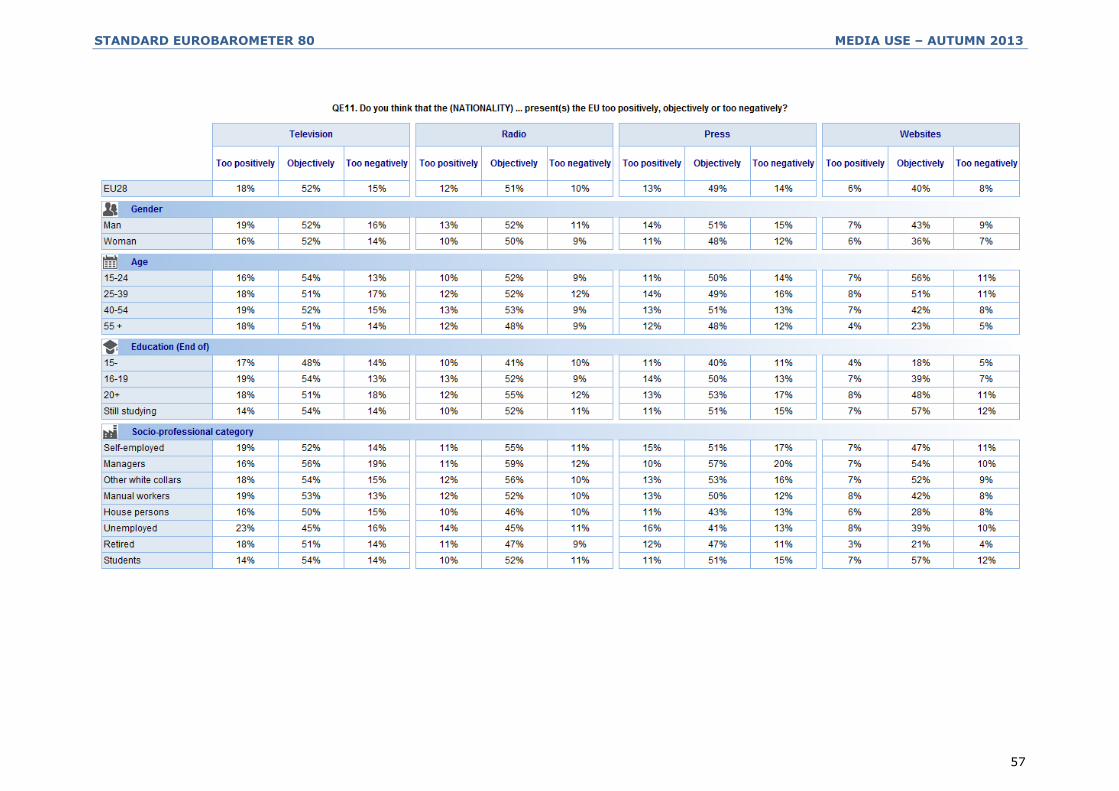
A socio-demographic analysis reveals few variations: in all categories, a majority of
respondents consider that the national media talk about the European Union objectively.
The proportion of Europeans who consider that media coverage of the European Union is
too positive is generally slightly higher than the proportion who say it is too negative.
Managers stand out from the rest of respondents: "too negative" responses outweigh
"too positive" ones for all four of the media tested.
STANDARD EUROBAROMETER 80 MEDIA USE – AUTUMN 2013
57
STANDARD EUROBAROMETER 80 MEDIA USE – AUTUMN 2013
58
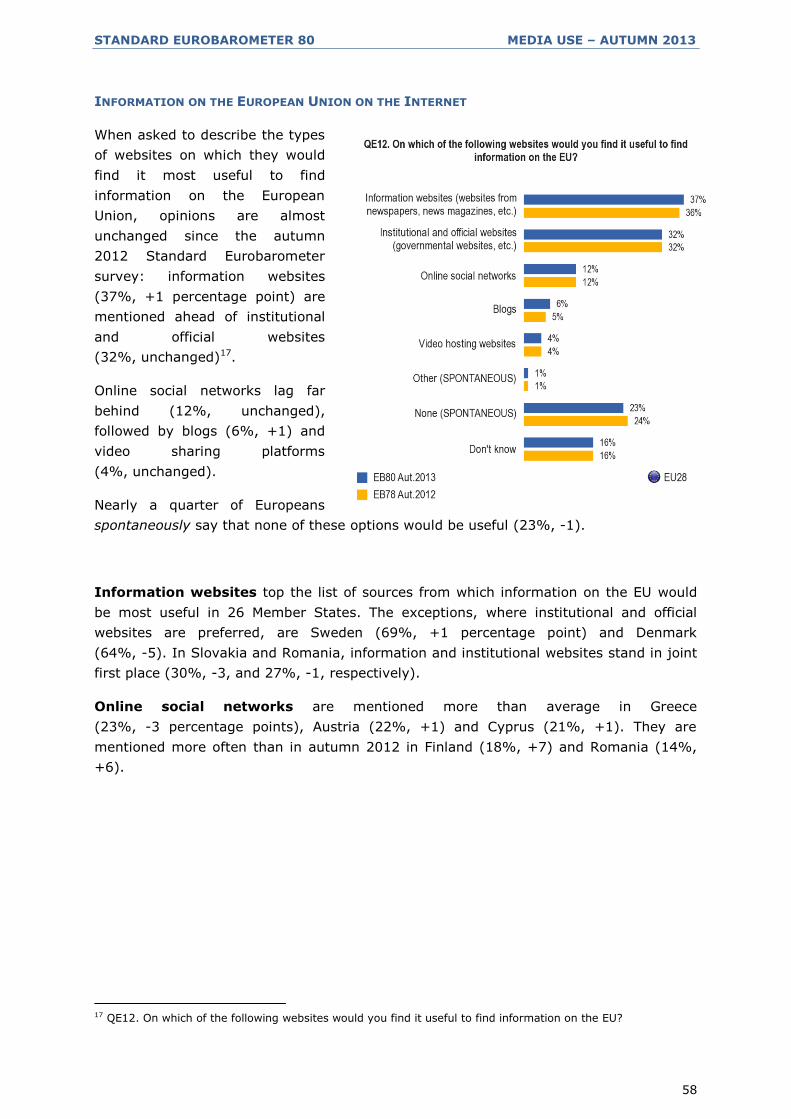
INFORMATION ON THE EUROPEAN UNION ON THE INTERNET
When asked to describe the types
of websites on which they would
find it most useful to find
information on the European
Union, opinions are almost
unchanged since the autumn
2012 Standard Eurobarometer
survey: information websites
(37%, +1 percentage point) are
mentioned ahead of institutional
and official websites
(32%, unchanged)17.
Online social networks lag far
behind (12%, unchanged),
followed by blogs (6%, +1) and
video sharing platforms
(4%, unchanged).
Nearly a quarter of Europeans
spontaneously say that none of these options would be useful (23%, -1).
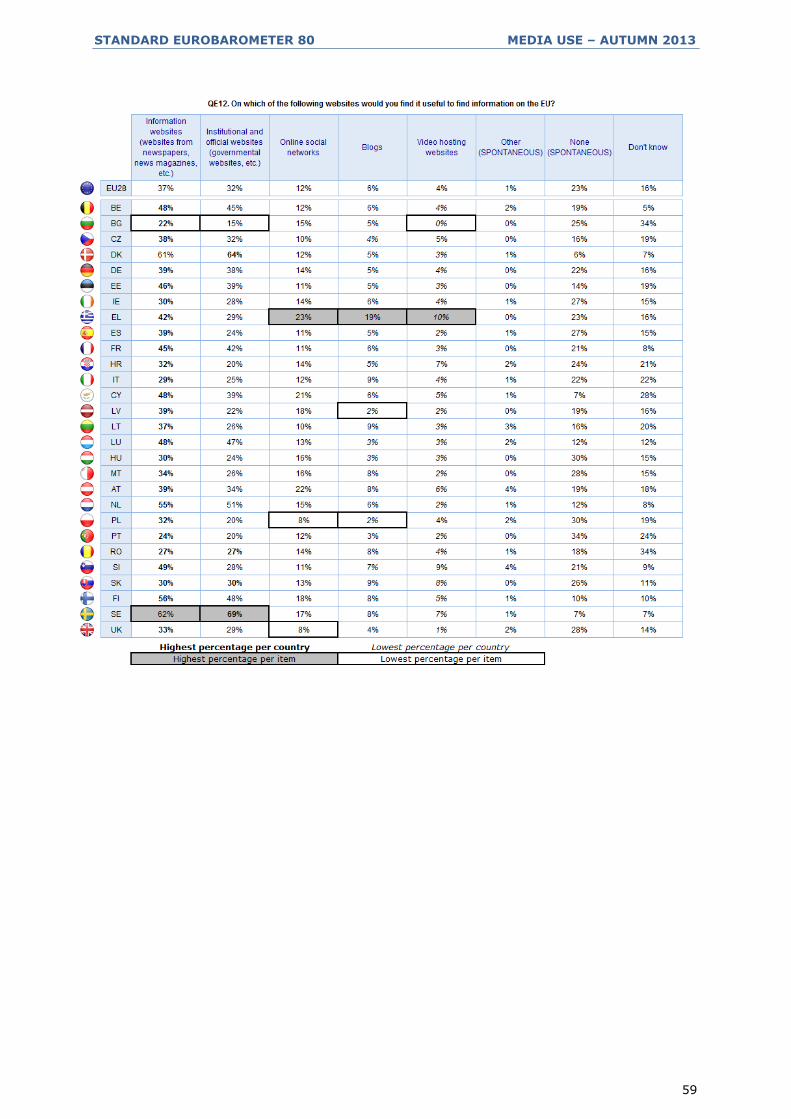
Information websites top the list of sources from which information on the EU would
be most useful in 26 Member States. The exceptions, where institutional and official
websites are preferred, are Sweden (69%, +1 percentage point) and Denmark
(64%, -5). In Slovakia and Romania, information and institutional websites stand in joint
first place (30%, -3, and 27%, -1, respectively).
Online social networks are mentioned more than average in Greece
(23%, -3 percentage points), Austria (22%, +1) and Cyprus (21%, +1). They are
mentioned more often than in autumn 2012 in Finland (18%, +7) and Romania (14%,
+6).
17 QE12. On which of the following websites would you find it useful to find information on the EU?
STANDARD EUROBAROMETER 80 MEDIA USE – AUTUMN 2013
59

STANDARD EUROBAROMETER 80 MEDIA USE – AUTUMN 2013
60
A socio-demographic analysis confirms certain trends previously identified regarding
media use:
- Younger respondents, who use the Internet the most, are more likely than
average to mention information websites (48%), institutional websites (40%) and
social networks (23%);
- Those aged 55 and older mention information websites (23%) slightly more often
than institutional websites (20%), and seldom mention online social networks
(4%) or blogs (2%). A quarter answered "don’t know" and 37% "none";
- The most educated respondents, who are very likely to trust institutional
websites, mention them much more than average (47%), and they also mention
news websites very often (52%). Their expectations of social networks are in line
with the average (14%);
- Managers very often mention information websites (53%) and institutional or
official websites (53%), as do students (53% for news websites, 46% for
institutional or official websites), who are also more likely than average to
mention online social networks (24%).

STANDARD EUROBAROMETER 80 MEDIA USE – AUTUMN 2013
61
IV. SOCIAL NETWORKS
- Europeans increasingly recognise the qualities of social networks, but doubts as to
their reliability as sources of political information are gaining ground -
The use of online social networks by Europeans has increased slightly since
autumn 2012 (44% use them at least once a week, +2 percentage points). However,
the proportion of Europeans who never use social networks remains high (41%, -2),
which explains why almost a quarter of Europeans still prefer to express no opinion on
this question (between 22% and 28% depending on the aspects discussed, compared
with a proportion ranging from 25% to 30% in autumn 2012).
A majority of Europeans, a slight increase since autumn 2012, agree with several positive
statements on social networks18:
- "Online social networks are a modern way to keep abreast of political affairs"
(52% agree, +2 percentage points, or +5 points since autumn 2011,
vs 26%, +1);
- They "can get people interested in political affairs" (52%, +2 and +5,
vs 25%, unchanged);
- They are "a good way to have your say on political issues" (51%, +1 and +4,
vs 26%, +1).
Negative opinions have also gained a little ground for two of these three statements.
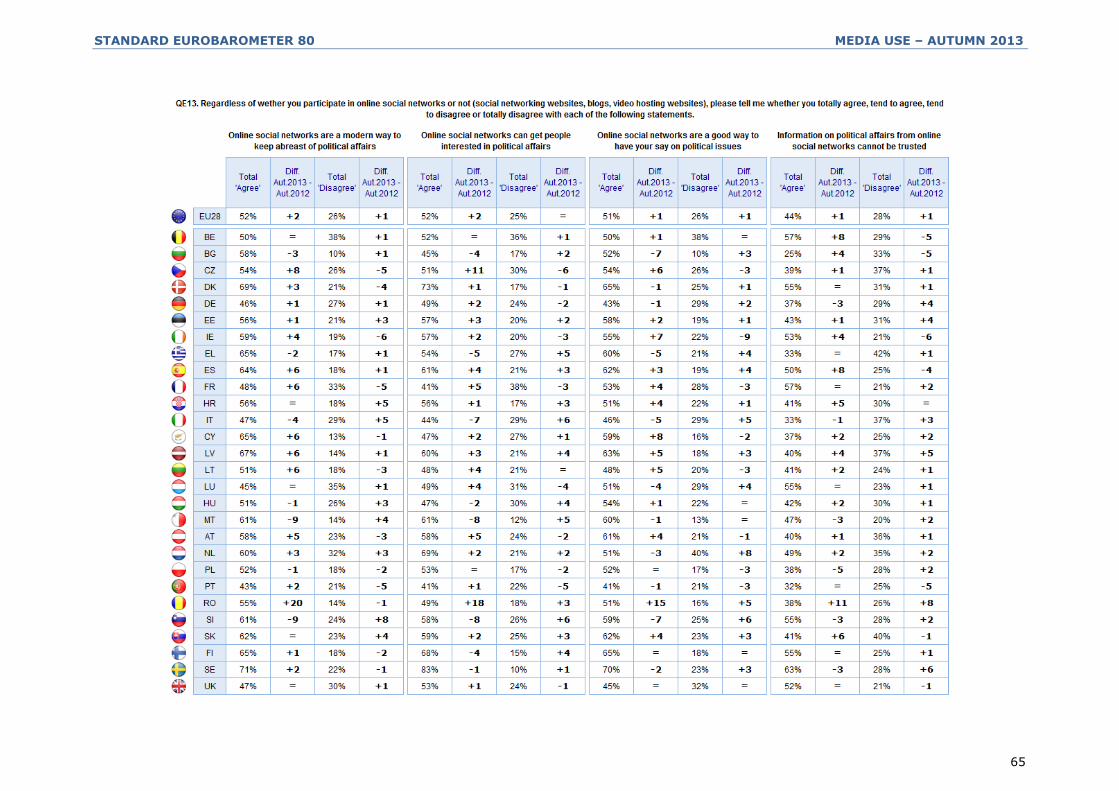
18 QE13. Regardless of whether you participate in online social networks or not (social networking websites, blogs, video hosting websites), please tell me whether you totally agree, tend to agree, tend to disagree or totally disagree with each of the following statements.

STANDARD EUROBAROMETER 80 MEDIA USE – AUTUMN 2013
62
Europeans are nevertheless also slightly more likely to agree that "information on
political affairs from online social networks cannot be trusted"
(44%, +1 percentage point and +4, vs 28%, +1).
Majorities in all Member States believe that social networks are a way to keep abreast of
and get people interested in political affairs, and to have your say.
STANDARD EUROBAROMETER 80 MEDIA USE – AUTUMN 2013
63
Three countries stand out due to significant evolutions in opinions regarding social
networks:
- In Romania, positive opinions have risen sharply (55%, +20 percentage points for
the opportunity to keep abreast; 49%, +18 for getting people interested in
political issues; and 51%, +15 for being able to have your say);
- This is also the case in the Czech Republic, though with less marked increases
since autumn 2012 (54%, +8 / 51%, +11 / 54%, +6);
- In contrast, the opposite phenomenon is found in Slovenia: positive opinions of
social networks have lost ground since autumn 2012 (61%, -9 percentage points
for the opportunity to keep abreast; 58%, -8 for getting people interested in
political issues; 59%, -7 for being able to have your say). Despite these declines,
positive views are nevertheless held by a majority in this country.
The belief that online social networks allow people to keep abreast of political issues
has gained ground in several countries: Spain (64%, +6 points), France (48%, +6),
Cyprus (65%, +6), Latvia (67%, +6) and Lithuania (51%, +6). It has declined in Malta
(61%, -9).
The idea that online social networks help get people interested in political issues has
lost ground in Malta (61%, -8 percentage points) and Italy (44%, -7).
The belief that online social networks allow people to have their say on political
issues has gained ground in Cyprus (59%, +8 percentage points) and Ireland
(55%, +7), but has declined significantly in Bulgaria (52%, -7).
Respondents in all Member States agree that information on social networks is
unreliable (25% total "Agree", vs 33%) except in Bulgaria where the ‘don’t know’ rate
is very high (42%), Greece (33% vs 42%) and Italy (33% vs 37%).
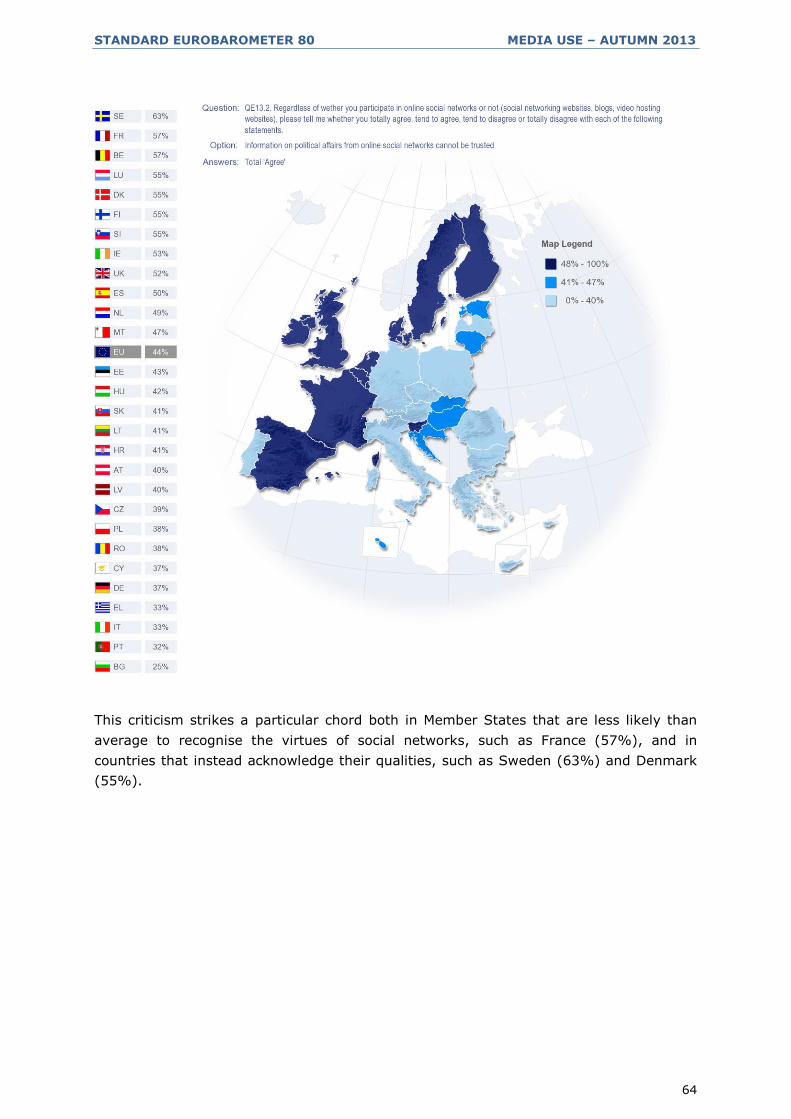
STANDARD EUROBAROMETER 80 MEDIA USE – AUTUMN 2013
64
This criticism strikes a particular chord both in Member States that are less likely than
average to recognise the virtues of social networks, such as France (57%), and in
countries that instead acknowledge their qualities, such as Sweden (63%) and Denmark
(55%).
STANDARD EUROBAROMETER 80 MEDIA USE – AUTUMN 2013
65
STANDARD EUROBAROMETER 80 MEDIA USE – AUTUMN 2013
66
We once again find the socio-demographic divisions that were recorded for social
network usage:
- Younger respondents, the most educated, managers and white collar workers,
who use social networks the most, are more likely than average to recognise their
political qualities, but they are also more likely to mention the unreliability of their
information.
- Europeans aged 55 years and older, the least educated and manual workers are
less likely to emphasise these qualities, but they are also less likely to say that
the information is unreliable as they have simply not developed a clear opinion on
the subject (with higher than average "don’t know" rates).

STANDARD EUROBAROMETER 80 MEDIA USE – AUTUMN 2013
67

STANDARD EUROBAROMETER 80 MEDIA USE – AUTUMN 2013
TS1
STANDARD EUROBAROMETER 80
Public opinion in the European Union
TECHNICAL SPECIFICATIONS
Between the 2nd and the 17th of November 2013, TNS opinion & social, a consortium created between TNS plc
and TNS opinion, carried out the wave 80.1 of the EUROBAROMETER survey, on request of the EUROPEAN
COMMISSION, Directorate-General for Communication, “Strategy, Corporate Communication Actions and
Eurobarometer”.
The wave 80.1 is the STANDARD EUROBAROMETER 80 survey and covers the population of the respective
nationalities of the European Union Member States, resident in each of the Member States and aged 15 years and
over.
The STANDARD EUROBAROMETER 80 survey has also been conducted in the five candidate countries (Turkey, the
Former Yugoslav Republic of Macedonia, Iceland, Montenegro and Serbia) and in the Turkish Cypriot Community.
In these countries, the survey covers the national population of citizens and the population of citizens of all the
European Union Member States that are residents in these countries and have a sufficient command of the
national languages to answer the questionnaire.
The basic sample design applied in all states is a multi-stage, random (probability) one. In each country, a
number of sampling points was drawn with probability proportional to population size (for a total coverage of the
country) and to population density.
In order to do so, the sampling points were drawn systematically from each of the "administrative regional units",
after stratification by individual unit and type of area. They thus represent the whole territory of the countries
surveyed according to the EUROSTAT NUTS II (or equivalent) and according to the distribution of the resident
population of the respective nationalities in terms of metropolitan, urban and rural areas. In each of the selected
sampling points, a starting address was drawn, at random. Further addresses (every Nth address) were selected
by standard "random route" procedures, from the initial address. In each household, the respondent was drawn,
at random (following the "closest birthday rule"). All interviews were conducted face-to-face in people's homes
and in the appropriate national language. As far as the data capture is concerned, CAPI (Computer Assisted
Personal Interview) was used in those countries where this technique was available.
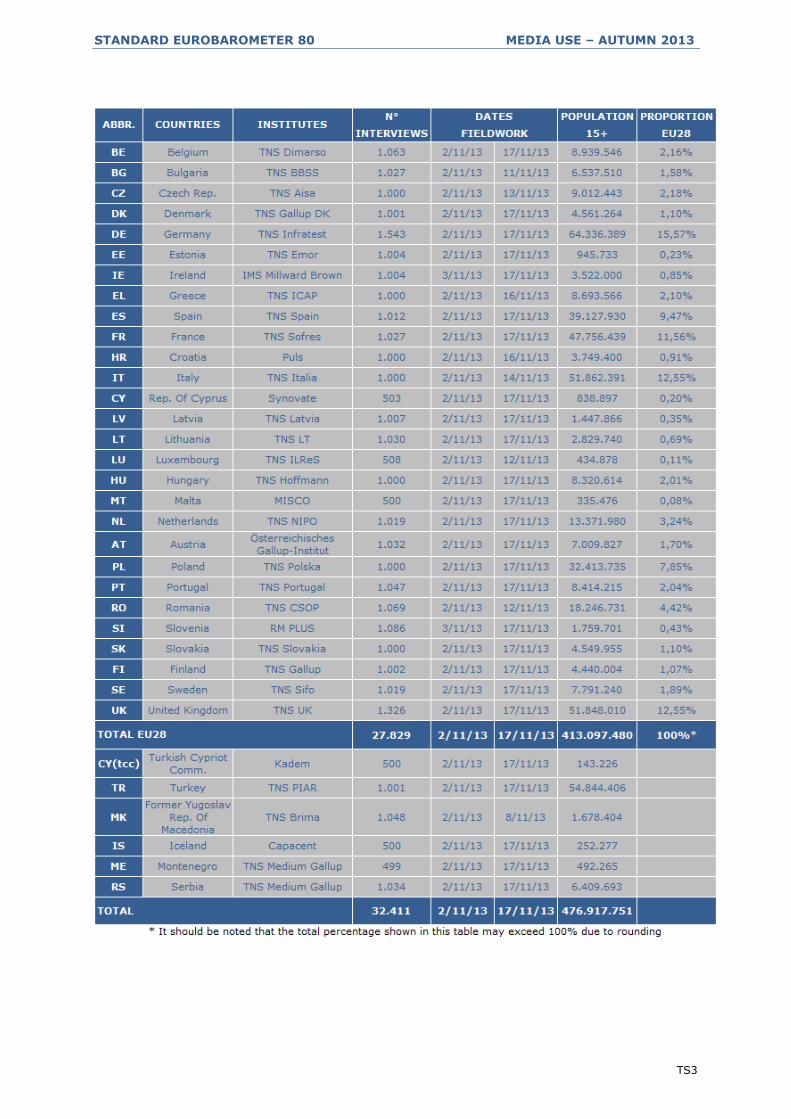
For each country a comparison between the sample and the universe was carried out. The Universe description
was derived from Eurostat population data or from national statistics offices. For all countries surveyed, a national
weighting procedure, using marginal and intercellular weighting, was carried out based on this Universe
description. In all countries, gender, age, region and size of locality were introduced in the iteration procedure.
For international weighting (i.e. EU averages), TNS Opinion & Social applies the official population figures as
provided by EUROSTAT or national statistic offices. The total population figures for input in this post-weighting
procedure are listed below.
STANDARD EUROBAROMETER 80 MEDIA USE – AUTUMN 2013
TS2
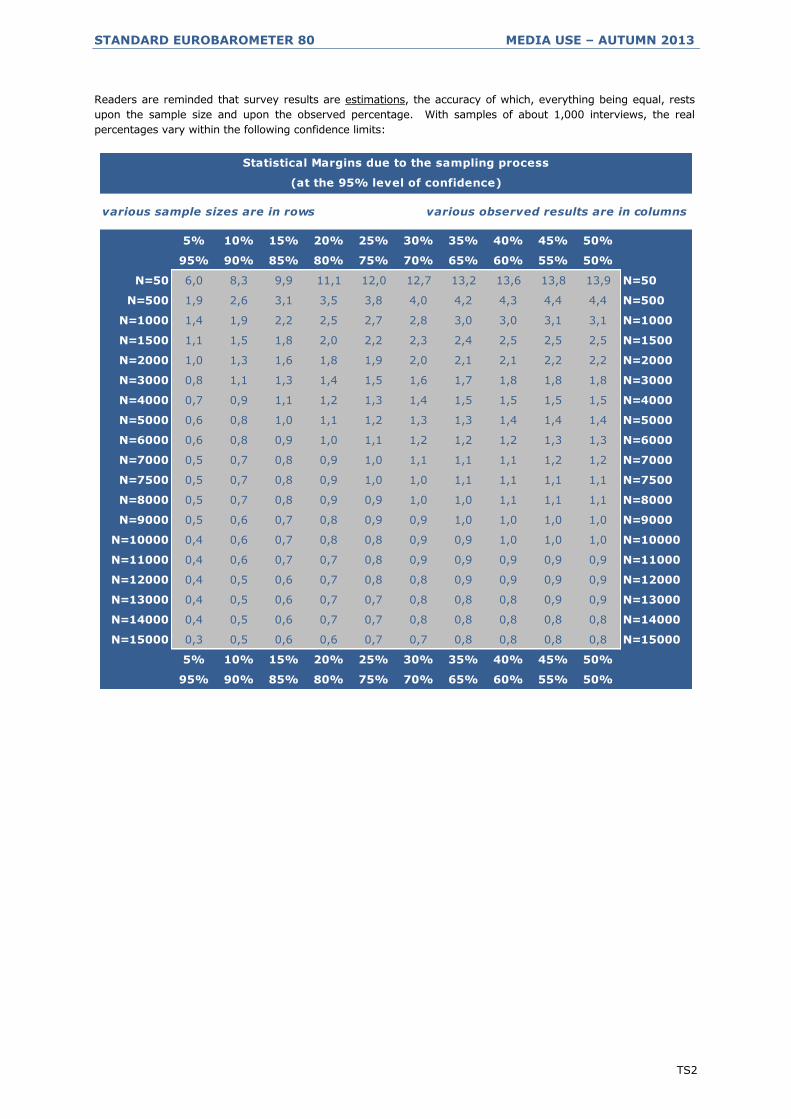
Readers are reminded that survey results are estimations, the accuracy of which, everything being equal, rests
upon the sample size and upon the observed percentage. With samples of about 1,000 interviews, the real
percentages vary within the following confidence limits:
various sample sizes are in rows various observed results are in columns
5% 10% 15% 20% 25% 30% 35% 40% 45% 50%
95% 90% 85% 80% 75% 70% 65% 60% 55% 50%
N=50 6,0 8,3 9,9 11,1 12,0 12,7 13,2 13,6 13,8 13,9 N=50
N=500 1,9 2,6 3,1 3,5 3,8 4,0 4,2 4,3 4,4 4,4 N=500
N=1000 1,4 1,9 2,2 2,5 2,7 2,8 3,0 3,0 3,1 3,1 N=1000
N=1500 1,1 1,5 1,8 2,0 2,2 2,3 2,4 2,5 2,5 2,5 N=1500
N=2000 1,0 1,3 1,6 1,8 1,9 2,0 2,1 2,1 2,2 2,2 N=2000
N=3000 0,8 1,1 1,3 1,4 1,5 1,6 1,7 1,8 1,8 1,8 N=3000
N=4000 0,7 0,9 1,1 1,2 1,3 1,4 1,5 1,5 1,5 1,5 N=4000
N=5000 0,6 0,8 1,0 1,1 1,2 1,3 1,3 1,4 1,4 1,4 N=5000
N=6000 0,6 0,8 0,9 1,0 1,1 1,2 1,2 1,2 1,3 1,3 N=6000
N=7000 0,5 0,7 0,8 0,9 1,0 1,1 1,1 1,1 1,2 1,2 N=7000
N=7500 0,5 0,7 0,8 0,9 1,0 1,0 1,1 1,1 1,1 1,1 N=7500
N=8000 0,5 0,7 0,8 0,9 0,9 1,0 1,0 1,1 1,1 1,1 N=8000
N=9000 0,5 0,6 0,7 0,8 0,9 0,9 1,0 1,0 1,0 1,0 N=9000
N=10000 0,4 0,6 0,7 0,8 0,8 0,9 0,9 1,0 1,0 1,0 N=10000
N=11000 0,4 0,6 0,7 0,7 0,8 0,9 0,9 0,9 0,9 0,9 N=11000
N=12000 0,4 0,5 0,6 0,7 0,8 0,8 0,9 0,9 0,9 0,9 N=12000
N=13000 0,4 0,5 0,6 0,7 0,7 0,8 0,8 0,8 0,9 0,9 N=13000
N=14000 0,4 0,5 0,6 0,7 0,7 0,8 0,8 0,8 0,8 0,8 N=14000
N=15000 0,3 0,5 0,6 0,6 0,7 0,7 0,8 0,8 0,8 0,8 N=15000
5% 10% 15% 20% 25% 30% 35% 40% 45% 50%
95% 90% 85% 80% 75% 70% 65% 60% 55% 50%
Statistical Margins due to the sampling process
(at the 95% level of confidence)
STANDARD EUROBAROMETER 80 MEDIA USE – AUTUMN 2013
TS3