Embed Size (px)
Citation preview

Medical Center Health System
Community Health Needs AssessmentAugust 2013

Table of ContentsExecutive Summary 2
Process and Methodology 6
Health System Biography 10
Study Area 13
Demographic Overview 16
Health Data Overview 27
Phone Interview Findings 52
Common Themes 69
Prioritization 72
Resources in the Community 77
Information Gaps 85
About Community Hospital Consulting 87
Appendix 89
Request for Comments 160

EXECUTIVE SUMMARY
Medical Center Health System Community Health Needs Assessment Community Hospital Consulting
August 2013 2

ExecutiveSummary A comprehensive, six‐step Community Health Needs Assessment was conducted for Medical Center Health System (MCHS) by Community Hospital Consulting (CHC Consulting). This CHNA utilizes relevant health data and stakeholder input to identify the significant community health needs in Ector County, which is located in Region 9 of Texas. The CHNA Team, consisting of leadership from MCHS, met with staff from CHC Consulting on July 9, 2013 to review the research findings and prioritize the community health needs. Six significant community health needs were identified by assessing the prevalence of the issues identified in the health data findings combined with the frequency and severity of mentions in the interview and survey findings. The CHNA Team utilized a structured matrix to rank the community health needs based on three characteristics: size and prevalence of the issue, effectiveness of interventions and MCHS’s capacity to address the need. Once this prioritization process was complete MCHS leadership discussed the results and decided to address all of the six identified needs. The final list of prioritized needs, including a rationale for each priority, is listed below:
1. Prevention, education and services to address maternal and fetal health concerns
Priority Rationale: Findings suggest that there are disparities regarding maternal and fetal health conditions in Ector County. As of 2011, 10.4% of births in Ector County compared to 8.5% in Texas are low birth weight births and 5.7% of births in Ector County compared to 3.9% in Texas are births to teen mothers. As of 2010, a higher percentage of women smoked during pregnancy in Ector County (8.1%) compared to Texas (4.9%). Interviewees also suggested that teen pregnancy was a concern in Ector County. Reportedly teen parents are underserved, and interviewees discussed how better educating this population might decrease repercussions such as health complications with mothers and infants, and high dropout rates.
2. Fragmented continuum of care Priority Rationale: Findings indicate the continuum of care in Ector County is fragmented. Interviewees also referred to providers operating in isolation, and expressed the need for a more connected, community‐based model of care. It was suggested that there is a need for improved follow‐up care and communication from provider to patient about recovery procedures and medication. One interviewee said, “We have what are called ‘islands of excellence,’ and there is no connecting link.”
Medical Center Health System Community Health Needs Assessment Community Hospital Consulting
August 2013 3

3. Prevention, education and services to address high mortality rates, chronic diseases and unhealthy lifestyles
Priority Rationale: Findings indicate that Ector County has higher mortality rates than Texas in the following conditions: heart disease, cancer, chronic lower respiratory disease, accidents, cerebrovascular disease, Alzheimer’s Disease, diabetes, influenza and pneumonia, chronic liver disease and cirrhosis, and septicemia. Ector County has higher rates of chlamydia than Texas, as well as higher rates of gonorrhea. According to the Behavioral Risk Factor Surveillance System (BRFSS), 70.1% of respondents in Ector County are overweight or obese and 9.4% have diabetes. Finally, according to the BRFSS, almost 21% of respondents in Ector County identify as current smokers and nearly 16% of respondents in Ector County engage in binge drinking.
4. Need for primary care services and providers
Priority Rationale: Findings indicate there is a need for access to primary care services and providers in Ector County. Interviewees acknowledged the need for increased access to and the improvement of primary care services in the area. Interviewees also mentioned aging physicians, long wait times, lack of cultural awareness and a shortage of nursing personnel as possible reasons for patients over‐utilizing emergency departments. Pediatric care was mentioned as an area for improvement in regard to the limited number of pediatric providers. Additional specialty services were also mentioned: burn care, pediatric trauma, and prenatal care.
5. Health disparities among specific populations
Priority Rationale: Findings indicate that there are certain groups in Ector County that are at an increased risk for receiving inadequate care including the Hispanic, indigent and uninsured, children and preteens, and elderly populations. Interviewees acknowledged that there are high rates of diabetes among the Hispanic population. Many also mentioned that this population faces access barriers due to immigration status, and there are also potential language barriers in this population. Interviewees acknowledged the lack of affordable health care for the indigent and uninsured populations of Ector County. They referenced the rising cost of living within the county and a lack of knowledge of available services. Accessing dental care is also a concern in this population.
Interviewees discussed the following health issues that are prevalent among children in the community: asthma and other respiratory issues, and childhood obesity and diabetes. Interviewees mentioned the need for increased access to mental health services for children, referring to high rates of emotional disorders and families who face difficulties accessing care. Reportedly, large numbers of children and adolescents in Ector County do not have a medical home. Finally, the elderly population is at risk for
Medical Center Health System Community Health Needs Assessment Community Hospital Consulting
August 2013 4

receiving inadequate care. Limitations the elderly population faces include: transportation issues, finding providers who accept Medicare and going extended periods of time without filling prescriptions due to long wait times in physician offices.
6. Need for additional mental health care services and providers
Priority Rationale: Findings indicate that there is a need for increased access to mental and behavioral health services in Ector County. Interviewees referred to the recent closing of a local behavioral health facility, and need for a replacement facility. They also mentioned a lack of mental health services for children and adolescents. Limited government funding may prohibit access to mental health services. One interviewee said, “Mental health services are virtually nonexistent…in this area.”
Medical Center Health System Community Health Needs Assessment Community Hospital Consulting
August 2013 5

PROCESS AND METHODOLOGY
Medical Center Health System Community Health Needs Assessment Community Hospital Consulting
August 2013 6

Process and Methodology Background and Objectives This CHNA is designed in accordance with CHNA requirements identified in the Federal Patient Protection and Affordable Care Act and further addressed in the Internal Revenue Service Notice 2011-52 and proposed IRS REG – 106499-12 released April 3, 2013. The objectives of the CHNA are:
• Meet Federal Government and regulatory requirements • Research and report on the demographics and health status of the study area including a review of state and regional data • Gather input, data and opinions from persons who represent the broad interest of the community • Analyze the quantitative and qualitative data gathered and communicate results via a final comprehensive report on the needs of the
communities served by Medical Center Health System • Prioritize the needs of the community served by Medical Center Health System • Create an Implementation Plan that addresses the prioritized needs
Scope of CHNA Report: The CHNA components include:
• A description of the process and methods used to conduct this CHNA, including a summary of data sources used in this report • A biography of Medical Center Health System • A description of MCHS’s defined patient origin • Definition and analysis of the communities served by Medical Center Health System, including both a demographic and a health data
analysis • Findings from thirteen comprehensive interviews conducted with people who represent a broad interest in the communities, including:
o Persons with special knowledge of or expertise in public health; o Federal, tribal, regional, State, or local health or other departments or agencies, with current data or other information relevant
to the health needs of the community served by the hospital facility; and
Medical Center Health System Community Health Needs Assessment Community Hospital Consulting
August 2013 7

o Leaders, representatives, or members of medically underserved, low income, and minority populations, and populations with chronic disease needs, in the community served by the hospital facility.
The prioritized community needs and a separate implementation plan, which intends to address the community needs identified by the research
A description of additional health services and resources available in the community A list of information gaps that impact the health system’s ability to assess the health needs of the community served A description of the individuals interviewed for this CHNA
Methodology: Medical Center Health System worked with CHC Consulting in the development of its CHNA. MCHS provided essential data and resources necessary to initiate and complete the process, including the definition of the study area and the identification of key community stakeholders to be interviewed. CHC Consulting conducted the following research: A demographic analysis of the study area, utilizing demographic data from the Texas State Data Center A study of the most recent health data available Conducted one‐on‐one interviews with individuals who have special knowledge of the communities, and analyzed results Facilitated the prioritization process during the CHNA Team meeting on July 9, 2013
The methodology for each component of this study is summarized below. In certain cases methodology is elaborated in the body of the report.
Medical Center Health System o Background information about MCHS, including the mission and vision, was provided by the health system or taken from its
website. Study Area Definition
o The study area for MCHS is based on hospital inpatient discharge data from October 1, 2011 through September 30, 2012 and discussions with MCHS leadership.
Demographics of the Study Area o Population demographics include population change by race, ethnicity, age, median income analysis, unemployment and
economic statistics in the study area. o Demographic data sources include, but are not limited to, the Texas State Data Center and the Kids Count Data Center.
Health Data Collection Process
Medical Center Health System Community Health Needs Assessment Community Hospital Consulting
August 2013 8

o A variety of sources, which are all listed in the references section of this report, were utilized in the health data collection process.
o Health data sources include, but are not limited to, the Texas Department of State Health Services, the Behavioral Risk Factor Surveillance System and the U.S. Census Bureau.
• Interview Methodology o Medical Center Health System provided CHC Consulting with a list of persons with special knowledge of public health in Ector
County including public health representatives, not-for-profit organization professionals, charities and other individuals who focus specifically on underrepresented groups.
o From that list, thirteen in depth interviews were conducted using a structured interview guide. o Extensive notes were taken during each interview and then quantified based on responses, communities and populations served
(minority, elderly, un/underinsured, etc.), and priorities identified by respondents. Qualitative data from the interviews was also analyzed and reported.
• Prioritization Strategy o Six significant needs were determined by assessing the prevalence of the issues identified in the health data findings, combined
with the frequency and severity of mentions in the interviews. o Three factors were used to rank those needs during the CHNA Team meeting on July 9, 2013. o See the prioritization section for a more detailed description of the prioritization methodology.
Medical Center Health System Community Health Needs Assessment Community Hospital Consulting
August 2013 9

HEALTH SYSTEM BIOGRAPHY
Medical Center Health System Community Health Needs Assessment Community Hospital Consulting
August 2013 10

AboutMedicalCenterHealthSystem Medical Center Health System is proud of more than 60 YEARS OF CARING! We’ve changed quite a bit through the years, expanding from an 85‐bed hospital to a 402 bed regional Medical Center. We started out serving only a few thousand patients a year. Today, we treat more than 100,000 patients annually through our Emergency Department, as a hospital admission or as an outpatient. Although many things have changed through the years, one thing remains the same: Our commitment to quality of care! The first few years were critical to the evolution of healthcare for Ector County. In 1948, there were three Hospitals in Odessa. Dr. Elbert Thorton owned a six‐bed Hospital. Dr. Emmett Headlee owned the Headlee Hospital, which is now the Ector County Library and Dr. J.K. Wood owned a 34‐ bed facility called Wood Hospital, which was located at the corner of 5th & Texas Streets. Due to the need for more healthcare services, a group of citizens, spearheaded by Dr. Wood, met with the Ector County Commissioners to propose a new Hospital. The proposal became a reality. C.C. Gibson was hired as the Hospital Administrator. His job was to prepare for the Grand Opening. On November 27, 1949, the Ector County Hospital was dedicated. On December 5, 1949, the doors were opened for patients. The construction cost of the 85‐bed facility was $838,946 and the top Nursing wage was $150 per month. In 1951, the name was changed to Medical Center Hospital. The bed capacity was increased to 100. There were 6,000 patients that year with an average bill of $86. There was an epidemic of Polio that year with 125 patients seen in one day! In 1952, MCH was already growing beyond everyone’s expectations. That same year, a Bond Election for an expansion was passed and construction began. As the decades unfolded, MCH developed into the regional health facility for the Permian Basin.
Services Provided by Medical Center Health System include:
Bariatric Services Cancer Services Cardiac Services Diabetes Center Emergency Services Family Health Clinic Imaging Services
Inpatient Rehab Maternity Care Mission Fitness Nursing Orthopedics Outpatient Services PBHN
Patient Navigation Pediatric Services ProCare Respiratory Services Ronald McDonald Care
Mobile Sleep Center
Sports Medicine Stroke Services Student Services Surgical Services Trauma Services Volunteer Services
West Texas Cancer Center
Medical Center Health System Community Health Needs Assessment Community Hospital Consulting
August 2013 11

Mission,Vision,ValuesMissionMedical Center Health System is a community‐based teaching organization dedicated to providing high‐quality and affordable healthcare to improve the health and wellness of all residents of the Permian Basin. VisionMCHS will be the premier source for health and wellness. Values“I CARE” – Integrity • Customer Centered • Accountability • Respect • Excellence
Medical Center Health System Community Health Needs Assessment Community Hospital Consulting
August 2013 12

STUDY AREA
Medical Center Health System Community Health Needs Assessment Community Hospital Consulting
August 2013 13

Study Area
• The “community served” (also referred to as the study area) for Medical Center Health System is based on FY 2012 hospital inpatient discharge data, as well as discussions with MCHS staff.
• Because Ector County comprises 68.4% of the hospital’s inpatient discharges, MCHS has decided to limit the study area definition to:– Ector County
Medical Center Health System Community Health Needs Assessment Community Hospital Consulting
August 2013 14

Medical Center Health System Study Area
Ector County makes up 68.4% of inpatient discharges*The “H” indicates MCHS
% of Total Cumulative % of Total
Ector TX 9,202 68.4% 68.4%All Others 4,248 31.6% 100.0%Total 13,450 100%
% of Volume
Source: Hospital Inpatient Discharge Data by DRG; October 1, 2011 ‐ September 30, 2012; Normal Newborns MS‐DRG 795 excluded
County StateFY 2012
Discharges
Medical Center Health System Community Health Needs Assessment Community Hospital Consulting
August 2013 15

DEMOGRAPHIC OVERVIEW
Medical Center Health System Community Health Needs Assessment Community Hospital Consulting
August 2013 16

Overall Population Change
Source: Texas State Data Center; http://txsdc.utsa.edu/Data/Files.aspx?cmd=Bh4iUm2n75LX0Zy9zmVCmnFcMEVw4iALjjBakybEAzVi74EtX3JW3g (accessed June 13, 2013)
0%
2%
4%
6%
8%
10%
Ector County Texas
Projected Population Growth2013‐2018 Percent Change
Geographic Location CY 2010 CY 2013 CY 2018 2013‐2018 Change
2013‐2018 % Change
Ector County 137,130 142,318 150,424 8,106 5.7%Texas 25,145,561 25,843,786 26,951,225 1,107,439 4.3%
Overall Population Growth
Medical Center Health System Community Health Needs Assessment Community Hospital Consulting
August 2013 17

Population by Race/Ethnicity 2013
44.4%
11.5%
38.5%
5.6%
Texas
Source: Texas State Data Center; http://txsdc.utsa.edu/Data/Files.aspx?cmd=Bh4iUm2n75LX0Zy9zmVCmnFcMEVw4iALjjBakybEAzVi74EtX3JW3g (accessed June 13, 2013)
39.9%
4.1%
53.9%
2.1%
Ector County
Medical Center Health System Community Health Needs Assessment Community Hospital Consulting
August 2013 18

Population by Age 2013
26.8%
10.1%
27.6%
24.2%
11.3%
Texas
Source: Texas State Data Center; http://txsdc.utsa.edu/Data/Files.aspx?cmd=Bh4iUm2n75LX0Zy9zmVCmnFcMEVw4iALjjBakybEAzVi74EtX3JW3g (accessed June 13, 2013)
29.0%
10.2%
26.9%
23.1%
10.8%
Ector County
Medical Center Health System Community Health Needs Assessment Community Hospital Consulting
August 2013 19

Median Age
• Ector County has a slightly younger median age than the state.
Source: United States Census Bureau 2000 and 2010 data; http://quickfacts.census.gov/qfd/index.html (accessed April 25, 2013)
Ector County Texas2000 32.0 32.32010 32.4 33.6
0
5
10
15
20
25
30
35
40
Median Age
Medical Center Health System Community Health Needs Assessment Community Hospital Consulting
August 2013 20
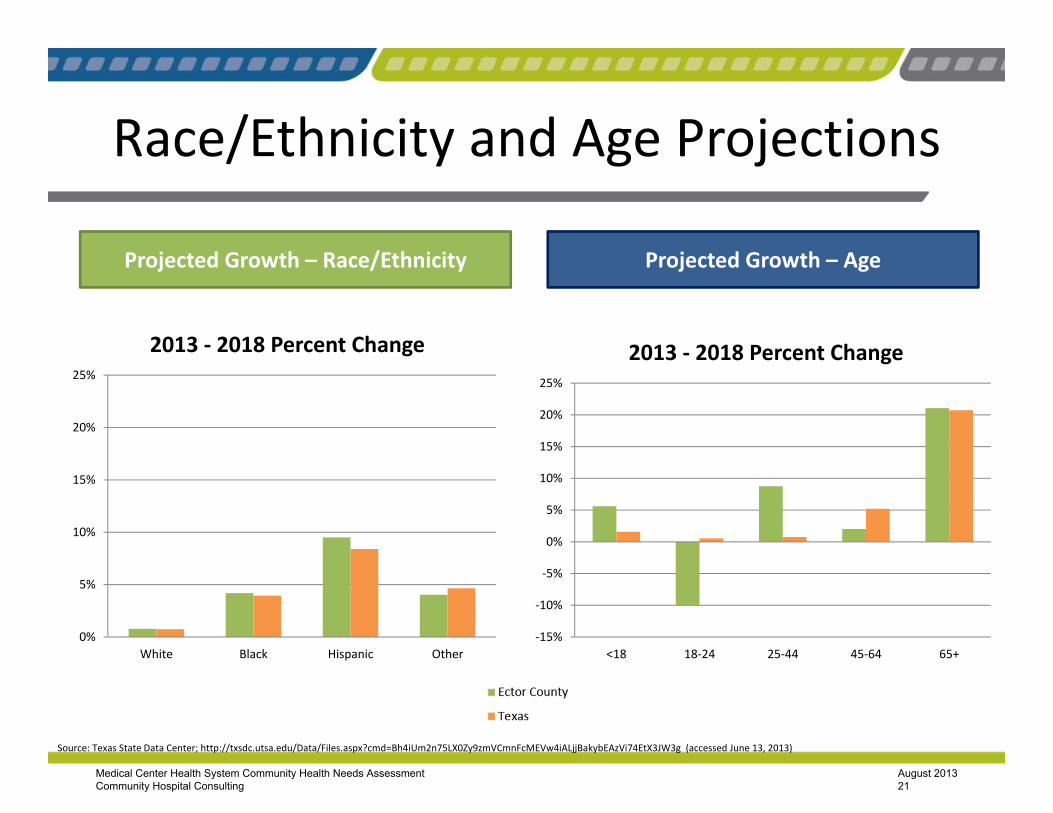
Race/Ethnicity and Age Projections
Projected Growth – Race/Ethnicity Projected Growth – Age
Source: Texas State Data Center; http://txsdc.utsa.edu/Data/Files.aspx?cmd=Bh4iUm2n75LX0Zy9zmVCmnFcMEVw4iALjjBakybEAzVi74EtX3JW3g (accessed June 13, 2013)
‐15%
‐10%
‐5%
0%
5%
10%
15%
20%
25%
<18 18‐24 25‐44 45‐64 65+
2013 ‐ 2018 Percent Change
0%
5%
10%
15%
20%
25%
White Black Hispanic Other
2013 ‐ 2018 Percent Change
Medical Center Health System Community Health Needs Assessment Community Hospital Consulting
August 2013 21

Unemployment
• Unemployment rates have decreased since 2009 in Ector County.
• As of 2012, Ector County has a much lower unemployment rate than Texas and the United States.
Source: Bureau of Labor Statistics, Local Area Unemployment Statistics; Rates shown are a percentage of the labor force; http://www.bls.gov/lau/#tables (accessed June 13 2013)
Ector County Texas United States2008 3.5% 4.9% 5.8%2009 8.0% 7.5% 9.3%2010 7.8% 8.2% 9.6%2011 5.8% 7.9% 8.9%2012 4.2% 6.8% 8.1%
0%2%4%6%8%10%12%14%
Percen
t
Annual Average Unemployment Rates (shown as percent of labor force)
Medical Center Health System Community Health Needs Assessment Community Hospital Consulting
August 2013 22

Income
• Ector County has a slightly lower median household income than Texas.
• Ector County’s median household income decreased between 2008 and 2010, but increased between 2010 and 2011.
Source: U.S. Census Bureau, Small Area Estimates Branch; http://www.census.gov/did/www/saipe/data/statecounty/data/2009.html (accessed April 26, 2013)
Ector County Texas2008 $46,868 $50,0492009 $43,935 $48,2862010 $42,339 $48,6222011 $47,930 $49,390
$0$10,000$20,000$30,000$40,000$50,000$60,000
Median Household Income
Medical Center Health System Community Health Needs Assessment Community Hospital Consulting
August 2013 23

Poverty
• 15.8% of residents in Ector County are living in poverty.
• More than 21% of children in Ector County are living in poverty.
Source: U.S. Census Bureau, Small Area Estimates Branch; (http://www.census.gov/did/www/saipe/data/statecounty/data/2009.html accessed April 26, 2013)See page 95 for the definition of poverty.
Ector County Texas2008 15.5% 15.8%2009 16.9% 17.1%2010 19.6% 17.9%2011 15.8% 18.5%
0%5%10%
15%20%25%30%
Percent in Poverty (All Ages)
Ector County Texas2008 20.8% 22.5%2009 23.1% 24.3%2010 28.3% 25.7%2011 21.2% 26.6%
0%5%10%
15%20%25%30%
Percent of Children in Poverty (Under 18)
Medical Center Health System Community Health Needs Assessment Community Hospital Consulting
August 2013 24

Children in the Study Area
• 66.5% of students in Ector County receive free and reduced price lunch, compared to 62.4% in Texas.
Source: The Annie E. Casey Foundation, The Kids Count Data Center; http://datacenter.kidscount.org/ (accessed June 13, 2013)
Ector County Texas2006‐2007 59.0% 59.0%2007‐2008 56.0% 59.0%2008‐2009 56.0% 60.0%2009‐2010 65.8% 63.1%2010‐2011 66.5% 62.4%
0%10%20%30%40%50%60%70%
Percen
t
Free/Reduced Price Lunch
Medical Center Health System Community Health Needs Assessment Community Hospital Consulting
August 2013 25

Children in the Study Area
• 10.4% of students in Ector County are enrolled in Bilingual/ESL Programs, compared to 16.2% in Texas.
Source: The Annie E. Casey Foundation, The Kids Count Data Center; http://datacenter.kidscount.org/ (accessed June 13, 2013)
Ector County Texas2006‐2007 11.3% 14.8%2007‐2008 11.2% 15.5%2008‐2009 11.5% 16.0%2009‐2010 10.9% 16.1%2010‐2011 10.4% 16.2%
0%5%10%15%20%25%30%
Perent
Students Enrolled in Bilingual/ESL Programs
Medical Center Health System Community Health Needs Assessment Community Hospital Consulting
August 2013 26

HEALTH DATA OVERVIEW
Medical Center Health System Community Health Needs Assessment Community Hospital Consulting
August 2013 27

Data Methodology
• The following information outlines specific health data:– Mortality, chronic diseases and conditions, health behaviors, natality, mental health and access
• Data Sources include, but are not limited to:– Texas Department of State Health Services– The Behavioral Risk Factor Surveillance System (BRFSS)
• The Behavioral Risk Factor Surveillance System (BRFSS) is the world’s largest, on‐going telephone health survey system, tracking health conditions and risk behaviors in the United States yearly since 1984. Currently, data are collected monthly in all 50 states, the District of Columbia, Puerto Rico, the U.S. Virgin Islands, and Guam.
• It is a state‐based system of health surveys that collects information on health risk behaviors, preventive health practices, and health care access primarily related to chronic disease and injury. For many states, the BRFSS is the only available source of timely, accurate data on health‐related behaviors.
• States use BRFSS data to identify emerging health problems, establish and track health objectives, and develop and evaluate public health policies and programs. Many states also use BRFSS data to support health‐related legislative efforts.
– United States Census Bureau– The Robert Wood Johnson Foundation and the University of Wisconsin Population Health Institute– RHP Plan 14 Community Needs
• Data Levels: Nationwide, state, region and county level data
Medical Center Health System Community Health Needs Assessment Community Hospital Consulting
August 2013 28

Source: Texas Department State Health Service, Health Service Regions (accessed January 14, 2013)
Ector County is located in Region 9.
Medical Center Health System Community Health Needs Assessment Community Hospital Consulting
August 2013 29

RHP 14 ‐ Counties
RHP 14 – Counties include: Andrews, Brewster, Crane, Culberson, Ector, Glasscock, Howard, Jeff Davis, Loving, Martin, Midland, Presidio, Reeves, Upton, Ward, and Winkler Counties
Medical Center Health System Community Health Needs Assessment Community Hospital Consulting
August 2013 30

County Health Rankings (2013)
• The County Health Rankings rank 232 counties in Texas (1 being the best, 232 being the worst).
• Various factors go into these rankings. For example, the clinical care ranking is based on:– Uninsured– Primary care physicians– Dentists– Preventable hospital stays– Diabetic screening– Mammography screening
2013 County Health RankingsEctor County
Health Outcomes 201MORTALITY 161MORBIDITY 223
Health Factors 215HEALTH BEHAVIORS 227CLINICAL CARE 155SOCIAL & ECONOMIC FACTORS 172PHYSICAL ENVIRONMENT 183
Source: The Robert Wood Johnson Foundation and the University of Wisconsin Population Health Institute (www.countyhealthrankings.org)Data accessed June 18, 2013
Medical Center Health System Community Health Needs Assessment Community Hospital Consulting
August 2013 31

Mortality Summary• As of 2010, Ector County has higher age‐adjusted death rates than Texas in all of the ten leading causes of death.
• As of 2010, heart disease is the leading cause of death in Ector County, the RHP 14 – Counties and Texas.
• Cancer is the second leading cause of death in Ector County, the RHP 14 ‐ Counties and Texas.– Ector County has higher incidence rates than Texas of:
• Colon and rectum cancer• Breast cancer• Lung and bronchus cancer
• Additional causes of death that may be a concern in Ector County are accidents, cerebrovascular disease, and chronic lower respiratory disease.
Source: Texas Health Data, Deaths of Texas Residents; Last Updated March 26, 2012; http://soupfin.tdh.state.tx.us/death10.htm (accessed June 14, 2013)Source: Texas Cancer Registry, Cancer Inquiry System (Accessed June 19, 2013).
Medical Center Health System Community Health Needs Assessment Community Hospital Consulting
August 2013 32

Mortality(Death Rate)
• Ector County has had a higher age‐adjusted death rate than Texas since 2008.
Source: Texas Health Data, Deaths of Texas Residents; Last Updated March 26, 2012; http://soupfin.tdh.state.tx.us/death10.htm (accessed June 14, 2013)
Ector County RHP 14 ‐ Counties Texas2008 969.1 863.4 808.82009 899.5 789.9 781.22010 985.3 835.0 770.3
0
200
400
600
800
1,000
1,200
Age‐adjusted Death Rate (per 100,000)
RHP 14 – Counties include: Andrews, Brewster, Crane, Culberson, Ector, Glasscock, Howard, Jeff Davis, Loving, Martin, Midland, Presidio, Reeves, Upton, Ward, and Winkler Counties
Medical Center Health System Community Health Needs Assessment Community Hospital Consulting
August 2013 33

Mortality(Leading Causes of Death in 2010)
Source: Texas Health Data, Deaths of Texas Residents; Last Updated March 26, 2012; http://soupfin.tdh.state.tx.us/death10.htm (accessed June 14, 2013)
Ector County RHP 14 ‐ Counties Texas1. Diseases of the Heart (I00‐I09, I11, I13, I20‐I51)
1. Diseases of the Heart (I00‐I09, I11,I13, I20‐I51)
1. Diseases of the Heart (I00‐I09, I11, I13, I20‐I51)
2. Malignant Neoplasms (C00‐C97) 2. Malignant Neoplasms (C00‐C97) 2. Malignant Neoplasms (C00‐C97)
3. Chronic Lower Respiratory Diseases (J40‐J47)
3. Chronic Lower Respiratory Diseases (J40‐J47) 3. Cerebrovascular Diseases (I60‐I69)
4. Accidents (V01‐X59, Y85‐Y86) 4. Accidents (V01‐X59, Y85‐Y86) 4. Chronic Lower Respiratory Diseases (J40‐J47)
5. Cerebrovascular Diseases (I60‐I69) 5. Cerebrovascular Diseases (I60‐I69) 5. Accidents (V01‐X59, Y85‐Y86)
6. Alzheimer's Disease (G30) 6. Alzheimer's Disease (G30) 6. Alzheimer's Disease (G30)
7. Diabetes Mellitus (E10‐E14) 7. Diabetes Mellitus (E10‐E14) 7. Diabetes Mellitus (E10‐E14)
8. Influenza and Pneumonia (J09‐J18) 8. Influenza and Pneumonia (J09‐J18)8. Nephritis, Nephrotic Syndrome and Nephrosis (N00‐N07, N17‐N19, N25‐N27)
9. Chronic Liver Disease and Cirrhosis (K70, K73‐K74) 9. Septicemia (A40‐A41) 9. Influenza and Pneumonia (J09‐J18)
10. Septicemia (A40‐A41) 10. Chronic Liver Disease and Cirrhosis (K70, K73‐K74) 10. Septicemia (A40‐A41)
RHP 14 – Counties include: Andrews, Brewster, Crane, Culberson, Ector, Glasscock, Howard, Jeff Davis, Loving, Martin, Midland, Presidio, Reeves, Upton, Ward, and Winkler Counties
Medical Center Health System Community Health Needs Assessment Community Hospital Consulting
August 2013 34

Mortality(Rates Age‐Adjusted per 100,000)
Source: Texas Health Data, Deaths of Texas Residents; Last Updated March 26, 2012; http://soupfin.tdh.state.tx.us/death10.htm (accessed June 14, 2013)
Disease Ector County RHP 14 ‐ Counties TexasDiseases of the Heart (I00‐I09, I11, I13, I20‐I51) 266.7 213.5 180.4
Malignant Neoplasms (C00‐C97) 184.5 163.7 165.6Chronic Lower Respiratory Diseases (J40‐J47) 86.3 67.0 43.0
Accidents (V01‐X59, Y85‐Y86) 56.3 51.3 38.7Cerebrovascular Diseases (I60‐I69) 68.2 44.9 44.3
Alzheimer's Disease (G30) 27.4 41.0 26.7Diabetes Mellitus (E10‐E14) 27.6 21.9 21.6Influenza and Pneumonia (J09‐J18) 19.6 21.6 14.6
Chronic Liver Disease and Cirrhosis (K70, K73‐K74) 17.3 16.6 11.7
Septicemia (A40‐A41) 16.2 18.1 14.8
Leading Causes of Death in Ector County compared to RHP 14 – Counties and Texas in 2010
RHP 14 – Counties include: Andrews, Brewster, Crane, Culberson, Ector, Glasscock, Howard, Jeff Davis, Loving, Martin, Midland, Presidio, Reeves, Upton, Ward, and Winkler Counties
Key:Red circle indicates the county's rate is higher than Texas' rate for that particular disease category in 2010Green circle indicates the county's rate is lower than Texas' rate for that particular disease category in 2010
Medical Center Health System Community Health Needs Assessment Community Hospital Consulting
August 2013 35

Heart Disease Mortality(Rates Age‐Adjusted per 100,000)
• Ector County has had a higher heart disease mortality rate than the RHP 14 – Counties and Texas since 2008.
• Ector County’s heart disease mortality rate decreased between 2008 and 2009, but spiked again in 2010.
Source: Texas Health Data, Deaths of Texas Residents; Last Updated March 26, 2012; http://soupfin.tdh.state.tx.us/death10.htm (accessed June 14, 2013)
Ector County RHP 14 ‐ Counties Texas2008 260.4 223.5 194.32009 228.5 198.4 186.72010 266.7 213.5 180.4
0
50
100
150
200
250
300
Heart Disease
Location 2008 2009 2010Ector County 306 280 291RHP 14 ‐ Counties 842 777 774Texas 38,493 38,008 38,096
Number of Deaths
RHP 14 – Counties include: Andrews, Brewster, Crane, Culberson, Ector, Glasscock, Howard, Jeff Davis, Loving, Martin, Midland, Presidio, Reeves, Upton, Ward, and Winkler Counties
Medical Center Health System Community Health Needs Assessment Community Hospital Consulting
August 2013 36

Cancer Mortality(Rate Age‐Adjusted per 100,000)
• Ector County has a higher cancer mortality rate than the RHP 14 – Counties and Texas.
• Texas’ cancer mortality rate is decreasing, while Ector County’s rate increased between 2009 and 2010.
Source: Texas Health Data, Deaths of Texas Residents; Last Updated March 26, 2012; http://soupfin.tdh.state.tx.us/death10.htm (accessed June 14, 2013)
Location 2008 2009 2010Ector County 226 224 217RHP 14 ‐ Counties 613 608 613Texas 35,618 35,531 36,652
Number of Deaths
RHP 14 – Counties include: Andrews, Brewster, Crane, Culberson, Ector, Glasscock, Howard, Jeff Davis, Loving, Martin, Midland, Presidio, Reeves, Upton, Ward, and Winkler Counties
Ector County RHP 14 ‐ Counties Texas2008 185.5 160.7 172.42009 177.9 154.1 167.62010 184.5 163.7 165.6
020406080100120140160180200
Cancer
Medical Center Health System Community Health Needs Assessment Community Hospital Consulting
August 2013 37

Cancer Incidence(Rates Age‐Adjusted per 100,000; 2006‐2010 combined rate)
Source: Texas Cancer Registry, Cancer Inquiry System (accessed June 18, 2013).
53.842.5
Ector County Texas
Colon and Rectum
63.8 61.5
Ector County Texas
Breast
77.561.6
Ector County Texas
Lung and Bronchus
95.8
133.2
Ector County Texas
Prostate
Medical Center Health System Community Health Needs Assessment Community Hospital Consulting
August 2013 38

Chronic Lower Respiratory Disease Mortality (Rate Age‐Adjusted per 100,000)
Source: Texas Health Data, Deaths of Texas Residents; Last Updated March 26, 2012; http://soupfin.tdh.state.tx.us/death10.htm (accessed June 14, 2013)
• Chronic lower respiratory disease is the third leading cause of death in Ector County.
• Ector County has had a substantially higher chronic lower respiratory disease mortality rate than the state since 2008.
Ector County RHP 14 ‐ Counties Texas2008 86.1 64.7 45.82009 86.0 66.2 43.42010 86.3 67.0 43.0
0102030405060708090
100
Chronic Lower Respiratory Disease
Location 2008 2009 2010Ector County 104 107 96RHP 14 ‐ Counties 245 259 242Texas 8,858 8,624 8,910
Number of Deaths
RHP 14 – Counties include: Andrews, Brewster, Crane, Culberson, Ector, Glasscock, Howard, Jeff Davis, Loving, Martin, Midland, Presidio, Reeves, Upton, Ward, and Winkler Counties
Medical Center Health System Community Health Needs Assessment Community Hospital Consulting
August 2013 39

Additional Mortality Causes(Rates Age‐Adjusted per 100,000)
• Leading types of accident deaths in 2010 in Ector County include:– Motor vehicle accidents (39)– Accidental Poisoning (17)– Other (7)
Source: Texas Health Data, Deaths of Texas Residents; Last Updated March 26, 2012; http://soupfin.tdh.state.tx.us/death10.htm (accessed June 14, 2013)
Ector County RHP 14 ‐ Counties Texas2008 64.0 54.8 41.42009 62.2 51.2 40.02010 56.3 51.3 38.7
01020304050607080
Accidents
Ector County RHP 14 ‐ Counties Texas2008 43.4 48.3 49.42009 54.7 43.5 45.82010 68.2 44.9 44.3
01020304050607080
Cerebrovascular Disease
Ector County RHP 14 ‐ Counties Texas2008 32.7 24.2 25.42009 28.9 24.0 23.12010 27.6 21.9 21.6
01020304050607080
Diabetes
RHP 14 – Counties include: Andrews, Brewster, Crane, Culberson, Ector, Glasscock, Howard, Jeff Davis, Loving, Martin, Midland, Presidio, Reeves, Upton, Ward, and Winkler Counties
Medical Center Health System Community Health Needs Assessment Community Hospital Consulting
August 2013 40

Communicable Diseases(Gonorrhea and Chlamydia; Rates Age‐adjusted per 100,00)
Source: Texas Department of State Health Services; Health Facts Profiles 2007, 2008 and 2009 (accessed June 19, 2013)
• There are higher rates of gonorrhea and chlamydia in Ector County compared Region 9 and Texas.
• Overall, chlamydia rates are increasing in Ector County, Region 9 and Texas.
Ector County Region 9 Texas2007 127.9 106.5 132.92008 168.1 129.1 129.82009 150.3 118.7 116.1
0100200300400500600
Rate
Gonorrhea Rates
Ector County Region 9 Texas2007 407.1 335 354.72008 483 447 405.82009 505.4 471.2 419
0
100
200
300
400
500
600Ra
teChlamydia Rates
Medical Center Health System Community Health Needs Assessment Community Hospital Consulting
August 2013 41

Chronic Conditions(Diabetes)
• Diabetes is the seventh leading cause of death in Ector County.
• According to BRFSS data, 9.4% of respondents in Ector County report that they have diabetes, compared to 10.8% in the RHP 14 – Counties and 9.8% in Texas.
Source: Texas Behavioral Surveillance System, Center for Health Statistics , Texas Department of State Health Services (accessed February 12, 2013)Diabetes definition: Respondents 18 years and older who report ever being told by a doctor that “you have diabetes,” excludes gestational diabetes
9.4%10.8%
9.8%
Ector County RHP 14 ‐ Counties Texas
Diabetes (shown as percent of respondents, ages 18+) 2007‐2010
RHP 14 – Counties include: Andrews, Brewster, Crane, Culberson, Ector, Glasscock, Howard, Jeff Davis, Loving, Martin, Midland, Presidio, Reeves, Upton, Ward, and Winkler Counties
Medical Center Health System Community Health Needs Assessment Community Hospital Consulting
August 2013 42

Chronic Conditions(Overweight & Obesity)
• According to BRFSS data, more than 70% of adult respondents in Ector County, compared to about 63% of respondents in the RHP 14 – Counties and about 66% of respondents in Texas are considered overweight or obese.
Source: Texas Behavioral Surveillance System, Center for Health Statistics , Texas Department of State Health Services (accessed February 12, 2013)Overweight or obese definition: Respondents 18 years and older who have a BMI calculated by self reported height and weight, BMI 25 or greater
70.1%63.4% 66.3%
Ector County RHP 14 ‐ Counties Texas
Overweight or Obese (shown as percent of respondents, ages 18+)
2007‐2010
RHP 14 – Counties include: Andrews, Brewster, Crane, Culberson, Ector, Glasscock, Howard, Jeff Davis, Loving, Martin, Midland, Presidio, Reeves, Upton, Ward, and Winkler Counties
Medical Center Health System Community Health Needs Assessment Community Hospital Consulting
August 2013 43

Health Behaviors(Physical Activity)
• Smaller percentages of respondents in Ector County (66.7%) compared to the RHP 14 – Counties (67.5%) and Texas (72.3%) report that they engage in leisure time physical activity.
Source: Texas Behavioral Surveillance System, Center for Health Statistics , Texas Department of State Health Services (accessed February 12, 2013)Leisure time physical activity definition: Respondents who report engaging in any physical activities or exercises, other than their normal job, during the past month
66.7% 67.5%72.3%
Ector County RHP 14 ‐ Counties Texas
Participation in Leisure Time Physical Activity (shown as percent of
respondents, ages 18+) 2007‐2010
RHP 14 – Counties include: Andrews, Brewster, Crane, Culberson, Ector, Glasscock, Howard, Jeff Davis, Loving, Martin, Midland, Presidio, Reeves, Upton, Ward, and Winkler Counties
Medical Center Health System Community Health Needs Assessment Community Hospital Consulting
August 2013 44
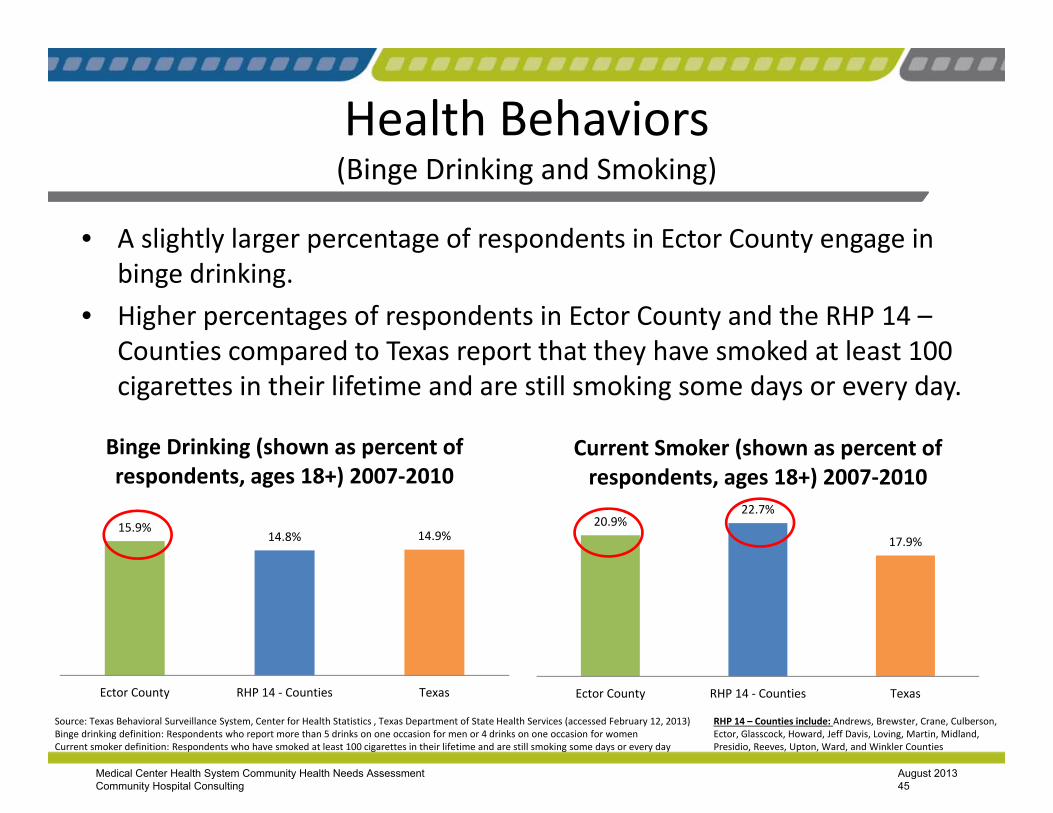
Health Behaviors(Binge Drinking and Smoking)
• A slightly larger percentage of respondents in Ector County engage in binge drinking.
• Higher percentages of respondents in Ector County and the RHP 14 –Counties compared to Texas report that they have smoked at least 100 cigarettes in their lifetime and are still smoking some days or every day.
Source: Texas Behavioral Surveillance System, Center for Health Statistics , Texas Department of State Health Services (accessed February 12, 2013)Binge drinking definition: Respondents who report more than 5 drinks on one occasion for men or 4 drinks on one occasion for womenCurrent smoker definition: Respondents who have smoked at least 100 cigarettes in their lifetime and are still smoking some days or every day
15.9%14.8% 14.9%
Ector County RHP 14 ‐ Counties Texas
Binge Drinking (shown as percent of respondents, ages 18+) 2007‐2010
20.9%22.7%
17.9%
Ector County RHP 14 ‐ Counties Texas
Current Smoker (shown as percent of respondents, ages 18+) 2007‐2010
RHP 14 – Counties include: Andrews, Brewster, Crane, Culberson, Ector, Glasscock, Howard, Jeff Davis, Loving, Martin, Midland, Presidio, Reeves, Upton, Ward, and Winkler Counties
Medical Center Health System Community Health Needs Assessment Community Hospital Consulting
August 2013 45

Natality and Maternal Health(Low Birth Weight (<2,500 Grams) and Teen Births)
• As of 2011, 10.4% of births in Ector County compared to 8.5% in Texas are low birth weight births.
• As of 2011, 5.7% of births in Ector County compared to 3.9% in Texas are births to teen mothers.
• As of 2010, a higher percentage of women smoked during pregnancy in Ector County (8.1%) compared to Texas (4.9%).
Source: Texas Department of State Health Services, Center for Health Statistics (accessed June 19, 2013)
% White % HispanicEctor County 10 9.4Region 9 8.4 8Texas 7.8 7.8
0
2
4
6
8
10
12
Percen
t
Percent of Low Birth Weight Births by Race/Ethnicity 2011
% White % HispanicEctor County 4.2 6.5Region 9 2.6 7.5Texas 1.6 5.6
0
2
4
6
8
10
12
Percen
t
Percent of Teen Births by Race/Ethnicity 2011
Medical Center Health System Community Health Needs Assessment Community Hospital Consulting
August 2013 46

Mental Health
• According to BRFSS data, about 27% of adult respondents in Ector County report poor mental health, compared to about 21% in the RHP 14 – Counties and slightly less than 20% in Texas.
Source: Texas Behavioral Surveillance System, Center for Health Statistics , Texas Department of State Health Services (accessed February 12, 2013)Poor mental health definition: Respondents who report 5 or more days of poor mental health, which includes stress, depressions and problems with emotions, in the past 30 days
27.1%
21.4%19.3%
Ector County RHP 14 ‐ Counties Texas
Poor Mental Health (shown as percent of respondents, ages 18+)
2007‐2010
RHP 14 – Counties include: Andrews, Brewster, Crane, Culberson, Ector, Glasscock, Howard, Jeff Davis, Loving, Martin, Midland, Presidio, Reeves, Upton, Ward, and Winkler Counties
Medical Center Health System Community Health Needs Assessment Community Hospital Consulting
August 2013 47

Health Care Access(Uninsured)
• Nearly 30% of residents in Ector County and just over 26% of residents in Texas are uninsured.
Sources: United States Census Bureau, Small Area Health Insurance Estimates (accessed June 13, 2013)
Ector County Texas2007 26.7% 26.8%2008 29.5% 25.7%2009 29.0% 26.3%2010 29.5% 26.3%
0%5%10%15%20%25%30%35%
Percen
t
Percentage of Uninsured Residents (Ages 0‐64)
Medical Center Health System Community Health Needs Assessment Community Hospital Consulting
August 2013 48

Health Care Access(Medical Cost Barriers)
• According to BRFSS data, 27% of respondents in Ector County report medical cost barriers compared to about 20% in the RHP 14 – Counties and Texas.
Source: Texas Behavioral Surveillance System, Center for Health Statistics , Texas Department of State Health Services (accessed February 12, 2013)Medical cost barriers definition: Respondents who report that they were not able to see a doctor because of cost in the past 12 months
27.0%
20.7% 19.8%
Ector County RHP 14 ‐ Counties Texas
Medical Cost Barriers (shown as percent of respondents, ages 18+)
2007‐2010
RHP 14 – Counties include: Andrews, Brewster, Crane, Culberson, Ector, Glasscock, Howard, Jeff Davis, Loving, Martin, Midland, Presidio, Reeves, Upton, Ward, and Winkler Counties
Medical Center Health System Community Health Needs Assessment Community Hospital Consulting
August 2013 49

Community Needs Identified in RHP 14
• High rates of chronic disease, including cancer, diabetes, heart disease, cardiovascular disease, respiratory diseases, Alzheimer’s, and obesity.
• High costs associated with preventable hospitalization admissions and readmissions.
• Shortages of health care professionals, including primary care physicians and mental health care providers.
• Lack of primary care physicians specializing in gynecology or geriatrics.
• Low utilization of preventative care services and screenings, especially by those with lower incomes.
Source: Texas Healthcare Transformation and Quality Improvement Program Medicaid 1115 Waiver, The RHP 14 Plan, http://www.texasrhp14.com/uploads/RHP_Plan_Region_14_12‐10‐12‐Final.pdf
Medical Center Health System Community Health Needs Assessment Community Hospital Consulting
August 2013 50

Community Needs Identified in RHP 14 (continued)
• Need to overcome patient access to care barriers. – E.g. language, previous experiences, distant travel required for many residents to access cardiac, neonatal, and pediatric intensive care, screening sites, physical rehabilitation, and long‐term care hospital services.
• Need for improvement in prenatal and perinatal care.
• Shortages in dental care.• Need for improvement in adolescent health, with focus on teen pregnancy, suicide, and obesity.
• Increase palliative care services.• High rate of teen pregnancy.
Source: Texas Healthcare Transformation and Quality Improvement Program Medicaid 1115 Waiver, The RHP 14 Plan, http://www.texasrhp14.com/uploads/RHP_Plan_Region_14_12‐10‐12‐Final.pdf
Medical Center Health System Community Health Needs Assessment Community Hospital Consulting
August 2013 51

PHONE INTERVIEW FINDINGS
Medical Center Health System Community Health Needs Assessment Community Hospital Consulting
August 2013 52

Overview
• Conducted 13 interviews with the three groups outlined in IRS Notice 2011‐52
• Discussed the health needs of the community, access issues, barriers and issues related to specific populations
• Gathered background information on each interviewee
Source: Medical Center Health System Community Health Needs Assessment Interviews conducted by Community Hospital Consulting; March 25, 2013 – May 1, 2013
Medical Center Health System Community Health Needs Assessment Community Hospital Consulting
August 2013 53

Interviewee Information• Margaret Burton: Director, Meals on Wheels of Odessa• Toby Eoff: Director, Medical Center Health System Foundation
• Mike George: President/CEO, Odessa Chamber of Commerce
• Grayson Hankins: Owner, University Pharmacy• Laura Mathew, RN: Director/Liaison, Health Services –Ector County Independent School District
• Many Puga: President, Odessa Hispanic Chamber of Commerce
Source: Medical Center Health System Community Health Needs Assessment Interviews conducted by Community Hospital Consulting; March 25, 2013 – May 1, 2013
Medical Center Health System Community Health Needs Assessment Community Hospital Consulting
August 2013 54

Interviewee Information
• Tom Pursel: Executive Director, United Way of Odessa• H.T. Sanchez, Ed.D.: Interim Superintendent, Ector County Independent School District
• Ravi Shakamuri, M.S.: CEO, Star Care Health Services• Greg Simmons: Precinct 2 Commissioner, Ector CountyCommissioners’ Court
• Gino Solla: Director, Ector County Health Department• Gregory D. Williams, Ed. D.: President, Odessa College• Tamrasha Williams, MD: Chief of Staff and Anesthesiologist, Medical Center Health System
Source: Medical Center Health System Community Health Needs Assessment Interviews conducted by Community Hospital Consulting; March 25, 2013 – May 1, 2013
Medical Center Health System Community Health Needs Assessment Community Hospital Consulting
August 2013 55

Areas Served by Organizations
Organization Area(s) Served
Ector County Commissioners’ Court Ector County
Ector County Health Department Ector County
Ector County Independent School District Ector County
Meals on Wheels of Odessa Odessa, TX
Medical Center Health System Permian Basin
Medical Center Health System Foundation Permian Basin
Odessa Chamber of Commerce Odessa, TX
Odessa College Odessa, TX
Odessa Hispanic Chamber of Commerce Odessa, TX
Star Home Health Permian Basin
United Way of Odessa Ector County
University Pharmacy Odessa, TX
The areas primarily served by the interviewees’
organizations are broken out in the chart to the left. Some of the organizations serve
community members/patients in
multiple areas.
Source: Medical Center Health System Community Health Needs Assessment Interviews conducted by Community Hospital Consulting; March 25, 2013 – May 1, 2013
Medical Center Health System Community Health Needs Assessment Community Hospital Consulting
August 2013 56

Interviewee Characteristics
• Special knowledge of or expertise in public health 69%
•Work for federal, tribal, regional, state or local health department or agency 8%
• Leader, representative or member of medically underserved, low‐income, minority or chronic disease population(s)
85%
Source: Medical Center Health System Community Health Needs Assessment Interviews conducted by Community Hospital Consulting; March 25, 2013 – May 1, 2013
Medical Center Health System Community Health Needs Assessment Community Hospital Consulting
August 2013 57

Community Needs Summary
• Interviewees discussed the following as the most significant health issues:– Health Literacy–Mental and Behavioral Health Services– Fragmented Care– Primary and Specialty Care Services– Teen Pregnancy– Special Populations
Source: Medical Center Health System Community Health Needs Assessment Interviews conducted by Community Hospital Consulting; March 25, 2013 – May 1, 2013
Medical Center Health System Community Health Needs Assessment Community Hospital Consulting
August 2013 58

Health LiteracyHealth and Wellness Education
• Interviewees acknowledged the need for increased health and wellness education within the community.
• Interviewees discussed the prevalence of unhealthy lifestyles, and the need to educate the public on chronic illness prevention.
• There was also reference to high rates of diabetes among African American and Hispanic populations.
“There are not enough healthy living programs currently in place.”
“[I would choose to] fix the health education that is provided to the community – because I think empowering the individual is the most
important thing. You can’t ask for accountability from a patient unless they’re educated enough to know what their risks
are.”
“The community is in need of increased engagement in health education. We have access to programs that will help residents lead healthy lifestyles, if people will just take
advantage [of them]”
Source: Medical Center Health System Community Health Needs Assessment Interviews conducted by Community Hospital Consulting; March 25, 2013 – May 1, 2013
Medical Center Health System Community Health Needs Assessment Community Hospital Consulting
August 2013 59

Health Literacy (continued)Health Services Education
• Interviewees acknowledged the lack of resource utilization, and expressed a need for increased advertisement and awareness of available health care services and programs.
• Interviewees mentioned the increase of new residents and the need to connect these newcomers to existing services.
– Interviewees expressed how more awareness of available services might reduce the use of emergency departments for nonemergentsituations by residents.
• Interviewees mentioned young, low income mothers as a group who might benefit from increased education on the importance of neonatal care.
“A lot of people are new to the community, so there is a constant opportunity for marketing and
education.”
“Citizens need to be educated on how to seek resources through the medical
system.”
“We have increasing numbers of visits to the ER…Free medical care is the
perception.”
Source: Medical Center Health System Community Health Needs Assessment Interviews conducted by Community Hospital Consulting; March 25, 2013 – May 1, 2013
Medical Center Health System Community Health Needs Assessment Community Hospital Consulting
August 2013 60

Mental and Behavioral Health Services• Interviewees discussed the need
for increased access to mental and behavioral health services.
• Interviewees referred to the recent closing of a local behavioral health facility, and need for a replacement facility.
• Interviewees mentioned a lack of mental health services for children and adolescents.
• It was mentioned that limited government funding may prohibit access to mental health services.
“Mental health services are virtually nonexistent…in this area.”
“We had a local behavioral [health] center close recently, and there is a great need for a replacement facility. Having one out here
would benefit a lot of families.”
“We see a lot of emotional disorders [in children] and there are very few child
psychiatrists in Odessa.”
“A lot of times the substance abuse we see [among students] is…self‐medicating for a
mental illness.”
“The county has limited capabilities. There is a great program manager…but he has limited
funds available…his hands are tied.”
Source: Medical Center Health System Community Health Needs Assessment Interviews conducted by Community Hospital Consulting; March 25, 2013 – May 1, 2013
Medical Center Health System Community Health Needs Assessment Community Hospital Consulting
August 2013 61

Fragmented Care• Interviewees acknowledged a
fragmented continuum of care within the local health care system.
• Interviewees referred to providers operating in isolation, and expressed the need for a more connected, community‐based model of care.
• Interviewees mentioned a need for improved follow‐up care and communication from provider to patient about recovery procedures and medication.
“We have what are called ‘islands of excellence, ’ and there is no connecting
link.”
“There…needs to be a better understanding of what patients are responsible for as they leave the
doctor’s office.
“Providers operate separately from each other.”
Source: Medical Center Health System Community Health Needs Assessment Interviews conducted by Community Hospital Consulting; March 25, 2013 – May 1, 2013
Medical Center Health System Community Health Needs Assessment Community Hospital Consulting
August 2013 62

Primary and Specialty Care Services
• Interviewees acknowledged the need for increased access to and the improvement of primary care services in the area.
• Interviewees mentioned aging physicians, long wait times, lack of cultural awareness and a shortage of nursing personnel as possible reasons for patients over‐utilizing emergency departments.
• Interviewees referred to pediatric care as an area for improvement in regard to the limited number of pediatric providers.
• Interviewees acknowledged a need for increased access to the following specialty services: burn care, pediatric trauma, and prenatal care
“I don’t think we have enough general practitioners.”
“There is a shortage of primary care physicians. Waiting rooms around town are filled, and it’s not uncommon to wait a couple of hours before
you see a doctor.”
“Elderly patients sometimes don’t schedule appointments for prescription refills because it
takes all day to be see even with an appointment.”
“Specialists [are lacking] in the pediatric age range. We don’t have those types of
practitioners here. Those kids go out of town for specialty care.”
Source: Medical Center Health System Community Health Needs Assessment Interviews conducted by Community Hospital Consulting; March 25, 2013 – May 1, 2013
Medical Center Health System Community Health Needs Assessment Community Hospital Consulting
August 2013 63

Teen Pregnancy• Interviewees acknowledged
high rates of teen pregnancy within the community and the resulting health issues.
• Reportedly teen parents are underserved, and interviewees discussed how better educating this population might decrease repercussions such as health complications with mothers and infants, and high drop out rates.
“Teen pregnancy is a big issue…[and] there are a plethora of issues that arise as a result [including] low birth weight, frequent admissions to the NICU and
preterm labor.”
“[High percentages] of high school girls who get pregnant don’t graduate.”
“There are a number of teen parents within the school system and young
mothers in poverty…”
“Kids having kids – teenage pregnancy is a way of life [in Odessa].”
Source: Medical Center Health System Community Health Needs Assessment Interviews conducted by Community Hospital Consulting; March 25, 2013 – May 1, 2013
Medical Center Health System Community Health Needs Assessment Community Hospital Consulting
August 2013 64

Special PopulationsHispanic Population
• Interviewees acknowledged the Hispanic population of Odessa as a group at risk of receiving inadequate care.
• Interviewees mentioned high rates of diabetes among this population, and the need for increased prevention and management education.
• Interviewees noted that the Hispanic population resides primarily on the West side of Ector County, and faces difficulty accessing programs which are located primarily on the East side of the county.
• Reportedly, there is a percentage of this group that is hesitant to access care due to their immigration status.
• Language can be a barrier for this group.
“Diabetes is a major health issue among Hispanics in the community. They need a lot of diabetes advice and education on preventive
care and how to manage symptoms.”
“…we don’t have the focus in the geographic area [where] things are happening. A large part of the problem is that resources are not city
wide.”
“We are in need of an access point [among the Hispanic population] for the purpose of
education.”
“There are a large number of underserved people in our population. This is often ethnically based since they are newer residents. We have a large Hispanic population, many of whom do
not have any health insurance.”
Source: Medical Center Health System Community Health Needs Assessment Interviews conducted by Community Hospital Consulting; March 25, 2013 – May 1, 2013
Medical Center Health System Community Health Needs Assessment Community Hospital Consulting
August 2013 65

Special PopulationsIndigent and Uninsured Populations
• Interviewees acknowledged the lack of affordable health care for the indigent and uninsured populations of Ector County.
• Interviewees referred to the rising cost of living within the county and a lack of knowledge of available services (other than emergency rooms) as reasons indigent or uninsured families might go extended periods of time without care.
• Interviewees mentioned the need for improved access to free or low cost screenings and other preventive measures as a means to address health issues before they escalate.
• Reportedly, accessing affordable dental care is a challenge for these populations.
“The cost of health care is sky rocketing. The cost to go to a PCP is a major expense, and a
lot of people [in Ector County] are uninsured.”
“[Access] is inadequate in terms of the number of providers accepting under and
uninsured patients.”
“Access to health insurance would allow a person to go to the doctor earlier on or get
tested, and address issues as early as possible.”
Source: Medical Center Health System Community Health Needs Assessment Interviews conducted by Community Hospital Consulting; March 25, 2013 – May 1, 2013
Medical Center Health System Community Health Needs Assessment Community Hospital Consulting
August 2013 66

Special Populations (continued)Children & Preteens
• Interviewees discussed the following health issues that are prevalent among children in the community: asthma and other respiratory issues, and childhood obesity and diabetes.
• Interviewees mentioned the need for increased access to mental health services for children, referring to high rates of emotional disorders and families who face difficulties accessing care.
• Reportedly, large numbers of children and adolescents in Ector County do not have a medical home.
Elderly• Interviewees discussed limitations the elderly population faces in accessing
care: – Transportation issues, finding providers who accept Medicare and going extended
periods of time without filling prescriptions due to long wait times in physician offices.
Source: Medical Center Health System Community Health Needs Assessment Interviews conducted by Community Hospital Consulting; March 25, 2013 – May 1, 2013
Medical Center Health System Community Health Needs Assessment Community Hospital Consulting
August 2013 67

Positive Aspects of the Health Care System
1• Medical Center Health System’s recent expansions and movement toward prevention have had a positive impact in the community.
2• The Texas Tech Health Science Center Permian Basin Campus is a valuable health care resource in the community.
3• Recent technological improvements and advancements in electronic record keeping have been a plus.
4• The increasing establishment of urgent care facilities have helped to provide residents with more care options.
Source: Medical Center Health System Community Health Needs Assessment Interviews conducted by Community Hospital Consulting; March 25, 2013 – May 1, 2013
Medical Center Health System Community Health Needs Assessment Community Hospital Consulting
August 2013 68

COMMON THEMES
Medical Center Health System Community Health Needs Assessment Community Hospital Consulting
August 2013 69

Common Themes
• Need for Primary Care services and providers• Need for additional mental health care services and providers
• Prevention, education, and services to address high mortality rates, chronic diseases and unhealthy lifestyles.– Mortality: heart disease, cancer, chronic lower respiratory disease, cerebrovascular disease, accidents
– Chronic Diseases: obesity, diabetes, asthma– Unhealthy Lifestyles: smoking, drinking, physical inactivity, communicable diseases
Medical Center Health System Community Health Needs Assessment Community Hospital Consulting
August 2013 70

Common Themes
• Prevention, education and services to address maternal and fetal health concerns– Teen pregnancy/births– Prenatal care– Low birth weight births
• Fragmented continuum of care• Health disparities among specific populations
– Hispanic– Indigent and uninsured (including dental care)– Children and adolescents– Elderly
Medical Center Health System Community Health Needs Assessment Community Hospital Consulting
August 2013 71

PRIORITIZATION
Medical Center Health System Community Health Needs Assessment Community Hospital Consulting
August 2013 72

The Prioritization Process
• On July 9, 2013 leadership from Medical Center Health System met with Community Hospital Consulting to review findings and prioritize the community’s health needs.
• Leadership ranked the health needs based on three factors:– Size and Prevalence of Issue– Effectiveness of Interventions– MCHS Capacity
• See the following page for a more detailed description of the prioritization process.
Medical Center Health System Community Health Needs Assessment Community Hospital Consulting
August 2013 73

The Prioritization Process
The CHNA Team utilized the following factors to evaluate and prioritize the significant health needs.
Medical Center Health System Community Health Needs Assessment Community Hospital Consulting
August 2013 74

Health Needs RankingMCHS leadership ranked the six significant health needs based on the three factors discussed, resulting in the following list (5 indicates the greatest need, 1 indicates the least need).
3.00
3.78
4.56
4.67
4.67
4.89
0.00 1.00 2.00 3.00 4.00 5.00 6.00
Need for additional mental health care services and providers
Health disparities among specific populations
Need for Primary Care services and providers
Prevention, education and services to address high mortality rates,chronic diseases and unhealthy lifestyles
Fragmented continuum of care
Prevention, education and services to address maternal and fetalhealth concerns
Final Score
Medical Center Health System Community Health Needs Assessment Community Hospital Consulting
August 2013 75

Final PrioritiesMCHS leadership decided to address all of the ranked health needs. The final health priorities that MCHS will address through its Implementation Plan are:
1. Prevention, education and services to address maternal and fetal health concerns
2. Fragmented continuum of care3. Prevention, education and services to address high
mortality rates, chronic diseases and unhealthy lifestyles.4. Need for primary care services and providers5. Health disparities among specific populations6. Need for additional mental health care services and
providers
Medical Center Health System Community Health Needs Assessment Community Hospital Consulting
August 2013 76

RESOURCES IN THE COMMUNITY
Medical Center Health System Community Health Needs Assessment Community Hospital Consulting
August 2013 77

Additional Resources in the Community
• In addition to the services provided by Medical Center Health System, other charity care services and health resources available in Ector County are included in this section.
• As part of a subsequent CHNA, additional questions may be added to the interview guide as potential measures to determine positive changes in the identified significant community health needs.
Medical Center Health System Community Health Needs Assessment Community Hospital Consulting
August 2013 78

Organization Name Area Primarily Served Address City State Zip Code Phone Website Services Provided
211 Odessa ‐ ‐ ‐ ‐ 211 http://www.uwodessa.org/2‐1‐1 is an easy to remember number for accessing free information about community services to find help when you need it or find places you can
help.ACT Odessa 2445 E. 11th St. Odessa TX 79761 432‐333‐3667 Counseling Center
Alpha Behavioral Health Services
Odessa 855 Central Dr. #2 Odessa TX 79761 432‐614‐5720 www.odessatherapy.com
As solution‐focused therapists, our goal is to help you uncover your true potential and lead a life worth celebrating. If you're looking for extra
support and guidance through a challenging situation or you're just ready to move in a new direction in your life, we look forward to working with you to
achieve your goals.Alternative Solutions
CounselingOdessa 2458 E. 11th Odessa TX 79761 432‐582‐2444
www.alternativelifesolutionscounseling.com
Alternative Life Solutions Counseling seeks to help individuals find an alternative solution and new directions in life's daily struggles.
American Cancer Society of Odessa
Odessa 811 Central Dr. Odessa TX 79761 432‐334‐6121 www.cancer.org/ Provides health and referral services and transportation assistance to those
suffering from or at risk of cancer.
American Red Cross ‐ Permian Basin Area Chapter
Andrews, Borden, Brewster, Crane, Dawson, Ector,
Gaines, Glasscock, Howard, Jeff Davis, Loving, Martin, Midland, Pecos, Presidio, Reeves, Terrell, Upton,
Ward and Winkler Counties
9601 Wright Drive Midland TX 79711 432‐563‐2267 http://www.redcross.org/tx/midlandThe Permian Basin Area Chapter of the American Red Cross offers the
following services: disaster services, health and safety services, services to the armed forces and branch officers, and other volunteer services.
Asbury Angels Alliance ‐ Baby Blessings/Food Pantry
Odessa 4001 E. University Odessa TX 79762 432‐366‐4455 http://www.asburyumcodessa.org/
Baby Blessings is a ministry of the Asbury United Methodist Church in Odessa, TX. Baby Blessings collects supplies like wipes, bottles, etc., and
provides them to mothers in need. Asbury UMC also has a Food Pantry that collects and distributes nonperishable foods to local families in need.
Basin Detox West Texas 800‐317‐7818 www.basindetox.comProvide a comfortable and safe medical detoxification to alleviate the
withdrawl symptoms and the anxieties while having to go through detox.
Birthright of Odessa Odessa 2125 E. 42nd St. Odessa TX 79762 432‐332‐0081http://birthright.org/en/landingpage/l
p‐odessa
Birthright of Odessa offers the following services to women who are pregnant or think they may be pregnant: completely confidential help,
friendship and emotional support, free pregnancy tests, medical referrals, legal referrals, educational assistance and referrals, maternity and baby clothes, housing referrals, referrals to social agencies, and referrals for professional counseling information on prenatal development, job
search/career development, adoption, pregnancy and childbirth, child care options and child safety issues.
Boys and Girls Club of the Permian Basin ‐ Odessa
Odessa 800 East 13th Street Odessa TX 79761 432‐337‐8389 http://www.odessabgc.com/
At the Boys & Girls Club, our mission is to help young people, especially those who need us most, reach their full potential as productive, caring and responsible citizens. Our four locations are open year round for kids from 6 ‐18 years old with a school year schedule from 3 p.m. ‐ 7 p.m. and summer
schedule from 8 a.m. ‐ 5:30 p.m. In addition, each facility is open one Saturday per month. Each facility provides trained adult staff members,
academic support, computer learning labs, art, daily hot meal, gymnasiums, adjacent parks, game rooms, field trips, formal and informal athletic
leagues, and much more.
Boys Scouts Buffalo Trail Council
West Texas 1101 W. Texas Ave. Midland TX 79701 432‐570‐7601 http://www.buffalotrailbsa.org/The mission of the Buffalo Trail Council is to prepare young people to make ethical and moral choices over their lifetimes by instilling in them the values
of the Scout Oath and Scout Law.
Community Resources ‐ Medical Center Hospital of Odessa
Medical Center Health System Community Health Needs Assessment Community Hospital Consulting
August 2013 79

Organization Name Area Primarily Served Address City State Zip Code Phone Website Services Provided
Community Resources ‐ Medical Center Hospital of Odessa
Cal Farley's Boys Ranch and Girlstown, USA
Texas PO Box 1890 Amarillo TX 79174 800‐687‐3722 www.calfarley.orgCal Farley's is one of America's largest privately‐funded child and family service providers specializing in both residential and community‐based
services at no cost to the families of children in our care.
Camp Fire USA West TX Council
West Texas P.O. Box 50988 Midland TX 79710‐0988 432‐570‐4144 http://campfirewtx.org/
Camp Fire's youth development philosophies center around the concept of developmental assets. By design, Camp Fire USA programs are not only fun; they build specific skills and characteristics like self‐direction, confidence and school preparedness. Programs include after‐school care, resident and
multi‐week camps, service learning and youth‐driven leadership.
CASA of the Permian Basin Area
Ector, Crane, Loving, Ward and Winkler Counties
300 N. Grant, Ste. 207
Odessa TX 79761 432‐498‐4174 http://www.casapba.org/
CASA (Court Appointed Special Advocates) of the Permian Basin Area trains volunteers to advocate for the best interests of abused and neglected children in the court system to ensure that each child is placed in a safe,
permanent, and healthy environment.
Catholic Charities Ector County2500 Andrews
HighwayOdessa TX 79761 432‐332‐1387
http://www.catholiccharitiesodessatx.org/
Catholic Charities provides a continuum of services to those in need. Our goal is to meet the immediate needs, such as food, medicine and utilities, and to prepare clients for a life of self‐sufficiency through training in money
management, literacy, GED preparedness, and workforce training. All educational programs are provided free‐of‐charge.
Centers for Children and Families (Centers)
West Texas1004 N. Big Spring
St, Ste. 325Midland TX 79701 432‐570‐1084 http://www.centerswesttexas.org/
Centers for Children and Families exists to improve quality of life and strengthen the communities we serve through counseling, educational and supportive services. Services include general counseling, military support, post‐adoption support, parent education classes and supervised visitations.
Choiceworks Counseling Odessa 1406 N. Grandview Odessa TX 79761 432‐332‐9644 www.odessamarriagecounseling.com Counseling Center
Communities in Schools ‐ The Permian Basin
Permian Basin PO Box 60594 Midland TX 79711‐0594432‐552‐2496 (Odessa Office)
http://cispb.org/
Communities in Schools of the Permian Basin helps students stay in school and make the right choices by connecting them with needed community resources. From individualized case management services to facilitated
services or programs for a targeted group of students, CISPB helps ease the burden on schools, strengthen relationships between home and school, and increase opportunities for positive life choices and academic achievement. By implementing this approach, CISPB creates a community of caring adults who work directly with educators and are able to reach students most at
risk for dropping out of schools.
The Crisis CenterServing Andrews, Crane,
Ector, Gaines, Loving, Reese, Ward and Winkler Counties
4526 E University Blvd
Odessa TX 79762 432‐333‐2527 www.odessacrisiscenter.org
Established 32 years ago, The Crisis Center currently assists nearly anyone impacted by a violent crime. Client services and program areas include The Crisis Center's Family Violence Shelter in Odessa, a Crisis Response Team, a 24‐hour Crisis Hotline, Counseling Services and Support Groups, Community
Awareness Programs and Primary Prevention Initiatives
Ector County Health Department
Ector County 221 N Texas Ave Odessa TX 79761 432‐498‐4141 http://www.co.ector.tx.us/default.aspx?Ector_County/Health%20Departmen
t
The Ector County Health Department offers immunizations, nursing services including STD testing and treatment and other health education.
ECISD Family Education Center Odessa 301 E. Clements St. Odessa TX 79761 432‐456‐8729 Free tutoring
EZ Rider Odessa 8007 E Business 20 Odessa TX 79765 432‐561‐9990 http://www.ez‐rider.org/ Local bus services with 6 routes throughout Odessa.
Medical Center Health System Community Health Needs Assessment Community Hospital Consulting
August 2013 80

Organization Name Area Primarily Served Address City State Zip Code Phone Website Services Provided
Community Resources ‐ Medical Center Hospital of Odessa
Family Health Clinic (FHC) and Family Health Dental Clinic
Odessa 840 W. Clements St Odessa TX 79763 432‐640‐4860 www.mchodessa.com
The FHC is a community‐based healthcare program that operates in partnership with Medical Center Hospital, the Ronald McDonald Charities and the Family Dental Clinic to provide a wide range of healthcare services to uninsured and underinsured individuals in Odessa and the surrounding
communities.
Family Promise of Odessa Odessa 1354 E 6th St Odessa TX 79761 432‐339‐7100http://www.forministry.com/ustxinter
fpoof
Family Promise of Odessa, Inc. exists to enable homeless families with children to achieve lasting self‐sufficiency by providing temporary shelter,
meals access to existing community social services.
Girl Scouts of the Desert SW ‐ Southern New Mexico and
West TexasWest Texas 5217 N. Dixie Blvd. Odessa TX 79762 432‐550‐2688 http://www.gsdsw.org/
Girl Scouts of the Desert Southwest brings together Girl Scouts of the Permian Basin, Girl Scouts of the Rio Grande and Girl Scouts ‐ Zia Council. Girl Scouting builds girls of courage, confidence and character who make the world a better place. Girl Scouting is a unique place where a girl can
learn valuable leadership skills for the benefit of her future, her community and her country. Through Girl Scouting, girls build the courage to grow strong physically, mentally and spiritually, the confidence to pursue their dreams, and the character to serve their communities and fellow Girl
Scouts.
Harmony Home Children's Advocacy Center
Ector County 910 S Grant Ave Odessa TX 79761 432‐333‐5233 www.ohhcac.org/
Harmony Home CAC serves children from Ector County and 14 surrounding counties who are between the ages of 3 and 17. All of their services are offered free of charge to the victim and his/her non‐offending caregivers. Primary services include: forensic interviews, victim services, therapy and
community education and outreach.
Hope Chest Odessa 1808 N. Dixie Odessa TX 79761 432‐580‐1019http://highlandumcodessa.com/Home
.html
Hope Chest exists to provide incentives to pregnant and parenting women. The Hope chest promotes and encourages responsibility and healthy
behaviors during and after pregnancy.
HUD Office (US Department of Housing and Urban
Development)Odessa
119 West 4th Street, Suite 104
Odessa TX 79761 432‐335‐4820http://portal.hud.gov/hudportal/HUD?src=/states/texas/community/home
HUD’s mission is to create strong, sustainable, inclusive communities and quality affordable homes for all. HUD is working to strengthen the housing market to bolster the economy and protect consumers; meet the need for quality affordable rental homes: utilize housing as a platform for improving
quality of life; build inclusive and sustainable communities free from discrimination; and transform the way HUD does business
Legal Aid of North West TexasEctor, Andrews, Crane,
Loving, Ward and Winkler Counties
620 N. Grant Ave., Ste 410
Odessa TX 79761432‐332‐1207; 800‐955‐1207
www.lanwt.org/contact_odessa.asp
LANWT provides free civil legal services to eligible low‐income residents. The stafff and volunteers are committed to the delivery of effective and
efficient legal services. LANWT also offers significant educational opportunities and experiences for high school, college and law students as
well as retired members of our community.
The Life Center: Sexual Integrity for Life
Midland and Odessa802 N. Washington
AveOdessa TX 79762 432‐617‐8378 http://www.midlandlifecenter.org/
The Life Center promotes sexual integrity, and their vison is to inspire and equip individuals to make positive decisions for life and relationships. They offer three departments: Prevention, Intervention and Restoration, and an expansion of services through satellite offices in Andrews and Odessa.
Midland/Odessa Area AIDS Support (MAAS)
Midland and Odessa 800 West Texas Midland TX 79701 432‐684‐7821 http://www.ribbonsoflight.org/
The organization offers support groups for people with HIV/AIDS and separate groups for their families in Midland and Odessa; a program to
teach AIDS awareness in the secondary schools; CARE Teams that provide spiritual and emotional support to people with AIDS in their homes; and
grief recovery groups.
Medical Center Health System Community Health Needs Assessment Community Hospital Consulting
August 2013 81

Organization Name Area Primarily Served Address City State Zip Code Phone Website Services Provided
Community Resources ‐ Medical Center Hospital of Odessa
Meals on Wheels of Odessa Odessa 1314 E 5th St Odessa TX 79761 432‐333‐6451 www.mowodessa.comOur service provides meals to adults 60 years of age or older and disabled adults 18 years or older who are home bound and unable by reason of
disability to prepare their own meals.
Medical Transportation Program (MTP)
877‐633‐8747http://www.dshs.state.tx.us/cshcn/mt
p.shtm
Many CSHCN Services Program clients can use the Medical Transportation Program (MTP) to get to their doctor's office, drugstore, or any place that they get medical services. If you have no way to get to these places, MTP
can help you.
Mission Messiah Odessa 1213 W. 2nd St Odessa TX 79763 432‐580‐5222 http://www.missionmessiah.org/
Transitional Housing for women and children dealing with debilitating problems such as drug dependency, eating disorders, suicidal tendances, etc. Consists of a 12‐month program that includes ministry, counseling,
work assignments, educational and career counseling.
Mission Odessa Odessa 315 W. 8th St. Odessa TX 79761 432‐339‐0762 http://FBCOdessas.comMission Odessa averages over 900 in Bible study each week serving
apartment communities, dayschools, retirement homes, plant churches, inmates, and other community projects.
Odessa Links Odessa 119 W 4th St #201 Odessa TX 79761 432‐582‐0099 www.odessalinks.orgOdessa Links connects community members in need of assistance to
valuable resources, organizations and initiatives.
Odessa WIC Clinic Odessa 835 Tower Dr, Ste 34 Odessa TX 79762 866‐907‐0080 http://www.dshs.state.tx.us/wichd/
The Special Supplemental Nutrition Program for Women, Infant and Children, popularly known as WIC, is a nutrition program that helps
pregnant women, new mothers, and young children eat well, learn about nutrition, and stay healthy. WIC provides nutrition education and
counseling, nutritious foods, and help accessing health care to low‐income women, infants, and children.
Palmer Drug Abuse Program (PDAP)
Odessa/Midland1208 West Wall
StreetMidland TX 79701 432‐685‐3645 www.pdap.org
PDAP is a fellowship of young people and parents who share their experiences, love and understanding that they may solve their common problems and help others to recover from the effects of mind‐changing chemicals. PDAP provides people with tools to successfully prevent substance abuse, delay its onset or reduce substeance abuse‐related
behaviors.
Permian Basin Community Centers for MHMR
Ector, Midland, Culberson, Pecos, Presidio, Jeff Davis, Hudspeth and Brewster
Counties
3128 Kermit Hwy (Odessa Office)
Odessa TX432‐333‐3265 (Crisis Hotline)
www.pbmhmr.comPermian Basin Community Centers is a public agency that provides a
comprehensive array of services to persons experiencing major mental illnesses, mental retardation and chemical dependency.
Permian Basin Mission Center Permian Basin 208 N. Adams Odessa TX 79761 432‐337‐0554 http://www.pbmission.org/
The Permian Basin Mission Center is a non‐profit, inter‐denominational benevolent agency seeking to provide relief to families and individuals experiencing difficulties in life. The Center provides food, clothing, and
furniture, as well as life‐skill work‐shops.
Permian Basin Regional Council on Alcohol & Drug
Abuse (PBRCADA)Permian Basin 120 E. 2nd St. Odessa TX 79761 432‐580‐5100 www.pbrcada.org
Provides resources to support the local and statewide alcohol, tobacco and other drug prevention. Programs provide individuals and families with access to caring counselors who provide needed resources, referrals,
assessments, crisis intervention and/or motivational interviewing needed to successfully address substance use discorders.
Medical Center Health System Community Health Needs Assessment Community Hospital Consulting
August 2013 82

Organization Name Area Primarily Served Address City State Zip Code Phone Website Services Provided
Community Resources ‐ Medical Center Hospital of Odessa
Prevention Resource Center Region 9
Andrews, Borden, Coke, Concho, Crane, Crockett, Dawson, Ector, Gaines, Glasscock, Howard, Irion, Kimble, Loving, Martin,
Mason, McCulloch, Menard, Midland, Pecos, Reagan,
Reeves, Schleicher, Sterling, Sutton, Terrell, Tom Green, Upton, Ward and Winkler
120 E. 2nd St. Odessa TX 79763 432‐580‐5100 http://reg9prc.org/
Department State Health Services has established 11 Prevention Resource Centers across the state of Texas. Region 9 PRC has been givien the
resources to maximize prevention efforts by performing a coordinative role between DSHS and other entities that are involved in alcohol, tobacco, and
other drugs. The overall goal of Region 9 PRC is to increase the effectiveness and visibility of prevention of alcohol, tobacco and other drug
use and abuse within the region through information dissemination, community education, identification of community resources and
identifying best practices in prevention.
Rays of Hope 911 W Texas Ave Midland TX 79701 432‐684‐5437 www.raysofhopemidland.org Children's Grief Center
Reed Adolescent Center Texas 404 Floydada Plainview TX 79072 806‐291‐4422 http://www.clplains.org/rac/rac.htm
Mission is to improve the quality of life for persons with mental illness, Intellectual Disabilities and chemical dependency, and their families by providing accessible services and resources which will support individual
choices and promotes lives of dignity and independence.
The Ronald McDonald Care Mobile
Odessa 500 W. 4th St. Odessa TX 79761 432‐640‐6000http://www.medicalcenterhealthsystem.com/CareMobile/Pages/default.asp
x
Medical Center Hospital and Ronald McDonald House Charities (RMHC) of the Southwest have partnered to bring the state‐of‐the‐art Ronald
McDonald Care Mobile program to our area. A medical clinic on wheels, the Care Mobile brings medical care and health information directly into local neighborhoods with unmet healthcare needs for ECISD students, siblings
and their minor children up to the age of 18. The vehicle houses two patient examination rooms, a laboratory, a reception area and a medical records
area.
Safe Place of the Permian Basin ‐ Project Adam
(Batterer's Intervention Program)
Andrews, Borden, Crane, Dawson, Ector, Gaines,
Glasscock, Howard, Loving, Martin, Midland, Reeves, Upton, Ward, and Winkler
Counties
700 N Grant Ave Odessa TX 79761 432‐580‐5970 www.safeplacenow.com/
The mission of Safe Place is to break the cycle of family violence by empowering individuals to make safe and healthy choices through awareness, advocacy, counseling and shelter, while promoting hope,
healing and dignity. Safe Place is a Midland County funded organizations with services and programs including a 24‐hour crisis hotline, an emergency
shelter located in Midland, legal and personal advocacy, counseling, children's programs, batterer's intervention programs, community
education and bilingual services.
The Salvation Army Odessa 810 E. 11th Odessa TX 79761 432‐332‐6910 www.salvationarmyusa.org/ Multifaceted religious and social service organization actively engaged in addressing the needs of the homeless and hungry, persons in financial
crisis, and at risk children and youth.
Samaritan Counseling Center of West Texas
Permian Basin 10008 Pilot Ave Midland TX 79706 432‐563‐4144 http://www.samaritanccwtx.org/
Clients may contact the center to schedule an appointment. The Center has a standard fee, but many insurance policies cover services. Some churches and employers have contracted to underwrite a portion of treatments, and assistance is provided for those clients with no insurance and low income. The Center provides counseling in a number of areas, provides services free to active military, veterans and their families, and offers workshops for
families going through divorce.
"SHARE" ‐ Sharing Hands Respite Service
West Texas 208 S. Marienfeld Midland TX 79701 432‐218‐4622 http://www.sharewesttexas.org/
SHARE partners with all members of families where there are children with special needs, supporting their efforts to establish and maintain strong and successful families. SHARE provides respite services as well as programs for
siblings, parents, grandparents, and extended families.
Medical Center Health System Community Health Needs Assessment Community Hospital Consulting
August 2013 83

Organization Name Area Primarily Served Address City State Zip Code Phone Website Services Provided
Community Resources ‐ Medical Center Hospital of Odessa
Star Care Nurse Family Partnership (NFP)
Ector County620 N. Grant Ave.,
Ste 100Odessa TX 79761 432‐580‐7707 www.startechgroup.com
Nurse‐Family Partnership (NFP) is a voluntary prevention program that provides nurse home visitation services to low‐income, first‐time mothers. Nurses begin home visits early in the mother’s pregnancy and continue visitation until the child’s second birthday. Nurses provide support,
education and counseling on health, behavioral and self‐sufficiency issues. This program is funded by a federal grant awarded to the Texas Health and
Human Services Commission from the U.S. Department of Health and Human Services. This program is also part of HHSC’s Home Visiting Program, which also includes the Parents as Teachers and the Home
Instruction for Parents of Preschool Youngsters (HIPPY) programs. These evidence‐based programs help parents prepare their children from birth
through age‐five, for success in school and beyond.
Stay Together Program Midland and Odessa8701 W County
Road 60Midland TX 79707 432‐699‐1466
http://highsky.org/programs_stay_together.html
The Stay Together Program delivers services to families with children/youth 0‐17 years of age, who are experiencing runaway, truant, or delinquent behaviors. Youth and families experiencing family conflict are also eligible for these services. The Stay Together Program is preventative in nature and engages the youth and their families early on to help ensure that the family remains intact, and to prevent the involvement of more restrictive state
agencies such as Juvenile Probation and Child Protective Services.
Texas Department of Health and Human Services ‐ Odessa
Odessa 3016 Kermit Hwy Odessa TX 79764432‐333‐5141; 1‐800‐252‐9330
HHSC.state.tx.usProvides/Offers food stamp programs, TANF (Temporary Assistance for
Needy Families) and Medicaid for children, pregnant women and parents of deprived children.
Texas Youth & Runaway Hotline
800‐989‐6884http://www.dfps.state.tx.us/Youth_Ho
tline/default.asp
The Texas Youth and Runaway hotline is answered 24‐hour, seven days a week and provides prevention services to youths, parents, siblings and
other family members who are in need of a caring voice and listening ear.
Texas Runaway Hotline888‐580‐HELP
(4357)www.texasrunaway.org
Texas Runaway Hotline is a confidential and free telephone hotline that offers referrals, safe runaway shelters, conference calling, message relay
service (fostering communication between kids and parents) and education for kids and parents about runaway rights.
Top Rank Youth Program Odessa ‐ affiliated with
Permian Basin Community Centers
Ector and Midland Counties 1012 MacArthur Odessa TX 79763 432‐580‐2617 www.pbmhmr.com
The Top Rank Youth program is a youth outpatient substance abuse treatment designed for adolescents who do not require the more
structured environment of residential treatment to achieve and maintain abstinence. The program ensures access to a full continuum of treatment services and provides sufficient treatment intensity to achieve treatment
plan goals for both the adolescent and their families.
United Way of Odessa Odessa 128 East 2nd St. Odessa TX 79761 432‐332‐0941 http://www.unitedwayodessa.org/United Way of Odessa and its program providers impact the lives of 1 in every 3 Odessans. The work of United Way staff, volunteers and donors provides people with the resources necessary to build a quality life.
UTPB Center for Behavioral Analysis
Odessa 4901 E. University Odessa TX 79762 432‐552‐2365 Counseling and testing center
West Texas Area Counseleing Center
Odessa 62 San Lucas Ct. Odessa TX 79765 432‐550‐3838 Counseling for clients age 3 and older
West Texas Opportunities West Texas 2605 Avenue M #Ce Snyder TX 79549 325‐573‐3068 http://www.gowto.org/
West Texas Opportunities, Inc. was created for the purpose of administering the provisions of the Economic Opportunity Act of 1964 and its subsequent amendments. It is dedicated to the proposition that the United States can achieve full economic and social potential as a nation
only if every individual, regardless of race, creed or sex, has the opportunity to develop to the full extent of his or her capabilities.
Medical Center Health System Community Health Needs Assessment Community Hospital Consulting
August 2013 84

INFORMATION GAPS
Medical Center Health System Community Health Needs Assessment Community Hospital Consulting
August 2013 85

Information Gaps• While the following information gaps exist in the health
data section of this report, please note that every effort was made to compensate for these gaps in the interviews conducted by Community Hospital Consulting.– This assessment seeks to address the community’s health needs
by evaluating the most current data available. However, published data inevitably lags behind due to publication and analysis logistics. Data from the Texas Department of State Health Services has only published the “County Health Facts Profiles” and death statistics through 2009 as of April 2013.
– Data regarding youth health behaviors was not available through the Center for Disease Control specifically for Ector County. Data from the Kids Count Data Center was used to review youth data elements.
Medical Center Health System Community Health Needs Assessment Community Hospital Consulting
August 2013 86

ABOUT COMMUNITY HOSPITAL CONSULTING
Medical Center Health System Community Health Needs Assessment Community Hospital Consulting
August 2013 87

About CHC Consulting• Community Hospital Corporation owns, manages and consults with hospitals
through three distinct organizations – CHC Hospitals, CHC Consulting and CHC ContinueCare, which share a common purpose of preserving and protecting community hospitals.
• Based in Plano, Texas, CHC provides the resources and experience community hospitals need to improve quality outcomes, patient satisfaction and financial performance. For more information about CHC, please visit the website at www.communityhospitalcorp.com.
• Medical Center Health System contracted with CHC Consulting to conduct its Community Health Needs Assessment and assist with its Implementation Plan, which included the following:
– Description of the health system’s mission, vision and values;– Analysis of service area demographics and community health status; – Input from persons with special expertise in public health and leaders or members of medically
underserved, low‐income or minority populations; – Listing of prioritized health needs of the community; – Listing of additional services available in the community to meet the identified needs;– An implementation strategy that describes how the health system plans to meet the health
need, or identifies the health need as one the health system does not intend to meet and explains why.
Medical Center Health System Community Health Needs Assessment Community Hospital Consulting
August 2013 88
APPENDIX‐ SUMMARY OF DATA SOURCES‐ PRIORITY MATRIX‐ DEMOGRAPHIC DATA FINDINGS‐ HEALTH DATA FINDINGS‐ INTERVIEWEE BIOGRAPHIES
Medical Center Health System Community Health Needs Assessment Community Hospital Consulting
August 2013 89

Summary of Data Sources• Demographics
– This study utilized demographic data from the Texas State Data Center; http://txsdc.utsa.edu/Data/Files.aspx?cmd=Bh4iUm2n75LX0Zy9zmVCmnFcMEVw4iALjjBakybEAzVi74EtX3JW3g
– The Annie E. Casey Foundation is a private charitable organization, dedicated to helping build better futures for disadvantaged children in the United States. One of their initiatives is the Kids Count Data Center, which provides access to hundreds of measures of child well‐being by county and state; http://datacenter.kidscount.org/
– Poverty percentages in this report come from the U.S. Census Bureau, Small Area Estimates Branch; http://www.census.gov/did/www/saipe/data/statecounty/data/2009.html
– The United States Bureau of Labor Statistics, Local Area Unemployment Statistics provides unemployment statistics by county and state; http://www.bls.gov/lau/#tables
• Health Data– The County Health Rankings are made available by the Robert Wood Jonson Foundation and the University
of Wisconsin Population Health Institute. The Rankings measure the health of nearly all counties in the nation and rank them within states. The Rankings are compiled using county‐level measures from a variety of national and state data sources. These measures are standardized and combined using scientifically‐informed weights. The Rankings are based on a model of population health that emphasizes the many factors that, if improved, can help make communities healthier places to live, learn, work and play. Building on the work of America's Health Rankings, the University of Wisconsin Population Health Institute has used this model to rank the health of Wisconsin’s counties every year since 2003; http://www.countyhealthrankings.org/
– The Texas Health Data ‐ Deaths of Texas Residents website allows the user to query the select causes of death, which are classified according to the ICD‐10 system, by year, county, race/ethnicity, gender and age group. Note that all death rates are age adjusted to the 2000 standard per 100,000 population; http://soupfin.tdh.state.tx.us/death10.htm
Medical Center Health System Community Health Needs Assessment Community Hospital Consulting
August 2013 90

Summary of Data Sources• Health Data Continued
– The Texas Cancer Registry’s online query system allows you to query cancer incidence rates by geography, cancer site, year, sex and race/ethnicity. Note that all rates are per 100,000 and age adjusted to the population standard that you manually select in the query tool. This study provides cancer incidence data that is age‐adjusted to the 2000 standard population http://www.cancer‐rates.info/tx/index.php
– This study utilizes county and state level data provided by the Texas Behavioral Surveillance System, Center for Health Statistics. This data, collected by a federally funded monthly telephone survey of randomly selected adults, is also available at the region, metropolitan statistical area and state levelthrough an online query system that allows users to select a variety of health behaviors, or conditions by year (2002 – 2010). The query also provides data by gender, race/ethnicity, age, education level, and income; http://www.dshs.state.tx.us/chs/brfss/query/brfss_form.shtm
– Texas Department of State Health Services provides County Health Facts Profiles, up to the year 2009, which give a snapshot of the county’s health. This study utilizes the communicable disease rates listed in the profiles for the three most recent available years (2007, 2008, and 2009); http://www.dshs.state.tx.us/chs/cfs/Texas‐Health‐Facts‐Profiles.doc
– The United States Census Bureau’s Small Area Health Insurance Estimates provide insured and uninsured rates by county up to the year 2010; http://www.census.gov/did/www/sahie/data/interactive/
• Phone Interviews– CHC Consulting conducted interviews on behalf Medical Center Health System from March 25, 2013 –
May 1, 2013.– Conducted by Katie Smith, Research Analyst
Medical Center Health System Community Health Needs Assessment Community Hospital Consulting
August 2013 91

Medical Center Health System Community Health Needs Assessment Prioritization Ballot
Please review the primary criteria we will use to identify the top community health priorities for
Medical Center Health System (MCHS) Then cast 3 votes for each priority
1. Size and Prevalence of the Issue
a. How many people does this affect? b. How does the prevalence of this issue in our communities compare with its prevalence in other counties or
the State? c. How serious are the consequences? (urgency; severity; economic loss)
2. Effectiveness of Interventions
a. How likely is it that actions taken will make a difference? b. How likely is it that actions will improve quality of life? c. How likely is it that progress can be made in both the short term and the long term? d. How likely is it that the community will experience reduction of long-term health cost?
3. MCHS Capacity
a. Are people at MCHS likely to support actions around this issue? (ready) b. Will it be necessary to change behaviors and attitudes in relation to this issue? (willing) c. Are the necessary resources and leadership available to us now? (able)
Using the criteria listed above, please indicate how important you believe this priority is for the communities we serve, with #5 indicating the highest importance and #1 indicating the lowest importance. To cast your votes, just fill in one circle in every row.
Need for Primary Care services and providers Size and Prevalence of the issue Effectiveness of Interventions MCHS Capacity Less Important ------- More Important
Need for additional mental health care services and providers
Size and Prevalence of the issue Effectiveness of Interventions MCHS Capacity Less Important ------- More Important
Prevention, education and services to address high mortality rates, chronic diseases and unhealthy lifestyles
Size and Prevalence of the issue Effectiveness of Interventions MCHS Capacity Less Important ------- More Important
Medical Center Health System Community Health Needs Assessment Community Hospital Consulting
August 2013 92

Prevention, education and services to address maternal and fetal health concerns Size and Prevalence of the issue Effectiveness of Interventions MCHS Capacity Less Important ------- More Important
Fragmented continuum of care
Size and Prevalence of the issue Effectiveness of Interventions MCHS Capacity Less Important ------- More Important
Health disparities among specific populations Size and Prevalence of the issue Effectiveness of Interventions MCHS Capacity Less Important ------- More Important
Medical Center Health System Community Health Needs Assessment Community Hospital Consulting
August 2013 93

DEMOGRAPHIC DATA FINDINGS
Medical Center Health System Community Health Needs Assessment Community Hospital Consulting
August 2013 94

Overall Population Growth
Geographic Location CY 2010 CY 2013 CY 20182013‐2018 Change
2013‐2018 % Change
Ector County 137,130 142,318 150,424 8,106 5.7%Texas 25,145,561 25,843,786 26,951,225 1,107,439 4.3%Source: Texas State Data Center
Data Accessed: June 13, 2013
Population by Race/Ethnicity
Change %White 56,306 56,801 57,244 443 0.8%Black 5,596 5,773 6,015 242 4.2%Hispanic 72,331 76,770 84,071 7,301 9.5%Other 2,897 2,974 3,094 120 4.0%Total 137,130 142,318 150,424 8,106 5.7%
Change %White 11,397,345 11,472,860 11,558,319 85,459 0.7%Black 2,886,825 2,963,671 3,080,775 117,104 4.0%Hispanic 9,460,921 9,961,641 10,799,290 837,649 8.4%Other 1,400,470 1,445,614 1,512,841 67,227 4.7%Total 25,145,561 25,843,786 26,951,225 1,107,439 4.3%Source: Texas State Data Center
Data Accessed: June 13, 2013
Ector County
Race/Ethnicity 2010 2013
Overall Population Growth
2013‐2018
2010 2013 2018
2018
2013‐2018Texas
Race/Ethnicity
Medical Center Health System Community Health Needs Assessment Community Hospital Consulting
August 2013 95

Population by Age
Change %<18 41,333 29.0% 43,646 29.0% 2313 5.6%18‐24 14,542 10.2% 13,087 8.7% ‐1455 ‐10.0%25‐44 38,230 26.9% 41,576 27.6% 3346 8.8%45‐64 32,833 23.1% 33,494 22.3% 661 2.0%65+ 15,380 10.8% 18,621 12.4% 3241 21.1%Total 142,318 100.0% 150,424 100.0% 8106 5.7%
2013‐2018Change %
<18 6,928,489 26.8% 7,038,910 26.1% 110,421 1.6%18‐24 2,605,732 10.1% 2,619,725 9.7% 13,993 0.5%25‐44 7,144,628 27.6% 7,198,639 26.7% 54,011 0.8%45‐64 6,248,841 24.2% 6,573,385 24.4% 324,544 5.2%65+ 2,916,096 11.3% 3,520,566 13.1% 604,470 20.7%Total 25,843,786 100.0% 26,951,225 100.0% 1107439 4.3%Source: Texas State Data Center
Data Accessed: June 13, 2013
Median Age
2000 2010Ector County 32.0 32.4Texas 32.3 33.6Source: Texas State Data Center
Date Accessed: April 25, 2013
% of Total
Age Cohort 2018 % of Total% of Total
2013‐2018Ector County
Texas
Age Cohort 2013 % of Total 2018
Geographic Location
2013
Median Age
Medical Center Health System Community Health Needs Assessment Community Hospital Consulting
August 2013 96

Income and Education Analysis
Location Year% in Poverty (All Ages)
% of Children (Under 18) in
Poverty
Median Household Income
Poverty and Income Analysis
Ecto
r Cou
nty 2008 15.5 20.8 46,868$
2009 16.9 23.1 43,935$ 2010 19.6 28.3 42,339$ 2011 15.8 21.2 47,930$ Ec
tor C
ount
y
Texa
s
2008 15.8 22.5 50,049$ 2009 17.1% 24.3% 48,286$ 2010 17.9% 25.7% 48,622$ 2011 18.5% 26.6% 49,390$
Data accessed April 26, 2013
2006‐2007 2007‐2008 2008‐2009 2009‐2010 2010‐2011Ector County 59.0% 56.0% 56.0% 65.8% 66.5%Texas 59.0% 59.0% 60.0% 63.1% 62.4%
2006‐2007 2007‐2008 2008‐2009 2009‐2010 2010‐2011Ector County 11.3% 11.2% 11.5% 10.9% 10.4%Texas 14.8% 15.5% 16.0% 16.1% 16.2%
Children Receiving Free and Reduced Price Lunch
Source: The Annie E. Casey Foundation, The Kids Count Data Center; http://datacenter.kidscount.org/
Source: U.S. Census Bureau, Small Area Estimates Branch; http://www.census.gov/did/www/saipe/data/statecounty/data/2009.html
Date Accessed: June 13, 2013
Students Enrolled in Bilingual/ESL Programs
Source: The Annie E. Casey Foundation, The Kids Count Data Center; http://datacenter.kidscount.org/
Date Accessed: June 13, 2013
Texa
s
Medical Center Health System Community Health Needs Assessment Community Hospital Consulting
August 2013 97

Related children under 18 years Size of family unit Weighted Eight
average None One Two Three Four Five Six Seven or morethresholds
One person (unrelated individual)....... 11,484 Under 65 years.............................. 11,702 11,702 65 years and over........................... 10,788 10,788
Two people...................................... 14,657 Householder under 65 years........... 15,139 15,063 15,504 Householder 65 years and over........ 13,609 13,596 15,446
Three people.................................... 17,916 17,595 18,106 18,123 Four people..................................... 23,021 23,201 23,581 22,811 22,891 Five people...................................... 27,251 27,979 28,386 27,517 26,844 26,434 Six people........................................ 30,847 32,181 32,309 31,643 31,005 30,056 29,494 Seven people................................... 35,085 37,029 37,260 36,463 35,907 34,872 33,665 32,340 Eight people.................................... 39,064 41,414 41,779 41,027 40,368 39,433 38,247 37,011 36,697 Nine people or more.......................... 46,572 49,818 50,059 49,393 48,835 47,917 46,654 45,512 45,229 43,487 Source: U.S. Census Bureau; http://www.census.gov/hhes/www/poverty/methods/definitions.html#poverty thresholds
Following the Office of Management and Budget's (OMB) Statistical Policy Directive 14, the Census Bureau uses a set of money income thresholds that vary by family size and composition to determine who is in poverty. If a family's total income is less than the family's threshold, then that family and every individual in it is considered in poverty. The official poverty thresholds do not vary geographically, but they are updated for inflation using
Consumer Price Index (CPI‐U). The official poverty definition uses money income before taxes and does not include capital gains or noncash benefits (such as public housing, Medicaid, and food stamps).
Poverty Thresholds for 2011 by Size of Family and Number of Related Children Under 18 Years
Medical Center Health System Community Health Needs Assessment Community Hospital Consulting
August 2013 98

Uninsured
Location YearDemographic
Group: Number
Uninsured: Number
Uninsured: %Insured: Number
Insured: %
2007 116,315 31,046 26.7 85,270 73.32008 115,570 34,101 29.5 81,469 70.52009 118,615 34,423 29.0 84,192 712010 120,948 35,369 29.5 83,510 70.52007 21,504,681 5,765,132 26.8 15,739,550 73.22008 21,348,989 5,494,593 25.7 15,854,396 74.32009 21,730,992 5,710,171 26.3 16,020,821 73.72010 22,098,206 5,820,793 26.3 16,277,413 73.7
Unemployment
2008 2009 2010 2011 2012Ector County 3.5% 8.0% 7.8% 5.8% 4.2%Texas 4.9% 7.5% 8.2% 7.9% 6.8%United States 5.8% 9.3% 9.6% 8.9% 8.1%Source: Bureau of Labor Statistics, Local Area Unemployment Statistics; http://www.bls.gov/lau/#tables
Note: Rates shown are a percentage of the labor force
Data Accessed: June 13, 2013
Uninsured and Insured Residents Under 65 Years of Age
Date Accessed: June 13, 2013
Annual Average Unemployment Rates (%)
Ector County
Texas
Source: United States Census Bureau, Small Area Health Insurance Estimates
Medical Center Health System Community Health Needs Assessment Community Hospital Consulting
August 2013 99

HEALTH DATA FINDINGS
Medical Center Health System Community Health Needs Assessment Community Hospital Consulting
August 2013 100
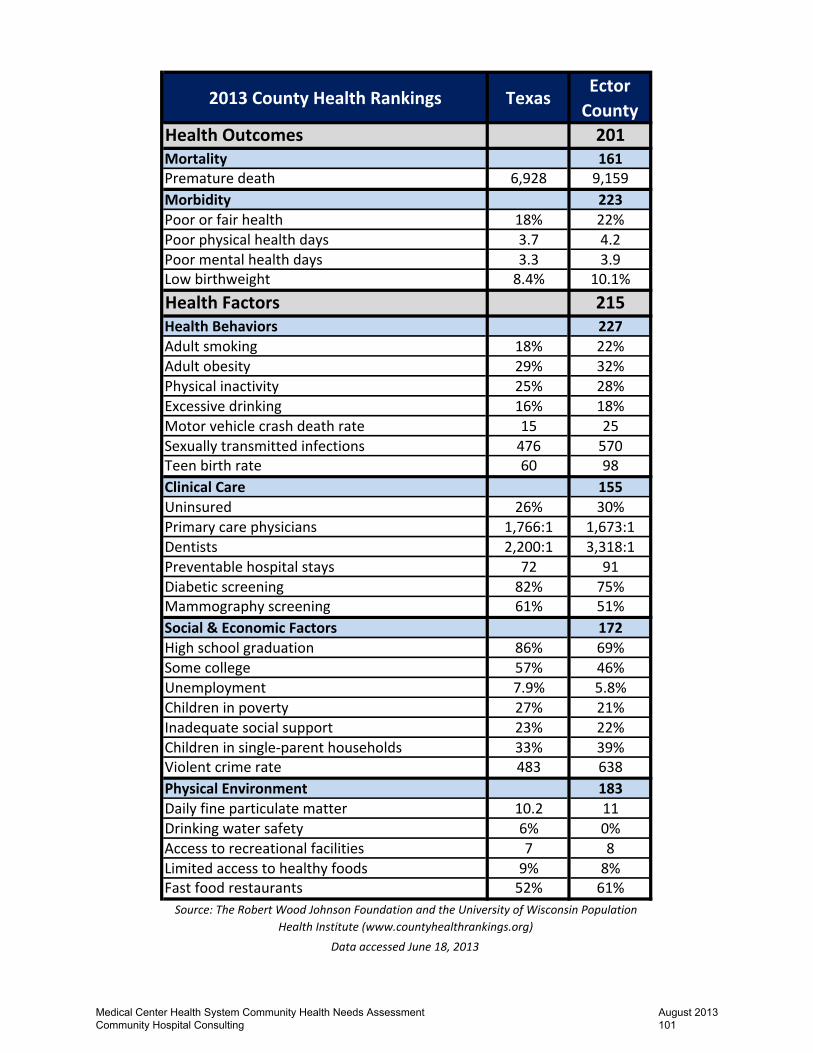
2013 County Health Rankings TexasEctor County
Health Outcomes 201Mortality 161Premature death 6,928 9,159Morbidity 223Poor or fair health 18% 22%Poor physical health days 3.7 4.2Poor mental health days 3.3 3.9Low birthweight 8.4% 10.1%Health Factors 215Health Behaviors 227Adult smoking 18% 22%Adult obesity 29% 32%Physical inactivity 25% 28%Excessive drinking 16% 18%Motor vehicle crash death rate 15 25Sexually transmitted infections 476 570Teen birth rate 60 98Clinical Care 155Uninsured 26% 30%Primary care physicians 1,766:1 1,673:1Dentists 2,200:1 3,318:1Preventable hospital stays 72 91Diabetic screening 82% 75%Mammography screening 61% 51%Social & Economic Factors 172High school graduation 86% 69%Some college 57% 46%Unemployment 7.9% 5.8%Children in poverty 27% 21%Inadequate social support 23% 22%Children in single‐parent households 33% 39%Violent crime rate 483 638Physical Environment 183Daily fine particulate matter 10.2 11Drinking water safety 6% 0%Access to recreational facilities 7 8Limited access to healthy foods 9% 8%Fast food restaurants 52% 61%Source: The Robert Wood Johnson Foundation and the University of Wisconsin Population
Health Institute (www.countyhealthrankings.org)
Data accessed June 18, 2013
Medical Center Health System Community Health Needs Assessment Community Hospital Consulting
August 2013 101

FocusArea Measure Weight Source Year(s)Mortality(50%) Premature death (years of potential life lost
before age 75 per 100,000 pop)50% National Center for Health Statistics 2008‐2010
Poor or fair health (percent of adults reporting fair or poor health)
10% Behavioral Risk Factor Surveillance System
2005‐2011
Poor physical health days (average number in past 30 days)
10% Behavioral Risk Factor Surveillance System
2005‐2011
Poor mental health days (average number in past 30 days)
10% Behavioral Risk Factor Surveillance System
2005‐2011
Low birthweight (percent of live births with weight < 2500 grams)
20% National Center for Health Statistics 2004‐2010
FocusArea Measure Weight Source Year(s)Tobaccouse(10%)
Adult smoking (percent of adults that smoke) 10% Behavioral Risk Factor Surveillance System
2005‐2011
Adult obesity (percent of adults that report a BMI >= 30)
7.5% National Center for Chronic Disease Prevention and Health Promotion, Division of Diabetes Translation
2009
Physical inactivity (percent of adults that report no leisure time physical activity)
2.5% National Center for Chronic Disease Prevention and Health Promotion, Division of Diabetes Translation
2009
Excessive drinking (percent of adults who report heavy or bringe drinking)
2.5% Behavioral Risk Factor Surveillance System
2005‐2011
Motor vehicle crash deaths per 100,000 population
2.5% National Center for Health Statistics 2004‐2010
Sexually transmitted infections (chlamydia rate per 100,000 population)
2.5% National Center for HIV/AIDS, Viral Hepatitis, STD, and TB Prevention
2010
Teen birth rate (per 1,000 females ages 15‐19)
2.5% National Center for Health Statistics 2004‐2010
HealthOutcomes
Morbidity(50%)
Dietandexercise(10%)
Alcoholuse(5%)
Sexualactivity(5%)
HealthBehaviors(30%)
Medical Center Health System Community Health Needs Assessment Community Hospital Consulting
August 2013 102

FocusArea Measure Weight Source Year(s)Uninsured (percent of population < age 65 without health insurance)
5% Small Area Health Insurance Estimates 2010
Ratio of population to primary care physicians 3% HRSA Area Resource File 2011‐2012
Ratio of population to dentists 2% HRSA Area Resource File 2011‐2012Preventable hospital stays (rate per 1,000 Medicare enrollees)
5% Dartmouth Atlas of Health Care 2010
Diabetic screening (percent of diabetics that receive HbA1c screening)
2.5% Dartmouth Atlas of Health Care 2010
Mammography screening (percent of females that receive screening)
2.5% Dartmouth Atlas of Health Care 2010
FocusArea Measure Weight Source Year(s)High school graduation (percent of ninth grade cohort that graduates in 4 years)
5% State sources and the National Center for Education Statistics
Varies by state
Some college (Percent of adults aged 25‐44 years with some post‐secondary education)
5% American Community Survey, 5‐year estimates
2007‐2011
Employment(10%)
Unemployment rate (percent of population age 16+ unemployed)
10% Bureau of Labor Statistics 2011
Income(10%) Children in poverty (percent of children under age 18 in poverty)
10% Small Area Income and Poverty Estimates
2011
Inadequate social support (percent of adults without social/emotional support)
2.5% Behavioral Risk Factor Surveillance System
2005‐2010
Percent of children that live in single‐parent household
2.5% American Community Survey, 5‐year estimates
2007‐2011
Communitysafety(5%)
Violent crime rate per 100,000 population 5% Uniform Crime Reporting, Federal Bureau of InvestigationState data sources for Illinois
2008‐2010
Social and Economic Environment (40%)
Education(10%)
Familyandsocialsupport(5%)
Accesstocare(10%)
Qualityofcare(10%)
ClinicalCare(20%)
Medical Center Health System Community Health Needs Assessment Community Hospital Consulting
August 2013 103

FocusArea Measure Weight Source Year(s)Daily fine particulate matter (average daily measure in micrograms per cubic meter)
2% CDC WONDER Environmental data Data not available for Alaska and
Hawaii
2008
Drinking water safety (percent of population exposed to water exceeding a violation limit in the past year)
2% Safe Drinking Water Information System
FY 2012
Access to recreational facilities (rate per 100,000 population)
2% County Business Patterns 2010
Limited access to health foods (percent of population who lives in poverty and more than 1 or 10 miles from a grocery store)
2% USDA Food Environment Atlas 2012
Fast food restaurants (percent of all restaurants that are fast food)
2% County Business Patterns 2010
PhysicalEnvironment(10%)
Environmentalquality(4%)
Builtenvironment(6%)
Medical Center Health System Community Health Needs Assessment Community Hospital Consulting
August 2013 104

ICD‐10 Death Statistics; Sorted by 2010 Age‐Adjusted Mortality Rate (per 100,000)Sorted descending order by 2010 death rate
Number Rate Number Rate Number Rate
Ector CountyDiseases of the Heart (I00‐I09, I11, I13, I20‐I51) 306 260.4 280 228.5 291 266.7
Malignant Neoplasms (C00‐C97) 226 185.5 224 177.9 217 184.5Chronic Lower Respiratory Diseases (J40‐J47) 104 86.1 107 86 96 86.3Accidents (V01‐X59, Y85‐Y86) 82 64 81 62.2 72 56.3
Cerebrovascular Diseases (I60‐I69) 52 43.4 67 54.7 74 68.2Alzheimer's Disease (G30) 49 42.8 28 23.5 27 27.4Diabetes Mellitus (E10‐E14) 40 32.7 38 28.9 32 27.6
Influenza and Pneumonia (J09‐J18) 32 27.2 24 19.6 22 19.6Chronic Liver Disease and Cirrhosis (K70, K73‐K74) 29 22.9 25 19.2 24 17.3Septicemia (A40‐A41) 22 18.2 19 ‐ 20 16.2Nephritis, Nephrotic Syndrome and Nephrosis (N00‐N07, N17‐N19, N25‐N27) 17 ‐ 16 ‐ 12 ‐Intentional Self‐Harm (Suicide) (X60‐X84, Y87.0) 10 ‐ 23 18.6 9 ‐
Essential (Primary) Hypertension and Hypertensive Renal Disease (I10, I12) 5 ‐ 10 ‐ 12 ‐
Assault (Homicide) (X85‐Y09, Y87.1) 13 ‐ 11 ‐ 7 ‐
Salmonella Infections (A01‐A02) 0 ‐ 0 ‐ 0 ‐
Shigellosis and Amebiasis (A03, A06) 0 ‐ 0 ‐ 0 ‐Tuberculosis (A16‐A19) 0 ‐ 0 ‐ 0 ‐Whooping Cough (A37) 0 ‐ 0 ‐ 0 ‐
ICD‐10 Death Statistics; Sorted by 2009 Age‐Adjusted Mortality Rate (per 100,000)2008 2009 2010
Cause of DeathLocation
Medical Center Health System Community Health Needs Assessment Community Hospital Consulting
August 2013 105

ICD‐10 Death Statistics; Sorted by 2010 Age‐Adjusted Mortality Rate (per 100,000)Sorted descending order by 2010 death rate
Number Rate Number Rate Number Rate
ICD‐10 Death Statistics; Sorted by 2009 Age‐Adjusted Mortality Rate (per 100,000)2008 2009 2010
Cause of DeathLocation
Scarlet Fever and Erysipelas (A38, A46) 0 ‐ 0 ‐ 0 ‐Meningococcal Infection (A39) 0 ‐ 0 ‐ 0 ‐Syphilis (A50‐A53) 0 ‐ 0 ‐ 0 ‐Acute Poliomyelitis (A80) 0 ‐ 0 ‐ 0 ‐Arthropod‐Borne Viral Encephalitis (A83‐A84, A85.2) 0 ‐ 0 ‐ 0 ‐Measles (B05) 0 ‐ 0 ‐ 0 ‐Viral Hepatitis (B15‐B19) 7 ‐ 4 ‐ 8 ‐Human Immunodeficiency Virus (HIV) Disease (B20‐B24) 3 ‐ 7 ‐ 0 ‐Malaria (B50‐B54) 0 ‐ 0 ‐ 0 ‐
In Situ Neoplasms, Benign Neoplasms and Neoplasms of Uncertain or Unknown Behavior (D00‐D48) 8 ‐ 4 ‐ 6 ‐Anemias (D50‐D64) 1 ‐ 2 ‐ 4 ‐
Nutritional Deficiencies (E40‐E64) 1 ‐ 0 ‐ 0 ‐Meningitis (G00, G03) 0 ‐ 0 ‐ 0 ‐Parkinson's Disease (G20‐G21) 4 ‐ 5 ‐ 10 ‐Atherosclerosis (I70) 1 ‐ 0 ‐ 0 ‐
Aortic Aneurysm and Dissection (I71) 1 ‐ 2 ‐ 3 ‐Acute Bronchitis and Bronchiolitis (J20‐J21) 0 ‐ 0 ‐ 0 ‐Pneumoconioses and Chemical Effects (J60‐J66, J68) 1 ‐ 0 ‐ 0 ‐Pneumonitis Due to Solids and liquids (J69) 5 ‐ 6 ‐ 6 ‐Peptic Ulcer (K25‐K28) 0 ‐ 0 ‐ 0 ‐
Diseases of Appendix (K35‐K38) 0 ‐ 1 ‐ 1 ‐
Medical Center Health System Community Health Needs Assessment Community Hospital Consulting
August 2013 106

ICD‐10 Death Statistics; Sorted by 2010 Age‐Adjusted Mortality Rate (per 100,000)Sorted descending order by 2010 death rate
Number Rate Number Rate Number Rate
ICD‐10 Death Statistics; Sorted by 2009 Age‐Adjusted Mortality Rate (per 100,000)2008 2009 2010
Cause of DeathLocation
Hernia (K40‐K46) 0 ‐ 1 ‐ 1 ‐
Cholelithiasis and Other Disorders of Gallbladder (K80‐K82) 3 ‐ 1 ‐ 2 ‐Infections of Kidney (N10‐N12, N13.6, N15.1) 0 ‐ 0 ‐ 2 ‐Hyperplasia of Prostate (N40) 0 ‐ 0 ‐ 0 ‐
Inflammatory Diseases of Female Pelvic Organs (N70‐N76) 0 ‐ 0 ‐ 0 ‐Pregnancy, Childbirth and the Puerperium (O00‐O99) 0 ‐ 0 ‐ 1 ‐
Certain Conditions Originating in the Perinatal Period (P00‐P96) 3 ‐ 4 ‐ 3 ‐
Congenital Malformations, Deformations and Chromosomal Abnormalities (Q00‐Q99) 5 ‐ 5 ‐ 6 ‐Legal Intervention (Y35, Y89.0) 0 ‐ 0 ‐ 0 ‐Operations of War and their Sequelae (Y36, Y89.1) 0 ‐ 0 ‐ 0 ‐Complications of Medical and Surgical Care (Y40‐Y84, Y88) 1 ‐ 0 ‐ 2 ‐All Other Diseases 139 116.2 133 105.4 153 136.8All Causes 1,170 969.1 1,128 899.50 1,123 985.3
RHP 14 ‐ CountiesDiseases of the Heart (I00‐I09, I11, I13, I20‐I51) 842 223.5 777 198.4 774 213.5
Malignant Neoplasms (C00‐C97) 613 160.7 608 154.1 613 163.7Chronic Lower Respiratory Diseases (J40‐J47) 245 64.7 259 66.2 242 67Accidents (V01‐X59, Y85‐Y86) 204 54.8 195 51.2 195 51.3
Cerebrovascular Diseases (I60‐I69) 183 48.3 169 43.5 163 44.9
Medical Center Health System Community Health Needs Assessment Community Hospital Consulting
August 2013 107

ICD‐10 Death Statistics; Sorted by 2010 Age‐Adjusted Mortality Rate (per 100,000)Sorted descending order by 2010 death rate
Number Rate Number Rate Number Rate
ICD‐10 Death Statistics; Sorted by 2009 Age‐Adjusted Mortality Rate (per 100,000)2008 2009 2010
Cause of DeathLocation
Alzheimer's Disease (G30) 134 35.8 125 32.2 141 41Diabetes Mellitus (E10‐E14) 91 24.2 96 24 81 21.9
Influenza and Pneumonia (J09‐J18) 166 44.1 87 22.6 78 21.6Septicemia (A40‐A41) 60 16.1 61 15.5 67 18.1Chronic Liver Disease and Cirrhosis (K70, K73‐K74) 75 19.5 60 15.9 66 16.6Nephritis, Nephrotic Syndrome and Nephrosis (N00‐N07, N17‐N19, N25‐N27) 49 13.3 44 11.1 44 11.5Intentional Self‐Harm (Suicide) (X60‐X84, Y87.0) 33 9.1 49 13.7 42 10.7
Essential (Primary) Hypertension and Hypertensive Renal Disease (I10, I12) 14 ‐ 28 7.2 33 9.3Parkinson's Disease (G20‐G21) 13 ‐ 16 ‐ 22 6.4
Salmonella Infections (A01‐A02) 0 ‐ 0 ‐ 0 ‐
Shigellosis and Amebiasis (A03, A06) 0 ‐ 0 ‐ 0 ‐Tuberculosis (A16‐A19) 0 ‐ 1 ‐ 1 ‐Whooping Cough (A37) 0 ‐ 0 ‐ 0 ‐Scarlet Fever and Erysipelas (A38, A46) 0 ‐ 0 ‐ 0 ‐Meningococcal Infection (A39) 0 ‐ 0 ‐ 0 ‐Syphilis (A50‐A53) 0 ‐ 0 ‐ 0 ‐Acute Poliomyelitis (A80) 0 ‐ 0 ‐ 0 ‐Arthropod‐Borne Viral Encephalitis (A83‐A84, A85.2) 0 ‐ 0 ‐ 0 ‐Measles (B05) 0 ‐ 0 ‐ 0 ‐Viral Hepatitis (B15‐B19) 11 ‐ 7 ‐ 13 ‐
Medical Center Health System Community Health Needs Assessment Community Hospital Consulting
August 2013 108
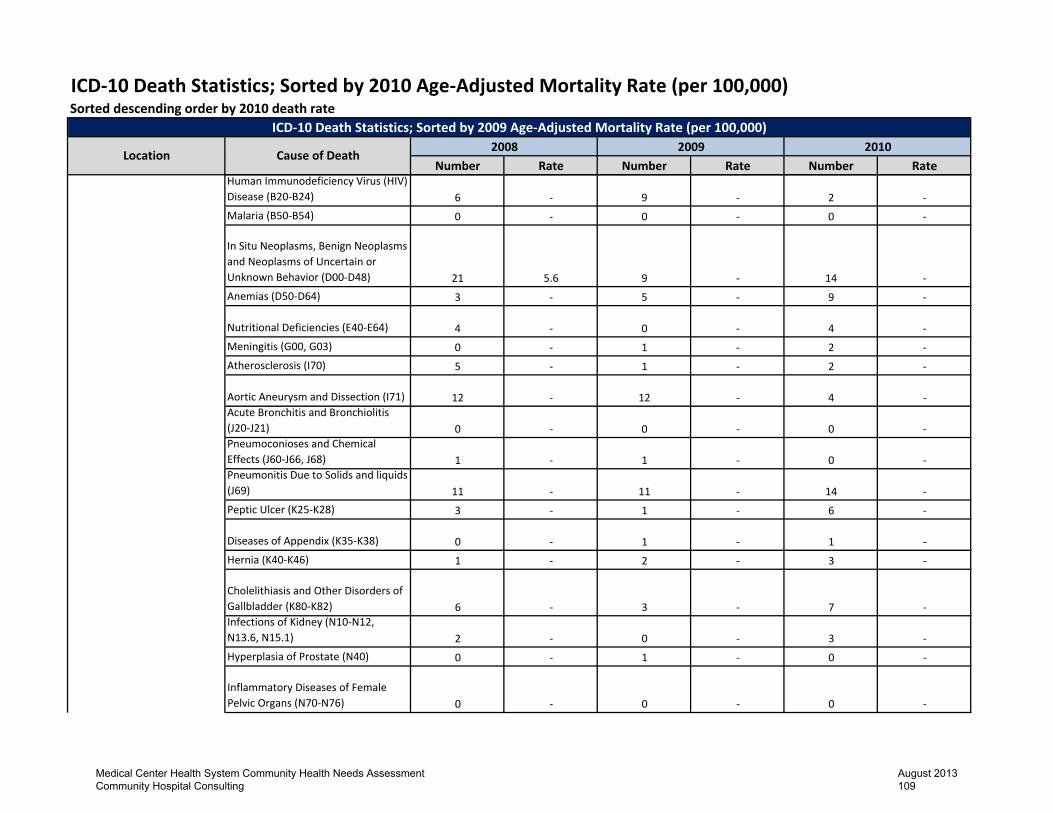
ICD‐10 Death Statistics; Sorted by 2010 Age‐Adjusted Mortality Rate (per 100,000)Sorted descending order by 2010 death rate
Number Rate Number Rate Number Rate
ICD‐10 Death Statistics; Sorted by 2009 Age‐Adjusted Mortality Rate (per 100,000)2008 2009 2010
Cause of DeathLocation
Human Immunodeficiency Virus (HIV) Disease (B20‐B24) 6 ‐ 9 ‐ 2 ‐Malaria (B50‐B54) 0 ‐ 0 ‐ 0 ‐
In Situ Neoplasms, Benign Neoplasms and Neoplasms of Uncertain or Unknown Behavior (D00‐D48) 21 5.6 9 ‐ 14 ‐Anemias (D50‐D64) 3 ‐ 5 ‐ 9 ‐
Nutritional Deficiencies (E40‐E64) 4 ‐ 0 ‐ 4 ‐Meningitis (G00, G03) 0 ‐ 1 ‐ 2 ‐Atherosclerosis (I70) 5 ‐ 1 ‐ 2 ‐
Aortic Aneurysm and Dissection (I71) 12 ‐ 12 ‐ 4 ‐Acute Bronchitis and Bronchiolitis (J20‐J21) 0 ‐ 0 ‐ 0 ‐Pneumoconioses and Chemical Effects (J60‐J66, J68) 1 ‐ 1 ‐ 0 ‐Pneumonitis Due to Solids and liquids (J69) 11 ‐ 11 ‐ 14 ‐Peptic Ulcer (K25‐K28) 3 ‐ 1 ‐ 6 ‐
Diseases of Appendix (K35‐K38) 0 ‐ 1 ‐ 1 ‐Hernia (K40‐K46) 1 ‐ 2 ‐ 3 ‐
Cholelithiasis and Other Disorders of Gallbladder (K80‐K82) 6 ‐ 3 ‐ 7 ‐Infections of Kidney (N10‐N12, N13.6, N15.1) 2 ‐ 0 ‐ 3 ‐Hyperplasia of Prostate (N40) 0 ‐ 1 ‐ 0 ‐
Inflammatory Diseases of Female Pelvic Organs (N70‐N76) 0 ‐ 0 ‐ 0 ‐
Medical Center Health System Community Health Needs Assessment Community Hospital Consulting
August 2013 109

ICD‐10 Death Statistics; Sorted by 2010 Age‐Adjusted Mortality Rate (per 100,000)Sorted descending order by 2010 death rate
Number Rate Number Rate Number Rate
ICD‐10 Death Statistics; Sorted by 2009 Age‐Adjusted Mortality Rate (per 100,000)2008 2009 2010
Cause of DeathLocation
Pregnancy, Childbirth and the Puerperium (O00‐O99) 0 ‐ 3 ‐ 4 ‐
Certain Conditions Originating in the Perinatal Period (P00‐P96) 12 ‐ 17 ‐ 13 ‐
Congenital Malformations, Deformations and Chromosomal Abnormalities (Q00‐Q99) 17 ‐ 17 ‐ 10 ‐
Assault (Homicide) (X85‐Y09, Y87.1) 25 6.6 17 ‐ 14 ‐Legal Intervention (Y35, Y89.0) 2 ‐ 1 ‐ 0 ‐Operations of War and their Sequelae (Y36, Y89.1) 0 ‐ 0 ‐ 0 ‐Complications of Medical and Surgical Care (Y40‐Y84, Y88) 2 ‐ 2 ‐ 5 ‐All Other Diseases 395 104.9 389 99.9 383 103.9All Causes 3,261 863.40 3,085 789.90 3,075 835
TexasDiseases of the Heart (I00‐I09, I11, I13, I20‐I51) 38,493 194.3 38,008 186.7 38,096 180.4
Malignant Neoplasms (C00‐C97) 35,618 172.4 35,531 167.6 36,652 165.6
Cerebrovascular Diseases (I60‐I69) 9,550 49.4 9,118 45.8 9,154 44.3Chronic Lower Respiratory Diseases (J40‐J47) 8,858 45.8 8,624 43.4 8,910 43
Accidents (V01‐X59, Y85‐Y86) 9,455 41.4 9,310 40 9,133 38.7
Alzheimer's Disease (G30) 5,276 28.7 5,062 26.9 5,200 26.7
Diabetes Mellitus (E10‐E14) 5,170 25.4 4,866 23.1 4,738 21.6Nephritis, Nephrotic Syndrome and Nephrosis (N00‐N07, N17‐N19, N25‐N27) 3,527 17.9 3,688 18.2 3,870 18.3
Medical Center Health System Community Health Needs Assessment Community Hospital Consulting
August 2013 110

ICD‐10 Death Statistics; Sorted by 2010 Age‐Adjusted Mortality Rate (per 100,000)Sorted descending order by 2010 death rate
Number Rate Number Rate Number Rate
ICD‐10 Death Statistics; Sorted by 2009 Age‐Adjusted Mortality Rate (per 100,000)2008 2009 2010
Cause of DeathLocation
Influenza and Pneumonia (J09‐J18) 3,542 18.3 3,380 16.7 3,013 14.6
Septicemia (A40‐A41) 2,964 14.8 3,085 15 3,166 14.8Chronic Liver Disease and Cirrhosis (K70, K73‐K74) 2,652 11.7 2,720 11.6 2,870 11.7Intentional Self‐Harm (Suicide) (X60‐X84, Y87.0) 2,618 11 2,795 11.4 2,903 11.8
Essential (Primary) Hypertension and Hypertensive Renal Disease (I10, I12) 1,582 8.1 1,606 8 1,719 8.3
Parkinson's Disease (G20‐G21) 1,268 6.9 1,320 7.1 1,490 7.6Pneumonitis Due to Solids and liquids (J69) 1,143 6 1,170 6 1,287 6.4
Assault (Homicide) (X85‐Y09, Y87.1) 1,489 5.9 1,494 5.9 1,371 5.4
In Situ Neoplasms, Benign Neoplasms and Neoplasms of Uncertain or Unknown Behavior (D00‐D48) 893 4.5 847 4.2 888 4.2
Certain Conditions Originating in the Perinatal Period (P00‐P96) 1,144 4 1,083 3.8 1,116 4.1Human Immunodeficiency Virus (HIV) Disease (B20‐B24) 862 3.6 875 3.6 769 3.1
Congenital Malformations, Deformations and Chromosomal Abnormalities (Q00‐Q99) 859 3.2 859 3.2 811 3.1
Aortic Aneurysm and Dissection (I71) 620 3.1 593 2.9 594 2.8
Viral Hepatitis (B15‐B19) 616 2.6 572 2.3 621 2.4
Anemias (D50‐D64) 326 1.7 312 1.5 342 1.6
Medical Center Health System Community Health Needs Assessment Community Hospital Consulting
August 2013 111

ICD‐10 Death Statistics; Sorted by 2010 Age‐Adjusted Mortality Rate (per 100,000)Sorted descending order by 2010 death rate
Number Rate Number Rate Number Rate
ICD‐10 Death Statistics; Sorted by 2009 Age‐Adjusted Mortality Rate (per 100,000)2008 2009 2010
Cause of DeathLocation
Nutritional Deficiencies (E40‐E64) 295 1.5 295 1.5 335 1.6
Atherosclerosis (I70) 351 1.8 275 1.4 230 1.1
Cholelithiasis and Other Disorders of Gallbladder (K80‐K82) 235 1.2 244 1.2 245 1.2
Peptic Ulcer (K25‐K28) 190 0.9 165 0.8 174 0.8Complications of Medical and Surgical Care (Y40‐Y84, Y88) 179 0.9 168 0.8 182 0.8
Hernia (K40‐K46) 108 0.5 118 0.6 107 0.5Pregnancy, Childbirth and the Puerperium (O00‐O99) 90 0.4 116 0.5 95 0.4
Tuberculosis (A16‐A19) 67 0.3 65 0.3 65 0.3Infections of Kidney (N10‐N12, N13.6, N15.1) 66 0.3 44 0.2 58 0.3
Meningitis (G00, G03) 63 0.3 43 0.2 54 0.2Pneumoconioses and Chemical Effects (J60‐J66, J68) 54 0.3 39 0.2 42 0.2
Legal Intervention (Y35, Y89.0) 42 0.2 51 0.2 35 0.1Acute Bronchitis and Bronchiolitis (J20‐J21) 17 ‐ 16 ‐ 17 ‐
Diseases of Appendix (K35‐K38) 26 0.1 23 0.1 30 0.1
Hyperplasia of Prostate (N40) 25 0.1 26 0.1 33 0.2
Inflammatory Diseases of Female Pelvic Organs (N70‐N76) 12 ‐ 5 ‐ 15 ‐
Salmonella Infections (A01‐A02) 9 ‐ 0 ‐ 1 ‐
Shigellosis and Amebiasis (A03, A06) 0 ‐ 0 ‐ 0 ‐
Medical Center Health System Community Health Needs Assessment Community Hospital Consulting
August 2013 112

ICD‐10 Death Statistics; Sorted by 2010 Age‐Adjusted Mortality Rate (per 100,000)Sorted descending order by 2010 death rate
Number Rate Number Rate Number Rate
ICD‐10 Death Statistics; Sorted by 2009 Age‐Adjusted Mortality Rate (per 100,000)2008 2009 2010
Cause of DeathLocation
Whooping Cough (A37) 3 ‐ 2 ‐ 1 ‐Scarlet Fever and Erysipelas (A38, A46) 0 ‐ 0 ‐ 0 ‐
Meningococcal Infection (A39) 10 ‐ 8 ‐ 2 ‐
Syphilis (A50‐A53) 3 ‐ 5 ‐ 1 ‐
Acute Poliomyelitis (A80) 0 ‐ 0 ‐ 0 ‐Arthropod‐Borne Viral Encephalitis (A83‐A84, A85.2) 1 ‐ 0 ‐ 0 ‐
Measles (B05) 0 ‐ 0 ‐ 0 ‐
Malaria (B50‐B54) 0 ‐ 0 ‐ 0 ‐Operations of War and their Sequelae (Y36, Y89.1) 1 ‐ 1 ‐ 1 ‐
All Other Diseases 23,763 118.9 24,165 118.2 25,623 121.6
All Causes 164,135 808.8 162,792 781.2 166,059 770.3
Source: Texas Health Data, Deaths of Texas Residents; Last Updated May 15, 2013; http://soupfin.tdh.state.tx.us/death10.htm (accessed June 14, 2013)
Note: Age‐adjusted rates use the 2000 population standard; "‐" indicates that the numerator is too small for rate calculation
Note: * Texas Health Data was developed by the Missouri Department of Health and adapted by the State of Texas. The graphics were developed using gd by Thomas Boutell and the database by using the GNU
database GDBM.
Medical Center Health System Community Health Needs Assessment Community Hospital Consulting
August 2013 113

Cancer Incidence Rates by Cancer Type (Age adjusted per 100,000) 2006‐2010
Colon and Rectum Cancer
Location Population at Risk Number of CasesAge‐adjusted Rate
(per 100,000)Ector County 665,090 317 53.8Texas 121,555,829 45,951 42.5
Source: Texas Cancer Registry; http://www.cancer‐rates.info/tx/index.php
Note: All rates are per 100,000. Rates are age‐adjusted to the 2000 U.S. Standard Population.
Data accessed June 19, 2013. Cancer Incidence File, April 2013.
0
10
20
30
40
50
60
Ector County Texas
Colon and Rectum Cancer Incidence Rates (per 100,000) 2006‐2010
Ector County Texas
Medical Center Health System Community Health Needs Assessment Community Hospital Consulting
August 2013 114

Breast Cancer
Location Population at Risk Number of CasesAge‐adjusted Rate
(per 100,000)Ector County 665,090 389 63.8Texas 121,555,829 69,238 61.5
Source: Texas Cancer Registry; http://www.cancer‐rates.info/tx/index.php
Note: All rates are per 100,000. Rates are age‐adjusted to the 2000 U.S. Standard Population.
Data accessed June 19, 2013. Cancer Incidence File, April 2013.
6060.561
61.562
62.563
63.564
Ector County Texas
Breast Cancer Incidence Rates (per 100,000) 2006‐2010
Ector County Texas
Medical Center Health System Community Health Needs Assessment Community Hospital Consulting
August 2013 115

Lung and Bronchus Cancer
Location Population at Risk Number of CasesAge‐adjusted Rate
(per 100,000)Ector County 665,090 455 77.5Texas 121,555,829 64,966 61.6
Source: Texas Cancer Registry; http://www.cancer‐rates.info/tx/index.php
Note: All rates are per 100,000. Rates are age‐adjusted to the 2000 U.S. Standard Population.
Data accessed June 19, 2013. Cancer Incidence File, April 2013.
0.0
20.0
40.0
60.0
80.0
100.0
Ector County Texas
Lung and Bronchus Cancer Incidence Rates (per 100,000) 2006‐2010
Ector County Texas
Medical Center Health System Community Health Needs Assessment Community Hospital Consulting
August 2013 116

Prostate Cancer
Location Population at Risk Number of CasesAge‐adjusted Rate
(per 100,000)Ector County 327,333 258 95.8Texas 60,300,264 66,145 133.2
Source: Texas Cancer Registry; http://www.cancer‐rates.info/tx/index.php
Note: All rates are per 100,000. Rates are age‐adjusted to the 2000 U.S. Standard Population.
Data accessed June 19, 2013. Cancer Incidence File, April 2013.
0
20
40
60
80
100
120
140
Ector County Texas
Prostate Cancer Incidence Rates (per 100,000) 2006‐2010
Ector County Texas
Medical Center Health System Community Health Needs Assessment Community Hospital Consulting
August 2013 117

Communicable Disease Rates
Number of Cases
Disease Rates (Per 100,000
Population)
Number of Cases
Disease Rates (Per 100,000
Population)
Number of Cases
Disease Rates (Per 100,000
Population)Ector County Tuberculosis 2 1.6 1 0.8 2 1.5
Primary and Secondary Syphilis 1 0.8 0 ‐ 5 3.7Gonorrhea 164 127.9 220 168.1 201 150.3Chlamydia 522 407.1 632 483 676 505.4AIDS 8 6.2 7 5.3 6 4.6Pertussis (Whooping Cough) 7 5.5 2 1.5 4 3Varicella (Chickenpox) 35 27.3 42 32.1 31 23.2
Region 9 Tuberculosis 13 2.4 13 2.4 12 2.2Primary and Secondary Syphilis 5 0.9 0 ‐ 7 1.3Gonorrhea 571 106.5 704 129.1 659 118.7Chlamydia 1,796 335 2,438 447 2,616 471.2AIDS 19 3.6 19 3.6 27 4.9Pertussis (Whooping Cough) 19 3.5 8 1.5 42 7.6Varicella (Chickenpox) 359 67 190 34.8 153 27.6
Texas Tuberculosis 1,494 6.3 1,501 6.2 1,477 5.9Primary and Secondary Syphilis 1,172 4.9 1,405 5.8 1,644 6.6Gonorrhea 31,761 132.9 31,569 129.8 28,782 116.1Chlamydia 84,784 354.7 98,707 405.8 103,829 419AIDS 2,857 12 2,865 11.9 2,286 9.2Pertussis (Whooping Cough) 1,051 4.4 2,046 8.4 3,358 13.5Varicella (Chickenpox) 10,061 42.1 7,839 32.2 4,445 17.9
Source: Texas Department of State Health Services; Health Facts Profiles 2007, 2008, 2009; http://www.dshs.state.tx.us/chs/cfs/Texas‐Health‐Facts‐Profiles.doc
Note: Disease rates are per 100,000 population. Use caution interpreting rates based on small numbers of cases.
Note: "‐" Indicates that the value was either not provided or not calculated.
Data accessed June 19, 2013
Communicable Disease Cases and Rates (2007 ‐ 2009)
Geographic Location Disease
2007 2008 2009
Medical Center Health System Community Health Needs Assessment Community Hospital Consulting
August 2013 118

Communicable Disease RatesGonorrhea
Chlamydia
Source: Texas Department of State Health Services; Health Facts Profiles 2007, 2008, 2009; http://www.dshs.state.tx.us/chs/cfs/Texas‐Health‐Facts‐Profiles.doc
Note: Disease rates are per 100,000 population. Use caution interpreting rates based on small numbers of cases.
Note: "‐" Indicates that the value was either not provided or not calculated.
Data accessed June 19, 2013
Ector County Region 9 Texas2007 127.9 106.5 132.92008 168.1 129.1 129.82009 150.3 118.7 116.1
050
100150200250300350400450
Rate
Gonorrhea Rates
Ector County Region 9 Texas2007 407.1 335 354.72008 483 447 405.82009 505.4 471.2 419
0
100
200
300
400
500
600
Rate
Chlamydia Rates
Medical Center Health System Community Health Needs Assessment Community Hospital Consulting
August 2013 119

Low Birth Weight Births (<2,500 Grams)
County, Region, or State
YearTotal Low Birth Weight Births
% of Births % White** % Black % Hispanic
2009 273 9.9 10 28.4 8.72010 250 10.3 10.5 14.3 9.92011 255 10.4 10 33 9.42009 819 8.7 8.1 19.7 8.32010 781 8.9 8.2 12.4 9.12011 755 8.5 8.4 18.2 82009 34,157 8.5 8 14.2 7.62010 32,490 8.4 7.7 13.9 7.72011 32,048 8.5 7.8 13.6 7.8
Source: Texas Department of State Health Services, Center for Health Statistics; Last updated April 29, 2013; http://www.dshs.state.tx.us/chs/vstat/annrpts.shtm
Note: * Percent is not computed if denominator is less than or equal to 20. "‐" = Percent is not computed if numerator is equal to 0.
** Includes Other and Unknown Race/Ethnicity.
Data accessed June 19, 2013
Low Birth Weight Births (<2,500 Grams) by Place and Race/Ethnicity
Ector County
Region 9
Texas
Ector County Region 9 Texas2009 9.9 8.7 8.52010 10.3 8.9 8.42011 10.4 8.5 8.5
0
2
4
6
8
10
12
Percen
t
Percent of Low Birth Weight Births (<2,500 Grams)
% White % Black % HispanicEctor County 10 33 9.4Region 9 8.4 18.2 8Texas 7.8 13.6 7.8
0
5
10
15
20
25
30
35
Percen
t
Percent of Low Birth Weight Births (<2,500 Grams) by Race/Ethnicity 2011
Medical Center Health System Community Health Needs Assessment Community Hospital Consulting
August 2013 120

Teen Births
Geographic Location
Year
Total Number of Births to Women 17 Years of Age or
Younger
% of Total Births % White** % Black % Hispanic
2009 216 7.8 5.3 9.5 8.92010 166 6.8 4.2 4.1 8.32011 139 5.7 4.2 4.5 6.52009 640 6.8 3.7 9.6 8.82010 524 6 3.4 7.4 7.82011 476 5.4 2.6 5.6 7.52009 18,732 4.7 2 5.6 6.52010 16,720 4.3 1.8 5 6.22011 14,638 3.9 1.6 4.4 5.6
Source: Texas Department of State Health Services, Center for Health Statistics; Last updated April 29, 2013; http://www.dshs.state.tx.us/chs/vstat/annrpts.shtm
Note: * Percent is not computed if denominator is less than or equal to 20. "‐" = Percent is not computed if numerator is equal to 0.
** Includes Other and Unknown Race/Ethnicity.
Data accessed June 19, 2013
Teen Births (Age 17 or Younger) by Place and Race/Ethnicity
Ector County
Region 9
Texas
Ector County Region 9 Texas2009 7.8 6.8 4.72010 6.8 6.0 4.32011 5.7 5.4 3.9
0.01.02.03.04.05.06.07.08.09.0
Percen
t
Percent of Teen Births
% White % Black % HispanicEctor County 4.2 4.5 6.5Region 9 2.6 5.6 7.5Texas 1.6 4.4 5.6
012345678
Percen
t
Percent of Teen Births by Race/Ethnicity 2011
Medical Center Health System Community Health Needs Assessment Community Hospital Consulting
August 2013 121

Smoking During Pregnancy
Geographic Location
2009 2010
Ector County 7.7% 8.1%Texas 5.1% 4.9%
Source: Texas Health Data, Births to Texas Residents; Last Updated May 15, 2013; http://soupfin.tdh.state.tx.us/birth05.htm (Accessed July 8, 2013)
Ector County Texas2009 7.7% 5.1%2010 8.1% 4.9%
0%
5%
10%
15%
20%
Smoking During Pregnancy
Medical Center Health System Community Health Needs Assessment Community Hospital Consulting
August 2013 122

Area Groups DemographicsSample
Size
Percent Not at Risk
(95% CI)Percent At Risk
(95% CI)Ector County Totals Totals 859 84.1 (76.9-89.3) 15.9 (10.7-23.1)
Gender Male 281 74.8 (61.6-84.6) 25.2 (15.4-38.4)Female 578 91.0 (85.0-94.8) 9.0 (5.2-15.0)
Race/Ethnicity White 604 85.7 (75.5-92.2) 14.3 (7.8-24.5)Black < 50 (-) (-)
Hispanic 195 81.2 (67.7-89.9) 18.8 (10.1-32.3)Other < 50 (-) (-)
Age Group 18-29 Years 76 81.0 (63.6-91.2) 19.0 (8.8-36.4)30-44 Years 143 76.0 (57.4-88.1) 24.0 (11.9-42.6)45-64 Years 341 86.7 (79.8-91.6) 13.3 (8.4-20.2)65+ Years 294 99.4 (98.1-99.8) 0.6 (0.2-1.9)
Education < High School 145 74.1 (50.9-88.8) 25.9 (11.2-49.1)High School
Grad 266 84.4 (73.8-91.3) 15.6 (8.7-26.2)Some College 254 84.1 (73.3-91.1) 15.9 (8.9-26.7)College Grad 194 96.1 (91.7-98.2) 3.9 (1.8-8.3)
Income < $25,000 286 89.8 (80.2-95.0) 10.2 (5.0-19.8)
$25,000-$49,999 184 82.6 (64.7-92.5) 17.4 (7.5-35.3)$50,000 + 280 76.5 (61.7-86.8) 23.5 (13.2-38.3)
Prevalence of Binge DrinkingEctor County
Adults Ages 18 Years and OverTexas BRFSS, 2007-2010 Combined
Medical Center Health System Community Health Needs Assessment Community Hospital Consulting
August 2013 123

Area Groups DemographicsSample
SizePercent Yes
(95% CI)Percent No
(95% CI)Ector County Totals Totals 868 8.6 (5.4-13.4) 91.4 (86.6-94.6)
Gender Male 285 7.0 (3.5-13.5) 93.0 (86.5-96.5)Female 583 9.8 (5.3-17.5) 90.2 (82.5-94.7)
Race/Ethnicity White 606 10.2 (6.8-15.2) 89.8 (84.8-93.2)Black < 50 (-) (-)
Hispanic 201 7.6 (2.4-21.3) 92.4 (78.7-97.6)Other < 50 (-) (-)
Age Group 18-29 Years 79 4.6 (1.9-10.9) 95.4 (89.1-98.1)30-44 Years 146 11.9 (4.7-27.1) 88.1 (72.9-95.3)45-64 Years 343 9.3 (4.8-17.1) 90.7 (82.9-95.2)65+ Years 295 7.8 (4.6-12.9) 92.2 (87.1-95.4)
Education < High School 146 10.7 (3.1-31.2) 89.3 (68.8-96.9)High School
Grad 270 7.2 (3.9-13.0) 92.8 (87.0-96.1)Some College 255 13.3 (7.5-22.7) 86.7 (77.3-92.5)College Grad 197 3.0 (1.4-6.4) 97.0 (93.6-98.6)
Income < $25,000 285 15.4 (7.5-29.0) 84.6 (71.0-92.5)
$25,000-$49,999 188 5.7 (2.9-11.2) 94.3 (88.8-97.1)$50,000 + 283 5.5 (2.2-13.1) 94.5 (86.9-97.8)
Texas BRFSS, 2007-2010 Combined
Ector CountyAdults Ages 18 Years and Over
Medical Center Health System Community Health Needs Assessment Community Hospital Consulting
August 2013 124

Area Groups DemographicsSample
SizePercent Yes
(95% CI)Percent No
(95% CI)Ector County Totals Totals 880 9.4 (6.5-13.5) 90.6 (86.5-93.5)
Gender Male 289 12.7 (7.5-20.7) 87.3 (79.3-92.5)Female 591 6.9 (4.3-10.9) 93.1 (89.1-95.7)
Race/Ethnicity White 614 7.8 (5.6-10.7) 92.2 (89.3-94.4)Black < 50 (-) (-)
Hispanic 202 12.6 (6.6-22.6) 87.4 (77.4-93.4)Other < 50 (-) (-)
Age Group 18-29 Years 79 0.2 (0.0-1.2)99.8 (98.8-
100.0)30-44 Years 147 5.9 (1.7-18.5) 94.1 (81.5-98.3)45-64 Years 348 12.8 (8.9-18.2) 87.2 (81.8-91.1)65+ Years 301 24.8 (15.0-38.0) 75.2 (62.0-85.0)
Education < High School 148 7.7 (3.2-17.6) 92.3 (82.4-96.8)High School
Grad 274 10.2 (5.2-19.1) 89.8 (80.9-94.8)Some College 259 10.2 (5.3-18.7) 89.8 (81.3-94.7)College Grad 199 9.3 (4.4-18.3) 90.7 (81.7-95.6)
Income < $25,000 293 12.4 (6.5-22.3) 87.6 (77.7-93.5)
$25,000-$49,999 189 5.3 (2.8-9.8) 94.7 (90.2-97.2)$50,000 + 284 8.4 (4.5-15.3) 91.6 (84.7-95.5)
Prevalence of DiabetesEctor County
Adults Ages 18 Years and OverTexas BRFSS, 2007-2010 Combined
Medical Center Health System Community Health Needs Assessment Community Hospital Consulting
August 2013 125

Area Groups DemographicsSample
Size
Percent Not at Risk
(95% CI)Percent At Risk
(95% CI)Ector County Totals Totals 838 29.9 (23.0-37.8) 70.1 (62.2-77.0)
Gender Male 287 26.3 (18.9-35.3) 73.7 (64.7-81.1)Female 551 32.8 (22.4-45.1) 67.2 (54.9-77.6)
Race/Ethnicity White 590 40.6 (31.9-50.0) 59.4 (50.0-68.1)Black < 50 (-) (-)
Hispanic 189 23.9 (13.2-39.2) 76.1 (60.8-86.8)Other < 50 (-) (-)
Age Group 18-29 Years 77 47.9 (26.9-69.7) 52.1 (30.3-73.1)30-44 Years 136 16.0 (9.7-25.0) 84.0 (75.0-90.3)45-64 Years 329 26.5 (19.1-35.5) 73.5 (64.5-80.9)65+ Years 292 32.7 (23.7-43.1) 67.3 (56.9-76.3)
Education < High School 141 21.5 (11.9-35.8) 78.5 (64.2-88.1)High School
Grad 262 29.5 (17.7-44.8) 70.5 (55.2-82.3)Some College 245 31.5 (23.0-41.5) 68.5 (58.5-77.0)College Grad 190 39.4 (22.1-59.9) 60.6 (40.1-77.9)
Income < $25,000 284 25.5 (17.3-36.1) 74.5 (63.9-82.7)
$25,000-$49,999 180 40.9 (23.0-61.6) 59.1 (38.4-77.0)$50,000 + 276 24.9 (17.7-33.9) 75.1 (66.1-82.3)
Prevalence of Overweight or ObeseEctor County
Adults Ages 18 Years and OverTexas BRFSS, 2007-2010 Combined
Medical Center Health System Community Health Needs Assessment Community Hospital Consulting
August 2013 126

Area Groups DemographicsSample
SizePercent Yes
(95% CI)Percent No
(95% CI)Ector County Totals Totals 880 27.0 (19.7-35.8) 73.0 (64.2-80.3)
Gender Male 289 18.1 (11.6-27.2) 81.9 (72.8-88.4)Female 591 33.9 (22.8-47.0) 66.1 (53.0-77.2)
Race/Ethnicity White 614 14.3 (10.3-19.3) 85.7 (80.7-89.7)Black < 50 (-) (-)
Hispanic 202 36.7 (25.5-49.5) 63.3 (50.5-74.5)Other < 50 (-) (-)
Age Group 18-29 Years 79 38.2 (18.5-62.8) 61.8 (37.2-81.5)30-44 Years 147 27.7 (16.1-43.3) 72.3 (56.7-83.9)45-64 Years 348 24.6 (18.5-32.0) 75.4 (68.0-81.5)65+ Years 301 12.2 (5.3-25.4) 87.8 (74.6-94.7)
Education < High School 148 43.3 (22.7-66.5) 56.7 (33.5-77.3)High School
Grad 274 27.2 (18.1-38.7) 72.8 (61.3-81.9)Some College 259 23.9 (15.6-34.9) 76.1 (65.1-84.4)College Grad 199 9.4 (4.8-17.8) 90.6 (82.2-95.2)
Income < $25,000 293 37.8 (26.0-51.3) 62.2 (48.7-74.0)
$25,000-$49,999 189 18.6 (10.3-31.3) 81.4 (68.7-89.7)$50,000 + 284 9.5 (5.8-15.3) 90.5 (84.7-94.2)
Adults Ages 18 Years and OverTexas BRFSS, 2007-2010 Combined
Did Not See a Doctor in the Past 12 Months Because of CostEctor County
Medical Center Health System Community Health Needs Assessment Community Hospital Consulting
August 2013 127

Area Groups DemographicsSample
Size
Percent None or Less Than 5
Days(95% CI)
Percent Five or More Days
(95% CI)Ector County Totals Totals 853 72.9 (62.7-81.2) 27.1 (18.8-37.3)
Gender Male 280 82.6 (70.8-90.2) 17.4 (9.8-29.2)Female 573 65.7 (51.1-77.9) 34.3 (22.1-48.9)
Race/Ethnicity White 600 75.6 (66.3-83.0) 24.4 (17.0-33.7)Black < 50 (-) (-)
Hispanic 196 81.7 (65.5-91.3) 18.3 (8.7-34.5)Other < 50 (-) (-)
Age Group 18-29 Years 79 60.8 (35.1-81.7) 39.2 (18.3-64.9)30-44 Years 143 69.6 (50.1-83.9) 30.4 (16.1-49.9)45-64 Years 340 76.4 (68.7-82.7) 23.6 (17.3-31.3)65+ Years 286 93.3 (88.8-96.1) 6.7 (3.9-11.2)
Education < High School 140 59.1 (34.3-80.1) 40.9 (19.9-65.7)High School
Grad 264 74.6 (58.3-86.0) 25.4 (14.0-41.7)Some College 252 81.2 (73.3-87.2) 18.8 (12.8-26.7)College Grad 197 77.8 (51.3-92.1) 22.2 (7.9-48.7)
Income < $25,000 283 71.2 (55.1-83.2) 28.8 (16.8-44.9)
$25,000-$49,999 185 74.8 (52.9-88.8) 25.2 (11.2-47.1)$50,000 + 279 81.0 (66.7-90.0) 19.0 (10.0-33.3)
Prevalence of Mental Health Not GoodEctor County
Adults Ages 18 Years and OverTexas BRFSS, 2007-2010 Combined
Medical Center Health System Community Health Needs Assessment Community Hospital Consulting
August 2013 128

Area Groups DemographicsSample
SizePercent Yes
(95% CI)Percent No
(95% CI)Ector County Totals Totals 866 5.3 (3.8-7.4) 94.7 (92.6-96.2)
Gender Male 285 6.5 (4.2-10.0) 93.5 (90.0-95.8)Female 581 4.4 (2.6-7.3) 95.6 (92.7-97.4)
Race/Ethnicity White 606 7.8 (5.3-11.3) 92.2 (88.7-94.7)Black < 50 (-) (-)
Hispanic 199 2.5 (1.2-4.9) 97.5 (95.1-98.8)Other < 50 (-) (-)
Age Group 18-29 Years 79 0.3 (0.0-2.3)99.7 (97.7-
100.0)30-44 Years 145 0.7 (0.2-2.0) 99.3 (98.0-99.8)45-64 Years 344 9.0 (5.5-14.5) 91.0 (85.5-94.5)65+ Years 293 15.0 (9.9-22.2) 85.0 (77.8-90.1)
Education < High School 146 6.3 (3.1-12.1) 93.7 (87.9-96.9)High School
Grad 267 6.4 (3.5-11.5) 93.6 (88.5-96.5)Some College 254 4.4 (2.7-7.2) 95.6 (92.8-97.3)College Grad 199 3.2 (1.3-7.5) 96.8 (92.5-98.7)
Income < $25,000 288 7.4 (4.5-11.9) 92.6 (88.1-95.5)
$25,000-$49,999 186 4.3 (2.1-8.5) 95.7 (91.5-97.9)$50,000 + 282 4.9 (2.4-9.7) 95.1 (90.3-97.6)
Prevalence of Heart DiseaseEctor County
Adults Ages 18 Years and OverTexas BRFSS, 2007-2010 Combined
Medical Center Health System Community Health Needs Assessment Community Hospital Consulting
August 2013 129

Area Groups DemographicsSample
SizePercent Yes
(95% CI)Percent No
(95% CI)Ector County Totals Totals 869 6.3 (4.6-8.6) 93.7 (91.4-95.4)
Gender Male 286 6.8 (4.4-10.3) 93.2 (89.7-95.6)Female 583 6.0 (3.8-9.2) 94.0 (90.8-96.2)
Race/Ethnicity White 608 9.5 (6.7-13.3) 90.5 (86.7-93.3)Black < 50 (-) (-)
Hispanic 199 2.8 (1.4-5.3) 97.2 (94.7-98.6)Other < 50 (-) (-)
Age Group 18-29 Years 79 0.3 (0.0-2.3)99.7 (97.7-
100.0)30-44 Years 145 0.9 (0.3-2.3) 99.1 (97.7-99.7)45-64 Years 346 11.2 (7.2-16.9) 88.8 (83.1-92.8)65+ Years 294 17.1 (11.6-24.3) 82.9 (75.7-88.4)
Education < High School 146 6.5 (3.3-12.5) 93.5 (87.5-96.7)High School
Grad 267 7.1 (4.0-12.2) 92.9 (87.8-96.0)Some College 257 7.2 (4.4-11.4) 92.8 (88.6-95.6)College Grad 199 3.7 (1.7-8.0) 96.3 (92.0-98.3)
Income < $25,000 291 8.6 (5.5-13.3) 91.4 (86.7-94.5)
$25,000-$49,999 186 6.3 (3.2-11.8) 93.7 (88.2-96.8)$50,000 + 282 5.4 (2.8-10.1) 94.6 (89.9-97.2)
Adults Ages 18 Years and OverTexas BRFSS, 2007-2010 Combined
Prevalence of Cardiovascular DiseaseEctor County
Medical Center Health System Community Health Needs Assessment Community Hospital Consulting
August 2013 130

Area Groups DemographicsSample
SizePercent Yes
(95% CI)Percent No
(95% CI)Ector County Totals Totals 878 66.7 (58.8-73.7) 33.3 (26.3-41.2)
Gender Male 289 71.2 (60.9-79.7) 28.8 (20.3-39.1)Female 589 63.2 (51.6-73.4) 36.8 (26.6-48.4)
Race/Ethnicity White 612 73.8 (66.8-79.8) 26.2 (20.2-33.2)Black < 50 (-) (-)
Hispanic 202 50.5 (37.3-63.6) 49.5 (36.4-62.7)Other < 50 (-) (-)
Age Group 18-29 Years 79 69.0 (45.7-85.5) 31.0 (14.5-54.3)30-44 Years 147 78.0 (62.5-88.4) 22.0 (11.6-37.5)45-64 Years 347 56.4 (47.6-64.9) 43.6 (35.1-52.4)65+ Years 300 60.3 (48.2-71.3) 39.7 (28.7-51.8)
Education < High School 147 60.1 (39.9-77.3) 39.9 (22.7-60.1)High School
Grad 274 56.8 (42.9-69.6) 43.2 (30.4-57.1)Some College 259 71.6 (61.0-80.2) 28.4 (19.8-39.0)College Grad 198 87.5 (78.7-92.9) 12.5 (7.1-21.3)
Income < $25,000 293 54.3 (40.9-67.1) 45.7 (32.9-59.1)
$25,000-$49,999 189 66.2 (46.5-81.5) 33.8 (18.5-53.5)$50,000 + 283 75.4 (64.4-83.9) 24.6 (16.1-35.6)
Leisure Time Physical ActivityEctor County
Adults Ages 18 Years and OverTexas BRFSS, 2007-2010 Combined
Medical Center Health System Community Health Needs Assessment Community Hospital Consulting
August 2013 131

Area Groups DemographicsSample
Size
Percent Not At Risk
(95% CI)Percent At Risk
(95% CI)Ector County Totals Totals 874 79.1 (72.3-84.6) 20.9 (15.4-27.7)
Gender Male 286 73.4 (61.0-82.9) 26.6 (17.1-39.0)Female 588 83.6 (76.7-88.7) 16.4 (11.3-23.3)
Race/Ethnicity White 611 76.6 (67.2-84.0) 23.4 (16.0-32.8)Black < 50 (-) (-)
Hispanic 199 81.5 (69.3-89.6) 18.5 (10.4-30.7)Other < 50 (-) (-)
Age Group 18-29 Years 79 79.3 (63.9-89.3) 20.7 (10.7-36.1)30-44 Years 145 77.0 (58.7-88.7) 23.0 (11.3-41.3)45-64 Years 344 72.7 (63.7-80.2) 27.3 (19.8-36.3)65+ Years 301 94.4 (90.1-97.0) 5.6 (3.0-9.9)
Education < High School 147 66.4 (44.7-82.9) 33.6 (17.1-55.3)High School
Grad 272 85.3 (77.1-90.9) 14.7 (9.1-22.9)Some College 258 75.6 (65.5-83.4) 24.4 (16.6-34.5)College Grad 197 88.6 (75.4-95.1) 11.4 (4.9-24.6)
Income < $25,000 291 74.4 (61.4-84.2) 25.6 (15.8-38.6)
$25,000-$49,999 189 83.1 (70.9-90.9) 16.9 (9.1-29.1)$50,000 + 280 76.2 (62.3-86.2) 23.8 (13.8-37.7)
Prevalence of Current SmokerEctor County
Adults Ages 18 Years and OverTexas BRFSS, 2007-2010 Combined
Medical Center Health System Community Health Needs Assessment Community Hospital Consulting
August 2013 132

Area Groups DemographicsSample
Size
Percent Not at Risk
(95% CI)Percent At Risk
(95% CI)Medical Center
Hospital - Odessa Totals Totals 2,675 85.2 (81.0-88.5) 14.8 (11.5-19.0)Gender Male 939 77.4 (69.3-83.9) 22.6 (16.1-30.7)
Female 1,736 91.9 (89.1-94.1) 8.1 (5.9-10.9)Race/Ethnicity White 1,906 89.1 (84.6-92.4) 10.9 (7.6-15.4)
Black 113 84.8 (67.1-93.8) 15.2 (6.2-32.9)Hispanic 586 76.7 (67.2-84.1) 23.3 (15.9-32.8)
Other < 50 (-) (-)Age Group 18-29 Years 194 84.3 (72.5-91.6) 15.7 (8.4-27.5)
30-44 Years 446 75.2 (65.3-83.0) 24.8 (17.0-34.7)45-64 Years 1,060 88.5 (84.3-91.7) 11.5 (8.3-15.7)65+ Years 964 99.2 (98.6-99.5) 0.8 (0.5-1.4)
Education < High School 391 83.6 (70.1-91.7) 16.4 (8.3-29.9)High School
Grad 714 85.2 (77.3-90.8) 14.8 (9.2-22.7)Some College 749 81.4 (72.3-88.0) 18.6 (12.0-27.7)College Grad 814 90.9 (87.3-93.6) 9.1 (6.4-12.7)
Income < $25,000 745 89.5 (81.3-94.4) 10.5 (5.6-18.7)
$25,000-$49,999 606 78.4 (66.5-87.0) 21.6 (13.0-33.5)$50,000 + 960 84.2 (78.5-88.6) 15.8 (11.4-21.5)
The RHP 14 - Counties include: Andrews, Brewster Crane, Culberson, Ector, Glasscock, Howard, Jeff Davis, Loving, Martin, Midland, Presidio, Reeves, Upton, Ward, and Winkler Counties
Note: All reported rates are weighted for Texas Demographics and the probability of selection.
Prevalence of Binge DrinkingRHP 14 - Counties
Adults Ages 18 Years and OverTexas BRFSS, 2007-2010 Combined
Survey Question: More than 5 drinks on one occasion for men or 4 drinks on one occasion for women
Note: Prepared using complex sample design from SUDAANPrepared by:
Texas Behavioral Surveillance System, Center for Health StatisticsTexas Department of State Health Services
February 12, 2013
Medical Center Health System Community Health Needs Assessment Community Hospital Consulting
August 2013 133

Area Groups DemographicsSample
SizePercent Yes
(95% CI)Percent No
(95% CI)Medical Center
Hospital - Odessa Totals Totals 2,714 9.8 (7.5-12.7) 90.2 (87.3-92.5)Gender Male 958 8.3 (5.1-13.3) 91.7 (86.7-94.9)
Female 1,756 11.1 (8.1-14.9) 88.9 (85.1-91.9)Race/Ethnicity White 1,926 11.7 (8.5-15.9) 88.3 (84.1-91.5)
Black 118 13.6 (7.2-24.4) 86.4 (75.6-92.8)Hispanic 599 6.7 (3.5-12.5) 93.3 (87.5-96.5)
Other < 50 (-) (-)Age Group 18-29 Years 198 11.8 (6.1-21.5) 88.2 (78.5-93.9)
30-44 Years 455 9.0 (4.7-16.3) 91.0 (83.7-95.3)45-64 Years 1,074 10.9 (7.9-14.9) 89.1 (85.1-92.1)65+ Years 974 6.6 (4.5-9.5) 93.4 (90.5-95.5)
Education < High School 395 7.4 (3.3-15.6) 92.6 (84.4-96.7)High School
Grad 723 9.8 (6.0-15.7) 90.2 (84.3-94.0)Some College 763 11.8 (7.1-19.0) 88.2 (81.0-92.9)College Grad 826 9.4 (6.2-14.1) 90.6 (85.9-93.8)
Income < $25,000 748 12.1 (7.8-18.3) 87.9 (81.7-92.2)
$25,000-$49,999 617 8.8 (4.9-15.2) 91.2 (84.8-95.1)$50,000 + 970 10.0 (6.2-15.9) 90.0 (84.1-93.8)
Prevalence of AsthmaRHP 14 - Counties
Adults Ages 18 Years and OverTexas BRFSS, 2007-2010 Combined
Texas Department of State Health Services
February 12, 2013
Survey Question: Have you ever been told by a doctor, nurse, or other health professional that you had asthma? The RHP 14 - Counties include: Andrews, Brewster Crane, Culberson, Ector, Glasscock, Howard, Jeff Davis,
Loving, Martin, Midland, Presidio, Reeves, Upton, Ward, and Winkler CountiesNote: All reported rates are weighted for Texas Demographics and the probability of selection.
Note: Prepared using complex sample design from SUDAANPrepared by:
Texas Behavioral Surveillance System, Center for Health Statistics
Medical Center Health System Community Health Needs Assessment Community Hospital Consulting
August 2013 134

Area Groups DemographicsSample
SizePercent Yes
(95% CI)Percent No
(95% CI)Medical Center
Hospital - Odessa Totals Totals 2,741 10.8 (8.5-13.5) 89.2 (86.5-91.5)Gender Male 969 11.1 (7.8-15.5) 88.9 (84.5-92.2)
Female 1,772 10.5 (7.6-14.3) 89.5 (85.7-92.4)Race/Ethnicity White 1,946 8.8 (6.6-11.7) 91.2 (88.3-93.4)
Black 119 14.4 (7.7-25.5) 85.6 (74.5-92.3)Hispanic 603 14.3 (9.4-21.1) 85.7 (78.9-90.6)
Other 50 3.9 (0.7-18.2) 96.1 (81.8-99.3)Age Group 18-29 Years 199 3.1 (0.8-11.7) 96.9 (88.3-99.2)
30-44 Years 458 8.2 (4.3-15.1) 91.8 (84.9-95.7)45-64 Years 1,082 12.9 (9.8-16.7) 87.1 (83.3-90.2)65+ Years 989 21.7 (16.5-28.1) 78.3 (71.9-83.5)
Education < High School 400 13.7 (8.2-22.0) 86.3 (78.0-91.8)High School
Grad 732 9.1 (5.8-14.1) 90.9 (85.9-94.2)Some College 770 12.7 (8.2-19.3) 87.3 (80.7-91.8)College Grad 832 8.4 (5.6-12.6) 91.6 (87.4-94.4)
Income < $25,000 760 15.2 (10.4-21.7) 84.8 (78.3-89.6)
$25,000-$49,999 622 10.4 (5.9-17.6) 89.6 (82.4-94.1)$50,000 + 976 7.6 (5.3-11.0) 92.4 (89.0-94.7)
Texas Behavioral Surveillance System, Center for Health StatisticsTexas Department of State Health Services
Note: Prepared using complex sample design from SUDAANPrepared by:
Prevalence of DiabetesRHP 14 - Counties
Adults Ages 18 Years and OverTexas BRFSS, 2007-2010 Combined
Survey Question: Have you ever been told by a doctor that you have diabetes? (Women diagnosed with diabetes The RHP 14 - Counties include: Andrews, Brewster Crane, Culberson, Ector, Glasscock, Howard, Jeff Davis,
Loving, Martin, Midland, Presidio, Reeves, Upton, Ward, and Winkler CountiesNote: All reported rates are weighted for Texas Demographics and the probability of selection.
February 12, 2013
Medical Center Health System Community Health Needs Assessment Community Hospital Consulting
August 2013 135

Area Groups DemographicsSample
Size
Percent Not at Risk
(95% CI)Percent At Risk
(95% CI)Medical Center
Hospital - Odessa Totals Totals 2,589 36.6 (30.9-42.7) 63.4 (57.3-69.1)Gender Male 956 31.4 (22.4-41.9) 68.6 (58.1-77.6)
Female 1,633 41.6 (34.8-48.9) 58.4 (51.1-65.2)Race/Ethnicity White 1,866 46.0 (38.3-53.9) 54.0 (46.1-61.7)
Black 112 24.7 (13.5-40.8) 75.3 (59.2-86.5)Hispanic 546 23.4 (16.4-32.1) 76.6 (67.9-83.6)
Other < 50 (-) (-)Age Group 18-29 Years 190 59.7 (42.2-75.0) 40.3 (25.0-57.8)
30-44 Years 423 26.4 (19.8-34.3) 73.6 (65.7-80.2)45-64 Years 1,020 30.8 (25.4-36.6) 69.2 (63.4-74.6)65+ Years 947 35.0 (29.4-41.0) 65.0 (59.0-70.6)
Education < High School 357 26.9 (17.7-38.7) 73.1 (61.3-82.3)High School
Grad 693 40.0 (27.3-54.1) 60.0 (45.9-72.7)Some College 736 34.4 (27.2-42.5) 65.6 (57.5-72.8)College Grad 798 41.8 (33.9-50.0) 58.2 (50.0-66.1)
Income < $25,000 725 31.3 (24.0-39.5) 68.7 (60.5-76.0)
$25,000-$49,999 583 42.6 (28.5-58.0) 57.4 (42.0-71.5)$50,000 + 954 33.2 (27.8-39.1) 66.8 (60.9-72.2)
Prevalence of Overweight or ObeseRHP 14 - Counties
Adults Ages 18 Years and OverTexas BRFSS, 2007-2010 Combined
Survey Question: Calculated from the height/weight questionsThe RHP 14 - Counties include: Andrews, Brewster Crane, Culberson, Ector, Glasscock, Howard, Jeff Davis,
Loving, Martin, Midland, Presidio, Reeves, Upton, Ward, and Winkler CountiesNote: All reported rates are weighted for Texas Demographics and the probability of selection.
Note: Prepared using complex sample design from SUDAANPrepared by:
Texas Behavioral Surveillance System, Center for Health StatisticsTexas Department of State Health Services
February 12, 2013
Medical Center Health System Community Health Needs Assessment Community Hospital Consulting
August 2013 136

Area Groups DemographicsSample
SizePercent Yes
(95% CI)Percent No
(95% CI)Medical Center
Hospital - Odessa Totals Totals 2,737 20.7 (16.8-25.2) 79.3 (74.8-83.2)Gender Male 967 14.6 (10.0-20.7) 85.4 (79.3-90.0)
Female 1,770 26.1 (20.5-32.7) 73.9 (67.3-79.5)Race/Ethnicity White 1,944 10.6 (8.1-13.8) 89.4 (86.2-91.9)
Black 119 29.8 (17.5-46.0) 70.2 (54.0-82.5)Hispanic 601 34.1 (26.2-43.0) 65.9 (57.0-73.8)
Other 50 46.6 (14.9-81.3) 53.4 (18.7-85.1)Age Group 18-29 Years 198 26.3 (14.5-42.8) 73.7 (57.2-85.5)
30-44 Years 457 24.9 (17.8-33.6) 75.1 (66.4-82.2)45-64 Years 1,081 20.1 (15.8-25.2) 79.9 (74.8-84.2)65+ Years 988 6.6 (3.7-11.4) 93.4 (88.6-96.3)
Education < High School 398 40.4 (27.7-54.5) 59.6 (45.5-72.3)High School
Grad 730 17.9 (12.6-24.7) 82.1 (75.3-87.4)Some College 770 19.0 (13.6-26.0) 81.0 (74.0-86.4)College Grad 832 9.4 (6.5-13.5) 90.6 (86.5-93.5)
Income < $25,000 759 35.1 (27.3-43.8) 64.9 (56.2-72.7)
$25,000-$49,999 620 22.2 (14.3-32.8) 77.8 (67.2-85.7)$50,000 + 976 6.9 (4.7-10.0) 93.1 (90.0-95.3)
February 12, 2013
Texas Behavioral Surveillance System, Center for Health StatisticsTexas Department of State Health Services
Texas BRFSS, 2007-2010 Combined
Survey Question: Was there a time in the past 12 months when you needed to see a doctor but could not The RHP 14 - Counties include: Andrews, Brewster Crane, Culberson, Ector, Glasscock, Howard, Jeff Davis,
Loving, Martin, Midland, Presidio, Reeves, Upton, Ward, and Winkler CountiesNote: All reported rates are weighted for Texas Demographics and the probability of selection.
Note: Prepared using complex sample design from SUDAANPrepared by:
Did Not See a Doctor in the Past 12 Months Because of CostRHP 14 - Counties
Adults Ages 18 Years and Over
Medical Center Health System Community Health Needs Assessment Community Hospital Consulting
August 2013 137
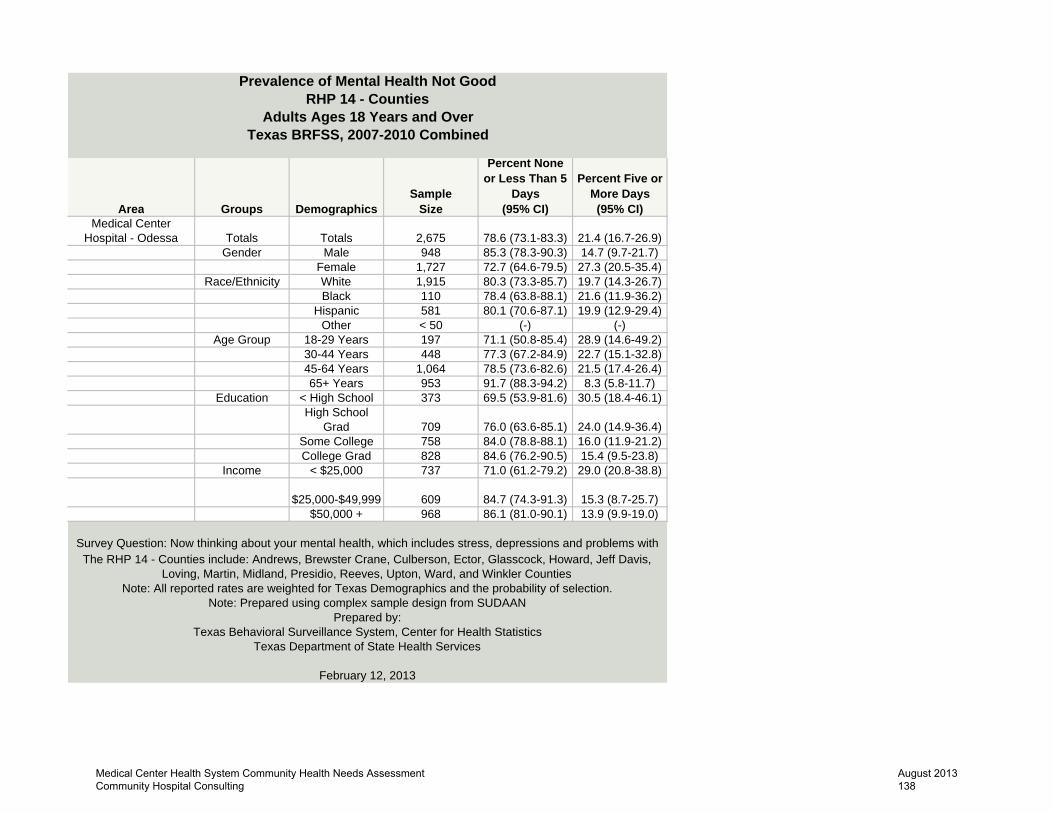
Area Groups DemographicsSample
Size
Percent None or Less Than 5
Days(95% CI)
Percent Five or More Days(95% CI)
Medical Center Hospital - Odessa Totals Totals 2,675 78.6 (73.1-83.3) 21.4 (16.7-26.9)
Gender Male 948 85.3 (78.3-90.3) 14.7 (9.7-21.7)Female 1,727 72.7 (64.6-79.5) 27.3 (20.5-35.4)
Race/Ethnicity White 1,915 80.3 (73.3-85.7) 19.7 (14.3-26.7)Black 110 78.4 (63.8-88.1) 21.6 (11.9-36.2)
Hispanic 581 80.1 (70.6-87.1) 19.9 (12.9-29.4)Other < 50 (-) (-)
Age Group 18-29 Years 197 71.1 (50.8-85.4) 28.9 (14.6-49.2)30-44 Years 448 77.3 (67.2-84.9) 22.7 (15.1-32.8)45-64 Years 1,064 78.5 (73.6-82.6) 21.5 (17.4-26.4)65+ Years 953 91.7 (88.3-94.2) 8.3 (5.8-11.7)
Education < High School 373 69.5 (53.9-81.6) 30.5 (18.4-46.1)High School
Grad 709 76.0 (63.6-85.1) 24.0 (14.9-36.4)Some College 758 84.0 (78.8-88.1) 16.0 (11.9-21.2)College Grad 828 84.6 (76.2-90.5) 15.4 (9.5-23.8)
Income < $25,000 737 71.0 (61.2-79.2) 29.0 (20.8-38.8)
$25,000-$49,999 609 84.7 (74.3-91.3) 15.3 (8.7-25.7)$50,000 + 968 86.1 (81.0-90.1) 13.9 (9.9-19.0)
Prevalence of Mental Health Not GoodRHP 14 - Counties
Survey Question: Now thinking about your mental health, which includes stress, depressions and problems with
Adults Ages 18 Years and OverTexas BRFSS, 2007-2010 Combined
February 12, 2013
The RHP 14 - Counties include: Andrews, Brewster Crane, Culberson, Ector, Glasscock, Howard, Jeff Davis, Loving, Martin, Midland, Presidio, Reeves, Upton, Ward, and Winkler Counties
Note: All reported rates are weighted for Texas Demographics and the probability of selection.Note: Prepared using complex sample design from SUDAAN
Prepared by:Texas Behavioral Surveillance System, Center for Health Statistics
Texas Department of State Health Services
Medical Center Health System Community Health Needs Assessment Community Hospital Consulting
August 2013 138

Area Groups DemographicsSample
SizePercent Yes
(95% CI)Percent No
(95% CI)Medical Center
Hospital - Odessa Totals Totals 2,707 6.7 (5.0-9.0) 93.3 (91.0-95.0)Gender Male 959 9.5 (6.2-14.2) 90.5 (85.8-93.8)
Female 1,748 4.3 (3.1-5.8) 95.7 (94.2-96.9)Race/Ethnicity White 1,924 8.4 (6.3-11.3) 91.6 (88.7-93.7)
Black 114 7.4 (3.2-16.4) 92.6 (83.6-96.8)Hispanic 597 3.8 (1.3-10.8) 96.2 (89.2-98.7)
Other < 50 (-) (-)
Age Group 18-29 Years 198 0.1 (0.0-0.9)99.9 (99.1-
100.0)30-44 Years 455 4.0 (1.2-12.9) 96.0 (87.1-98.8)45-64 Years 1,074 7.7 (5.2-11.4) 92.3 (88.6-94.8)65+ Years 968 18.7 (14.6-23.5) 81.3 (76.5-85.4)
Education < High School 395 9.8 (4.6-19.6) 90.2 (80.4-95.4)High School
Grad 723 6.2 (3.7-10.3) 93.8 (89.7-96.3)Some College 756 7.6 (4.9-11.6) 92.4 (88.4-95.1)College Grad 827 3.6 (2.3-5.6) 96.4 (94.4-97.7)
Income < $25,000 745 9.8 (5.5-16.9) 90.2 (83.1-94.5)
$25,000-$49,999 617 4.0 (2.5-6.3) 96.0 (93.7-97.5)$50,000 + 970 6.1 (3.6-10.2) 93.9 (89.8-96.4)
Prevalence of Heart DiseaseRHP 14 - Counties
Adults Ages 18 Years and OverTexas BRFSS, 2007-2010 Combined
Texas Department of State Health Services
February 12, 2013
Survey Question: Calculated from Having either a heart attack, also called a myocardial infarction and having The RHP 14 - Counties include: Andrews, Brewster Crane, Culberson, Ector, Glasscock, Howard, Jeff Davis,
Loving, Martin, Midland, Presidio, Reeves, Upton, Ward, and Winkler CountiesNote: All reported rates are weighted for Texas Demographics and the probability of selection.
Note: Prepared using complex sample design from SUDAANPrepared by:
Texas Behavioral Surveillance System, Center for Health Statistics
Medical Center Health System Community Health Needs Assessment Community Hospital Consulting
August 2013 139

Area Groups DemographicsSample
SizePercent Yes
(95% CI)Percent No
(95% CI)Medical Center
Hospital - Odessa Totals Totals 2,708 7.7 (5.9-10.0) 92.3 (90.0-94.1)Gender Male 960 10.2 (6.8-15.0) 89.8 (85.0-93.2)
Female 1,748 5.5 (4.1-7.2) 94.5 (92.8-95.9)Race/Ethnicity White 1,924 9.5 (7.2-12.4) 90.5 (87.6-92.8)
Black 115 10.8 (5.4-20.3) 89.2 (79.7-94.6)Hispanic 596 4.5 (1.8-11.0) 95.5 (89.0-98.2)
Other 50 2.4 (0.4-13.5) 97.6 (86.5-99.6)
Age Group 18-29 Years 198 0.1 (0.0-0.9)99.9 (99.1-
100.0)30-44 Years 454 4.4 (1.4-12.8) 95.6 (87.2-98.6)45-64 Years 1,076 9.1 (6.4-12.8) 90.9 (87.2-93.6)65+ Years 968 21.4 (17.1-26.4) 78.6 (73.6-82.9)
Education < High School 393 10.1 (4.8-19.8) 89.9 (80.2-95.2)High School
Grad 723 7.6 (4.8-11.7) 92.4 (88.3-95.2)Some College 760 9.0 (6.1-13.1) 91.0 (86.9-93.9)College Grad 826 4.1 (2.7-6.1) 95.9 (93.9-97.3)
Income < $25,000 748 11.7 (7.1-18.6) 88.3 (81.4-92.9)
$25,000-$49,999 615 5.3 (3.5-8.1) 94.7 (91.9-96.5)$50,000 + 970 6.4 (3.9-10.5) 93.6 (89.5-96.1)
Prevalence of Cardiovascular DiseaseRHP 14 - Counties
Adults Ages 18 Years and Over
Texas Behavioral Surveillance System, Center for Health StatisticsTexas Department of State Health Services
February 12, 2013
Texas BRFSS, 2007-2010 Combined
Survey Question: Calculated from all three heart questionsThe RHP 14 - Counties include: Andrews, Brewster Crane, Culberson, Ector, Glasscock, Howard, Jeff Davis,
Loving, Martin, Midland, Presidio, Reeves, Upton, Ward, and Winkler CountiesNote: All reported rates are weighted for Texas Demographics and the probability of selection.
Note: Prepared using complex sample design from SUDAANPrepared by:
Medical Center Health System Community Health Needs Assessment Community Hospital Consulting
August 2013 140

Area Groups DemographicsSample
SizePercent Yes
(95% CI)Percent No
(95% CI)Medical Center
Hospital - Odessa Totals Totals 2,739 67.5 (62.7-71.9) 32.5 (28.1-37.3)Gender Male 970 69.9 (62.1-76.7) 30.1 (23.3-37.9)
Female 1,769 65.3 (59.4-70.8) 34.7 (29.2-40.6)Race/Ethnicity White 1,944 73.7 (68.4-78.4) 26.3 (21.6-31.6)
Black 119 67.6 (52.3-79.9) 32.4 (20.1-47.7)Hispanic 604 54.1 (45.2-62.7) 45.9 (37.3-54.8)
Other < 50 (-) (-)Age Group 18-29 Years 199 78.3 (63.7-88.1) 21.7 (11.9-36.3)
30-44 Years 458 70.2 (60.7-78.3) 29.8 (21.7-39.3)45-64 Years 1,082 62.9 (57.1-68.4) 37.1 (31.6-42.9)65+ Years 987 56.8 (50.4-62.9) 43.2 (37.1-49.6)
Education < High School 400 46.5 (33.9-59.5) 53.5 (40.5-66.1)High School
Grad 732 64.0 (53.8-73.0) 36.0 (27.0-46.2)Some College 769 74.3 (66.9-80.4) 25.7 (19.6-33.1)College Grad 831 84.2 (79.1-88.2) 15.8 (11.8-20.9)
Income < $25,000 760 49.7 (41.2-58.2) 50.3 (41.8-58.8)
$25,000-$49,999 622 68.5 (56.4-78.5) 31.5 (21.5-43.6)$50,000 + 975 79.0 (73.7-83.4) 21.0 (16.6-26.3)
Leisure Time Physical ActivityRHP 14 - Counties
Prepared by:Texas Behavioral Surveillance System, Center for Health Statistics
Texas Department of State Health Services
February 12, 2013
Adults Ages 18 Years and OverTexas BRFSS, 2007-2010 Combined
Survey Question: During the past month, other than your regular job, did you participate in any physical activities The RHP 14 - Counties include: Andrews, Brewster Crane, Culberson, Ector, Glasscock, Howard, Jeff Davis,
Loving, Martin, Midland, Presidio, Reeves, Upton, Ward, and Winkler CountiesNote: All reported rates are weighted for Texas Demographics and the probability of selection.
Note: Prepared using complex sample design from SUDAAN
Medical Center Health System Community Health Needs Assessment Community Hospital Consulting
August 2013 141

Area Groups DemographicsSample
Size
Percent Not At Risk
(95% CI)Percent At Risk
(95% CI)Medical Center
Hospital - Odessa Totals Totals 2,730 77.3 (71.0-82.5) 22.7 (17.5-29.0)Gender Male 964 69.5 (58.1-78.9) 30.5 (21.1-41.9)
Female 1,766 84.3 (80.7-87.4) 15.7 (12.6-19.3)Race/Ethnicity White 1,941 76.1 (66.6-83.7) 23.9 (16.3-33.4)
Black 118 68.3 (51.8-81.3) 31.7 (18.7-48.2)Hispanic 598 78.6 (69.3-85.7) 21.4 (14.3-30.7)
Other 50 92.6 (79.8-97.6) 7.4 (2.4-20.2)Age Group 18-29 Years 199 70.0 (46.8-86.1) 30.0 (13.9-53.2)
30-44 Years 456 75.1 (64.9-83.1) 24.9 (16.9-35.1)45-64 Years 1,075 77.7 (72.4-82.2) 22.3 (17.8-27.6)65+ Years 988 90.2 (85.9-93.3) 9.8 (6.7-14.1)
Education < High School 398 69.1 (56.0-79.7) 30.9 (20.3-44.0)High School
Grad 729 76.2 (60.1-87.2) 23.8 (12.8-39.9)Some College 768 73.8 (64.9-81.1) 26.2 (18.9-35.1)College Grad 828 90.7 (86.3-93.8) 9.3 (6.2-13.7)
Income < $25,000 758 68.4 (58.8-76.7) 31.6 (23.3-41.2)
$25,000-$49,999 621 68.8 (51.0-82.4) 31.2 (17.6-49.0)$50,000 + 971 85.1 (79.9-89.2) 14.9 (10.8-20.1)
Prevalence of Current Smoker
Note: Prepared using complex sample design from SUDAANPrepared by:
Texas Behavioral Surveillance System, Center for Health StatisticsTexas Department of State Health Services
February 12, 2013
RHP 14 - CountiesAdults Ages 18 Years and Over
Texas BRFSS, 2007-2010 Combined
Survey Question: Smoked at least 100 cigarettes in their lifetime and are still smoking somedays or everyday. The RHP 14 - Counties include: Andrews, Brewster Crane, Culberson, Ector, Glasscock, Howard, Jeff Davis,
Loving, Martin, Midland, Presidio, Reeves, Upton, Ward, and Winkler CountiesNote: All reported rates are weighted for Texas Demographics and the probability of selection.
Medical Center Health System Community Health Needs Assessment Community Hospital Consulting
August 2013 142

Groups DemographicsSample
SizePercent Not at Risk
(95% CI)Percent At Risk
(95% CI)Totals Totals 56,458 85.1 (84.5-85.7) 14.9 (14.3-15.5)Gender Male 19,762 78.6 (77.5-79.6) 21.4 (20.4-22.5)
Female 36,696 91.4 (90.9-91.9) 8.6 (8.1-9.1)Race/Ethnicity White 34,750 84.5 (83.8-85.2) 15.5 (14.8-16.2)
Black 3,841 89.5 (87.6-91.1) 10.5 (8.9-12.4)Hispanic 15,544 83.1 (81.8-84.4) 16.9 (15.6-18.2)
Other 1,716 92.9 (91.1-94.4) 7.1 (5.6-8.9)Age Group 18-29 Years 4,364 77.1 (74.9-79.1) 22.9 (20.9-25.1)
30-44 Years 12,026 82.2 (81.1-83.3) 17.8 (16.7-18.9)45-64 Years 22,132 88.0 (87.3-88.7) 12.0 (11.3-12.7)65+ Years 17,410 95.9 (95.3-96.4) 4.1 (3.6-4.7)
Education < High School 8,610 86.9 (85.2-88.5) 13.1 (11.5-14.8)High School Grad 14,479 83.8 (82.4-85.0) 16.2 (15.0-17.6)
Some College 14,571 84.1 (82.9-85.3) 15.9 (14.7-17.1)College Grad 18,614 86.0 (85.0-86.9) 14.0 (13.1-15.0)
Income < $25,000 15,931 87.6 (86.4-88.8) 12.4 (11.2-13.6)$25,000-$49,999 12,184 83.2 (81.8-84.6) 16.8 (15.4-18.2)
$50,000 + 19,991 82.6 (81.7-83.6) 17.4 (16.4-18.3)
Prevalence of Binge DrinkingTexas
Adults Ages 18 Years and OverTexas BRFSS, 2007-2010 Combined
Survey Question: More than 5 drinks on one occasion for men or 4 drinks on one occasion for women
February 11, 2013
Note: All reported rates are weighted for Texas Demographics and the probability of selection.Note: Prepared using complex sample design from SUDAAN
Prepared by:Texas Behavioral Surveillance System, Center for Health Statistics
Texas Department of State Health Services
Medical Center Health System Community Health Needs Assessment Community Hospital Consulting
August 2013 143

Groups DemographicsSample
SizePercent Yes
(95% CI)Percent No
(95% CI)Totals Totals 57,577 9.8 (9.4-10.1) 90.2 (89.9-90.6)Gender Male 20,330 9.9 (9.3-10.5) 90.1 (89.5-90.7)
Female 37,247 9.6 (9.2-10.1) 90.4 (89.9-90.8)Race/Ethnicity White 35,367 8.2 (7.9-8.7) 91.8 (91.3-92.1)
Black 3,940 14.1 (12.7-15.8) 85.9 (84.2-87.3)Hispanic 15,868 11.0 (10.3-11.8) 89.0 (88.2-89.7)
Other 1,769 9.1 (7.5-11.2) 90.9 (88.8-92.5)Age Group 18-29 Years 4,458 1.7 (1.1-2.4) 98.3 (97.6-98.9)
30-44 Years 12,267 4.9 (4.3-5.6) 95.1 (94.4-95.7)45-64 Years 22,576 14.2 (13.5-14.9) 85.8 (85.1-86.5)65+ Years 17,706 22.4 (21.4-23.4) 77.6 (76.6-78.6)
Education < High School 8,814 13.9 (12.9-15.0) 86.1 (85.0-87.1)High School Grad 14,803 10.6 (9.9-11.4) 89.4 (88.6-90.1)
Some College 14,819 9.9 (9.2-10.8) 90.1 (89.2-90.8)College Grad 18,941 7.0 (6.5-7.6) 93.0 (92.4-93.5)
Income < $25,000 16,233 14.3 (13.5-15.2) 85.7 (84.8-86.5)$25,000-$49,999 12,373 10.1 (9.3-10.9) 89.9 (89.1-90.7)
$50,000 + 20,270 6.5 (6.0-7.1) 93.5 (92.9-94.0)
Prevalence of Diabetes Texas
Adults Ages 18 Years and OverTexas BRFSS, 2007-2010 Combined
Survey Question: Have you ever been told by a doctor that you have diabetes? (Women diagnosed with diabetes during
Texas Department of State Health ServicesJanuary 28, 2013
Note: All reported rates are weighted for Texas Demographics and the probability of selection.Note: Prepared using complex sample design from SUDAAN
Prepared by:Texas Behavioral Surveillance System, Center for Health Statistics
Medical Center Health System Community Health Needs Assessment Community Hospital Consulting
August 2013 144

Groups DemographicsSample
SizePercent Not at Risk
(95% CI)Percent At Risk
(95% CI)Totals Totals 53,979 33.7 (32.9-34.4) 66.3 (65.6-67.1)Gender Male 19,834 27.4 (26.3-28.6) 72.6 (71.4-73.7)
Female 34,145 40.1 (39.2-41.0) 59.9 (59.0-60.8)Race/Ethnicity White 33,804 37.2 (36.2-38.1) 62.8 (61.9-63.8)
Black 3,715 26.9 (24.5-29.5) 73.1 (70.5-75.5)Hispanic 14,264 26.4 (25.0-27.8) 73.6 (72.2-75.0)
Other 1,667 51.8 (47.6-55.9) 48.2 (44.1-52.4)Age Group 18-29 Years 4,104 45.2 (42.7-47.7) 54.8 (52.3-57.3)
30-44 Years 11,410 31.9 (30.6-33.3) 68.1 (66.7-69.4)45-64 Years 21,291 28.1 (27.1-29.0) 71.9 (71.0-72.9)65+ Years 16,805 35.1 (34.1-36.2) 64.9 (63.8-65.9)
Education < High School 7,616 27.7 (25.7-29.9) 72.3 (70.1-74.3)High School Grad 13,962 32.0 (30.5-33.5) 68.0 (66.5-69.5)
Some College 14,114 32.0 (30.6-33.4) 68.0 (66.6-69.4)College Grad 18,167 38.6 (37.4-39.9) 61.4 (60.1-62.6)
Income < $25,000 15,092 29.7 (28.1-31.3) 70.3 (68.7-71.9)$25,000-$49,999 11,852 30.8 (29.3-32.4) 69.2 (67.6-70.7)
$50,000 + 19,658 34.7 (33.6-35.9) 65.3 (64.1-66.4)
Prevalence of Overweight or ObeseTexas
Adults Ages 18 Years and OverTexas BRFSS, 2007-2010 Combined
Texas Department of State Health Services
February 11, 2013
Survey Question: Calculated from the height/weight questions
Note: All reported rates are weighted for Texas Demographics and the probability of selection.Note: Prepared using complex sample design from SUDAAN
Prepared by:Texas Behavioral Surveillance System, Center for Health Statistics
Medical Center Health System Community Health Needs Assessment Community Hospital Consulting
August 2013 145

Groups DemographicsSample
SizePercent Yes
(95% CI)Percent No
(95% CI)Totals Totals 57,457 19.8 (19.2-20.5) 80.2 (79.5-80.8)Gender Male 20,276 15.7 (14.7-16.8) 84.3 (83.2-85.3)
Female 37,181 23.8 (23.0-24.6) 76.2 (75.4-77.0)Race/Ethnicity White 35,310 12.9 (12.2-13.6) 87.1 (86.4-87.8)
Black 3,929 27.3 (25.0-29.8) 72.7 (70.2-75.0)Hispanic 15,822 28.9 (27.6-30.3) 71.1 (69.7-72.4)
Other 1,765 20.8 (17.1-25.0) 79.2 (75.0-82.9)Age Group 18-29 Years 4,445 27.0 (24.9-29.1) 73.0 (70.9-75.1)
30-44 Years 12,254 22.3 (21.1-23.6) 77.7 (76.4-78.9)45-64 Years 22,535 19.0 (18.2-19.9) 81.0 (80.1-81.8)65+ Years 17,648 6.7 (6.0-7.4) 93.3 (92.6-94.0)
Education < High School 8,768 34.9 (32.9-36.9) 65.1 (63.1-67.1)High School Grad 14,762 24.3 (22.9-25.7) 75.7 (74.3-77.1)
Some College 14,796 20.1 (18.9-21.3) 79.9 (78.7-81.1)College Grad 18,928 9.2 (8.3-10.1) 90.8 (89.9-91.7)
Income < $25,000 16,172 38.8 (37.2-40.4) 61.2 (59.6-62.8)$25,000-$49,999 12,355 21.9 (20.5-23.4) 78.1 (76.6-79.5)
$50,000 + 20,260 6.6 (6.1-7.3) 93.4 (92.7-93.9)
Texas Behavioral Surveillance System, Center for Health StatisticsTexas Department of State Health Services
Did Not See a Doctor in the Past 12 Months Because of CostTexas
Adults Ages 18 Years and OverTexas BRFSS, 2007-2010 Combined
Survey Question: Was there a time in the past 12 months when you needed to see a doctor but could not because of cost?
Note: All reported rates are weighted for Texas Demographics and the probability of selection.Note: Prepared using complex sample design from SUDAAN
Prepared by:
February 11, 2013
Medical Center Health System Community Health Needs Assessment Community Hospital Consulting
August 2013 146
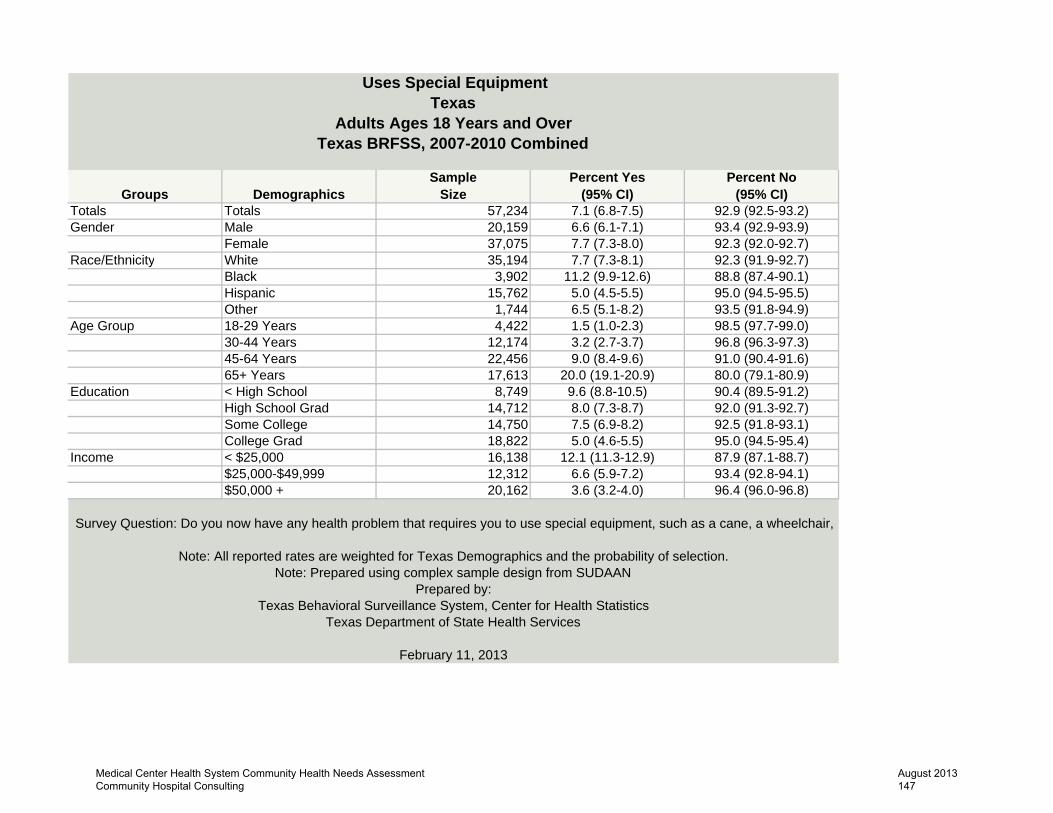
Groups DemographicsSample
SizePercent Yes
(95% CI)Percent No
(95% CI)Totals Totals 57,234 7.1 (6.8-7.5) 92.9 (92.5-93.2)Gender Male 20,159 6.6 (6.1-7.1) 93.4 (92.9-93.9)
Female 37,075 7.7 (7.3-8.0) 92.3 (92.0-92.7)Race/Ethnicity White 35,194 7.7 (7.3-8.1) 92.3 (91.9-92.7)
Black 3,902 11.2 (9.9-12.6) 88.8 (87.4-90.1)Hispanic 15,762 5.0 (4.5-5.5) 95.0 (94.5-95.5)Other 1,744 6.5 (5.1-8.2) 93.5 (91.8-94.9)
Age Group 18-29 Years 4,422 1.5 (1.0-2.3) 98.5 (97.7-99.0)30-44 Years 12,174 3.2 (2.7-3.7) 96.8 (96.3-97.3)45-64 Years 22,456 9.0 (8.4-9.6) 91.0 (90.4-91.6)65+ Years 17,613 20.0 (19.1-20.9) 80.0 (79.1-80.9)
Education < High School 8,749 9.6 (8.8-10.5) 90.4 (89.5-91.2)High School Grad 14,712 8.0 (7.3-8.7) 92.0 (91.3-92.7)Some College 14,750 7.5 (6.9-8.2) 92.5 (91.8-93.1)College Grad 18,822 5.0 (4.6-5.5) 95.0 (94.5-95.4)
Income < $25,000 16,138 12.1 (11.3-12.9) 87.9 (87.1-88.7)$25,000-$49,999 12,312 6.6 (5.9-7.2) 93.4 (92.8-94.1)$50,000 + 20,162 3.6 (3.2-4.0) 96.4 (96.0-96.8)
Texas Behavioral Surveillance System, Center for Health StatisticsTexas Department of State Health Services
February 11, 2013
Uses Special EquipmentTexas
Adults Ages 18 Years and OverTexas BRFSS, 2007-2010 Combined
Survey Question: Do you now have any health problem that requires you to use special equipment, such as a cane, a wheelchair,
Note: All reported rates are weighted for Texas Demographics and the probability of selection.Note: Prepared using complex sample design from SUDAAN
Prepared by:
Medical Center Health System Community Health Needs Assessment Community Hospital Consulting
August 2013 147

Groups DemographicsSample
Size
Percent None or Less Than 5 Days
(95% CI)
Percent Five or More Days
(95% CI)Totals Totals 56,315 80.7 (80.1-81.4) 19.3 (18.6-19.9)Gender Male 19,927 84.2 (83.2-85.2) 15.8 (14.8-16.8)
Female 36,388 77.3 (76.6-78.1) 22.7 (21.9-23.4)Race/Ethnicity White 34,794 81.7 (80.9-82.4) 18.3 (17.6-19.1)
Black 3,841 77.2 (74.9-79.3) 22.8 (20.7-25.1)Hispanic 15,351 80.0 (78.8-81.3) 20.0 (18.7-21.2)
Other 1,729 81.5 (77.2-85.1) 18.5 (14.9-22.8)Age Group 18-29 Years 4,400 76.2 (74.0-78.2) 23.8 (21.8-26.0)
30-44 Years 12,104 80.0 (78.8-81.1) 20.0 (18.9-21.2)45-64 Years 22,166 80.7 (79.9-81.4) 19.3 (18.6-20.1)65+ Years 17,087 88.2 (87.5-88.9) 11.8 (11.1-12.5)
Education < High School 8,324 74.8 (73.0-76.6) 25.2 (23.4-27.0)High School Grad 14,432 78.7 (77.3-80.0) 21.3 (20.0-22.7)
Some College 14,618 79.1 (77.9-80.3) 20.9 (19.7-22.1)College Grad 18,746 86.3 (85.3-87.2) 13.7 (12.8-14.7)
Income < $25,000 15,676 71.3 (69.7-72.7) 28.7 (27.3-30.3)$25,000-$49,999 12,196 81.1 (79.8-82.4) 18.9 (17.6-20.2)
$50,000 + 20,116 86.2 (85.4-87.1) 13.8 (12.9-14.6)
Note: All reported rates are weighted for Texas Demographics and the probability of selection.Note: Prepared using complex sample design from SUDAAN
Prepared by:Texas Behavioral Surveillance System, Center for Health Statistics
Five or more Days of Poor Mental HealthTexas
Adults Ages 18 Years and OverTexas BRFSS, 2007-2010 Combined
Survey Question: Now thinking about your mental health, which includes stress, depressions and problems with emotions, for how
Texas Department of State Health ServicesJanuary 28, 2013
Medical Center Health System Community Health Needs Assessment Community Hospital Consulting
August 2013 148

Groups DemographicsSample
SizePercent Yes
(95% CI)Percent No
(95% CI)Totals Totals 57,318 3.9 (3.7-4.1) 96.1 (95.9-96.3)Gender Male 20,225 4.7 (4.3-5.1) 95.3 (94.9-95.7)
Female 37,093 3.1 (2.9-3.4) 96.9 (96.6-97.1)Race/Ethnicity White 35,236 4.6 (4.3-4.9) 95.4 (95.1-95.7)
Black 3,913 4.4 (3.6-5.2) 95.6 (94.8-96.4)Hispanic 15,793 2.5 (2.2-2.9) 97.5 (97.1-97.8)
Other 1,752 4.4 (3.3-5.9) 95.6 (94.1-96.7)Age Group 18-29 Years 4,449 0.5 (0.3-0.9) 99.5 (99.1-99.7)
30-44 Years 12,243 1.1 (0.9-1.5) 98.9 (98.5-99.1)45-64 Years 22,499 4.5 (4.2-5.0) 95.5 (95.0-95.8)65+ Years 17,560 13.6 (12.9-14.4) 86.4 (85.6-87.1)
Education < High School 8,741 5.2 (4.6-5.8) 94.8 (94.2-95.4)High School Grad 14,715 4.6 (4.1-5.1) 95.4 (94.9-95.9)
Some College 14,766 4.1 (3.7-4.5) 95.9 (95.5-96.3)College Grad 18,898 2.7 (2.4-3.0) 97.3 (97.0-97.6)
Income < $25,000 16,114 6.2 (5.6-6.8) 93.8 (93.2-94.4)$25,000-$49,999 12,332 4.0 (3.6-4.5) 96.0 (95.5-96.4)
$50,000 + 20,243 2.2 (2.0-2.4) 97.8 (97.6-98.0)
Survey Question: Has a doctor, nurse, or other health professional ever told you that you had a heart attack, also called a
Note: All reported rates are weighted for Texas Demographics and the probability of selection.Note: Prepared using complex sample design from SUDAAN
Prepared by:
Prevalence of Heart Attack or Myocardial InfarctionTexas
Adults Ages 18 Years and OverTexas BRFSS, 2007-2010 Combined
Texas Behavioral Surveillance System, Center for Health StatisticsTexas Department of State Health Services
January 28, 2013
Medical Center Health System Community Health Needs Assessment Community Hospital Consulting
August 2013 149

Groups DemographicsSample
SizePercent Yes
(95% CI)Percent No
(95% CI)Totals Totals 57,032 6.2 (5.9-6.5) 93.8 (93.5-94.1)Gender Male 20,121 6.9 (6.4-7.3) 93.1 (92.7-93.6)
Female 36,911 5.5 (5.2-5.8) 94.5 (94.2-94.8)Race/Ethnicity White 35,061 7.1 (6.8-7.5) 92.9 (92.5-93.2)
Black 3,893 6.1 (5.3-7.1) 93.9 (92.9-94.7)Hispanic 15,719 4.5 (4.0-5.0) 95.5 (95.0-96.0)
Other 1,740 6.4 (5.0-8.1) 93.6 (91.9-95.0)Age Group 18-29 Years 4,441 1.0 (0.7-1.5) 99.0 (98.5-99.3)
30-44 Years 12,219 1.9 (1.5-2.3) 98.1 (97.7-98.5)45-64 Years 22,401 7.6 (7.1-8.1) 92.4 (91.9-92.9)65+ Years 17,407 20.7 (19.8-21.7) 79.3 (78.3-80.2)
Education < High School 8,659 8.4 (7.6-9.2) 91.6 (90.8-92.4)High School Grad 14,632 6.9 (6.4-7.6) 93.1 (92.4-93.6)
Some College 14,703 6.5 (6.0-7.1) 93.5 (92.9-94.0)College Grad 18,843 4.4 (4.0-4.7) 95.6 (95.3-96.0)
Income < $25,000 15,988 9.4 (8.7-10.1) 90.6 (89.9-91.3)$25,000-$49,999 12,279 6.3 (5.8-6.9) 93.7 (93.1-94.2)
$50,000 + 20,197 3.7 (3.4-4.0) 96.3 (96.0-96.6)
Texas BRFSS, 2007-2010 Combined
Survey Question: Calculated from Having either a heart attack, also called a myocardial infarction and having angina or coronary
Note: All reported rates are weighted for Texas Demographics and the probability of selection.Note: Prepared using complex sample design from SUDAAN
Prevalence of Heart DiseaseTexas
Adults Ages 18 Years and Over
Prepared by:Texas Behavioral Surveillance System, Center for Health Statistics
Texas Department of State Health ServicesJanuary 28, 2013
Medical Center Health System Community Health Needs Assessment Community Hospital Consulting
August 2013 150

Groups DemographicsSample
SizePercent Yes
(95% CI)Percent No
(95% CI)Totals Totals 57,438 2.6 (2.4-2.7) 97.4 (97.3-97.6)Gender Male 20,274 2.3 (2.0-2.5) 97.7 (97.5-98.0)
Female 37,164 2.9 (2.6-3.1) 97.1 (96.9-97.4)Race/Ethnicity White 35,274 2.8 (2.6-3.1) 97.2 (96.9-97.4)
Black 3,931 4.0 (3.4-4.9) 96.0 (95.1-96.6)Hispanic 15,848 1.6 (1.4-1.9) 98.4 (98.1-98.6)
Other 1,756 2.1 (1.4-3.2) 97.9 (96.8-98.6)Age Group 18-29 Years 4,457 0.5 (0.3-0.9) 99.5 (99.1-99.7)
30-44 Years 12,260 0.7 (0.5-1.0) 99.3 (99.0-99.5)45-64 Years 22,532 3.2 (2.8-3.5) 96.8 (96.5-97.2)65+ Years 17,619 8.6 (8.0-9.2) 91.4 (90.8-92.0)
Education < High School 8,776 3.9 (3.4-4.5) 96.1 (95.5-96.6)High School Grad 14,769 3.1 (2.8-3.5) 96.9 (96.5-97.2)
Some College 14,781 2.5 (2.2-2.8) 97.5 (97.2-97.8)College Grad 18,911 1.6 (1.4-1.8) 98.4 (98.2-98.6)
Income < $25,000 16,175 4.4 (4.0-4.9) 95.6 (95.1-96.0)$25,000-$49,999 12,356 2.4 (2.1-2.8) 97.6 (97.2-97.9)
$50,000 + 20,253 1.2 (1.1-1.5) 98.8 (98.5-98.9)
Adults Ages 18 Years and OverTexas BRFSS, 2007-2010 Combined
Survey Question: Has a doctor, nurse, or other health professional ever told you that you had a stroke?
Note: All reported rates are weighted for Texas Demographics and the probability of selection.
Prevalence of StrokeTexas
Note: Prepared using complex sample design from SUDAANPrepared by:
Texas Behavioral Surveillance System, Center for Health StatisticsTexas Department of State Health Services
January 28, 2013
Medical Center Health System Community Health Needs Assessment Community Hospital Consulting
August 2013 151

Groups DemographicsSample
SizePercent Yes
(95% CI)Percent No
(95% CI)Totals Totals 57,002 7.7 (7.4-8.1) 92.3 (91.9-92.6)Gender Male 20,116 8.2 (7.7-8.7) 91.8 (91.3-92.3)
Female 36,886 7.3 (7.0-7.7) 92.7 (92.3-93.0)Race/Ethnicity White 35,030 8.9 (8.5-9.3) 91.1 (90.7-91.5)
Black 3,902 8.7 (7.7-9.9) 91.3 (90.1-92.3)Hispanic 15,711 5.5 (4.9-6.0) 94.5 (94.0-95.1)
Other 1,740 7.9 (6.3-9.8) 92.1 (90.2-93.7)Age Group 18-29 Years 4,437 1.4 (1.0-2.0) 98.6 (98.0-99.0)
30-44 Years 12,208 2.4 (2.0-2.9) 97.6 (97.1-98.0)45-64 Years 22,398 9.6 (9.0-10.2) 90.4 (89.8-91.0)65+ Years 17,397 25.4 (24.4-26.4) 74.6 (73.6-75.6)
Education < High School 8,651 10.7 (9.8-11.7) 89.3 (88.3-90.2)High School Grad 14,637 8.8 (8.1-9.5) 91.2 (90.5-91.9)
Some College 14,689 8.1 (7.5-8.7) 91.9 (91.3-92.5)College Grad 18,830 5.4 (5.0-5.8) 94.6 (94.2-95.0)
Income < $25,000 15,988 11.9 (11.2-12.7) 88.1 (87.3-88.8)$25,000-$49,999 12,271 7.9 (7.3-8.6) 92.1 (91.4-92.7)
$50,000 + 20,185 4.5 (4.2-4.9) 95.5 (95.1-95.8)
TexasAdults Ages 18 Years and Over
Texas BRFSS, 2007-2010 Combined
Survey Question: Calculated from all three heart questions
Prevalence of Cardiovascular Disease
Note: All reported rates are weighted for Texas Demographics and the probability of selection.Note: Prepared using complex sample design from SUDAAN
Prepared by:Texas Behavioral Surveillance System, Center for Health Statistics
Texas Department of State Health ServicesJanuary 28, 2013
Medical Center Health System Community Health Needs Assessment Community Hospital Consulting
August 2013 152

Groups DemographicsSample
SizePercent Yes
(95% CI)Percent No
(95% CI)Totals Totals 57,557 72.3 (71.6-73.0) 27.7 (27.0-28.4)Gender Male 20,320 75.4 (74.3-76.5) 24.6 (23.5-25.7)
Female 37,237 69.3 (68.5-70.1) 30.7 (29.9-31.5)Race/Ethnicity White 35,342 76.5 (75.8-77.3) 23.5 (22.7-24.2)
Black 3,939 68.4 (66.0-70.7) 31.6 (29.3-34.0)Hispanic 15,871 65.9 (64.4-67.3) 34.1 (32.7-35.6)
Other 1,768 75.6 (72.2-78.7) 24.4 (21.3-27.8)Age Group 18-29 Years 4,456 75.7 (73.5-77.8) 24.3 (22.2-26.5)
30-44 Years 12,273 74.5 (73.3-75.7) 25.5 (24.3-26.7)45-64 Years 22,576 71.1 (70.1-72.0) 28.9 (28.0-29.9)65+ Years 17,676 65.0 (63.9-66.1) 35.0 (33.9-36.1)
Education < High School 8,813 54.4 (52.3-56.4) 45.6 (43.6-47.7)High School Grad 14,790 65.8 (64.3-67.2) 34.2 (32.8-35.7)
Some College 14,813 75.1 (73.9-76.3) 24.9 (23.7-26.1)College Grad 18,937 83.7 (82.7-84.6) 16.3 (15.4-17.3)
Income < $25,000 16,222 59.2 (57.6-60.7) 40.8 (39.3-42.4)$25,000-$49,999 12,374 71.0 (69.5-72.5) 29.0 (27.5-30.5)
$50,000 + 20,271 83.0 (82.1-83.8) 17.0 (16.2-17.9)
Texas Department of State Health Services
Prevalence of Leisure Time ExerciseTexas
Adults Ages 18 Years and OverTexas BRFSS, 2007-2010 Combined
Survey Question: During the past month, other than your regular job, did you participate in any physical activities or exercises such
January 28, 2013
Note: All reported rates are weighted for Texas Demographics and the probability of selection.Note: Prepared using complex sample design from SUDAAN
Prepared by:Texas Behavioral Surveillance System, Center for Health Statistics
Medical Center Health System Community Health Needs Assessment Community Hospital Consulting
August 2013 153

Groups DemographicsSample
SizePercent Not At Risk
(95% CI)Percent At Risk
(95% CI)Totals Totals 57,330 82.1 (81.5-82.8) 17.9 (17.2-18.5)Gender Male 20,222 78.9 (77.8-79.9) 21.1 (20.1-22.2)
Female 37,108 85.3 (84.7-85.9) 14.7 (14.1-15.3)Race/Ethnicity White 35,235 81.1 (80.3-81.9) 18.9 (18.1-19.7)
Black 3,914 80.6 (78.6-82.6) 19.4 (17.4-21.4)Hispanic 15,790 83.7 (82.4-84.9) 16.3 (15.1-17.6)
Other 1,760 85.0 (80.9-88.3) 15.0 (11.7-19.1)Age Group 18-29 Years 4,441 77.1 (75.0-79.1) 22.9 (20.9-25.0)
30-44 Years 12,229 81.6 (80.4-82.8) 18.4 (17.2-19.6)45-64 Years 22,483 81.4 (80.6-82.2) 18.6 (17.8-19.4)65+ Years 17,610 91.1 (90.5-91.8) 8.9 (8.2-9.5)
Education < High School 8,752 76.8 (74.8-78.6) 23.2 (21.4-25.2)High School Grad 14,741 76.5 (75.1-77.8) 23.5 (22.2-24.9)
Some College 14,767 80.1 (78.9-81.3) 19.9 (18.7-21.1)College Grad 18,871 90.5 (89.6-91.4) 9.5 (8.6-10.4)
Income < $25,000 16,171 75.7 (74.2-77.1) 24.3 (22.9-25.8)$25,000-$49,999 12,334 78.6 (77.1-80.1) 21.4 (19.9-22.9)
$50,000 + 20,212 87.4 (86.6-88.2) 12.6 (11.8-13.4)
Texas Department of State Health ServicesJanuary 28, 2013
Note: All reported rates are weighted for Texas Demographics and the probability of selection.Note: Prepared using complex sample design from SUDAAN
Prepared by:Texas Behavioral Surveillance System, Center for Health Statistics
Prevalence of Current SmokerTexas
Adults Ages 18 Years and OverTexas BRFSS, 2007-2010 Combined
Survey Question: Smoked at least 100 cigarettes in their lifetime and are still smoking somedays or everyday.
Medical Center Health System Community Health Needs Assessment Community Hospital Consulting
August 2013 154
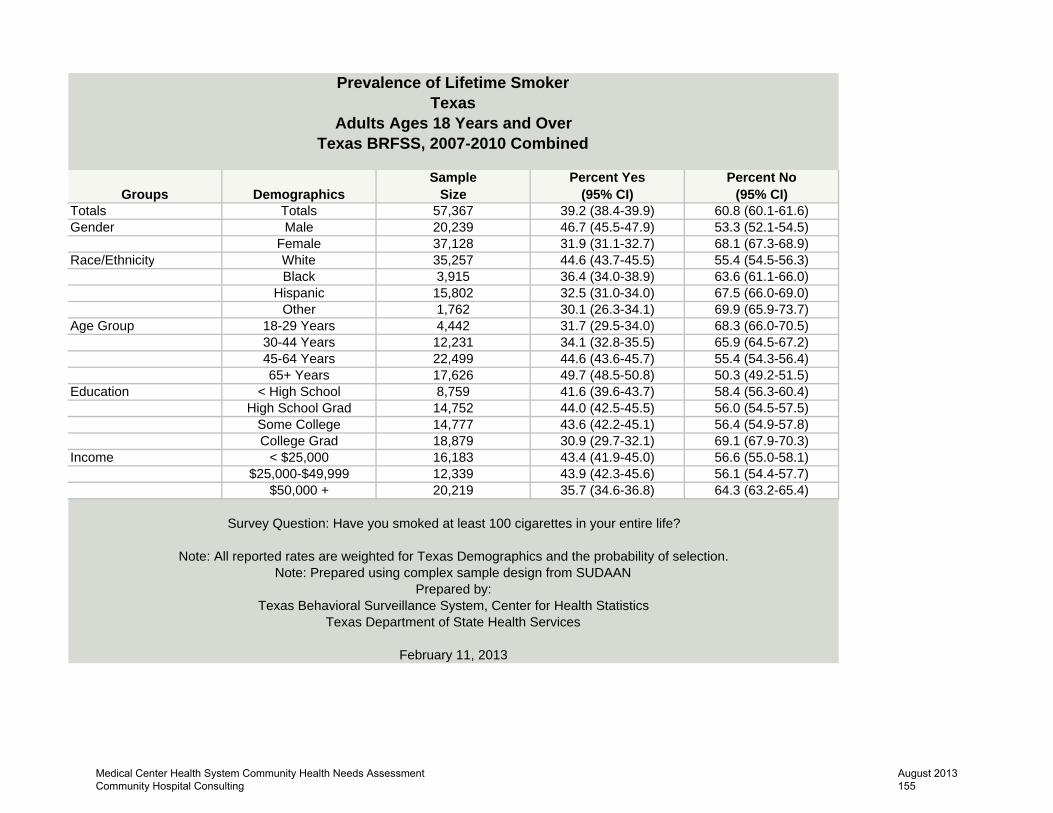
Groups DemographicsSample
SizePercent Yes
(95% CI)Percent No
(95% CI)Totals Totals 57,367 39.2 (38.4-39.9) 60.8 (60.1-61.6)Gender Male 20,239 46.7 (45.5-47.9) 53.3 (52.1-54.5)
Female 37,128 31.9 (31.1-32.7) 68.1 (67.3-68.9)Race/Ethnicity White 35,257 44.6 (43.7-45.5) 55.4 (54.5-56.3)
Black 3,915 36.4 (34.0-38.9) 63.6 (61.1-66.0)Hispanic 15,802 32.5 (31.0-34.0) 67.5 (66.0-69.0)
Other 1,762 30.1 (26.3-34.1) 69.9 (65.9-73.7)Age Group 18-29 Years 4,442 31.7 (29.5-34.0) 68.3 (66.0-70.5)
30-44 Years 12,231 34.1 (32.8-35.5) 65.9 (64.5-67.2)45-64 Years 22,499 44.6 (43.6-45.7) 55.4 (54.3-56.4)65+ Years 17,626 49.7 (48.5-50.8) 50.3 (49.2-51.5)
Education < High School 8,759 41.6 (39.6-43.7) 58.4 (56.3-60.4)High School Grad 14,752 44.0 (42.5-45.5) 56.0 (54.5-57.5)
Some College 14,777 43.6 (42.2-45.1) 56.4 (54.9-57.8)College Grad 18,879 30.9 (29.7-32.1) 69.1 (67.9-70.3)
Income < $25,000 16,183 43.4 (41.9-45.0) 56.6 (55.0-58.1)$25,000-$49,999 12,339 43.9 (42.3-45.6) 56.1 (54.4-57.7)
$50,000 + 20,219 35.7 (34.6-36.8) 64.3 (63.2-65.4)
Texas Department of State Health Services
February 11, 2013
Survey Question: Have you smoked at least 100 cigarettes in your entire life?
Note: All reported rates are weighted for Texas Demographics and the probability of selection.Note: Prepared using complex sample design from SUDAAN
Prepared by:Texas Behavioral Surveillance System, Center for Health Statistics
Prevalence of Lifetime SmokerTexas
Adults Ages 18 Years and OverTexas BRFSS, 2007-2010 Combined
Medical Center Health System Community Health Needs Assessment Community Hospital Consulting
August 2013 155

Groups DemographicsSample
SizePercent Yes
(95% CI)Percent No
(95% CI)Totals Totals 57,507 12.5 (12.0-13.1) 87.5 (86.9-88.0)Gender Male 20,304 11.1 (10.3-12.0) 88.9 (88.0-89.7)
Female 37,203 13.9 (13.3-14.6) 86.1 (85.4-86.7)Race/Ethnicity White 35,314 14.4 (13.7-15.1) 85.6 (84.9-86.3)
Black 3,938 15.1 (13.3-17.0) 84.9 (83.0-86.7)Hispanic 15,858 8.7 (7.8-9.6) 91.3 (90.4-92.2)Other 1,766 12.8 (10.2-15.9) 87.2 (84.1-89.8)
Age Group 18-29 Years 4,453 15.7 (14.0-17.5) 84.3 (82.5-86.0)30-44 Years 12,254 11.4 (10.6-12.3) 88.6 (87.7-89.4)45-64 Years 22,551 12.6 (11.9-13.4) 87.4 (86.6-88.1)65+ Years 17,681 11.4 (10.7-12.1) 88.6 (87.9-89.3)
Education < High School 8,807 9.3 (8.3-10.5) 90.7 (89.5-91.7)High School Grad 14,783 12.7 (11.7-13.8) 87.3 (86.2-88.3)Some College 14,806 14.8 (13.7-15.9) 85.2 (84.1-86.3)College Grad 18,913 12.3 (11.4-13.2) 87.7 (86.8-88.6)
Income < $25,000 16,218 12.9 (11.9-13.9) 87.1 (86.1-88.1)$25,000-$49,999 12,354 11.5 (10.5-12.5) 88.5 (87.5-89.5)$50,000 + 20,254 12.8 (12.0-13.7) 87.2 (86.3-88.0)
Prepared by:Texas Behavioral Surveillance System, Center for Health Statistics
Texas Department of State Health ServicesJanuary 28, 2013
Doctor Diagnosed AsthmaTexas
Adults Ages 18 Years and OverTexas BRFSS, 2007-2010 Combined
Survey Question: Have you ever been told by a doctor, nurse, or other health professional that you had asthma?
Note: All reported rates are weighted for Texas Demographics and the probability of selection.Note: Prepared using complex sample design from SUDAAN
Medical Center Health System Community Health Needs Assessment Community Hospital Consulting
August 2013 156

INTERVIEW BIOGRAPHIES
Medical Center Health System Community Health Needs Assessment Community Hospital Consulting
August 2013 157

Name Interview Date Organization Title Interviewer A B C D
Margaret Burton Wednesday, March 27, 2013 Meals on Wheels of Odessa DirectorKatie Smith,
Research AnalystX X
Toby Eoff Wednesday, April 03, 2013Medical Center Health System
FoundationPresident
Katie Smith, Research Analyst
X X
Mike George Tuesday, March 26, 2013 Odessa Chamber of Commerce President/CEOKatie Smith,
Research AnalystX
Grayson Hankins Tuesday, March 26, 2013 University Pharmacy OwnerKatie Smith,
Research AnalystX X
Laura Mathew, RN Monday, March 25, 2013Health Services – Ector County Independent School District
Director/LiaisonKatie Smith,
Research AnalystX X
Many Puga Monday, April 08, 2013Odessa Hispanic Chamber of
CommercePresident
Katie Smith, Research Analyst
X
Tom Pursel Thursday, April 04, 2013 United Way of Odessa Executive DirectorKatie Smith,
Research AnalystX
Margaret Burton has been the Director at the Meals on Wheels of Odessa for 17 years. Prior to her role as Director, she worked for the organization for 7 years. Burton is a devoted community activist, holding positions on many different local boards including the board of the Family Health Center, and serving as an Odessa City Councilwoman.
Medical Center Hospital of Odessa Community Health Needs Assessment Interview Biographies
Many Puga is the President of the Odessa Hispanic Chamber of Commerce. He has been in the area for over 25 years, and has a background in banking.
Laura Mathew, RN has been the Director of Health Services for the Ector County Independent School District for 11 years. Mathew received a bachelor of science at TWU and a Master’s in Public Health from the University of Texas. She has been a registered nurse for over 30 years, spending time in both inpatient and outpatient facilities, and her focus has always been community health.
Grayson Hankins has owned the University Pharmacy for 7 years. He is a partner in a local hospice agency, and prior to that he worked in pharmaceutical sales. Hankins currently serves on the Texas Council for Alzheimer’s and Related Disorders a consortium made up of 4 university groups trying to pool resources and find cures.
Mike George has been the President and CEO of the Odessa Chamber of Commerce for 20 years. George began his career in banking, and spent 10 years as a trust officer and another 10 years working for the chairman of the board. He has an extensive management background.
Toby Eoff is the President of Odessa Pumps, a US distributor of pumps for water stations, chemicals and corrosives, slurries or sumps. He has been on the Medical Center Health System Foundation board for 2 years, and is currently in his first year as President of the foundation.
Tom Pursel is a retired military member, and has been the Executive Director of the United Way of Odessa for 3 years.
Medical Center Health System Community Health Needs Assessment Community Hospital Consulting
August 2013 158

Name Interview Date Organization Title Interviewer A B C D
Medical Center Hospital of Odessa Community Health Needs Assessment Interview Biographies
H.T. Sanchez, Ed.D. Wednesday, May 01, 2013Ector County Independent School
DistrictInterim Superintendent
Katie Smith, Research Analyst
X X
Ravi Shakamuri, M.S. Tuesday, March 26, 2013 Star Care Health Services CEOKatie Smith,
Research AnalystX X
Greg Simmons Tuesday, March 26, 2013Ector County Commissioners’
CourtPrecinct 2 Commissioner
Katie Smith, Research Analyst
X
Gino Solla Wednesday, March 27, 2013 Ector County Health Department DirectorKatie Smith,
Research AnalystX X X
Gregory D. Williams, Ed. D. Thursday, March 28, 2013 Odessa College PresidentKatie Smith,
Research AnalystX
Tamrasha Williams, MD Thursday, April 11, 2013 Medical Center Health SystemChief of Staff and Anesthesiologist
Katie Smith, Research Analyst
X X
D: other
A: special knowledge of or expertise in public health
B: work for federal, tribal, regional, state or local health department or agency
C: leader, representative or member of a medically underserved, low income, minority or chronic disease population(s)
Ravi Shakamuri is the CEO of Star Care Health Services, a home health service company. The company also includes Star Hospice and Star Medical Equipment. Shakamuri has held his current position for 15 years, and previously served as the regional director of outpatient services for Seton Healthcare.
Sanchez has worked in public education for 15 years and has been an elementary, middle, and high school principal. He has also served as a district level Bilingual/ESLServices Director and Instructional Support Services Executive Director at Tyler ISD and as Accountability and Special Populations Assistant Superintendent for ECISD. He has made scholarly contributions at international and state level conferences, presented research studies to universities, and has been published on educational topics. Sanchez also serves as an adjunct professor for Texas A & M University‐Commerce where he teaches graduate level school law and doctoral level ethics and philosophy. He holds a Doctorate of Education from Texas A&M University‐Commerce, a Master of Education from Sul Ross State University, and a Bachelor of Arts from Angelo State University.
Greg Simmons has been the Precint 2 Commissioner for Ector County for 15 years. Simmons has experience in hospital administration, and currently serves as a bank president.
Gino Solla is the Director for the Ector County Health Department. Solla has been with the health department since 1994.
Dr. Gregory Williams has been the President of Odessa College for 7 years. He previously served as president for another college and has over 25 years of experience ineducation, both with grades K‐12 and in higher education. Dr. Williams is also involved with training and education programs for nurses and individuals in the nursing field at Odessa College.
Dr. Tamrasha Williams is the Chief of Staff at Medical Center Health System. Dr Williams has been on staff at the hospital for 21 years, and also serves as an anesthesiologist.
Medical Center Health System Community Health Needs Assessment Community Hospital Consulting
August 2013 159

Please address written comments on the CHNA and Implementation Plan and requests for a copy of the CHNA to:
Diana Franco, DNP, RN‐BC, CWOCN, NE Director of Population/Community Health
Phone Number: (432) 640 – 2383 Email: [email protected]
500 West 4th Street Odessa, TX 79761
Medical Center Health System Community Health Needs Assessment Community Hospital Consulting
August 2013 160