Embed Size (px)
Citation preview

International Journal of Latest Trends in Engineering and Technology (IJLTET)
Vol. 4 Issue 2 July 2014 70 ISSN: 2278-621X
Medical image enhancement using Global mean
and variance with Localization function
Manjeet Singh Walia
Student (Department of Information Security),
Chandigarh Engineering College, Landran , India
Manish Mahajan
Associate Professor (Department of IT)
Chandigarh Engineering College, Landran , India
. Abstract- In medical images we mostly use x-ray source to produce the images. The image formation is so obtained by
using the concept of back projection. This means that source generate the x ray energy and pass through patient body and
make the image through the sensor. This may lead to have a poor image contrast because of the poor usage of the
available range of possible gray levels. Due to this the images may lead to overexposure & underexposure [1]. Some parts
having soft tissues, generate high contrast while some other parts havig hard tissue generate low contrast. Most of the
contrast enhancement methods are used to correct the contrast, but all the methods have limited efficiency to do this
correction. So we need a method that could generate contrast for local means. Local means make a effect over small
changed level of gray values.In the current paper we are going to implement the new method of image contrast
enhancement that uses the concept of Global mean and global variance by using localization functions. The results of this
technique show that it proves to be better, accurate and improves the contrast of images
Keywords- Image enhancement, Rayleigh CLAHE, global mean and variance
I.INTRODUCTION
The principal objective of image enhancement is to process a given image so that the result is more suitable than the
original image for a specific application. It will improve the image features like edges, boundaries, or contrast to
make a better graphic display which helpful for display and examination. The enhancement doesn't increase the
inherent information related to the data, but it will boost the dynamic range of the chosen features so that they can be
detected easily. The advantage of image enhancement either may be a human observer or a computer vision program
performing some kind of higher-level image analysis, it also detect target or understand scenes.
A. General registration process
Fig. 1 General image enhancement process
Source Image: In this step the image which is to be enhanced is uploaded.
Enhancement Technique: This is the second step in this different Image Enhancement method are applied to the
image to enhance different features of the image.
Application specific: In this step the application is specified for which application the enhancement method is used,
as it may vary from one application to other.
Better Image: This is the final step, in this we receive the image after the enhancement of the image is done & a
better image is received.
SOURCE IMAGE ENHANCEMENT
TECHNIQUE BETTER IMAGE
APPLICATION
SPECIFIC
International Journal of Latest Trends in Engineering and Technology (IJLTET)
Vol. 4 Issue 2 July 2014 71 ISSN: 2278-621X
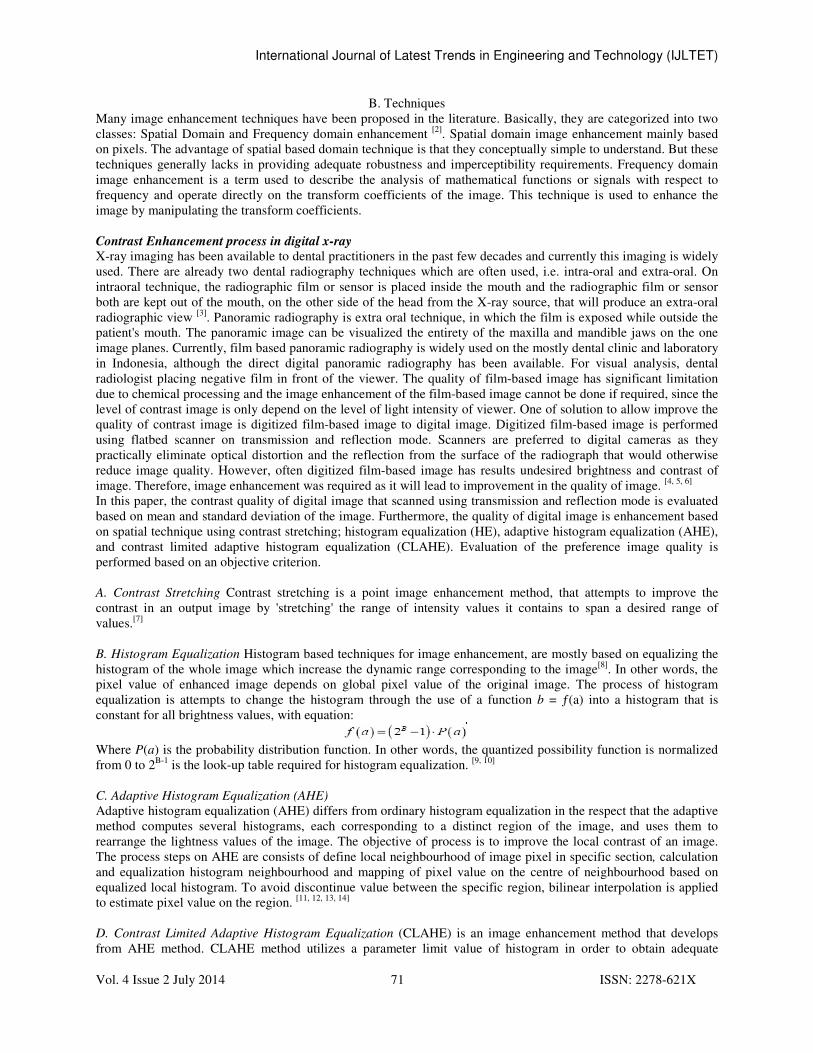
B. Techniques
Many image enhancement techniques have been proposed in the literature. Basically, they are categorized into two
classes: Spatial Domain and Frequency domain enhancement [2]
. Spatial domain image enhancement mainly based
on pixels. The advantage of spatial based domain technique is that they conceptually simple to understand. But these
techniques generally lacks in providing adequate robustness and imperceptibility requirements. Frequency domain
image enhancement is a term used to describe the analysis of mathematical functions or signals with respect to
frequency and operate directly on the transform coefficients of the image. This technique is used to enhance the
image by manipulating the transform coefficients.
Contrast Enhancement process in digital x-ray
X-ray imaging has been available to dental practitioners in the past few decades and currently this imaging is widely
used. There are already two dental radiography techniques which are often used, i.e. intra-oral and extra-oral. On
intraoral technique, the radiographic film or sensor is placed inside the mouth and the radiographic film or sensor
both are kept out of the mouth, on the other side of the head from the X-ray source, that will produce an extra-oral
radiographic view [3]
. Panoramic radiography is extra oral technique, in which the film is exposed while outside the
patient's mouth. The panoramic image can be visualized the entirety of the maxilla and mandible jaws on the one
image planes. Currently, film based panoramic radiography is widely used on the mostly dental clinic and laboratory
in Indonesia, although the direct digital panoramic radiography has been available. For visual analysis, dental
radiologist placing negative film in front of the viewer. The quality of film-based image has significant limitation
due to chemical processing and the image enhancement of the film-based image cannot be done if required, since the
level of contrast image is only depend on the level of light intensity of viewer. One of solution to allow improve the
quality of contrast image is digitized film-based image to digital image. Digitized film-based image is performed
using flatbed scanner on transmission and reflection mode. Scanners are preferred to digital cameras as they
practically eliminate optical distortion and the reflection from the surface of the radiograph that would otherwise
reduce image quality. However, often digitized film-based image has results undesired brightness and contrast of
image. Therefore, image enhancement was required as it will lead to improvement in the quality of image. [4, 5, 6]
In this paper, the contrast quality of digital image that scanned using transmission and reflection mode is evaluated
based on mean and standard deviation of the image. Furthermore, the quality of digital image is enhancement based
on spatial technique using contrast stretching; histogram equalization (HE), adaptive histogram equalization (AHE),
and contrast limited adaptive histogram equalization (CLAHE). Evaluation of the preference image quality is
performed based on an objective criterion.
A. Contrast Stretching Contrast stretching is a point image enhancement method, that attempts to improve the
contrast in an output image by 'stretching' the range of intensity values it contains to span a desired range of
values.[7]
B. Histogram Equalization Histogram based techniques for image enhancement, are mostly based on equalizing the
histogram of the whole image which increase the dynamic range corresponding to the image[8]
. In other words, the
pixel value of enhanced image depends on global pixel value of the original image. The process of histogram
equalization is attempts to change the histogram through the use of a function b = ƒ(a) into a histogram that is
constant for all brightness values, with equation:
Where P(a) is the probability distribution function. In other words, the quantized possibility function is normalized
from 0 to 2B-1
is the look-up table required for histogram equalization. [9, 10]
C. Adaptive Histogram Equalization (AHE)
Adaptive histogram equalization (AHE) differs from ordinary histogram equalization in the respect that the adaptive
method computes several histograms, each corresponding to a distinct region of the image, and uses them to
rearrange the lightness values of the image. The objective of process is to improve the local contrast of an image.
The process steps on AHE are consists of define local neighbourhood of image pixel in specific section, calculation
and equalization histogram neighbourhood and mapping of pixel value on the centre of neighbourhood based on
equalized local histogram. To avoid discontinue value between the specific region, bilinear interpolation is applied
to estimate pixel value on the region. [11, 12, 13, 14]
D. Contrast Limited Adaptive Histogram Equalization (CLAHE) is an image enhancement method that develops
from AHE method. CLAHE method utilizes a parameter limit value of histogram in order to obtain adequate

International Journal of Latest Trends in Engineering and Technology (IJLTET)
Vol. 4 Issue 2 July 2014 72 ISSN: 2278-621X
brightness and contrast on the enhanced image. The contrast limit is controlled on the histogram equalization
process. The process of histogram distribution is defined based on contrast range of original image. [11, 12, 13, 14, 15]
II. PROPOSED WORK
We have proposed that we can do contrast enhancement by using a new method as in medical images we mostly use
x-ray source to produce the images. The image formation is so obtained by using the concept of back projection.
This meas that source generate the x ray energy and pass through patient body and make the image through sensor.
This leads to have a poor image contrast may be because of poor usage of the available range of possible gray levels.
The images may suffer from overexposure or from underexposure. Some parts having soft tissues, generate high
contrast while other part havig hard tissue generate low contrast. Most of the methods increases the contrast wich is
not suitalble or up to the mark So we need a method that could generate contrast for local means. Local means make
a effect over small changed level of gray values.
Fig. 2. Image Enhancement process using proposed algorithm
STEP-1 Input the Image: Firstly the source image is selected & then the different operations are performed on it.
STEP-2 Calculate Global mean & Global variance: Let M be the Mean of the Image
Global Mean1 = (M/Local mean)
Global Mean2 = (1- Local Mean/Local Mean+1)
STEP-3 Performing neighborhood operations using column wise functions including localization function:
Localization Function = [GlobalMEAN1 GlobalMEAN2 GlobalMEAN1; GlobalMEAN2 -
4/(LOCALMEAN+1)GlobalMEAN2;GlobalMEAN1 GlobalMEAN2 GlobalMEAN1];
STEP-4 Apply Step 3 to the image matrices.
STEP-5 Based on the Local & globalization calculation, find the ranking of the intensity values & make equalization
accordingly
Step- 6 Obtained Enhanced Image
Calculate Global mean & Global variance
Performing neighborhood operations using column wise
functions including localization function
Based on the Local & globalization calculation, find the ranking of the intensity values &
make equalization accordingly
Visualize the image & then save the image
Stop
Input Image

International Journal of Latest Trends in Engineering and Technology (IJLTET)
Vol. 4 Issue 2 July 2014 73 ISSN: 2278-621X
III. EXPERIMENTAL RESULTS
The performance of the proposed technique is calculated using eight sets of images. Three error matrices are used to
compare image compression quality i.e. mean square error(MSE) ,peak signal to noise ratio(PSNR) & normalized
absolute error(NAE).Greater value of PSNR means quality of image is improved . The lower the value of MSE, the
lower the error, normalized absolute error (NAE) is tested on images which indicates absolute error difference
between pixels.
(a) (b) (c) (d) (e) (f)
Example 1. Contrast Enhancement experimental results
(a) Histogram Equalization (b) Adaptive Histogram Equalization (c) Contrast Limited Adaptive Histogram Equalization uniform (d) Contrast
Limited Adaptive Histogram Equalization Expo (e) Contrast Limited Adaptive Histogram Equalization Rayleigh (f) Proposed
(a) (b) (c) (d) (e) (f)
Example 2. Contrast Enhancement experimental results
(a) Histogram Equalization (b) Adaptive Histogram Equalization (c) Contrast Limited Adaptive Histogram Equalization uniform (d) Contrast
Limited Adaptive Histogram Equalization Expo (e) Contrast Limited Adaptive Histogram Equalization Rayleigh (f) Proposed
(a) (b) (c) (d) (e) (f)
Example 3. Contrast Enhancement experimental results (a) Histogram Equalization (b) Adaptive Histogram Equalization (c) Contrast Limited Adaptive Histogram Equalization uniform (d) Contrast
Limited Adaptive Histogram Equalization Expo (e) Contrast Limited Adaptive Histogram Equalization Rayleigh (f) Proposed
(a) (b) (c) (d) (e) (f)
Example 4. Contrast Enhancement experimental results
(a) Histogram Equalization (b) Adaptive Histogram Equalization (c) Contrast Limited Adaptive Histogram Equalization uniform (d) Contrast
Limited Adaptive Histogram Equalization Expo (e) Contrast Limited Adaptive Histogram Equalization Rayleigh (f) Proposed

International Journal of Latest Trends in Engineering and Technology (IJLTET)
Vol. 4 Issue 2 July 2014 74 ISSN: 2278-621X
(a) (b) (c) (d) (e) (f)
Example 5. Contrast Enhancement experimental results
(a) Histogram Equalization (b) Adaptive Histogram Equalization (c) Contrast Limited Adaptive Histogram Equalization uniform (d) Contrast
Limited Adaptive Histogram Equalization Expo (e) Contrast Limited Adaptive Histogram Equalization Rayleigh (f) Proposed
(a) (b) (c) (d) (e) (f)
Example 6. Contrast Enhancement experimental results
((a) Histogram Equalization (b) Adaptive Histogram Equalization (c) Contrast Limited Adaptive Histogram Equalization uniform (d) Contrast
Limited Adaptive Histogram Equalization Expo (e) Contrast Limited Adaptive Histogram Equalization Rayleigh (f) Proposed
(a) (b) (c) (d) (e) (f)
Example 7. Contrast Enhancement experimental results
(a) Histogram Equalization (b) Adaptive Histogram Equalization (c) Contrast Limited Adaptive Histogram Equalization uniform (d) Contrast
Limited Adaptive Histogram Equalization Expo (e) Contrast Limited Adaptive Histogram Equalization Rayleigh (f) Proposed
(a) (b) (c) (d) (e) (f)
Example 8. Contrast Enhancement experimental results
(a) Histogram Equalization (b) Adaptive Histogram Equalization (c) Contrast Limited Adaptive Histogram Equalization uniform (d) Contrast
Limited Adaptive Histogram Equalization Expo (e) Contrast Limited Adaptive Histogram Equalization Rayleigh (f) Proposed

International Journal of Latest Trends in Engineering and Technology (IJLTET)
Vol. 4 Issue 2 July 2014 75 ISSN: 2278-621X
Table 1: Comparing results of different methods from Table 2: Comparing results of different methods from
example 1 example 2
Table 3: Comparing results of different methods from Table 4: Comparing results of different methods from
example3 example 4 Technique PSNR MSE NAE
HE 16.7514 1373.859 0.29029
AHE 16.1526 1576.9509 0.3143
CLAHE
UNIFORM
15.3789 1884.486 0.34472
CLAHE
EXPO
16.2609 1538.1115 0.30774
CLAHE
RAYLEIGH
18.036 1022.0609 0.25063
PROPOSED 18.8313 851.0314 0.19015
Table 5: Comparing results of different methods from Table 6: Comparing results of different methods from
example 5 example 6 Technique PSNR MSE NAE
HE 10.0827 6379.8902 1.2823
AHE 14.1927 2476.353 0.70125
CLAHE
UNIFORM
11.5356 4565.8022 0.96868
CLAHE
EXPO
12.4487 3700.1006 0.85041
CLAHE
RAYLEIGH
12.9939 3263.5143 0.87612
PROPOSED 25.1906 196.7976 0.12649
Table 7: Comparing results of different methods from Table 8: Comparing results of different methods from
example 7 example 8
Technique PSNR MSE NAE
HE 10.082 6380.8727 1.0861
AHE 19.309 762.3931 0.25538
CLAHE
UNIFORM
18.2115 981.5914 0.30868
CLAHE EXPO 19.1798 785.4117 0.27152
CLAHE
RAYLEIGH
18.4863 921.4142 0.3684
PROPOSED 26.7565 137.2241 0.08498
Technique PSNR MSE NAE
HE 18.6734 882.5584 0.24237
AHE 20.6668 557.7013 0.16351
CLAHE
UNIFORM
18.9197 833.8981 0.20193
CLAHE EXPO 18.8166 853.9339 0.20512
CLAHE
RAYLEIGH
20.1374 629.9997 0.17507
PROPOSED 27.4881 115.9509 0.048321
Technique PSNR MSE NAE
HE 19.9256 661.4899 0.21589
AHE 14.8319 2137.4423 0.3528
CLAHE
UNIFORM
12.4405 3707.1086 0.46551
CLAHE
EXPO
12.7773 3430.4469 0.44656
CLAHE
RAYLEIGH
12.8491 3374.2111 0.47363
PROPOSED 22.0088 409.4462 0.11918
Technique PSNR MSE NAE
HE 18.1466 996.3738 0.23185
AHE 16.9337 1317.3674 0.25426
CLAHE
UNIFORM
15.3506 1896.7896 0.31203
CLAHE
EXPO
15.7361 1735.6932 0.29815
CLAHE
RAYLEIGH
17.3456 1198.174 0.24903
PROPOSED 24.8475 212.9735 0.068311
Technique PSNR MSE NAE
HE 9.2417 7743.0006 1.3181
AHE 20.0306 645.6817 0.25395
CLAHE
UNIFORM
19.0255 813.8163 0.30625
CLAHE
EXPO
19.8372 675.081 0.27784
CLAHE
RAYLEIGH
19.0154 815.7254 0.39176
PROPOSED 28.3084 95.9939 0.064135
Technique PSNR MSE NAE
HE 14.1953 2474.8476 0.2677
AHE 17.4491 1169.9515 0.16391
CLAHE
UNIFORM
15.0192 2047.2127 0.2204
CLAHE
EXPO
13.9731 2604.7806 0.25472
CLAHE
RAYLEIGH
14.9393 2085.2197 0.23664
PROPOSED 25.4375 185.9229 0.040584

International Journal of Latest Trends in Engineering and Technology (IJLTET)
Vol. 4 Issue 2 July 2014 76 ISSN: 2278-621X
Fig 3: Bar chart comparing values of PSNR for different methods
Fig 4: Bar chart comparing values of MSE for different methods
Fig 5: Bar chart comparing values of NAE for different methods

International Journal of Latest Trends in Engineering and Technology (IJLTET)
Vol. 4 Issue 2 July 2014 77 ISSN: 2278-621X
IV. CONCLUSION AND FUTURE WORK
It is seen from different techniques of image contrast enhancement that it improves the visible quality of the image.
In medical imaging, contrast in the image plays the better role. Thus to make an image lighter or darker, or to
increase or decrease the contrast of the resulting image for a specific application or set of images, contrast
enhancement purposes better results and has greater visibility over the original image. In future we will make the
Hypothesis filters with our technique and compare the Results with Performance matrices
REFRENCES
[1] Scott T. Acton, Oklahoma State University Dong Wei, The University of Texas at Austin Alan C. Bovik, The University of Texas at Austin
J. Webster (ed.), Wiley Encyclopedia of Electrical and Electronics Engineering Online Copyright © 1999 by John Wiley & Sons, Inc. All
rights reserved. Article Online Posting Date: December 27, 1999
[2] Jinshan Tang Eli Peli, and Scott Acton, “Image Enhancement Using a Contrast Measure in the Compressed Domain”, IEEE Signal
processing Letters , Vol. 10, NO. 10, October 2003
[3] Whaites, Eric dan R.A. Cawson. Essentials of Dental Radiography and Radiology, Churchill Livingstone: Elsevier Science Limited, 2003.
[4] Jose V. Rios et.all, Assessment of Periapical Status: A Comparative Study Using Film-Based Periapical Radiographs and Digital Panoramic
Images, Jurnal Periodontology, Vol. 6, 2010.
[5] Wei-Chun Lin.all, Contrast Enhancement of X-ray Image Based on Singular Value Selection, Optical Engineering Opt. Eng. 49, 047005
(Apr 13, 2010).
[6] Yasuhiro Morimoto, et.al, New Trends and Advances in Oral and Maxillofacial Imaging, Current Medical Imaging Reviews, 2009, 5, 226-
237.
[7] N. R. Moktar, Nor HazlynaHarun and M. Y. Mashor, “Image Enhancement Techniques Using Local, Global, Bright, Dark and Partial
Contrast Stretching For Acute Leukemia Images”, The World Congress on Engineering, Vol. 1, 2009.
[8] Bin Liu, Weiqi Jin, Yan Chen, Chongliang Liu, and Li Li, “Contrast enhancement using Non-overlapped Sub-blocks and Local Histogram
Projection.” IEEE Transactions on Consumer Electronics, Vol. 57, No. 2, May 2011
[9] MENOTTI D, NAJMAN L, FACON J, et al., “Multi-histogram equalization methods for contrast enhancement and brightness preserving”,
Consumer Electronics, IEEE Transactions on, vol. 53(3), 2007, pp. 1186-1194.
[10] KONG N S P, IBRAHIM H, “Color image enhancement using brightness preserving dynamic histogram equalization”, Consumer
Electronics, IEEE Transactions on, vol. 54, No.4, 2008, pp. 1962-1968.
[11] Young, Ian T, Jan J. Gerbrands, Lucas J. van Vliet, Fundamentals of Image Processing, Delft University of Technology.
[12] Garg, Rajesh, Bhawna Mittal, Sheetal Garg, Histogram Equalization Techniques For Image Enhancement, IJECT Vol. 2, Issue 1, March,
2011.
[13] Salem Saleh Al-amri, N.V. Kalyankar, S.D. Khamitkar, Linear and Non- Linear Contrast Enhancement Image, IJCSNS International
Journal of Computer Science and Network Security, VOL.10 No.2, February 2010.
[14] Wang, Xin;Wong, Brian Stephen;Chen, Guan Tui, Spotting Defects More Clearly: Radiographic Image Enhancement, Industrial Heating;
Jan 2006.
[15] YisuZhao Distrib. & Collaborative Virtual Environments Res.Lab.(DISCOVER),Univ.of Ottawa,Ottawa,ON,Canada Georganas, Nicolas D.
; Petriu, E.M., (I2MTC), 2010 IEEE