Embed Size (px)
Citation preview
1
ASSESSMENT OF RADIATION DOSE TO PATIENTS DURING SINGLE
PHOTON EMISSION COMPUTED TOMOGRAPHY (SPECT) 99mTc-SESTAMIBI
MYOCARDIAL PERFUSION IMAGING (MPI) IN NIAMEY- NIGER.
This thesis is presented to the
DEPARTMENT OF MEDICAL PHYSICS
SCHOOL OF NUCLEAR AND ALLIED SCIENCES
UNIVERSITY OF GHANA
BY
ADAMOU SOLI IDRISSA
(10509438)
B.Sc. (University of Niamey, 2009)
IN PARTIAL FULFILLMENT OF THE REQUIREMENTS FOR THE AWARD OF A
MASTER OF PHILOSOPHY
IN
MEDICAL PHYSICS
JULY, 2016
University of Ghana http://ugspace.ug.edu.gh

i
DECLARATION
This thesis is the result of research work undertaken by ADAMOU SOLI IDRISSA
in the Department of Medical Physics, School of Nuclear and Allied Sciences,
University of Ghana, under the supervision of Prof. A. W. K. Kyere, Dr. I. K. Wilson
and Dr. F. Hasford
Sign……………………………………. Date……………………………
Idrissa ADAMOU SOLI
(Student)
Supervisor’s Declaration
We hereby declare that the preparation and presentation of this thesis were supervised
in accordance with guidelines on supervision of thesis laid down by the University of
Ghana
Sign…………………………… Date……………………………
Prof. A. W. K. Kyere
(Principal supervisor)
Sign…………………………… Date……………………………
Dr. I. K. Wilson
(Co-Supervisor)
Sign…………………………… Date……………………………
Dr. F. Hasford
(Co-Supervisor)
University of Ghana http://ugspace.ug.edu.gh
ii
ABSTRACT
Radiation absorbed dose for patients undergoing myocardial perfusion has been
calculated for technetium-99m Hexakis-2-methoxy-2-methylpropyl-isonitrile (99mTc-
Sestamibi) at the Nuclear Medicine Department of Abdou Moumouni University.
Thirty patients were scanned and image quantification was achieved using
MedisoInterViewXP® software. An activity of370 MBq (10 mCi) of 99mTc-Sestamibi
was administered for stress and 1110 MBq (30 mCi) for rest. A 256 x 1024 matrix
size and a speed of 250 mm per minute were used to acquire the whole body image at
10 minutes, 2 hours and 4 hours after injection of 99mTc-Sestamibi for heart, liver and
kidneys quantifications and 10 minutes, 20 minutes and 2 hours for urinary bladder
quantification. The activities of the heart, liver, kidneys and urinary bladder were
determined using the conjugate view method. The uptake of 99mTc-Sestamibi in the
heart, liver and kidneys were respectively 2.17%, 6.53% and 5%, 10 minutes after
injection and were in good agreement with the work of Wacker’s et al of respectively
1.5±0.4%, 5.9±2.9% and 10.6±2.2% 5 minutes after injection.
The cumulative activities for the heart, liver, kidneys and urinary bladder were
respectively30.81MBq/h, 74.98MBq/h, 39.09MBq/h, 136.25MBq/h for the stress and
86.78MBq/h, 244.77MBq/h, 108.76MBq/h and 338.80MBq/h for the rest.
The difference in the absorbed dose values obtained was less than 10% except for
kidneys which was about 15% for both female and male patients. Both methods found
a relatively high absorbed dose per unit of injected activity (mGy/MBq) for urinary
bladder and ovaries as target-organs for female patients.
Also the uncertainties were in the good agreement according to Stabin.
University of Ghana http://ugspace.ug.edu.gh

iii
DEDICATION
To the Almighty God,
Who has brought this research work to a successful end.
To my parents ADAMOU SOLI and SAHIYAMAIGARI for giving birth to me and
supporting me throughout their life, rest in peace
This research work is dedicated
To my mother SAHIYA MAIGARI
To my father ADAMOU SOLI
To my wife Hadizatou AMADOU ALZOUMA
To the Director of Radioisotopes Institute, Dr ALI ADA
To the Chief of Nuclear Medicine Department, Dr Iliassou TAHIROU
To Prof. Ben Mohamed Abdelkrim, Radioisotopes Institute
To the Chief of Nuclear Physics, Dr SOUMANA Salifou, Radioisotopes Institute
To Dr ILLA SALIFOU Illa, Radioisotopes Institute
To all my class mate
University of Ghana http://ugspace.ug.edu.gh

iv
ACKNOWLEDGEMENTS
First and foremost, I will give thanks to Abdou Moumouni University, the
Radioisotopes Institute and Belgium technical cooperation for sponsoring my two
years education. Special thanks go to the Director of the Radioisotopes Institute, Dr
ALI ADA and the Chief of Nuclear Medicine Department, Dr Iliassou TAHIROU for
their encouragement.
I extend my utmost gratitude to Prof A. W. K. Kyere and Dr. I. K. Wilson, for their
understanding, encouragement and personal guidance that have provided a good basis
for this thesis.
Thanks to Prof, J. H. AMUASI, Prof C. SCHANDORF and Prof J. J. FLETCHER, for
their precious lectures and advice.
My special thanks to Dr F. Hasford for his support and contribution for the success of
this work.
Thanks to the personal of Radioisotopes Institute, friends, colleagues and lecturers of
School of Nuclear and Allied Sciences, for their priceless support and encouragement.
Last but not the least, to those who indirectly contributed in this research, your
kindness means a lot to me. Thank you very much.
University of Ghana http://ugspace.ug.edu.gh

v
TABLE OF CONTENTS
DECLARATION ........................................................................................................... I
ABSTRACT .................................................................................................................. II
DEDICATION .............................................................................................................III
ACKNOWLEDGEMENTS ........................................................................................ IV
TABLE OF CONTENTS .............................................................................................. V
LIST OF FIGURES .................................................................................................. VIII
LIST OF TABLES ........................................................................................................ X
LIST OF ABBREVIATIONS AND SYMBOLS ....................................................... XI
CHAPTER ONE: INTRODUCTION ............................................................................1
1.1 BACKGROUND .......................................................................................................1
1.2 STATEMENT OF THE PROBLEM ....................................................................3
1.3 OBJECTIVES ......................................................................................................5
1.4 RELEVANCE AND JUSTIFICATION ...............................................................6
1.5 SCOPE AND LIMITATION ................................................................................6
1.6 ORGANISATION OF THESIS ............................................................................7
CHAPTER TWO: LITERATURE REVIEW ................................................................8
2.1 THE BASICS OF INTERNAL DOSIMETRY ..............................................................9
2.1.1 Radiation dose assessment.........................................................................12
2.1.2 Evolution of Dosimetric Formalisms ..........................................................17
2.1.3 Planar methods for quantification ..............................................................19
2.1.4 Quantification of tomographic data ...........................................................26
2.2 RADIOPHARMACEUTICALS .............................................................................27
2.2.1 Uncertainty of Biokinetic Model of Radiopharmaceuticals ........................27
2.2.2 Radiopharmaceuticals used in diagnostic imaging procedures ...................28
Table 2.1 Standard Myocardial perfusion SPECT patient radiation doses: ..32
2.3. INDICATIONS FOR MYOCARDIAL PERFUSION IMAGING (MPI). ............................32
2.4 IMAGE ACQUISITION .......................................................................................33
Instrumentation .....................................................................................................33
2.4.3 SPECT Imaging ........................................................................................33
University of Ghana http://ugspace.ug.edu.gh

vi
Basic principle ......................................................................................................34
CHAPTER THREE: MATERIALS AND METHOD .................................................37
3.1 EQUIPMENT AND SOFTWARE...........................................................................37
3.1.1 The Mediso gamma camera system ...........................................................37
3.1.2 The InterViewXP®software .......................................................................38
3.1.3 OLINDA software .....................................................................................40
3.2 METHODOLOGY .............................................................................................42
3.2.1 Wholebody scan ........................................................................................42
3.2.2 Data collection ...........................................................................................43
Table 3.1: Biodata and injected activity of 30 patients .................................44
3.2.3 Quantitative assessment .............................................................................46
3.2.4 Conversion of counts into activity .............................................................46
3.2.5 Biokinetic model........................................................................................49
3.2.6 Determination of the residence time ..........................................................51
3.2.7 Dose calculation ........................................................................................53
Table 3.2: Estimated radiation dose to certain organs according to Mirdose3
using 99mTc-Sestamibi ...................................................................................53
3.2.8 Determination of the Uncertainty of Biokinetic models for 99mTc-
Sestamibi ..............................................................................................................54
CHAPTER FOUR: RESULTS AND DISCUSSION ..................................................55
4.1 INTRODUCTION ...............................................................................................55
4.2 RESULTS .........................................................................................................55
4.2.1 Body and organs thickness ........................................................................55
Table 4.1: Average thickness for the body and organs thickness for 10 sized
patient CT scan ..............................................................................................56
4.2.2 Activity of the source- organs ...................................................................56
Table 4.2: Estimated radionuclide activities in organs for patients, ten
minutes post-injection of 10 mCi Tc-99m Sestamibi ...................................58
Table 4.3: Estimated bladder activity after injection of 10 mCi Tc-99m
Sestamibi .......................................................................................................59
Table 4.4: Estimated organs activities for patients, 120 minutes post injection
of 10 mCi Tc-99m Sestamibi ........................................................................60
University of Ghana http://ugspace.ug.edu.gh

vii
Table 4.5: Estimated organs activities for the patients 240 minutes .............61
post-injection of 10 mCi Tc-99m Sestamibi .................................................61
Table 4.6: Estimated organs activities for the patients 10 minutes post
injection of 30 mCi Tc-99m Sestamibi .........................................................63
Table 4.7: Estimated bladder activity after injection of 30 mCi Tc-99m
Sestamibi .......................................................................................................64
Table 4.9: Estimated organs activities for the patients 240 minutes post-
injection of 30 mCi Tc-99m Sestamibi .........................................................67
4.2.3 Cumulative activity estimation ....................................................................69
4.2.4 Residence time of 99mTc-Sestamibi in the heart, liver, kidneys and bladder
during myocardial perfusion imaging (MPI) ........................................................74
Table 4.10: Calculation of residence time of the heart, liver, kidneys and
bladder ...........................................................................................................74
4.2.5 99mTc-Sestamibi Biokinetic model ............................................................75
4.2.6 Absorbed dose in different organs .............................................................76
Table 4.11: Comparison of Absorbed dose per administered activity with
OLINDA and MIRDOSE 3 ...........................................................................76
4.2.7 Estimation of the uncertainties ....................................................................78
5.1 CONCLUSION ..................................................................................................81
5.2 RECOMMENDATIONS ......................................................................................83
REFERENCES ............................................................................................................84
University of Ghana http://ugspace.ug.edu.gh

viii
LIST OF FIGURES
Figure 2.1: Evolution of dosimetric formalism............................................................ 17
Figure 2.3: Energy spectrum for the 140 keV 99m-Tc ................................................ 23
Figure 2.4: Filtered back projection ............................................................................. 35
Figure 2.5: Attenuation correction ............................................................................... 36
Figure 3.1: Mediso gamma camera .............................................................................. 38
Figure 3.2: ROI selection ............................................................................................. 39
Figure 3.3: Thickness measurement ............................................................................ 40
Figure 3.4: OLINDA input form .................................................................................. 41
Figure 3.5: Whole-body scan ....................................................................................... 43
Figure 3.6: Determination of the system calibration factor ......................................... 48
Figure 3.7: Compartmental diagram ............................................................................ 49
Figure 3.8: protocol for estimating residence time ...................................................... 52
Figure 4.1: Radionuclide activities in the heart, liver and kidneys .............................. 68
Figure 4.2: Activity in the bladder ............................................................................... 69
Figure 4.3.Cumulative activity estimation in the heart after injection of 10 mCi of
99mTc-Sestamibi ........................................................................................................... 70
Figure 4.4. Heart cumulative activity estimation after injection of 30 mCi of 99mTc-
Sestamibi ...................................................................................................................... 70
Figure4.5 Liver cumulative activity estimation after injection for 10 mCi of 99mTc-
Sestamibi ...................................................................................................................... 71
Figure4.6 Liver cumulative activity estimation after injection of 30 mCi of 99mTc-
Sestamibi ...................................................................................................................... 71
Figure4.7 Kidneys cumulative activity estimation after injection of 10 mCi of 99mTc-
Sestamibi ...................................................................................................................... 72
University of Ghana http://ugspace.ug.edu.gh

ix
Figure 4.8 Kidneys cumulative activity estimation after injection of 30 mCi of 99mTc-
Sestamibi ...................................................................................................................... 72
Figure 4.9 Bladder cumulative activity estimation after injection of 10 mCi of 99mTc-
Sestamibi ...................................................................................................................... 73
Figure 4.10 Bladder cumulative activity estimation after injection of 30 mCi of 99mTc-
Sestamibi ...................................................................................................................... 73
Figure 4.11: Time activity curve simulation for 99mTc-Sestamibi for blood, liver,
kidney and bladder. ...................................................................................................... 75
Urinary bladder absorbed dose per administered activity for females’ patient is
relatively high and consequently the absorbed dose to the ovaries is also high. ......... 77
Figure 4.13: Absorbed dose per administered activity for male .................................. 77
University of Ghana http://ugspace.ug.edu.gh

x
LIST OF TABLES
Table 2.1 Standard Myocardial perfusion SPECT patient radiation doses: .................32
Table 3.1: Biodata and injected activity of 30 patients ................................................44
Table 3.2: Estimated radiation dose to certain organs according to Mirdose3 using
99mTc-Sestamibi ...........................................................................................................53
Table 4.1: Average thickness for the body and organs thickness for 10 sized patient
CT scan ........................................................................................................................56
Table 4.2: Heart, liver and kidneys activities 10 minutes post-injection of 10 mCi Tc-
99m Sestamibi ..............................................................................................................58
Table 4.3: bladder activity after injection of 10 mCi Tc-99m Sestamibi ...................59
Table 4.4: Heart, liver and kidneys activities for the patients 2 hours post-injection of
10 mCi Tc-99m Sestamibi ...........................................................................................60
Table 4.5: Heart, liver and kidneys activities for the patients 4 hours post-injection of
10 mCi Tc-99m Sestamibi ...........................................................................................61
Table 4.6: Heart, liver and kidneys activities for the patients 10 minutes post-injection
of 30 mCi Tc-99m Sestamibi .......................................................................................63
Table 4.7: Bladder activity after injection of 30 mCi Tc-99m Sestamibi ....................64
Table 4.8: Heart, liver and kidneys activities for the patients 120 minutes post-
injection of 30 mCi Tc-99m Sestamibi ........................................................................65
Table 4.9: Heart, liver and kidneys activities for the patients 240 minutes post-
injection of 30 mCi Tc-99m Sestamibi ........................................................................67
Table 4.10: Calculation of residence time of the Heart, liver, kidneys and Bladder ...74
Table 4.11: Comparison of Absorbed dose per administered activity with OLINDA
and MIRDOSE 3 ..........................................................................................................76
Table 4.12 Estimation of uncertainties of the Heart, liver, kidneys and Bladder ........79
University of Ghana http://ugspace.ug.edu.gh

xi
LIST OF ABBREVIATIONS AND SYMBOLS
3-D Three-Dimensional
à Cumulated activity
CLS Counts within the Lower Scatter windows
Cpp Count recorded within the Photopeak window
CT Computed Tomography
Cts Counts
CUS Counts within the Upper Scatter windows
D Mean absorbed dose,
DF Dose Factor
DICOM Digital Imaging and Communications in Medicine
EANM European Association of Nuclear Medicine
f fraction of administered activity
FOV Field Of View
FS Scaling Factor
Gy Gray
H Dose equivalent
IAEA International Atomic Energy Agency
ICRP International Commission on Radiological Protection
University of Ghana http://ugspace.ug.edu.gh

xii
keV Kilo electron-volt
LEHR Low-Energy High Resolution
MBq Mega Becquerel
mCi Milli Curie
MIRD Medical Internal Radiation Dose
Mo-99 Molybdenum-99
MPI Myocardial Perfusion Imaging
NaI(Tl) Sodium Iodine dope with Thallium
PET Positron Emission Tomography
PMT Photomultiplier tubes
Q Quality factor
QA Quality Assurance
ROI Regions of Interest
S Dose conversion factors
SEE Specific Effective Energy
SPECT Single Photon Emission Computed Tomography
SUVs Standardized Uptake Values
Tb Biological half-life,
Tc-99mSestamibiTechnetium-99m Hexakis-2-methoxy-2-methylpropyl-isonitrile
University of Ghana http://ugspace.ug.edu.gh

xiii
Te Effective half-life,
Tp, Physical half-life,
WR Radiation weighting factor,
University of Ghana http://ugspace.ug.edu.gh

1
CHAPTER ONE: INTRODUCTION
1.1 Background
Nuclear Medicine is the study and utilization of radioactive compounds in
medicine to image and treat human disease. It relies on the tracer principle first
espoused by Georg Karl Von Hevesy, in the early 1920s. The tracer principle is the
study of the fate of compounds in vivo using a small amount of radioactive tracer
which does not have any pharmacological response by the body to the tracer(Nuclear
Medicine Physics:Handbook for teachers and students, IAEA 2014, p8).
These tracers are usually attached to chemical compounds that are attracted to specific
organs bones or tissues, like iodine to the thyroid gland, MIBI or tetrofosmin to the
heart. After being administered to the body, these must be a radionuclide. Special
electronic instruments, such as scintillation or a gamma camera, which display these
emissions into images, can detect these emissions (Helal, 2012).
The strength of nuclear medicine lies in using the tracer method to acquire
information about how an organ is or is not functioning as it should. (Handbook for
teachers and students, AIEA)
Myocardial perfusion imaging (MPI) with single photon emission computed
tomography (SPECT) is a nuclear medicine imaging technique that uses gamma rays
to scan the heart (Hendel et al, 2009).
It`s a well-established, highly standardized test to detect significant coronary artery
disease and to risk-stratify patients with regard to cardiac event-free survival.
University of Ghana http://ugspace.ug.edu.gh

2
Myocardial perfusion single photon emission computed tomography(MPI-SPECT)
has become essential for screening diabetic patient at high risk of silent myocardial
ischemia.
The absorbed dose is a quantity that usually is estimated from the localized uptake
and retention of administered radiopharmaceuticals, the radiation decay data of
radionuclide and simulations of radiation transport in anthropomorphic models.
The absorbed radiation dose from internally deposited radionuclides is a major factor
in assessing risk and therapeutic utility when evaluating new radiopharmaceuticals for
use in nuclear medicine diagnostic or treatment. The measurement of the
biodistribution of radiopharmaceuticals in human subjects to estimate radiation
absorbed dose using the medical internal radiation dose (MIRD) schema.
(MIRDPamphlet Nº16,Siegel et al, 2012)
The calculation of internal dose estimates is performed by summing the radiation
absorbed in various target tissues from a number of source-organs in the body that
contain significant quantities of radioactive material:
D=(Ã /m) ƩΔiφi
Where D= dose in rad
Ã= cumulative activity
m= organ mass in grams
Δi= equilibrium dose constant in g.rad / uci-h
φi= absorbed fraction
University of Ghana http://ugspace.ug.edu.gh

3
To simplify calculations, the MIRD committee formed in the 1960s by the Society of
Nuclear Medicine (SNM), introduced the s values which is the ratio effective
absorbed energies by the organ weights of the standard man.
SAD *~
where D= dose, Ã= cumulative activities and S= Mean absorbed doses.
1.2 STATEMENT OF THE PROBLEM
Clinical applications of nuclear medicine allow functional imaging of normal
and abnormal tissues. Myocardial perfusion imaging is one of the purposes of SPECT
imaging to examine the function of the heart muscle in order to diagnose ischemic
diseases.
Following this principle that in stress situation the uptake of the diseased myocardium
is less than the normal one. After injection of a radionuclide into the blood stream of
the patient, SPECT imaging is performed first in stress situation; if there is an
abnormality in the images, the same procedure will be repeated in rest situation within
several days or within hours depending on the substance and pharmaceutical that are
being used.
In Niger, with 16 million peoples, the prevalence of coronary artery disease was about
3% in2000 and probably higher than this in 2015. Because of this relatively high
prevalence, the SPECT myocardial perfusion imaging becomes the second most
requested scan after the bone scan in the nuclear medicine department of the Radio-
Isotopes Institute of Niamey.
University of Ghana http://ugspace.ug.edu.gh

4
Whenever patients are exposed to ionizing radiation, an estimation of radiation doses
is an essential element to balancing the risk and benefits of the proposed examination.
During a Sestamibi myocardial perfusion, two injections are needed, 10 mCi during
the maximum effort (stress) and 30 mCi for the rest scan.
The role of internal dosimetry in diagnostic nuclear medicine is thus to provide the
basis for stochastic risk assessment. Once this risk is quantified, it may be used to
optimize the amount of administered activity in order to maximize image quality
while minimizing patient risk. This optimization process is important for pediatric
patients owing to their enhanced organ radio sensitivities and years over which any
stochastic effects may become manifest. The optimization should be considered, and
always evaluated for any imaging procedure. (IAEA Report, 2011).
Accurate dosimetry of diagnostic procedures is important for making judgments on
the diagnostic benefits to the patient compared to the associated radiation risks.
Dosimetry of diagnostic radiopharmaceuticals is therefore primarily concerned with
the dosimetry of the total population or group. The absorbed dose from internally
distributed radioactivity used in diagnostic procedures is usually only calculated using
models based on reference individuals and not specific patients. Accurate dosimetry
for representative groups of patients for each specific investigation is needed in order
to optimize use of the various alternative radio diagnostic techniques, and to estimate
the collective radiation exposure and risk from nuclear medicine investigations
(Hickson, 2011).
The current philosophy of radiation protection is based on the assumption that any
radiation dose, no matter how small, may result in human health effects, such as
cancer and hereditary genetic damage. But doses of ionization radiation less than
0.1Gy are critical for risk assessment of the general public, as well as of radiation
University of Ghana http://ugspace.ug.edu.gh

5
workers (Ahasanet al., 2004). Therefore, it is important to do research in the spectrum
of the present work.
1.3 OBJECTIVES
To assess the radiation dose received by the patients undergoing SPECT myocardial
perfusion imaging (MPI) with 99mTc-Sestamibi.
1.3.1. Specific Objectives
- To determine the cumulated activity in the heart, liver, kidneys and urinary
bladder for patients undergoing MPI at various time after injection (
10minutes,2h, and 4 h for heart, liver and kidneys and 10 minutes, 20 minutes and
2 hours for urinary bladder quantifications)
- To determine residence times (τ) of 99mTc-Sestamibiin the heart, liver, kidneys and
urinary bladder;
- To determine the absorbed dose in the source-organs and target-organs of patients
undergoing 99mTc-Sestamibi MPI using the OLINDA software.
University of Ghana http://ugspace.ug.edu.gh

6
1.4 RELEVANCE AND JUSTIFICATION
The results of internal dosimetry can be useful in estimating the amount of activity
that can be administered to the patient and also serve as a way of comparing the risk
to the benefits of these nuclear medical procedures with other modalities of diagnostic
procedures (Alamet al, 2005).
The estimation of radiation dose can help to optimize image quality while using
lowest radiation dose possible.
The performance of any diagnostic test requires a careful assessment of the risk and
benefits of the test and optimization of protocols to minimize risks to patients, staff
members, and the public. Procedures that utilize ionizing radiation should be
performed in accordance with ALARA (As Low As Reasonably Achievable), Howard
et al, 2011.
Absorbed dose from patients or any other radiation source depends on contact time,
distance and intensity of radiation (Helal, 2012).
1.5 SCOPE AND LIMITATION
This study will assess the radiation dose to patients undergoing SPECT myocardial
perfusion imaging at the Radio-Isotopes Institute, Abdou Moumouni University of
Niamey – Niger.
The study will also estimate the cumulative activity10 minutes, 20 minutes, 2 hours,
and 4 hours, after injection for patients undergoing 99mTc-Sestamibi SPECT-MPI.
The data collection will be done in Niamey-Niger at the Radio-Isotopes Institute of
Abdou Mounouni University, and data analysis and data processing will take place in
Accra at the School of Nuclear and Allied Sciences (SNAS).
University of Ghana http://ugspace.ug.edu.gh

7
1.6 ORGANISATION OF THESIS
This thesis is in a chronological order of five chapters. Chapter one is an introduction
to the research and provides an overview of the current state of knowledge relevant to
the study. Chapter two reviews existing literature relevant to the research problem.
Chapter three focuses on the experimental and theoretical framework for the study.
The results obtained are presented and discussed in chapter four. Chapter five
contains the conclusions of the study and recommendations for further research.
University of Ghana http://ugspace.ug.edu.gh

8
CHAPTER TWO: LITERATURE REVIEW
In nuclear medicine applications, scintigraphic studies have been applied to different
organs such as liver, spleen, heart, kidneys, bone, lung, thyroid, lymph glands etc.
(UNSCEAR, 1993).
The procedures are using the administration of a small amount of radiopharmaceutical
into human body in order to image organs. When radiopharmaceutical reaches the
organ, the radiopharmaceutical is accumulated and released in particular ways. The
accumulation of radiopharmaceutical will lead the organs to become radioactive and
then, the others organs closer will received radiation dose internal dose from the
source-organs (Hidayati 2013).
The absorbed dose levels for the critical organs are always high, during therapy.
Although the absorbed dose levels of the critical organs during the nuclear medicine
procedures are lower than those arising from therapy, their evaluation may be also
considered important.
SPECT data from myocardial perfusion imaging (MPI) are normally displayed as a
set of three slices orthogonal to the left ventricular (LV) long axis for both ECG-gated
(GSPECT) and non-gated SPECT studies. The slices normally presented are
horizontal long axis (HLA), vertical long axis (VLA) and short axis (SA)
(N.DARVISH, 2013).
The cardiac scan is one of the most common scans in nuclear medicine. During the
heart scan, among various organs, the kidneys and intestines absorb high amounts of
radiopharmaceutical. Relation to high absorption fraction of Tc Sestamibi receiving
by the bladder duringMPI and genital(ovaries and testes) organs are not yet
University of Ghana http://ugspace.ug.edu.gh

9
established. The ovaries are chosen as the critical organs, because they are the most
radiosensitive organs for the genetic and somatic effects (Cember, 1992).
In order to know the risk and ensure the safety of human organs, it is necessary to
know the amount of radiation dose absorbed by an organ (Alamet.al. 2005).
2.1 The basics of internal dosimetry
The absorbed radiation dose from internally deposited radionuclides is a major factor
in assessing risk and therapeutic utility when evaluating new radiopharmaceuticals for
use in nuclear medicine for diagnosis and/or treatment. Although direct measurements
of absorbed dose and dose distributions in vivo would be preferable, this generally is
not feasible for routine clinical studies. Absorbed dose, therefore, is a quantity that
usually is estimated from the localized uptake and retention of administered
radiopharmaceuticals, the radiation decay data of the radionuclide and simulation of
radiation transport in anthropomorphic models (MIRD Pamphlet No.16). Dose
estimates based on the generalized heart model of the revised MIRD Pamphlet No.5,
are only a first approximation because there is no separation of heart walls from heart
chambers, and it is unlikely that any radionuclide would be uniformly distributed
throughout both walls and chambers.
The mean absorbed dose to an organ from an internally administered
radiopharmaceutical is dependent on the characteristics of both the radionuclide and
the pharmaceutical in terms of the type of radiation emitted and the spatial and
temporal distribution of the radionuclide in the body. Internal dosimetry has been
applied to the determination of tissue doses and related quantities for occupational
exposures in radiation protection, environmental exposures in radiation epidemiology,
University of Ghana http://ugspace.ug.edu.gh

10
and diagnostic and therapeutic exposures in nuclear medicine (Zanzonico, 2000;
Jönsson, 2007).
The mean absorbed dose, D (Gy) can be calculated using the MIRD formalism and
the equation:
D = Ã * S (2.1)
Here, Ã is the cumulated activity (MBq s), expressing the total number of decays
during a particular time interval, and S is the mean absorbed dose to the target organ
per unit cumulated activity in the source organ (Gy MBq-1 s-1).
The S value thus takes into account all physical factors when calculating the energy
absorbed by the target organ, from radiation emitted from the source organ. Practical
applications may, however, introduce several uncertainties.
One such uncertainty is that the calculation of the mean absorbed dose is often based
on the assumption that the radionuclide is uniformly distributed in the source volume.
Also, human dosimetric models are based on an average size and age.
With regard to radiation protection purposes, the administration of
radiopharmaceutical into human body needs to be assessed in order to consider the
risk to the patients and the critical groups such as the family of patients, nurses and
people who have contact with them ( Helal, 2012). Moreover, the assessment might
be useful for other purposes such as evaluation of clinical trials or internal dose
assessment for new radiopharmaceuticals (Stabin et al, 1999).
One of the well-known radiopharmaceuticals for nuclear medicine procedure is
technetium-99m. 99mTc Sestamibi previously has been used for myocardial perfusion
studies ( Joseph et al., 2003), but the application has been extended in scinti
University of Ghana http://ugspace.ug.edu.gh

11
mammography in breast cancer detection (O, 2010) and other sites such as thyroid (
Perez-Monte, et al., 1996), brain tumors (Yokogami et al., 1998), and multiple
myeloma ( Pace, 2005).
For radiation protection purposes in diagnostic applications, human models are
relevant in absorbed dose calculations because the purpose is to estimate the risk of
late stochastic effects on a large population of patients undergoing the same type of
examination. The use of dosimetry factors based on a standardized phantom and
average-based biokinetics is thus justified. The discrepancy between the body
geometry of the patient and that of the dosimetry model and the individual variation in
time-activity biodistribution introduces inaccuracies into the absorbed dose
calculation. However, these are less important when compared with the therapeutic
situation.
When administering high activities for therapeutic purposes the aim is to produce
sufficient deterministic effects on tumour cells but to avoid such effects on normal
tissues. Therefore, the planning of radionuclide therapy is very important to ensure
that the correct activity is administered to achieve the desired effect. The calculation
of organ absorbed doses in patient-specific radionuclide therapy dose planning has to
be as accurate as possible, and hence the errors and uncertainties in the models have
to be reduced. Radionuclides emitting low-energy electrons, a non-uniform activity
distribution within the organ or tissue can give large variations in the absorbed dose to
different cells or areas in the organ ( Jönsson, 2007). Studies have shown that the dose
absorbed by radiolabeled Kupffer cells after 99mTc-sulfur colloid injection was
approximately 15,000 times the mean electron dose to the same cells as estimated
using the conventional MIRD Schema (Robinson, 1997). This illustrates the
importance of developing small-scale anatomy models for more accurate internal
University of Ghana http://ugspace.ug.edu.gh

12
dosimetry. In patient-specific dosimetry, both a patient-specific physical model as
well as patient-specific biokinetic data should be included. If the inhomogeneous
activity distribution within an organ or tissue could also be accounted for, the
accuracy in the absorbed dose calculation would increase (Jönsson, 2007).
2.1.1 Radiation dose assessment
In any use of ionizing radiation, an analysis of the risk and benefits is needed to
justify and optimize the procedures involved. When radiopharmaceuticals are
administered to patients to diagnose and evaluate disease or for therapeutic purposes,
estimates of radiation does to major organs and tissues of the body are required.
Internal dose estimates are performed via calculations and the use of theoretical
models, as it is not possible to make direct measurements of the radiation doses
received. Standardized models of human body and standardized models of
radiopharmaceutical behavior in the body may be used tocharacterize the radiation
doses received by various tissues in the body (Stabin, 2007).
Dose calculations
To estimate absorbed dose in a given organ of the body, one must determine the
amount of energy deposited per unit mass of the organ. This yields the quantity
absorbed dose, when expressed in proper units, and can be extended to calculation of
equivalent and effective dose if desired. A generic equation can be developed to
estimate the absorbed dose rate in an organ by assigning numerical values to all
quantities needed to establish the energy deposited dose rate in the organ. Once the
University of Ghana http://ugspace.ug.edu.gh

13
radionuclideis involved, the energies and abundances of the nuclideare known. When
the cumulative activity is estimated, the absorbed dose within the organ is known:
This quantity is most often called the absorbed fraction.
The clinical use of internal dosimetry in Nuclear Medicine
The clinical uses are:
1- To estimate the absorbed dose received for patients undergoing diagnostic
nuclear medicine procedures;
2- To plan patient treatments by using tracer doses;
3- Treatment optimization in multiple cycles treatments or in combined use of
radionuclide therapy and external radiotherapy;
4- Clinical evaluation of new radiopharceuticals.
Standard dose equations
A generic equation for the absorbed dose rate in an object uniformly contaminated
with radioactivity (for example an organ or tissue with radiopharmaceutical uptake)
may be shown as:
m
E n A k
= Diii
i
~
(2.2)
D = absorbed dose in a target organ (rad or Gy)
à = cumulated activity (sum of all nuclear transitions that occurred) in a
source organ (Ci-hr or MBq-s)
n = number of radiations with energy E emitted per nuclear transition
University of Ghana http://ugspace.ug.edu.gh

14
E = energy per radiation (MeV)
= absorbed fraction (fraction of radiation energy absorbed in the target)
m = mass of target region (g or kg)
k = proportionality constant (rad-g/Ci-hr-MeV or Gy-kg/MBq-sec-MeV)
An example calculation of k is shown here, to obtain dose in rad from activity in Ci,
with mass in g, and energy in MeV:
13.2100
106.13600107.3 64
erg
radg
MeV
ergx
h
s
Cis
disxk
(2.3)
In general, internal dose can be calculated by the following simple equation:
DFND where N is the number of nuclear transitions that occur in source region
S, and DF is a “dose factor”. The factor DF contains the various components shown in
the formulas for S and SEE (Specific Effective Energy) basically it depends on
combining decay data with absorbed fractions(AFs), which are derived generally
using Monte Carlo simulation of radiation transport in models of the body and its
internal structures (organs, tumors, etc.):
m
Enk
DF i
iii
(2.4)
When the components of the various published internal dose calculation schemes are
carefully studied, they can all be reduced to this single generic equation:
SτASAD 0
~
(2.5)
University of Ghana http://ugspace.ug.edu.gh

15
where à is defined as cumulated activity, is the residence time, which is simply
equal to Ã/A0, the cumulated activity divided by the patient’s administered activity
(A0), and S is given by:
m
Enk
S i
iii
(2.6)
Time-activity functions are usually given in the form of one or more exponential
functions. The function may describe only the biological clearance of the agent (and
thus be associated with a biological half-life) or the biological clearance and the
radioactive decay (and thus be associated with an effective half-life). The relationship
between biological half-life, Tb, physical half-life, Tp, and effective half-life, Te, is
given as:
pb
pb
eTT
TTT
(2.7)
For a compound whose clearance may be described by a single exponential term:
TAf1.443 = Af
= dt eAf = dt A(t) = A eo
e
ot-o
00
e
~ (2.8)
Where: f = fraction of administered activity taken up
A0 = activity administered (e.g. Ci)
Te = effective half-life (e.g. h)
à = cumulated activity (e.gCi-h)
If more than one exponential term is needed to describe the clearance, we will simply
have a repetition of this expression, with different values of f and Te for each term.
University of Ghana http://ugspace.ug.edu.gh

16
In the International Commission on Radiological Protection (ICRP) system of
radiation protection for workers (ICRP 1979), the dose equation is: SEEUH S
Here, H is the dose equivalent (the absorbed dose, D multiplied by a radiation
weighting factor wR, formerly known as a quality factor (Q), US is the number of
nuclear transitions that occur in source region S, and SEE is:
m
wEnk
SEE i
Riii i
(2.9)
As written, the equations above give only the dose from one source region to one
target region, but they can be generalized easily to multiple source and target regions.
Since the factor N is analogous to à and US, and the factor DF is analogous to S and
SEE, the MIRD and ICRP systems of dose calculation can be accommodated by the
equation D = N x DF, whose terms are more intuitively understandable by most users.
The MIRD concept of “residence time” (Loevinger, 1988) has often caused
confusion, because of its apparent units of time (even though it really expresses the
number of nuclear transitions that occur in a source region) and because of the use of
this term to represent the “mean life” of atoms in biological or engineering
applications (Stabin, 2007; Islam, 2011).
University of Ghana http://ugspace.ug.edu.gh

17
2.1.2 Evolution of Dosimetric Formalisms
Figure 2.1: Evolution of dosimetric formalism
The current generation of anthropomorphic phantoms began with the development of
the Fisher-Snyder phantom, which employed a combination of geometric shapes -
spheres, cylinders, cones, etc. to create a reasonably accurate representation of the
body.
Monte Carlo computer programs were used to simulate the creation and transport of
photons through these various structures in the body, which’s atomic
compositions and densities were based on data provided by the International
Commission on Radiological Protection (ICRP103) in its widely quoted report on
“Reference Man”, now updated in a more recent report (ICRP103). These reports
provide various anatomical data helpful in producing dose calculations for
standardized individual, (Bolchet al., 1998). Absorbed fractions and dose conversion
factors (S values), as defined above, for over 100 radionuclides and over 20 source
University of Ghana http://ugspace.ug.edu.gh
18
and target regions, were also published (Synder, 1978). Absorbed fractions for
photons at discrete energies were published for these phantoms, which contained
approximately 25 source and target regions. Tables of S values were never published,
but ultimately were made available in the computer software called “MIRDOSE”
(Stabin, 1996), which was widely used by the nuclear medicine community.
Stabin et al. developed a series of phantoms for the adult female, including a model of
the non-pregnant adult female and the woman at three stages of pregnancy. These
phantoms modeled the changes to the uterus, intestines, bladder, and other organs that
occur during pregnancy, and included specific models for the fetus, fetal soft tissue,
fetal skeleton, and placenta. S values for these phantoms were also made available to
the dosimetry community through the MIRDOSE software.
Figure 2.2: S-values phantoms through MIRDOSE software
University of Ghana http://ugspace.ug.edu.gh

19
A number of authors have developed more realistic phantom using image methods to
replace the stylized models of the 1970`s with voxel-based (A) or mathematical
methods like non-uniform rational, (Bolchet al., 2013.).
2.1.3 Planar methods for quantification
In the introduction to MIRD Pamphlet No. 16 (Siegel et al, 1999), the
following is stated:
To determine the activity-time profile of the radioactivity in source regions, four
questions need to be answered.
1. What regions are source regions?
2. How fast does the radioactivity accumulate in these source regions?
3. How long does the activity remain in the source regions?
4. How much activity is in the source regions?
The first question concerns identification of the source regions, whereas the second
and the third questions relate to the appropriate number of measurements to be made
in the source regions, as well as the timing of these measurements. The fourth
question is addressed through quantitative external counting and /or sampling of
tissues and excreta.
Each source region must be identified and its uptake and retention of activity
as a function of time must be determined. This provides the data required to calculate
cumulated activity or residence time in all source regions.
University of Ghana http://ugspace.ug.edu.gh

20
The remainder of the body is the total body minus the source regions and must be
considered as a potential source as well. Mathematical models that describe the
kinetic processes of a particular agent may be used to predict its behavior in regions
where direct measurements are not possible, but where sufficient independent
knowledge about the physiology of the region is available to specify its
interrelationship with the regions or tissues whose uptake and retention can be
measured directly. The statistical foundation of a data acquisition protocol designed
for dosimetry requires an adequate number of data points and careful selection of the
timing of these points. As the number of measurements increases, the confidence in
the fit to the data and in the estimates of unknown parameters in the model is
improved. As a heuristic or general rule of thumb, at least as many data points as the
number of initially unknown variables in the mathematical curve-fitting function(s) or
in the compartmental model applied to the data set, should be obtained. For example,
each exponential term in a multiexponential curve-fitting function requires two data
points to be adequately characterized. On the other hand, if it is known a priori that
the activity retention in a region can be accurately represented by a monoexponential
function, restrictions on sampling times are less stringent as long as enough data
points are obtained to derive the fitted function. Because of problems inherent in the
collection of patient data (e.g., patient motion, loss of specimen, etc), the collection of
data above the necessary minimum is advisable.”
Image Quantification
Nuclear medicine images can be used for either detection tasks, such as identifying
perfusion defects, or quantitative tasks, such as estimating ejection fraction,
standardized uptake values (SUVs) or organ absorbed dose. Obtaining images that are
suitable for quantitative tasks often requires additional processing compared with
University of Ghana http://ugspace.ug.edu.gh

21
those used for visual interpretation. This additional processing often results in
improved resolution and contrast and reduced artefacts. These improvements in the
image will often, but not always, translate directly to improved performance on
detection tasks. For example, the development of attenuation correction methods for
cardiac SPECT has improved detection of myocardial perfusion defects, while at the
same time providing images which are quantitatively more accurate.
For image quantification, data are collected with a nuclear medicine gamma camera.
Quantification of data gathered with these cameras may be achieved in a number of
ways. One method is the use of developed and processed anterior and posterior
projection images of the patient with the conjugate view method. As this is a
projection image, the actual depth of objects containing activity within the patient is
not known. Region of interest (ROIs) are drawn around objects that are recognizable
as internal organs or structures; the number of counts in a ROI, however, cannot be
used directly to calculate how much activity is in the organ. Some corrections are
needed to the observed number of counts to obtain a reliable estimate of activity in
this object. In this method, images are taken in front of and behind the patient, and a
geometric mean of the two values is taken. This geometric mean, when corrected for
attenuation, is theoretically independent of depth for most radionuclides of interest,
and thus this quantity is thought to be the most reliable for use in quantification.
Corrections for the presence of scattered radiations within the photopeak channel can
be addressed by using an appropriate scatter correction technique (Stabin, 2010). In
this method, the source activity Aj is given by the expression 2.10 (JM Pereira et al,
2010):
C
f
e
IIA i
t
PAj
e (2.10)
University of Ghana http://ugspace.ug.edu.gh

22
)2/sinh(
)2/(
jj
jj
jt
tf
(2.11)
where IA and IP are the observed counts in the anterior and posterior projections
(counts/time), t is the overall patient thickness, μe is the effective linear attenuation
coefficient, C is system calibration factor C (count rate per unit activity), and the
factor f (equation 2.11) represents a correction for the source region attenuation
coefficient (μj) and source thickness (tj) (i.e., source self-attenuation correction). This
expression assumes that the views are perfectly collimated (i.e. they are oriented
towards each other without offset) under the model of narrow beam geometry without
significant scattered radiation effects. Corrections for scatter are usually necessary,
and a number of methods have been proposed (Siegel et al, 1999, Jönsson, 2007;
Stabin, 2008; Gahrouei, 2012).
Corrections for Scattered Radiation
Scattering of the gamma-rays in the patient not only creates widening of the measured
140 keV energy spectrum. Apart from scattering in the body, scatter can also occur in
the collimator and detector system. Both types of scatter cause deterioration of image
resolution. Scatter correction can be solved by using either multiple energy windows
on the measured 99mTc spectrum to determine the scatter component in the signal
empirically (Bucerius et al., 2012).
University of Ghana http://ugspace.ug.edu.gh

23
Figure 2.3: Energy spectrum for the 140 keV 99m-Tc
One relatively straightforward correction procedure for scatter compensation involves
establishing adjacent windows on either side of the photopeak window, with the area
of the two similar adjacent windows equal to that of the photopeak. The corrected
(true) photopeak counts CT are given by the expression:
)(* USLSSppT CCFCC
(2.12)
Where Cpp is the total count recorded within the photopeak window, while CLS and
CUS are the counts within the lower and upper scatter windows, respectively. If the
areas of the scatter windows are not equal (in sum) to that of the photopeak window,
then an appropriate scaling factor (FS) should be applied. Subtraction of the adjacent
windows is assumed to compensate for the high-energy photon scatter tail upon which
the true photopeak events are superimposed. Even if the areas of the scatter windows
are equal to that of the photopeak window, use of a scaling factor other than unity
may provide the best correction for scatter in a given system with a particular
University of Ghana http://ugspace.ug.edu.gh

24
radionuclide. This may be determined by the study of a known volume source in a
water phantom whose dimensions are similar to that of a human subject (Stabin, 2007,
2008). Other corrections are often required as well.
Corrections for Background Activity
Background correction in planar images, was performed as:
C= CROI SOURCE – CROI Background X Ssource(2.13)
Where C gives the corrected counts in the region of interest in the source area, CROI
Source is the number of the counts in the source region of interest, CROI background is the
mean value of the counts/ pixel in a background region drawn close to the source and
Ssource is the source area in pixels. The subtraction was performed for each projection,
Ia and Ip, before application of equation 2.10. Equation 2.10 was used to estimate the
activity in a drawn ROI, performing attenuation correction on the whole ROI. On
some images background ROIs were also drawn far from the source area, to evaluate
the effect of variability in the placement of background ROIs.
For SPECT images, background subtraction was performed using equation 2.13 as
well. It was done to compensate the contribution of spurious numerical values that
appear in all regions of the images after reconstruction and to compensate for
background spill-in from the surround neighboring into the source area ( Zingerman et
al.2009).
Other study presented a method that takes into account the thickness of the organ and
the background volumes above and below the organ, and the method also includes
effects of different attenuation coefficients in different layers in the region of interest.
University of Ghana http://ugspace.ug.edu.gh
25
A simplified method was proposed by Buijs et al, 1998, in which only the organ
thickness, l, and body thickness, L, are required. Here, the fraction of the total
background activity, F, is calculated using equation 2.14:
)/(1 LlF (2.14)
The method proposed by Buijs et al. is accurate but is more sensitive to low organ-to-
background activity concentration ratios (Jönsson, 2007; Stabin, 2007, 2008).
Correction for Overlapping Organs and Regions
It is not uncommon for some organs or tumors to have overlapping regions on
projection images. The right kidney and liver are frequently partially superimposed on
such images, as are the left kidney and spleen, for example. When organ overlap
occurs, an estimate of the total activity within a source can be obtained by a number
of approximate methods. For paired organs, such as kidneys and lungs, one approach
is to simply quantify the activity in one of the organs for which there is no overlap
with other organs, and multiply the number of counts in this organ by two to obtain
the total counts in both organs. Another approach is to draw a ROI over the organ
region in scans where there is overlap, count the number of pixels and note the
average count rate per pixel, then use a ROI from another image in which there is no
apparent overlap and the whole organ is clearly visible; count the number of pixels in
a larger ROI drawn on this image, and then multiply the count rate per pixel from the
first image by the number of pixels in the second image. Or, equivalently, take the
total number of counts in the first image and multiply by the ratio of the number of
pixels in the second to the first image ROIs. If a significant overlap of images with
University of Ghana http://ugspace.ug.edu.gh

26
another organ is not possible, an approximate ROI may need to be drawn just from the
knowledge of the typical shapes of such organs. This kind of approximation is
obviously not ideal, but may be necessary.
In addition, calibration coefficients for each radionuclide and gamma
camera/collimator combination must be obtained by imaging a small source of known
activity for a fixed amount of time. The attenuation characteristics of the camera may
be studied by imaging this source with various known thicknesses of tissue equivalent
material interposed between the source and camera, and fitting the results (counts
versus thickness) to an exponential function (Jönsson, 2007; Stabin, 2007; Siegel et
al, 1999).
2.1.4 Quantification of tomographic data
Tomographic imaging offers the potential for improved dosimetric accuracy due to its
increased contrast when compared with planar imaging.
Tomographic data are particularly useful for dosimetry where there is suspected
heterogeneous uptake of activity in the source organ or underlying or overlying
background activity. To date, Positron Emission Tomography (PET) data have been
little used for dosimetry, although PET quantification is an active area of research in
its own right. Standardized uptake values (SUVs) are used to quantify radiotracer
uptake and, whilst prone to some uncertainty, are nevertheless used clinically with
more regularity than quantification of SPECT or planar data. SUVs are defined as
ight patient weactivity/ tracer injected
in tissueion concentratactivity tracer SUV
(2.15)
University of Ghana http://ugspace.ug.edu.gh

27
Quantification of image data has been considered for many years, although as yet
there are no standardized methods for quantifying SPECT or PET data. This remains
the largest single obstacle to accurate dosimetry, and is currently a strong focus of
research. It is probable that this task will be made easier with the advent of dual
modality scanners and it is hoped that in time manufacturers will develop systems that
are adapted to high energy high activity imaging, whereby camera sensitivity may be
sacrificed to some extent in favour of spatial and energy resolution (Stabin, 2007;
Siegel et al, 1999).
2.2 Radiopharmaceuticals
A radiopharmaceutical is a radioactive compound used for the diagnosis and/or
treatment of diseases. Most radiopharmaceuticals are for diagnostic purposes, only
about 5% are used for therapy. Because most radiopharmaceuticals are administered
by intravenous administration, they should be sterile and non-pyrogenic.
2.2.1 Uncertainty of Biokinetic Model of Radiopharmaceuticals
Uncertainty analysis is the computation of the total uncertainty induced in the output
by quantified uncertainty in the inputs and models, and the attributes of the relative
importance of the input uncertainties in terms of their contributions, whereas
sensitivity analysis is the computations of the effect of changes in input values or
assumptions, including boundaries and model functional form, on the inputs. The
following five steps were including in the analysis:
University of Ghana http://ugspace.ug.edu.gh

28
1- Uncertainty of input: The source of uncertainty of model parameters were
carefully analyzed and evaluated;
2- Sampling: Sampling techniques are needed to generate samples of the model
inputs parameters( variables);
3- Modelling: To predict the kinetics and retentions of radiopharmaceutical in
humans, biokinetics modelling is required;
4- Uncertainty of output: Model predictions for different organs and tissues at
different time periods resulted in huge amounts of data;
5- Sensitivity of parameters: in order to identify the most influential parameter in
the model, the concepts of the standardized rank regression coefficient (
SRRC) and the partial rank correlation coefficient ( PRCC) were used. The
SRRC can be computed by constructing regression models, which
approximate the rank transformations of the sampled model input and output
variables. The PRCC measures the rank correlation between one defined
output variable with an input variable, under the condition that the indirect
influence on this defined output variable due to other further input variables in
somehow eliminated, (Li et al, 2010).
2.2.2 Radiopharmaceuticals used in diagnostic imaging procedures
Scintigraphic imaging procedures produce images that represent the distribution of a
radiopharmaceutical within a patient or phantom. A radiopharmaceutical consists of
two components. The first component is a photon emitting radionuclide and the
second is the pharmaceutical compound. The photons emitted from the radionuclide
University of Ghana http://ugspace.ug.edu.gh

29
are used for imaging while the pharmaceutical compound dictates the distribution
within a patient.
Several factors must be taken into consideration when selecting a radionuclide to be
used in nuclear medicine imaging. Among these factors are the type of radiation the
radionuclide emits, the energy of the emitted radiation, the radionuclide’s half-life,
and its ability to form a stable bond with the pharmaceutical compound.
First, the type of radiation must be photon radiation. Alpha and beta radiation are
particles, which deposit their energy locally and as a result, have a short range in
tissue.
This type of radiation significantly contributes to the dose received by the patient and
not to the formation of an image. In contrast, photons with appropriate energies may
pass through several centimeters of human tissue before being absorbed. This
increases the number of photons emitted that reach a detector, and reduces the
radiation dose to the patients.
Second, the energy of the radiation is important consideration as there is a limited
range of energies able to be detected reliably by current imaging equipment. The
energies of diagnostically useful photons lie in the range of 70 to 200 keV. Photon
radiation with energy lower than 70 keV will generally not escapefrom the patient and
therefore contribute to the dose. Photons with energies higher than 200 keV can
penetrate the septa of the collimator to produce artifacts in the image, or pass through
the NaI(Tl) crystal without interacting and detrimentally affect the counting statistics.
Medium and high-energy collimators can overcome these problems but these suffer
from reduced spatial resolution and sensitivity compared to low energy collimators
(Gurk, 2007).
University of Ghana http://ugspace.ug.edu.gh

30
Third, the half-life of the radionuclide must be considered. There are two components
of half –life, physical and biological. The physical half-life is unique to the
radionuclide and determines how the activity changes with time. The biological half-
life is based on how long the radiopharmaceutical will be present in the organ of
interest. This is described by the uptake and clearance rate of each organ and is
dependent on the organs function. This is also known as the kinetics of the
radiopharmaceutical. Together, the physical and biological half-lives determine how
long the radiopharmaceutical is present in the body and thus how much dose the
patient receives. As such, the radionuclide should be chosen with a physical half-life
that ensures enough activity is present at the time of a scan to form an image, but
which also decays away expeditiously to ensure the radiation does not significantly
contribute to patient dose after the imaging procedure is completed.
The final consideration in radionuclide selection is that it should form a strong bond
with its pharmaceutical compound. This ensures the photon emitting radionuclide is
distributed to and within the intended organ or organs under investigation. A nuclear
medicine imaging procedure becomes worthless if the radionuclide and
pharmaceutical have separated at the time of imaging.
Several different radiopharmaceuticals have been used in recent years for cardiac
imaging in nuclear medicine and the dosimetry of these agents may be quite different.
The dosimetry of radiopharmaceuticals currently used in nuclear cardiology is
reviewed, and uncertainties in the dose are discussed. Relative radiation risks for
these radiopharmaceuticals also are discussed.
Various radiopharmaceuticals are used for SPECT myocardial perfusion and their
respective radiation risks are below.
University of Ghana http://ugspace.ug.edu.gh

31
201Tl-Chloride (half-life= 72.9 h), administered as an intravenous bolus injection, has
been used for several decades to image the myocardium. The uptake of 201Tl-chloride
by organs such as the liver, kidneys, heart and intestines varied widely.
99mTc-MIBI (Methoxy isobutyl isonitile), (99mTc half-life = 6.02 h), known also as
Sestamibi, is a cationic compound used in studies of cardiac ventricular function and
myocardial perfusion. The clearance from blood is rapid; uptake is high in the muscle,
liver and kidney and is lower in the thyroid and salivary glands.
99mTc-Tetrofosmin is a lipophilic technetium phosphine dioxo cation (trade name
Myoview) is used study myocardial perfusion. It is cleared rapidly from blood and
shows marked uptake in the liver, muscle, heart wall, kidneys and salivary glands.
99mTc-labeled Red Blood Cells (RBCs) circulate in the bloodstream and are useful in
the evaluation of cardiac function. They are cleared from the body with biologic half-
times of 40-80 h, and some urinary activity is detectable.
Technetium 99m characteristics
The Tc-99m radionuclide emits 140.5 keV photons. These photons are attenuated
50% in a thickness of 4.6 cm of human tissue and are therefore able to escape the
patient and be detected. Second, the physical half-life of Tc-99m is 6.02 hours. This
ensures that patient dose is kept to a reasonable level. The method of producing Tc-
99m is also straightforward. The Mo-99 nucleus undergoes β- decay:
eTcMo m9999
Mo-99m generators or ‘cows’ are usually delivered to a hospital at the beginning of a
week. Staff then ‘milks’ the generator by washing the internal column with saline to
produce the sodium pertechnetate complex (Na99mTcO4). This technetium ion is then
University of Ghana http://ugspace.ug.edu.gh

32
attached to a pharmaceutical appropriate to the organ of interest. For these reasons,
Tc-99m is used in 85-90% of all nuclear medicine scans, (Gurk, 2007).
Table 2.1 Standard Myocardial perfusion SPECT patient radiation doses:
Study Injected activity Effective dose estimâtes
1-day rest/stress 99mTc-
Sestamibi
10 mCi for rest
30 mCi for stress
11.4 mSv
2-days stress / rest or rest /stress
99mTc-Sestamibi
25 mCi stress
25 mCi rest
14.8 mSv
Stress-only 99mTc-Sestamibi 25 mCi stress 6.8 mSv
(Gordon et al, 2012)
2.3. Indications for Myocardial perfusion Imaging (MPI).
Myocardial Perfusion Imaging is a nuclear medicine technique to examine the heart
muscle(N.DARVISH, 2013). The test is used to:
• Diagnose coronary artery disease (CAD) and various cardiac abnormalities such as
myocardial infarction and atheromatous plaques.
• Identify how critical is the stage of CAD and locates the coronary stenosis in
patients.
University of Ghana http://ugspace.ug.edu.gh

33
• Prognosticate or define the degree of risk in patients who are at risk of having CAD
e.g. myocardial infarction abnormalities.
• Check if the patient is in good condition after bypass graft and angioplasty.
2.4 Image acquisition
Instrumentation
A single or double headed gamma camera equipped with a low-energy, high-
resolution collimator is used for myocardial perfusion technetium-99m based. A 15%
energy window: (±5%), centered over the 140-keV photopeak of technetium-99m
should be set.
The acquisition parameters
- Low energy High Resolution (LEHR);
- Acquisition matrix: 128 × 128;
- 1.43 zoom;
- 32 images acquired 30 seconds each;
- Rotation mode of the head of the gamma camera: non-circular 180 °
(Starting from -45 to 135 °).
- First acquisition, post stress is made 30 to 40 minutes after injection of the
radiotracer.
- Second acquisition at rest is done 3-4 hours after the first if using one day
protocol (only in patients with abnormal or suspicious acquisition post stress).
2.4.3 SPECT Imaging
University of Ghana http://ugspace.ug.edu.gh
34
Basic principle
SPECT Imaging is a technique that uses a gamma camera to trace gamma rays;
gamma emitting radioisotope (radionuclide) is injected intravenously into the patient.
The chemical process that allows the marking is as follows(Darvish, 2013);
⇨the radioisotope is attached to a specific ligand to obtain a radioligand
⇨Radioligand that bind to certain types of tissues
⇨The combination of ligand and the radioisotope are carried and bound to the place
of interest in the body
⇨Thus the place is marked and can be seen due to the gamma emission of isotope.
Image reconstruction
Image reconstruction for SPECT can be done either by filtered back-projection or by
iterative methods. Filtered back-projection for SPECT is identical to the one
performed in CT which is used for acquiring view set for slices and reconstructing the
corresponding image. Every sample in the views is the sum of the image values
passed by the rays (Smith, 1997).
In mathematical aspect, image reconstruction from a series of projections can be done
by using inverse Radon transform.
Filtered Back-projection Techniques
The signal is produced along parallel X-rays. Hence the data can be filtered and back
projected to obtain the image.
University of Ghana http://ugspace.ug.edu.gh
35
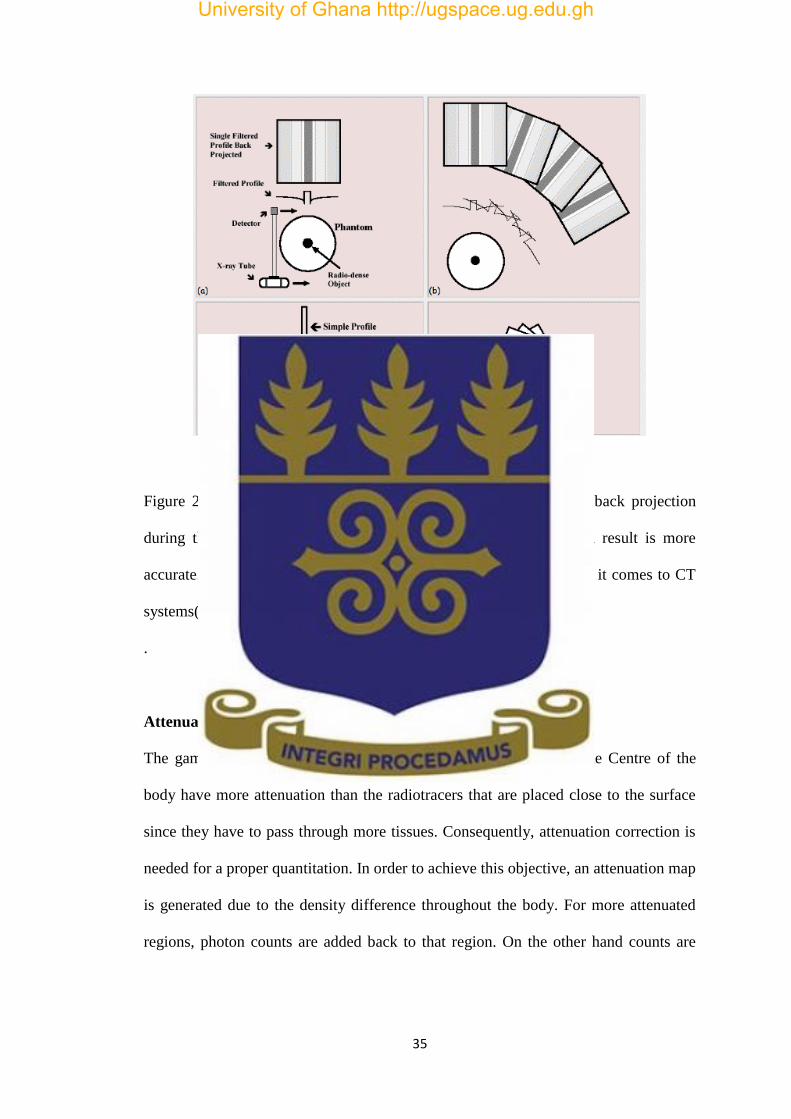
Figure 2.4: Filtered back projection: The views are filtered before back projection
during the reconstruction of image. In mathematical basis, the end result is more
accurate. This algorithm is the most commonly used algorithm when it comes to CT
systems(Darvish, 2013).
.
Attenuation correction
The gamma rays coming from the radiotracers that are placed in the Centre of the
body have more attenuation than the radiotracers that are placed close to the surface
since they have to pass through more tissues. Consequently, attenuation correction is
needed for a proper quantitation. In order to achieve this objective, an attenuation map
is generated due to the density difference throughout the body. For more attenuated
regions, photon counts are added back to that region. On the other hand counts are
University of Ghana http://ugspace.ug.edu.gh

36
subtracted from less attenuated regions to obtain a properly defined data. (DARVISH,
2013).
Figure 2.5: Attenuation correction
a) Uncorrected SPECT image of a material consisting of uniform radioactivity. The
dark area is due to attenuation as the gamma rays pass through the material. b)
Correction factor map with low scaling factor near the surface and high scaling factor
at the Centre c) Initial image is multiplied by the attenuation factors and the uniform
distribution is obtained more accurately.
University of Ghana http://ugspace.ug.edu.gh

37
CHAPTER THREE: MATERIALS AND METHOD
This chapter presents the materials used to performthis research work and the method
used toarrive at the results. The materials include the equipment and software used for
the study.
3.1 Equipment and software
The equipment used to perform myocardial perfusion imaging for this study is the
Mediso gamma cameradouble heads. The system is connected to a computer which
displays acquired images using InterViewXP® software. The InterViewXP®
softwareenables thedrawing ofthe regions of interest (ROIs) to demarcate organs
being studied. The thicknesses of the organs in anterior and posterior positions were
measured by scanning patient with a CT systemHitachi supra 16 slices. Dose
calculations were performed with MATLAB and OLINDAsoftware. The conjugate
view method was used to estimate the average activity in the organsat different times
by using the Microsoft Excel 2010.
3.1.1 The Mediso gamma camera system
The Mediso gammacameraof the Nuclear Medicine department, Radioisotopes
Institutein Niger was used to perform 99mTc-Sestamibi whole-body scans in this study.
The gamma camera contains 59 photomultiplier-tubes (PMT) characterized by
improved energy resolution, shielding and long-term stability. The thallium-doped
sodium iodide crystal size is 585mm×470mm with 9.5mm thickness. The proper
positioning of the gantry, patient bed and table highly impacts image quality. Access
University of Ghana http://ugspace.ug.edu.gh

38
to the standard gantry controls is provided on the acquisition screen andthe user can
easily adjust the positioning of the gantry and patient prior to imaging.
Figure 3.1: Mediso gamma camera
3.1.2 The InterViewXP®software
The InterViewXP® application is designed so that many of the display (display tools
toolbar, color bar, cine, and curve tools) and processing features (filter tool and ROI
tool) are common to all activities that are needed to display raw and processed data. In
this work, the ROI tool was used to get the counts of activity of different organs such
as heart, liver, kidneys and bladder.
Detectors
Panel display
Gantry
Patient
bed
University of Ghana http://ugspace.ug.edu.gh

39
Drawing of regions of interest (ROI)
Region of interest
ROI selection
“Heart” ROI is needed for“RBF/CO%”, “Patlak” and “Deconvolution”
calculations.Mostgamma camera images do not visualize the heart, so heart
ROI is drawn on the aorta.Liver ROI is needed for deconvolution. Liver ROI
is needed to sign a representative territory of liver, because most of images do
not contains the full liver. Kidney ROIs are needed for relative kidney and
relative patlak calculations and bladder ROI is needed for reflux and bladder
curve calculation.
Figure 3.2: ROI selection
Measurement of organs thicknesses with the Hitachi Supra CT
Body and organs thicknesses weremeasured from the CT imageswith Radiant Dicom
Viewer software at the Diagnostic RadiologyDepartmentof LamordeHospital in
University of Ghana http://ugspace.ug.edu.gh
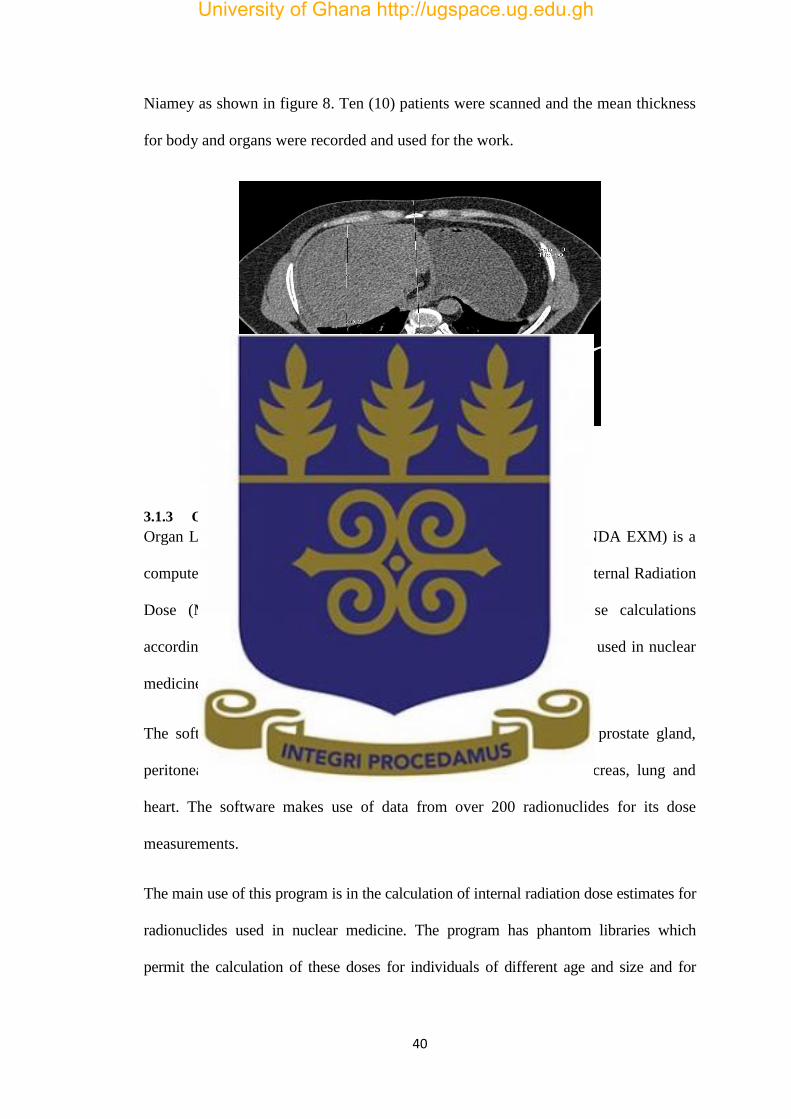
40
Niamey as shown in figure 8. Ten (10) patients were scanned and the mean thickness
for body and organs were recorded and used for the work.
Figure 3.3: Thickness measurement
3.1.3 OLINDA software
Organ Level Internal Dose Assessment Exponential Modeling (OLINDA EXM) is a
computer code meant to provide a functionsimilar tothat ofMedical Internal Radiation
Dose (MIRDOSE) code. The MIRDOSE performs internal dose calculations
according to the MIRD technique for many radionuclides commonly used in nuclear
medicine.
The software is used to assess doses to variety of organs such as prostate gland,
peritoneal cavity, head/brain, multipart kidney, liver, stomach, pancreas, lung and
heart. The software makes use of data from over 200 radionuclides for its dose
measurements.
The main use of this program is in the calculation of internal radiation dose estimates for
radionuclides used in nuclear medicine. The program has phantom libraries which
permit the calculation of these doses for individuals of different age and size and for
University of Ghana http://ugspace.ug.edu.gh
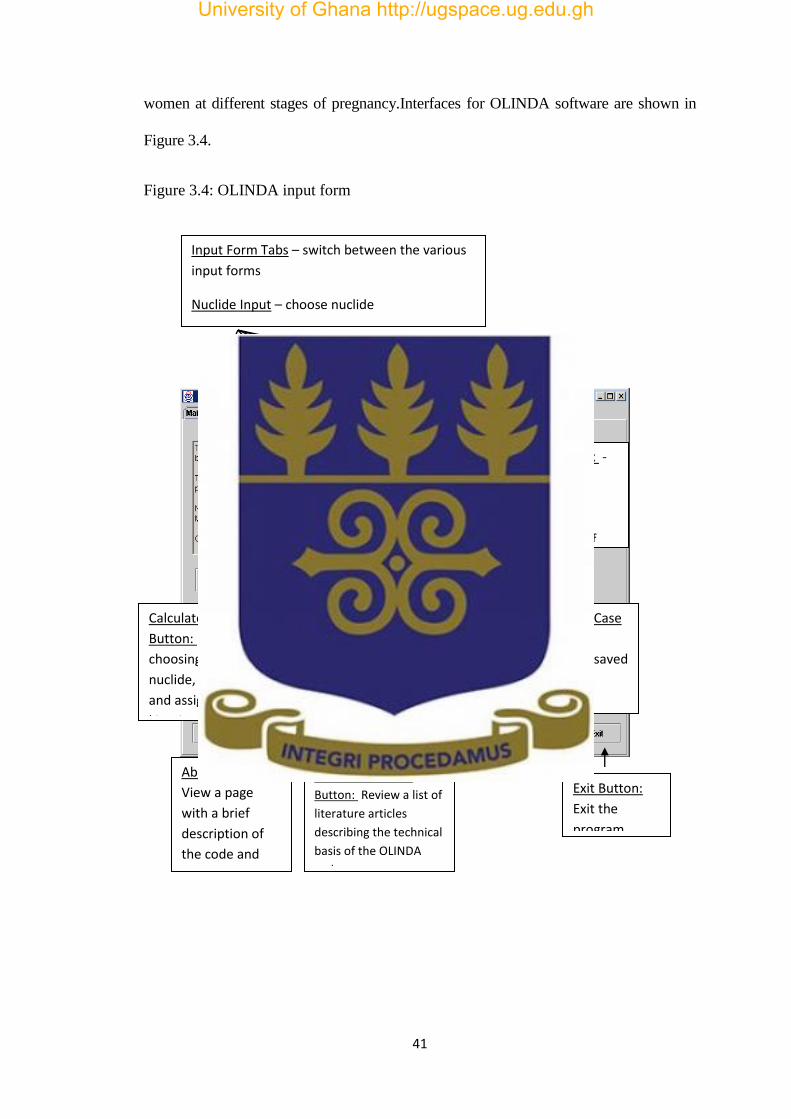
41
women at different stages of pregnancy.Interfaces for OLINDA software are shown in
Figure 3.4.
Figure 3.4: OLINDA input form
Input Form Tabs – switch between the various
input forms
Nuclide Input – choose nuclide
Models Input – choose model(s)
Kinetics Input – Assign kinetic parameters to
source organs
Help Form – get help on functions
Main Info Box -
gives general
instructions,
tracks your
assignment of
nuclides and
models
Calculate Doses
Button: After
choosing the
nuclide, model(s)
and assigning
kinetics, push this
to obtain dose
estimates.
DFs Button: After
choosing the
nuclide, model(s),
push this to obtain
dose conversion
factor tables.
Save Case
Button: At
any time, you
can save a set
of input data
for later
modification
or reuse.
Retrieve Case
Button:
Retrieve saved
cases.
About Button:
View a page
with a brief
description of
the code and
the origin of the
name.
OLINDA Literature
Button: Review a list of
literature articles
describing the technical
basis of the OLINDA
code.
Exit Button:
Exit the
program.
University of Ghana http://ugspace.ug.edu.gh

42
3.2 Methodology
3.2.1 Wholebody scan
The Nuclear Medicine Department of the RadioisotopesInstitute (RII) of Niamey uses
Tc-99m Sestamibi to perform Myocardial Perfusion Imaging (MPI). Tc-99m
Sestamibi is prepared in the hot laboratory of the departmentaccording to the
manufacturer’s instructions and administered byintravenous injection to the patient at
the maximum predicted heart rate during the stress stage for the procedure. Before
performing the imaging, theMediso gamma camera systemequipped with a Low
Energy High Resolutioncollimatorsareused to acquire the anterior and posterior planar
whole-body images of the patient at ten (10)minutes after administration of the
radiopharmaceutical and then two (2) hours and four (4) hours after performing the
imaging. For bladder dose assessment, static acquisition is performed after 10
minutes, 20 minutes and 2 hours after the injection.
The Administered activities for patients in this study were 10 mCi for the stressand 30
mCi for the rest examinations.
The Matrix size was256 x 1024 for wholebody scan and 256 x 256 for static
acquisition at the speedof 25 cm per minute.
Wholebody scans of patients undergoing SPECT MPI with 10 mCi99mTc-Sestamibi
during the stress are shown in figure 3.5
University of Ghana http://ugspace.ug.edu.gh

43
Figure 3.5: Whole-body scanof a patientafter injection of 10 mCi, 99mTc-Sestamibi 10
min, 2 h and 4 hours (left to right)
3.2.2 Data collection
This study was conducted on 30 adult patients with an average age of 47.6. Whole-
body scans of 23 patients wereacquired at 10 minutes, 2 hours and 4 hours on the
Mediso Gamma Camera system. The system was again usedto scan 7 patients for
bladder static acquisition after 10 minutes, 20 minutes and 2 hours in order to assess
the dose to the testes and ovaries.Scans of 10average sized patients were performed
for determination of body and organs thicknesses.
University of Ghana http://ugspace.ug.edu.gh

44
Due to ethical reasons, patient names were encoded with ID numbers, with their
names hidden. Table 3.1 shows data on the patients sampled for this study.
Table 3.1: Biodata and injected activity of 30 patients
Patient
ID
AGE
(years) GENDER
Weight
(kg)
Height
( Cm)
BMI
1 45 M
76
168 26.95
2 48 F 77 155 32.08
3 38 M 77 183 22.98
4 55 F 97 173 32.44
5 51 M 77 169 27.01
6 50 M 93 170 32.17
7 57 M 94 174 31.12
8 44 F 86 165 31.61
9 30 F 91 171 31.16
10 53 M 79 184 23.33
11 23 M 55 156 22.60
12 48 M 74 178 23.35
13 38 F 106 166 38.46
14 25 M 98 179 30.58
15 60 M 88 168 31.17
University of Ghana http://ugspace.ug.edu.gh

45
16 43 M 75 175 24.48
17 47 F 57 156 23.42
18 50 F 61 157 24.74
19 60 M 76 184 22.44
20 51 M 78 177 24.84
21 49 F 79 164 29.37
22 32 M 79 168 27.99
23 57 M 81 181 24.72
24 60 F 53 155 22.06
25 60 F 91 175 29.71
26 48 F 83 158 33.24
27 51 F 80 160 31.25
28 52 F 124 170 42.90
29 60 F 58 162 22.10
30 43 F 75 168 22.57
Mean 47.6 15/15 80.6±15.8 169.5±8.87 27.99±5.28
The average of the patient’s weight is 80.6 ±15.8 kg, the average height is 169 ±8.87 cm and
the body mass index is 27.99± 5.28. The average age is 47.6 with the maximum age at 60 and
the minimum at 23 years in 15 men and 15 women.
University of Ghana http://ugspace.ug.edu.gh

46
3.2.3 Quantitative assessment
Regions of interest were drawn for the heart, liver and bladder on each patient using
the ROI statics tools of the Interview®software. Table A1 (in the appendix) shows the
selected regions of interest and their respective geometric mean counts (GMCs).
The respective counts of activity for all ROIs were recorded. Geometric mean counts
(GMC) of activity for selected ROIs were calculated using anterior and posterior
counts. GMC for each selected organ were calculated using Microsoft Excel 2010.
(3.1)
Standard Deviation was performed using equation (3.2).
(3.2)
Where is the mean of values.
3.2.4 Conversion of counts into activity
In this study, the counts obtained for each patient were converted into activity using
conjugate view method. The activities were estimated using equation (3.3).
(3.3)
In this equation, A is the organs activity in mCi, CA and CP are the anterior and
posterior view background corrected counts respectively, t is the body anterior–
posterior thickness across each organ. Also µe is the effective linear attenuation
coefficient of Tc-99m in soft tissue, f is equal to and represents
CountsMean Posterior CountsMean Anterior GMC
N
xxSD
2
x N
C
f
e
CCA
t
pA
e
**
)2/sinh(/)2/( xx ee
University of Ghana http://ugspace.ug.edu.gh

47
a correction for the source region attenuation coefficient (µe) and source organ
thickness (x) and C is the system calibration factor (counts per unit activity).
Determination of body and organ thickness
For body and organ thicknesses were determined in the AP and PA positions,
computed tomography scans of 10average sized patients was used. Organs which
were considered in this study were heart, liver, kidneys and urinary bladder. The
mean body and organ thicknesses were measured and their respective standard
deviations were estimated. Table 4 shows the thicknesses of body sections and organs
of interest in this study.
Determination of the system calibration factor
A point-source of 5 mCiTc-99m was acquired for a period of 60s with the Mediso
gamma camera (Figure 3.6). After the acquisition, the count of the source was
recorded and the counts activity found was864kcts. The calibration factor was
calculated using equation (3.4).
(3.4) Activityknown
countsSourceC
University of Ghana http://ugspace.ug.edu.gh

48
Figure 3.6: Determination of the system calibration factor
99mTc
University of Ghana http://ugspace.ug.edu.gh

49
3.2.5 Biokinetic model
The biokinetic model (Figure 12) published by L. Melendez-A. et al was used to simulate with
MATLAB, the transfer of the amounts of 99mTc-Sestamibi in blood, liver, kidney and
bladder.
Figure 3.7: Compartmental diagramdescribing the kinetics of 99mTc-Sestamibi through
the body.
University of Ghana http://ugspace.ug.edu.gh
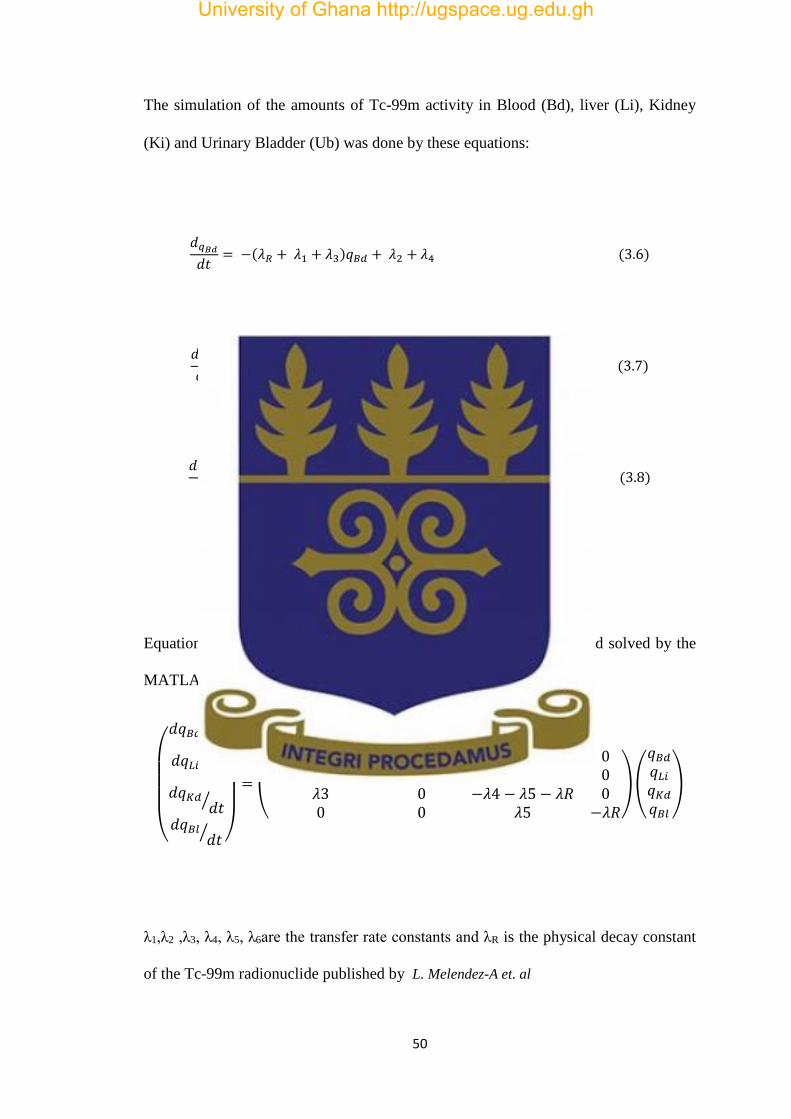
50
The simulation of the amounts of Tc-99m activity in Blood (Bd), liver (Li), Kidney
(Ki) and Urinary Bladder (Ub) was done by these equations:
𝑑𝑞𝐵𝑑𝑑𝑡
= −(𝜆𝑅 + 𝜆1 + 𝜆3)𝑞𝐵𝑑 + 𝜆2 + 𝜆4 (3.6)
𝑑𝑞𝐿𝑖𝑑𝑡
= −(𝜆𝑅 + 𝜆6 + 𝜆2)𝑞𝐿𝑖 + 𝜆1 (3.7)
𝑑𝑞𝐾𝑖𝑑𝑑𝑡
= −(𝜆𝑅 + 𝜆4 + 𝜆5)𝑞𝐾𝑖𝑑 + 𝜆3 (3.8)
𝑑𝑞𝑈𝐵𝑑𝑡
= − 𝜆𝑅 + 𝜆5 (3.9)
Equations 3.6, 3.7, 3.8 and 3.9 can be reorganized again as below and solved by the
MATLAB program.
(
𝑑𝑞𝐵𝑑𝑑𝑡⁄
𝑑𝑞𝐿𝑖𝑑𝑡⁄
𝑑𝑞𝐾𝑑𝑑𝑡⁄
𝑑𝑞𝐵𝑙𝑑𝑡⁄ )
= (
−𝜆1 − 𝜆3 − 𝜆𝑅 𝜆2 𝜆4 0𝜆1 −𝜆2 − 𝜆𝑅 0 0𝜆3 0 −𝜆4 − 𝜆5 − 𝜆𝑅 00 0 𝜆5 −𝜆𝑅
)(
𝑞𝐵𝑑𝑞𝐿𝑖𝑞𝐾𝑑𝑞𝐵𝑙
)
λ1,λ2 ,λ3, λ4, λ5, λ6are the transfer rate constants and λR is the physical decay constant
of the Tc-99m radionuclide published by L. Melendez-A et. al
University of Ghana http://ugspace.ug.edu.gh

51
3.2.6 Determination of the residence time
Determination of the residence time of Sestamibi in the heart, liver and kidneys was
estimated on 23 adult patients (8 females and 15 males) with an average age of 45.8
years.
The residence time of Sestamibi in the bladder was estimated on 7 patients (6 females
and 1 male) with the average age of 53.4 years in order to assess the dose to the testes
and ovaries. All the patients recruited for this study were referred from others
hospitals to undergo myocardial perfusion imaging. All patients signed a consent form
after receiving information about the aim of the study. The injected radionuclide
activity for the stress was 10 mCi of 99mTc‑Sestamibi and for the rest study was 30
mCi. Patients were imaged with a dual‑heads gamma camera (Mediso), equipped with
low‑energy high resolution collimators. A 15% energy window centered over the 140
keVphotopeak of 99mTc was used.
Patients were scannedat three different time point for heart, liver and kidney dose
assessments. Patients were scanned at 10 minutes, 2 hour and 4 hours after
radionuclide injection for bladder dose assessment, patients were scanned 10 minutes,
20 minutes and 2 hours after injection of radionuclide.
The determination of the radionuclide activity in organs involved, regions of interest
were drawn on images obtained at three time point. The ROIs were drawn around
source-organs such as heart, liver, kidneys and bladder.
The uptake activity at different time points were estimated for the heart, liver, kidneys
and bladder and used to generate the time-activity curves. The time-activity curves
were fitted by Microsoft Excel (2010 version) and used to estimate cumulative
activity in each organ of interest. Functional fitting procedure was used to generate
University of Ghana http://ugspace.ug.edu.gh

52
expressions for calculating the cumulated activity value for heart, liver, bladder and
kidney and for each patient.
Residence time for radionuclide in the organs were estimatedwith equation 3.10.
0
~
A
A (3.10)
Where τ: residence time, Ã: cumulated activity and A0: injected activity
Figure 3.8: protocol for estimating residence timeof theheart, liver and kidneys
Input
3 planar whole body scans
three various time after
99mTc-Sestamibi injection
ROI Analysis
InterViewXP®
placing ROI on anterior and posterior
view and Obtain ROI counts
Determination of Activity
Excel Sheet
Analysis of ROI-statistics using geometric mean and
background correction.
Convert the ROI counts in activity using conjugate
view methods
Input:
Organ thickness (ant-post) measured by CT
Integrate the activity at different time
Cumulated activity is obtained after
integrating the equation getting
Residence time
Residence time=
Cumulated activity divided
by Injected Activity
University of Ghana http://ugspace.ug.edu.gh

53
3.2.7 Dose calculation
Dose calculation was performed by assuming that the average mass of the patient is
70kg. Standard value (S-V) for the heart, liver, kidney and bladderwhichwere used to
estimate the dose receiving by the source-organs using the OLINDA software.
Table 3.2: Estimated radiation dose to certain organs according to Mirdose3 using 99mTc-Sestamibi
Target organs Estimated radiation dose
Thyroid 2.22E-03
Bladder wall 5.37E-03
Kidneys 23.1E-03
Liver 8.19E-03
Heart wall 4.95E-03
Lungs 2.75E-03
ovaries 62.4E-03
Spleen 8.62E-03
Testes 7.90E-03
According to the MIRDOSE 3 software, the radiation dose to different organsis below
using equation 3.10
University of Ghana http://ugspace.ug.edu.gh

54
(3.10)
For Tc-99m Sestamibiwholebody scan, the source organs well observed are: Bladder,
heart, kidneys, liverand the intestine.
3.2.8 Determination of the Uncertainty of Biokinetic models for 99mTc-
Sestamibi
Mathematical and Biokinetic or compartmental models are developed by the ICRP
and MIRD committee. These models are used to calculate the residence time or
cumulated activity in the source organ per unit administered activity (Stabin, 2008).
A series of physical factors contribute to the difference between measured activity and
actual activity in source regions based on planar scintigraphy. Accurate estimation of
the activity in an organ from the measured counting rate requires correction for the
system calibration factor, attenuation, scatter, background activity, organ and patient
thickness and physical decay of the radionuclide used (Buijs et al, 1998).
The uncertainties of the parameters which contribute to the absorbed dose uncertainty
can be allocated to two main parts:
1- The uptake, distribution and retention of the radiopharmaceuticals in organs
and tissues;
2- The mass and position of the organs and tissues.
The total uncertainty in individual dose estimated can be reduced to a value of
perhaps ± 10-20% (Stabin, 2008).
For this study, uncertainties of background correction and attenuation correction and
scatter correction are estimated.
k
kh khSAD )(*~
University of Ghana http://ugspace.ug.edu.gh

55
CHAPTER FOUR: RESULTS AND DISCUSSION
4.1 Introduction
This chapter presents the results of the estimated 99mTc-Sestamibi activities in
the source-organs (heart, liver, kidney and bladder) and the absorbed dose per unit
administered activity estimated for the critical organsusing MIRD formalism and
OLINDA software analysis. The results have been discussed in detail and the
relationship between the experimental and theoretical activity estimates in the heart,
liver, kidney and bladder have been estimated.
4.2 Results
4.2.1 Body and organs thickness
Thicknesses of the patient bodyweremeasured from scansof10 patients from the
Department of Diagnostic Radiology of Lamorde National hospital.Computed
tomography images of the thorax were used to determine thickness of the heart,
abdominal CT images for the thickness of kidney, and pelvic CT images for the
thickness of bladder. The average estimated value of the body and organs thicknesses
arepresented in Table 4.1. Detailed estimates of the individual thicknesses of each
patient are shown in appendix 1
University of Ghana http://ugspace.ug.edu.gh
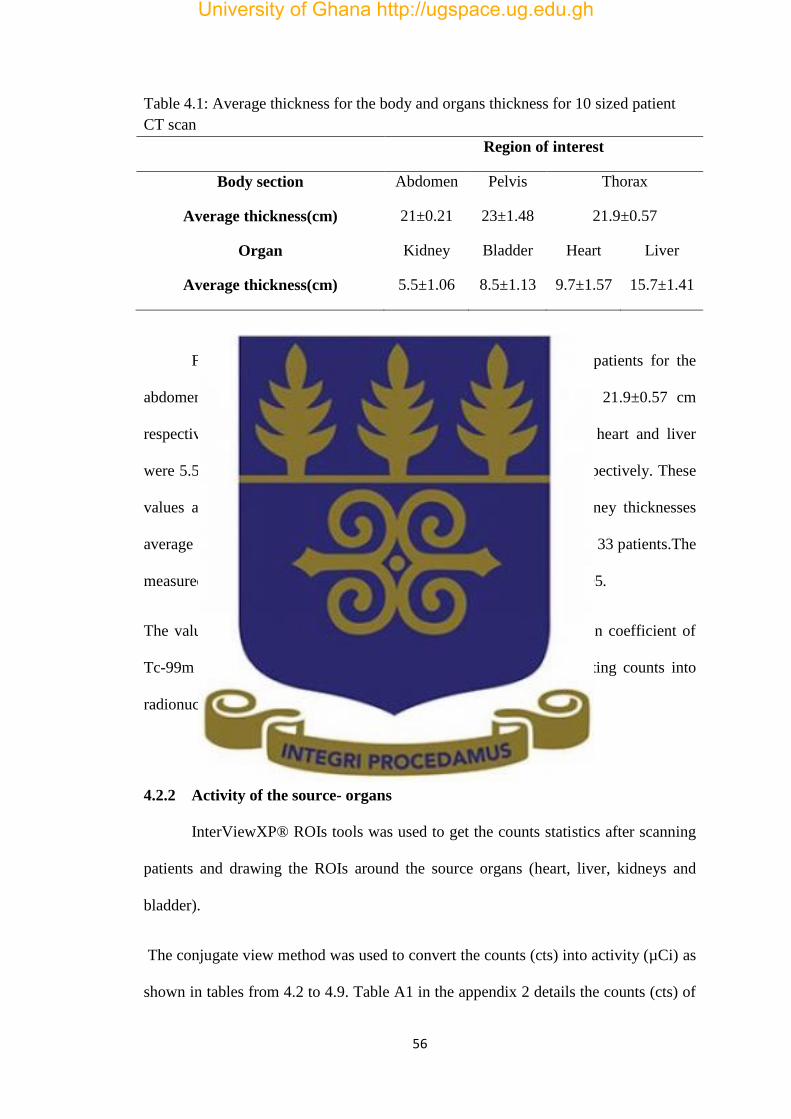
56
Table 4.1: Average thickness for the body and organs thickness for 10 sized patient
CT scan
Region of interest
Body section Abdomen Pelvis Thorax
Average thickness(cm) 21±0.21 23±1.48 21.9±0.57
Organ Kidney Bladder Heart Liver
Average thickness(cm) 5.5±1.06 8.5±1.13 9.7±1.57 15.7±1.41
From Table 4.1, body thickness from CT scans of the 10 patients for the
abdomen, pelvic and thorax were 21 cm±0.21, 23 cm±1.48 and 21.9±0.57 cm
respectively. The corresponding thickness for the kidney, bladder, heart and liver
were 5.5±1.06 cm, 8.5±1.13 cm, 9.7 ±1.57 cm and 15.7±1.41 cm respectively. These
values are consistent with Larsson et al, 2012who measured a kidney thicknesses
average of 5.54 cm in a study involving the measurement of kidney of 33 patients.The
measured Values are also consistent with the study ofRonald et al, 1995.
The values of these thicknesses were used to estimate the attenuation coefficient of
Tc-99m where the conjugate view approach was applied in converting counts into
radionuclide activity for the heart, liver, kidney and bladder ROIs.
4.2.2 Activity of the source- organs
InterViewXP® ROIs tools was used to get the counts statistics after scanning
patients and drawing the ROIs around the source organs (heart, liver, kidneys and
bladder).
The conjugate view method was used to convert the counts (cts) into activity (µCi) as
shown in tables from 4.2 to 4.9. Table A1 in the appendix 2 details the counts (cts) of
University of Ghana http://ugspace.ug.edu.gh

57
the ROIs in the different source organs (heart, liver, kidneys and bladder) for each
patient.
University of Ghana http://ugspace.ug.edu.gh

58
Table 4.2: Estimated radionuclide activities in organs for patients, ten minutes post-
injection of 10 mCi Tc-99m Sestamibi
ID SEX AGE ACTIVITY in µCi
Heart Liver Kidneys
1 M 45 208.57 630.3 401.25
2 F 48 250.21 668.49 398.89
3 M 38 174.50 628.09 519.53
4 F 55 166.55 642.90 550.22
5 M 51 224.66 629.96 480.29
6 M 50 205.08 496.01 487.73
7 M 57 162.74 623.26 559.26
8 F 44 241.23 816.51 567.51
9 F 30 243.81 868.34 498.16
10 M 53 137.19 950.71 465.86
11 M 23 242.02 562.80 497.96
12 M 48 240.60 740.74 573.45
13 F 38 273.52 661.89 512.09
14 M 25 183.95 526.59 468.61
15 M 60 266.20 953.68 596.04
16 M 43 249.06 777.65 445.26
17 F 47 161.61 411.13 509.24
18 F 50 77.35 635.45 575.15
19 M 60 158.40 436.20 457.36
20 M 51 304.35 640.40 477.88
21 F 49 190.14 447.21 486.23
22 M 32 243.57 643.02 483.73
23 M 57 398.60 634.58 491.43
Average 45.8 217.56±134.37 653.30±3.03 500.14±63.76
University of Ghana http://ugspace.ug.edu.gh

59
Table 4.2 shows the estimated activities (µCi)in the heart, liver, kidneys, ten
minutes after injection of 10 mCi of 99mTc-Sestamibi during SPECT MPI. These
uptakes radionuclide activities uptake represent 2.17% for the heart, 6.53% for the
liver and 5% for the kidneys of the injected activities. Wackers et al.,1989 , found
respectively 1.5±0.4%, 5.9±2.9% and 10.6±2.2% for the heart, liver and kidneys five
minutes after injection of Sestamibi.
Table 4.3: Estimated bladder activity after injection of 10 mCi Tc-99m Sestamibi
ID SEX AGE ACTIVITY in µCi
10 minutes 20 minutes 120 minutes
24 F 60 899.46 1385.31 1725.51
25 F 60 981.33 1184.98 1964.32
26 F 48 656.63 805.51 1050.72
27 F 51 813.77 882.70 1059.10
28 F 52 279.44 680.25 1117.39
29 M 60 135.54 859.87 1054.32
30 M 43 383.11 900.36 1234.81
Average 53 592.75±365.11 957±342.91 1315.17±346.97
Table 4.3 shows the estimated radionuclides activitiesin the bladder, 10minutes, 20
minutes and 120 minutes after injection of 10 mCi of 99mTc-Sestamibi during SPECT
MPI. The urinary bladder uptake at 10 minutes, 20 minutes and 120 minutes
represents 5.92%, 9.57% and 13.15% respectively of the injected activity
University of Ghana http://ugspace.ug.edu.gh

60
Table 4.4: Estimated organs activities for patients, 120 minutes post injection of 10
mCi Tc-99m Sestamibi
ID SEX AGE ACTIVITY in µCi
Heart Liver Kidneys
1 M 45 151.20 451.06 171.90
2 F 48 210.14 480.65 213.01
3 M 38 110.46 399.41 236.01
4 F 55 92.12 381.80 230.30
5 M 51 90.77 458.24 225.28
6 M 50 152.20 362.55 205.78
7 M 57 112.86 496.54 262.69
8 F 44 163.76 567.25 269.06
9 F 30 183.07 562.66 229.67
10 M 53 42.91 266.73 217.61
11 M 23 176.85 369.21 220.54
12 M 48 190.55 421.11 269.77
13 F 38 186.95 364.79 217.54
14 M 25 146.05 349.98 212.43
15 M 60 215.29 563.50 264.59
16 M 43 170.40 553.72 164.06
17 F 47 88.02 342.34 235.31
18 F 50 35.78 385.59 264.32
19 M 60 84.38 324.99 203.72
20 M 51 210.65 474.25 207.87
21 F 49 153.89 273.95 200.32
22 M 32 170.10 421.87 202.82
23 M 57 278.44 372.07 219.88
Average 45.8 148.56±89.97 419.32±55.85 223.67±33.93
Table 4.4 shows the estimated activities(µCi) in the heart, liver, kidneys at120
minutes after injection of 10 mCi of 99mTc-Sestamibi during SPECT MPI and
represented an uptake of 1.48%, 4.19% and 2.23% of the injected activity.
University of Ghana http://ugspace.ug.edu.gh

61
Table 4.5: Estimated organs activities for the patients 240 minutes
post-injection of 10 mCi Tc-99m Sestamibi
ID SEX AGE ACTIVITY in µCi
Heart Liver Kidneys
1 M 45 126.80 358.07 41.55
2 F 48 41.65 127.86 52.50
3 M 38 59.75 306.12 65.80
4 F 55 37.82 281.51 74.84
5 M 51 29.17 340.62 55.97
6 M 50 121.71 151.53 61.38
7 M 57 54.14 118.13 63.05
8 F 44 27.87 149.05 81.51
9 F 30 29.95 158.24 71.70
10 M 53 27.65 58.68 55.52
11 M 23 99.16 249.52 62.14
12 M 48 101.19 219.64 82.81
13 F 38 116.48 246.40 69.89
14 M 25 103.53 69.80 71.57
15 M 60 29.39 194.20 74.13
16 M 43 23.77 175.13 52.75
17 F 47 53.12 187.96 66.97
18 F 50 14.49 258.65 89.93
19 M 60 43.16 226.29 50.62
20 M 51 188.64 347.10 58.68
21 F 49 99.55 137.96 55.78
22 M 32 70.11 166.63 54.08
23 M 57 183.34 209.32 51.73
Average 45.8 73.15±38.98 206.02±105.18 63.69±7.20
Table 4.5 shows the estimated activities(µCi) in the heart, liver, Kidneys, 240 minutes
after injection of 10 mCi of 99mTc-Sestamibi during SPECT MPI. The uptake in the
University of Ghana http://ugspace.ug.edu.gh

62
organs represents 0.73% for the heart, 2.06% for the liver and 0.63% for the kidneys
of the injected activity.
University of Ghana http://ugspace.ug.edu.gh

63
Table 4.6: Estimated organs activities for the patients 10 minutes post injection of 30
mCi Tc-99m Sestamibi
ID SEX AGE ACTIVITY in µCi
Heart Liver Kidneys
1 M 45 1328.04 3971.63 1284.01
2 F 48 885.55 6580.55 1077.00
3 M 38 878.89 4411.13 1423.52
4 F 55 1261.51 4740.51 1540.62
5 M 51 1347.31 4264.92 1291.98
6 M 50 1419.93 4787.71 1472.95
7 M 57 598.69 3790.10 1683.38
8 F 44 492.93 3571.15 1719.55
9 F 30 786.02 3629.99 1444.67
10 M 53 570.42 7920.02 1425.54
11 M 23 929.34 4239.78 1020.81
12 M 48 1423.10 5708.14 1766.23
13 F 38 1461.51 4810.32 1469.70
14 M 25 994.61 3764.52 1091.86
15 M 60 1470.36 6192.62 1841.77
16 M 43 1031.99 4450.33 1090.90
17 F 47 842.80 4216.17 1522.62
18 F 50 476.18 4953.95 1731.21
19 M 60 693.34 3634.60 1376.64
20 M 51 1123.44 4123.73 1462.30
21 F 49 1113.59 4447.03 1458.69
22 M 32 1717.79 3872.15 1407.66
23 M 57 968.76 3151.02 1145.03
Average 45.8 1035.48±254.05 4575.31±580.26 1423.85±98.27
Table 4.6 shows the estimated activities (µCi)in the heart, liver, Kidneys, 10 minutes
after injection of 30 mCi of 99mTc-Sestamibi during SPECT MPI. The organs uptake
University of Ghana http://ugspace.ug.edu.gh

64
is 3.45% for the heart, 15.25% for the liver and 4.74% for kidneys of the injected
activity.
Table 4.7: Estimated bladder activity after injection of 30 mCi Tc-99m Sestamibi
ID SEX AGE ACTIVITY in µCi
10 minutes 20 minutes 120 minutes
24 F 60 2698.38 3463.4 5003.97
25 F 60 2306.12 3673.43 3928.60
26 F 48 1838.56 2497.08 2942.01
27 F 51 2481.99 3089.45 3060.79
28 F 52 810.37 1891.09 3374.51
29 M 60 414.75 2545.21 3236.76
30 M 43 1225.95 2602.04 3704.43
Average 53
1682.30±1041.1
7 2823.08±609.07 3607.30±918.91
Table 4.7 shows the estimated activities (µCi)in the bladder, 10minutes, 20 minutes et
120 minutes after injection of 30 mCi of 99mTc-Sestamibi during SPECT MPI. The
urinary bladder uptake is 5.60% 10 minutes after 30 mCi injection, 9.41% 20 minutes
after injection and 12.02% after 120 minutes of the injected activity.
University of Ghana http://ugspace.ug.edu.gh
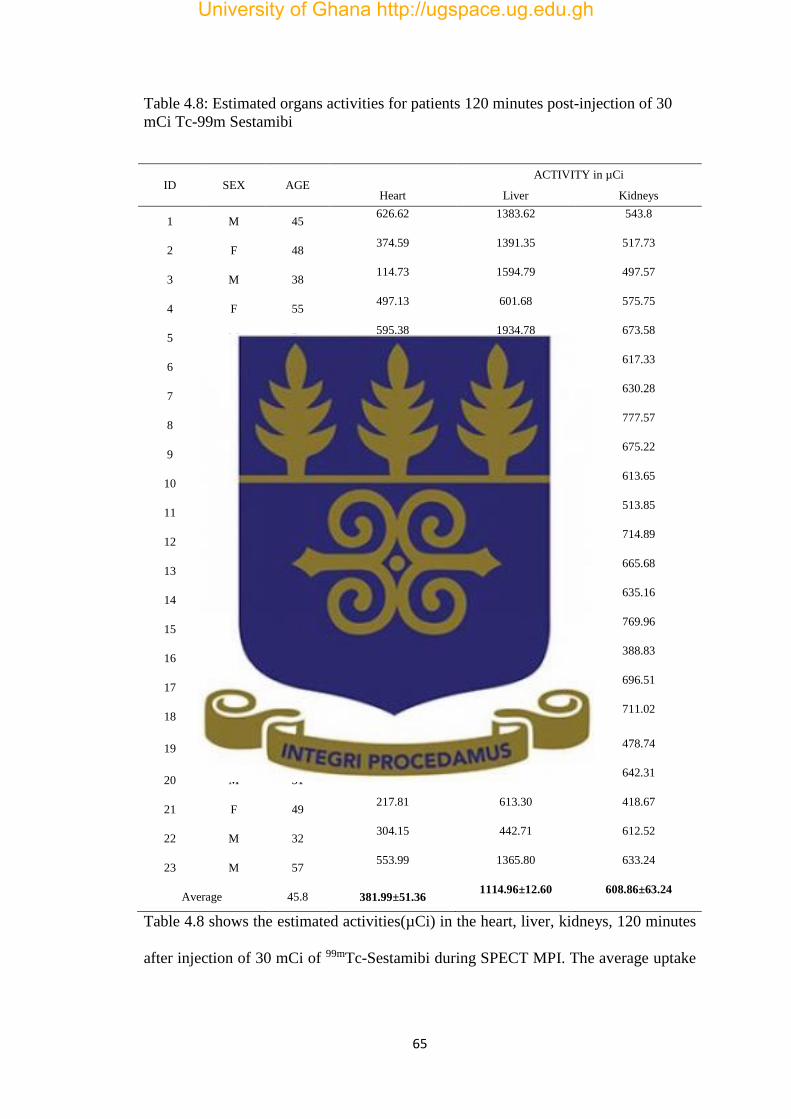
65
Table 4.8: Estimated organs activities for patients 120 minutes post-injection of 30
mCi Tc-99m Sestamibi
ID SEX AGE ACTIVITY in µCi
Heart Liver Kidneys
1 M 45 626.62 1383.62 543.8
2 F 48 374.59 1391.35 517.73
3 M 38 114.73 1594.79 497.57
4 F 55 497.13 601.68 575.75
5 M 51 595.38 1934.78 673.58
6 M 50 642.14 807.92 617.33
7 M 57 390.93 818.82 630.28
8 F 44 174.66 1917.17 777.57
9 F 30 412.63 1255.64 675.22
10 M 53 300.31 781.25 613.65
11 M 23 415.71 1485.18 513.85
12 M 48 477.40 1374.76 714.89
13 F 38 109.36 1423.75 665.68
14 M 25 349.61 1001.99 635.16
15 M 60 296.79 1371.73 769.96
16 M 43 249.16 1444.71 388.83
17 F 47 291.43 996.62 696.51
18 F 50 118.16 481.67 711.02
19 M 60 545.81 454.49 478.74
20 M 51 727.38 700.39 642.31
21 F 49 217.81 613.30 418.67
22 M 32 304.15 442.71 612.52
23 M 57 553.99 1365.80 633.24
Average 45.8 381.99±51.36 1114.96±12.60 608.86±63.24
Table 4.8 shows the estimated activities(µCi) in the heart, liver, kidneys, 120 minutes
after injection of 30 mCi of 99mTc-Sestamibi during SPECT MPI. The average uptake
University of Ghana http://ugspace.ug.edu.gh

66
for the heart represents 1.27%, 3.71% for the liver and 2.02% for the kidneys of the
injected activity.
University of Ghana http://ugspace.ug.edu.gh
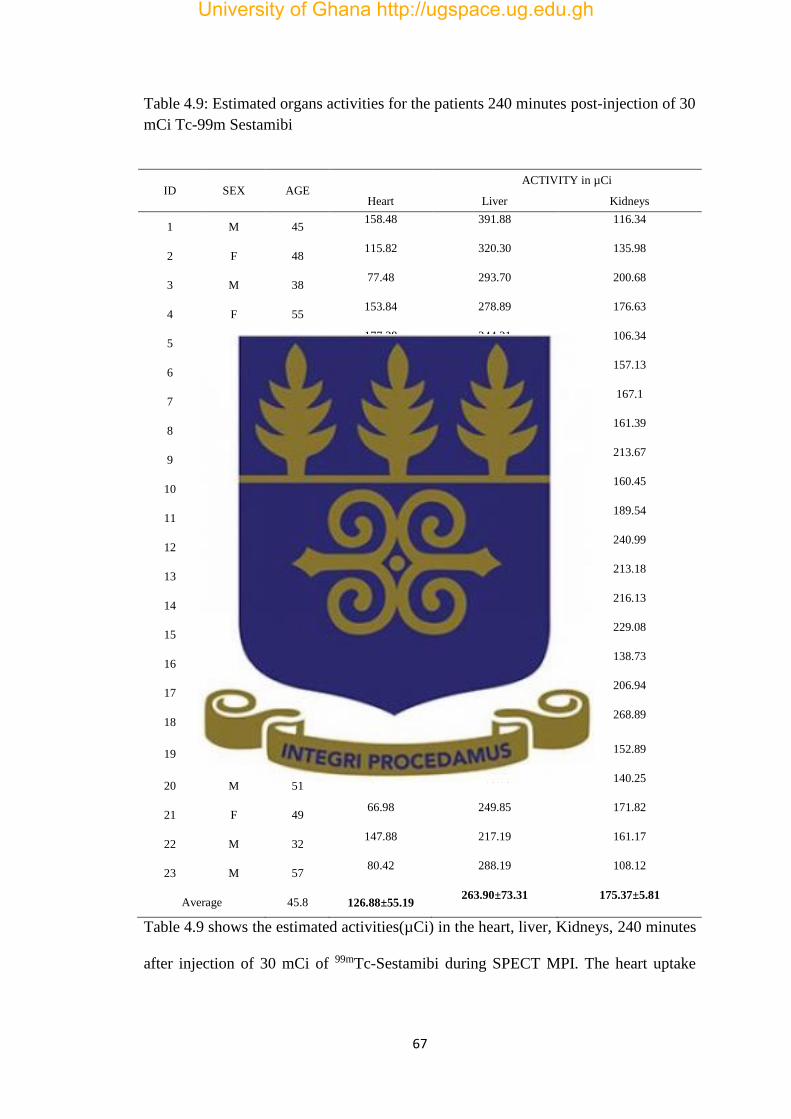
67
Table 4.9: Estimated organs activities for the patients 240 minutes post-injection of 30
mCi Tc-99m Sestamibi
ID SEX AGE ACTIVITY in µCi
Heart Liver Kidneys
1 M 45 158.48 391.88 116.34
2 F 48 115.82 320.30 135.98
3 M 38 77.48 293.70 200.68
4 F 55 153.84 278.89 176.63
5 M 51 177.28 244.31 106.34
6 M 50 449.90 190.11 157.13
7 M 57 126.84 248.84 167.1
8 F 44 167.72 190.81 161.39
9 F 30 172.14 185.06 213.67
10 M 53 126.51 231.99 160.45
11 M 23 51.93 355.70 189.54
12 M 48 55.30 243.41 240.99
13 F 38 50.92 250.30 213.18
14 M 25 60.48 296.76 216.13
15 M 60 83.11 250.01 229.08
16 M 43 103.31 276.87 138.73
17 F 47 101.92 300.55 206.94
18 F 50 139.33 231.16 268.89
19 M 60 57.88 270.84 152.89
20 M 51 192.77 263.05 140.25
21 F 49 66.98 249.85 171.82
22 M 32 147.88 217.19 161.17
23 M 57 80.42 288.19 108.12
Average 45.8 126.88±55.19 263.90±73.31 175.37±5.81
Table 4.9 shows the estimated activities(µCi) in the heart, liver, Kidneys, 240 minutes
after injection of 30 mCi of 99mTc-Sestamibi during SPECT MPI. The heart uptake
University of Ghana http://ugspace.ug.edu.gh

68
represents 0.42%, 0.87% for the liver and 0.58% for the kidneys of the injected
activity.
These uptakes are observed to be closer to whatWackers et al., 1989, found 5 minutes
and 240minutes after injection of 10 mCi and 30 mCi of 99mTc-sestamibi.
The activity in the liver is higher than the reminder source-organs because majority
(50-65 %) of the 99mTc-Sestamibi injected is eliminated through the extravascular
system (liver and digestive system), than the activity of bladder, kidneys and heart
respectively, Bucerius et al, 2012.
Figure 4.1: Radionuclide activities in the heart, liver and kidneys during myocardial
perfusion imaging with 99mTc-Sestamibi.
Figure 4.1 shows the mean activity in the heart, liver and kidneys after injection of 10
mCi of 99mTc-Sestamibi at the different time points(10 minutes, 120 minutes and 240
minutes). This figure shows that liver received the highest activity and the least is
theheart.
0
100
200
300
400
500
600
700
Org
ans
acti
viti
es
Time
10
120
240
University of Ghana http://ugspace.ug.edu.gh

69
Figure 4.2: Activity in the bladder during myocardial perfusion imaging with 99mTc-
Sestamibi.
Figure 4.2 shows the activity in the bladder 10 minutes, 20 minutes and 120 minutes
after injection of 10 mCi and 30 mCi. The bladder is a temporary reservoir, so the
activity is accumulated until the patient urinated.
4.2.3 Cumulative activity estimation
The radiation dose delivered to a target organ depends on the amount of activity
present in the source organ and on the length of time for which the activity is present.
The product of these two factors is the cumulative activity in the source organ.
0
500
1000
1500
2000
2500
3000
3500
4000
10 20 120
Bla
dd
er
acti
viti
es
Time
10 mCi
30 mCi
University of Ghana http://ugspace.ug.edu.gh
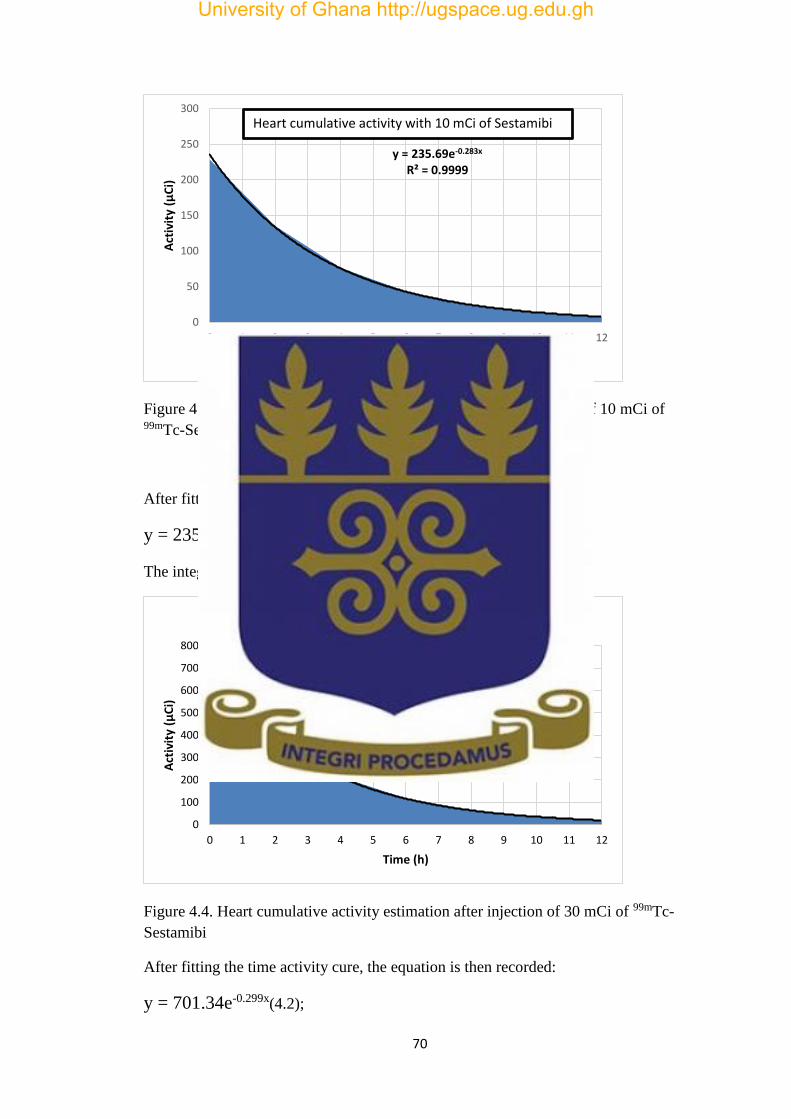
70
Figure 4.3.Cumulative activity estimation in the heart after injection of 10 mCi of 99mTc-Sestamibi
After fitting the time activity curve, the equation is then recorded:
y = 235.69e-0.283x( 4.1);
The integration from 0-∞ of equation 1 gives: 832.82 µCi/h
Figure 4.4. Heart cumulative activity estimation after injection of 30 mCi of 99mTc-
Sestamibi
After fitting the time activity cure, the equation is then recorded:
y = 701.34e-0.299x(4.2);
y = 235.69e-0.283x
R² = 0.9999
0
50
100
150
200
250
300
0 1 2 3 4 5 6 7 8 9 10 11 12
Act
ivit
y (µ
Ci)
Time (h)
Heart cumulative activity with 10 mCi of Sestamibi
y = 701.34e-0.299x
R² = 0.9999
0
100
200
300
400
500
600
700
800
0 1 2 3 4 5 6 7 8 9 10 11 12
Act
ivit
y (µ
Ci)
Time (h)
Heart cumulative activity for 30 mCi
University of Ghana http://ugspace.ug.edu.gh

71
The integration from 0-∞ of equation 2 gives: 2345.61 µCi/h.
Figure4.5 Liver cumulative activity estimation after injection for 10 mCi of 99mTc-
Sestamibi
After fitting the time activity cure, the equation is then recorded:
y = 1102.5e-0.544x(4.3);
The integration from 0-∞ of equation 3 gives: 2026.65 µCi/h
Figure4.6 Liver cumulative activity estimation after injection of 30 mCi of 99mTc-
Sestamibi
y = 1102.5e-0.544x
R² = 0.9999
0
200
400
600
800
1000
1200
0 1 2 3 4 5 6 7 8 9 10 11 12
Act
ivit
y (µ
Ci)
Time (h)
Liver cumulative activity with 10 mCi of 99mTc-Sestamibi
y = 4875.7e-0.737x
R² = 0.9998
0
1000
2000
3000
4000
5000
6000
0 1 2 3 4 5 6 7 8 9 10
Act
ivit
y (µ
Ci)
Time (h)
Liver cumulative activity with 30 mCi of 99mTc-Sestamibi
University of Ghana http://ugspace.ug.edu.gh

72
After fitting the time activity cure, the equation is then recorded:
y = 4875.7e-0.737x( 4.4);
The integration from 0-∞ of equation 4 gives: 6615.60µCi/h
Figure4.7 Kidneys cumulative activity estimation after injection of 10 mCi of 99mTc-
Sestamibi
After fitting the time activity cure, the equation is then recorded:
y = 565.3e-0.535x(4.5);
The integration from 0-∞ of equation 5 gives: 1056.63 µCi/h.
Figure4.8 Kidneys cumulative activity estimation after injection of 30 mCi of 99mTc-
Sestamibi
y = 565.3e-0.535x
R² = 0.9999
0
100
200
300
400
500
600
700
0 1 2 3 4 5 6 7 8 9 10 11 12
Act
ivit
y (µ
Ci)
Time (h)
kidney cumulative activity with 10 mCi
y = 1605e-0.546x
R² = 0.9999
0
200
400
600
800
1000
1200
1400
1600
1800
0 1 2 3 4 5 6 7 8 9 10 11 12
Act
ivit
y (µ
Ci
Time
kidney cumulative activity with 30 mCi
University of Ghana http://ugspace.ug.edu.gh

73
After fitting the time activity cure, the equation is then recorded:
y = 1605e-0.546x(4.6);
The integration from 0-∞ of equation 6 gives: 2939.56µCi/h.
Figure4.9 Bladder cumulative activity estimation after injection of 10 mCi of 99mTc-
Sestamibi
After fitting the time activity cure, the equation is then recorded:
y = 1090e-0.296x( 4.7);
The integration from 0-∞ of equation 7 gives: 3682.43 µCi/h
Figure4.10 Bladder cumulative activity estimation after injection of 30 mCi of 99mTc-
Sestamibi
y = 1090e-0.296x
R² = 0.9995
0
200
400
600
800
1000
1200
0 1 2 3 4 5 6 7 8 9 10 11 12
Act
ivit
y (C
i)
Time (h)
Bladder cumulative activity with 10 mCi
y = 3360.6e-0.367x
R² = 0.9995
0
500
1000
1500
2000
2500
3000
3500
4000
0 1 2 3 4 5 6 7 8 9 10 11 12
Act
ivit
y (C
i)
Time (h)
Bladder cumulative activity with 30 mCi
University of Ghana http://ugspace.ug.edu.gh
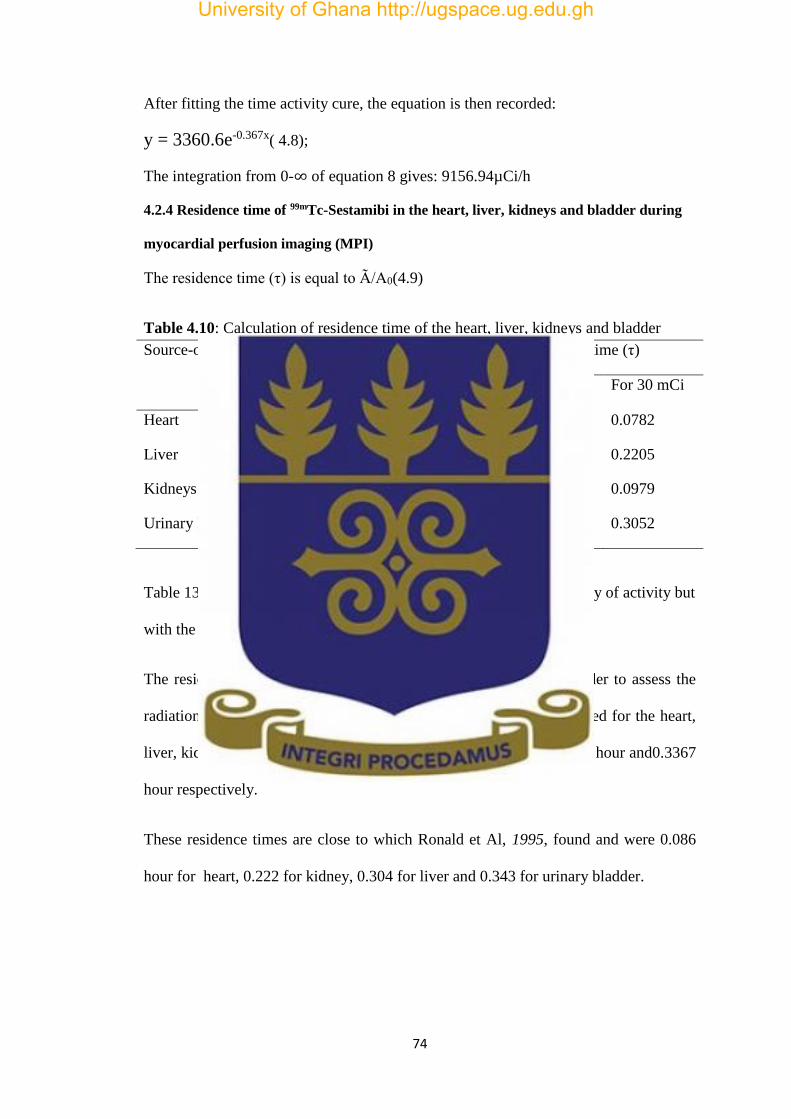
74
After fitting the time activity cure, the equation is then recorded:
y = 3360.6e-0.367x( 4.8);
The integration from 0-∞ of equation 8 gives: 9156.94µCi/h
4.2.4 Residence time of 99mTc-Sestamibi in the heart, liver, kidneys and bladder during
myocardial perfusion imaging (MPI)
The residence time (τ) is equal to Ã/A0(4.9)
Table 4.10: Calculation of residence time of the heart, liver, kidneys and bladder
Source-organs Cumulative ctivity(µCi/h) Residence time (τ)
For 10 mCi For 30 mCi For 10 mCi For 30 mCi
Heart 832.82 2345.61 0.0832 0.0782
Liver 2026.65 6615.60 0.2027 0.2205
Kidneys 1056.63 2939.56 0.1056 0.0979
Urinary Bladder 3682.43 9156.94 0.3682 0.3052
Table 13 shows that the residence time did not change with the quantity of activity but
with the tracer.
The residence time for the kidney and bladder were estimated in order to assess the
radiation dose of target- organs. The average residence times estimated for the heart,
liver, kidneys and bladder were 0.0807 hour, 0.2116 hour, and 0.1017 hour and0.3367
hour respectively.
These residence times are close to which Ronald et Al, 1995, found and were 0.086
hour for heart, 0.222 for kidney, 0.304 for liver and 0.343 for urinary bladder.
University of Ghana http://ugspace.ug.edu.gh

75
4.2.5 99mTc-Sestamibi Biokinetic model
Time-activity curve for the study was obtained from MATLAB simulation of the
biokinetic model published bySydoff, 2013 andRohe et al, 1995. The MATLAB code
of time-activity stimulation curve is found in Appendix 3
Figure 4.11: Time activity curve simulation for 99mTc-Sestamibi for blood, liver,
kidney and bladder.
Figure 16 shows the simulated time-activity curve for blood, liver, kidney and the
bladder. It was found that, the blood recorded a significant radionuclide activity of
10.00 mCi at the first minutes after injection of 99mTc-Sesamibi. This because99mTc-
Sesamibi is injected directly into systemic circulation where the emission of gamma
rays begins to occur before reaching the heart, kidney and the bladder. The bladder is
a temporary urine reservoir, so the 99mTc-Sestamibi stays in the bladder for a
relatively long period of time (about10 hours).The maximum uptake of the kidneys is
10-1
100
101
102
0
1
2
3
4
5
6
7
8
9
Time
Activity
Blood
Liver
Kidney
Bladder
Liver+Kid+Bl
University of Ghana http://ugspace.ug.edu.gh

76
seen after 2 hours and the washout of liver is fast, and takes approximately one (1)
hour.
4.2.6 Absorbed dose in different organs
The absorbed doses per unit of injected activity (mGy/MBq × 10-3) were calculated
with OLINDA methodfor source-organs (heart, urinary bladder, kidneys and liver)
and target-organs (lung, spleen, testes and ovaries) .
Table 4.11: Comparison of Absorbed dose per administered activity with OLINDA
and MIRDOSE 3
Absorbed Dose per Administered Activity (10-3mGy/MBq)
Target Organs
Female Male
MIRDOSE3 OLINDA
Difference
% MIRDOSE3 OLINDA
Difference
%
Urinary Bladder 53.7 55.30 1.6 53.7 57.2 3.5
Kidneys 23.1 8.29 -14.8 23.1 7.25 -15.85
Liver 8.19 2.02 -6.17 8.19 3.63 -4.56
Heart 4.95 2.02 -2.93 4.95 1.93 -3.02
Thyroid 2.22 6.02 3.8 2.22 2.63 0.41
Spleen 8.62 4.90 -3.72 8.62 4.6 -4.02
Lung 2.75 2.48 -0.27 2.75 3.9 1.15
Testes - - - 7.90 3.25 -4.65
Ovaries 62.4 54.6 -7.8 - - -
University of Ghana http://ugspace.ug.edu.gh
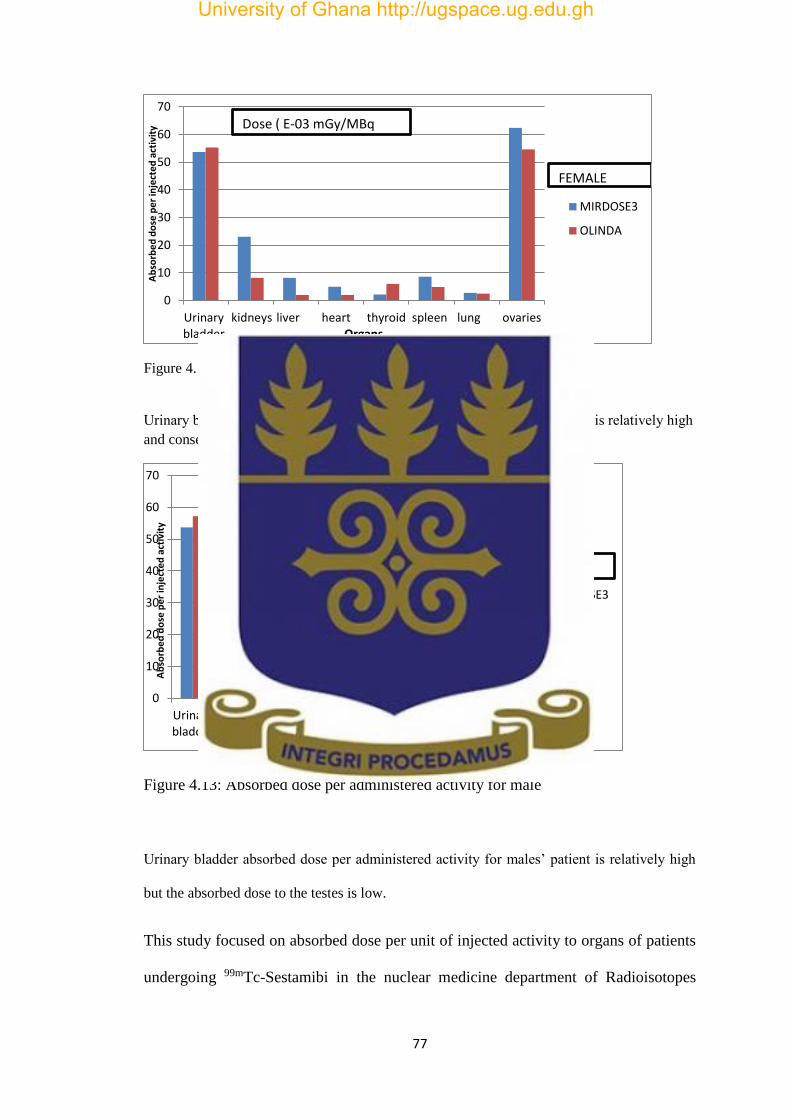
77
Figure 4.12:Absorbed dose per administered activity for female
Urinary bladder absorbed dose per administered activity for females’ patient is relatively high
and consequently the absorbed dose to the ovaries is also high.
Figure 4.13: Absorbed dose per administered activity for male
Urinary bladder absorbed dose per administered activity for males’ patient is relatively high
but the absorbed dose to the testes is low.
This study focused on absorbed dose per unit of injected activity to organs of patients
undergoing 99mTc-Sestamibi in the nuclear medicine department of Radioisotopes
0
10
20
30
40
50
60
70
Urinarybladder
kidneys liver heart thyroid spleen lung ovaries
Ab
sorb
ed
do
se p
er
inje
cte
d a
ctiv
ity
Organs
MIRDOSE3
OLINDA
Dose ( E-03 mGy/MBq
FEMALE
0
10
20
30
40
50
60
70
Urinarybladder kidneys
liver heart thyroid spleen lung testes
Ab
sorb
ed
do
se p
er
inje
cte
d a
ctiv
ity
Organs
MIRDOSE3
OLINDA
Dose(E-03mGy/MBq)
MALE
University of Ghana http://ugspace.ug.edu.gh

78
institute in Niamey. The radionuclide activity in patient organs wasdetermined using
the conjugate view method after scanning the patient. The absorbed doses per unit
injected activity for patient target organs have been estimated. Internal radiation
absorbed dose per administered activity for target organs of thirty patients was
estimated by using OLINDA software and have been compared to the result of
MIRDOSE 3 for 99mTc-Sestamibi. The Comparison of the data from the two methods
shows that the difference is less than 10% except the kidneys which is about 15%.
The absorbed dose per unit administrated activity is relatively high for urinary bladder
for both female and male patients and the dose to the ovaries is also high and low for
the testes.
The absorbed dose per unit administered activity to patient organs found in this study
was comparable to results from MIRDOSE 3 (Stabin, 1996).
4.2.7 Estimation of the uncertainties
Attenuation, Background and Scatter uncertainties
The linear attenuation coefficient of 99mTc in the water is 0.15/cm and the effective
linear attenuation coefficient in tissue is 0.12/cm. The background uncertainty is
calculated without subtracting the background and scatter uncertainty is found by
removing 30% of the counts found in the organs because 20 – 40 % of the counts
coming from the scatter. So the uncertainty was calculated by using the followed
formula:
University of Ghana http://ugspace.ug.edu.gh

79
𝑐𝑎𝑙𝑐𝑢𝑙𝑎𝑡𝑒𝑑 𝑣𝑎𝑙𝑢𝑒−𝑡ℎ𝑒𝑜𝑟𝑖𝑡𝑖𝑐𝑎𝑙 𝑣𝑎𝑙𝑢𝑒
𝑡ℎ𝑒𝑜𝑟𝑖𝑡𝑖𝑐𝑎𝑙 𝑣𝑎𝑙𝑢𝑒x 100 (4.10)
Table 4.12 Estimation of uncertainties of the heart, liver, kidneys and bladder
Source-organs Residence-time(τ) Uncertainties
With
attenuation
of 0.12/cm
With
attenuation
of 0.15/cm
Background Scatter
Heart 0.0807 0.1129 -28.52%
0.0807 0.0356 126.68%
0.0807 0.0935 -13.69%
Liver 0.2116 0.3018 -29.88%
0.2116
0.0801 164.17%
0.2116 0.2228 -5.02%
Kidneys 0.1017
0.1520 -33.09%
0.1017
0.1289 -21.10%
0.1017 0.1291 -21.22%
Urinary bladder 0.3367
0.4645 -27.53%
0.3367
0.3410 -1.26%
0.3367 0.0540 523.51%
Table 4.12 shows the estimated attenuation, background and scatter uncertainties in
the heart, liver, kidneys and urinary bladder.
University of Ghana http://ugspace.ug.edu.gh

80
The negative values signified underestimated counts and overestimated for the
positive values.
In this study, the three uncertainties were less than 40% except:
- Background uncertainty for heart and liver, with an overestimated of
respectively 126.68% and 164.17%
- and scatter uncertainty for bladder with an overestimated of 523%.
The study shows that for heart and liver quantification, correction for background is
very important and correction for scatter is no need for bladder
quantification.According to Norrgren et al.2003, the effective attenuation coefficient
correction influence the estimation of the activity by about ±10%, body thickness
influence by about ±10%, device sensitivity by about ±5% and the background by
about± 20%. So the uncertainty of attenuation correction can influence to about
±50%.
Delpon et al. 2003, found overestimated of up to 120% over the actual value of whole
body activity in patient, using only attenuation correction. If scatter correction was
performed in addition to attenuation correction, underestimates of 40±10% were
observed.
University of Ghana http://ugspace.ug.edu.gh

81
CHAPTER FIVE: CONCLUSION AND RECOMMENDATION
5.1 Conclusion
Radionuclide activities in the heart, liver, kidney and bladder were estimated for
99mTc-Sestamibi imaging in SPECT myocardial perfusion imaging. The study was
done at 10 minutes, 20 minutes, 2 hours and 4 hours after injection. Quantitative
assessments of the uptakes in the organs of interest were performed from
Scintigraphic scans from Mediso gamma camera. The InterViewXP® software was
used for the drawing of ROIs and determining counts of activity. The ROIs were
converted into activity using conjugate view method. The study involved thirty
patients undergoing myocardial perfusion imaging in the Nuclear Medicine
Department of AbdouMoumouni University (Niamey-NIGER). The cumulative
radionuclide activities in the heart, liver, kidneys and urinary bladder were relatively
low and represented about 1% of the injected activity.
The time-activity curve was simulated with MATLAB R2013a using biokinetic model
publishedby Sydoff, 2013andRohe et al, 1995. These models were used to determine
the theoretical activities in the blood, liver, and kidneys, four hours after injection,
and two hours after injection in the bladder.
The residence times were estimatedfor the heart, liver, kidneys, and urinary bladder
and were compared with the Mirdose 3 values published by Stabin, 1996.
OLINDA was used to estimate radiation absorbed doses per administered activity and
the results were comparable to the MIRDOSE3.
University of Ghana http://ugspace.ug.edu.gh

82
The radiation dose in organs of patients ‘undergoing myocardial perfusion was low.
However, relatively high radiation absorbed dose was observed in the urinary bladder
as a source-organ and in the ovaries as a target-organ.
University of Ghana http://ugspace.ug.edu.gh

83
5.2 Recommendations
Following the results obtained in this study, the following recommendations are made
in cases of 99mTc-Sestamibi SPECT-MPI:
1- To patients;
Patients are encouraged to drink water and also to urinate frequently after injection of
99mTc-Sestamibi in order to reduce the activity level of the urine and the absorbed
dose to the bladder.
2- To medical physicists
Medical physicists are encouraged to perform quantitative based researches in nuclear
medicine dosimetry using protocols such as OLINDA, MIRDOSE to be able to
accurately quantify dose to organs of patients undergoing scans.
University of Ghana http://ugspace.ug.edu.gh
84
REFERENCES
Agency, I. A. E.A (2011).Nuclear Medicine Physics.Medical Physics, 38(8),
4904.
Ahasan, M.M. (2004). Assessment of radiation dose in Nuclear Medicine Hot
Lab. Iranian Journal of Radiation Research (Print), 2(2), 75-78.
Alam et al, 2005. “Internal Dosimetry of Human Brain for 99m-Tc and 131-I Using
Nuclear Imaging in Bangladesh”. Sri Lankan Journal of Physics.
Alam et al, 2011. “BIO-DISTRIBUTION AND DOSIMETRY OF A RENAL
AGENT INNORMAL BANGLADESHI SUBJECTS” Bangladesh Journal of
Medical Physics Vol. 4, No.1, 2011
Article, O. (2006). Myocardial uptake characteristics of three 99m Tc-labeled
tracers for myocardial perfusion imaging one hour after rest injection, 20(10),
663–670.
Bailey et al, 2013. An Evidence-Based Review of Quantitative SPECT Imaging
and Potential Clinical Applications.Journal of Nuclear Medicine, 54(1), 83–89.
Bambara et al,2015.ScienceDirect Estimation of kidney and bladder radionuclide
activity for patients undergoing bone scan. Journal of Radiation Research and
Applied Sciences, 8(3), 317–322.
Bolch, W. E., Bouchet, L. G., Robertson, J. S., Wessels, B. W., Siegel, J. A.,
Howell, R. W., … Watson, E. E. (1998). MIRD Pamphlet No . 17 : The Dosimetry
of Nonuniform Activity Distributions†” Radionuclide S Values at the Voxel
Level.
Bolch, W. and Fahey, F.(2013). “The management of imaging procedure dose 2:
Nuclear Medicine.Med. Phys. 40 (6), 486- 493 .
University of Ghana http://ugspace.ug.edu.gh

85
Buijs, W. C. A. M., Siegel, J. A., Boerman, O. C., &Corstens, F. H. (1998).
Absolute organ activity estimated by five different methods of background
correction. Journal of Nuclear Medicine, 39, 2167-2171.
Cardona, R. (2014) Myocardial Perfusion SPECT. Medscape [online]. [Accessed
21 October 2015]
Cristy M., Eckerman K.F., 1987. Specific Absorbed Fractions of Energy at
Various Ages from Internal Photon Sources. Part I: Methods. ORNL Report TM-
8381/V1. Oak Ridge National Laboratory, Oak Ridge, TN.
Darvish,(2013). Presentation and evaluation of gated-SPECT myocardial
perfusion images Presentation and evaluation of gated-SPECT myocardial
perfusion images.
David, A. W., Makler, P. T., Watson, E. E., Coffey, J. L., Thomas, S. R., and
London, J. (1989). MIRD DOSE ESTIMATE REPORT NO 13 Radiation
Absorbed Dose from Technetium-99m-Labeled Bone Imaging Agents. Journal of
Nuclear Medicine, 30(13), 1117–1123.
Dewaraja, Y. K., Wilderman, S. J., Ljungberg, M., Koral, K. F., Zasadny, K., and
Kaminiski., M. S. (2005). Accurate Dosimetry in 131I Radionuclide Therapy
Using Patient-Specific, 3-Dimensional Methods for SPECT Reconstruction and
Absorbed Dose Calculation. Journal of Nuclear Medicine, 46, 840–849.
Gahrouei, S. D., Cheki, M.,Moslehi, M. (2012). Estimation of organ absorbed
doses in patients from 99mTc-diphosphonate using the data of MIRDose
software. Journal of Medical Signals and Sensors, 2(4): 231-233.
Gurk, 2007. “Variation of image counts with patient anatomy and development of
a Monte Carlo simulation system for whole-body bone scans.”A thesis for Master
of Science in Medical Physics, University of Canterbury.
University of Ghana http://ugspace.ug.edu.gh

86
Hatada et al, 2004. A New Myocardial Perfusion Imaging Agent with Rapid Liver
Clearance: Comparison with 99mTc-Sestamibi and 99mTc-Tetrofosmin in Rats.
Journal of Nuclear Medicine, 45(12), 2095–2101.
Hays, M. T., Watson, E. E., Thomas, S. R., and Stabin, M. (2002). MIRD Dose
Estimate Report No . 19 : Radiation Absorbed Dose Estimates from 18 F-FDG.
Journal of Nuclear Medicine, 43(19), 210–214.
Helal, N. (2012). Patient organs dose calculations in nuclear medicine.
International Journal of Research and Reviews in Applied Sciences, 11(April),
153–161.
Hendel, R. C., Berman, D. S., Di Carli, M. F., Heidenreich, P. A., Henkin, R. E.,
Pellikka, P. A., Williams, K. A. (2009).
ACCF/ASNC/ACR/AHA/ASE/SCCT/SCMR/SNM 2009 appropriate use criteria
for cardiac radionuclide imaging: a report of the American College of Cardiology
Foundation Appropriate Use Criteria Task Force, the American Society of
Nuclear Cardiology, the American Col. Circulation (Vol. 119). Retrieved from
http://dx.doi.org/10.1016/j.jacc.2009.02.013
Hickson, J. K. (2011). Internal radionuclide dosimetry of model and patient based
voxelised phantoms using the GATE toolkit. Royal Melbourne Institute of
Technology.
Hou, X., Celler, A., Grimes, J., Bénard, F., and Ruth T., (2012).Theoretical
dosimetry estimations for radioisotopes produced by proton-induced reactions on
natural and enriched molybdenum targets, Physics in medicine and biology 57 (6),
1499.
Howard et al, 2011. “Comparison of I-131 Radioimmunotherapy Tumor
Dosimetry: Unit Density Sphere Model Versus Patient-Specific Monte Carlo
University of Ghana http://ugspace.ug.edu.gh

87
Calculations”. Cancer Biotherapy and Radiopharmaceuticals, Volume 26, Number
5, 2011, DOI: 10.1089/cbr.2011.0965.
International Atomic Energy Agency. (2014). Quantitative Nuclear Medicine
Imaging: Concepts, Requirements and Methods. IAEA HUMAN HEALTH
REPORTS, 9, 59.
International Atomic Energy Agency, 2003.“Standards and codes of practice in
medical radiation dosimetry”. Proceedings of an International Symposium Held in
Vienna, Austria, 25–28 november 2002. Volume 2, International Atomic Energy
Agency Vienna, 2003.
Inhibitor, G., Agrawal, M., Abraham, J., Balis, F. M., Edgerly, M., Stein, W. D.,
… Chen, C. C. (2003). Increased 99m Tc-Sestamibi Accumulation in Normal
Liver and Drug-resistant Tumors after the Administration of the. Clinical Cancer
Research, 9, 650–656.
Jönsson, L. M. (2007). Internal Dosimetry Development and Evaluation of
Methods and Models Medical Radiation Physics, Lund University.
Kári, B., Györke, T., Pártos, O., and Müller, I. (2004). Handbook of InterViewXP
Clinical guide of SPECT / Whole Body / Planar processing software package.
Budapest: MEDISO Medical Imaging Systems.
Konijnenberg, M. (2012). Physics and Radiation Exposure. In 99mTc-Sestamibi:
Clinical Applications (pp. 7–23). Berlin Heidelberg: Springer. doi:10.1007/978-3-
642-04233-1
Li, W. B. andHoeschen, C.(2010).Uncertainty and sensitivity analysis of
biokinetics models for radiopharmaceuticals used in Nuclear Medicine.Radiation
Protection Dosimetry, 139 (1-3), 228-23.1.
University of Ghana http://ugspace.ug.edu.gh

88
Liu, S, He Z., Hsieh, W. Y., Kim Y. S. (2006) Evaluation of novel cationic (99m)
Tc-nitrido complexes as radiopharmaceuticals for heart imaging: improving liver
clearance with crown ether groups. Nucl Med Biol, 33:419–432.
MallinckrodtPharmaceuticals (2015). Tc 99m Sestamibi Injection Full Prescribing
Information : Contents * 1 Indications and usage 7 Drug Interactions Note :
References How Supplied / Storage And Handling (Vol. 10), 4-5, Maryland.
Melendez, L. A., Rodriguez, J. C., Ferro F. G., Consuelo, M. A., Herrera, R.,
Rodriguez, E., Mitsoura, C., Martinez, D. (2004). Biokinetics of 99m Tc-UBI 29-
41 in humans. Nucl Med Biol, 31,373-379.
Monsieurs, M. (2010). Patient dosimetry and radiation protection issues for
radionuclide therapy using 131 I. Thesis submitted to the department of Anatomy,
Embryology, Histology and Medical to obtain the degree of Doctor in Medical
Sciences, Ghent University.
Pereira, J. M.,Stabin,M. G., Lima, F. R. A., Guimarães, M. I. C. C., Forrester, J.
W. (2010).Image Quantification for Radiation Dose Calculations - Limitations
andUncertainties. Health Physics 99:5, 688-701
Robinson, M. S., Colas-linhart, N. C., Guiraud-vitaux, F., Petiet, A. M., and Bok,
B. D. (1997). Heterogeneous Distribution of Technetium-99m-Labeled
Microspheres in Rat Lungs : Microautoradiographic Evidence and Dosimetrie
Consequences nnI. The Journal of Nuclear Medicine, 38(4), 650– 654.
Rohe R. C, Thomas S. R., Stabin M. G.,Deutsch, E. A., Gerson, M. C.,
Cummings, D. D., and Maxon H. R.(1995). Biokinetics and dosimetry analysis
inhealthy volunteers for a two-injection (rest-stress) protocol of the myocardial
perfusion imaging agent technetium 99m-labeled Q3. J NuclCardiol, 2, 395–404.
University of Ghana http://ugspace.ug.edu.gh

89
Sadik, M. (2009). Computer-Assisted Diagnosis for the Interpretation of Bone
Scintigraphy: A new approach to improve diagnostic accuracy. Gothenburg:
GesonHylteTryck.
Sahebnasagh, A., Adinehvand, K., and Azadbakht, B. (2012). Determination and
Comparison of Absorbed dose of Ovaries and Uterus in Heart Scan from TC-99m,
by Three Methods : TLD Measurement , MCNP Simulation and MIRD
Calculation and Estimation of its Risks. Research Journal of Applied Sciences,
Engineering and Technology, 4(22), 4572–4575.
Savi, A, Gerundino, P, Zoli, P.,Maffioli, L., Compierchio, A., Colombo, F.,
Matarrese, M.and Deutsch, E. (1989).Biodistribution of Tc-99m methoxy-
isobutyl-isonitrile (MIBI) in humans. Eur J Nucl Med.15:597–600.
Sgouros, G., Squeri, S., Ballangrud, Å. M., Kolbert, K. S., Teitcher, J. B.,
Panageas, K. S., … Zelenetz, A. D. (2003). Non-Hodgkin ’ s Lymphoma Patients
Treated with 131 I-anti-B1 Antibody : Assessment of Tumor Dose – Response.
The Journal of Nuclear Medicine, 44(2), 260–268.
Siegel, J. A., Thomas, S. R., Stubbs, J. B., Stabin, M. G., Hays, M. T., Koral, K.
F., Brill, A. B. (1999). MIRD Pamphlet No . 16 : Techniques for Quantitative
Radiopharmaceutical Biodistribution Data Acquisition and Analysis for Use in
Human Radiation Dose Estimates. Journal of Clinical Imaging, 40(16), 37–61.
Smith, E. M., Anger, E. M., Harris, E. M. and Mitchel, E. M.(1967). Internal
radiation dosimetry.Environmental Health Series. [RH] Radiological Health,
3001, 45–53.
Stabin, M. G. (2009). Internal Dose Assessment in Nuclear Medicine (Vol. 14).
Albuquerque: University of New Mexico Health Sciences Center.
University of Ghana http://ugspace.ug.edu.gh
90
Stabin, M. G., and Flux, G. D. (2007). Internal dosimetry as a tool for radiation
protection of the patient in nuclear medicine. Biomedical Imaging and
Interventional Journal, 3(2), 1–11. http://doi.org/10.2349/biij.3.2.e28
Stabin, M. G., Sparks, R. B. and Crowe, E (1996). MIRDOSE: Personal computer
software for internal dose assessment innuclear medicine, J. Nucl. Med. 37(3),
538–546
Stabin, M. G. (2008). The Importance of Patient-Specific Dose Calculations in
Nuclear Medicine. Nuclear Engineering and Technology, 40(7), 527–532.
Stabin, M. G. (2008) Fundamentals of Nuclear Medicine Dosimetry. Springer,
New York, NY.
Stabin, M. G.(2006).Nuclear medicine dosimetry.Physics in Medicine and
Biology.
Stabin, M. G.(2005).OLINDA/EXM: The Second-Generation Personal Computer
Software for Internal Dose Assessment in Nuclear Medicine”. J Nucl Med 2005;
46:1023–1027.
Stabin, M. G. (2008). Uncertainties in internal dose calculations for
radiopharmaceuticals. J Nucl Med; 49 (5),1–60.
Sydoff, M. (2013). Quantification Methods for Clinical Studies in Nuclear
Medicine - Applications in AMS, PET/CT and SPECT/CT Lund University, dept.
of Medical Radiation Physics
Snyder, W. S., Ford, M. R., Warner, G. G., and Watson, S. B. (1975). MIRD
Pamphlet 11: “S,” Absorbed dose per unit cumulated activity for selected
radionuclides and organs 1-69.pdf. New York: Society of Nuclear Medicine.
University of Ghana http://ugspace.ug.edu.gh

91
Snyder, W. S., Ford, M. R., and Warner, G. G. (1978). nm/MIRD Pamphlet 5:
Estimates of Specific Absorbed fractions for Phototn sources uniformly distrinuted
in various Organs of a Heterogeneous Phantom. New York: Society of Nuclear
Medicine.
Wackers, F. J. T., Berman, D. S., Watson, D. D., Beller, G. A., Strauss, H. W.,
Boucher, C. A., … Mckusick, K. (2016). Technetium-9 9m Hexakis 2-
Methoxyisobutyl Isonitrile : Human Biodistribution , Dosimetry , Safety , and
Preliminary Comparison to Thaffium-201 for Myocardial Perfusion Imaging.
Journal of Nuclear Medicine, 30(3), 301–312.
Zanzonico, P. B. (2000). Internal Radionuclide Radiation Dosimetry : A Review
of Basic Concepts and Recent Developments *. Journal of Nuclear Medicine, 41,
297–308.
University of Ghana http://ugspace.ug.edu.gh

- 95 -
APPENDIX
Appendix 1: Body and organs Thickness (cm)
Thoraco-
abdominal
Abdomino-pelvic
Patient # Thickness Heart Liver Kidneys Bladder
1
A/P Body section 22.0 23.0 21.5 25.1
A/P Organ 9.00 16.20 4.6 7.70
2
A/P Body section 23.1 24.1 20.7 24.2
A/P Organ 10.2 14.70 5.2 8.50
3
A/P Body section 21.6 23.6 19.5 22.6
A/P Organ 11.8 15.90 5.8 9.40
4
A/P Body section 22.8 20.1 23.0 21.8
A/P Organ 8.6 17.60 5.4 10.0
5
A/P Body section 22.6 19.8 22.4 20.6
A/P Organ 9.90 13.80 5.8 8.20
6
A/P Body section 19.0 21.0 21.0 25.8
A/P Organ 8.90 14.00 5.2 7.80
7
A/P Body section 20.6 20.8 19.4 21.4
A/P Organ 8.80 16.80 6.0 7.50
8
A/P Body section 21.6 22.0 18.9 20.9
A/P Organ 9.70 17.20 4.7 8.00
9 A/P Body section 22.9 21.3 21.2 24.6
A/P Organ 9.30 16.60 6.2 8.60
10
A/P Body section 22.8 23.3 22.4 23.0
A/P Organ 10.8 14.20 6.1 9.3
University of Ghana http://ugspace.ug.edu.gh

- 96 -
Appendix2: Activity of the heart and liver 10 minutes after injection of 99mTc-Sestamibi
Nº Heart Ant Ant
Backg
Heart
post
Post
Backg
Liver Ant Ant
Backg
Liver post Post
Backg
Heart
GMC
Liver
GMC
Heart
Activity(µCi)
Liver
Activity(µCi)
1 31091
5000 21051
4000 183288
10000 144281
8000 21092.12 485961.53 208.57
1328.04
2 34003
5000 26076
4000 136405
10000 91070
8000 80014.18 102471.76 250.21
885.55
3 23710
5000 20691
4000 123095
10000 99454
8000 17671.68 101700.49 174.75
878.89
4 24835
5000 18302
4000 164373
10000 146036
8000 9147.68 145976.13 166.55
1261.51
5 27888
5000 26552
4000 188585
10000 144104
8000 22719.37 155904.24 224.66
1347.31
6 28406
5000 22377
4000 181301
10000 165600
8000 20739.62 164307.75 205.08
1419.93
7 24263
5000 18060
4000 83593
10000 73215
8000 16457.14 69277.46 162.74
598.69
8 29619
5000 28174
4000 72416
10000 60127
8000 24395.48 57039.97 241.23
492.93
9 30649
5000 27702
4000 106867
10000 93402
8000 24656.28 90954.02 243.81
786.02
10 19253
5000 17504
4000 81407
10000 69015
8000 13873.44 66006.80 137.19
570.42
11 30965
5000 27071
4000 124171
10000 109291
8000 24475.26 107538.34 242.02
929.34
12 29492
5000 28172
4000 191202
10000 157654
8000 24331.47 164674.23 240.60
1423.10
13 33805
5000 30562
4000 189801
10000 167071
8000 27660.77 169118.67 273.52
1461.51
14 24640
5000 21620
4000 131380
10000 117130
8000 18602.60 115092.13 183.95
994.61
15 35919
5000 27439
4000 193253
10000 165970
8000 26920.44 170142.51 266.20
1470.36
16 31404
5000 28025
4000 132605
10000 124297
8000 25186.42 119409.35 249.06
1031.92
17 21912
5000 19794
4000 113027
10000 100316
8000 16343.44 97524.56 161.61
842.80
University of Ghana http://ugspace.ug.edu.gh

- 97 -
18 12836
5000 11808
4000 69123
10000 59353
8000 7821.98 55101.21 77.35
476.18
19 20854
5000 20186
4000 94338
10000 84323
8000 16019.13 80230.47 158.40
693.34
20 36245
5000 34318
4000 140282
10000 130282
8000 30778.01 131278.19 304.35
1134.49
21 24107
5000 23351
4000 144773
10000 131205
8000 19228.61 128859.25 190.14
1113.59
22 31212
5000 27146
4000 212026
10000 203576
8000 24631.34 198774.83 243.57
1717.79
23 47196
5000 42507
4000 126310
10000 116042
8000 40309.32 112099.79 398.60
968.76
Effective linear attenuation: 0.12/cm Liver F: 0.4007 Heart F: 0.4585
Calibration factor: 172.8 CPM/µCi
Expµe:0.072 for heart and liver
University of Ghana http://ugspace.ug.edu.gh

- 98 -
Appendix3: Activity of the bladder 10 minutes after injection of 10 mCi of 99mTc-Sestamibi
Nº Anterior Background Posterior Background GMC Activity
1 89815
5000 87327
5000 83561.74 899.46
2 96504
5000 95834
5000 91168 981.33
3 71302
5000 61126
5000 61002.18 656.63
4 86489
5000 75139
5000 75601.30 813.77
5 31199
5000 30725
5000 25960.91 279.44
6 18178
5000 17032
5000 12591.96 135.54
7 49217
5000 33649
5000 35591.75 383.11
Effective linear attenuation: 0.12/cm Bladder F: 0.4676
Calibration factor: 172.8 CPM/µCi
Expµe:0.0632 for Bladder
University of Ghana http://ugspace.ug.edu.gh

- 99 -
Appendix 4: Matlab code
A=[-1.295 0.76 0.02 0; 0.55 -2.675 0 0; 0.63 0 -0.535 0; 0 0 0.40 -0.115]; x0 = [10 0 0 0]'; B = [0 0 0 0]'; C = [1 0 0 0]; D = 0; fori = 1:1001, u(i) = 0; t(i) = (i-1)*0.1; end; sys=ss(A,B,C,D); [y,t,x] = lsim(sys,u,t,x0); plot(t,x(:,1),'-',t,x(:,2),'*',t,x(:,3),'.',t,x(:,4),'+',t,x(:,2)+x(:,3)+x(:,4),':') semilogx(t,x(:,1),'-',t,x(:,2),'*',t,x(:,3),'.',t,x(:,4),'+',t,x(:,2)+x(:,3)+x(:,4),':') legend('Blood','Liver','Kidney','Bladder','Liver+Kid+Bl') % save data n = length(t); fid = fopen('gi44chaineq.txt','w'); % Open a file to be written fori = 1:n, fprintf(fid,'%10.8f %20.16f %20.16f %20.16f %20.16f %20.16f\n',t(i),x(i,1),x(i,2),x(i,3),x(i,4),x(i,2)+x(i,3)+x(i,4)); % Saving data end % d1 activity in blood after 4h % d2 activity in liver after 4h % d3 activity in kidney after 4h % d4 activity in Urinary Bladder after 2h d1=x(31,1) d2=x(31,2) d3=x(31,3) d4=x(31,4) fclose(fid); savegi44chaineq.dat-asciit,x
University of Ghana http://ugspace.ug.edu.gh