Embed Size (px)
Citation preview
MEDITERRANEASERIE DE ESTUDIOS BIOLÓGICOS
2015 Época II Número especial
COMITÉ CIENTÍFICO: G. U. CARAVELLO
S. G. CONARD
A. FARINA
A. FERCHICHI
A. A. RAMOS
Con la colaboración de:
Universitat d’AlacantUniversidad de Alicante
FISHERMAN
The Indian Ocean is the smallest, youngest and physically most complex of the three major oceans. Most of the water area of the Indian Ocean lies within the tropical and temperate zones, with a significant biodiversity and several upwelling zones important to commercially valuable marine species. Although great fisheries potential, some areas of this ocean are still insufficiently known.
The main aim of the 1st edition of the FISHERMAN Regional Conference is to bring together re-gional and international professionals involved and interested in the FISHERY Fishery sector, to exchange ideas and to promote an effective collaboration in the South-Western Indian Ocean.
You are invited to submit abstracts of contributions on the following topics:
1. Biology and ecology of marine resources2. Management and conservation of marine resources3. Education and training on fishe-ries 4. Economic and Social As-sessment of fisheries 5. Policy and governance
Quality papers will be published in an interational indexed journal.
Early registration: until 20 May 2015Registration: 21 May-31 July 2015Submission of abstracts: 30 April 2015Notification of acceptance: 1 June 2015Camera Ready Submission: 31July 2015Conference dates: 10-11 September 2015
Important dates
SEPTEMBER 2015
- To enhance the understanding of sustaina-ble ocean resources governance, its manage-ment and use in the region by critically asses-sing the agenda for reform. - To discuss the present situation in the Re-gion about Fisheries Management and Fishe-ries Education.- To present the FISHERMAN project and its developments.
The 1st edition of the FISHERMAN Regio-nal Conference will bring together Regio-nal and International Marine Resources professionals, fisheries authorities, acade-mics, reseachers, policy makers, activists, politicians and others involved and interes-ted in Fishery sector in the region.
Target
Objectives
------
For any enquiry, please write to [email protected]
! More information
www.fisherman-project.eu
HOTEL RESTAURANT LES ROCHES ROUGES, MAHAJANGA, MADAGASCAR
10-11
FISHERMAN is a project within the EDULINK Programme: ACP-EU Higher Education Cooperation funded by the European Union and implemented by the ACP Secretariat.
FisherMan aims at supporting higher education institutions in the region to create new training programmes in sustainable fisheries managementnary approach.
i about
Sustainable Fisheries in the South-Western Indian Ocean: The importance of the Education, Management and Governance
Invited talk by Daniel Pauly: Official vs. reconstructed marine fisheries catches in the Western Indian Ocean: what we can learn from the discrepancy
REGIONALCONFERENCE1
st

Marcellin Roandrianasolo Tsihoboto, Bemiasa John & Fanazava Rijasoa
Analysis of environmental parameters effects on the spatial and temporal
dynamics of tropical tuna in the EEZ of Madagascar: coupling remote sensing
and catch data
Índice
Abstract ............................................................................. 69
Resume ............................................................................. 70
Introduction ........................................................................ 71
Material and methods ........................................................ 75
Results............................................................................... 79
Discussion ......................................................................... 91
References cited................................................................ 98
Notas ............................................................................... 104
69ÍNDICE
Analysis of environmental parameters effects on the spatial and temporal dynamics of tropical tuna in the EEZ of Madagascar: coupling remote sensing and catch data
Marcellin Roandrianasolo Tsihoboto1, Bemiasa John1, Fanazava Rijasoa2
1 Institut Halieutique et des Sciences Marines, Université de Toliara, Route du Port Mahavatse II – Toliara 601 – Madagascar
2 Centre de Surveillance de Pêche de Madagascar, Ministère dea la Pêche et des Ressources Halieutiques- Antananarivo 101-Madagascar
Abstract
Potential fishing zone can be identified from the information collected regarding the relationship between the environmen-tal factors and distribution areas of the species. In this con-text, the effects of environmental parameters on the spatio-temporal dynamics of yellowfin tuna, Bigeye tuna, skipjack and albacore were analysed in the EEZ of Madagascar from
DOI: 10.14198/MDTRRA2015.ESP.05
Marcellin Roandrianasolo Tsihoboto, Bemiasa John & Fanazava Rijasoa
70ÍNDICE
2005 to 2013 using a modelling approach between remote sensed environment and monthly catch data. The result of this analysis showed that (1) there is a positive relationship between the catches data and environmental parameters, (2) the sea surface temperature (SST) and chlorophyll-a are the main parameters that influence the distributions, (3) the most productive areas are located in the northwest and east central part of the EEZ and (4) these areas are already operational and well known by tuna fishermen. Finally, for the initiative to an optimal resource management, spatial distribution predic-tive maps of each studied species were produced. The limit of these results and suggestions are discussed.
Keywords: Madagascar, environmental parameters, dynam-ic, tropical tuna, remote sensing, modelling
Resume
Titre : Analyse des effets des paramètres environnementaux sur les dynamiques spatiotemporelles des thons tropicaux dans la ZEE Malagasy : couplage télédétection et données de captures
L’identification d’une zone potentielle de pêche peut être ob-tenue à partir des informations sur les relations entre les fac-teurs de l’environnement et les aires de répartition d’une es-
Analysis of environmental parameters effects on the spatial and temporal dynamics of tropical tuna in the EEZ of Madagascar: coupling remote sensing and catch data
71ÍNDICE
pèce. Dans ce contexte, les effets des paramètres environne-mentaux sur les dynamiques spatiotemporelles du thon alba-core, Patudo, Listao et germon ont été analysés dans la ZEE de Madagascar entre 2005 et 2013 à l’aide d’une approche de modélisation entre les données mensuelles de captures et des images satellites. L’analyse de ces données a montré que (1) il existe une corrélation entre la distribution des cap-tures et les paramètres environnementaux, (2) la température de surface de la mer (TSM) et la chlorophylle-a sont les prin-cipaux paramètres qui influence les distributions des thons, (3) les zones les plus productives se situent dans la partie Nord-Ouest et Centre Est de la ZEE et que (4) ces zones sont déjà opérationnelles et bien connues par les thoniers. Enfin, dans l’initiative d’une gestion optimale des ressources, des cartes prédictives de la distribution spatiale de chaque espèce étudiée ont été réalisées. Les limites de ces résultats et les mesures à prendre sont discutées.
Mots-clés : Madagascar, paramètres environnementaux, dy-namique, thons tropicaux, télédétection, modélisation.
Introduction
Tuna fishes are among the most valuable of the Indian Ocean’s fishery resources. This fishery has been prac-ticed by coastal populations since millennia. Since the
Marcellin Roandrianasolo Tsihoboto, Bemiasa John & Fanazava Rijasoa
72ÍNDICE
1950s, tuna catches have been increasing, but the most im-portant catches have been noticed during the past thirty years (IOTC, 2015). Report from IOTC relates that in 1980, the total catch of tuna (and related species) from the Indian Ocean was just under 350,000 tonnes. In 2006, catches peaked at over 1.7 million tonnes. That was an increase of 390%, or an aver-age annual growth rate of 6.3%, sustained over 26 years. The same report noticed that total catches have declined since 2006, largely due to external factors including the world eco-nomic crisis and the Somali pirate situation. Between 2008-2012 the average annual catch of tuna (and related species) in the Indian Ocean was just over 1.5 million tonnes. Almost 1.1 million tonnes (71%) of this came from the western and central Indian Ocean. In 2006, for whole the western and cen-tral Indian Ocean, the recorded total catches of tuna, seerfish and billfish increased to a maximum of almost 1.37 million tonnes. The recorded catch in 2012 was 1.16 million tonnes. As for the catch weight, the main species caught are skipjack and yellowfin tuna (IOTC, 2015). Although landed in smaller quantities, bigeye, albacore and particularly southern bluefin tuna are highly prized because of their higher unit value.
Within Madagsacr Exclusive Economic Zone (1 1410 000 km2), tuna fishing is one of the most important of the twelve
Analysis of environmental parameters effects on the spatial and temporal dynamics of tropical tuna in the EEZ of Madagascar: coupling remote sensing and catch data
73ÍNDICE
main fisheries identified for sea fishing (MPRH, 2012). Tuna production is estimated at 10 000 tonnes per year (Soumy, 2004). Most of the catches are given by the foreign vessels (mainly from the EU) which participate in this activity in the framework of international aggrements. Catch data analysis from various sources indicates that the worldwide landings of tuna have doubled in each decade since 1950 and exceeded 2 million mt per year in 1980s. Recent report (Wesley, 1991) noted that increases in catches of skipjack and yellowfin tuna in the Indian Ocean have been particularly great since 1982. However, the system for collecting statistics on fisheries other than foreign industrial tuna fishing is deficient or non-existent. This situation could lead to the collapse of the tuna stocks in the region. In addition to these, the accelerated growth of the human population on this planet is accompanied by an increasingly strong pressure on natural resources, including fishery resources. Many fisheries are already overexploited and only allow catches less than those they would manage (Fonteneau, 1997). As a result of this deficiency in the man-agement of fisheries resources, many species catches could decrease further in the future; tunas that pass during their migration in Malagasy water are no exception.
Marcellin Roandrianasolo Tsihoboto, Bemiasa John & Fanazava Rijasoa
74ÍNDICE
Thirty government officials are involved in the management of the exploitation of tuna in Madagascar but the imbalance in the operation can be observed (Ralison and Minten, 2003) because of technical difficulties, incompetence in the field and the inability of the national tuna fishing to exploit optimally these resources. At the current stage of research, the prob-lem is contained in the following question: Is it possible to discern a preferentially areas of tunas by using easily meas-urable environmental parameters (Marsac, 1989)?
Several studies on tuna fishing have been carried out in the western Indian area, particularly for yellowfin tuna (eg. Mar-sac, 1985; 1986; 1987-a and b; 1988; 1989; 1990; 1991; 1995), but few are treating the biological aspects linked to en-vironmental parameter variability. Marsac (1987-a, b, c; 1988; 1990); Nishida (1995) and Ianelli (1995) started using tuna catch data to analyze the relationship between tuna fishing distribution areas and environmental conditions. Up to now, no investigations have been carried out within the Madagas-car EEZ and dealing the subject. Being given that the actual areas of distribution of tuna industrial fishing fleets within the Madagascar EEZ are mainly concentrated in the North West and east coast, probable new tuna potential fishing zones (PFZ) exists in the remaining zones around the island. There
Analysis of environmental parameters effects on the spatial and temporal dynamics of tropical tuna in the EEZ of Madagascar: coupling remote sensing and catch data
75ÍNDICE
is a need to investigate these new PFZ in order to increase and sustain the income generated by tuna industrial fishing activities. This paper describes the methodology how to iden-tify new PFZ. Catch data from tuna industrial fishing will be coupled with environmental parameters (SST, chlorophyll-a) to establish a cartographic description of the spatial and tem-poral distribution of four commercial tuna species (Skipjack, Yellowfin, Bigeye, Albacore) in the EEZ Madagascar in order to identify new potential fishing zones, which may contribute to the optimal management of these resources.
Material and methods
Tunas distribution is not uniform in time and space (Berges et al., 1989). The abundance of food and temperature are cited among the main factors. As migrators and predators, tunas have no boundaries, following the favourable places for their survival.
Data Sources
Catch data
The catch data used in this study are from tuna fishing trips between 2005 and 2013 in the Exclusive Economic Zone of Madagascar of yellowfin tuna (Thunnus albacares), bigeye
Marcellin Roandrianasolo Tsihoboto, Bemiasa John & Fanazava Rijasoa
76ÍNDICE
tuna (Thunnus obesus), albacore tuna (Thunnus alalunga) and skipjack (Katsuwonus pelamis). They were provided by the Madagascar Fishing Monitoring Center that collects them from the ships logbooks or “logbooks”. In general, when seat-ed is made, the ship’s captain systematically note in the log-book the geographical position of the vessel (longitude, lati-tude in degree-minute), the date of the catch, the name of the species caught (yellowfin, bigeye and skipjack), the category of catches by species and an estimate of the tonnage carried.
The satellite data
Environmental data used in this study are from MODIS Aqua Images. MODIS is an instrument of observation of the Earth on board the satellites Terra (EOS AM) and Aqua (EOS PM). MODIS images can be downloaded free of charge from NASA website - Goddard Earth Sciences Distributed Active Archive Center (DAAC) (Url 1) (1). MODIS collects Sea Surface Tem-perature (SST) and primary production (chlorophylls), which are available as pre-processed data: Level 1 (L1), 2 (L2) and 3 (L3) (Url 2) (2). But, Level 3 was the only database used during the study, with a spatial resolution of 4.86 km. It has sufficient resolution to describe the variability of the environ-ment and to analyze the distribution of the catches.
Analysis of environmental parameters effects on the spatial and temporal dynamics of tropical tuna in the EEZ of Madagascar: coupling remote sensing and catch data
77ÍNDICE
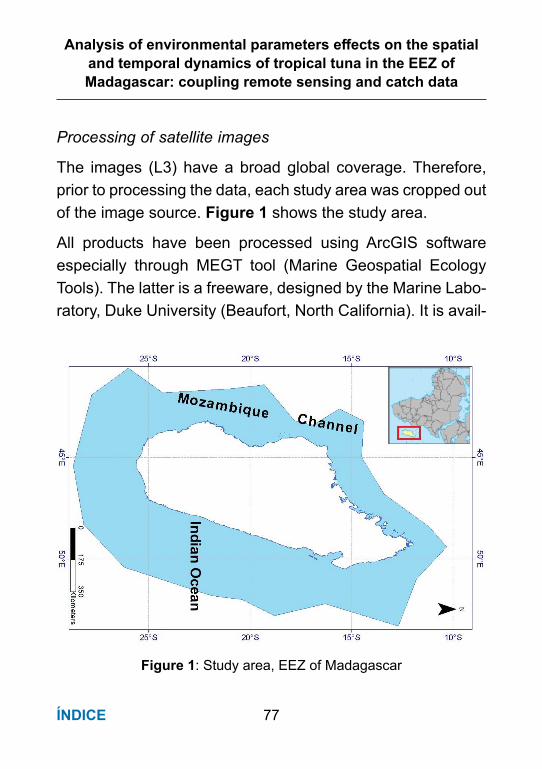
Processing of satellite images
The images (L3) have a broad global coverage. Therefore, prior to processing the data, each study area was cropped out of the image source. Figure 1 shows the study area.
All products have been processed using ArcGIS software especially through MEGT tool (Marine Geospatial Ecology Tools). The latter is a freeware, designed by the Marine Labo-ratory, Duke University (Beaufort, North California). It is avail-
Figure 1: Study area, EEZ of Madagascar
Marcellin Roandrianasolo Tsihoboto, Bemiasa John & Fanazava Rijasoa
78ÍNDICE
able via the web (Url 3) (3). ArcGIS can read images directly from MODIS and ensure the conversion of the metadata in HDF formats into Raster formats (Geo Referenced), and pixel values in degrees centigrade for temperature (°C) (SST) or mg/m3 for Chlorophyll-a and project images in the world geo-graphic coordinate system WGS 84.
Approach and model-analysis of the distribution of species
Maxent was used to model the distribution of the species of interest (Philips et al., 2006). This program identifies the areas where tunas are most likely to occur, and the environmental conditions comparable to the tuna ecological niche. Maxent works with georeferenced data and detailed environmental factors data.
The points of presence
Presence points were extracted from catch data (see previous section). They were organized into Excel and then converted into modelling formats programs adapted to the species distri-bution. In this study, the data is imported as a CSV file (* .csv). They include following basic information: the taxonomic name of the species and the coordinates (longitude and latitude) from its point of presence.
Analysis of environmental parameters effects on the spatial and temporal dynamics of tropical tuna in the EEZ of Madagascar: coupling remote sensing and catch data
79ÍNDICE
The environmental variables
There are already databases presented as an approximate value of the ecological niche known as “climate envelope” that provide detailed climate information (based on the interpo-lation of data collected worldwide by climate measuring sta-tions). They are available on the Bio oracle website (Url 4) (4). Among the parameters commonly used to describe the envi-ronment and distribution of tuna: SST, Chlorophylls, bathym-etry, dissolved oxygen, salinity, and sea surface current were used in this study to define where to meet tuna species (Stret-ta and Dufour, 1973; Stretta et al., 1973; Stretta, 1977;).
Results
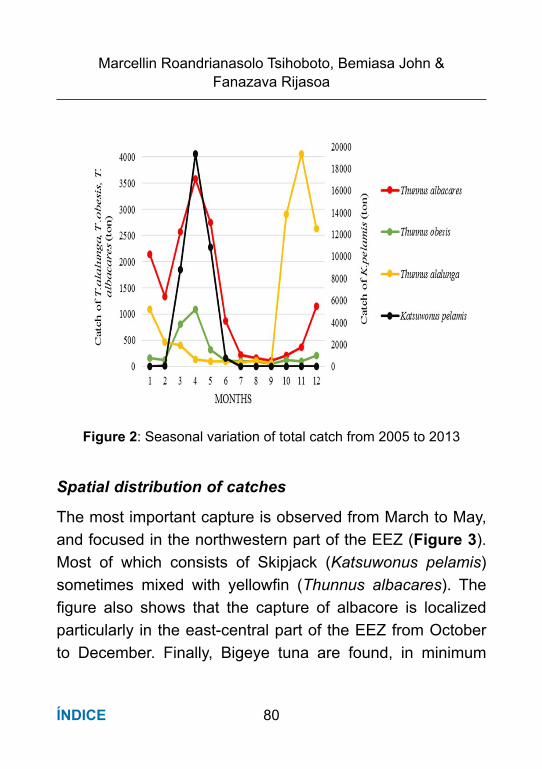
Seasonal variation in catches
Tuna fishing in the Malagasy EEZ are manifested through-out the year from January to December. The Skipjack (Katsu-wonus pelamis) is the species that dominates the catches of Malagasy tuna (Figure 2). For Bigeye, Skipjack and yellowfin tuna species, their total catches show that the highest abun-dances are found from March to May with a peak in April; however for albacore species, the peak is in November. Gen-erally a small catch is observed on July and September.
Marcellin Roandrianasolo Tsihoboto, Bemiasa John & Fanazava Rijasoa
80ÍNDICE
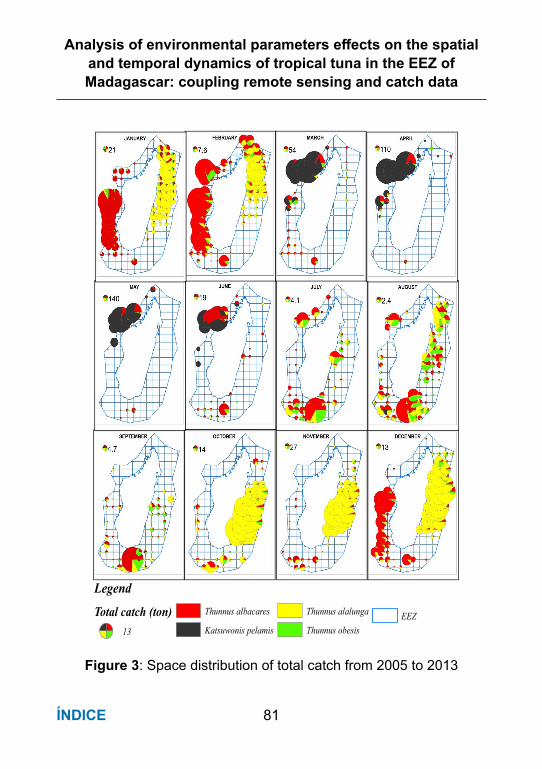
Spatial distribution of catches
The most important capture is observed from March to May, and focused in the northwestern part of the EEZ (Figure 3). Most of which consists of Skipjack (Katsuwonus pelamis) sometimes mixed with yellowfin (Thunnus albacares). The figure also shows that the capture of albacore is localized particularly in the east-central part of the EEZ from October to December. Finally, Bigeye tuna are found, in minimum
Figure 2: Seasonal variation of total catch from 2005 to 2013
Analysis of environmental parameters effects on the spatial and temporal dynamics of tropical tuna in the EEZ of Madagascar: coupling remote sensing and catch data
81ÍNDICE
Figure 3: Space distribution of total catch from 2005 to 2013
LegendTotal catch (ton)
13
Thunnus albacares
Katsuwonis pelamis
Thunnus alalunga
Thunnus obesisEEZ
±
Marcellin Roandrianasolo Tsihoboto, Bemiasa John & Fanazava Rijasoa
82ÍNDICE
amount, at almost in the whole area of the EEZ throughout the year.
Oceanographic data
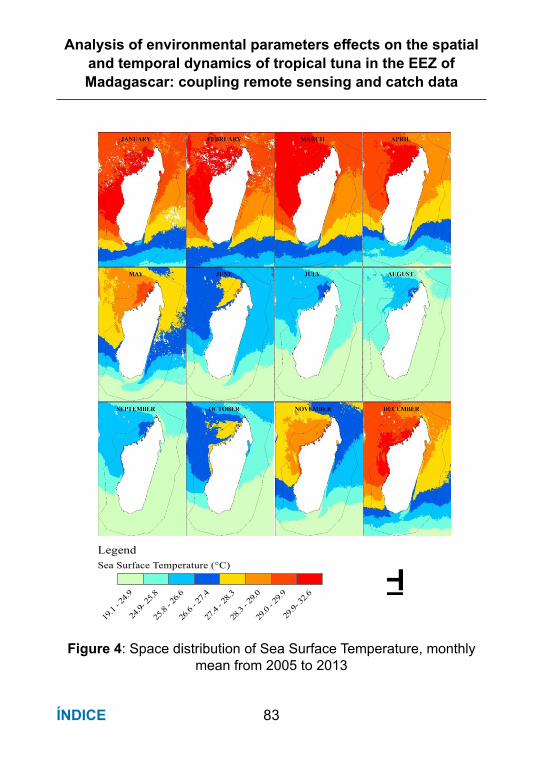
Sea Surface Temperature (SST ) distribution
The distribution of sea surface temperature (SST) is not ho-mogeneous throughout Madagascar’s EEZ, with a fairly pro-nounced seasonal variation (Figure 4). The west coast is warmer compared to the east coast and the north-western part is the warmest.
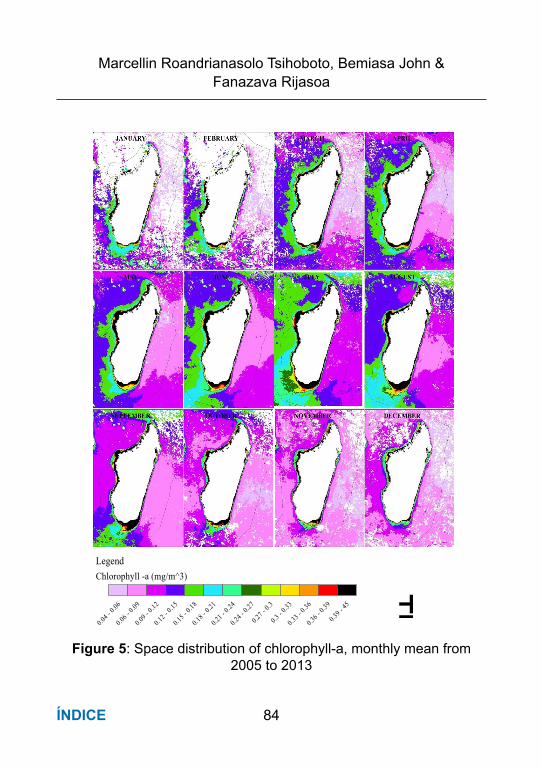
Chlorophylls (CH-a) distribution
The distribution of chlorophyll-a concentration also suggests a seasonal delineation. The west coast is more productive comparing to the east coast (Figure 5) and the important bio-mass is located in the south-western part.
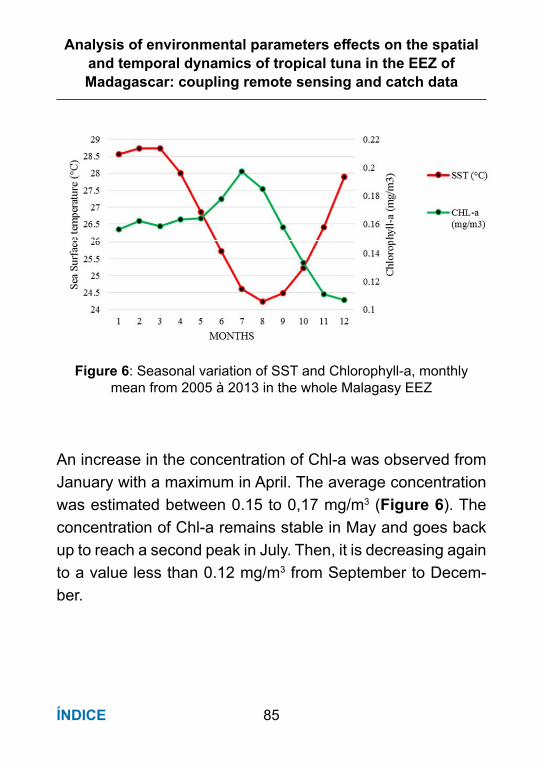
Sea surface temperature and chlorophylls values
The value of the temperature ranges from 24 °C to 28 °C (Fig-ure 6). From January to April, the temperature remains stable in the range of 28 °C. From May it falls largely to achieve its minimum in August (of approximately 24 °C). There is also a rise in the value of SST from September until December.
Analysis of environmental parameters effects on the spatial and temporal dynamics of tropical tuna in the EEZ of Madagascar: coupling remote sensing and catch data
83ÍNDICE
LegendSea Surface Temperature (°C)
19.1
- 24.9
24.9-
25.8
25.8
- 26.6
26.6
- 27.4
27.4
- 28.3
28.3
- 29.0
29.0
- 29.9
29.9-
32.6 ±
Figure 4: Space distribution of Sea Surface Temperature, monthly mean from 2005 to 2013
Marcellin Roandrianasolo Tsihoboto, Bemiasa John & Fanazava Rijasoa
84ÍNDICE
LegendChlorophyll -a (mg/m^3)
0.04 - 0
.06
0.06 - 0
.09
0.09 - 0
.12
0.12 - 0
.15
0.15 - 0
.18
0.18 - 0
.21
0.21 - 0
.24
0.24 - 0
.27
0.27 - 0
.3
0.3 - 0
.33
0.33 - 0
.36
0.36 - 0
.39
0.39 - 4
5 ±Figure 5: Space distribution of chlorophyll-a, monthly mean from
2005 to 2013
Analysis of environmental parameters effects on the spatial and temporal dynamics of tropical tuna in the EEZ of Madagascar: coupling remote sensing and catch data
85ÍNDICE
Figure 6: Seasonal variation of SST and Chlorophyll-a, monthly mean from 2005 à 2013 in the whole Malagasy EEZ
An increase in the concentration of Chl-a was observed from January with a maximum in April. The average concentration was estimated between 0.15 to 0,17 mg/m3 (Figure 6). The concentration of Chl-a remains stable in May and goes back up to reach a second peak in July. Then, it is decreasing again to a value less than 0.12 mg/m3 from September to Decem-ber.
Marcellin Roandrianasolo Tsihoboto, Bemiasa John & Fanazava Rijasoa
86ÍNDICE
Modelling
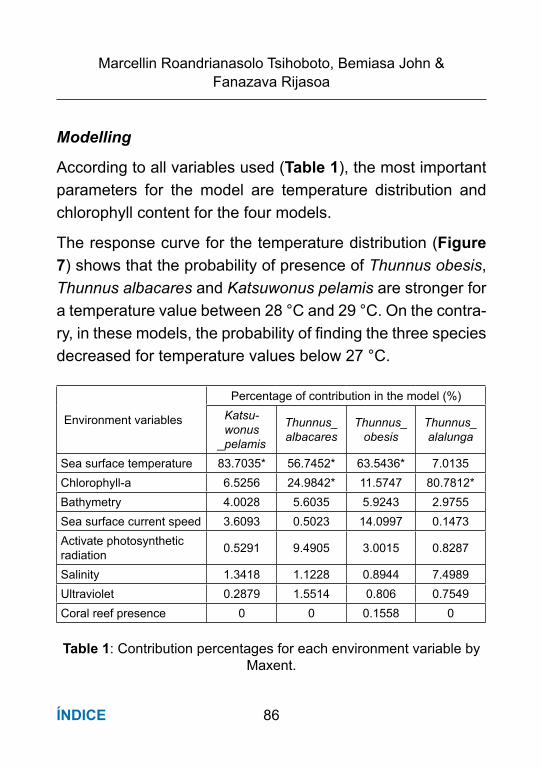
According to all variables used (Table 1), the most important parameters for the model are temperature distribution and chlorophyll content for the four models.
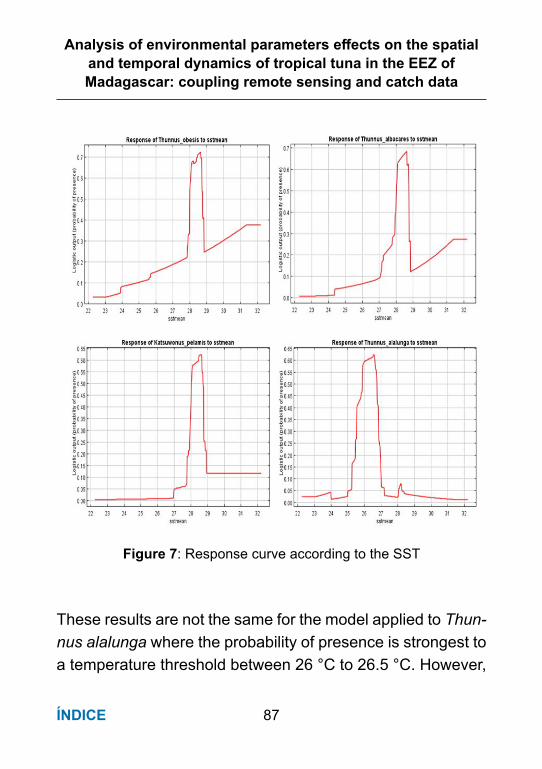
The response curve for the temperature distribution (Figure 7) shows that the probability of presence of Thunnus obesis, Thunnus albacares and Katsuwonus pelamis are stronger for a temperature value between 28 °C and 29 °C. On the contra-ry, in these models, the probability of finding the three species decreased for temperature values below 27 °C.
Environment variables
Percentage of contribution in the model (%)Katsu-wonus
_pelamis
Thunnus_albacares
Thunnus_obesis
Thunnus_alalunga
Sea surface temperature 83.7035* 56.7452* 63.5436* 7.0135Chlorophyll-a 6.5256 24.9842* 11.5747 80.7812*Bathymetry 4.0028 5.6035 5.9243 2.9755Sea surface current speed 3.6093 0.5023 14.0997 0.1473Activate photosynthetic radiation 0.5291 9.4905 3.0015 0.8287
Salinity 1.3418 1.1228 0.8944 7.4989Ultraviolet 0.2879 1.5514 0.806 0.7549Coral reef presence 0 0 0.1558 0
Table 1: Contribution percentages for each environment variable by Maxent.
Analysis of environmental parameters effects on the spatial and temporal dynamics of tropical tuna in the EEZ of Madagascar: coupling remote sensing and catch data
87ÍNDICE
These results are not the same for the model applied to Thun-nus alalunga where the probability of presence is strongest to a temperature threshold between 26 °C to 26.5 °C. However,
Figure 7: Response curve according to the SST
Marcellin Roandrianasolo Tsihoboto, Bemiasa John & Fanazava Rijasoa
88ÍNDICE
beyond this threshold the probability of finding the species remains relatively low (Figure 7).
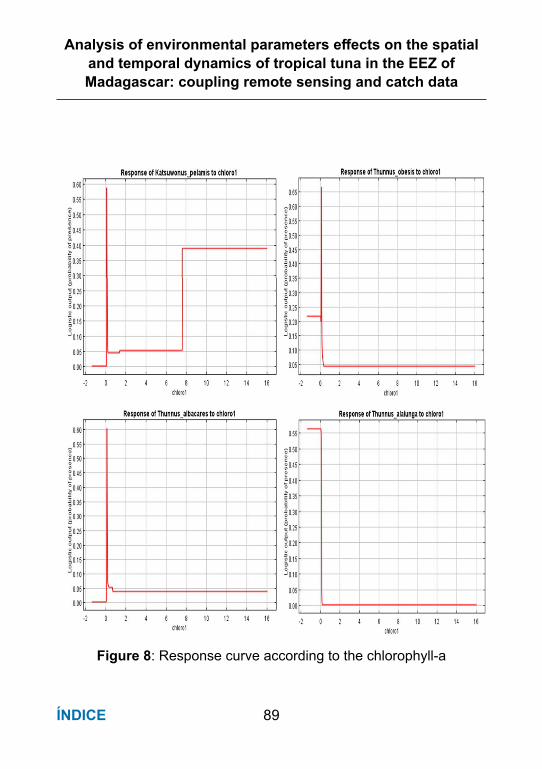
The important environmental variable after the temperature is the chlorophyll-a. For the three species: Katsuwonus pelamis, Thunnus obesis, Thunnus albacares the peak is observed at a concentration of 0.15 mg/m3 (Figure 8). Similar results were found for the model applied to Thunnus alalunga but with a lower value (0.08 mg /m3).
Graphic models
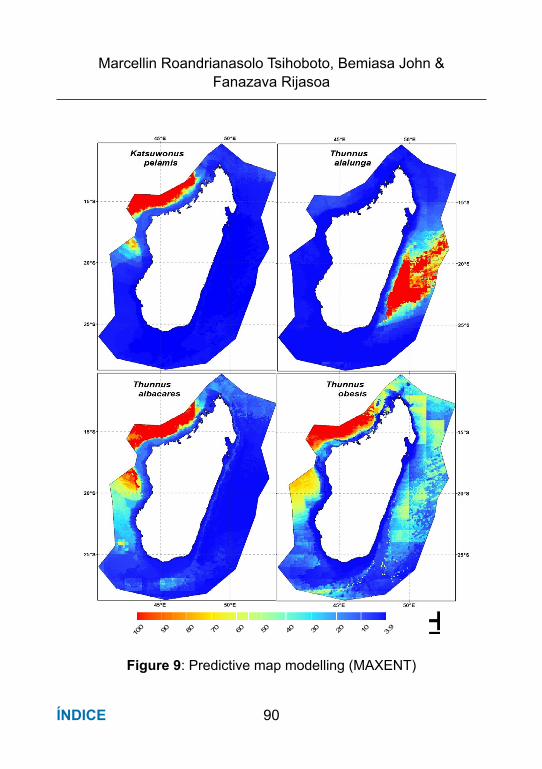
Models show that the probability of finding tuna is stronger in the West Coast than in the East Coast of Madagascar’s EEZ (Figure 9).
In one side there are some particular groupings areas evalu-ated by the model, as favourable for the three species: Katsu-wonus pelamis, Thunnus albacares, Thunnus obesis, located in the northwest of the EEZ. These areas correspond exactly to the geographic coordinates from 12.5 to 16.5° S and 42.5 to 48° E. It was also noted that areas with higher temperature are considered favourable for the distribution of these spe-cies. In the other side, the model applied to Thunnus alalunga (figure 9) showed that the most likely areas to find the spe-cies are in the east-central part of the EEZ, specifically from
Analysis of environmental parameters effects on the spatial and temporal dynamics of tropical tuna in the EEZ of Madagascar: coupling remote sensing and catch data
89ÍNDICE
Figure 8: Response curve according to the chlorophyll-a
Marcellin Roandrianasolo Tsihoboto, Bemiasa John & Fanazava Rijasoa
90ÍNDICE
Figure 9: Predictive map modelling (MAXENT)
100 90 80 70 60 50 40 30 20 10 3.
9 ±
Analysis of environmental parameters effects on the spatial and temporal dynamics of tropical tuna in the EEZ of Madagascar: coupling remote sensing and catch data
91ÍNDICE
18 to 24° S and 48 to 53° E. These areas are located in the fishing zone of longliners.
Discussion
Temporal and spatial distribution of catches
The monthly evolution of tuna catch showed two different pe-riods (March-April-May and October-November-December). Each period presents a strong spatial homogeneity of catch from the same geographical area. This result is coherent with the work of the description of the seasonal nature of this fishery by several authors (Fonteneau, 1997; Randriambola, 2012; Ramanantsoa, 2013).
The study shows that these two periods correspond to two different fishing strategies. From February to May, seiners mainly target banks Skipjack, Yellowfin and Bigeye tuna in the north-western part of the island. For longliners, even if they are operational in all seasons, the essential of their catch is located in the east-central part of the island from October to December, and the most targeted species are albacore.
Tropical tuna species are migratory pelagic species, which can travel great distances for reasons of breeding and feed-ing (Saulnier, 2014). Between 1994 and 1995, studies on the reproductive biology of tuna in the Mozambique Channel
Marcellin Roandrianasolo Tsihoboto, Bemiasa John & Fanazava Rijasoa
92ÍNDICE
carried out in Madagascar confirm that egg lying took place in Malagasy waters during the second quarter (Rajoharison, 1994.1995; Conand and Richards, 1995).
According to the IRD (2003), reproduction of albacore, mainly takes place from November to February, in an area between 17 and 28 ° S in the south of the equator.
Their spatial and temporal distribution is particularly linked to seasonal variation of weather (upwelling, thermal front), which defines primary production and therefore the amount of available prey (Tewkai et al., 2009). Besides, Saulnier (2014) argues that in the Indian Ocean, the spatio-temporal distri-bution of tuna’s catches is the result of a double phenome-non: first, the actual distribution of tuna bank that aggregate around FADs, and second, the behavior of fishermen, whose activity reflects more or less to local abundance. He also em-phasized that the seiners fishing activity is marked by a strong seasonality in the Indian Ocean, which is characterized by a shift in northern Mozambique Channel from March to June (Saulnier, 2014). Indeed from March to May, the Mozambique Channel is rich in floating debris from land (tree trunks, coco-nut branches): a large number of catches is then conducted with natural floating matters.
Analysis of environmental parameters effects on the spatial and temporal dynamics of tropical tuna in the EEZ of Madagascar: coupling remote sensing and catch data
93ÍNDICE
Piton and Magnier (1975) explained the reason for tuna fish-ermen operating in the Indian Ocean. They highlighted the potentially productive nature of the northwest coast of Mada-gascar, due to terrigenous nutrient inputs and anticyclonic cir-culation (convergence and concentration of nutrients), how-ever, the weakness of the currents limit the productivity.
This natural variability is added by the behaviour of tunas in front of eddies. Each year three main eddies usually occur in the north and the center (diameter 50 to 300 km), which can last from one week to several months. Alternately cyclonic and anticyclonic, succeed in the Mozambique Channel (Schouten et al., 2003). According Marsac and Tewkai (2010), direct catches of tuna are obtained either on the periphery or in the heart of eddies, where phytoplankton production is important. They argued that tuna use eddies to feed themselves.
Distribution of species
Katsuwonus pelamis, Thunnus albacares, Thunnus obesis are mainly captured in the northwest and Thunnus alalunga are caught more in the Central East part of ZEE.
This distribution is due to the variability of environmental pa-rameters. The main parameter, which determines the distri-bution of the different species of tuna in the Malagasy EEZ,
Marcellin Roandrianasolo Tsihoboto, Bemiasa John & Fanazava Rijasoa
94ÍNDICE
is the temperature distribution. Temperature range required for each species are not the same. Albacore need colder wa-ters than yellowfin and skipjack (Crosniere and Fourmanoire, 1961). The latter explains the dominance of yellowfin, Bigeye and skipjack tuna in the Mozambique channel while albacore clearly predominates in the East-Centre.
The temperature in the Northwest part of Malagasy EEZ has a monthly average of about 28 °C, which is warmer compared to the Central East part, with a monthly average of 26 °C.
Indeed, as various authors have described (Blackburn, 1965; Evans et al., 1981; Sund et al., 1981; Stretta, 1991), maxi-mum abundance of Thunnus albacares is located in an area where the temperature varies between 20 and 30 °C, then between 20 and 29 °C for Katsuwonus pelamis. They added that for Thunnus obesis, their maximum abundance depends on the fishing gear used. For their part, Stretta and Slepoukha (1986) also noted that in a tropical water, Thunnus albacares and Katsuwonus pelamis are captured mainly in places where the temperature ranges from 22 ° C to 29 ° C. This was lat-er confirmed by Fonteneau (1997) saying that in the Indian Ocean, catches are maximum with an average temperature of 28 °C for Thunnus albacares, 27 °C for Katsuwonus pela-mis and Thunnus obesis, and 18 °C for albacore. These sea
Analysis of environmental parameters effects on the spatial and temporal dynamics of tropical tuna in the EEZ of Madagascar: coupling remote sensing and catch data
95ÍNDICE
surface temperature ranges could be found in Madagascar’s EEZ.
Finally, according Bonhommeau and Fromentin (2011), alba-core do not approach the coast and prefer deep and open wa-ters. The lack of oxygen and warm temperatures do not suit them (IRD, 2003). Along the linear east coast of Madagascar, there is the permanent passage of South Equatorial Current, with a maximum flow during the monsoon Northeast (STRE-TA et al., 2006). This current has all the necessary character-istics to influence the distribution of albacore in the east coast of Madagascar.
Madagascar has many assets on the tuna activities carried in its EEZ. This study highlighted the potentially productive zones that may contribute to the optimal management of the resources. These areas are already well known and are wide-ly used by fishermen.
The distribution of tuna species in Madagascar’s EEZ varies in time and space depending on environmental parameters. The results from modeling confirm that the temperature distri-bution and the distribution of chlorophyll content are the two most important parameters which determine the distribution of these resources as well as the variation of capture within the EEZ.
Marcellin Roandrianasolo Tsihoboto, Bemiasa John & Fanazava Rijasoa
96ÍNDICE
Fisheries Development
From this study, further development of the large-scale tuna fishery can be considered as mentionned by the Indian Ocean Fishery Commission (1985). As the tuna fishery is not primari-ly a one-targeted species, besides, other species can be tar-geted among the various sashimi-quality fish, primarily yellow-fin, bigeye, and southern bluefin tunas and billfishes (Wesley, 1991). It will also be expected that, with the great mobility of the present fleets, future catches of these tuna species within the Madagascar EEZ will be depending to resource availabil-ity as well as species-specific market demand. As the results of the model used for this study show that exploitable resourc-es can be found in new areas within the EEZ, new fleet may relocate to these areas, but future trends in catches of these species will depend on their relative abundance, the evalua-tion of which is not part of this study.
Fisheries Management
It is clear that the need for management of Indian Ocean tuna fisheries is increasingly discussed in area fishery manage-ment forums (Wesley, 1991). In the near future, the continued expansion of both small-scale and large-scale tuna fisheries both inside and outside the EEZ could reduce catches. Con-
Analysis of environmental parameters effects on the spatial and temporal dynamics of tropical tuna in the EEZ of Madagascar: coupling remote sensing and catch data
97ÍNDICE
flicts between tradional and indudtrial fishery were recently noticed in the north-west fishing area, especially for shrimp fishery. Traditional fishermen often accused industrial fleet to expand their fishing area to areas adjacent to that used by the small-scale fisheries, and ultimately lead to decreased catches in smallscale fisheries as well as the overfishing of the exploited stocks.Tuna fishery managers need the relevant results to address scientifically such issue. Though such con-flicts does not occur in tuna fisheries, current research find-ings could be used to prevent both resource conflicts between small and large-scale of tuna fisheries and the risk of overfish-ing as well.
The license sales were therefore chosen not to have to suf-fer in terms of the economy. However, the sector remains al-most unchecked: catch statistics are difficult to verify, board observer proves to be an almost impossible operation. Final-ly, we simply accept unilateral declarations from ship-owners. For this it will be necessary to improve the quantity and quality of data collected during fishing operations. Socio-economists as fisheries scientists must find a balance between ship own-ers and the Malagasy State to establish a fair sharing of rents.
Marcellin Roandrianasolo Tsihoboto, Bemiasa John & Fanazava Rijasoa
98ÍNDICE
References citedANONYME. (2003). Etude du Comportement des Thonidés par
l’Acoustique et la Pêche : Synthèse des résultats ECOTAP.IRD, 28p.
BERGES, J-C., CAYRE, P., CITEAU,J.,DEMARCQ,H.,DUPOUY,C., GUILLOT, B.,GOHIN, F., LAURS, M., LE BORGNE, P.,LEROY, C., LIORZOU, B., MARSAC, F., PETIT, M., PIANET, R., STRETTA,J-M.(1989).Télédétection satellitaire et pêcherie thonière océanique. FAO LIBRARY AN: 289025-061, Document technique sur les pêch-es n°302,160p.
BLACKBURN, M. (1965). Oceanography and the ecology of tunas. In: Oceanography arid Marine Biology. Annual Revue n° 3, pp.299-322.
BONHOMMEAU, S., et Fromentin, J. (2011). Les populations ichtyologiques de grands pélagiques. SRM GDG, Doc IFREMER, 9p.
CONAND, F et RICHARDS.J.W. (1995). Distribution of Tuna Larvae between Madagascar and the Equator, Indian Ocean. ORSTOM. Biological Oceanography. Volume 1, Number 4, pp.321-336.
CROSNIER.A et FOURMANOIR.P. (1961).Pêche au thon à Madagas-car. Extrait du bulletin Madagascar n°185,3p.
DUFOUR, P., et STRETTA, J.M. (1973). Fronts thermiques et thermo-halins dans la région du Cap Lopez (Golfe de Guinée) en juin-juillet 1972: phytoplancton, Zooplancton, Micronecton et pêche thonière.
Analysis of environmental parameters effects on the spatial and temporal dynamics of tropical tuna in the EEZ of Madagascar: coupling remote sensing and catch data
99ÍNDICE
Centre de Recherche océanographique Abidjan. Document Scien-tifique, Vol IV (3), pp. 99-142.
EVANS, R. H., MACLAIN, D. R., et BAUER, R. A. (1981). Atlantic skip-jack tuna: influences of the environment on their vulnerability to sur-face gear. Documents Scientifiques ,ICCAT IX, pp.264-274.
FONTENEAU, A. (1997). Atlas des pêcheries thonières tropicales. Captures mondiales et environnement. Institut français de re-cherche scientifique pour le développement en coopération ,197p.
IANELLI, J.N. (1995). Studies on the population structure of skipjack tuna, Katsuwonus pelamis, in the central and eastern Pacifi Ocean: Signs of interaction potential using environmental data. FAO, Sta-tus of Interactions of Pacific Tuna Fisheris in 1995.
IOTC. (2015). Compendium of Active Conservation and Management Measures for the Indian Ocean Tuna Commission. CTOI-FAO Re-port, p.188.
MARSAC, F ., et TEWKAI.E (2010). Tourbillons méso-échelle et top prédateurs dans le canal de Mozambique. In : Information spatiale pour l’environnement et les territoires, pp. 44-44.
MARSAC, F. (1995). Analysis of small-scale movements of yellowfin tuna around Fish-Aggregating Devices (FADs) using sonic tags In: Proceedings; IPTP collective volume no. 9.
MARSAC, F. (1991). The recent drop in the yellowfin catches by the Western Indian Ocean purse seine fishery: overfishing or oceano-
Marcellin Roandrianasolo Tsihoboto, Bemiasa John & Fanazava Rijasoa
100ÍNDICE
graphic changes? In: FAO, Colombo (Sri Lanka). Indo-Pacific Tuna Development and Management Programme , 1991, p. 66-83.
MARSAC, F. (1989). Pêcheries de thons tropicaux de l’océan Indien occidental. Antenne ORSTOM. Victoria-Mahé Seychelles. FAO LI-BRARY AN : 289057, pp. 111-125.
MARSAC, F. (1988). Some considerations on the yellowfin tuna stock status. In: FAO, Colombo (Sri Lanka). Indo-Pacific Tuna Develop-ment and Management Programme , 1988, p. 40-49.
MARSAC, F. (1987)-b. A method to assess the set time of the purse seiners in the Indian Ocean. In: FAO, Colombo (Sri Lanka). In-do-Pacific Tuna Development and Management Programme , 1987, p. 155-161.
MARSAC, F. (1987)-a. Preliminary yield per recruit analysis of the In-dian Ocean yellowfin and bigeye fisheries In: FAO, Colombo (Sri Lanka). Indo-Pacific Tuna Development and Management Pro-gramme , 1987, p. 58-72.
MARSAC, F. (1986). La peche de surface des thonides tropicaux dans l’ocean indien [Tropical tuna: surface fisheries in the Indian Ocean]. (French) In: FAO Fisheries Technical Paper (FAO), no. 282 / Rome (Italy), FAO , 1986 , 24 p.
MARSAC, F. (1985). Preliminary study of the growth of yellowfin (Thunnus albacares) estimated from purse seine data in the west-ern Indian Ocean. In: FAO, Colombo (Sri Lanka). Indo-Pacific Tuna Development and Management Programme , 1985, p. 84-90.
Analysis of environmental parameters effects on the spatial and temporal dynamics of tropical tuna in the EEZ of Madagascar: coupling remote sensing and catch data
101ÍNDICE
NISHIDA, T. (1995). Influence of purse seine fishery on longline fish-ery for yellowfin tuna (Thunnus albacares) in the western Indian Ocean. FAO, Status of Interactions of Pacific Tuna Fisheris in 1995.
PHILLIPS, S. J., R.P. ANDERSON, et SCHAPIER, R.E. (2006). Max-imum Entropy Modeling of Species Geographic Distributions. Eco-logical Modeling 190, pp.231-259.
PYTON, B et MAGNIER, Y. (1975). Remarque sur la circulation et les caractéristiques des eaux malgache de la couche superficielle en-tre Madagascar et l’équateur.Cah.ORSTOM.Sér.Océanogr.XIII (2), pp.117-132.
RAJOHARISON, H. (1994). Note sur les indices gonado- somatiques et la fécondité des Albacores (Thunnus albacares) échantillonnés à Antsiranana en 1993 - Document Scientifique. AT/COI/PTRZ 14. 11 p.
RAJOHARISON, H., CONAND, F. (1995). Étude de la reproduction de l’albacore dans le canal du Mozambique. Document Scientifique. AT/COI/PTRZ 20 .11 p.
RALISON, E., et MINTEN, B. (2003). Accès aux ressources halieu-tiques et place de la pêche dans l’économie rurale. In : Revue du secteur agricole et de l’environnement, Banque mondiale, pp.64-65.
RAMANANTSOA, H. J. D. (2013). Utilisation des données satellitaires d’environnement pour la surveillance de pêche de Madagascar : Télédétection et Risque Naturel. Diplôme De MASTER2, Institut
Marcellin Roandrianasolo Tsihoboto, Bemiasa John & Fanazava Rijasoa
102ÍNDICE
Observatoire Géophysique d’Antananarivo, Université de la Réun-ion, Université d’Antananarivo, 43p.
RANDRIAMBOLA, T. (2012).National Pilot Projet. AMESD-MOI/TAF-RIRPRX, 20p.
SAULNIER, E. (2014). Dynamique spatio-temporelle de l’effort de pêche sur DCP des thoniers senneurs français dans l’océan indien. Diplôme d’Ingénieur de l’Institut Supérieur des Sciences Agronom-iques, Agroalimentaires, Horticoles et du Paysage, Agrocampus Ouest, CFR de RENNES, 55p.
SCHOUTEN, M. W., RIDDERINKHOF, H., VAN LEEUWEN, P. J. (2003). Eddies and variability in the Mozambique Channel. Deep-Sea Research volume 5, 90p.
STRETTA, J-M., et SLEPOUKHA, M. (1986). Analyse des facteurs bi-otiques et abiotiques associés aux bancs de Listao. Proceedings of the International Commission for Conservation of Atlantic Tuna (ICCAT-Madrid Spain), Conference on the International Skipjack Program held in Canarias Spain on 21-29 June 1983, pp.161-169.
STRETTA, J.M; GUYOMARD, D.; PETIT, M ; DESRUISSEAUX, M; GARDEL, L. (2006). Hydroclimat du sud-ouest de l’océan Indien et océanographie spatiale, pp.39-63.
STRETTA, J-M. (1977). Température de surface et pêche thonière dans la zone frontale du cap Lopez en juin et juillet 1972. 1974 et 1975. ORSTOM, Service Océanographie Vol XV(2), pp.163-180.
Analysis of environmental parameters effects on the spatial and temporal dynamics of tropical tuna in the EEZ of Madagascar: coupling remote sensing and catch data
103ÍNDICE
STRETTA, J-M. (1991). Forecasting models for tuna fishery with aer-ospatial remote sensing. Remote sensing vol12, n°4, pp.771-779.
STRETTA, J-M., NOËL, J., et LE GUEN, J.C (1973). Mesures de température de surface par radiométrie aérienne et concentrations de thons au large d’Abidjan en août 1973. Document Multigr, CRO Abidjan, 16 p.
SUND, P.N., BLACKBURN, M. et WILLIAMS, F. (1981). Tunas and their environment in the Pacific Ocean. Annual Revue n° 19, pp. 443-512.
TEWKAI, E., ROSSI, V., SUDRE, J., WEIMERSKIRCH, H., LOPEZ, C., HERNANDEZ, G.E., MARSAC, F., GARÇON, V. (2009). Top marine predators track Lagrangian coherent structures. Proceed-ings of the National Academy of Sciences 106 (20), pp. 8245-8250.

Marcellin Roandrianasolo Tsihoboto, Bemiasa John & Fanazava Rijasoa
104ÍNDICE
Notas1. Url1 : http://oceancolor.gsfc.nasa.gov/
2. Url2 : http://oceancolor.gsfc.nasa.gov/cgi/l3
3. Url3 : https://mgel.env.duke.edu/mget/download/
4. Url4 : http://www.oracle.ugent.be/download.html