Embed Size (px)
Citation preview
Medtech 2015 in ReviewElizabeth Cairns & Madeleine Armstrong – March 2016
2 Copyright © 2016 Evaluate Ltd. All rights reserved.EP Vantage MedTech 2015 in Review
EP Vantage MedTech 2015 in Review
In 2015 the medtech industry saw the same pattern repeat itself across a number of metrics: fewer, bigger deals.
The total expenditure on M&A soared to previously unimagined heights, but the number of deals dropped from a
year earlier. The total amount of venture capital raised by medtech groups remained level, but the number of deals
crashed. And the explosion in IPOs that characterised last year has burned out – but those that did get away were
larger, on average, than in any year since EP Vantage started tracking floats.
Mergers worth more than $127bn were closed last year as companies consolidated in response to the factors
that have become characteristic of this market over that past year or two. Unabating pressure on pricing and a
diminishing number of customers as hospitals and insurers conduct consolidation of their own mean medtech groups
must build scale to meet their growth targets.
This then has knock-on effects. Consolidation of the largest companies means fewer buyers for the smaller groups,
which in turn have difficulty raising early-stage investment as VCs see the chances of an exit shrinking. The amount
of venture investment raised by medtech groups has remained stable over the past few years, yet the number of
deals done has fallen sharply; just 287 medtech companies managed to persuade investors that they were worth a
punt, a 30% decrease from 2014.
Also contributing to the misery of early-stage companies needing capital to keep afloat is the steady decrease in
IPO activity across the sector in 2015. Shareholders, like VCs, are interested only in revenue-stage companies; woe
betide a small medtech company seeking capital to fund R&D.
Medtech groups listed on stock exchanges have not been hammered in the same way as biotechs, but the public
markets have undoubtedly been disappointing across 2015 compared with previous years. Indices of US medtech
stocks posted modest rises, whereas in Europe the performance was flat.
Dismal as the environment appears, it does not seem to be preventing devices reaching patients: the US FDA
approved more products in 2015 than in any year in the previous decade. As if to compensate, however, European
regulation is getting tighter.
Though the effects of the ongoing changes to European regulatory legislation will be hard to quantify, they are
likely to make life harder for start-ups. These companies often rely on a swift, cheap CE mark to allow them to ramp
European sales before turning to the US; raising the bar to CE mark will cut off yet another source of early cash.
This is a harsh climate in which to grow as a medtech group, and the smaller the company is the harder the task becomes.
Unless stated, all data are sourced to EvaluateMedTech and were accessed in January 2016.
3 Copyright © 2016 Evaluate Ltd. All rights reserved.
Source: EvaluateMedTech® January 2016Medtech M&A Activity by Quarter
Dea
l Val
ue
Dea
l Cou
nt
10
20
40
30
50
60
70 90
80
70
60
50
40
30
20
10
0Q1
$4.3bn
Q2
$1.8bn
Q3
$7.9bn
Q4
$8.6bn
Q1
$5.9bn
Q2
$18.8bn
Q3
$9.1bn
Q4
$11.4bn
Q1
$2.5bn
Q2
$28.5bn
Q3
$7.4bn
Q4
$4.7bn
Q1
$3.5bn
Q2
$2.6bn
Q3
$8.4bn
Q4
$5.0bn
Q1
$19.8bn
Q2
$11.1bn
Q3
$5.3bn
Q4
$3.5bn
Q2
$15.3bn
Q3
$23.3bn
Q4
$19.7bn
0
Deal Value ($bn)
Deal Count
2011 2012 2013 2014 20152010
Year *Analysis conducted by deal completion date
Q1
$68.7bn
6360
58
79
59
66
72
55
59 60
52
64
58
47
58
45
58
46
42
30
44
56
45
51
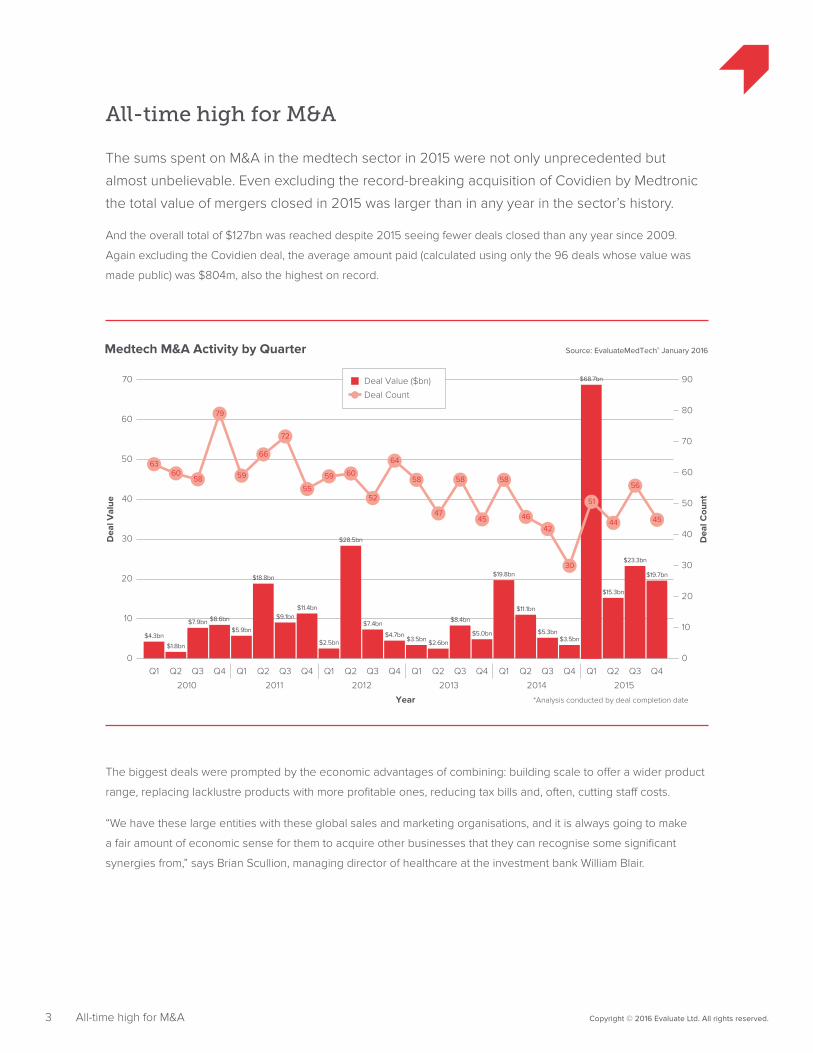
All-time high for M&A
The sums spent on M&A in the medtech sector in 2015 were not only unprecedented but
almost unbelievable. Even excluding the record-breaking acquisition of Covidien by Medtronic
the total value of mergers closed in 2015 was larger than in any year in the sector’s history.
And the overall total of $127bn was reached despite 2015 seeing fewer deals closed than any year since 2009.
Again excluding the Covidien deal, the average amount paid (calculated using only the 96 deals whose value was
made public) was $804m, also the highest on record.
All-time high for M&A
The biggest deals were prompted by the economic advantages of combining: building scale to offer a wider product
range, replacing lacklustre products with more profitable ones, reducing tax bills and, often, cutting staff costs.
“We have these large entities with these global sales and marketing organisations, and it is always going to make
a fair amount of economic sense for them to acquire other businesses that they can recognise some significant
synergies from,” says Brian Scullion, managing director of healthcare at the investment bank William Blair.

4 Copyright © 2016 Evaluate Ltd. All rights reserved.
Date Closed Target Sector(s) Value ($m)
26 January Covidien Anesthesia & Respiratory; Cardiology; General & Plastic Surgery; General Hospital & Healthcare Supply; Neurology; Patient Monitoring
49,900
2 October Twelve Cardiology 458
11 August RF Surgical Systems General & Plastic Surgery; General Hospital & Healthcare Supply 240
31 August Medina Medical Cardiology; Neurology 150
19 June Aptus Endosystems Cardiology 110
18 November Aircraft Medical Anesthesia & Respiratory; Ear, Nose & Throat; Endoscopy 110
28 September Lazarus Effect Cardiology 100
19 June CardioInsight Technologies Cardiology; Diagnostic Imaging 93
26 March Sophono Ear, Nose & Throat -
Medtronic’s 2015 Spending Spree Source: EvaluateMedTech® January 2016
All-time high for M&A
The interest of technology and software companies in devices is also hard to miss, with groups such as Google and
IBM forming alliances with medtech companies or buying them outright.
While the megamergers dominate the headlines, smaller and arguably more interesting deals are still occurring in
the background.
“Medtronic-Covidien, Zimmer-Biomet, St Jude-Thoratec – these are all noteworthy deals, but the important point
is that there’s still a fairly active acquisition market out there for smaller companies,” Mr Scullion told EP Vantage.
“Maybe they’re not worthy of the front page of the Wall Street Journal, but the source of innovation and the economic
benefit of consolidation continues to be pronounced.”
Indeed, a company making a large purchase does not have to forswear smaller deals. Medtronic has been
extraordinarily active as a buyer, closing eight acquisitions besides its integration of Covidien, and spending over $1bn
among them. These nine deals put it way out in front as the most prolific acquirer as well as the biggest spender.
Medtronic is a good illustration of the two main reasons for M&A. The Covidien deal was about scale, dovetailing
the two groups’ portfolios to provide hospitals and other customers with a single vendor for many of their products,
particularly in cardiology and neurology.
The other take outs, though, were more to do with the promise of each company’s technology. Medtronic swooped
on Twelve to get hold of its catheter-mounted artificial mitral valve, gaining a presence in the technology area that
arguably saw 2015’s most frenzied activity.
These kinds of technology-focused tuck-in deals have historically been the lifeblood of the sector, and they are more
important to its long-term health than the megamergers. It is vital that they continue.
Daniel Bertholet, a senior investment director at the VC company Endeavour Vision, is optimistic on this point. “The
large strategic medtech companies need innovation in order to generate revenue growth. They’re very selective in
their acquisitions, but they keep making acquisitions,” he says. “It’s the business model of the industry.”
5 Copyright © 2016 Evaluate Ltd. All rights reserved.All-time high for M&A
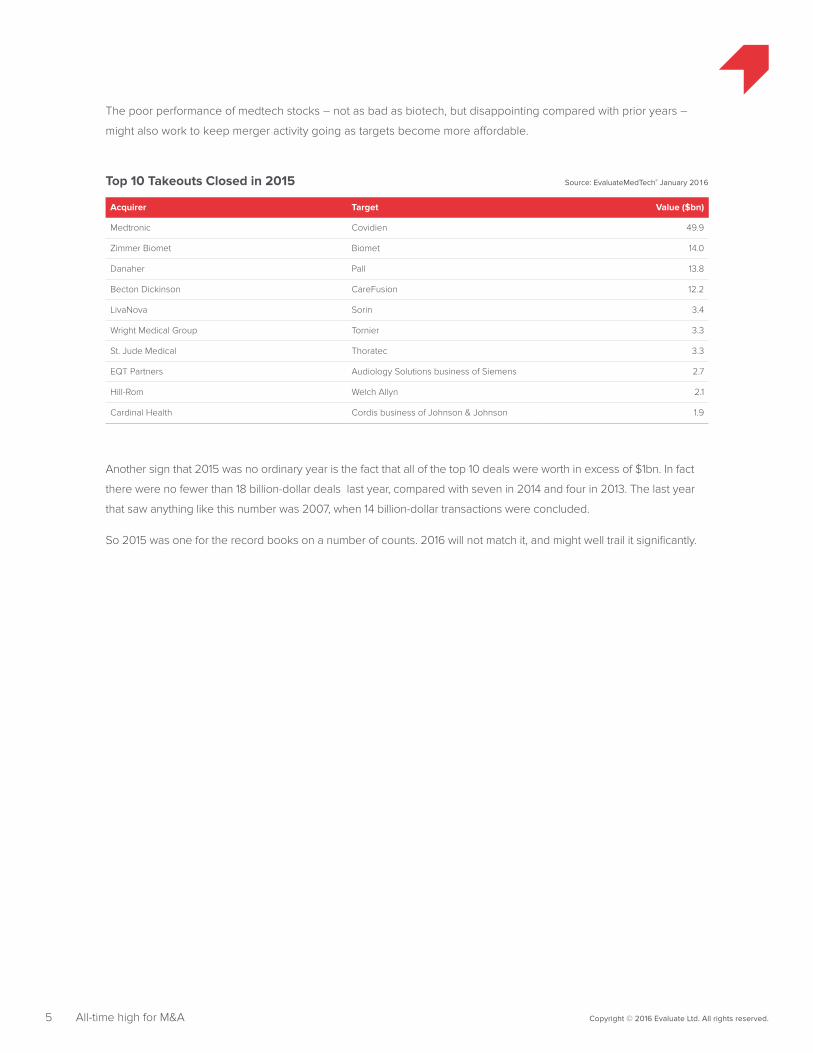
The poor performance of medtech stocks – not as bad as biotech, but disappointing compared with prior years –
might also work to keep merger activity going as targets become more affordable.
Acquirer Target Value ($bn)
Medtronic Covidien 49.9
Zimmer Biomet Biomet 14.0
Danaher Pall 13.8
Becton Dickinson CareFusion 12.2
LivaNova Sorin 3.4
Wright Medical Group Tornier 3.3
St. Jude Medical Thoratec 3.3
EQT Partners Audiology Solutions business of Siemens 2.7
Hill-Rom Welch Allyn 2.1
Cardinal Health Cordis business of Johnson & Johnson 1.9
Top 10 Takeouts Closed in 2015 Source: EvaluateMedTech® January 2016
Another sign that 2015 was no ordinary year is the fact that all of the top 10 deals were worth in excess of $1bn. In fact
there were no fewer than 18 billion-dollar deals last year, compared with seven in 2014 and four in 2013. The last year
that saw anything like this number was 2007, when 14 billion-dollar transactions were concluded.
So 2015 was one for the record books on a number of counts. 2016 will not match it, and might well trail it significantly.
6 Copyright © 2016 Evaluate Ltd. All rights reserved.
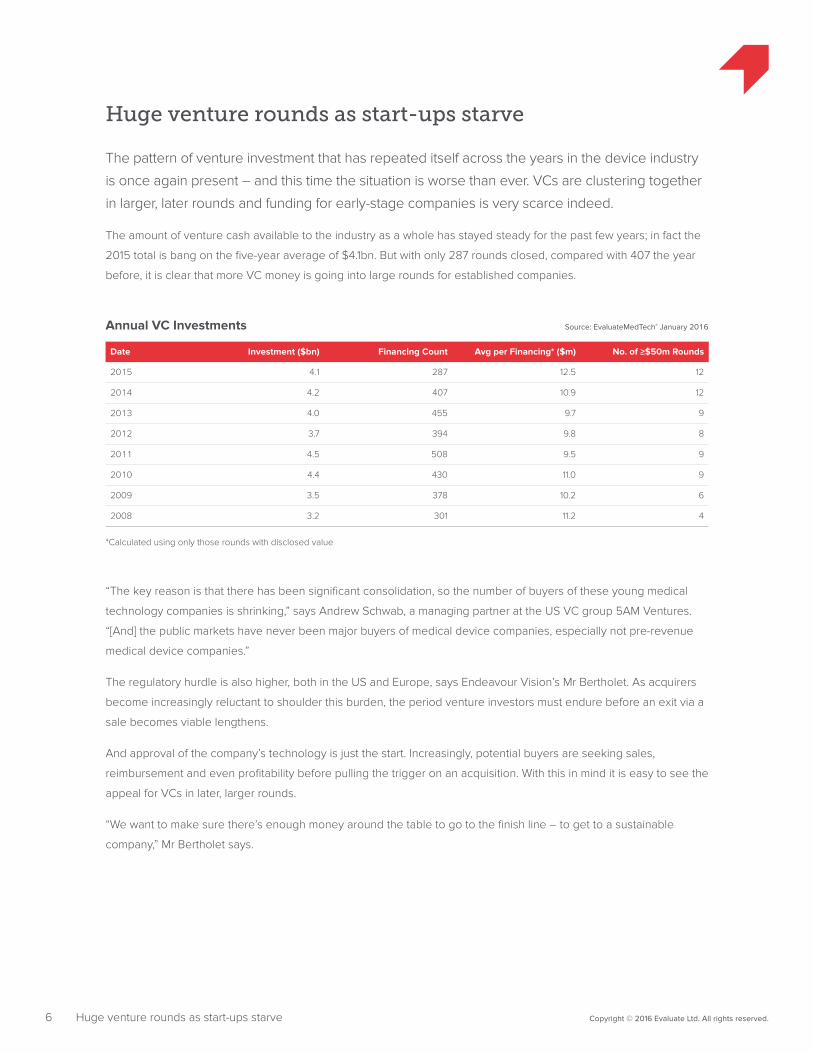
Huge venture rounds as start-ups starve
The pattern of venture investment that has repeated itself across the years in the device industry
is once again present – and this time the situation is worse than ever. VCs are clustering together
in larger, later rounds and funding for early-stage companies is very scarce indeed.
The amount of venture cash available to the industry as a whole has stayed steady for the past few years; in fact the
2015 total is bang on the five-year average of $4.1bn. But with only 287 rounds closed, compared with 407 the year
before, it is clear that more VC money is going into large rounds for established companies.
Date Investment ($bn) Financing Count Avg per Financing* ($m) No. of ≥$50m Rounds
2015 4.1 287 12.5 12
2014 4.2 407 10.9 12
2013 4.0 455 9.7 9
2012 3.7 394 9.8 8
2011 4.5 508 9.5 9
2010 4.4 430 11.0 9
2009 3.5 378 10.2 6
2008 3.2 301 11.2 4
Annual VC Investments Source: EvaluateMedTech® January 2016
*Calculated using only those rounds with disclosed value
Huge venture rounds as start-ups starve
“The key reason is that there has been significant consolidation, so the number of buyers of these young medical
technology companies is shrinking,” says Andrew Schwab, a managing partner at the US VC group 5AM Ventures.
“[And] the public markets have never been major buyers of medical device companies, especially not pre-revenue
medical device companies.”
The regulatory hurdle is also higher, both in the US and Europe, says Endeavour Vision’s Mr Bertholet. As acquirers
become increasingly reluctant to shoulder this burden, the period venture investors must endure before an exit via a
sale becomes viable lengthens.
And approval of the company’s technology is just the start. Increasingly, potential buyers are seeking sales,
reimbursement and even profitability before pulling the trigger on an acquisition. With this in mind it is easy to see the
appeal for VCs in later, larger rounds.
“We want to make sure there’s enough money around the table to go to the finish line – to get to a sustainable
company,” Mr Bertholet says.
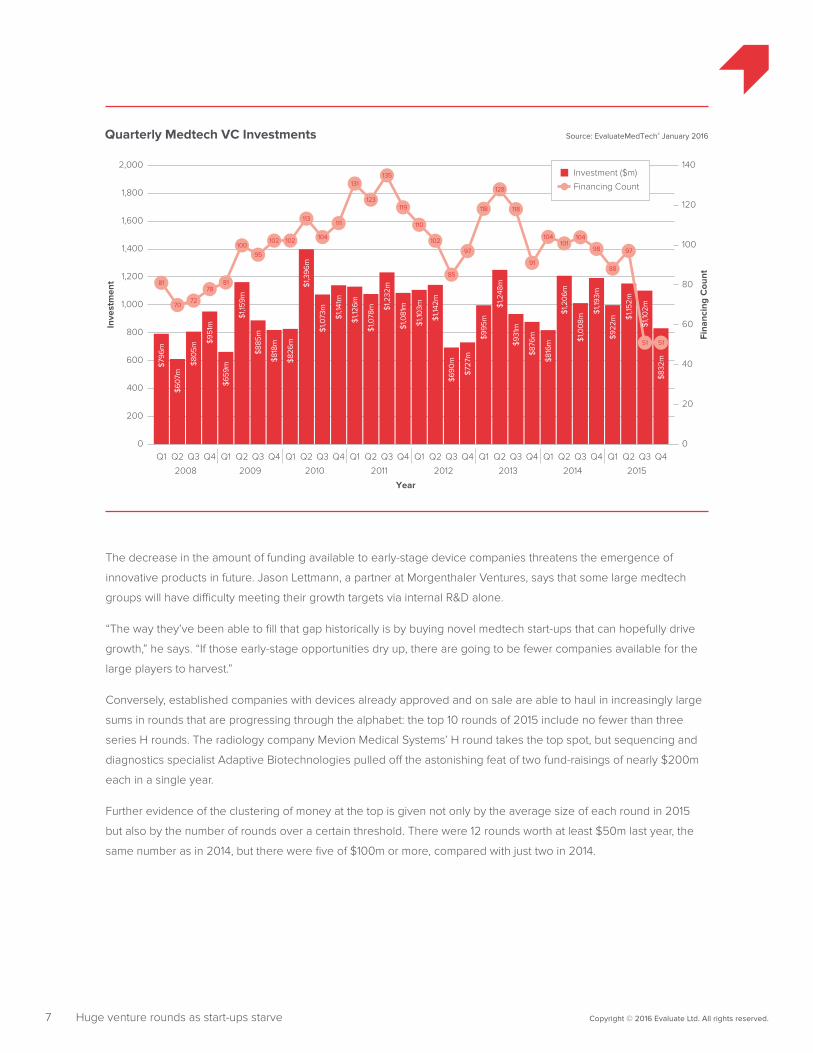
7 Copyright © 2016 Evaluate Ltd. All rights reserved.Huge venture rounds as start-ups starve
1,000
800
600
400
200
Source: EvaluateMedTech® January 2016Quarterly Medtech VC Investments
Inve
stm
ent
Fina
ncin
g C
ount
1,400
1,200
1,600
1,800
2,000 140
120
100
80
60
40
20
0
Investment ($m)
Financing Count
Year
2008 2009 2010 2011 2012 2013 2014 2015
Q1
81
Q2
70
Q3
72
Q4
78
Q1
81
Q2
100
Q3
95
Q4
102
Q1
102
Q2
113
Q3
104
Q4
111
Q1
131
Q2
123
Q3
135
Q4
119
Q1
110
Q2
102
Q3
85
Q4
97
Q1
118
Q2
128
Q3
118
Q4
91
Q1
104
Q2
101
Q3
104
Q4
98
Q1
88
Q2
97
Q3
51
Q4
$796
m
$607
m
$805
m $951
m
$659
m
$1,15
9m
$885
m
$818
m
$826
m
$1,3
96m
$1,0
73m
$1,14
1m
$1,12
6m
$1,0
78m $1
,232
m
$1,0
81m
$1,10
3m
$1,14
2m
$690
m
$727
m
$995
m
$1,2
48m
$931
m
$876
m
$816
m
$1,2
06m
$1,0
08m
$1,19
3m
$922
m $1,15
2m
$1,10
2m
$832
m
51
0
The decrease in the amount of funding available to early-stage device companies threatens the emergence of
innovative products in future. Jason Lettmann, a partner at Morgenthaler Ventures, says that some large medtech
groups will have difficulty meeting their growth targets via internal R&D alone.
“The way they’ve been able to fill that gap historically is by buying novel medtech start-ups that can hopefully drive
growth,” he says. “If those early-stage opportunities dry up, there are going to be fewer companies available for the
large players to harvest.”
Conversely, established companies with devices already approved and on sale are able to haul in increasingly large
sums in rounds that are progressing through the alphabet: the top 10 rounds of 2015 include no fewer than three
series H rounds. The radiology company Mevion Medical Systems’ H round takes the top spot, but sequencing and
diagnostics specialist Adaptive Biotechnologies pulled off the astonishing feat of two fund-raisings of nearly $200m
each in a single year.
Further evidence of the clustering of money at the top is given not only by the average size of each round in 2015
but also by the number of rounds over a certain threshold. There were 12 rounds worth at least $50m last year, the
same number as in 2014, but there were five of $100m or more, compared with just two in 2014.
8 Copyright © 2016 Evaluate Ltd. All rights reserved.
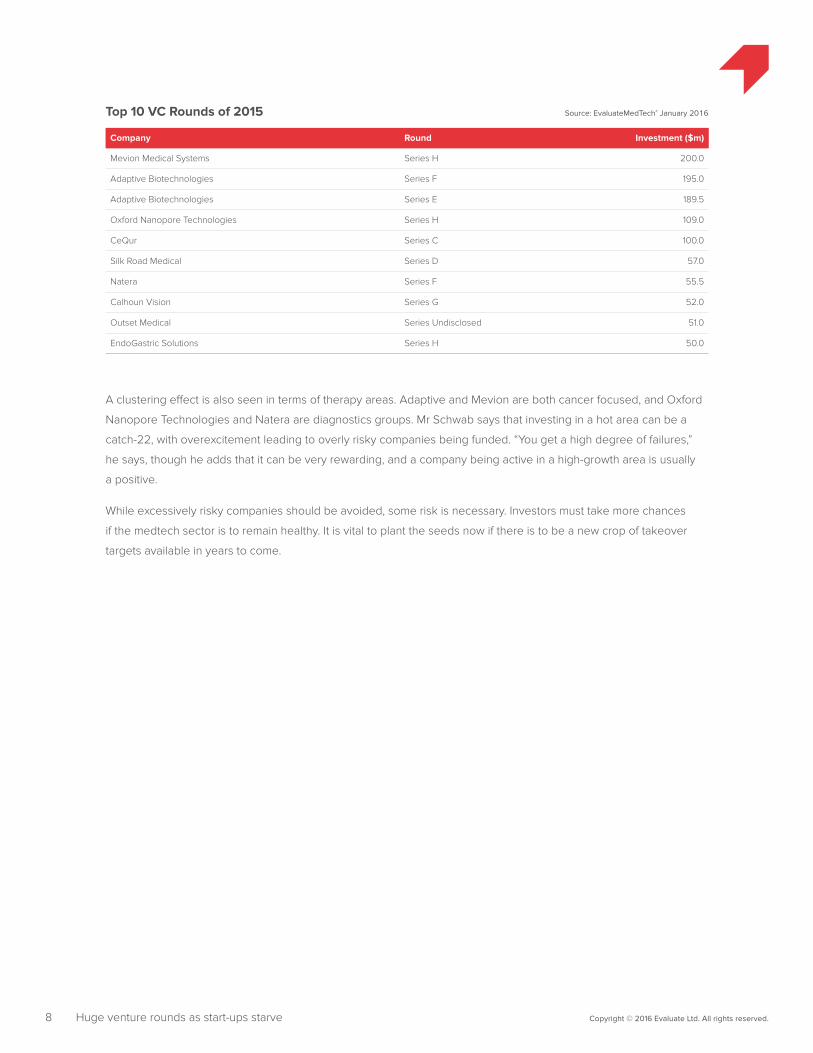
Company Round Investment ($m)
Mevion Medical Systems Series H 200.0
Adaptive Biotechnologies Series F 195.0
Adaptive Biotechnologies Series E 189.5
Oxford Nanopore Technologies Series H 109.0
CeQur Series C 100.0
Silk Road Medical Series D 57.0
Natera Series F 55.5
Calhoun Vision Series G 52.0
Outset Medical Series Undisclosed 51.0
EndoGastric Solutions Series H 50.0
Top 10 VC Rounds of 2015 Source: EvaluateMedTech® January 2016
Huge venture rounds as start-ups starve
A clustering effect is also seen in terms of therapy areas. Adaptive and Mevion are both cancer focused, and Oxford
Nanopore Technologies and Natera are diagnostics groups. Mr Schwab says that investing in a hot area can be a
catch-22, with overexcitement leading to overly risky companies being funded. “You get a high degree of failures,”
he says, though he adds that it can be very rewarding, and a company being active in a high-growth area is usually
a positive.
While excessively risky companies should be avoided, some risk is necessary. Investors must take more chances
if the medtech sector is to remain healthy. It is vital to plant the seeds now if there is to be a new crop of takeover
targets available in years to come.
9 Copyright © 2016 Evaluate Ltd. All rights reserved.
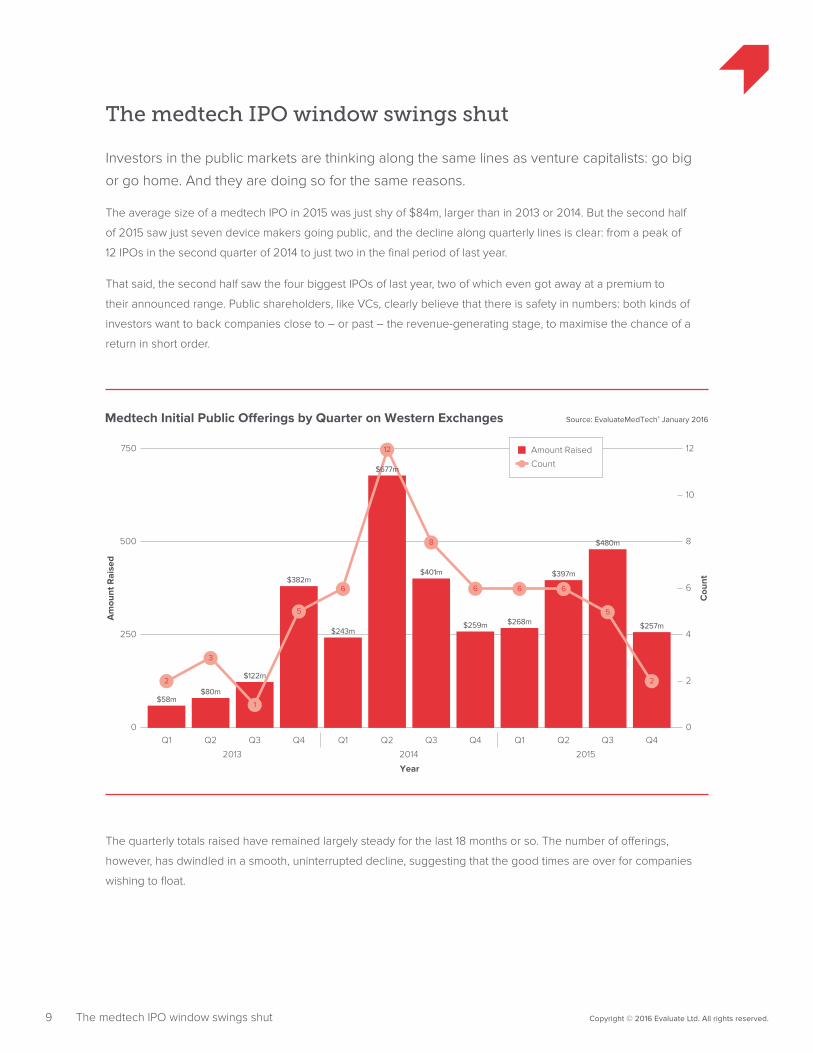
The medtech IPO window swings shut
Investors in the public markets are thinking along the same lines as venture capitalists: go big
or go home. And they are doing so for the same reasons.
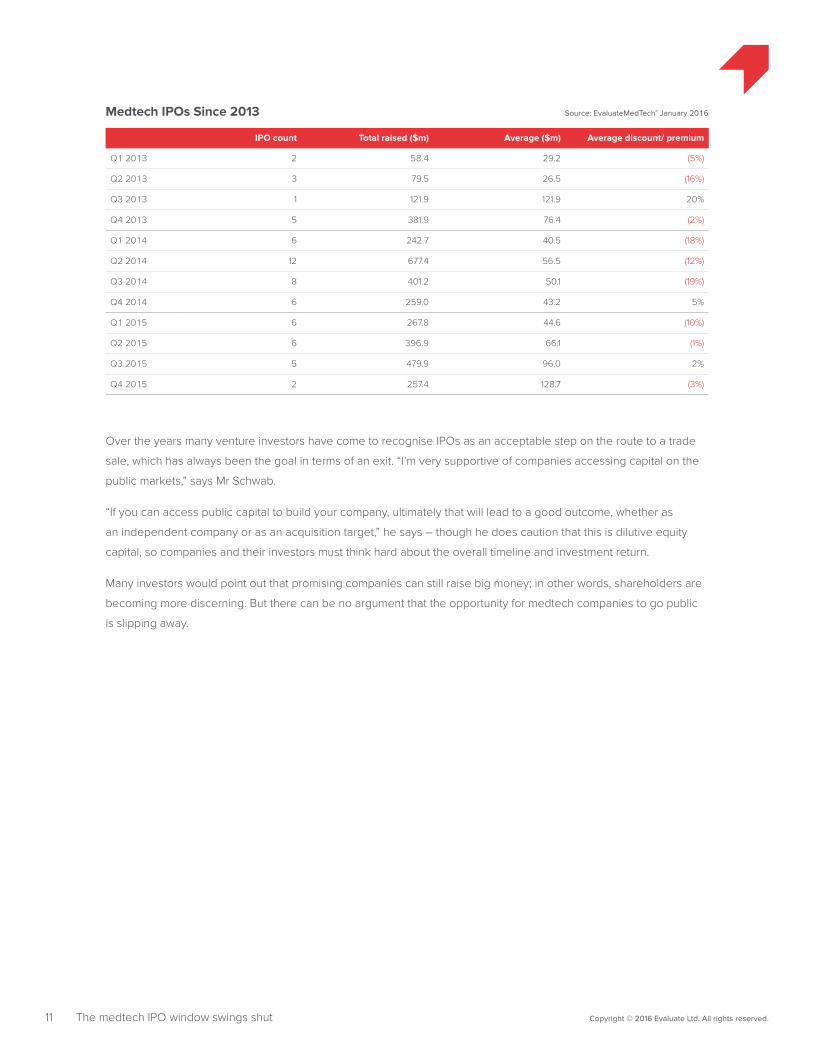
The average size of a medtech IPO in 2015 was just shy of $84m, larger than in 2013 or 2014. But the second half
of 2015 saw just seven device makers going public, and the decline along quarterly lines is clear: from a peak of
12 IPOs in the second quarter of 2014 to just two in the final period of last year.
That said, the second half saw the four biggest IPOs of last year, two of which even got away at a premium to
their announced range. Public shareholders, like VCs, clearly believe that there is safety in numbers: both kinds of
investors want to back companies close to – or past – the revenue-generating stage, to maximise the chance of a
return in short order.
Source: EvaluateMedTech® January 2016Medtech Initial Public O�erings by Quarter on Western Exchanges
Am
ount
Rai
sed
Cou
nt
250
500
750 12
10
8
6
4
2
00
Amount Raised
Count
2013 2014 2015
Year
Q1
$58m
Q2
$80m
Q3
$122m
Q4
$382m
Q1
$243m
Q2 Q3
$401m
Q4
$259m
Q1
$268m
Q2
$397m
Q3
$480m
Q4
$257m
2
3
1
5
6
12
8
6 6 6
5
2
$677m
The medtech IPO window swings shut
The quarterly totals raised have remained largely steady for the last 18 months or so. The number of offerings,
however, has dwindled in a smooth, uninterrupted decline, suggesting that the good times are over for companies
wishing to float.

10 Copyright © 2016 Evaluate Ltd. All rights reserved.
Company Amount Raised ($m) Offering Price Discount/Premium 2015 YE Chg Since Float
Natera 180 $18.00 13% (40%)
Novocure 165 $22.00 (6%) (34%)
ConforMIS 135 $15.00 0% 15%
Penumbra 120 $30.00 13% 79%
Biocartis 109 €11.50 7% 15%
Glaukos 108 $18.00 9% 37%
Advanced Accelerator Applications 92 $16.00 0% 95%
Entellus Medical 78 $17.00 6% (1%)
Avinger 65 $13.00 0% 75%
Carbylan Therapeutics 65 $5.00 0% (28%)
Average across top 10 IPOs 112 - 4% 21%
Average across all 19 IPOs 74 - (3%) (4%)
Top 10 Medtech IPOs of 2015 Source: EvaluateMedTech® January 2016
The medtech IPO window swings shut
The poor performance of the Nasdaq and other markets across 2015 – most medtech indices rose but nowhere near
as much as they have in previous years – has effectively shut the window. Only two offerings got away in the last
three months of 2015 and as of mid-February there have been no listings on Western exchanges this year either.
“As valuations fall that tends to make IPOs more problematic,” says William Blair’s Mr Scullion. “Generally for younger,
faster-growing companies that money’s no longer available for them.”
Once again it is start-ups that are caught with no way out: most buyers will not look at companies without approvals,
sales and reimbursement, and potential shareholders appear to have the same criteria.
“Unless you’ve got a revenue-stage company with strong growth prospects it’s almost impossible at this point,” says
5AM Ventures’ Mr Schwab.
This is reflected in the largest IPOs of 2015. Nasdaq-listed Novocure’s technology is FDA-approved for glioblastoma,
and Natera, which closed the largest IPO of the past three years when it scored $180m in July, also has sales in the US.
Morgenthaler Ventures’ Mr Lettmann strikes a more optimistic note. “I still think there’s going to be an appetite for
device companies,” he says. “Particularly companies that are revenue-stage and growing, I believe those companies
will always be able to go out regardless of the market.”
Natera’s success was not just due to being on the market – it also benefited from a takeout of one of its peers. Its
flagship technology is Panorama, which can diagnose foetal abnormalities by testing not the foetus’s blood but the
pregnant woman’s. This arena has been the subject of huge excitement since a group with a similar technology,
Ariosa Diagnostics, was taken out by Roche at the end of 2014.
With IPOs increasingly regarded as financing events rather than exits in themselves, Natera’s venture investors are
doubtless keen on a similar outcome.
11 Copyright © 2016 Evaluate Ltd. All rights reserved.The medtech IPO window swings shut
IPO count Total raised ($m) Average ($m) Average discount/ premium
Q1 2013 2 58.4 29.2 (5%)
Q2 2013 3 79.5 26.5 (16%)
Q3 2013 1 121.9 121.9 20%
Q4 2013 5 381.9 76.4 (2%)
Q1 2014 6 242.7 40.5 (18%)
Q2 2014 12 677.4 56.5 (12%)
Q3 2014 8 401.2 50.1 (19%)
Q4 2014 6 259.0 43.2 5%
Q1 2015 6 267.8 44.6 (10%)
Q2 2015 6 396.9 66.1 (1%)
Q3 2015 5 479.9 96.0 2%
Q4 2015 2 257.4 128.7 (3%)
Medtech IPOs Since 2013 Source: EvaluateMedTech® January 2016
Over the years many venture investors have come to recognise IPOs as an acceptable step on the route to a trade
sale, which has always been the goal in terms of an exit. “I’m very supportive of companies accessing capital on the
public markets,” says Mr Schwab.
“If you can access public capital to build your company, ultimately that will lead to a good outcome, whether as
an independent company or as an acquisition target,” he says – though he does caution that this is dilutive equity
capital, so companies and their investors must think hard about the overall timeline and investment return.
Many investors would point out that promising companies can still raise big money; in other words, shareholders are
becoming more discerning. But there can be no argument that the opportunity for medtech companies to go public
is slipping away.
12 Copyright © 2016 Evaluate Ltd. All rights reserved.
Shares slip, though it could be worse
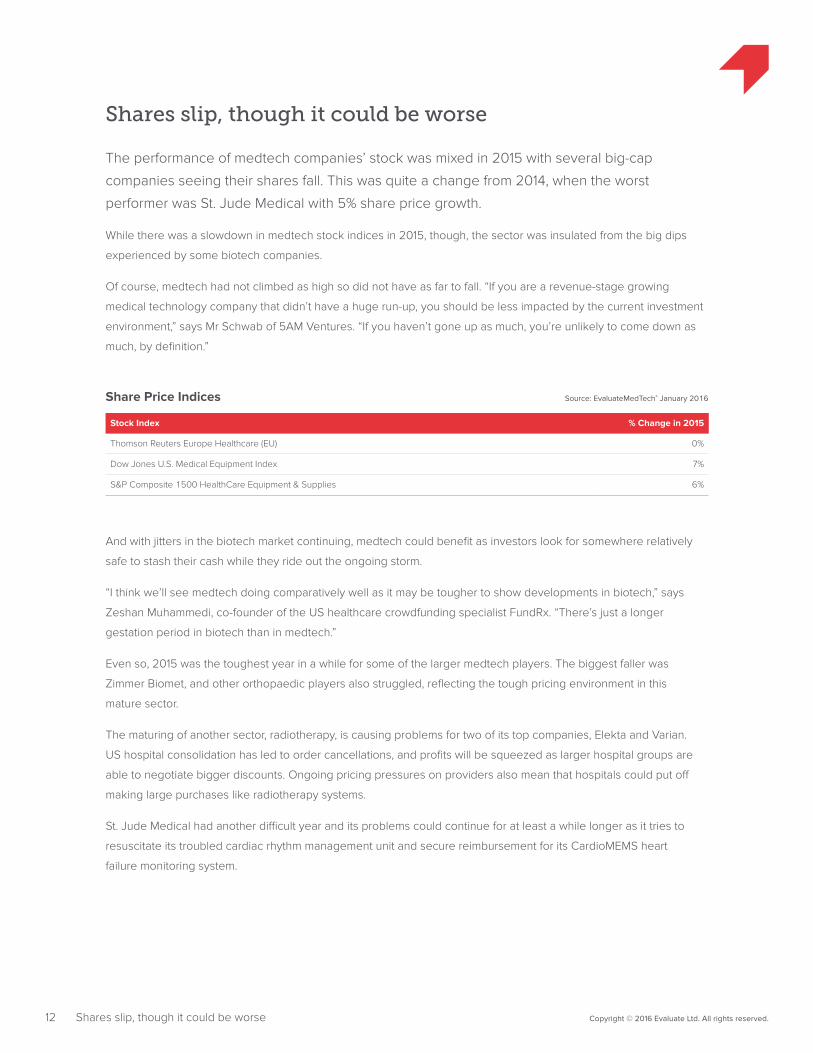
The performance of medtech companies’ stock was mixed in 2015 with several big-cap
companies seeing their shares fall. This was quite a change from 2014, when the worst
performer was St. Jude Medical with 5% share price growth.
While there was a slowdown in medtech stock indices in 2015, though, the sector was insulated from the big dips
experienced by some biotech companies.
Of course, medtech had not climbed as high so did not have as far to fall. “If you are a revenue-stage growing
medical technology company that didn’t have a huge run-up, you should be less impacted by the current investment
environment,” says Mr Schwab of 5AM Ventures. “If you haven’t gone up as much, you’re unlikely to come down as
much, by definition.”
Stock Index % Change in 2015
Thomson Reuters Europe Healthcare (EU) 0%
Dow Jones U.S. Medical Equipment Index 7%
S&P Composite 1500 HealthCare Equipment & Supplies 6%
Share Price Indices Source: EvaluateMedTech® January 2016
Shares slip, though it could be worse
And with jitters in the biotech market continuing, medtech could benefit as investors look for somewhere relatively
safe to stash their cash while they ride out the ongoing storm.
“I think we’ll see medtech doing comparatively well as it may be tougher to show developments in biotech,” says
Zeshan Muhammedi, co-founder of the US healthcare crowdfunding specialist FundRx. “There’s just a longer
gestation period in biotech than in medtech.”
Even so, 2015 was the toughest year in a while for some of the larger medtech players. The biggest faller was
Zimmer Biomet, and other orthopaedic players also struggled, reflecting the tough pricing environment in this
mature sector.
The maturing of another sector, radiotherapy, is causing problems for two of its top companies, Elekta and Varian.
US hospital consolidation has led to order cancellations, and profits will be squeezed as larger hospital groups are
able to negotiate bigger discounts. Ongoing pricing pressures on providers also mean that hospitals could put off
making large purchases like radiotherapy systems.
St. Jude Medical had another difficult year and its problems could continue for at least a while longer as it tries to
resuscitate its troubled cardiac rhythm management unit and secure reimbursement for its CardioMEMS heart
failure monitoring system.
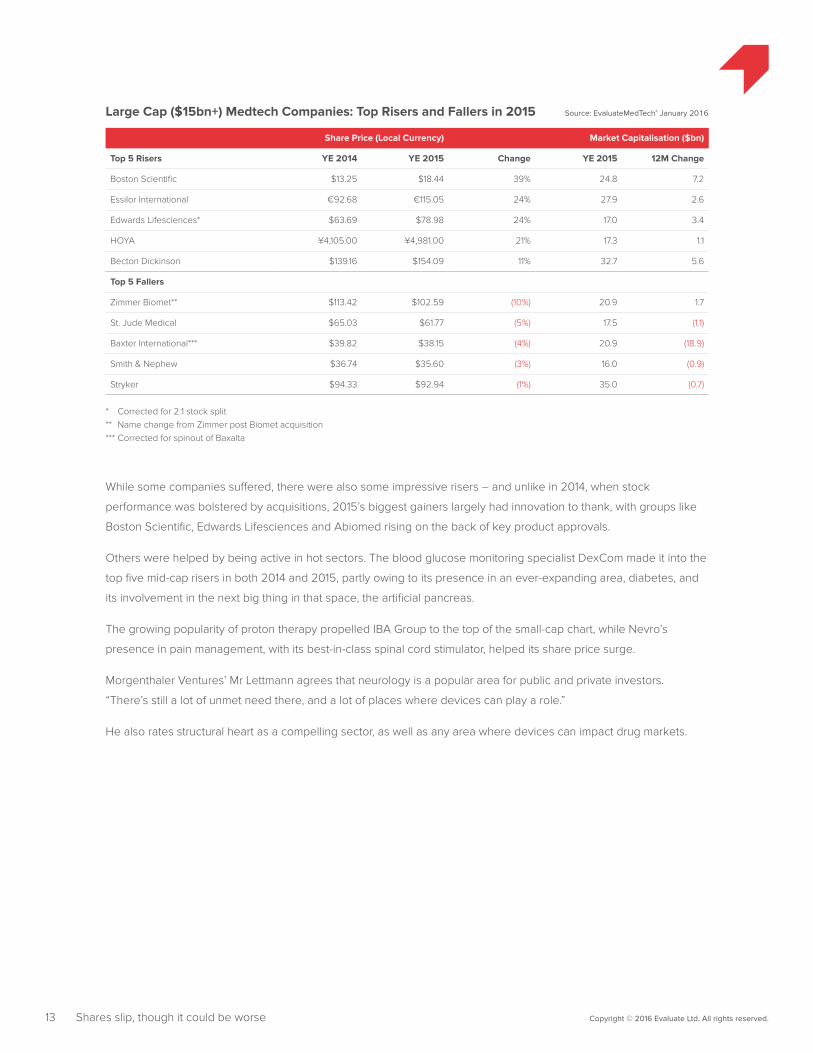
Share Price (Local Currency) Market Capitalisation ($bn)
Top 5 Risers YE 2014 YE 2015 Change YE 2015 12M Change
Boston Scientific $13.25 $18.44 39% 24.8 7.2
Essilor International €92.68 €115.05 24% 27.9 2.6
Edwards Lifesciences* $63.69 $78.98 24% 17.0 3.4
HOYA ¥4,105.00 ¥4,981.00 21% 17.3 1.1
Becton Dickinson $139.16 $154.09 11% 32.7 5.6
Top 5 Fallers
Zimmer Biomet** $113.42 $102.59 (10%) 20.9 1.7
St. Jude Medical $65.03 $61.77 (5%) 17.5 (1.1)
Baxter International*** $39.82 $38.15 (4%) 20.9 (18.9)
Smith & Nephew $36.74 $35.60 (3%) 16.0 (0.9)
Stryker $94.33 $92.94 (1%) 35.0 (0.7)
Large Cap ($15bn+) Medtech Companies: Top Risers and Fallers in 2015 Source: EvaluateMedTech® January 2016
* Corrected for 2:1 stock split** Name change from Zimmer post Biomet acquisition*** Corrected for spinout of Baxalta
13 Copyright © 2016 Evaluate Ltd. All rights reserved.Shares slip, though it could be worse
While some companies suffered, there were also some impressive risers – and unlike in 2014, when stock
performance was bolstered by acquisitions, 2015’s biggest gainers largely had innovation to thank, with groups like
Boston Scientific, Edwards Lifesciences and Abiomed rising on the back of key product approvals.
Others were helped by being active in hot sectors. The blood glucose monitoring specialist DexCom made it into the
top five mid-cap risers in both 2014 and 2015, partly owing to its presence in an ever-expanding area, diabetes, and
its involvement in the next big thing in that space, the artificial pancreas.
The growing popularity of proton therapy propelled IBA Group to the top of the small-cap chart, while Nevro’s
presence in pain management, with its best-in-class spinal cord stimulator, helped its share price surge.
Morgenthaler Ventures’ Mr Lettmann agrees that neurology is a popular area for public and private investors.
“There’s still a lot of unmet need there, and a lot of places where devices can play a role.”
He also rates structural heart as a compelling sector, as well as any area where devices can impact drug markets.
14 Copyright © 2016 Evaluate Ltd. All rights reserved.Shares slip, though it could be worse
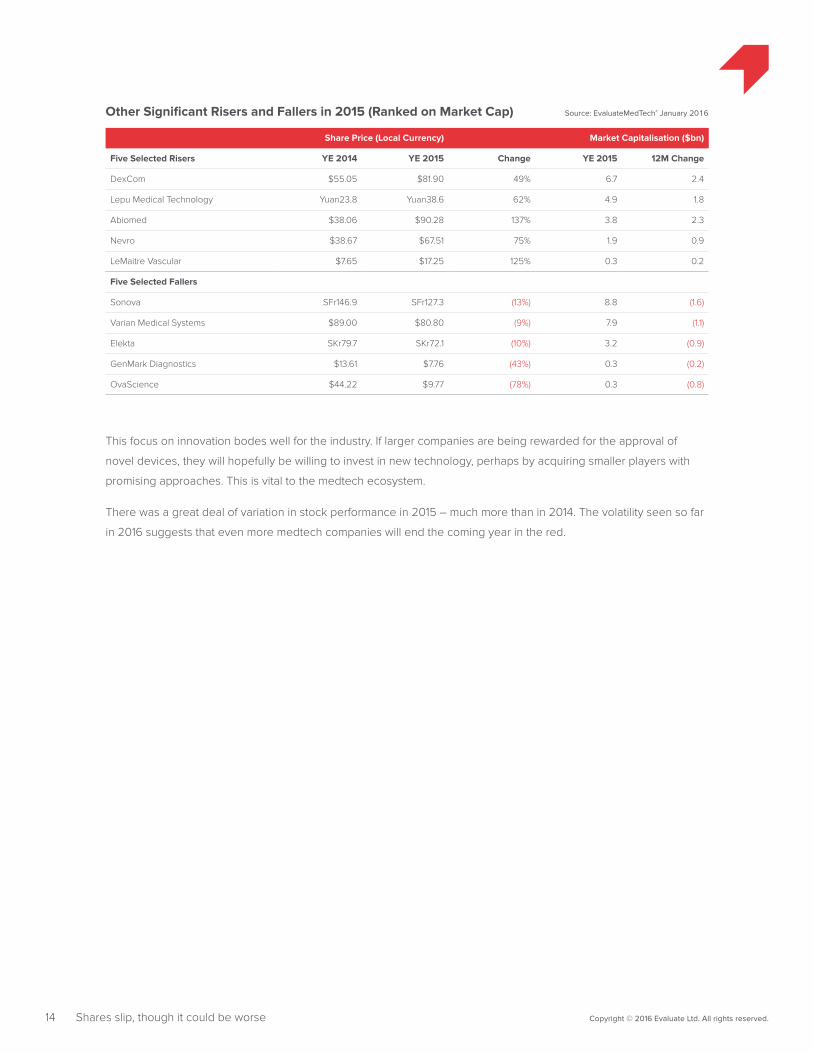
Share Price (Local Currency) Market Capitalisation ($bn)
Five Selected Risers YE 2014 YE 2015 Change YE 2015 12M Change
DexCom $55.05 $81.90 49% 6.7 2.4
Lepu Medical Technology Yuan23.8 Yuan38.6 62% 4.9 1.8
Abiomed $38.06 $90.28 137% 3.8 2.3
Nevro $38.67 $67.51 75% 1.9 0.9
LeMaitre Vascular $7.65 $17.25 125% 0.3 0.2
Five Selected Fallers
Sonova SFr146.9 SFr127.3 (13%) 8.8 (1.6)
Varian Medical Systems $89.00 $80.80 (9%) 7.9 (1.1)
Elekta SKr79.7 SKr72.1 (10%) 3.2 (0.9)
GenMark Diagnostics $13.61 $7.76 (43%) 0.3 (0.2)
OvaScience $44.22 $9.77 (78%) 0.3 (0.8)
Other Significant Risers and Fallers in 2015 (Ranked on Market Cap) Source: EvaluateMedTech® January 2016
This focus on innovation bodes well for the industry. If larger companies are being rewarded for the approval of
novel devices, they will hopefully be willing to invest in new technology, perhaps by acquiring smaller players with
promising approaches. This is vital to the medtech ecosystem.
There was a great deal of variation in stock performance in 2015 – much more than in 2014. The volatility seen so far
in 2016 suggests that even more medtech companies will end the coming year in the red.
15 Copyright © 2016 Evaluate Ltd. All rights reserved.
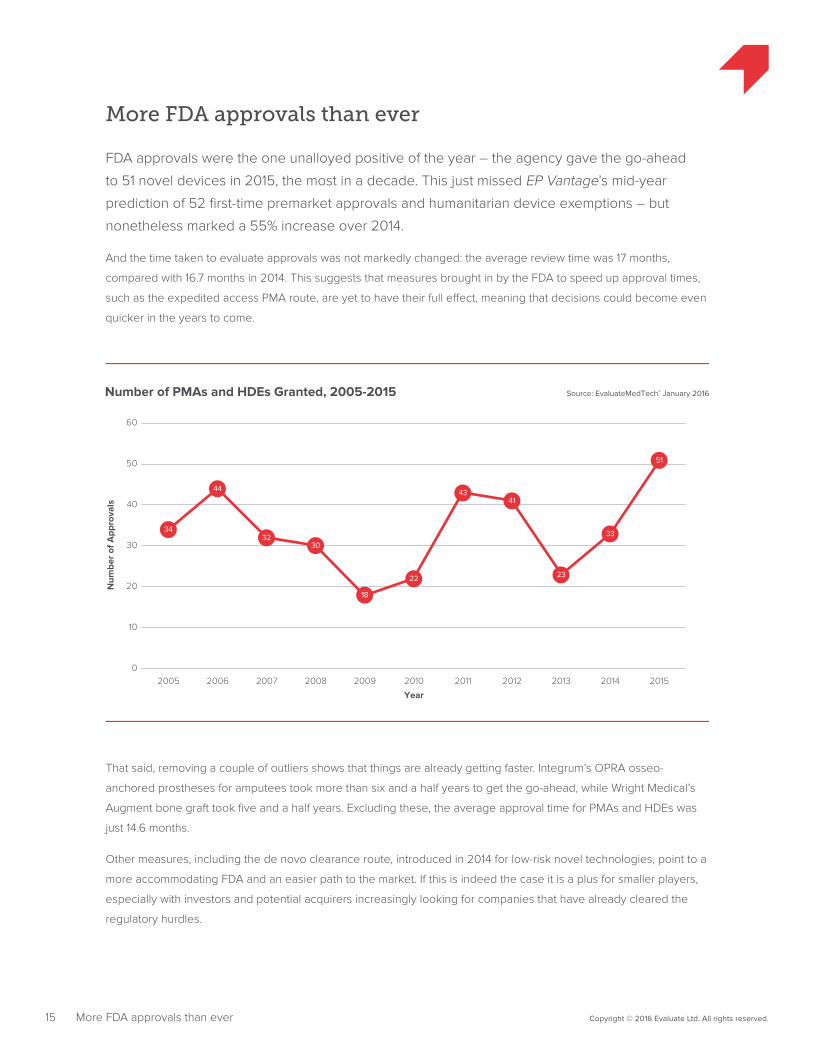
More FDA approvals than ever
FDA approvals were the one unalloyed positive of the year – the agency gave the go-ahead
to 51 novel devices in 2015, the most in a decade. This just missed EP Vantage’s mid-year
prediction of 52 first-time premarket approvals and humanitarian device exemptions – but
nonetheless marked a 55% increase over 2014.
And the time taken to evaluate approvals was not markedly changed: the average review time was 17 months,
compared with 16.7 months in 2014. This suggests that measures brought in by the FDA to speed up approval times,
such as the expedited access PMA route, are yet to have their full effect, meaning that decisions could become even
quicker in the years to come.
Source: EvaluateMedTech® January 2016Number of PMAs and HDEs Granted, 2005-2015
Num
ber
of A
ppro
vals
10
20
30
40
50
60
2005 2006 2007 2008 2009 2010 2011 2012 2013 2014 20150
Year
34
44
3230
18
22
4341
23
33
51
More FDA approvals than ever
That said, removing a couple of outliers shows that things are already getting faster. Integrum’s OPRA osseo-
anchored prostheses for amputees took more than six and a half years to get the go-ahead, while Wright Medical’s
Augment bone graft took five and a half years. Excluding these, the average approval time for PMAs and HDEs was
just 14.6 months.
Other measures, including the de novo clearance route, introduced in 2014 for low-risk novel technologies, point to a
more accommodating FDA and an easier path to the market. If this is indeed the case it is a plus for smaller players,
especially with investors and potential acquirers increasingly looking for companies that have already cleared the
regulatory hurdles.
16 Copyright © 2016 Evaluate Ltd. All rights reserved.More FDA approvals than ever
Arguably getting past the FDA is becoming easier. The dearth of funding for start-ups, however, likely means that
many smaller companies cannot secure the cash necessary to reach the filing stage.
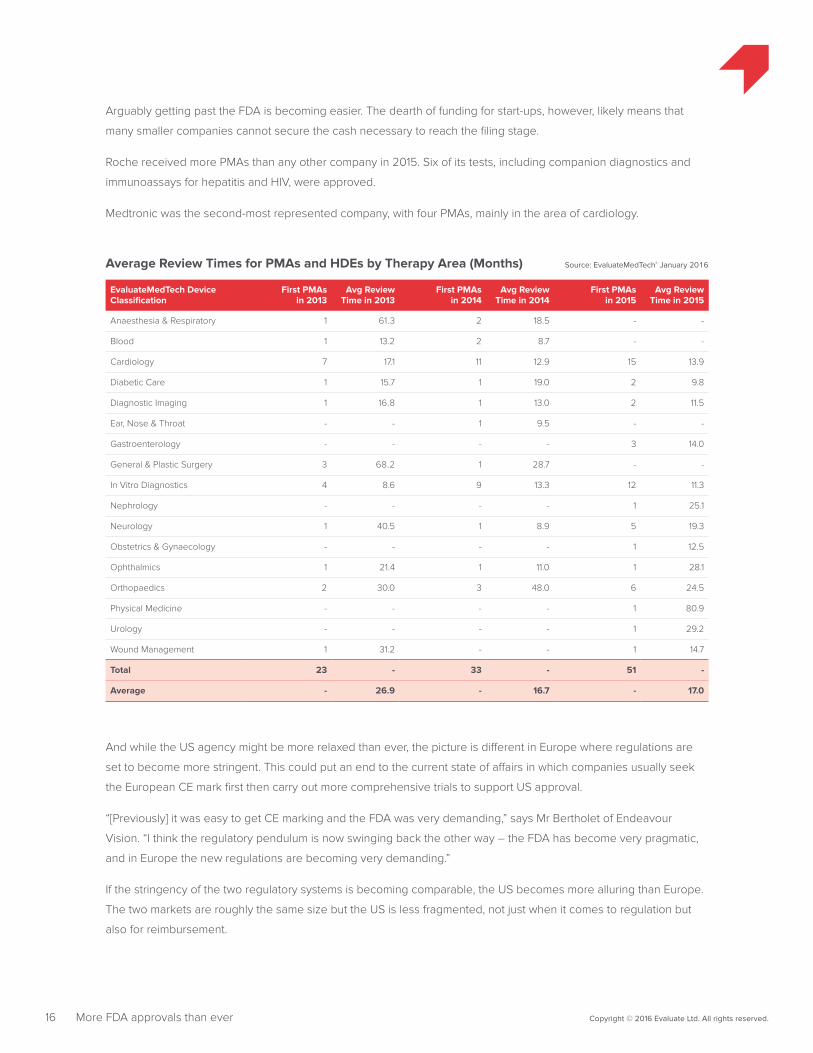
Roche received more PMAs than any other company in 2015. Six of its tests, including companion diagnostics and
immunoassays for hepatitis and HIV, were approved.
Medtronic was the second-most represented company, with four PMAs, mainly in the area of cardiology.
EvaluateMedTech Device Classification
First PMAs in 2013
Avg Review Time in 2013
First PMAs in 2014
Avg Review Time in 2014
First PMAs in 2015
Avg Review Time in 2015
Anaesthesia & Respiratory 1 61.3 2 18.5 - -
Blood 1 13.2 2 8.7 - -
Cardiology 7 17.1 11 12.9 15 13.9
Diabetic Care 1 15.7 1 19.0 2 9.8
Diagnostic Imaging 1 16.8 1 13.0 2 11.5
Ear, Nose & Throat - - 1 9.5 - -
Gastroenterology - - - - 3 14.0
General & Plastic Surgery 3 68.2 1 28.7 - -
In Vitro Diagnostics 4 8.6 9 13.3 12 11.3
Nephrology - - - - 1 25.1
Neurology 1 40.5 1 8.9 5 19.3
Obstetrics & Gynaecology - - - - 1 12.5
Ophthalmics 1 21.4 1 11.0 1 28.1
Orthopaedics 2 30.0 3 48.0 6 24.5
Physical Medicine - - - - 1 80.9
Urology - - - - 1 29.2
Wound Management 1 31.2 - - 1 14.7
Total 23 - 33 - 51 -
Average - 26.9 - 16.7 - 17.0
Average Review Times for PMAs and HDEs by Therapy Area (Months) Source: EvaluateMedTech® January 2016
And while the US agency might be more relaxed than ever, the picture is different in Europe where regulations are
set to become more stringent. This could put an end to the current state of affairs in which companies usually seek
the European CE mark first then carry out more comprehensive trials to support US approval.
“[Previously] it was easy to get CE marking and the FDA was very demanding,” says Mr Bertholet of Endeavour
Vision. “I think the regulatory pendulum is now swinging back the other way – the FDA has become very pragmatic,
and in Europe the new regulations are becoming very demanding.”
If the stringency of the two regulatory systems is becoming comparable, the US becomes more alluring than Europe.
The two markets are roughly the same size but the US is less fragmented, not just when it comes to regulation but
also for reimbursement.

17 Copyright © 2016 Evaluate Ltd. All rights reserved.More FDA approvals than ever
Traditionally companies target CE mark first for their devices, taking the easier path to bring in revenue to keep them
going while negotiating the relatively lengthy and expensive US regulatory system. A change to this well-established
pattern could deprive young companies of a way of staying afloat.
Not all sectors are created equal when it comes to getting the FDA’s blessing. As in previous years, the cardiology
market saw the most approvals – 15 – while in vitro diagnostics was in second place with 12.
Source: EvaluateMedTech® January 2016First-time PMAs and HDEs by Therapy Area
Num
ber
of A
ppro
vals
2
4
6
12
10
8
16
14
2013 2014 2015
Car
diol
ogy
Blo
od
Ana
esth
esia
& R
espi
rato
ry
Ear,
Nos
e&
Thr
oat
Dia
gnos
ticIm
agin
g
Dia
betic
Car
e
In V
itro
Dia
gnos
tics
Gen
eral
&Pl
astic
Sur
gery
Gas
troen
tero
logy
Obs
tetri
cs &
Gyn
aeco
logy
Neu
rolo
gy
Nep
hrol
ogy
Phys
ical
Med
icin
e
Orth
opae
dics
Wou
ndM
anag
emen
t
Uro
logy
Oph
thal
mic
s
0
Cardiology and IVD approvals were also faster than the overall average, suggesting that the agency was keen to get
these products onto the market.
Concerns have been raised this year that the increasing pace at the agency could allow unsafe technologies onto
the market. But medtech companies will not be complaining. While doom pervades the sector the increase in FDA
approvals and the short time it took to get these were rare positives in 2015.
18 Copyright © 2016 Evaluate Ltd. All rights reserved.Where now?
Where now?
The only surprise in the device sector in 2015 is the degree to which the trends already long
evident have become even more entrenched.
The venture crisis is only becoming more pronounced, and eventually its effects will be felt in a big way: as more
start-ups fall by the wayside, unable to find the money to sustain themselves, fewer disruptive technologies will be
available for acquisition, and larger groups will be unable to sustain their growth rates.
As of mid-February 2016 there had already been five billion-dollar acquisitions, aimed either at building a wider
product range to help absorb the kind of discounts demanded by payers and providers, or at shifting a company’s
focus into areas of higher margins or greater demand. The number of tech-focused acquisitions of young companies
continues to drop: perhaps the groups at the top of the sector are already seeing the first consequences of the VC
downturn.
There appears to be little sign of the markets improving; device indices are down between 4% and 10% year to date.
It is hardly a surprise that not a single medtech company has yet braved Western stock exchanges so far this year.
The industry can at least hope that the sharp upward trend in FDA approvals seen over the past two years will
continue at the same rate. If it does, 2016 could see 70 or more novel devices reach the US.
But even then the majority of the approvals would go to established companies – those best able to afford them and,
in a sense, least in need of them.
Report authors: Elizabeth Cairns and Madeleine Armstrong

Additional complimentary copies of this report can be downloaded at: www.evaluategroup.com/Medtech2105Review
Evaluate Headquarters Evaluate Ltd. 1 1 -29 Fashion Street London E1 6PX United Kingdom T +44 (0)20 7377 0800 F +44 (0)20 7539 1801
Evaluate North America EvaluatePharma USA Inc. 15 Broad Street, Suite 401 Boston, MA 02109, USA T +1 617 573 9450 F +1 617 573 9542
Evaluate Japan Evaluate Japan KK Akasaka Garden City 4F 4-15-1 Akasaka, Minato-ku Tokyo 107-0052, Japan T +81 (0)80 1164 4754
www.evaluate.com
Established in 1996, Evaluate Ltd is the trusted leader in high quality life science sector analysis and consensus forecasts to 2020. Evaluate’s team of expert analysts transform life science information into insights so companies can perform well.
EvaluatePharma® delivers exclusive consensus sales forecasts and trusted commercial insight into biotech and pharmaceutical performance.
@EvaluatePharma
EvaluateMedTech® sets a new standard in commercial analysis and consensus forecasts of the global medical device and diagnostic industry.
@EvaluateMedTech
EvaluateClinical Trials® delivers unique clinical trial intelligence expertly curated to efficiently analyse the global clinical trial landscape.
@EPClinicalTrial
EP Vantage an award winning editorial team, provides daily commentary and analysis with fresh perspectives and insight into current and future industry trends.
@EPVantage
Evaluate Custom Services provides customised solutions to help you access, analyse and manage the information you need to support effective decision-making.
The Evaluate services enable the life science community to make sound business decisions about value and opportunity.


![[MR15] ハードコア デバッギング ~ Windows のアプリケーション運用トラブルシューティング実践](https://img.pdfslide.net/doc/110x75/5a6478857f8b9a27568b462f/mr15-windows-.jpg)