Embed Size (px)
Citation preview
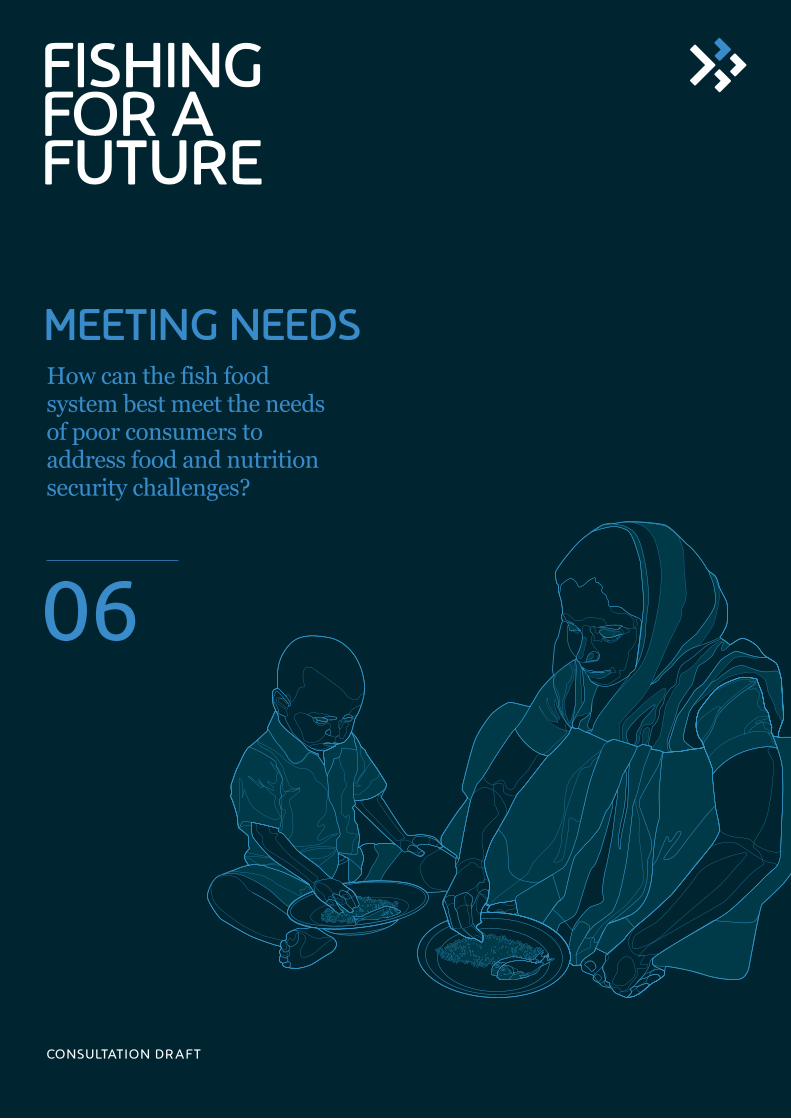
Meet ing needs
CONSULTAT ION DRA F T
How can the fish food system best meet the needs of poor consumers to address food and nutrition security challenges?
06
Meet ing needs
06
How can the fish food system best meet the needs of poor consumers to address food and nutrition security challenges?
CONT ENT Page
06.01 C URRENT STAT E 1 What is the current global and regional pattern of demand for fisheries and aquaculture products to meet food and nutrition security needs of poor and malnourished consumers?
06.02 T RENdS A Nd ExpECTAT iONS 5 How is the need for fisheries and aquaculture products among poor and malnourished consumers likely to evolve? What are the key drivers of these trends?
06.03 KEY UNC ERTA iNT iES 6
What are the key uncertainties concerning the current and likely future trends in the needs of poor and malnourished consumers? How do these uncertainties differ by geographic region and sector?
06.04 KEY iSSUES 8 What are the key issues that need to be addressed to help meet the needs of poor and malnourished consumers of fish products? Why is this?
06.05 SUCC ESSES 10
Are there any examples or promising approaches that illustrate the ways in which problems in this area have been addressed successfully?
06.06 REF ERENC ES A Nd RELAT Ed REA diNG 12
A BOUT T H iS dOC UMENT
This briefing paper is part of a series aimed at providing accessible summaries of key issues for thefish food system. Combining empirical data summaries with informed opinion and perspective wehope that these papers will both inform and stimulate debate and dialogue among stakeholders.Each brief was prepared by the Fishing for a Future secretariat, drawing on opinions and analysisprovided by an expert in the topic area; this paper was prepared with support from Dr S. Hall.
Comments and critique are welcome and should be sent to [email protected].
1
What is the current global and regional pattern of demand for fisheries and aquaculture products to meet food and nutrition security needs of poor and malnourished consumers?
CURRent stAte 06.01Ref.
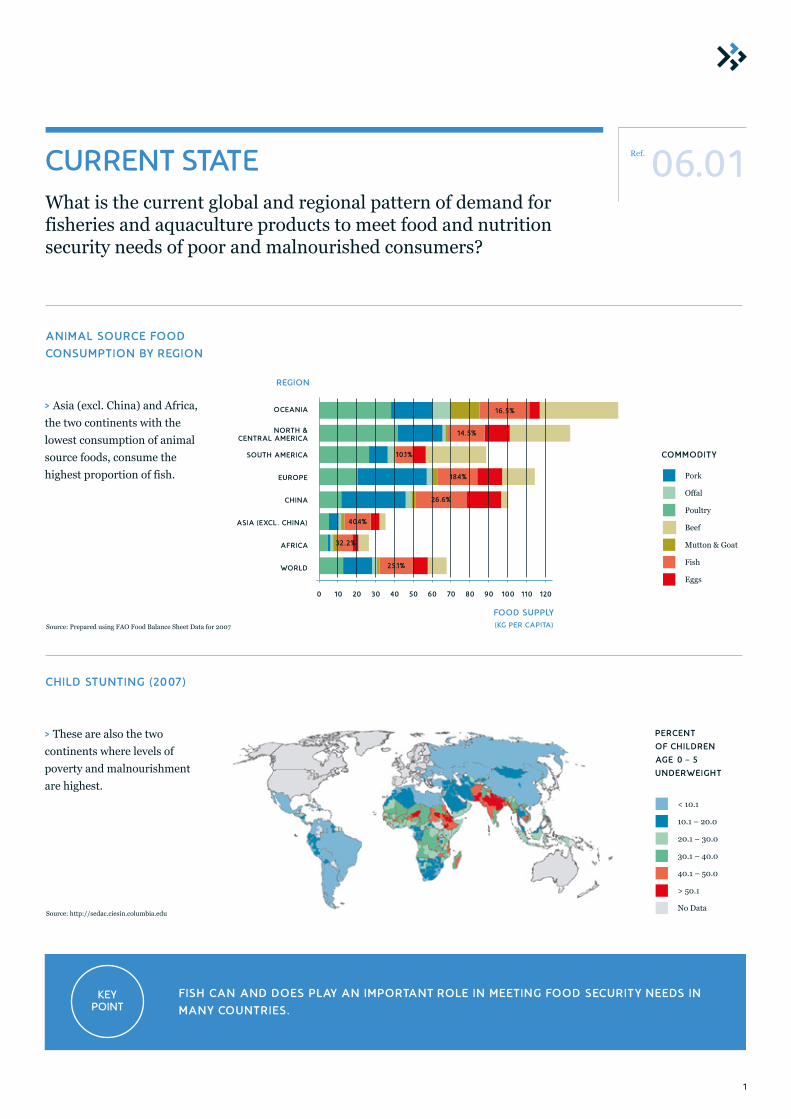
A NiMA L SOURC E FOOd
CONSUMpT iON BY REG iON
C HiLd ST UNT iNG (2007)
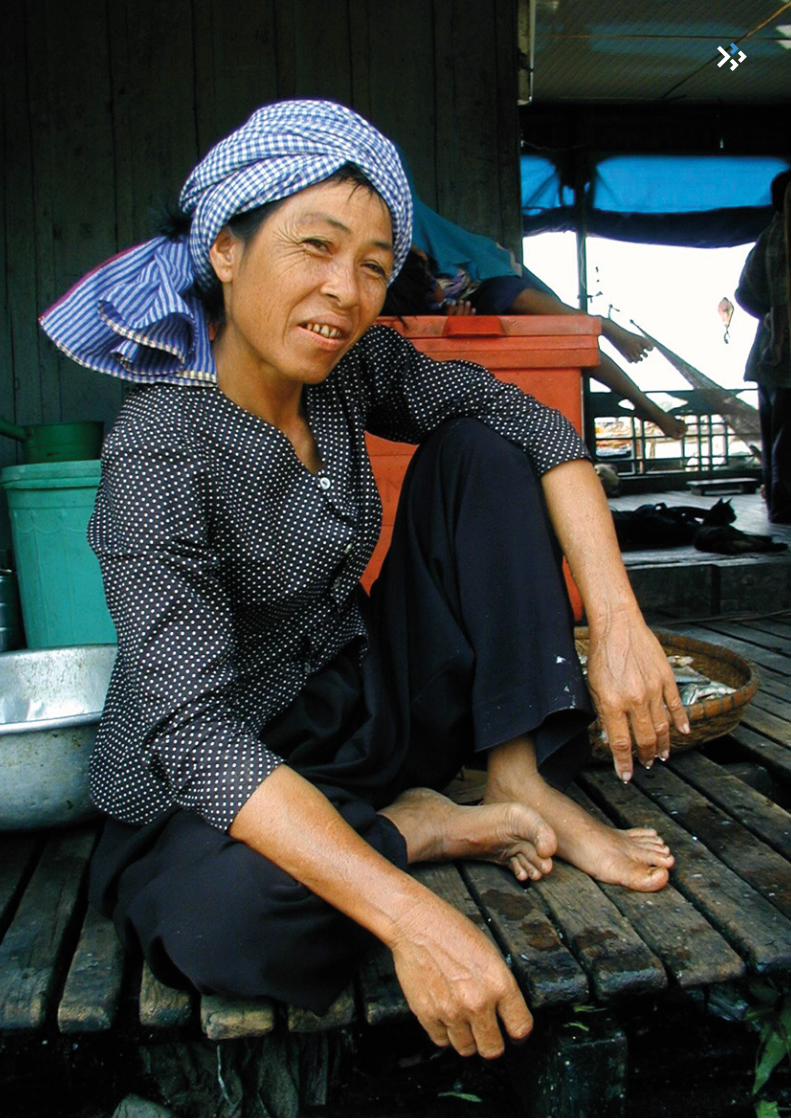
> Asia (excl. China) and Africa, the two continents with the lowest consumption of animal source foods, consume the highest proportion of fish.
> These are also the two continents where levels of poverty and malnourishment are highest.
Source: http://sedac.ciesin.columbia.edu
Source: Prepared using FAO Food Balance Sheet Data for 2007
pERCENT
OF CH iLdREN
AGE 0 – 5
UNdERwEiGHT
< 10.1
10.1 – 20.0
20.1 – 30.0
30.1 – 40.0
40.1 – 50.0
> 50.1
No Data
Pork
Offal
Poultry
Mutton & Goat
Beef
Fish
Eggs
COMMOdiTY
F iSH CA N A Nd dOES pLAY A N iMpORTA NT ROLE iN MEET iNG FOOd SEC UR iT Y NEEdS iN
MA NY COUNT R iES .KeY
POint
0 10 20 30 40 50 60 70 80 90 100 110 120
FOOd SUppLY ( KG pER CA piTA)
REGiON
OCEA NiA
NORT H & CENT RAL A MER iCA
SOUT H A MER iCA
EUROpE
CHiNA
ASiA (ExCL . CHiNA)
A FR iCA
wORLd
16.5%
14.5%
10.1%
18.4%
26.6%
40.4%
32.2%
25.1%
2
BR IEF ING PA PER 06 / MEEt ING NEEds
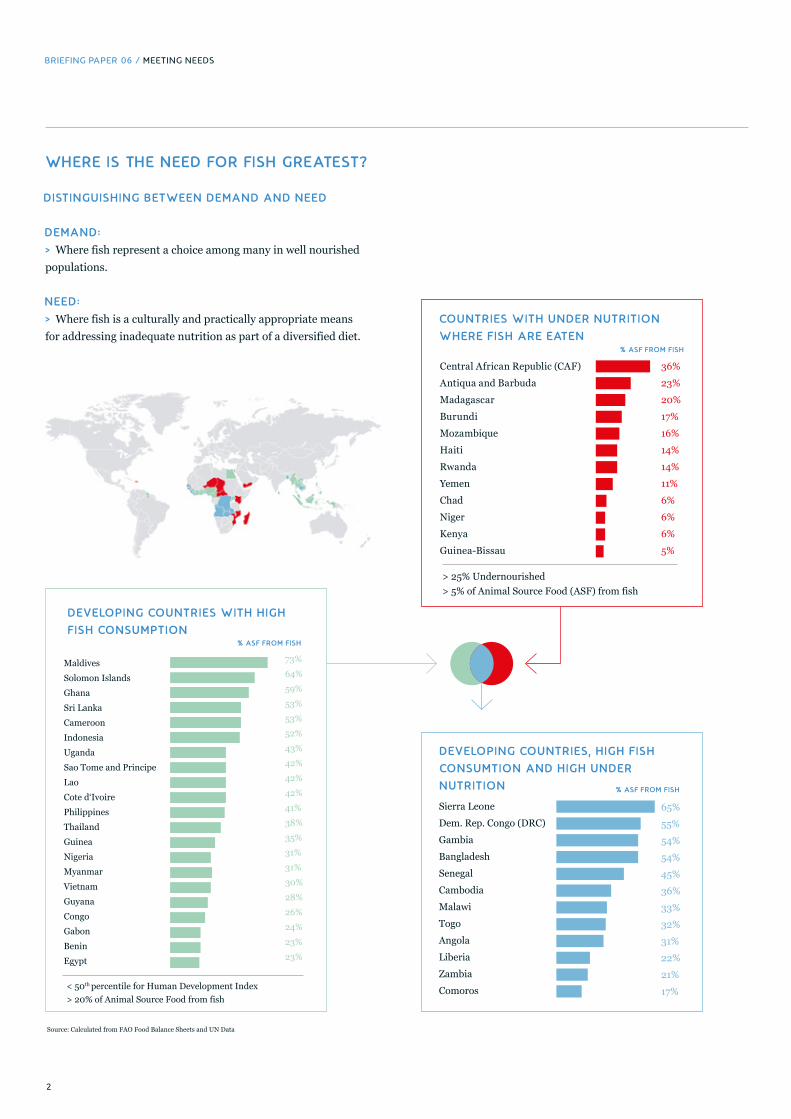
wHERE iS THE NEEd FOR F iSH GREATEST?
dEMA Nd:
> Where fish represent a choice among many in well nourished populations.
NEEd:
> Where fish is a culturally and practically appropriate means for addressing inadequate nutrition as part of a diversified diet.
diST iNGU iSH iNG BET w EEN dEMA Nd A Nd NEEd
% ASF FROM F iSH
% ASF FROM F iSH
% ASF FROM F iSH
dEv ELOp iNG COUNT R iES, H iGH F iSH
CONSUMT iON A Nd H iGH UNdER
NUT R iT iON
Sierra LeoneDem. Rep. Congo (DRC)GambiaBangladeshSenegalCambodiaMalawiTogoAngolaLiberiaZambiaComoros
65%55%54%54%45%36%33%32%31%22%21%17%
COUNT R iES w iT H UNdER NUT R iT iON
w HERE F iSH A RE EAT EN
Central African Republic (CAF)Antiqua and BarbudaMadagascarBurundiMozambiqueHaitiRwandaYemenChadNigerKenyaGuinea-Bissau
> 25% Undernourished> 5% of Animal Source Food (ASF) from fish
36%23%20%17%16%14%14%11%6%6%6%5%
73%64%59%53%53%52%43%42%42%42%41%38%35%31%31%30%28%26%24%23%23%
dEv ELOp iNG COUNT R iES w iT H H iGH
F iSH CONSUMpT iON
MaldivesSolomon IslandsGhanaSri LankaCameroonIndonesiaUgandaSao Tome and PrincipeLaoCote d‘IvoirePhilippinesThailandGuineaNigeriaMyanmarVietnamGuyanaCongoGabonBeninEgypt
< 50th percentile for Human Development Index> 20% of Animal Source Food from fish
Source: Calculated from FAO Food Balance Sheets and UN Data
3
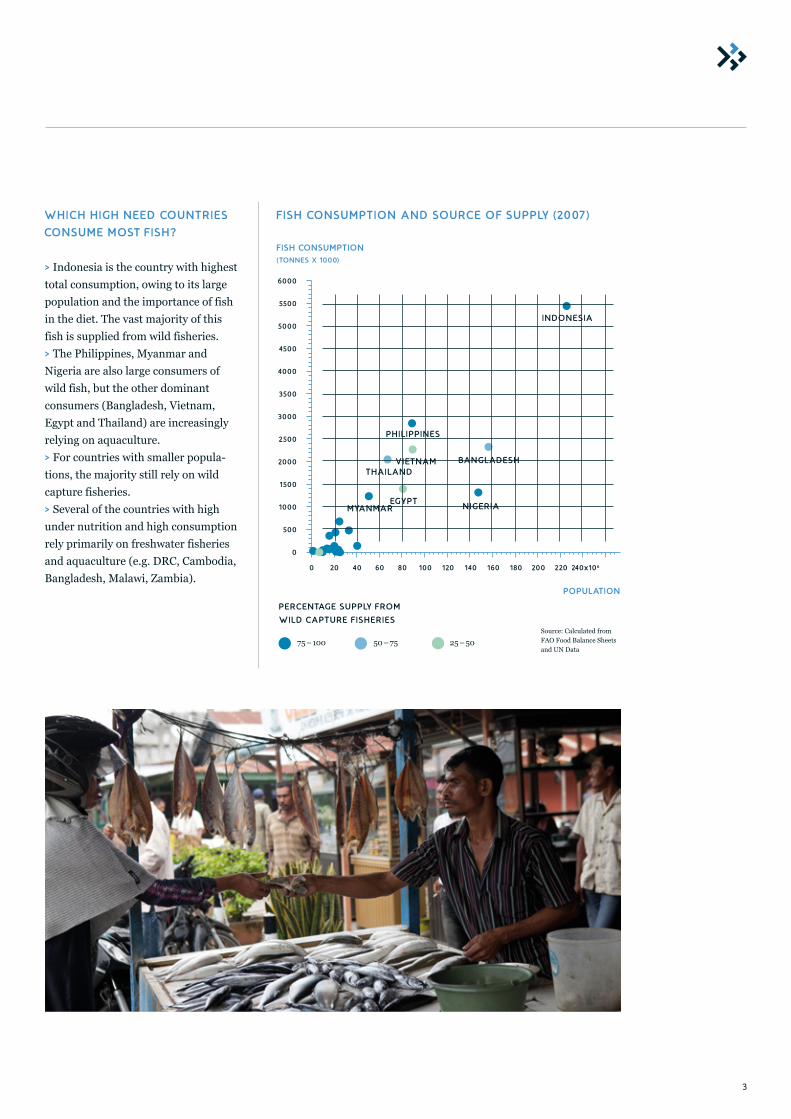
w HiC H H iGH NEEd COUNT R iES
CONSUME MOST F iSH?
> Indonesia is the country with highest total consumption, owing to its large population and the importance of fish in the diet. The vast majority of this fish is supplied from wild fisheries. > The Philippines, Myanmar and Nigeria are also large consumers of wild fish, but the other dominant consumers (Bangladesh, Vietnam, Egypt and Thailand) are increasingly relying on aquaculture. > For countries with smaller popula-tions, the majority still rely on wild capture fisheries.> Several of the countries with high under nutrition and high consumption rely primarily on freshwater fisheries and aquaculture (e.g. DRC, Cambodia, Bangladesh, Malawi, Zambia).
F iSH CONSUMpT iON A Nd SOURC E OF SUppLY (2007)
75 – 100 50 – 75 25 – 50
F iSH CONSUMpT iON (TONNES x 1000)
pOpULAT iON
6000
5500
5000
4500
4000
3500
3000
2500
2000
1500
1000
500
0
0 20 40 60 80 100 120 140 160 180 200 220 240x106
iNdONES iA
BA NGLA dESH
NiGER iA
pH iL ipp iNES
v iET NA MT HA iLA Nd
EGY pTMYA NMA R
pERC ENTAGE SUppLY F ROM
w iLd CA pT URE F iSHER iESSource: Calculated from FAO Food Balance Sheets and UN Data
5
06.02Ref.tRends And exPeCtAt iOnsHow is the need for fisheries and aquaculture products among poor and malnourished consumers likely to evolve? What are the key drivers of these trends?
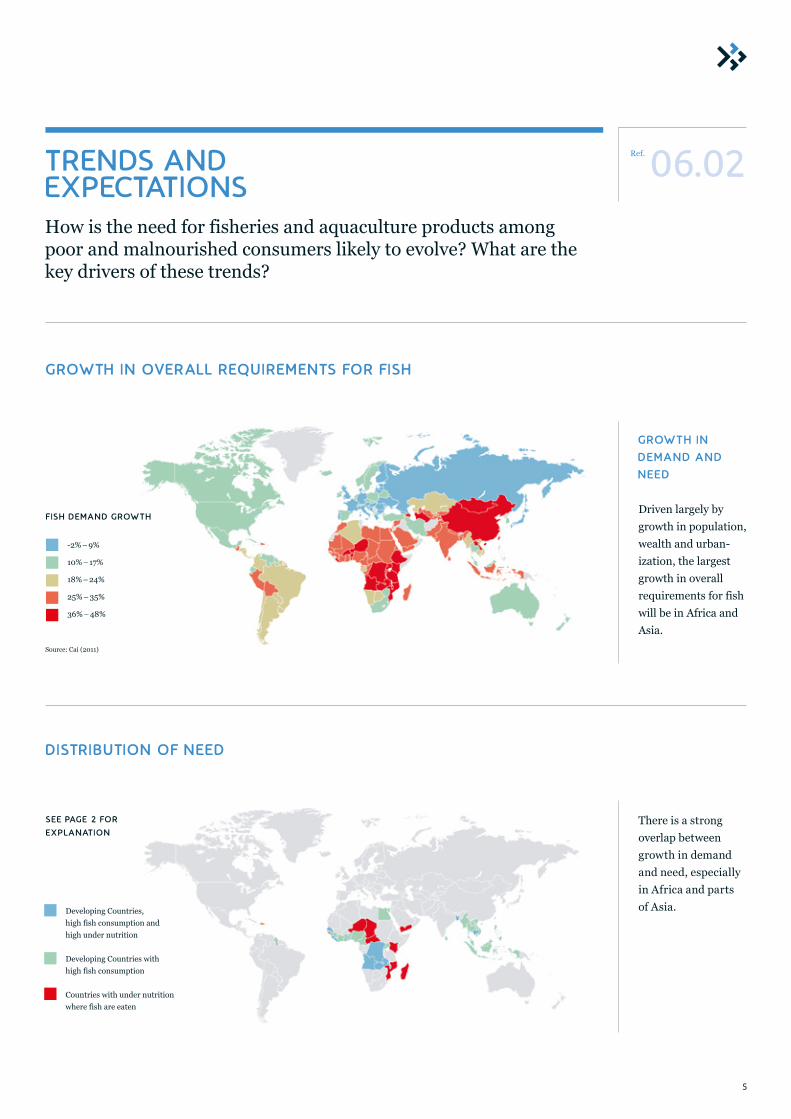
GROwTH iN OvERALL REqUiREMENTS FOR F iSH
diSTRiBUT iON OF NEEd
GROwT H iN
dEMA Nd A Nd
NEEd
Driven largely by growth in population, wealth and urban-ization, the largest growth in overall requirements for fish will be in Africa and Asia.
There is a strong overlap between growth in demand and need, especially in Africa and parts of Asia.
SEE pAGE 2 FOR
ExpLA NAT iON
-2% – 9%
10% – 17%
18% – 24%
25% – 35%
36% – 48%
Source: Cai (2011)
F iSH dEMA Nd GROwT H
Developing Countries, high fish consumption and high under nutrition
Developing Countries with high fish consumption
Countries with under nutrition where fish are eaten
6
BR IEF ING PA PER 06 / MEEt ING NEEds
KeY UnCeRtA int iesWhat are the key uncertainties concerning the current and likely future trends in the needs of poor and malnourished consumers? How do these uncertainties differ by geographic region and sector?
06.03Ref.
CA N AqUAC ULT URE GROw TO MEET
dEMA Nd FOR F iSH AT A F FORdA BLE
pR iC ES FOR pOOR CONSUMERS, OR
w iLL GROwT H BE AT T HE ExpENSE
OF T HE pOOR?
> The effectiveness of the aquaculture development policies of developing countries will have significant impacts on sector growth and target markets.> In some circumstances, using fishmeal, fish oil and trash fish to produce farmed fish diverts resources that would otherwise be eaten directly by poor consumers. > Increased demand for feed as aqua- culture production rises may, therefore, have implications for food security among the vulnerable.
HOw iMpORTA NT A RE LA RGE SCA LE
F iSHER iES FOR MEET iNG NEEd A Nd
HOw w iLL ACC ESS C HA NGE AS F iSH
pR iC ES R iSE?
> In 2007 imports into developing countries with high need accounted for 18.6% of total supply (FishStat). Much of this was probably low value fish from large scale marine fisheries. > In 2007 exports from these same countries was 4.70 mT (16.9% of total supply). This was, presumably, of high value fish.> The future dynamics of this trade and the implications for poor consumers are highly uncertain.
HOw C LOSELY L iNKEd A RE T HE
vA LUE C HA iNS T HAT MEET T HE
NEEdS OF w EA LT HY A Nd pOOR
CONSUMERS?
> Data and analysis on value and supply chain structure is limited, so current and future interactions between supply chains that meet demand and those that meet need are unclear.> As the middle class in developing countries grows, and demand for fish rises, the impact on affordability and availability for poor consumers is uncertain.
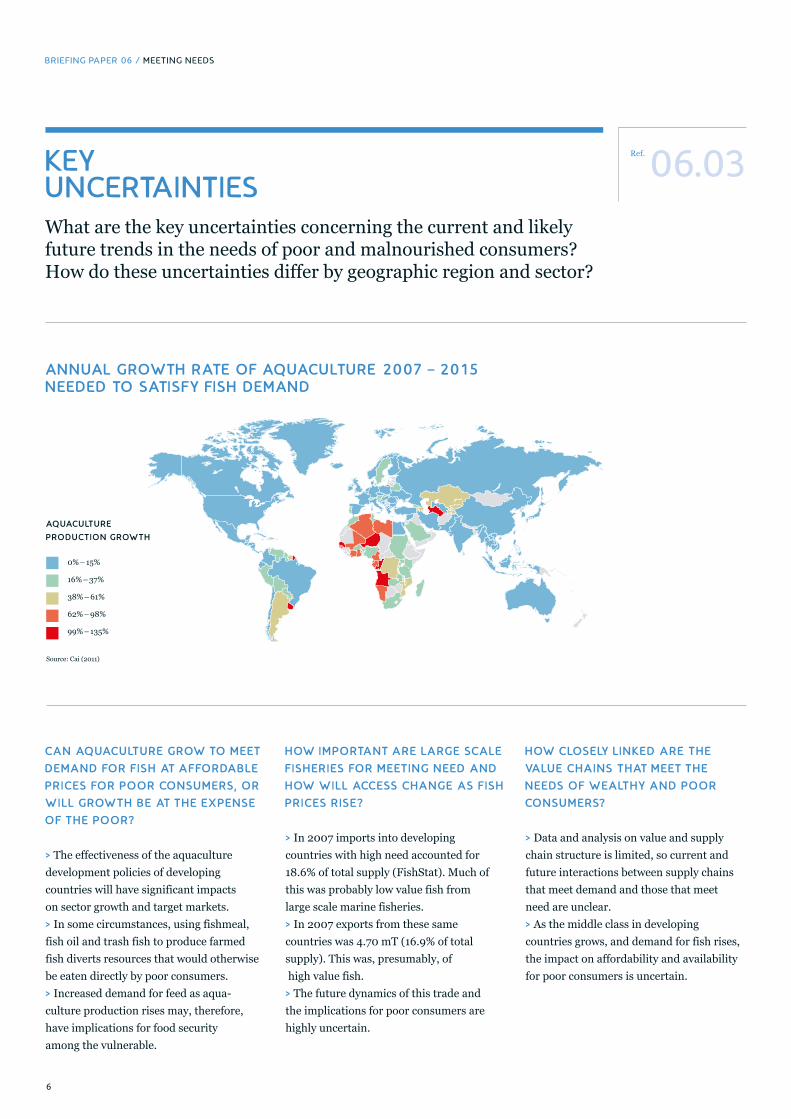
ANNUAL GROwTH RATE OF AqUACULTURE 2007 – 2015 NEEdEd TO SAT iSFY F iSH dEMANd
AqUAC ULT URE
pROdUCT iON GROwT H
0% – 15%
16% – 37%
38% – 61%
62% – 98%
99% – 135%
Source: Cai (2011)
8
BR IEF ING PA PER 06 / MEEt ING NEEds
06.04Ref.KeYissUesWhat are the key issues that need to be addressed to help meet the needs of poor and malnourished consumers of fish products? Why is this?
F i LL iNG GA pS iN
UNdERSTA NdiNG A Nd
L iNK iNG SECTORS
> Current and future interactions will require further investigation.
> Understanding all of the contributors to food insecurity for vulnerable populations and linking health, nutrition, economic, and production expertise to address constraints will be key to success.
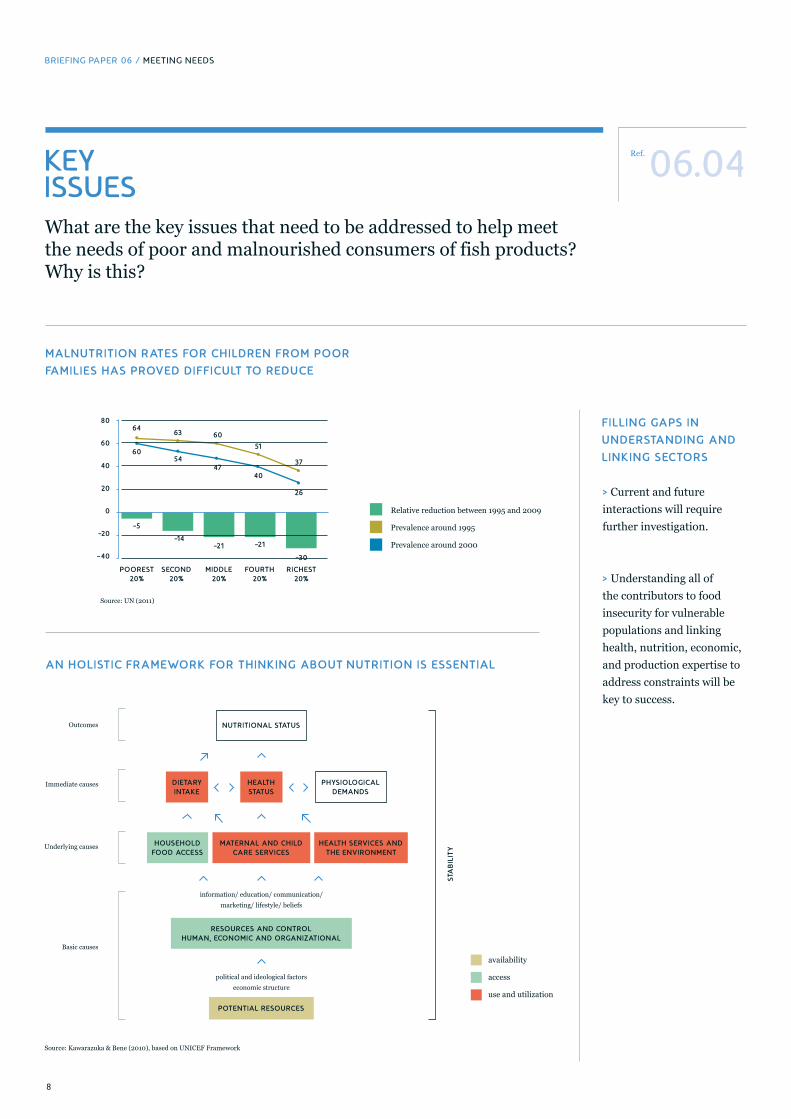
MA LNUT R iT iON RAT ES FOR C H iLdREN F ROM pOOR
FA MiL iES HAS pROv Ed d iF F iC ULT TO REdUC E
A N HOL iST iC F RA MEwORK FOR T H iNK iNG A BOUT NUT R iT iON iS ESSENT iA L
availability
access
use and utilization
STA
BiL
iTY
NUT R iT iONAL STAT US
RESOURCES A Nd CONT ROL HUMA N, ECONOMiC A Nd ORGA NiZAT iONAL
pOT ENT iAL RESOURCES
diETA RY iNTA KE
HOUSEHOLd FOOd ACCESS
HEALT H STAT US
MAT ERNAL A Nd CHiLd CA RE SERv iCES
pHYSiOLOGiCAL dEMA NdS
HEALT H SERv iCES A Nd T HE ENv iRONMENT
political and ideological factors economic structure
information/ education/ communication/ marketing/ lifestyle/ beliefs
Outcomes
Immediate causes
Underlying causes
Basic causes
Relative reduction between 1995 and 2009
Prevalence around 1995
Prevalence around 2000
pOOREST 20%
SECONd 20%
MiddLE 20%
FOURT H 20%
RiCHEST 20%
80
60
40
20
0
-20
-40
60
64
-5
-14-21 -21
-30
63 60
51
375447
40
26
Source: UN (2011)
Source: Kawarazuka & Bene (2010), based on UNICEF Framework
9
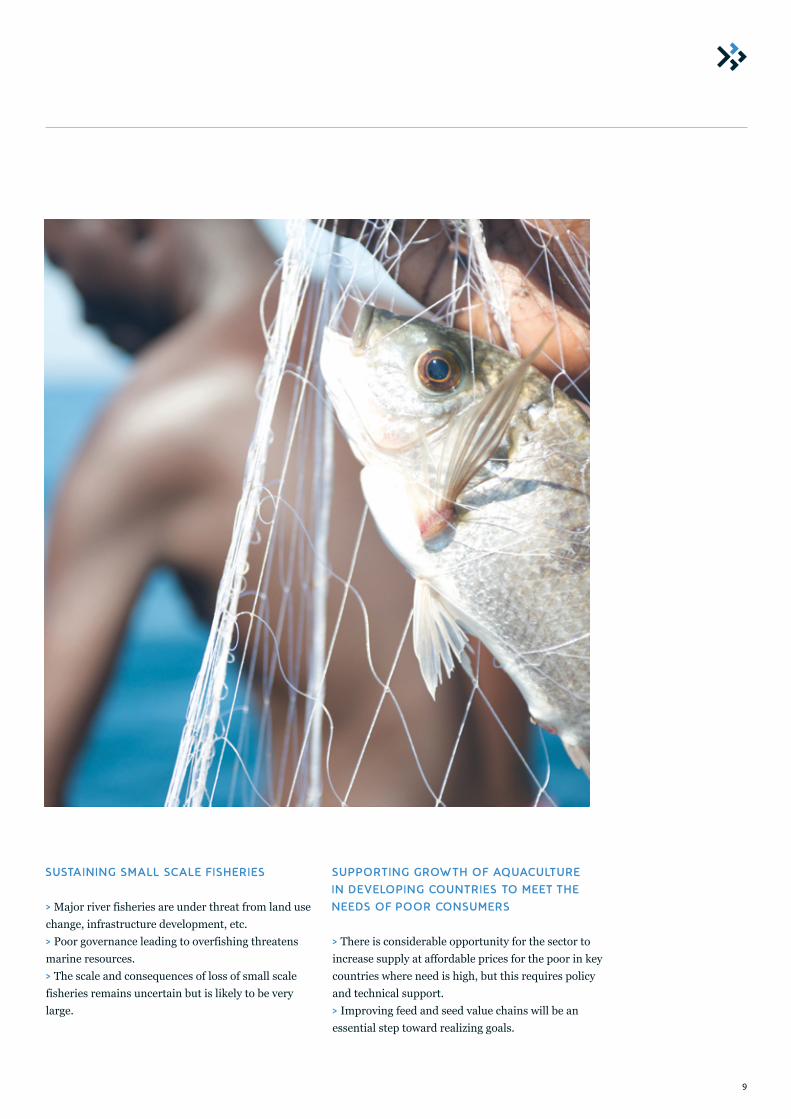
SUSTA iN iNG SMA LL SCA LE F iSHER iES
> Major river fisheries are under threat from land use change, infrastructure development, etc.> Poor governance leading to overfishing threatens marine resources.> The scale and consequences of loss of small scale fisheries remains uncertain but is likely to be very large.
SUppORT iNG GROwT H OF AqUAC ULT URE
iN dEv ELOp iNG COUNT R iES TO MEET T HE
NEEdS OF pOOR CONSUMERS
> There is considerable opportunity for the sector to increase supply at affordable prices for the poor in key countries where need is high, but this requires policy and technical support. > Improving feed and seed value chains will be an essential step toward realizing goals.
10
BR IEF ING PA PER 06 / MEEt ING NEEds
06.05Ref.sUCCesses
Are there any examples or promising approaches that illustrate the ways in which problems in this area have been addressed successfully?
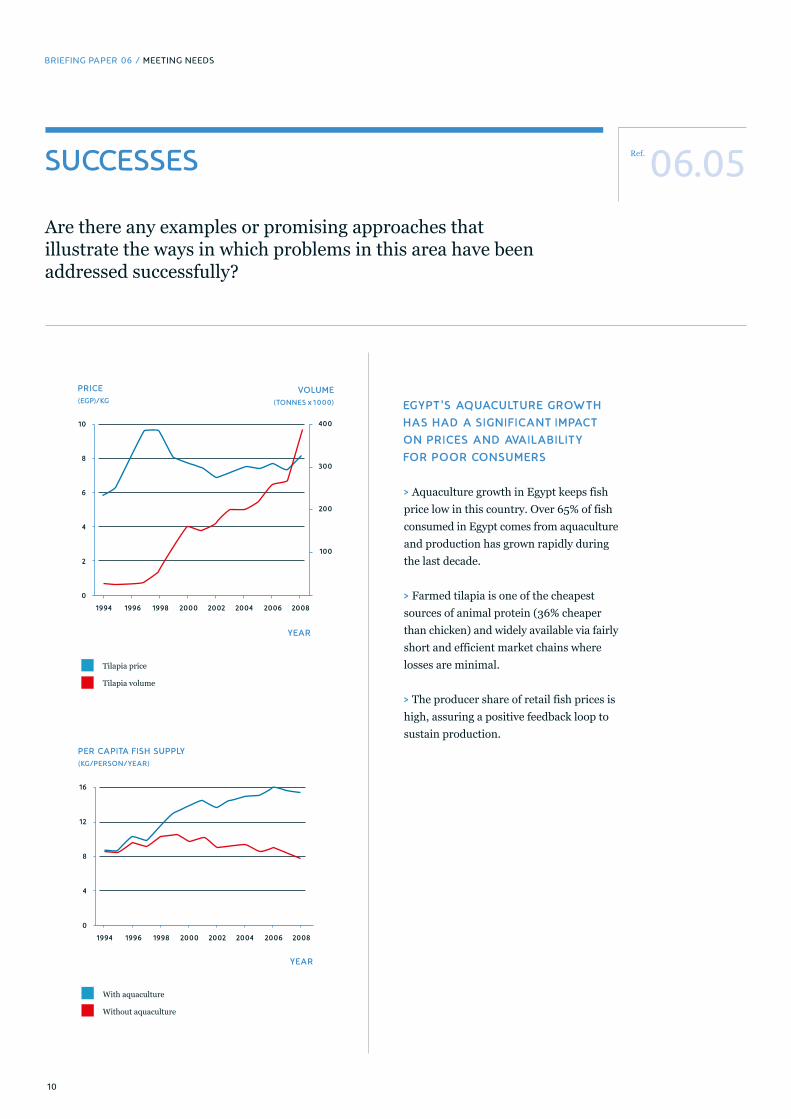
EGY pT ’S AqUAC ULT URE GROwT H
HAS HA d A S iGN iF iCA NT iMpACT
ON pR iC ES A Nd AvA iLA B iL iT Y
FOR pOOR CONSUMERS
> Aquaculture growth in Egypt keeps fish price low in this country. Over 65% of fish consumed in Egypt comes from aquaculture and production has grown rapidly during the last decade.
> Farmed tilapia is one of the cheapest sources of animal protein (36% cheaper than chicken) and widely available via fairly short and efficient market chains where losses are minimal.
> The producer share of retail fish prices is high, assuring a positive feedback loop to sustain production.
Tilapia price
Tilapia volume
YEA R
10
8
6
4
2
0
400
300
200
100
1994 1996 1998 2000 2002 2004 2006 2008
pR iCE (EGp)/KG
vOLUME (TONNES x1000)
With aquaculture
Without aquaculture
16
12
8
4
0
1994 1996 1998 2000 2002 2004 2006 2008
pER CA piTA F iSH SUppLY ( KG/pERSON/YEA R)
YEA R
11
12
BR IEF ING PA PER 06 / MEEt ING NEEds
RefeRenCes And RelAted ReAding
06.06Ref.
Allison, E. H. 2011. Aquaculture, fisheries, poverty and food security. WorldFish Working Paper 2011-65:60pp.
Beveridge, M., S. H. Thilsted, M. J. Phillips, M. Metian, M. Troell, and S. J. Hall. 2013. Meeting the food and nutrition needs of the poor: the role of fish and the opportunities and challenges emerging from the rise of aquaculture. Journal of Fish Biology DOI: 10.1111/jfb.12187.
Cai, J. 2011. Preliminary notes on forecasting country’s future demand for fish. FAO Aquaculture Newsletter 47:16-17.
FAO. 2012. The state of world fisheries and aquacul-ture (SOFIA) - 2012. 230pp.
Hall, S. J., R. Hilborn, N. Andrew, and E. H. Allision. 2013. Innovations in capture fisheries are an impe-rative for nutrition security in the developing world. Proceedings of the National Academy of Sciences 110:8393-8398.
Kawarazuka, N., and C. Bene. 2011. The potential role of small fish species in improving micronutrient de-ficiencies in developing countries: building evidence. Public Health Nutrition 14:1927-1938.
Roos, N., M. Abdul Wahab, C. Chamnan, and S. H. Thilsted. 2007. The role of fish in food-based strate-gies to combat vitamin A and mineral deficiencies in developing countries. Journal of Nutrition 137:1106-1109.
Roos, N., C. Chamnan, D. Loeung, J. Jakobsen, and S. H. Thilsted. 2007. Freshwater fish as a dietary source of vitamin A in Cambodia. Food Chemistry 103:1104-1111.
Roos, N., M. A. Wahab, M. A. R. Hossain, and S. H. Thilsted. 2007. Linking human nutrition and fishe-ries: incorporating micro-nutrient dense, small indi-ginous fish species in carp polyculture production in Bangladesh. Food and Nutrition Bulletin 28:281-293.
UN. 2011. World Population Prospects: The 2010 Revision, Highlights and Advanced Tables. Working Paper No ESA/P/WP.220. http://esa.un.org/wpp/documentation/pdf/WPP2010_Highlights.pdf/.
UNHRC. 2012. The Rights to Fish for Food. United Nations Human Rights Commission. New York. http://www.srfood.org/images/stories/pdf/officialre-ports/20121030_fish_en.pdf/. New York.
BR iEF iNG pA pERS
01 SUSTA iN iNG F iSH STOC KS
What are the key levers for improving capture fisheries governance to sustain the resource base – how do these change for different types of fishery?
02 SUSTA iN iNG AqUAC ULT URE GROwT H
How do we sustain the growth in aquaculture that is needed?
03 COp iNG w iT H C L iMAT E C HA NGE
How can we climate proof our fish production systems?
04 T HE w EA LT H TO w ELFA RE CONT iNUUM
What economic roles are wild capture fisheries best placed to play and under what circumstances?
05 T HE F UT URE OF dEMA Nd
How will the demand for fish evolve and what are the implications of anticipated changes?
06 MEET iNG NEEdS
How can the fish food system best meet the needs of poor consumers to address food and nutrition security challenges?
A LL BR iEF iNG pA pERS A RE AvA iLA BLE FOR dOw NLOA d AT
www.F iSH iNGF UT URE .ORGPdf
pLEASE SENd ALL COMMENTS TO Bp.FEEdBACK@F iSH iNGFUTURE .ORG
www.F iSH iNGF UT URE .ORG
F iSHER iES A Nd AqUAC ULT URE
iN T HE 21ST C ENT URY:
A N iN iT iAT iv E FOR GLOBA L ACT iON
iN iT iAT iv E SEC RETA R iAT:
Dr. Stephen J. HallWorldFish, Penang, MalaysiaEmail: [email protected]
Andreas SchafferThe Earth Observatory of Singapore, SingaporeEmail: [email protected]
Paper made fromrecycled material
100% RECYCLED