Embed Size (px)
Citation preview

MEETING WITH INVESTORS
SÃO PAULO, NOVEMBER 13, 2018
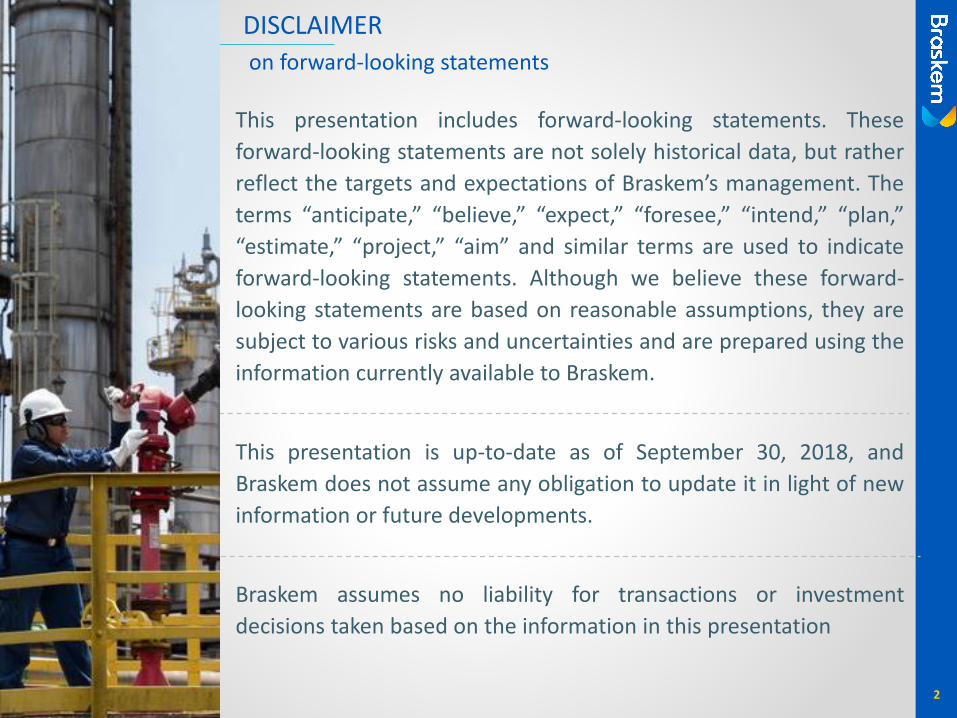
DISCLAIMER
on forward-looking statements
2
This presentation includes forward-looking statements. These
forward-looking statements are not solely historical data, but rather
reflect the targets and expectations of Braskem’s management. The
terms “anticipate,” “believe,” “expect,” “foresee,” “intend,” “plan,”
“estimate,” “project,” “aim” and similar terms are used to indicate
forward-looking statements. Although we believe these forward-
looking statements are based on reasonable assumptions, they are
subject to various risks and uncertainties and are prepared using the
information currently available to Braskem.
This presentation is up-to-date as of September 30, 2018, and
Braskem does not assume any obligation to update it in light of new
information or future developments.
Braskem assumes no liability for transactions or investment
decisions taken based on the information in this presentation
AGENDA
3
Brazil
US and Europe
Mexico
3Q18 Results
Governance and Compliance
Circular Economy
Scenario
Priorities

4
BR
AZIL
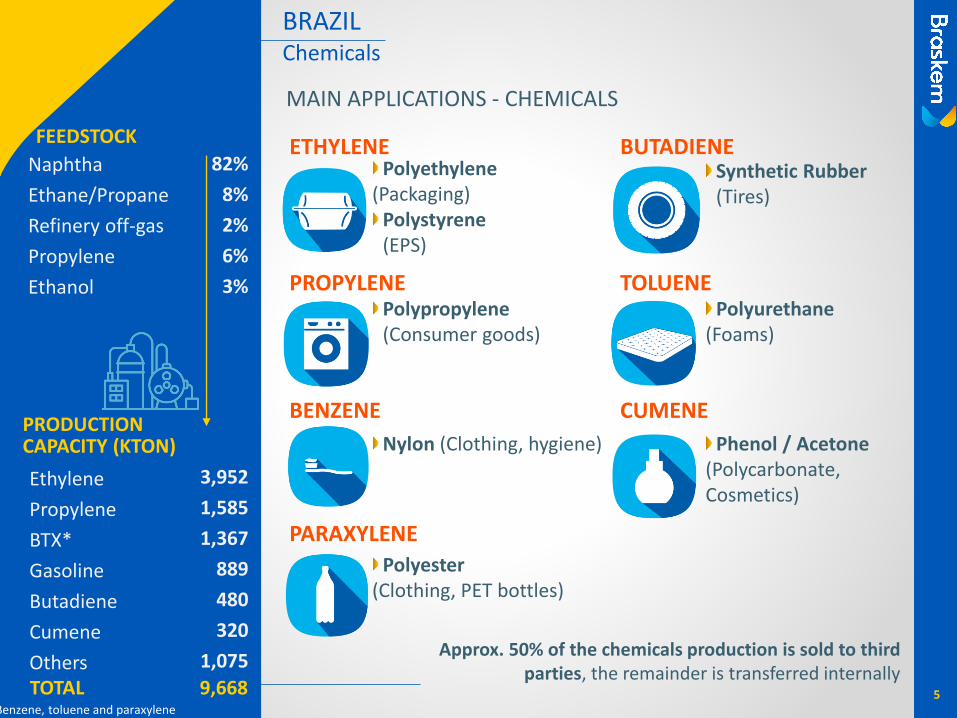
BRAZIL
MAIN APPLICATIONS - CHEMICALS
PRODUCTION CAPACITY (KTON)
Naphtha
Ethane/Propane
Refinery off-gas
Propylene
Ethanol
Ethylene
Propylene
BTX*
Gasoline
Butadiene
Cumene
Others
Chemicals
Approx. 50% of the chemicals production is sold to third parties, the remainder is transferred internally
5
ETHYLENEPolyethylene
(Packaging) Polystyrene (EPS)
PROPYLENEPolypropylene(Consumer goods)
BUTADIENE
PARAXYLENE
BENZENE
Synthetic Rubber (Tires)
Polyester (Clothing, PET bottles)
TOLUENEPolyurethane
(Foams)
Nylon (Clothing, hygiene)
CUMENE
Phenol / Acetone(Polycarbonate, Cosmetics)
82%
8%
2%
6%
3%
3,952
1,585
1,367
889
480
320
1,075
TOTAL
FEEDSTOCK
9,668*Benzene, toluene and paraxylene
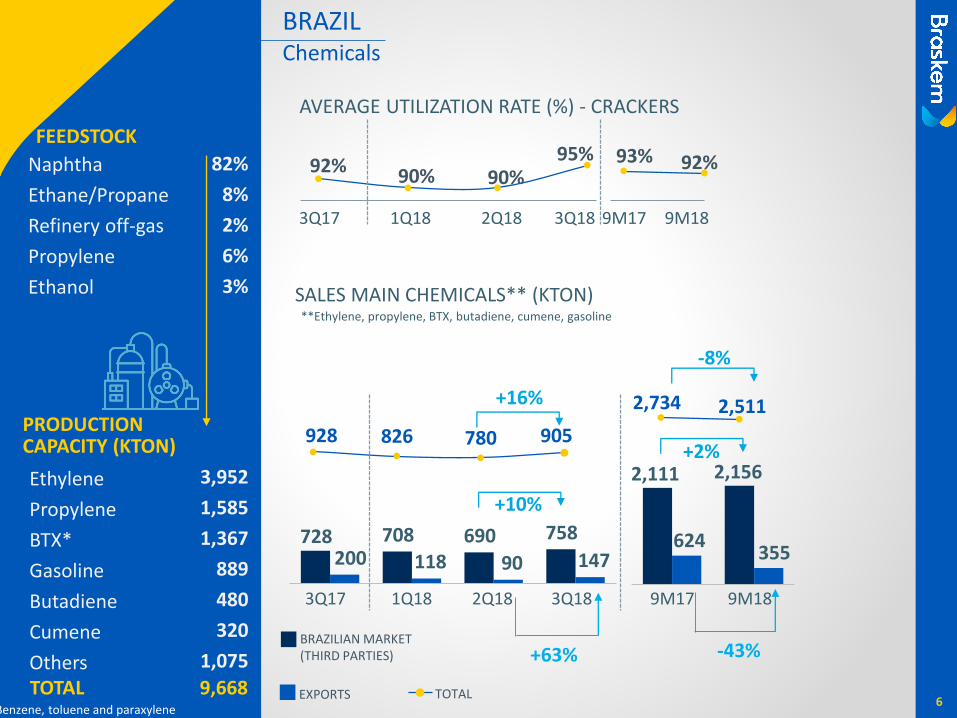
BRAZIL
AVERAGE UTILIZATION RATE (%) - CRACKERS
SALES MAIN CHEMICALS** (KTON)
92% 90% 90%95%
3Q183Q17 2Q181Q18
728200
708
118690
90
758
147
Chemicals
**Ethylene, propylene, BTX, butadiene, cumene, gasoline
9M17 9M18
624
2,111 2,156
355
6
928 826 780 905
2,5112,734
+10%
+16%
+2%
-8%
BRAZILIAN MARKET(THIRD PARTIES)
EXPORTS TOTAL
3Q183Q17 2Q181Q18 9M17 9M18
93% 92%
-43%+63%
PRODUCTION CAPACITY (KTON)
Ethylene
Propylene
BTX*
Gasoline
Butadiene
Cumene
OthersTOTAL
FEEDSTOCK
*Benzene, toluene and paraxylene
Naphtha
Ethane/Propane
Refinery off-gas
Propylene
Ethanol
82%
8%
2%
6%
3%
3,952
1,585
1,367
889
480
320
1,075
9,668
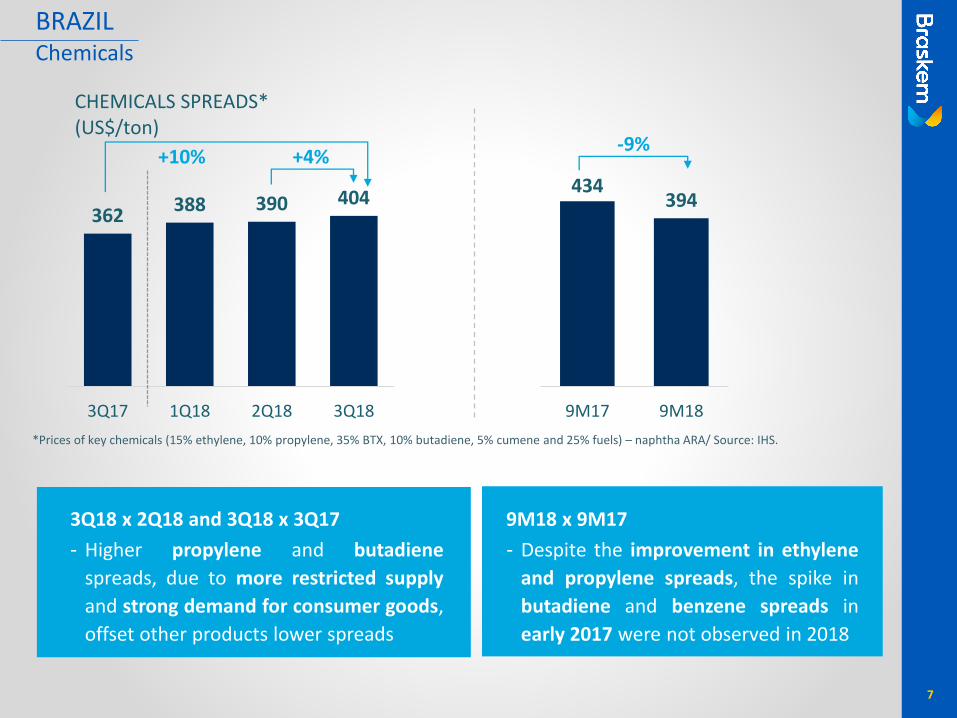
434394
9M17 9M18
362388 390 404
3Q17 1Q18 2Q18 3Q18
CHEMICALS SPREADS* (US$/ton)
+4%-9%
*Prices of key chemicals (15% ethylene, 10% propylene, 35% BTX, 10% butadiene, 5% cumene and 25% fuels) – naphtha ARA/ Source: IHS.
3Q18 x 2Q18 and 3Q18 x 3Q17
- Higher propylene and butadiene
spreads, due to more restricted supply
and strong demand for consumer goods,
offset other products lower spreads
9M18 x 9M17
- Despite the improvement in ethylene
and propylene spreads, the spike in
butadiene and benzene spreads in
early 2017 were not observed in 2018
7
+10%
BRAZILChemicals
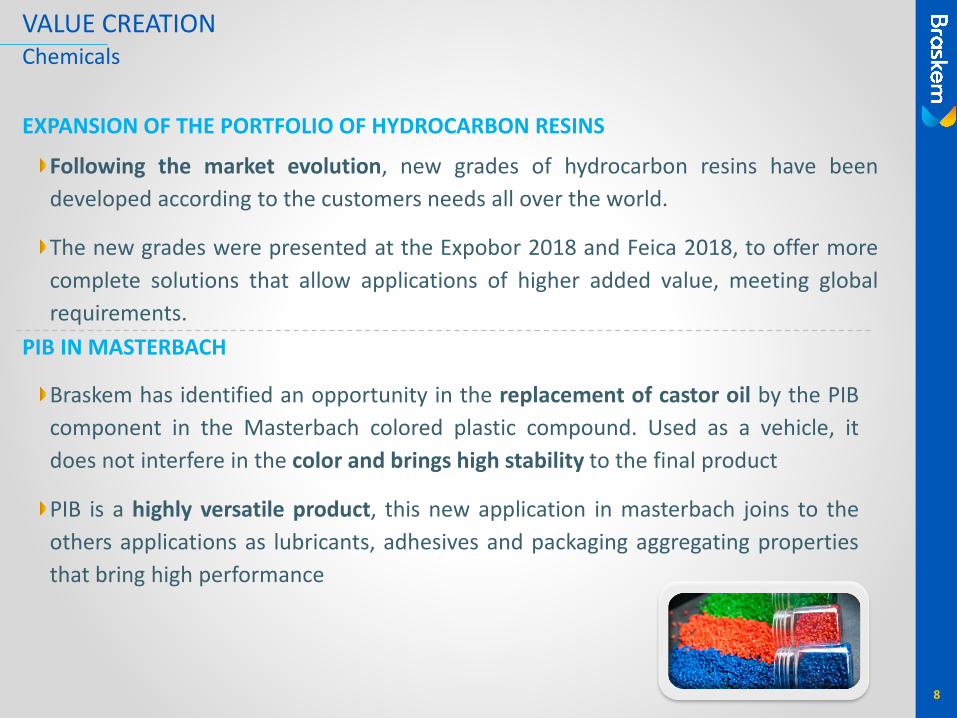
VALUE CREATIONChemicals
8
EXPANSION OF THE PORTFOLIO OF HYDROCARBON RESINS
Following the market evolution, new grades of hydrocarbon resins have been
developed according to the customers needs all over the world.
The new grades were presented at the Expobor 2018 and Feica 2018, to offer more
complete solutions that allow applications of higher added value, meeting global
requirements.
PIB IN MASTERBACH
Braskem has identified an opportunity in the replacement of castor oil by the PIB
component in the Masterbach colored plastic compound. Used as a vehicle, it
does not interfere in the color and brings high stability to the final product
PIB is a highly versatile product, this new application in masterbach joins to the
others applications as lubricants, adhesives and packaging aggregating properties
that bring high performance
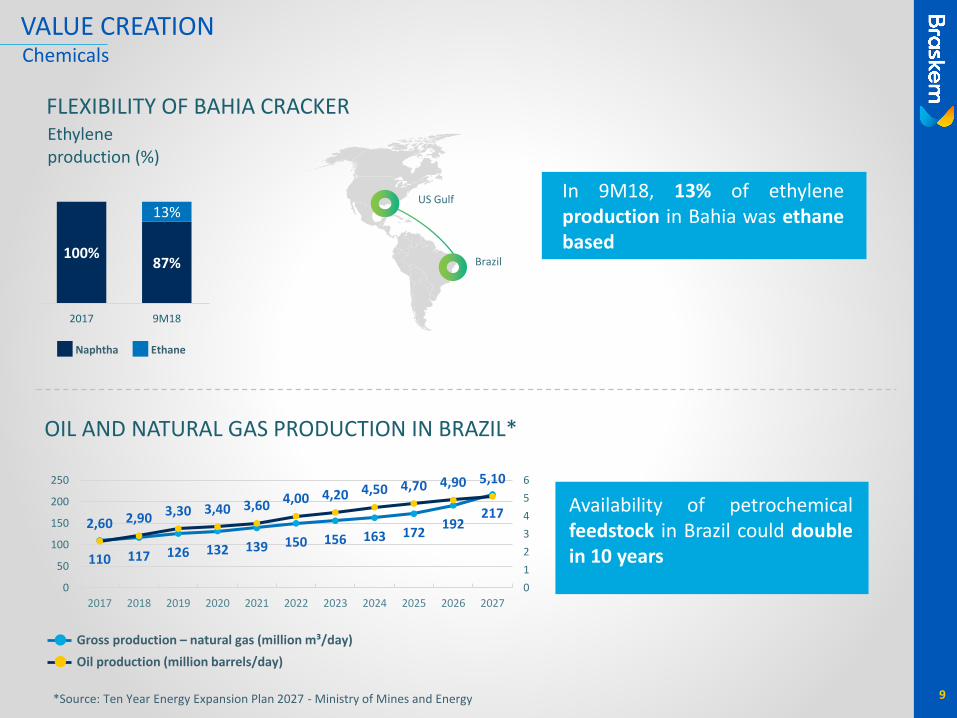
*Source: Ten Year Energy Expansion Plan 2027 - Ministry of Mines and Energy
100%87%
13%
2017 9M18
Ethylene production (%)
Naphtha Ethane
In 9M18, 13% of ethyleneproduction in Bahia was ethanebased
Brazil
US Gulf
110 117 126 132 139 150 156 163 172192
2172,60 2,90 3,30 3,40 3,60 4,00 4,20 4,50 4,70 4,90 5,10
0
1
2
3
4
5
6
0
50
100
150
200
250
2017 2018 2019 2020 2021 2022 2023 2024 2025 2026 2027
Gross production – natural gas (million m³/day)
Oil production (million barrels/day)
Availability of petrochemicalfeedstock in Brazil could doublein 10 years
9
FLEXIBILITY OF BAHIA CRACKER
OIL AND NATURAL GAS PRODUCTION IN BRAZIL*
VALUE CREATIONChemicals
BRAZIL
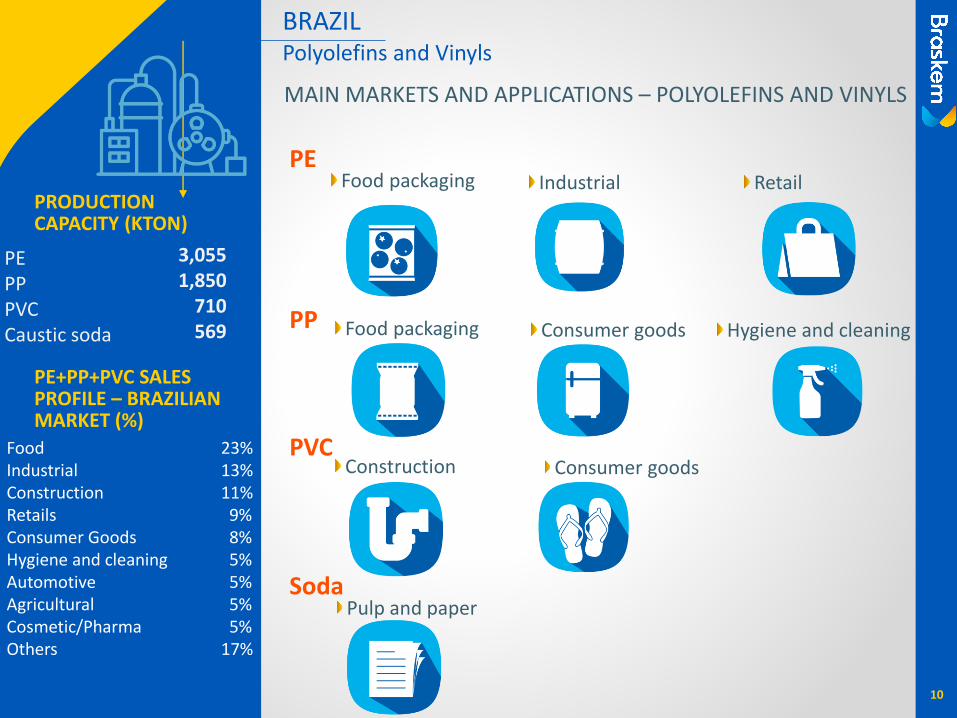
PRODUCTION CAPACITY (KTON)
MAIN MARKETS AND APPLICATIONS – POLYOLEFINS AND VINYLS
PE+PP+PVC SALES PROFILE – BRAZILIAN MARKET (%)
PEPPPVCCaustic soda
Polyolefins and Vinyls
10
PEFood packaging
PP
Soda
PVC
3,0551,850
710569
Industrial Retail
Construction Consumer goods
Pulp and paper
Food packaging Consumer goods Hygiene and cleaning
Food 23%Industrial 13%Construction 11%Retails 9%Consumer Goods 8%Hygiene and cleaning 5%Automotive 5%Agricultural 5%Cosmetic/Pharma 5%Others 17%
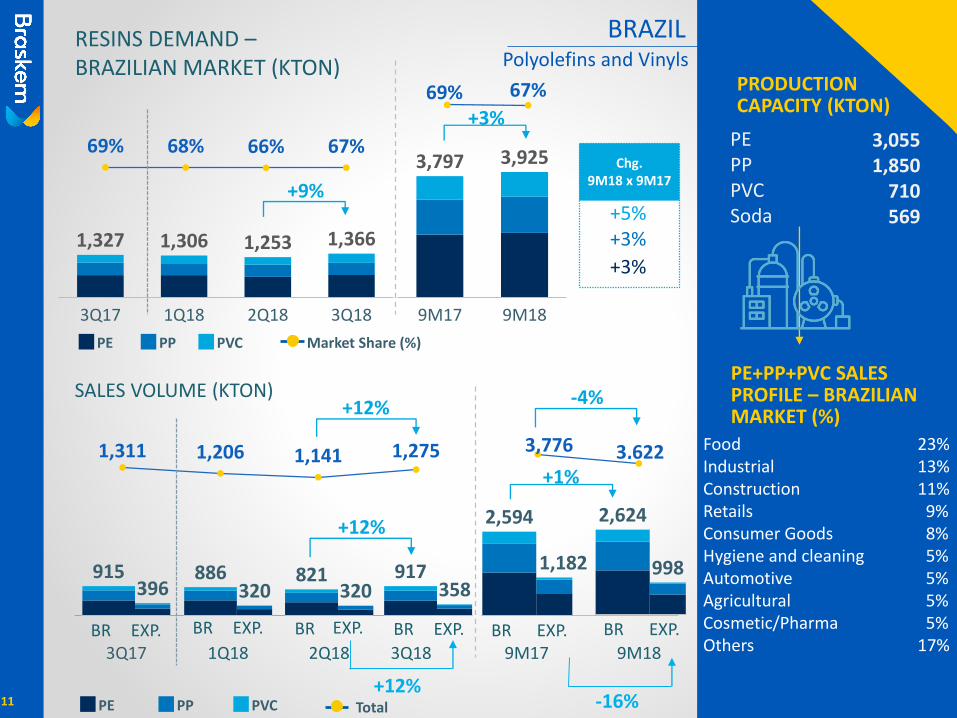
+9%
+3%
Chg. 9M18 x 9M17
+5%+3%
+3%
BRAZILPolyolefins and Vinyls
+12%
BR EXP.
SALES VOLUME (KTON)+12%
3Q17 1Q18 2Q18 3Q18 9M17 9M18
69% 68% 66% 67%
69% 67%
1,311 1,206 1,141 1,275+1%
-4%
3,776 3,622
PRODUCTION CAPACITY (KTON)
PEPPPVCSoda
3,0551,850
710569
RESINS DEMAND –BRAZILIAN MARKET (KTON)
BR EXP. BR EXP. BR EXP. BR EXP. BR EXP.
-16%
396915 886
320 320821 917
358
1,182
2,594
998
2,624
+12%
PE PVCPP Market Share (%)
PE PVCPP Total
2Q18 3Q183Q17 1Q18
1,327 1,306 1,253 1,366
9M17 9M18
3,797 3,925
PE+PP+PVC SALES PROFILE – BRAZILIAN MARKET (%)
Food 23%Industrial 13%Construction 11%Retails 9%Consumer Goods 8%Hygiene and cleaning 5%Automotive 5%Agricultural 5%Cosmetic/Pharma 5%Others 17%
11
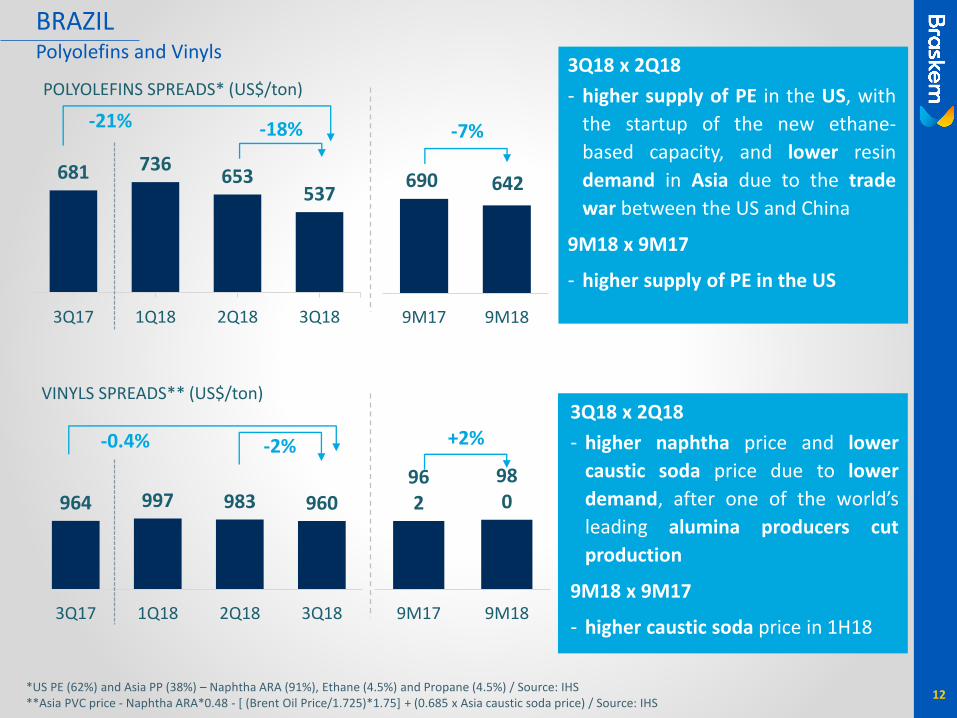
*US PE (62%) and Asia PP (38%) – Naphtha ARA (91%), Ethane (4.5%) and Propane (4.5%) / Source: IHS**Asia PVC price - Naphtha ARA*0.48 - [ (Brent Oil Price/1.725)*1.75] + (0.685 x Asia caustic soda price) / Source: IHS
9M17 9M18
681 736653
537
3Q17 1Q18 2Q18 3Q18
POLYOLEFINS SPREADS* (US$/ton)
-18% -7%
3Q18 x 2Q18
- higher supply of PE in the US, with
the startup of the new ethane-
based capacity, and lower resin
demand in Asia due to the trade
war between the US and China
9M18 x 9M17
- higher supply of PE in the US
12
690 642
3Q18 x 2Q18
- higher naphtha price and lower
caustic soda price due to lower
demand, after one of the world’s
leading alumina producers cut
production
9M18 x 9M17
- higher caustic soda price in 1H18
-21%
BRAZILPolyolefins and Vinyls
962
980
9M17 9M18
964 997 983 960
3Q17 1Q18 2Q18 3Q18
VINYLS SPREADS** (US$/ton)
-2% +2%-0.4%
Polyolefins and Vinyls
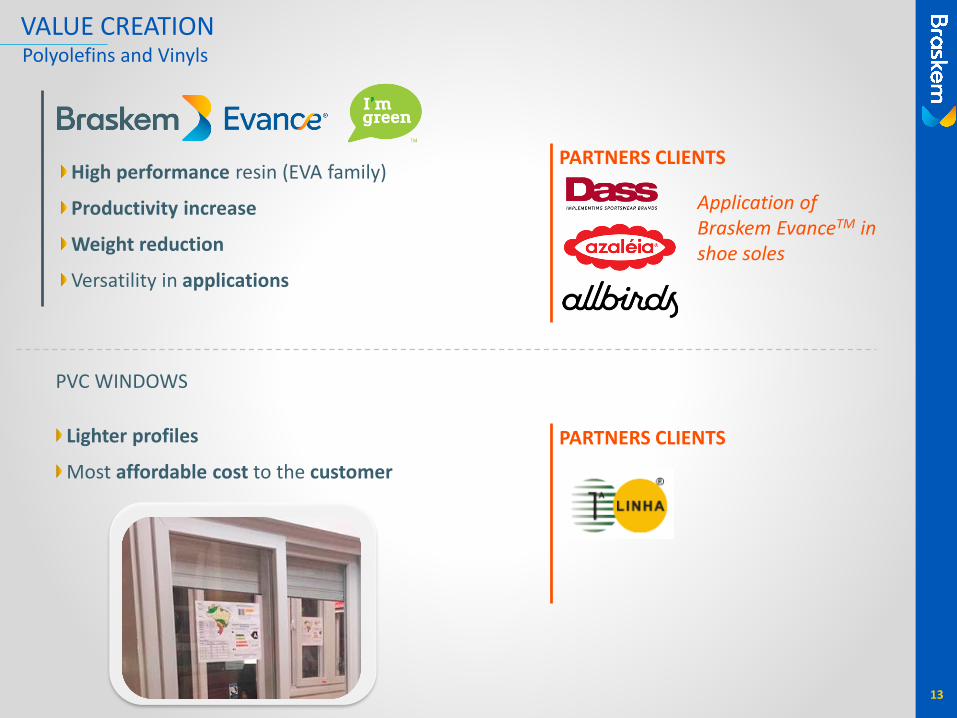
13
PARTNERS CLIENTSHigh performance resin (EVA family)
Productivity increase
Weight reduction
Versatility in applications
PVC WINDOWS
Lighter profiles
Most affordable cost to the customer
Application of Braskem EvanceTM in shoe soles
PARTNERS CLIENTS
VALUE CREATION
BRAZIL
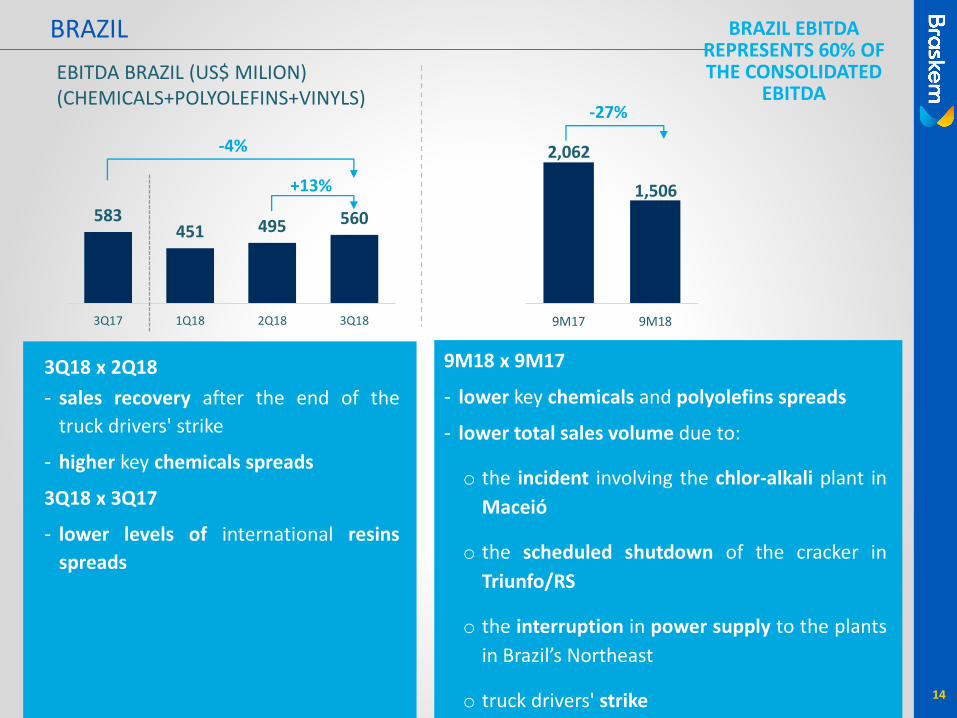
9M17 9M18
583451 495 560
3Q17 1Q18 2Q18 3Q18
+13%
-27%
-4%
14
BRAZIL EBITDAREPRESENTS 60% OF THE CONSOLIDATED
EBITDA
3Q18 x 2Q18
- sales recovery after the end of the
truck drivers' strike
- higher key chemicals spreads
3Q18 x 3Q17
- lower levels of international resins
spreads
9M18 x 9M17
EBITDA BRAZIL (US$ MILION)(CHEMICALS+POLYOLEFINS+VINYLS)
2,062
1,506
9M18 x 9M17
- lower key chemicals and polyolefins spreads
- lower total sales volume due to:
o the incident involving the chlor-alkali plant in
Maceió
o the scheduled shutdown of the cracker in
Triunfo/RS
o the interruption in power supply to the plants
in Brazil’s Northeast
o truck drivers' strike
15
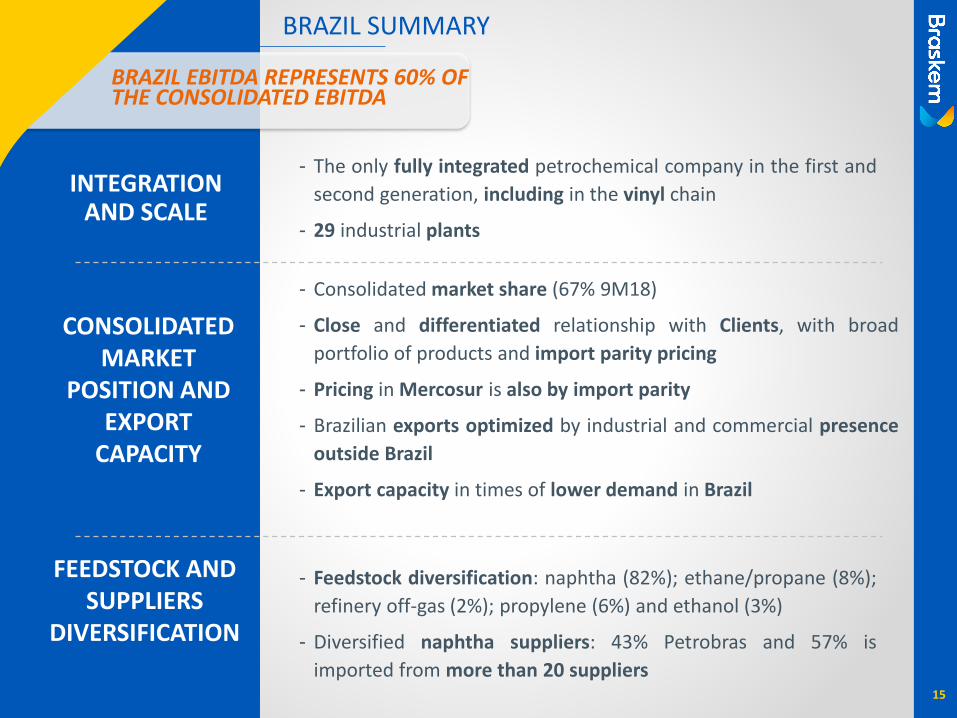
BRAZIL SUMMARY
BRAZIL EBITDA REPRESENTS 60% OF THE CONSOLIDATED EBITDA
- Consolidated market share (67% 9M18)
- Close and differentiated relationship with Clients, with broad
portfolio of products and import parity pricing
- Pricing in Mercosur is also by import parity
- Brazilian exports optimized by industrial and commercial presence
outside Brazil
- Export capacity in times of lower demand in Brazil
- Feedstock diversification: naphtha (82%); ethane/propane (8%);
refinery off-gas (2%); propylene (6%) and ethanol (3%)
- Diversified naphtha suppliers: 43% Petrobras and 57% is
imported from more than 20 suppliers
- The only fully integrated petrochemical company in the first and
second generation, including in the vinyl chain
- 29 industrial plants
INTEGRATION AND SCALE
CONSOLIDATED MARKET
POSITION AND EXPORT
CAPACITY
FEEDSTOCK AND SUPPLIERS
DIVERSIFICATION
16
UN
ITED STA
TES A
ND
EUR
OP
E
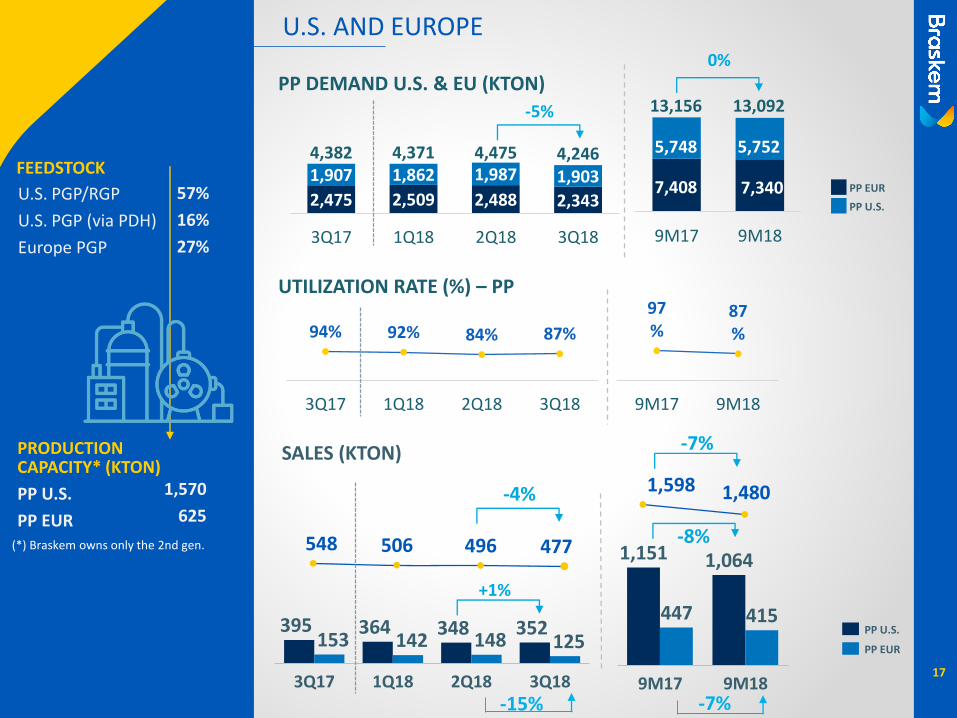
SALES (KTON)
3Q18
364
3Q17 1Q18
153
2Q18
395142
348148
352125
PP U.S.
PP EUR
1,064
9M17 9M18
447
1,151
415
2,475 2,509 2,488 2,343
1,907 1,862 1,987 1,903
4,382 4,371 4,475 4,246
3Q17 1Q18 2Q18 3Q18
PRODUCTION CAPACITY* (KTON)
U.S. PGP/RGP
U.S. PGP (via PDH)
Europe PGP
PP U.S.
PP EUR
57%
16%
27%
1,570
625
(*) Braskem owns only the 2nd gen.
U.S. AND EUROPE
17
PP EUR
PP U.S.
-5%
9M17 9M18
0%
94% 92% 84% 87%
3Q17 1Q18 2Q18 3Q18
97%
87%
9M17 9M18
FEEDSTOCK
13,156 13,092
5,748 5,752
7,408 7,340
UTILIZATION RATE (%) – PP
PP DEMAND U.S. & EU (KTON)
+1%
-15%
548 506 496 477
-4%
-8%
-7%
-7%
1,598 1,480
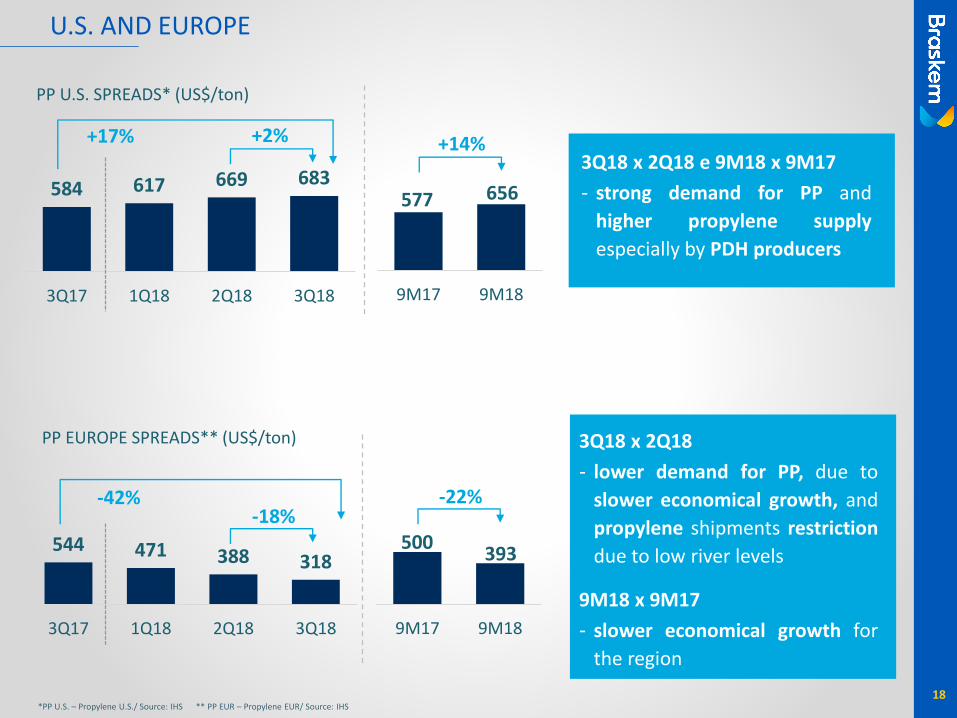
U.S. AND EUROPE
584 617 669 683
3Q17 1Q18 2Q18 3Q18
PP U.S. SPREADS* (US$/ton)
+2%
9M17 9M18
+14%3Q18 x 2Q18 e 9M18 x 9M17
- strong demand for PP and
higher propylene supply
especially by PDH producers
544 471 388 318
3Q17 1Q18 2Q18 3Q18
PP EUROPE SPREADS** (US$/ton)
-18%
9M17 9M18
-22%
3Q18 x 2Q18
- lower demand for PP, due to
slower economical growth, and
propylene shipments restriction
due to low river levels
9M18 x 9M17
- slower economical growth for
the region
18*PP U.S. – Propylene U.S./ Source: IHS ** PP EUR – Propylene EUR/ Source: IHS
577 656
500393
+17%
-42%
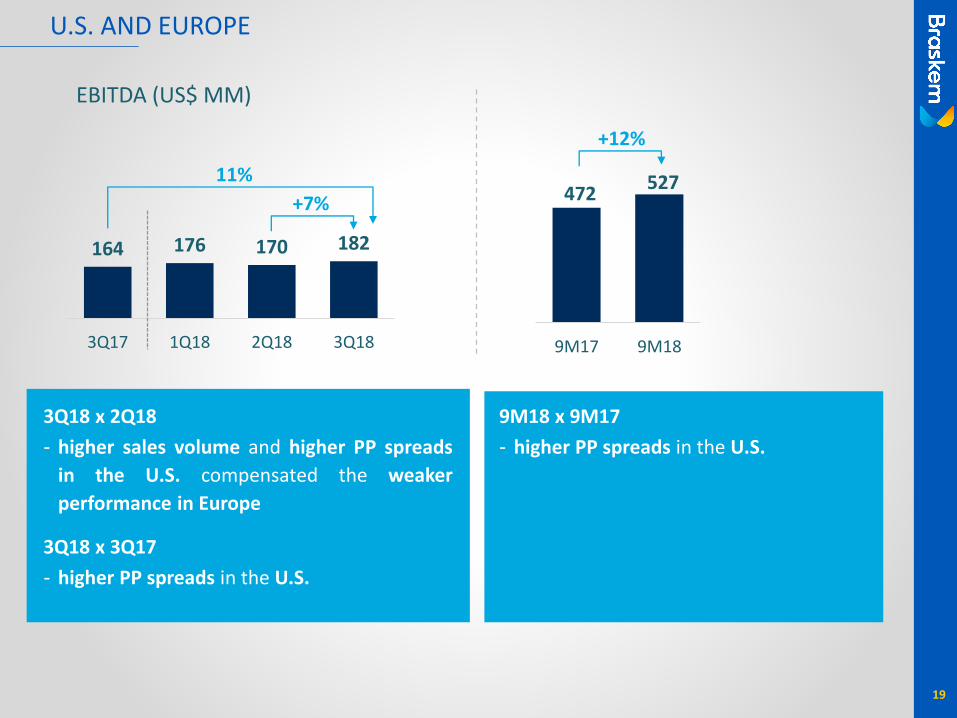
19
3Q18 x 2Q18
- higher sales volume and higher PP spreads
in the U.S. compensated the weaker
performance in Europe
3Q18 x 3Q17
- higher PP spreads in the U.S.
9M18 x 9M17
- higher PP spreads in the U.S.
U.S. AND EUROPE
9M17 9M18
164 176 170 182
3Q17 1Q18 2Q18 3Q18
EBITDA (US$ MM)
+7%
+12%
11%472
527
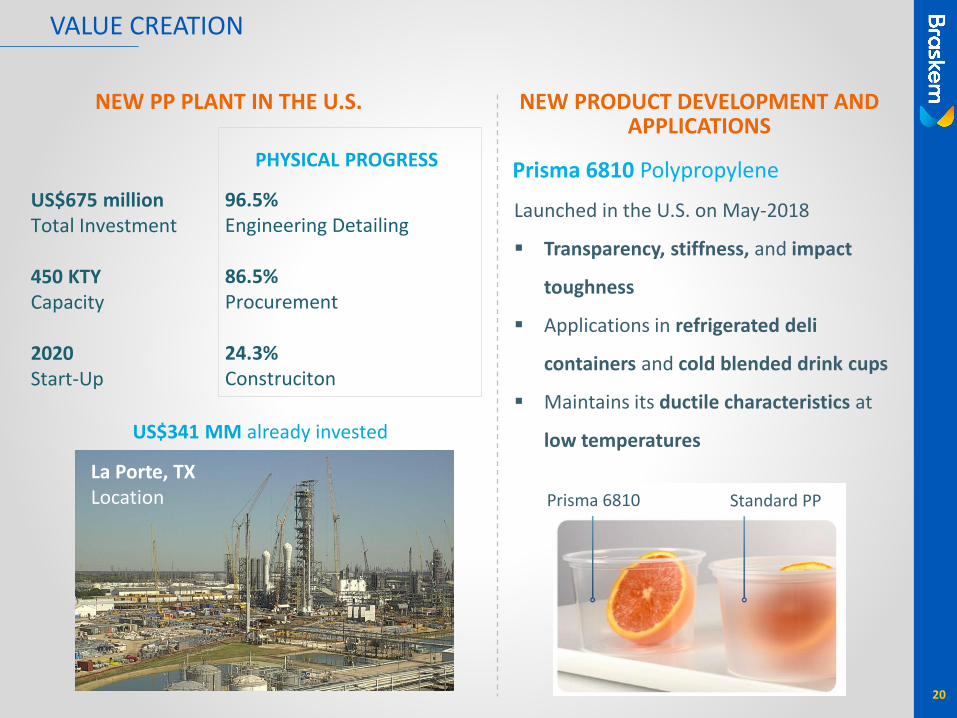
La Porte, TXLocation
VALUE CREATION
20
NEW PRODUCT DEVELOPMENT AND APPLICATIONS
NEW PP PLANT IN THE U.S.
US$675 millionTotal Investment
450 KTYCapacity
2020Start-Up
96.5%Engineering Detailing
86.5%Procurement
24.3%Construciton
PHYSICAL PROGRESS
US$341 MM already invested
Launched in the U.S. on May-2018
Transparency, stiffness, and impact
toughness
Applications in refrigerated deli
containers and cold blended drink cups
Maintains its ductile characteristics at
low temperatures
Prisma 6810 Standard PP
Prisma 6810 Polypropylene
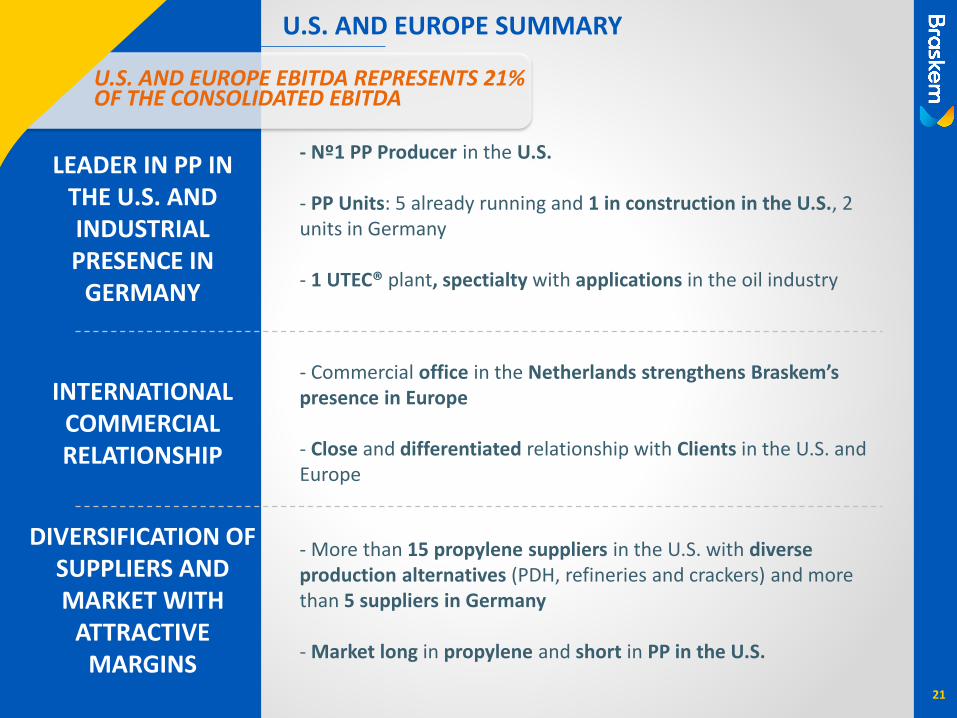
- More than 15 propylene suppliers in the U.S. with diverse production alternatives (PDH, refineries and crackers) and more than 5 suppliers in Germany
- Market long in propylene and short in PP in the U.S.
- Nº1 PP Producer in the U.S.
- PP Units: 5 already running and 1 in construction in the U.S., 2 units in Germany
- 1 UTEC® plant, spectialty with applications in the oil industry
- Commercial office in the Netherlands strengthens Braskem’s presence in Europe
- Close and differentiated relationship with Clients in the U.S. and Europe
21
U.S. AND EUROPE SUMMARY
LEADER IN PP IN THE U.S. AND INDUSTRIAL PRESENCE IN
GERMANY
DIVERSIFICATION OF SUPPLIERS AND MARKET WITH
ATTRACTIVE MARGINS
INTERNATIONAL COMMERCIAL RELATIONSHIP
U.S. AND EUROPE EBITDA REPRESENTS 21% OF THE CONSOLIDATED EBITDA

MEX
ICO
22
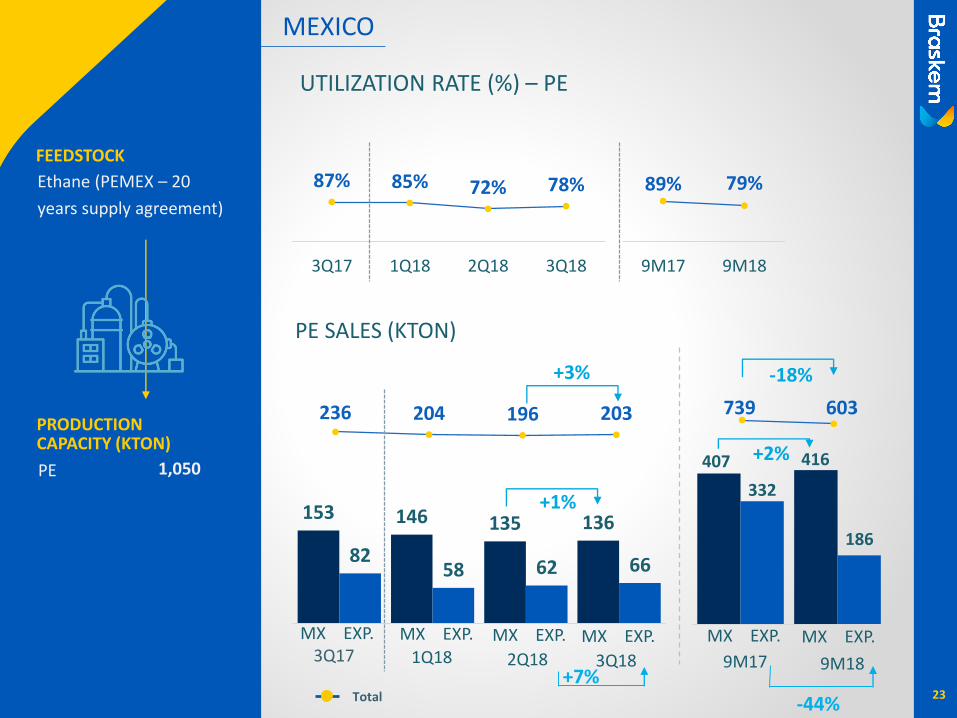
153 146 135 136
8258 62 66
PE SALES (KTON)
236 204 196 203
87% 85% 72% 78%
3Q17 1Q18 2Q18 3Q18
MEXICO
23
FEEDSTOCK
PRODUCTION CAPACITY (KTON)
Ethane (PEMEX – 20
years supply agreement)
PE 1,050
89% 79%
9M17 9M18
MX EXP.
739 603
+3%
Total
-18%
UTILIZATION RATE (%) – PE
186
416
332
407
+7%
MX EXP. MX EXP. MX EXP. MX EXP. MX EXP.3Q17 1Q18 2Q18 3Q18 9M17 9M18
-44%
+1%
+2%
24
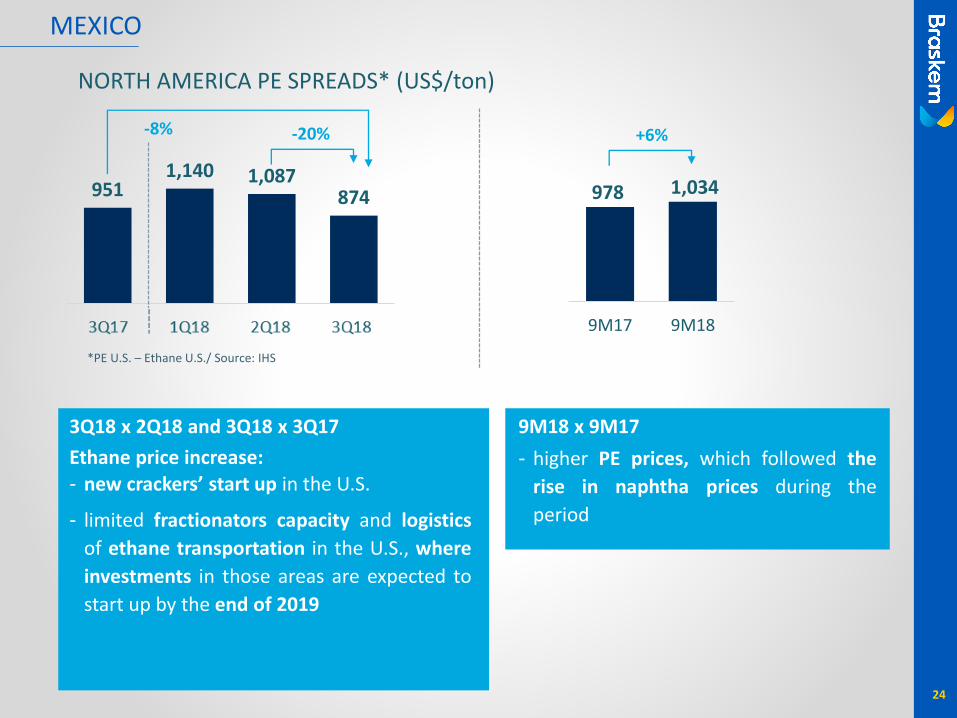
9M17 9M18
9511,140 1,087
874
3T17 1T18 2T18 3T18
-20% +6%
3Q18 x 2Q18 and 3Q18 x 3Q17
Ethane price increase:
- new crackers’ start up in the U.S.
- limited fractionators capacity and logistics
of ethane transportation in the U.S., where
investments in those areas are expected to
start up by the end of 2019
9M18 x 9M17
- higher PE prices, which followed the
rise in naphtha prices during the
period
MEXICO
NORTH AMERICA PE SPREADS* (US$/ton)
978 1,034
*PE U.S. – Ethane U.S./ Source: IHS
-8%
25
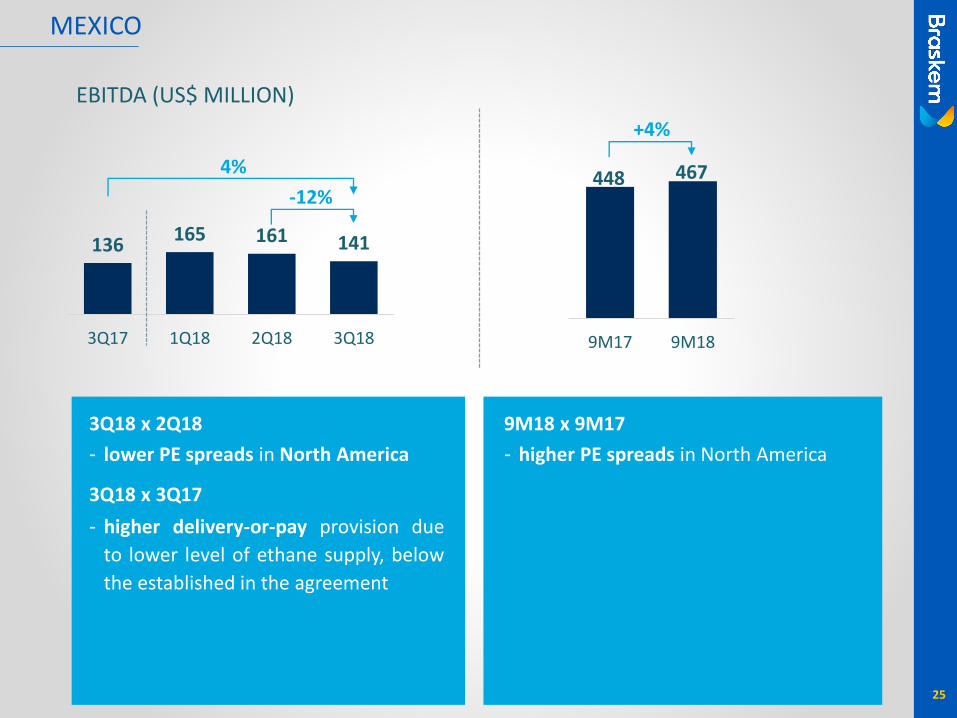
9M17 9M18
136165 161 141
3Q17 1Q18 2Q18 3Q18
EBITDA (US$ MILLION)
-12%
+4%
MEXICO
4%
3Q18 x 2Q18
- lower PE spreads in North America
3Q18 x 3Q17
- higher delivery-or-pay provision due
to lower level of ethane supply, below
the established in the agreement
448 467
9M18 x 9M17
- higher PE spreads in North America
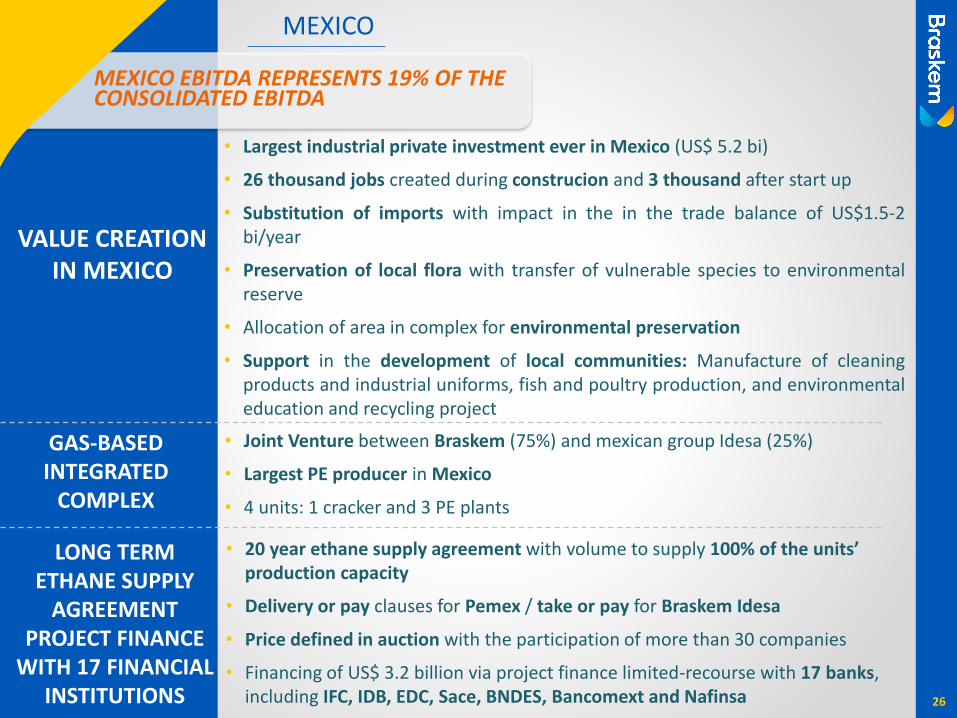
• 20 year ethane supply agreement with volume to supply 100% of the units’ production capacity
• Delivery or pay clauses for Pemex / take or pay for Braskem Idesa
• Price defined in auction with the participation of more than 30 companies
• Financing of US$ 3.2 billion via project finance limited-recourse with 17 banks, including IFC, IDB, EDC, Sace, BNDES, Bancomext and Nafinsa
• Joint Venture between Braskem (75%) and mexican group Idesa (25%)
• Largest PE producer in Mexico
• 4 units: 1 cracker and 3 PE plants
26
MEXICO
VALUE CREATION IN MEXICO
LONG TERM ETHANE SUPPLY
AGREEMENT PROJECT FINANCE
WITH 17 FINANCIAL INSTITUTIONS
GAS-BASED INTEGRATED
COMPLEX
• Largest industrial private investment ever in Mexico (US$ 5.2 bi)
• 26 thousand jobs created during construcion and 3 thousand after start up
• Substitution of imports with impact in the in the trade balance of US$1.5-2bi/year
• Preservation of local flora with transfer of vulnerable species to environmentalreserve
• Allocation of area in complex for environmental preservation
• Support in the development of local communities: Manufacture of cleaningproducts and industrial uniforms, fish and poultry production, and environmentaleducation and recycling project
MEXICO EBITDA REPRESENTS 19% OF THE CONSOLIDATED EBITDA

27
3Q
18
CO
NSO
LIDA
TED
RESU
LTS
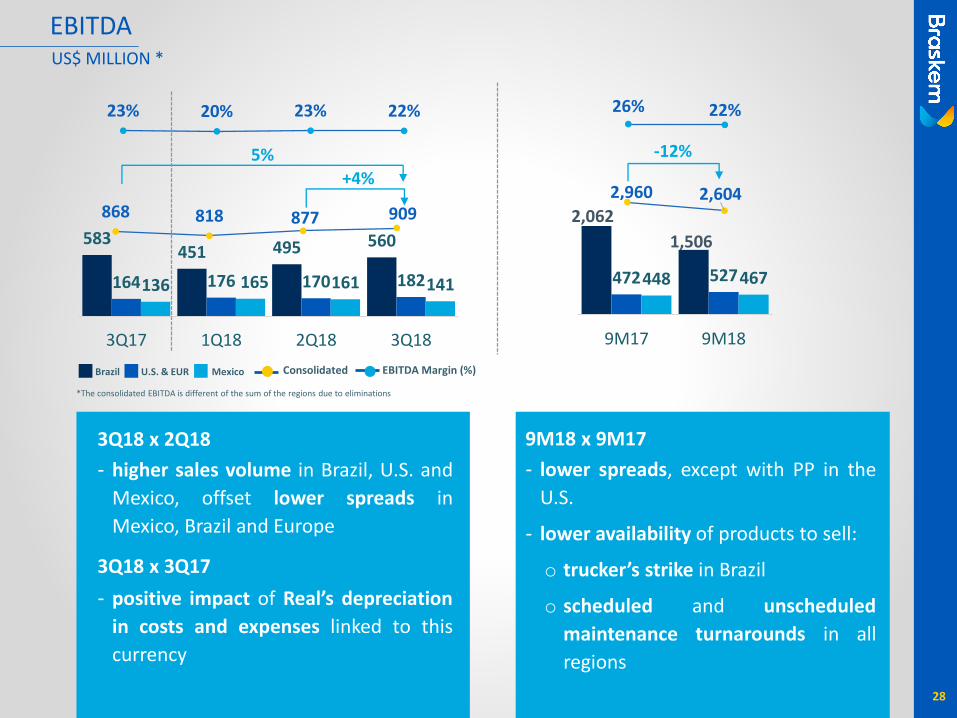
472 527448 467
9M17 9M18
23% 20% 23% 22% 26% 22%
868 818 877 909
+4%
Consolidated
5%
MexicoBrazil U.S. & EUR EBITDA Margin (%)
2,960 2,604
-12%
EBITDA
28
3Q18 x 2Q18
- higher sales volume in Brazil, U.S. and
Mexico, offset lower spreads in
Mexico, Brazil and Europe
3Q18 x 3Q17
- positive impact of Real’s depreciation
in costs and expenses linked to this
currency
9M18 x 9M17
- lower spreads, except with PP in the
U.S.
- lower availability of products to sell:
o trucker’s strike in Brazil
o scheduled and unscheduled
maintenance turnarounds in all
regions
1,506
2,062
US$ MILLION *
583451 495 560
164 176 170 182136 165 161 141
3Q17 1Q18 2Q18 3Q18
*The consolidated EBITDA is different of the sum of the regions due to eliminations
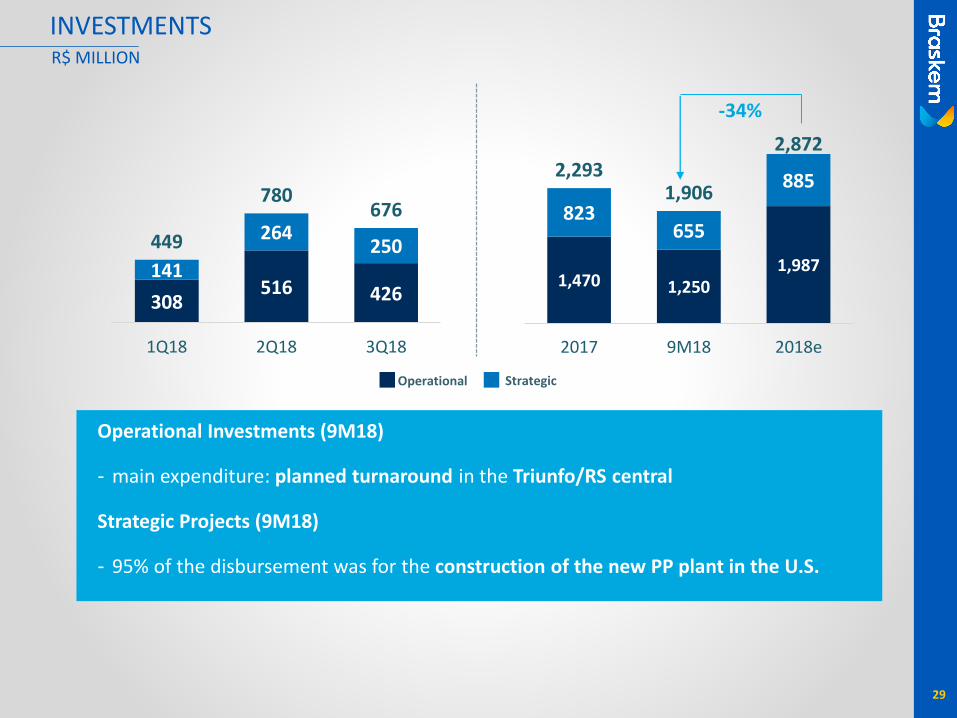
INVESTMENTS
Operational Strategic
308516 426
141
264250449
780676
1Q18 2Q18 3Q18
R$ MILLION
1,470 1,2501,987
823655
8852,293
1,906
2,872
2017 9M18 2018e
-34%
Operational Investments (9M18)
- main expenditure: planned turnaround in the Triunfo/RS central
Strategic Projects (9M18)
- 95% of the disbursement was for the construction of the new PP plant in the U.S.
29
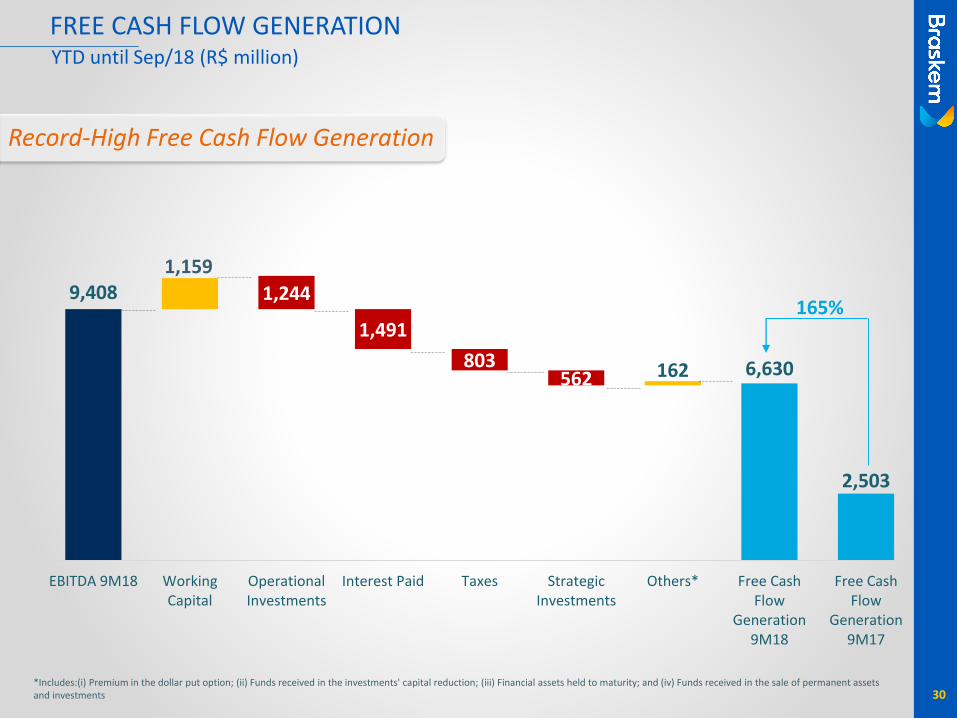
9,408
6,630
2,503
1,159
1,244
1,491
803562 162
EBITDA 9M18 WorkingCapital
OperationalInvestments
Interest Paid Taxes StrategicInvestments
Others* Free CashFlow
Generation9M18
Free CashFlow
Generation9M17
*Includes:(i) Premium in the dollar put option; (ii) Funds received in the investments' capital reduction; (iii) Financial assets held to maturity; and (iv) Funds received in the sale of permanent assets and investments
FREE CASH FLOW GENERATIONYTD until Sep/18 (R$ million)
165%
30
Record-High Free Cash Flow Generation
(1) Does not consider discounts from transaction costs and Leniency Agreement
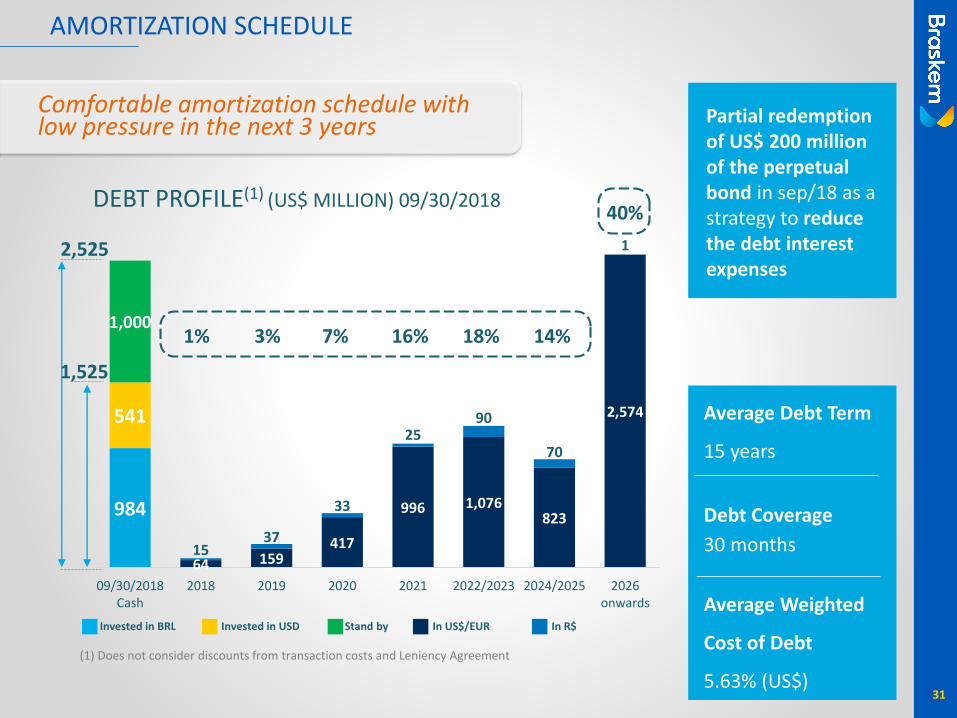
Invested in BRL Invested in USD Stand by In R$In US$/EUR
984
64 159417
996 1,076823
2,574541
1537
33
2590
70
1
1,000
09/30/2018Cash
2018 2019 2020 2021 2022/2023 2024/2025 2026onwards
DEBT PROFILE(1) (US$ MILLION) 09/30/2018
7% 18%3% 16% 14%1%
40%
1,525
2,525
AMORTIZATION SCHEDULE
Partial redemptionof US$ 200 million of the perpetualbond in sep/18 as a strategy to reduce the debt interest expenses
31
Average Debt Term
15 years
Debt Coverage
30 months
Average Weighted
Cost of Debt
5.63% (US$)
Comfortable amortization schedule with low pressure in the next 3 years
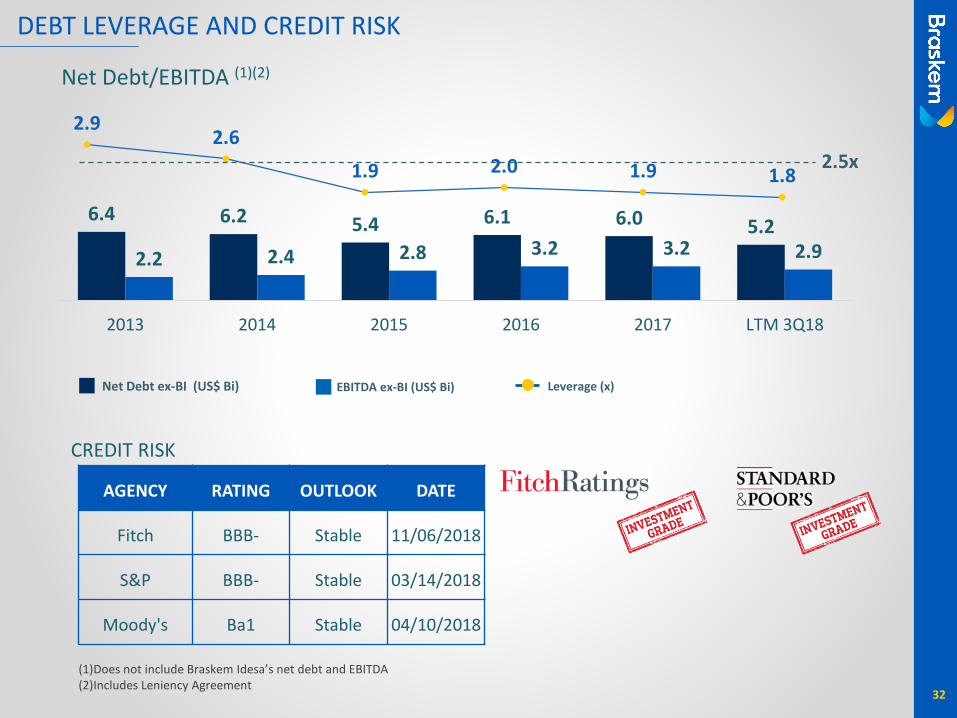
6.4 6.2 5.4 6.1 6.0 5.2
2.2 2.4 2.8 3.2 3.2 2.9
2013 2014 2015 2016 2017 LTM 3Q18
Net Debt/EBITDA (1)(2)
2.92.6
1.9 2.0 1.9 1.8
Leverage (x)
(1)Does not include Braskem Idesa’s net debt and EBITDA(2)Includes Leniency Agreement
2.5x
Net Debt ex-BI (US$ Bi) EBITDA ex-BI (US$ Bi)
AGENCY RATING OUTLOOK DATE
Fitch BBB- Stable 11/06/2018
S&P BBB- Stable 03/14/2018
Moody's Ba1 Stable 04/10/2018
CREDIT RISK
32
DEBT LEVERAGE AND CREDIT RISK

33
GO
VER
NA
NC
E A
ND
CO
MP
LIAN
CE
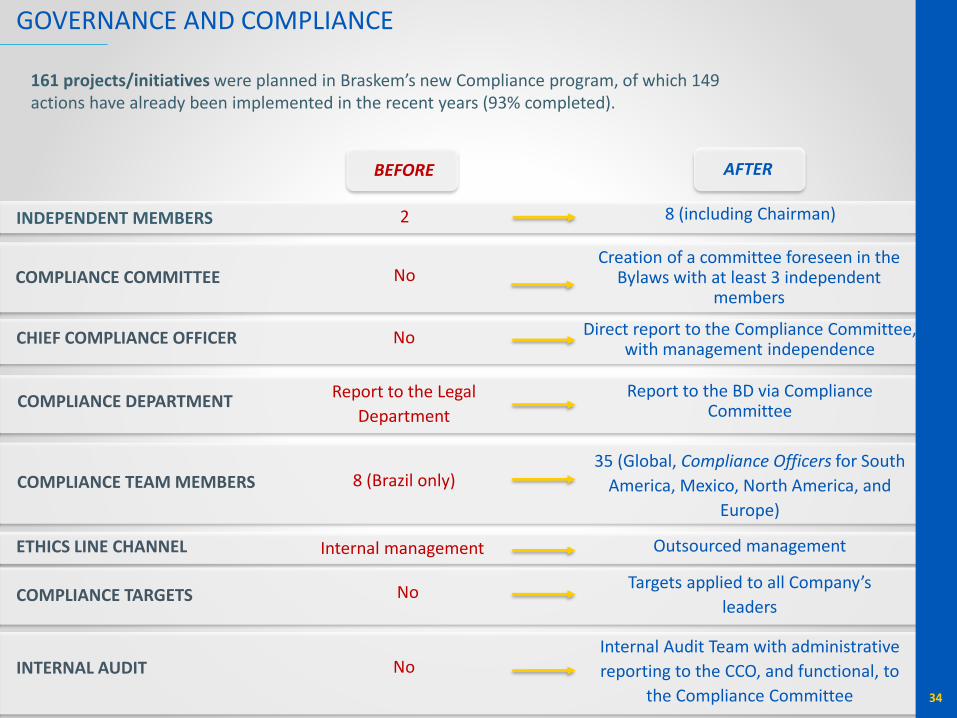
GOVERNANCE AND COMPLIANCE
161 projects/initiatives were planned in Braskem’s new Compliance program, of which 149 actions have already been implemented in the recent years (93% completed).
ETHICS LINE CHANNEL Internal management Outsourced management
BEFORE AFTER
COMPLIANCE TEAM MEMBERS 8 (Brazil only)35 (Global, Compliance Officers for South
America, Mexico, North America, and
Europe)
COMPLIANCE DEPARTMENTReport to the Legal
Department
Report to the BD via ComplianceCommittee
CHIEF COMPLIANCE OFFICER No Direct report to the Compliance Committee, with management independence
COMPLIANCE COMMITTEE NoCreation of a committee foreseen in the
Bylaws with at least 3 independentmembers
INDEPENDENT MEMBERS 2 8 (including Chairman)
COMPLIANCE TARGETS NoTargets applied to all Company’s
leaders
INTERNAL AUDIT NoInternal Audit Team with administrative
reporting to the CCO, and functional, to
the Compliance Committee 34
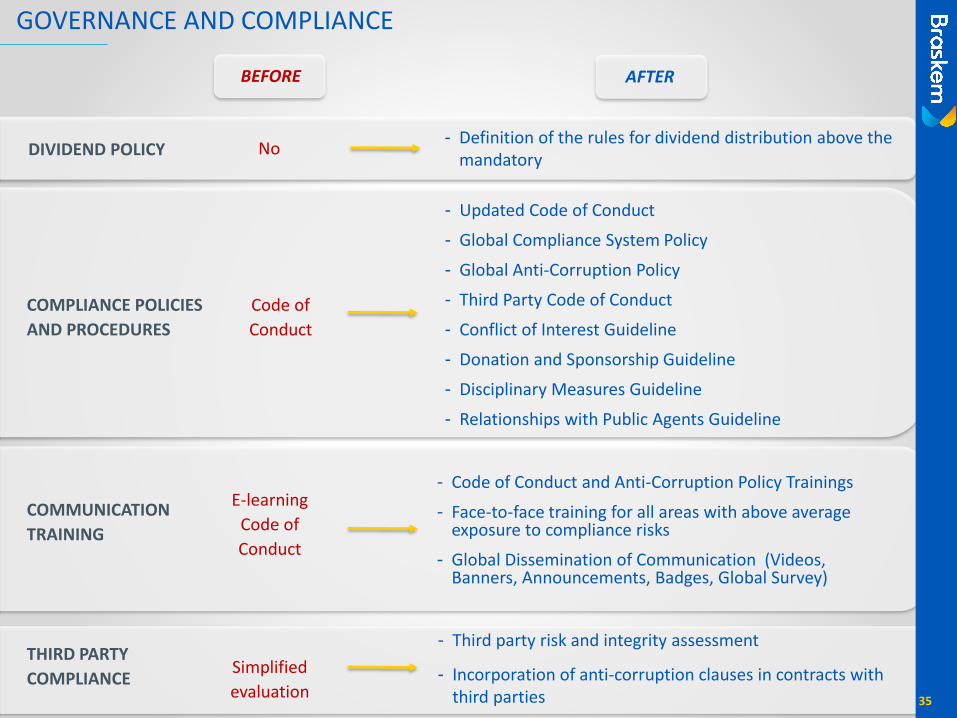
DIVIDEND POLICY
GOVERNANCE AND COMPLIANCE
COMPLIANCE POLICIES
AND PROCEDURES
Code of
Conduct
- Updated Code of Conduct
- Global Compliance System Policy
- Global Anti-Corruption Policy
- Third Party Code of Conduct
- Conflict of Interest Guideline
- Donation and Sponsorship Guideline
- Disciplinary Measures Guideline
- Relationships with Public Agents Guideline
COMMUNICATION
TRAINING
E-learning
Code of
Conduct
THIRD PARTY
COMPLIANCE
- Code of Conduct and Anti-Corruption Policy Trainings
- Face-to-face training for all areas with above average exposure to compliance risks
- Global Dissemination of Communication (Videos, Banners, Announcements, Badges, Global Survey)
- Third party risk and integrity assessment
- Incorporation of anti-corruption clauses in contracts with third parties
BEFORE AFTER
35
Simplified
evaluation
No- Definition of the rules for dividend distribution above the
mandatory
36
CIR
CU
LAR
ECO
NO
MY
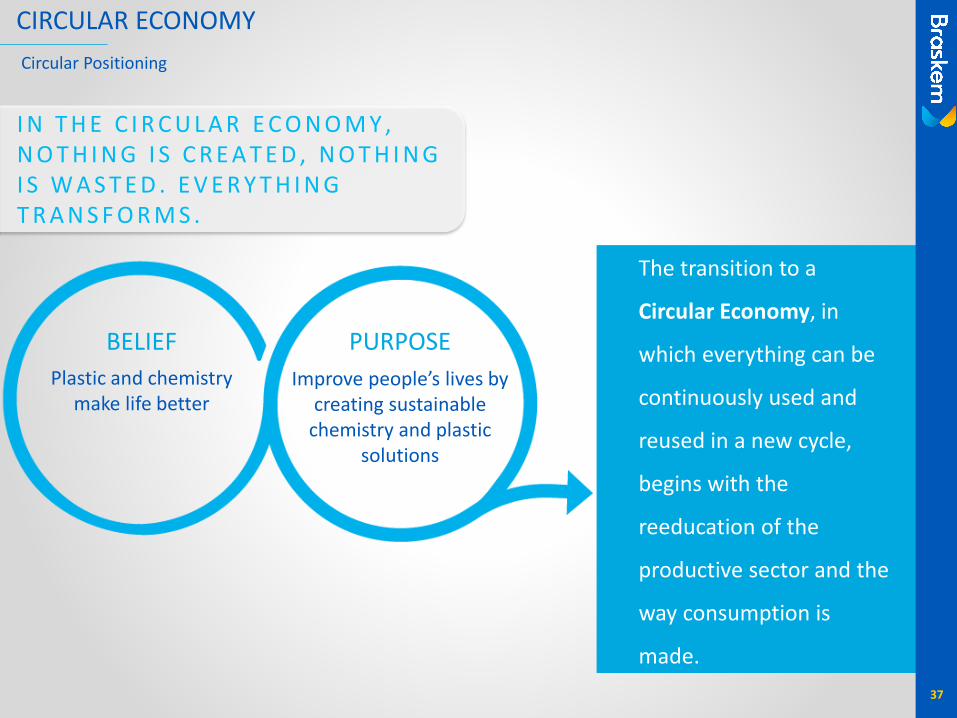
BELIEF
Plastic and chemistry make life better
PURPOSE
Improve people’s lives by creating sustainable
chemistry and plastic solutions
The transition to a
Circular Economy, in
which everything can be
continuously used and
reused in a new cycle,
begins with the
reeducation of the
productive sector and the
way consumption is
made.
CIRCULAR ECONOMY
Circular Positioning
I N T H E C I R C U L A R E C O N O M Y , N O T H I N G I S C R E A T E D , N O T H I N G I S W A S T E D . E V E R Y T H I N G T R A N S F O R M S .
37
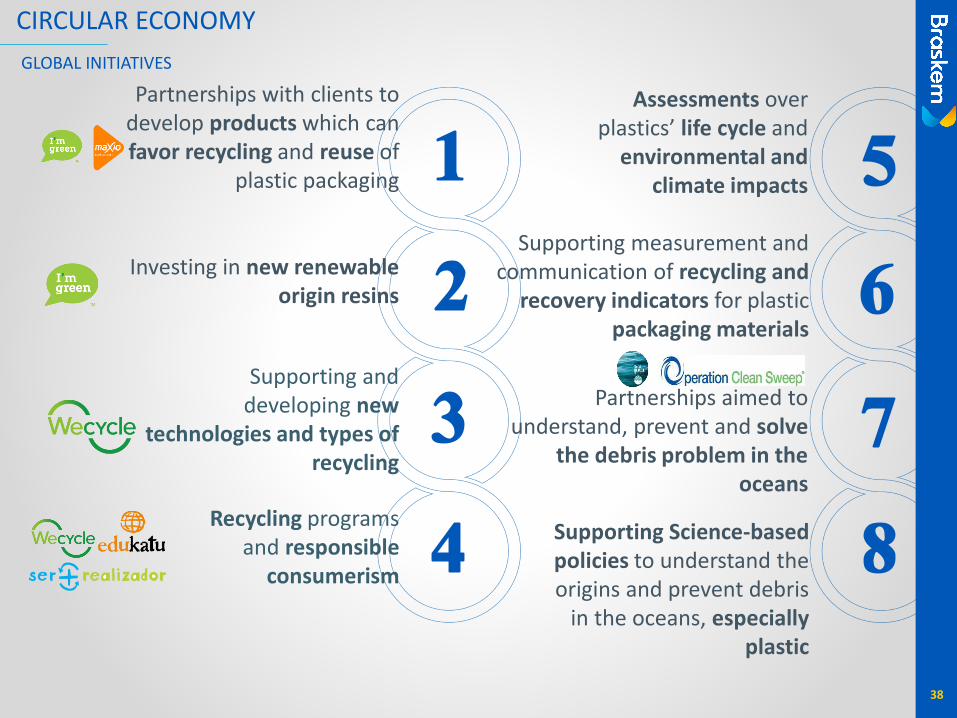
Partnerships with clients to develop products which can favor recycling and reuse of
plastic packaging
Investing in new renewable origin resins
Supporting and developing new
technologies and types of recycling
Recycling programs and responsible
consumerism
Assessments over plastics’ life cycle and
environmental and climate impacts
Partnerships aimed to understand, prevent and solve
the debris problem in the oceans
Supporting Science-based policies to understand the origins and prevent debris
in the oceans, especially plastic
CIRCULAR ECONOMY
38
GLOBAL INITIATIVES
Supporting measurement and communication of recycling and
recovery indicators for plastic packaging materials

39
SCEN
AR
IO
*Souce: IHS
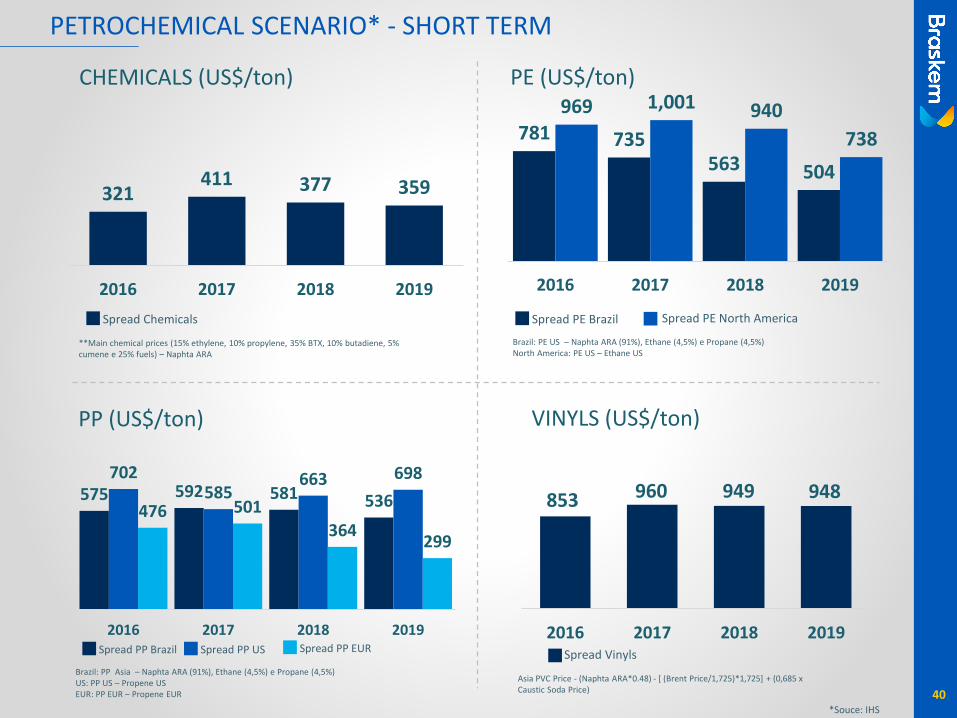
PETROCHEMICAL SCENARIO* - SHORT TERM
40
781 735563 504
969 1,001 940
738
2016 2017 2018 2019
PE (US$/ton)
**Main chemical prices (15% ethylene, 10% propylene, 35% BTX, 10% butadiene, 5% cumene e 25% fuels) – Naphta ARA
321411 377 359
2016 2017 2018 2019
CHEMICALS (US$/ton)
Spread Chemicals
Brazil: PE US – Naphta ARA (91%), Ethane (4,5%) e Propane (4,5%)North America: PE US – Ethane US
Spread PE Brazil Spread PE North America
Brazil: PP Asia – Naphta ARA (91%), Ethane (4,5%) e Propane (4,5%)US: PP US – Propene USEUR: PP EUR – Propene EUR
575 592 581 536
702585
663 698
476 501
364299
2016 2017 2018 2019
PP (US$/ton)
Spread VinylsSpread PP Brazil Spread PP US
Asia PVC Price - (Naphta ARA*0.48) - [ (Brent Price/1,725)*1,725] + (0,685 x Caustic Soda Price)
Spread PP EUR2016 2017 2018 2019
VINYLS (US$/ton)
960853 949 948
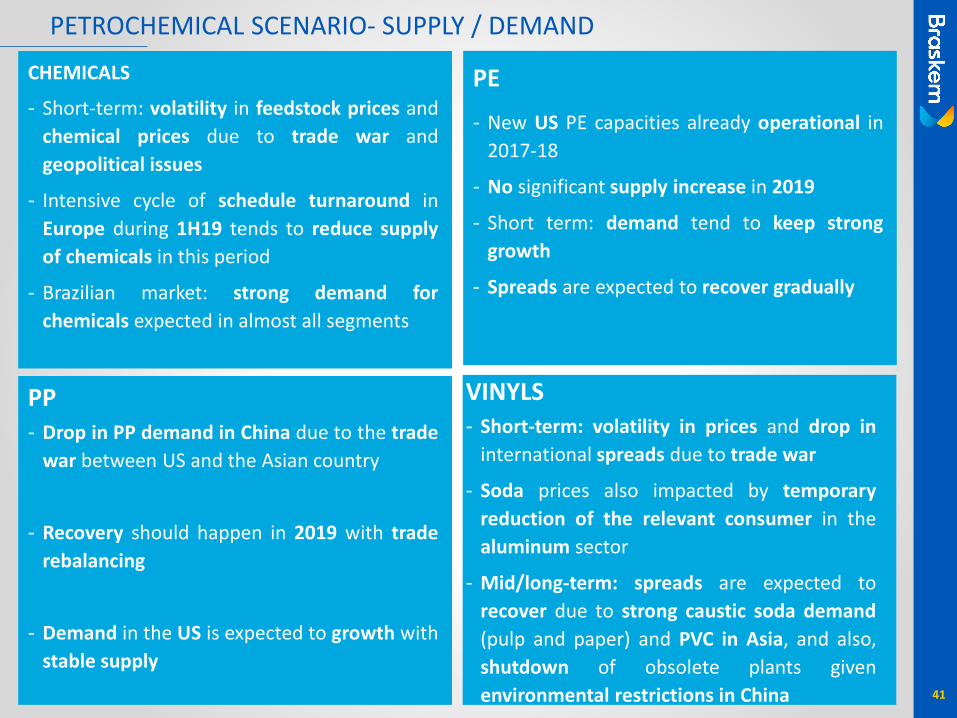
PETROCHEMICAL SCENARIO- SUPPLY / DEMAND
PE
- New US PE capacities already operational in
2017-18
- No significant supply increase in 2019
- Short term: demand tend to keep strong
growth
- Spreads are expected to recover gradually
41
CHEMICALS
- Short-term: volatility in feedstock prices and
chemical prices due to trade war and
geopolitical issues
- Intensive cycle of schedule turnaround in
Europe during 1H19 tends to reduce supply
of chemicals in this period
- Brazilian market: strong demand for
chemicals expected in almost all segments
VINYLS- Short-term: volatility in prices and drop in
international spreads due to trade war
- Soda prices also impacted by temporary
reduction of the relevant consumer in the
aluminum sector
- Mid/long-term: spreads are expected to
recover due to strong caustic soda demand
(pulp and paper) and PVC in Asia, and also,
shutdown of obsolete plants given
environmental restrictions in China
PP- Drop in PP demand in China due to the trade
war between US and the Asian country
- Recovery should happen in 2019 with trade
rebalancing
- Demand in the US is expected to growth with
stable supply
42
PR
IOR
ITIES
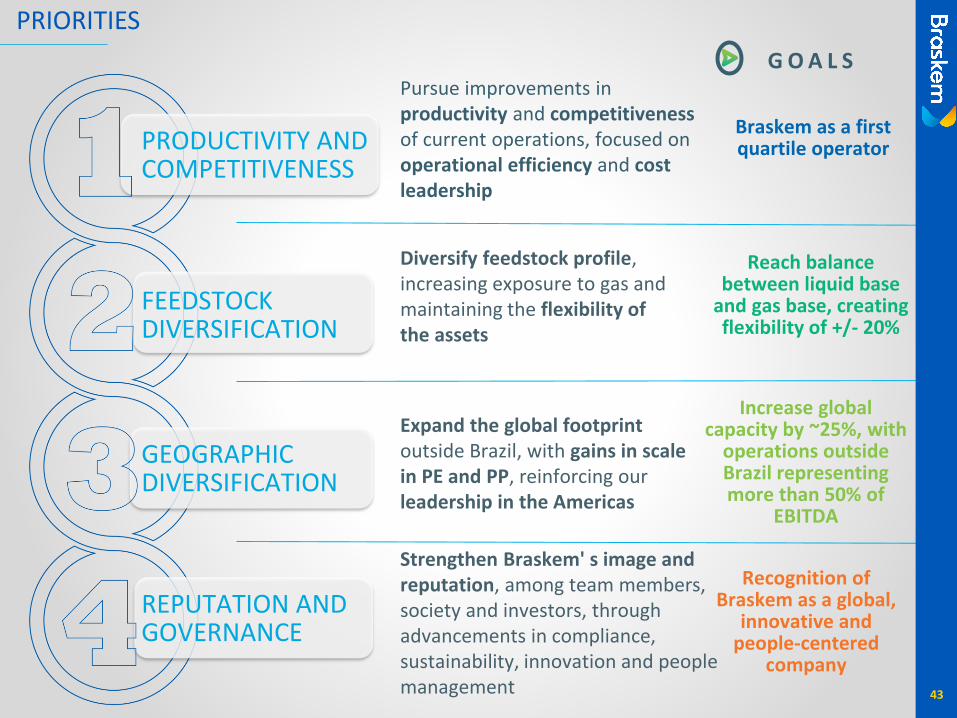
Pursue improvements in productivity and competitivenessof current operations, focused on operational efficiency and cost leadership
Braskem as a first quartile operator
Diversify feedstock profile, increasing exposure to gas and maintaining the flexibility of the assets
Reach balance between liquid base
and gas base, creating flexibility of +/- 20%
Expand the global footprint outside Brazil, with gains in scale in PE and PP, reinforcing our leadership in the Americas
Increase global capacity by ~25%, with
operations outside Brazil representing more than 50% of
EBITDA
Strengthen Braskem' s image and reputation, among team members, society and investors, through advancements in compliance, sustainability, innovation and people management
Recognition of Braskem as a global,
innovative and people-centered
company
G O A L S
PRIORITIES
43
PRODUCTIVITY AND COMPETITIVENESS
FEEDSTOCK DIVERSIFICATION
GEOGRAPHIC DIVERSIFICATION
REPUTATION AND GOVERNANCE

MEETING WITH INVESTORS
SÃO PAULO, NOVEMBER 13, 2018
45
BRASKEM S.A.