Embed Size (px)
Citation preview
The Weekly Dig – July 7, 2017 Mick Carew, PhD [email protected]
Emma Boggio, MSA, CPA, CA604-697-6166 [email protected]
and the Haywood Mining Team
Member of the Canadian Investor Protection Fund
Please see page 37 or Analyst Certification, and pages 37 to 46 for Important Information and Legal Disclaimers, Rating Structure, and notes.
Gold Approaches $1,200 per Ounce Level Amid Surging U.S. Job Growth Figures
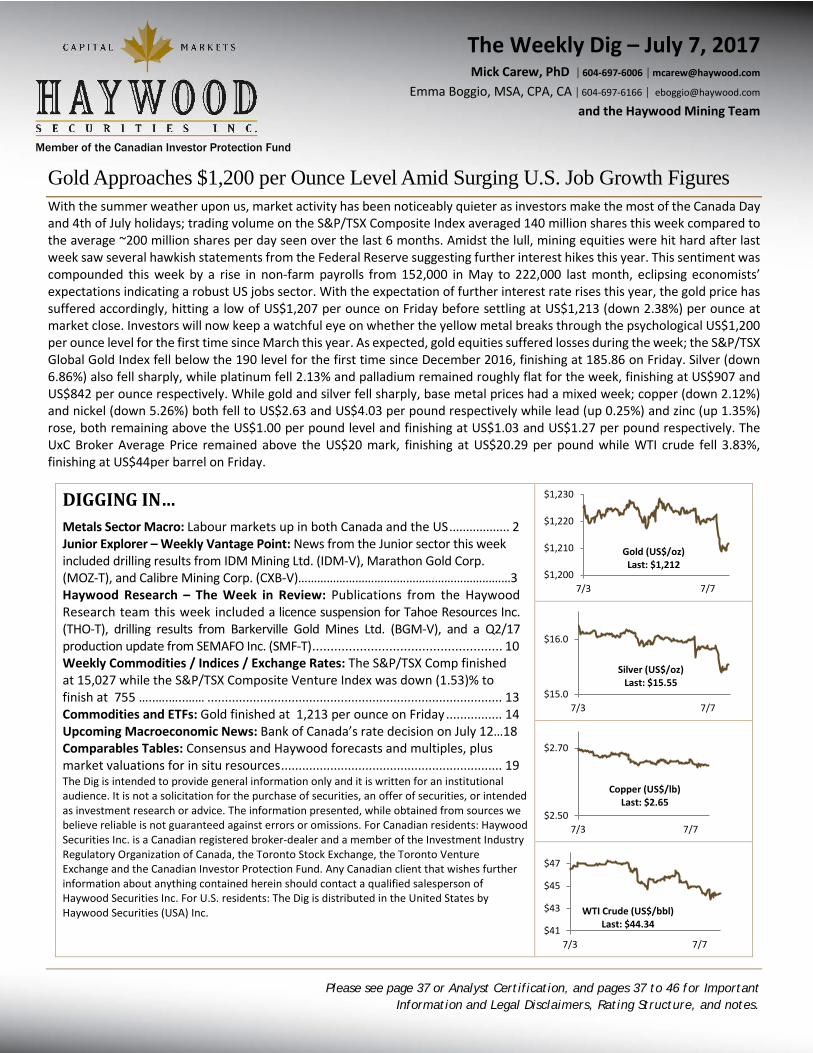
With the summer weather upon us, market activity has been noticeably quieter as investors make the most of the Canada Day and 4th of July holidays; trading volume on the S&P/TSX Composite Index averaged 140 million shares this week compared to the average ~200 million shares per day seen over the last 6 months. Amidst the lull, mining equities were hit hard after last week saw several hawkish statements from the Federal Reserve suggesting further interest hikes this year. This sentiment was compounded this week by a rise in non-farm payrolls from 152,000 in May to 222,000 last month, eclipsing economists’ expectations indicating a robust US jobs sector. With the expectation of further interest rate rises this year, the gold price has suffered accordingly, hitting a low of US$1,207 per ounce on Friday before settling at US$1,213 (down 2.38%) per ounce at market close. Investors will now keep a watchful eye on whether the yellow metal breaks through the psychological US$1,200 per ounce level for the first time since March this year. As expected, gold equities suffered losses during the week; the S&P/TSX Global Gold Index fell below the 190 level for the first time since December 2016, finishing at 185.86 on Friday. Silver (down 6.86%) also fell sharply, while platinum fell 2.13% and palladium remained roughly flat for the week, finishing at US$907 and US$842 per ounce respectively. While gold and silver fell sharply, base metal prices had a mixed week; copper (down 2.12%) and nickel (down 5.26%) both fell to US$2.63 and US$4.03 per pound respectively while lead (up 0.25%) and zinc (up 1.35%) rose, both remaining above the US$1.00 per pound level and finishing at US$1.03 and US$1.27 per pound respectively. The UxC Broker Average Price remained above the US$20 mark, finishing at US$20.29 per pound while WTI crude fell 3.83%, finishing at US$44per barrel on Friday.
DIGGING IN… Metals Sector Macro: Labour markets up in both Canada and the US .................. 2 Junior Explorer – Weekly Vantage Point: News from the Junior sector this week included drilling results from IDM Mining Ltd. (IDM-V), Marathon Gold Corp. (MOZ-T), and Calibre Mining Corp. (CXB-V)………………………….………………………………3 Haywood Research – The Week in Review: Publications from the Haywood Research team this week included a licence suspension for Tahoe Resources Inc. (THO-T), drilling results from Barkerville Gold Mines Ltd. (BGM-V), and a Q2/17 production update from SEMAFO Inc. (SMF-T) .................................................... 10 Weekly Commodities / Indices / Exchange Rates: The S&P/TSX Comp finished at 15,027 while the S&P/TSX Composite Venture Index was down (1.53)% to finish at 755 …..….…..…… .................................................................................... 13
Commodities and ETFs: Gold finished at 1,213 per ounce on Friday ................ 14 Upcoming Macroeconomic News: Bank of Canada’s rate decision on July 12…18 Comparables Tables: Consensus and Haywood forecasts and multiples, plus market valuations for in situ resources ............................................................... 19
The Dig is intended to provide general information only and it is written for an institutional audience. It is not a solicitation for the purchase of securities, an offer of securities, or intended as investment research or advice. The information presented, while obtained from sources we believe reliable is not guaranteed against errors or omissions. For Canadian residents: Haywood Securities Inc. is a Canadian registered broker-dealer and a member of the Investment Industry Regulatory Organization of Canada, the Toronto Stock Exchange, the Toronto Venture Exchange and the Canadian Investor Protection Fund. Any Canadian client that wishes further information about anything contained herein should contact a qualified salesperson of Haywood Securities Inc. For U.S. residents: The Dig is distributed in the United States by Haywood Securities (USA) Inc.
$1,200
$1,210
$1,220
$1,230
7/3 7/7
Gold (US$/oz)Last: $1,212
$15.0
$16.0
7/3 7/7
Silver (US$/oz)Last: $15.55
$2.50
$2.70
7/3 7/7
Copper (US$/lb)Last: $2.65
$41
$43
$45
$47
7/3 7/7
WTI Crude (US$/bbl)Last: $44.34

The Weekly Dig 7/7/17
Haywood Mining [email protected] Page 2
Metals Sector Macro
Macroeconomic News
United States Factory Orders fell 0.8% in May, as they surpassed surveyed expectations of a 0.5% decline, following April’s downwardly revised -0.3%. It was the biggest drop in new orders for U.S.-made goods since November 2016, as orders fell for transport equipment (-3%) and computers and electronic products (-0.2%). In addition, held down by weakness in petroleum and coal, non-durable goods fell 0.8% as did durable orders, finishing slightly better than surveyed expectations of a -1.0% decline.
According to the Mortgage Bankers Association (MBA), mortgage applications rose 1.4% in the week ended June 30, after the prior week’s 6.2% drop. Refinancing applications declined 0.4%, while applications to purchase a home increased by a seasonally adjusted 3.1%. The average fixed 30-year mortgage rate increased by 7 basis points to 4.2%.
After a downwardly revised ADP employment change of 230,000 in May, private businesses hired 158,000 workers in June (lower than market expectations of 183,000). The service-providing sector added all 158,000 jobs, boosted by professional and business (69,000); trade, transportation, and utilities (30,000); education and health (28,000); leisure and hospitality (11,000), and financial activities (10,000). Meanwhile, the goods-producing sector was flat as a 6,000 rise in manufacturing payrolls was offset by a 4,000 decline in natural resources and mining and a 2,000 drop in the construction sector.
Initial jobless claims came in at 248,000 for the week ending July 1 and finished above consensus estimates of 243,000. The 4-week average declined by 750 from the previous week’s average to the 243,000 level. Continuing claims, where data lag by a week, increased by 11,000 to 1.956 million. Meanwhile, the unemployment rate for insured workers (which excludes job leavers and re-entrants) remained low at an unchanged 1.4%.
The Trade Balance in the United States narrowed to a deficit of US$46.5 billion in May from the prior month’s US$47.6 billion gap a month earlier and finished below surveyed expectations of US$46.2 billion. Exports rose 0.4% to US$192 billion, the highest value in nearly 2 years boosted mainly by sales of consumer goods and cell phones. Imports dropped 0.1% to US$238.5 billion.
On Friday, it was announced that the change in non-farm payrolls beat surveyed expectations and finished June at 222,000, following May’s upwardly revised 152,000. However, despite June’s surge, the split between strength in demand for labor and weakness in wages is more acute than ever after June flat lined for average hourly earnings with only a 0.2% increase for the month. The unemployment rate stayed low in June finishing at 4.4% after May’s 4.3%.
Canada The seasonally adjusted Markit Manufacturing Purchasing Managers Index (PMI) declined to 54.7 in June 2017 from 55.1 in May. Although this reading pointed to the weakest expansion in factory activity since February, manufacturing companies remain upbeat about their prospects for growth over the next 12 months, which contributed to an increase in purchasing activity and inventories. In addition, production volumes expanded for the eighth month in a row.
Canada’s labour market beat expectation yet again in June, with 45,300 jobs added and unemployment falling by 18,600, despite expectations of only a 10,000 change in employment. According to Statistics Canada, of the jobs added, the majority were in part-time work. Also announced on Friday was a slight decrease in the unemployment rate from May’s 6.6% to June’s 6.5%
The Weekly Dig 7/7/17
Haywood Mining [email protected] Page 3
Junior Explorer: Weekly Vantage Point
News from the Junior sector this week included:
Mining Flashes Other News
• IDM Mining Ltd. (IDM-V) • Marathon Gold Corp. (MOZ-T) • Calibre Mining Corp. (CXB-V)
Mining Flashes
IDM Mining Ltd. (IDM-V, $0.14, [Not Rated]) – Drill Program Expanded at Red Mountain
Mick Carew, PhD [email protected], Emma Boggio, MSA, CPA, CA, [email protected]
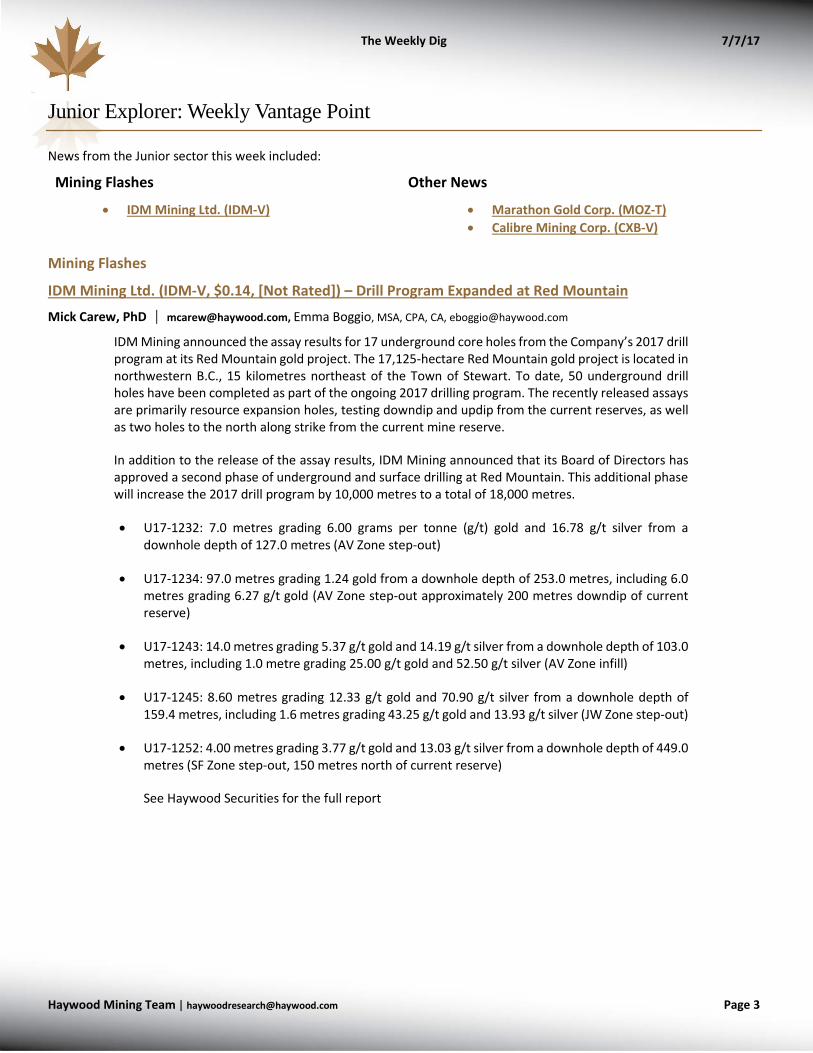
IDM Mining announced the assay results for 17 underground core holes from the Company’s 2017 drill program at its Red Mountain gold project. The 17,125-hectare Red Mountain gold project is located in northwestern B.C., 15 kilometres northeast of the Town of Stewart. To date, 50 underground drill holes have been completed as part of the ongoing 2017 drilling program. The recently released assays are primarily resource expansion holes, testing downdip and updip from the current reserves, as well as two holes to the north along strike from the current mine reserve.
In addition to the release of the assay results, IDM Mining announced that its Board of Directors has approved a second phase of underground and surface drilling at Red Mountain. This additional phase will increase the 2017 drill program by 10,000 metres to a total of 18,000 metres.
• U17-1232: 7.0 metres grading 6.00 grams per tonne (g/t) gold and 16.78 g/t silver from a downhole depth of 127.0 metres (AV Zone step-out)
• U17-1234: 97.0 metres grading 1.24 gold from a downhole depth of 253.0 metres, including 6.0 metres grading 6.27 g/t gold (AV Zone step-out approximately 200 metres downdip of current reserve)
• U17-1243: 14.0 metres grading 5.37 g/t gold and 14.19 g/t silver from a downhole depth of 103.0 metres, including 1.0 metre grading 25.00 g/t gold and 52.50 g/t silver (AV Zone infill)
• U17-1245: 8.60 metres grading 12.33 g/t gold and 70.90 g/t silver from a downhole depth of 159.4 metres, including 1.6 metres grading 43.25 g/t gold and 13.93 g/t silver (JW Zone step-out)
• U17-1252: 4.00 metres grading 3.77 g/t gold and 13.03 g/t silver from a downhole depth of 449.0 metres (SF Zone step-out, 150 metres north of current reserve)
See Haywood Securities for the full report
The Weekly Dig 7/7/17
Haywood Mining [email protected] Page 4
Other News
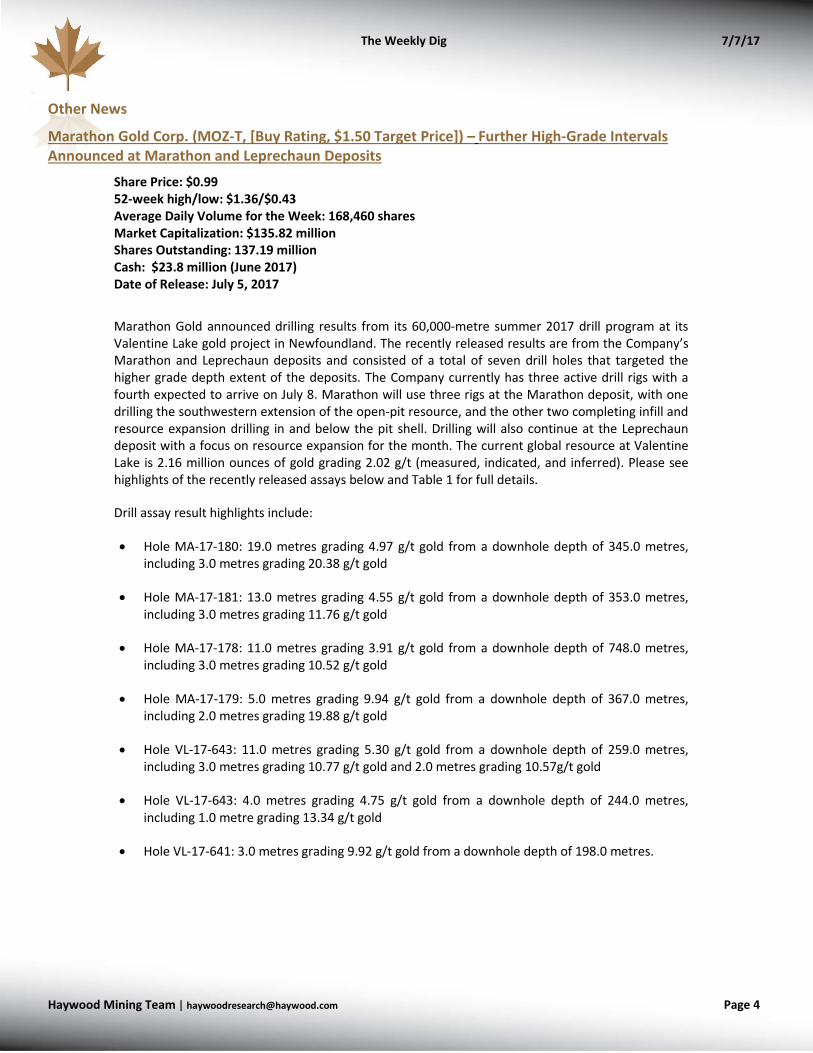
Marathon Gold Corp. (MOZ-T, [Buy Rating, $1.50 Target Price]) – Further High-Grade Intervals Announced at Marathon and Leprechaun Deposits
Share Price: $0.99 52-week high/low: $1.36/$0.43 Average Daily Volume for the Week: 168,460 shares Market Capitalization: $135.82 million Shares Outstanding: 137.19 million Cash: $23.8 million (June 2017) Date of Release: July 5, 2017
Marathon Gold announced drilling results from its 60,000-metre summer 2017 drill program at its Valentine Lake gold project in Newfoundland. The recently released results are from the Company’s Marathon and Leprechaun deposits and consisted of a total of seven drill holes that targeted the higher grade depth extent of the deposits. The Company currently has three active drill rigs with a fourth expected to arrive on July 8. Marathon will use three rigs at the Marathon deposit, with one drilling the southwestern extension of the open-pit resource, and the other two completing infill and resource expansion drilling in and below the pit shell. Drilling will also continue at the Leprechaun deposit with a focus on resource expansion for the month. The current global resource at Valentine Lake is 2.16 million ounces of gold grading 2.02 g/t (measured, indicated, and inferred). Please see highlights of the recently released assays below and Table 1 for full details.
Drill assay result highlights include:
• Hole MA-17-180: 19.0 metres grading 4.97 g/t gold from a downhole depth of 345.0 metres, including 3.0 metres grading 20.38 g/t gold
• Hole MA-17-181: 13.0 metres grading 4.55 g/t gold from a downhole depth of 353.0 metres, including 3.0 metres grading 11.76 g/t gold
• Hole MA-17-178: 11.0 metres grading 3.91 g/t gold from a downhole depth of 748.0 metres, including 3.0 metres grading 10.52 g/t gold
• Hole MA-17-179: 5.0 metres grading 9.94 g/t gold from a downhole depth of 367.0 metres, including 2.0 metres grading 19.88 g/t gold
• Hole VL-17-643: 11.0 metres grading 5.30 g/t gold from a downhole depth of 259.0 metres, including 3.0 metres grading 10.77 g/t gold and 2.0 metres grading 10.57g/t gold
• Hole VL-17-643: 4.0 metres grading 4.75 g/t gold from a downhole depth of 244.0 metres, including 1.0 metre grading 13.34 g/t gold
• Hole VL-17-641: 3.0 metres grading 9.92 g/t gold from a downhole depth of 198.0 metres.
The Weekly Dig 7/7/17
Haywood Mining [email protected] Page 5
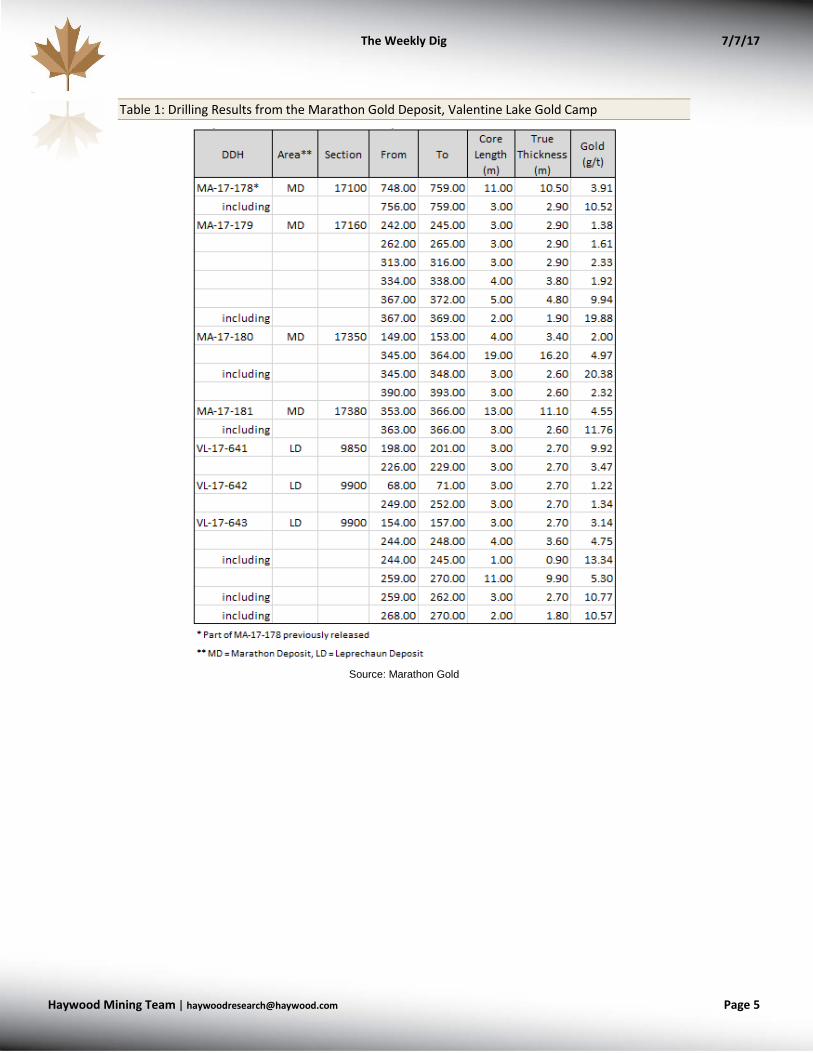
Table 1: Drilling Results from the Marathon Gold Deposit, Valentine Lake Gold Camp
Source: Marathon Gold
The Weekly Dig 7/7/17
Haywood Mining [email protected] Page 6
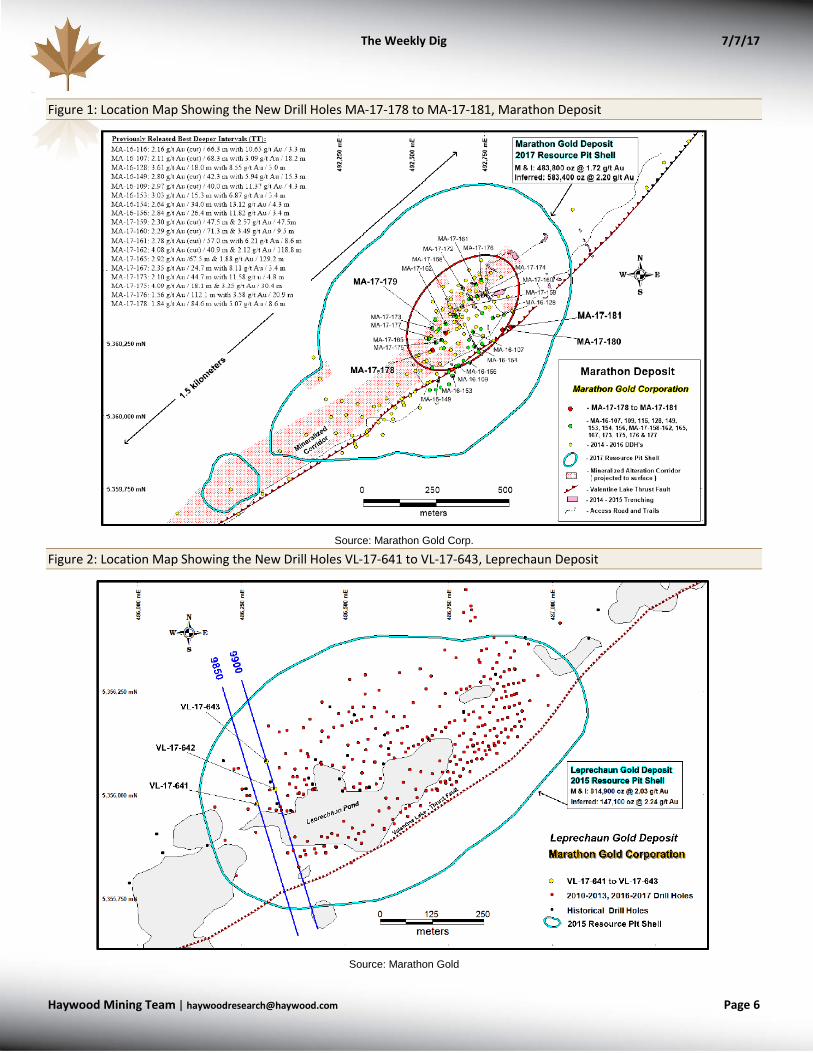
Figure 1: Location Map Showing the New Drill Holes MA-17-178 to MA-17-181, Marathon Deposit
Source: Marathon Gold Corp.
Figure 2: Location Map Showing the New Drill Holes VL-17-641 to VL-17-643, Leprechaun Deposit
Source: Marathon Gold

The Weekly Dig 7/7/17
Haywood Mining [email protected] Page 7
Calibre Mining Corp. (CXB-V, [Not Rated]) – Initial Results from 2017 Maiden Drilling Program
Share Price: $0.15 52-week high/low: $0.30/$0.10 Average Daily Volume for the Week: 59,870 shares Market Capitalization: $46.9 million Shares Outstanding: 312.67 million Cash: $5.74 million (Mar. 31, 2017) Date of Release: July 5, 2017 Earlier this week, Calibre Mining announced the initial drilling results from its maiden drilling program on its 100% owned Santa Maria Gold-Copper-Zinc Project in Nicaragua. The 2017 maiden drill program at Santa Maria consists of 13 diamond drill holes totaling 2100 metres. To date, results have been received for 8 drill holes (please see Table 1 below). The recent results support a northern 300 metres of gold-silver mineralization with high copper which transitions to the south where it is characterized by moderate copper and high zinc. Mineralization remains open along strike and to depth with the Santa Maria gold in soil anomaly having been traced for over 3 kilometers.
Please see highlights below and full details in Table 1.
• Drill Hole SM17-001: 4.95 metres grading 4.16 AuEq g/t (1.51 g/t gold, 24.70 g/t silver, 1.72 % Copper) from a downhole depth of 70.0 metres, including 1.30 metres grading 8.05 AuEq g/t;
• Drill Hole SM17-003: 2.10 metres grading 7.84 AuEq g/t (7.21 g/t gold, 10.90 g/t silver, 0.33% Copper) from a downhole depth of 99.9 metres, including 1.0 metres grading 14.87 AuEq g/t; and
• Drill Hole SM17-008: 2.65 metres grading 5.26 AuEq g/t (3.58 g/t gold, 16.40 g/t silver, 0.29% Copper, and 1.65% zinc) from a downhole depth of 57.7 metres, including 0.95 metres grading 11.74 AuEq g/t.
Table 1: Drilling Results from the Santa Maria Gold-Copper-Zinc Project
Source: Calibre Mining

The Weekly Dig 7/7/17
Haywood Mining [email protected] Page 8
Performance of Companies Included in Junior X and Notable News Flow
Source: Capital IQ and Haywood Securities
Close Price Market Capitalization
Cash at Quarter End Weekly Performance QTD Performance
QTD Performance vs. TSXV Index
Company Ticker (C$) (C$M) (C$M)Junior Exploration Names Antler Gold Inc. TSXV:ANTL 0.33 12.64 3.50 6.5% (16.1)% (8.2)%Aurion Resources Ltd. TSXV:AU 1.83 117.41 12.00 (3.2)% 0.5% 8.5%Auryn Resources Inc. TSX:AUG 2.98 229.46 40.00 (2.3)% (14.9)% (6.9)%Calibre M ining Corp. TSXV:CXB 0.15 46.90 5.20 0.0% (30.2)% (22.3)%Cordoba Minerals Corp. TSXV:CDB 0.71 62.33 2.00 (5.3)% (37.7)% (29.8)%IDM Mining Ltd. TSXV:IDM 0.13 48.48 20.00 (3.7)% (21.2)% (13.3)%Kenadyr M ining (Holdings) Corp. TSXV:KEN 0.34 28.96 8.50 (1.4)% (60.0)% (52.1)%Monarques Gold Corporation TSXV:MQR 0.33 47.79 9.52 (5.8)% (8.5)% (0.5)%Nighthawk Gold Corp. TSX:NHK 0.70 137.49 37.00 (13.6)% (21.3)% (13.4)%Plateau Uranium Inc. TSXV:PLU 0.30 19.15 2.50 (10.4)% (43.4)% (35.5)%Pure Gold M ining Inc. TSXV:PGM 0.49 93.85 17.50 (9.3)% (18.3)% (10.4)%Purepoint Uranium Group Inc. TSXV:PTU 0.07 12.30 1.00 (7.1)% (31.6)% (23.7)%Red Eagle Exploration Limited TSXV:XR 0.11 44.95 1.00 (8.3)% (43.6)% (35.7)%Regulus Resources Inc. TSXV:REG 1.49 105.71 11.50 (3.2)% (14.9)% (6.9)%Rupert Resources Ltd. TSXV:RUP 1.15 115.85 10.00 0.0% (12.9)% (5.0)%Vendetta M ining Corp. TSXV:VTT 0.30 32.91 0.35 13.2% 39.5% 47.4%Other Companies in the News No other news for the week
The Weekly Dig 7/7/17
Haywood Mining [email protected] Page 9
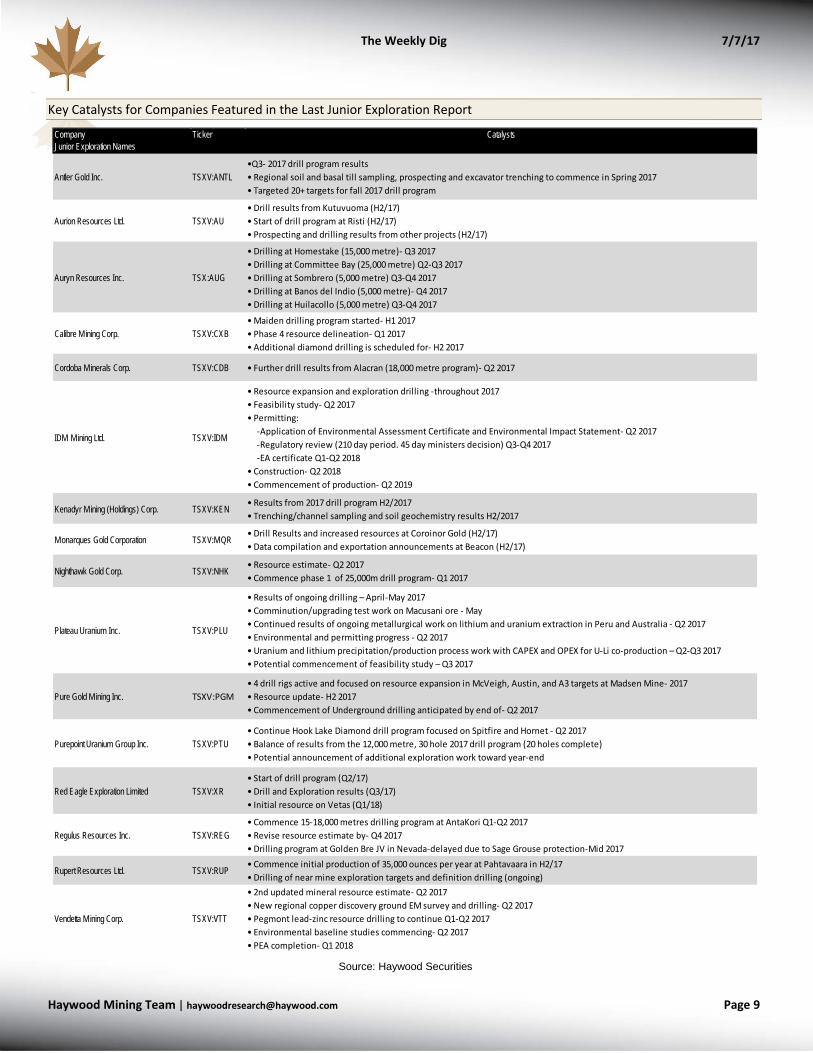
Key Catalysts for Companies Featured in the Last Junior Exploration Report
Source: Haywood Securities
Company Ticker CatalystsJunior Exploration Names
Antler Gold Inc. TSXV:ANTL•Q3- 2017 drill program results• Regional soil and basal till sampling, prospecting and excavator trenching to commence in Spring 2017• Targeted 20+ targets for fall 2017 drill program
Aurion Resources Ltd. TSXV:AU• Drill results from Kutuvuoma (H2/17)• Start of drill program at Risti (H2/17)• Prospecting and drilling results from other projects (H2/17)
Auryn Resources Inc. TSX:AUG
• Drilling at Homestake (15,000 metre)- Q3 2017• Drilling at Committee Bay (25,000 metre) Q2-Q3 2017• Drilling at Sombrero (5,000 metre) Q3-Q4 2017 • Drilling at Banos del Indio (5,000 metre)- Q4 2017• Drilling at Huilacollo (5,000 metre) Q3-Q4 2017
Calibre M ining Corp. TSXV:CXB• Maiden drilling program started- H1 2017• Phase 4 resource delineation- Q1 2017• Additional diamond drilling is scheduled for- H2 2017
Cordoba Minerals Corp. TSXV:CDB • Further drill results from Alacran (18,000 metre program)- Q2 2017
IDM Mining Ltd. TSXV:IDM
• Resource expansion and exploration drilling -throughout 2017• Feasibility study- Q2 2017• Permitting: -Application of Environmental Assessment Certificate and Environmental Impact Statement- Q2 2017 -Regulatory review (210 day period. 45 day ministers decision) Q3-Q4 2017 -EA certificate Q1-Q2 2018• Construction- Q2 2018• Commencement of production- Q2 2019
Kenadyr M ining (Holdings) Corp. TSXV:KEN• Results from 2017 drill program H2/2017• Trenching/channel sampling and soil geochemistry results H2/2017
Monarques Gold Corporation TSXV:MQR• Drill Results and increased resources at Coroinor Gold (H2/17)• Data compilation and exportation announcements at Beacon (H2/17)
Nighthawk Gold Corp. TSXV:NHK• Resource estimate- Q2 2017• Commence phase 1 of 25,000m drill program- Q1 2017
Plateau Uranium Inc. TSXV:PLU
• Results of ongoing drilling – April-May 2017• Comminution/upgrading test work on Macusani ore - May• Continued results of ongoing metallurgical work on lithium and uranium extraction in Peru and Australia - Q2 2017• Environmental and permitting progress - Q2 2017• Uranium and lithium precipitation/production process work with CAPEX and OPEX for U-Li co-production – Q2-Q3 2017• Potential commencement of feasibility study – Q3 2017
Pure Gold M ining Inc. TSXV:PGM• 4 drill rigs active and focused on resource expansion in McVeigh, Austin, and A3 targets at Madsen Mine- 2017• Resource update- H2 2017• Commencement of Underground drilling anticipated by end of- Q2 2017
Purepoint Uranium Group Inc. TSXV:PTU• Continue Hook Lake Diamond drill program focused on Spitfire and Hornet - Q2 2017• Balance of results from the 12,000 metre, 30 hole 2017 drill program (20 holes complete)• Potential announcement of additional exploration work toward year-end
Red Eagle Exploration Limited TSXV:XR• Start of drill program (Q2/17)• Drill and Exploration results (Q3/17)• Initial resource on Vetas (Q1/18)
Regulus Resources Inc. TSXV:REG• Commence 15-18,000 metres drilling program at AntaKori Q1-Q2 2017• Revise resource estimate by- Q4 2017• Drilling program at Golden Bre JV in Nevada-delayed due to Sage Grouse protection-Mid 2017
Rupert Resources Ltd. TSXV:RUP• Commence initial production of 35,000 ounces per year at Pahtavaara in H2/17• Drilling of near mine exploration targets and definition drilling (ongoing)
Vendetta M ining Corp. TSXV:VTT
• 2nd updated mineral resource estimate- Q2 2017• New regional copper discovery ground EM survey and drilling- Q2 2017• Pegmont lead-zinc resource drilling to continue Q1-Q2 2017• Environmental baseline studies commencing- Q2 2017• PEA completion- Q1 2018
The Weekly Dig 7/7/17
Haywood Mining [email protected] Page 10
Haywood Research: The Week in Review
Publications from the Haywood Research team for the week included the following:
• Licence Suspension for Tahoe Resources Inc. (THO-T)
• Drilling results from Barkerville Gold Mines Ltd. (BGM-V)
• Q2/17 Production from SEMAFO Inc. (SMF-T)
Research Report
Tahoe Resources Inc. (THO-T, TAHO-N; $10.76, [Sell Rating, $9.00 Target Price]) – Escobal Mining Licence Suspended
Geordie Mark, PhD, FAusIMM, [email protected]; Alvin Islam, GIT, [email protected]
Escobal Mining Licence Suspended – The Supreme Court of Guatemala issued a provisional decision to suspend the Escobal mining licence as a result of action brought forward by CALAS against the Ministry of Energy and Mines. CALAS has provided allegations that Guatemala’s Ministry of Energy and Mines violated the Xinca indigenous people’s right of consultation in advance of granting the project mining licence to the Company’s Guatemalan subsidiary (Minera San Rafael).
Escobal Mine Will Be Placed on Standby on the Formal Receipt of the Order to Temporarily Suspend the Mining Licence – The Company believes that the period potentially required to undertake the consultation processes and to reconsider the issue of the licence could range between 6 and 12 months. While the Company is clearly taking all steps to have the Escobal venture back on line as soon as possible (potentially within the consultation period), the definition of an absolute timeframe for resolution of such actions is outside the Company’s control and as such represents a risk to the operation’s near-term output potential. Consequently, we now project no production from the mine for the remainder of 2017, and will track legal progress to monitor any further changes in our estimates.
New 2017 Forecasts – Our revised expectations project annual revenues of US$735 million driving earnings before interest, taxes, depreciation, and amortization (EBITDA) of US$300 million and cash flow (before changes in working capital) of US$0.80 per share. Annual production is projected to comprise 10.6 million ounces of payable silver, 412,000 ounces of gold, 13.5 million pounds of zinc, and 10 million pounds of lead at a cash cost of US$6.62/oz of silver equivalent. General Q2/17 production of more than 4 million ounces of silver and 110,000 ounces of gold was collectively broadly in line with expectations for quarter cash at US$165 million.
See Haywood Securities for the full report
The Weekly Dig 7/7/17
Haywood Mining [email protected] Page 11
Radar Flashes
Barkerville Gold Mines Ltd. (BGM-V, $0.90 [Buy Rating, $1.60 Target Price]) – Continuity of High-Grade Mineralization Between Island and Cow Mountain
Mick Carew, PhD [email protected], Emma Boggio, MSA, CPA, CA, [email protected]
Barkerville announced additional drilling results from its ongoing 130,000-metre Phase II program at its Caribou project in British Columbia. The latest results are from the Shaft Zone (situated at Island Mountain) and the Valley Zone (situated between the Island Mountain and Cow Mountain deposits). The Company is currently exploring and delineating these zones with seven drill rigs, while an eighth drill rig is conducting exploratory drilling on Barkerville Mountain. The Company’s released drilling results from theses Zone continue to be positive, as they support continuity of gold mineralization between Island Mountain and Cow Mountain.
Highlights include:
• Drill Hole CM-17-057: 7.50 metres grading 17.30 g/t gold from a downhole depth of 215.15 metres, including 0.65 metre grading 57.40 g/t gold, 0.60 metre grading 115.50 g/t gold, and 0.60 metre grading 29.40 g/t gold
• Drill Hole CM-17-048: 4.55 metres grading 12.27 g/t gold from a downhole depth of 165.60 metres, including 0.70 metre grading 70.80 g/t gold
• Drill Hole CM-17-053: 3.00 metres grading 11.33 g/t gold from a downhole depth of 140.00 metres, including 0.50 metre grading 54.10 g/t gold
• Drill Hole IM-17-103: 5.75 metres grading 9.65 g/t gold from a downhole depth of 399.50 metres, including 0.70 metre grading 37.00 g/t gold and 0.95 metre grading 24.50 g/t gold.
See Haywood Securities for the full report
SEMAFO Inc. (SMF-T, $2.86, [Buy Rating, $4.50 Target Price]) – Q2 Production Slightly Better Than Guidance
Kerry Smith, MBA, PEng, [email protected]; Danny Ochoa, CFA, [email protected]
Q2/17 Production 6% Above (Lowered) Expectations – SEMAFO reported Q2/17 production totalling 47,600 ounces of gold, which was above the Company’s latest guidance for the quarter of 45,000 ounces. With the release of Q1/17 production results in late April, SEMAFO lowered its 2017 guidance about 12%, and guided towards Q2/17 production of 45,000 ounces. Production guidance was lowered owing to an incorrect geological interpretation in the upper portion of Zone 9 at Siou, which will be mined out in early Q3.
2017 Production Guidance Reiterated – SEMAFO reiterated its full-year production guidance of between 190,000 and 205,000 ounces of gold and an all-in sustaining cost (AISC) of between US$920 and US$960/oz. For the year, we forecast total production of 200,000 ounces at a total cash cost of US$715/oz and AISC of US$1,035/oz. For the first half of the year, production has totalled 103,000 ounces.
The Weekly Dig 7/7/17
Haywood Mining [email protected] Page 12
Additional US$60 Million Drawn Down on Credit Facility – On June 20, SEMAFO announced it had drawn down an incremental US$60 million of its credit facility with Macquarie Bank, for a total drawdown of US$120 million. The credit facility is repayable in eight quarterly instalments of US$15 million, starting in March 31, 2019. At March 31, 2017, SEMAFO’s cash balance stood at US$255 million, and US$193 million remained to be spent on development of the Boungou mine. While SEMAFO could fund Boungou development from its existing cash balance, the credit facility provides additional financial flexibility. Boungou will be in production in H2/18, and we model full-year production in 2019 of 225,000 ounces at a total cash cost of US$360/oz.
See Haywood Securities for the full report

The Weekly Dig 7/7/17
Haywood Mining [email protected] Page 13
Weekly Commodities / Indices / Exchange Rates
Source: Haywood Securities
Metal and Currency Prices for the Week
Source: Haywood Securities
14,800
15,000
15,200
7/4 7/7
S&P/TSX Composite IndexLast: 15,027 178
183
188
193
198
7/4 7/7
S&P/TSX Global Gold IndexLast: 185.86
21,050
21,250
21,450
7/3 7/7
Dow Jones Industrial AverageLast: 21,414
740
750
760
770
7/4 7/7
S&P/TSX Venture Comp IndexLast: 755
95
99
103
107
7/4 7/7
S&P/TSX Global Base Metals IndexLast: 102.18
2,380
2,400
2,420
2,440
7/3 7/7
S&P 500 IndexLast: 2,425
The Weekly Dig 7/7/17
Haywood Mining [email protected] Page 14
Commodities and ETFs: A Week in Action
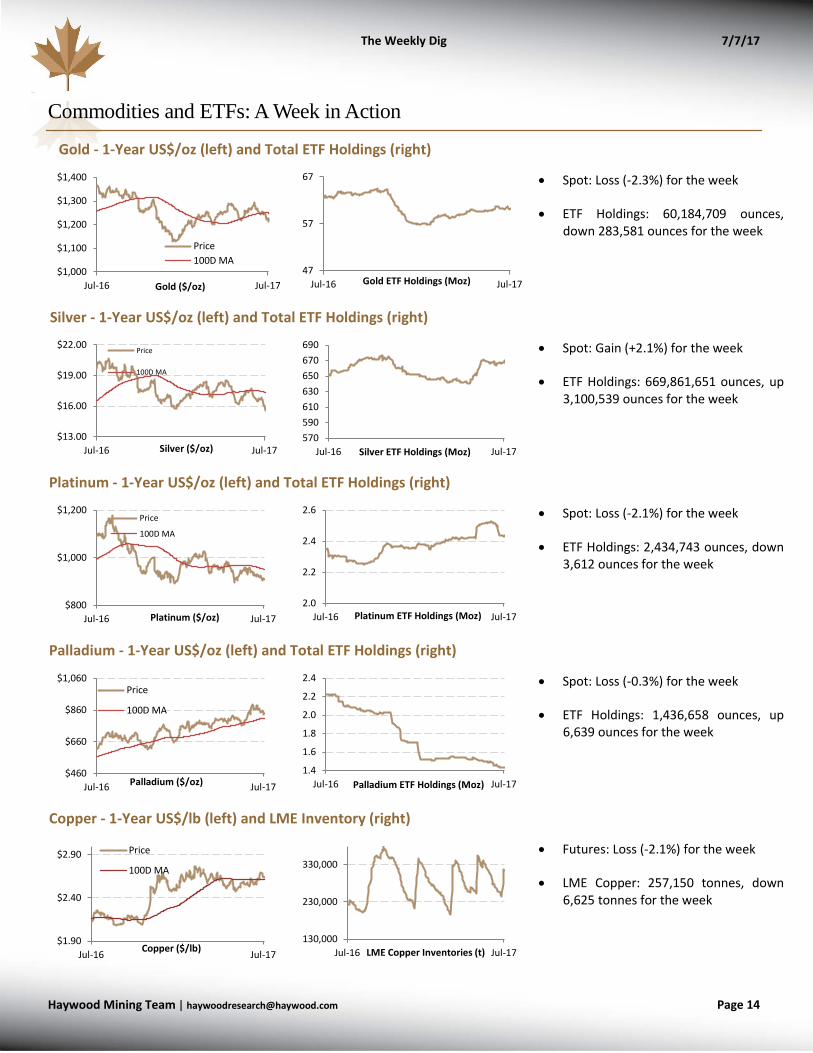
Gold - 1-Year US$/oz (left) and Total ETF Holdings (right)
• Spot: Loss (-2.3%) for the week
• ETF Holdings: 60,184,709 ounces, down 283,581 ounces for the week
Silver - 1-Year US$/oz (left) and Total ETF Holdings (right)
• Spot: Gain (+2.1%) for the week
• ETF Holdings: 669,861,651 ounces, up 3,100,539 ounces for the week
Platinum - 1-Year US$/oz (left) and Total ETF Holdings (right)
• Spot: Loss (-2.1%) for the week
• ETF Holdings: 2,434,743 ounces, down 3,612 ounces for the week
Palladium - 1-Year US$/oz (left) and Total ETF Holdings (right)
• Spot: Loss (-0.3%) for the week
• ETF Holdings: 1,436,658 ounces, up 6,639 ounces for the week
Copper - 1-Year US$/lb (left) and LME Inventory (right)
• Futures: Loss (-2.1%) for the week
• LME Copper: 257,150 tonnes, down 6,625 tonnes for the week
$1,000
$1,100
$1,200
$1,300
$1,400
Jul-16 Jul-17Gold ($/oz)
Price100D MA
47
57
67
Jul-16 Jul-17Gold ETF Holdings (Moz)
$13.00
$16.00
$19.00
$22.00
Jul-16 Jul-17Silver ($/oz)
Price
100D MA
570590610630650670690
Jul-16 Jul-17Silver ETF Holdings (Moz)
$800
$1,000
$1,200
Jul-16 Jul-17Platinum ($/oz)
Price
100D MA
2.0
2.2
2.4
2.6
Jul-16 Jul-17Platinum ETF Holdings (Moz)
$460
$660
$860
$1,060
Jul-16 Jul-17Palladium ($/oz)
Price
100D MA
1.4
1.6
1.8
2.0
2.2
2.4
Jul-16 Jul-17Palladium ETF Holdings (Moz)
$1.90
$2.40
$2.90
Jul-16 Jul-17Copper ($/lb)
Price
100D MA
130,000
230,000
330,000
Jul-16 Jul-17LME Copper Inventories (t)
The Weekly Dig 7/7/17
Haywood Mining [email protected] Page 15
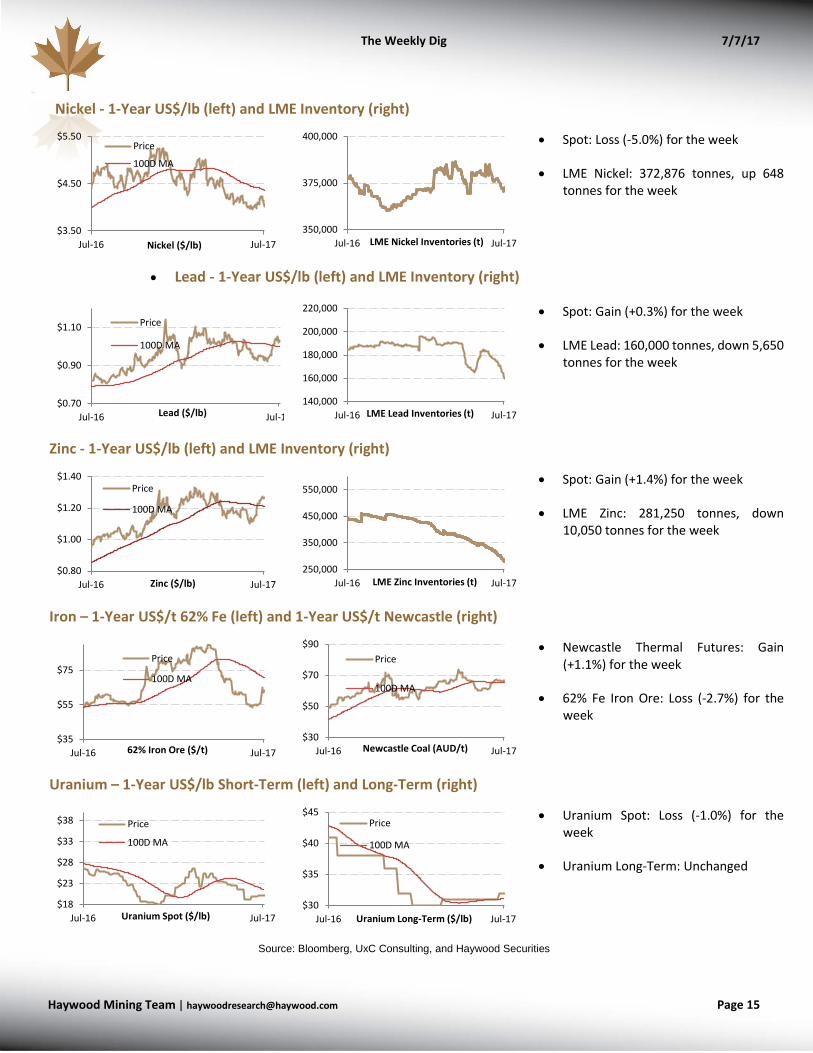
Nickel - 1-Year US$/lb (left) and LME Inventory (right)
• Spot: Loss (-5.0%) for the week
• LME Nickel: 372,876 tonnes, up 648 tonnes for the week
• Lead - 1-Year US$/lb (left) and LME Inventory (right)
• Spot: Gain (+0.3%) for the week
• LME Lead: 160,000 tonnes, down 5,650 tonnes for the week
Zinc - 1-Year US$/lb (left) and LME Inventory (right)
• Spot: Gain (+1.4%) for the week
• LME Zinc: 281,250 tonnes, down 10,050 tonnes for the week
Iron – 1-Year US$/t 62% Fe (left) and 1-Year US$/t Newcastle (right)
• Newcastle Thermal Futures: Gain (+1.1%) for the week
• 62% Fe Iron Ore: Loss (-2.7%) for the week
Uranium – 1-Year US$/lb Short-Term (left) and Long-Term (right)
• Uranium Spot: Loss (-1.0%) for the week
• Uranium Long-Term: Unchanged
Source: Bloomberg, UxC Consulting, and Haywood Securities
$3.50
$4.50
$5.50
Jul-16 Jul-17Nickel ($/lb)
Price
100D MA
350,000
375,000
400,000
Jul-16 Jul-17LME Nickel Inventories (t)
$0.70
$0.90
$1.10
Jul-16 Jul-1Lead ($/lb)
Price
100D MA
140,000
160,000
180,000
200,000
220,000
Jul-16 Jul-17LME Lead Inventories (t)
$0.80
$1.00
$1.20
$1.40
Jul-16 Jul-17Zinc ($/lb)
Price
100D MA
250,000
350,000
450,000
550,000
Jul-16 Jul-17LME Zinc Inventories (t)
$35
$55
$75
Jul-16 Jul-1762% Iron Ore ($/t)
Price
100D MA
$30
$50
$70
$90
Jul-16 Jul-17Newcastle Coal (AUD/t)
Price
100D MA
$18
$23
$28
$33
$38
Jul-16 Jul-17Uranium Spot ($/lb)
Price
100D MA
$30
$35
$40
$45
Jul-16 Jul-17Uranium Long-Term ($/lb)
Price
100D MA
The Weekly Dig 7/7/17
Haywood Mining [email protected] Page 16
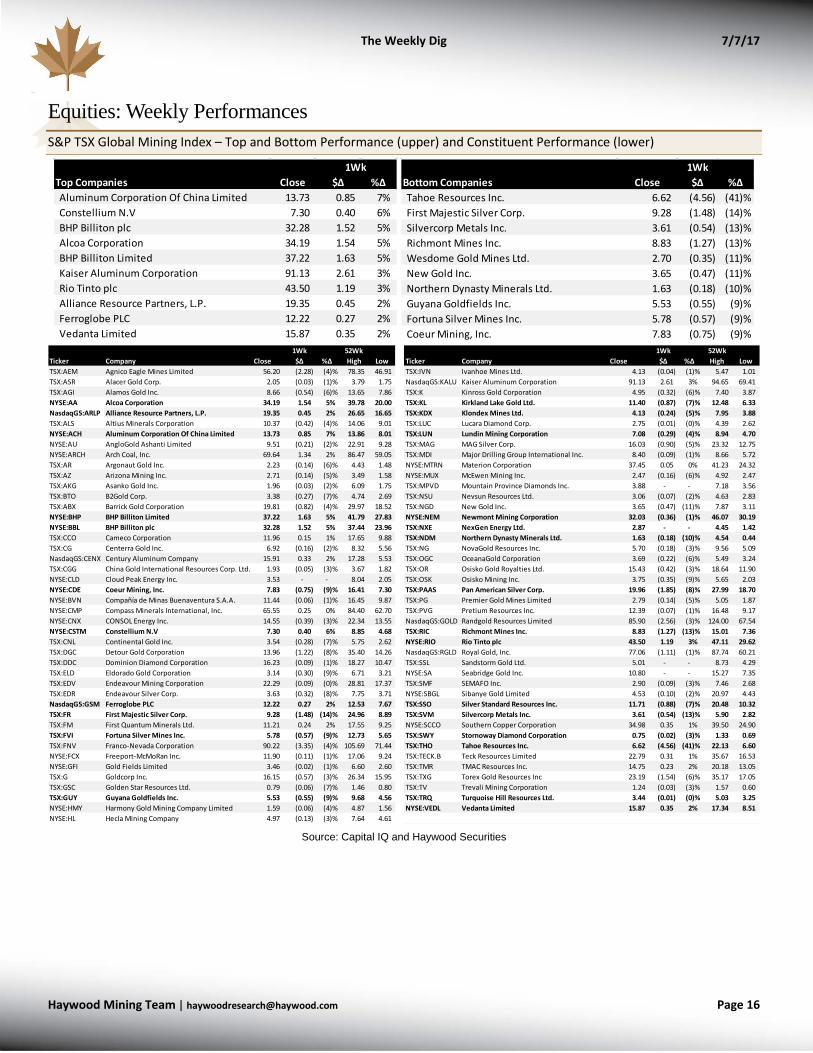
Equities: Weekly Performances S&P TSX Global Mining Index – Top and Bottom Performance (upper) and Constituent Performance (lower)
Source: Capital IQ and Haywood Securities
Top Companies Close $∆ %∆Aluminum Corporation Of China Limited 13.73 0.85 7% Constellium N.V 7.30 0.40 6% BHP Billiton plc 32.28 1.52 5% Alcoa Corporation 34.19 1.54 5% BHP Billiton Limited 37.22 1.63 5% Kaiser Aluminum Corporation 91.13 2.61 3% Rio Tinto plc 43.50 1.19 3% Alliance Resource Partners, L.P. 19.35 0.45 2% Ferroglobe PLC 12.22 0.27 2% Vedanta Limited 15.87 0.35 2%
1Wk 1WkBottom Companies Close $∆ %∆Tahoe Resources Inc. 6.62 (4.56) (41)% First Majestic Silver Corp. 9.28 (1.48) (14)% Silvercorp Metals Inc. 3.61 (0.54) (13)% Richmont Mines Inc. 8.83 (1.27) (13)% Wesdome Gold Mines Ltd. 2.70 (0.35) (11)% New Gold Inc. 3.65 (0.47) (11)% Northern Dynasty Minerals Ltd. 1.63 (0.18) (10)% Guyana Goldfields Inc. 5.53 (0.55) (9)% Fortuna Silver Mines Inc. 5.78 (0.57) (9)% Coeur Mining, Inc. 7.83 (0.75) (9)%
1Wk 52Wk 1Wk 52WkTicker Company Close $∆ %∆ High Low Ticker Company Close $∆ %∆ High LowTSX:AEM Agnico Eagle Mines Limited 56.20 (2.28) (4)% 78.35 46.91 TSX:IVN Ivanhoe Mines Ltd. 4.13 (0.04) (1)% 5.47 1.01 TSX:ASR Alacer Gold Corp. 2.05 (0.03) (1)% 3.79 1.75 NasdaqGS:KALU Kaiser Aluminum Corporation 91.13 2.61 3% 94.65 69.41 TSX:AGI Alamos Gold Inc. 8.66 (0.54) (6)% 13.65 7.86 TSX:K Kinross Gold Corporation 4.95 (0.32) (6)% 7.40 3.87 NYSE:AA Alcoa Corporation 34.19 1.54 5% 39.78 20.00 TSX:KL Kirkland Lake Gold Ltd. 11.40 (0.87) (7)% 12.48 6.33 NasdaqGS:ARLP Alliance Resource Partners, L.P. 19.35 0.45 2% 26.65 16.65 TSX:KDX Klondex Mines Ltd. 4.13 (0.24) (5)% 7.95 3.88 TSX:ALS Altius Minerals Corporation 10.37 (0.42) (4)% 14.06 9.01 TSX:LUC Lucara Diamond Corp. 2.75 (0.01) (0)% 4.39 2.62 NYSE:ACH Aluminum Corporation Of China Limited 13.73 0.85 7% 13.86 8.01 TSX:LUN Lundin Mining Corporation 7.08 (0.29) (4)% 8.94 4.70 NYSE:AU AngloGold Ashanti Limited 9.51 (0.21) (2)% 22.91 9.28 TSX:MAG MAG Silver Corp. 16.03 (0.90) (5)% 23.32 12.75 NYSE:ARCH Arch Coal, Inc. 69.64 1.34 2% 86.47 59.05 TSX:MDI Major Drilling Group International Inc. 8.40 (0.09) (1)% 8.66 5.72 TSX:AR Argonaut Gold Inc. 2.23 (0.14) (6)% 4.43 1.48 NYSE:MTRN Materion Corporation 37.45 0.05 0% 41.23 24.32 TSX:AZ Arizona Mining Inc. 2.71 (0.14) (5)% 3.49 1.58 NYSE:MUX McEwen Mining Inc. 2.47 (0.16) (6)% 4.92 2.47 TSX:AKG Asanko Gold Inc. 1.96 (0.03) (2)% 6.09 1.75 TSX:MPVD Mountain Province Diamonds Inc. 3.88 - - 7.18 3.56 TSX:BTO B2Gold Corp. 3.38 (0.27) (7)% 4.74 2.69 TSX:NSU Nevsun Resources Ltd. 3.06 (0.07) (2)% 4.63 2.83 TSX:ABX Barrick Gold Corporation 19.81 (0.82) (4)% 29.97 18.52 TSX:NGD New Gold Inc. 3.65 (0.47) (11)% 7.87 3.11 NYSE:BHP BHP Billiton Limited 37.22 1.63 5% 41.79 27.83 NYSE:NEM Newmont Mining Corporation 32.03 (0.36) (1)% 46.07 30.19 NYSE:BBL BHP Billiton plc 32.28 1.52 5% 37.44 23.96 TSX:NXE NexGen Energy Ltd. 2.87 - - 4.45 1.42 TSX:CCO Cameco Corporation 11.96 0.15 1% 17.65 9.88 TSX:NDM Northern Dynasty Minerals Ltd. 1.63 (0.18) (10)% 4.54 0.44 TSX:CG Centerra Gold Inc. 6.92 (0.16) (2)% 8.32 5.56 TSX:NG NovaGold Resources Inc. 5.70 (0.18) (3)% 9.56 5.09 NasdaqGS:CENX Century Aluminum Company 15.91 0.33 2% 17.28 5.53 TSX:OGC OceanaGold Corporation 3.69 (0.22) (6)% 5.49 3.24 TSX:CGG China Gold International Resources Corp. Ltd. 1.93 (0.05) (3)% 3.67 1.82 TSX:OR Osisko Gold Royalties Ltd. 15.43 (0.42) (3)% 18.64 11.90 NYSE:CLD Cloud Peak Energy Inc. 3.53 - - 8.04 2.05 TSX:OSK Osisko Mining Inc. 3.75 (0.35) (9)% 5.65 2.03 NYSE:CDE Coeur Mining, Inc. 7.83 (0.75) (9)% 16.41 7.30 TSX:PAAS Pan American Silver Corp. 19.96 (1.85) (8)% 27.99 18.70 NYSE:BVN Compañía de Minas Buenaventura S.A.A. 11.44 (0.06) (1)% 16.45 9.87 TSX:PG Premier Gold Mines Limited 2.79 (0.14) (5)% 5.05 1.87 NYSE:CMP Compass Minerals International, Inc. 65.55 0.25 0% 84.40 62.70 TSX:PVG Pretium Resources Inc. 12.39 (0.07) (1)% 16.48 9.17 NYSE:CNX CONSOL Energy Inc. 14.55 (0.39) (3)% 22.34 13.55 NasdaqGS:GOLD Randgold Resources Limited 85.90 (2.56) (3)% 124.00 67.54 NYSE:CSTM Constellium N.V 7.30 0.40 6% 8.85 4.68 TSX:RIC Richmont Mines Inc. 8.83 (1.27) (13)% 15.01 7.36 TSX:CNL Continental Gold Inc. 3.54 (0.28) (7)% 5.75 2.62 NYSE:RIO Rio Tinto plc 43.50 1.19 3% 47.11 29.62 TSX:DGC Detour Gold Corporation 13.96 (1.22) (8)% 35.40 14.26 NasdaqGS:RGLD Royal Gold, Inc. 77.06 (1.11) (1)% 87.74 60.21 TSX:DDC Dominion Diamond Corporation 16.23 (0.09) (1)% 18.27 10.47 TSX:SSL Sandstorm Gold Ltd. 5.01 - - 8.73 4.29 TSX:ELD Eldorado Gold Corporation 3.14 (0.30) (9)% 6.71 3.21 NYSE:SA Seabridge Gold Inc. 10.80 - - 15.27 7.35 TSX:EDV Endeavour Mining Corporation 22.29 (0.09) (0)% 28.81 17.37 TSX:SMF SEMAFO Inc. 2.90 (0.09) (3)% 7.46 2.68 TSX:EDR Endeavour Silver Corp. 3.63 (0.32) (8)% 7.75 3.71 NYSE:SBGL Sibanye Gold Limited 4.53 (0.10) (2)% 20.97 4.43 NasdaqGS:GSM Ferroglobe PLC 12.22 0.27 2% 12.53 7.67 TSX:SSO Silver Standard Resources Inc. 11.71 (0.88) (7)% 20.48 10.32 TSX:FR First Majestic Silver Corp. 9.28 (1.48) (14)% 24.96 8.89 TSX:SVM Silvercorp Metals Inc. 3.61 (0.54) (13)% 5.90 2.82 TSX:FM First Quantum Minerals Ltd. 11.21 0.24 2% 17.55 9.25 NYSE:SCCO Southern Copper Corporation 34.98 0.35 1% 39.50 24.90 TSX:FVI Fortuna Silver Mines Inc. 5.78 (0.57) (9)% 12.73 5.65 TSX:SWY Stornoway Diamond Corporation 0.75 (0.02) (3)% 1.33 0.69 TSX:FNV Franco-Nevada Corporation 90.22 (3.35) (4)% 105.69 71.44 TSX:THO Tahoe Resources Inc. 6.62 (4.56) (41)% 22.13 6.60 NYSE:FCX Freeport-McMoRan Inc. 11.90 (0.11) (1)% 17.06 9.24 TSX:TECK.B Teck Resources Limited 22.79 0.31 1% 35.67 16.53 NYSE:GFI Gold Fields Limited 3.46 (0.02) (1)% 6.60 2.60 TSX:TMR TMAC Resources Inc. 14.75 0.23 2% 20.18 13.05 TSX:G Goldcorp Inc. 16.15 (0.57) (3)% 26.34 15.95 TSX:TXG Torex Gold Resources Inc 23.19 (1.54) (6)% 35.17 17.05 TSX:GSC Golden Star Resources Ltd. 0.79 (0.06) (7)% 1.46 0.80 TSX:TV Trevali Mining Corporation 1.24 (0.03) (3)% 1.57 0.60 TSX:GUY Guyana Goldfields Inc. 5.53 (0.55) (9)% 9.68 4.56 TSX:TRQ Turquoise Hill Resources Ltd. 3.44 (0.01) (0)% 5.03 3.25 NYSE:HMY Harmony Gold Mining Company Limited 1.59 (0.06) (4)% 4.87 1.56 NYSE:VEDL Vedanta Limited 15.87 0.35 2% 17.34 8.51 NYSE:HL Hecla Mining Company 4.97 (0.13) (3)% 7.64 4.61
The Weekly Dig 7/7/17
Haywood Mining [email protected] Page 17
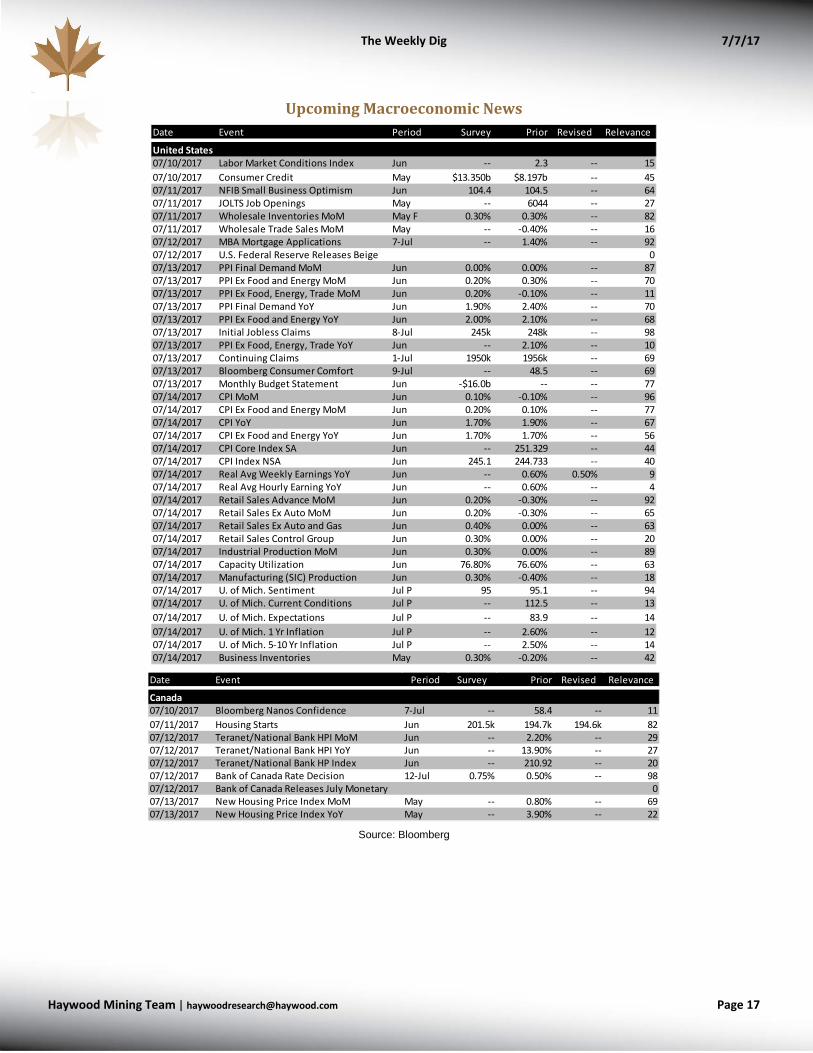
Upcoming Macroeconomic News
Source: Bloomberg
Date Event Period Survey Prior Revised Relevance
United States07/10/2017 Labor Market Conditions Index Jun -- 2.3 -- 1507/10/2017 Consumer Credit May $13.350b $8.197b -- 4507/11/2017 NFIB Small Business Optimism Jun 104.4 104.5 -- 6407/11/2017 JOLTS Job Openings May -- 6044 -- 2707/11/2017 Wholesale Inventories MoM May F 0.30% 0.30% -- 8207/11/2017 Wholesale Trade Sales MoM May -- -0.40% -- 1607/12/2017 MBA Mortgage Applications 7-Jul -- 1.40% -- 9207/12/2017 U.S. Federal Reserve Releases Beige 007/13/2017 PPI Final Demand MoM Jun 0.00% 0.00% -- 8707/13/2017 PPI Ex Food and Energy MoM Jun 0.20% 0.30% -- 7007/13/2017 PPI Ex Food, Energy, Trade MoM Jun 0.20% -0.10% -- 1107/13/2017 PPI Final Demand YoY Jun 1.90% 2.40% -- 7007/13/2017 PPI Ex Food and Energy YoY Jun 2.00% 2.10% -- 6807/13/2017 Initial Jobless Claims 8-Jul 245k 248k -- 9807/13/2017 PPI Ex Food, Energy, Trade YoY Jun -- 2.10% -- 1007/13/2017 Continuing Claims 1-Jul 1950k 1956k -- 6907/13/2017 Bloomberg Consumer Comfort 9-Jul -- 48.5 -- 6907/13/2017 Monthly Budget Statement Jun -$16.0b -- -- 7707/14/2017 CPI MoM Jun 0.10% -0.10% -- 9607/14/2017 CPI Ex Food and Energy MoM Jun 0.20% 0.10% -- 7707/14/2017 CPI YoY Jun 1.70% 1.90% -- 6707/14/2017 CPI Ex Food and Energy YoY Jun 1.70% 1.70% -- 5607/14/2017 CPI Core Index SA Jun -- 251.329 -- 4407/14/2017 CPI Index NSA Jun 245.1 244.733 -- 4007/14/2017 Real Avg Weekly Earnings YoY Jun -- 0.60% 0.50% 907/14/2017 Real Avg Hourly Earning YoY Jun -- 0.60% -- 407/14/2017 Retail Sales Advance MoM Jun 0.20% -0.30% -- 9207/14/2017 Retail Sales Ex Auto MoM Jun 0.20% -0.30% -- 6507/14/2017 Retail Sales Ex Auto and Gas Jun 0.40% 0.00% -- 6307/14/2017 Retail Sales Control Group Jun 0.30% 0.00% -- 2007/14/2017 Industrial Production MoM Jun 0.30% 0.00% -- 8907/14/2017 Capacity Utilization Jun 76.80% 76.60% -- 6307/14/2017 Manufacturing (SIC) Production Jun 0.30% -0.40% -- 1807/14/2017 U. of Mich. Sentiment Jul P 95 95.1 -- 9407/14/2017 U. of Mich. Current Conditions Jul P -- 112.5 -- 1307/14/2017 U. of Mich. Expectations Jul P -- 83.9 -- 1407/14/2017 U. of Mich. 1 Yr Inflation Jul P -- 2.60% -- 1207/14/2017 U. of Mich. 5-10 Yr Inflation Jul P -- 2.50% -- 1407/14/2017 Business Inventories May 0.30% -0.20% -- 42
Date Event Period Survey Prior Revised Relevance
Canada07/10/2017 Bloomberg Nanos Confidence 7-Jul -- 58.4 -- 1107/11/2017 Housing Starts Jun 201.5k 194.7k 194.6k 8207/12/2017 Teranet/National Bank HPI MoM Jun -- 2.20% -- 2907/12/2017 Teranet/National Bank HPI YoY Jun -- 13.90% -- 2707/12/2017 Teranet/National Bank HP Index Jun -- 210.92 -- 2007/12/2017 Bank of Canada Rate Decision 12-Jul 0.75% 0.50% -- 9807/12/2017 Bank of Canada Releases July Monetary 007/13/2017 New Housing Price Index MoM May -- 0.80% -- 6907/13/2017 New Housing Price Index YoY May -- 3.90% -- 22
The Weekly Dig 7/7/17
Haywood Mining [email protected] Page 18
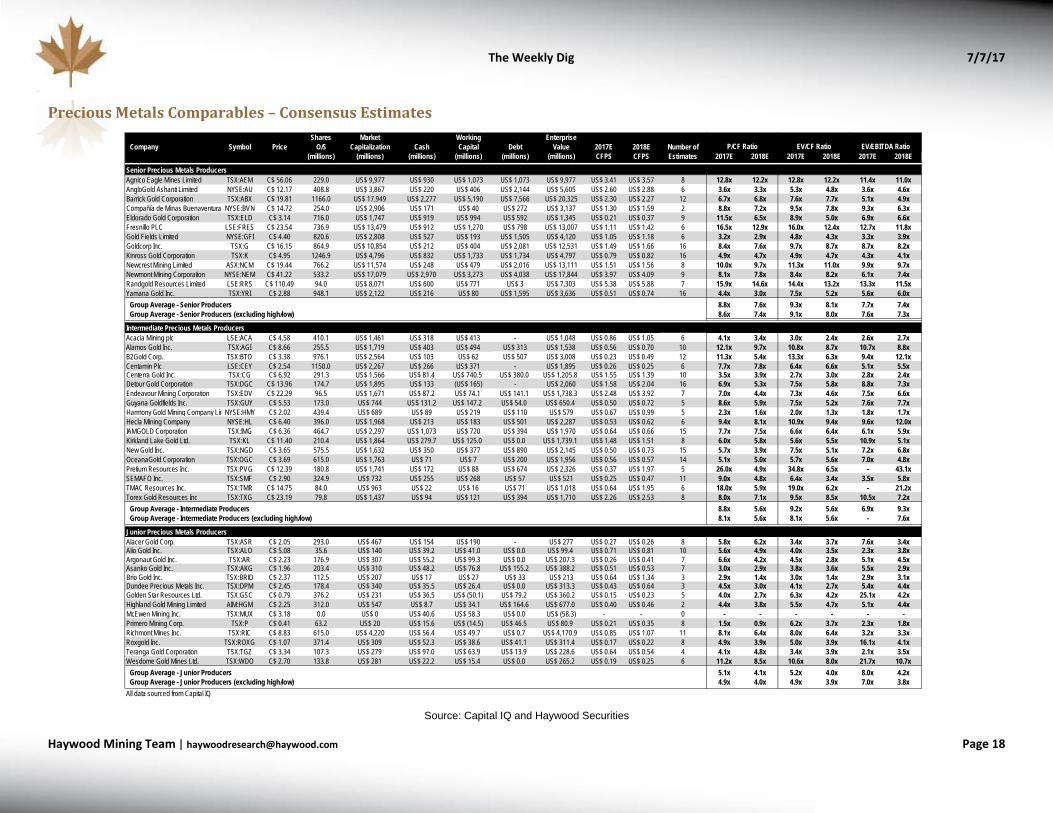
Precious Metals Comparables – Consensus Estimates
Source: Capital IQ and Haywood Securities
Shares Market Working EnterpriseCompany Symbol Price O/S Capitalization Cash Capital Debt Value 2017E 2018E Number of
(millions) (millions) (millions) (millions) (millions) (millions) CFPS CFPS Estimates 2017E 2018E 2017E 2018E 2017E 2018E
Senior Precious Metals ProducersAgnico Eagle Mines Limited TSX:AEM C$ 56.06 229.0 US$ 9,977 US$ 930 US$ 1,073 US$ 1,073 US$ 9,977 US$ 3.41 US$ 3.57 8 12.8x 12.2x 12.8x 12.2x 11.4x 11.0xAngloGold Ashanti Limited NYSE:AU C$ 12.17 408.8 US$ 3,867 US$ 220 US$ 406 US$ 2,144 US$ 5,605 US$ 2.60 US$ 2.88 6 3.6x 3.3x 5.3x 4.8x 3.6x 4.6xBarrick Gold Corporation TSX:ABX C$ 19.81 1166.0 US$ 17,949 US$ 2,277 US$ 5,190 US$ 7,566 US$ 20,325 US$ 2.30 US$ 2.27 12 6.7x 6.8x 7.6x 7.7x 5.1x 4.9xCompañía de Minas Buenaventura NYSE:BVN C$ 14.72 254.0 US$ 2,906 US$ 171 US$ 40 US$ 272 US$ 3,137 US$ 1.30 US$ 1.59 2 8.8x 7.2x 9.5x 7.8x 9.3x 6.3xEldorado Gold Corporation TSX:ELD C$ 3.14 716.0 US$ 1,747 US$ 919 US$ 994 US$ 592 US$ 1,345 US$ 0.21 US$ 0.37 9 11.5x 6.5x 8.9x 5.0x 6.9x 6.6xFresnillo PLC LSE:FRES C$ 23.54 736.9 US$ 13,479 US$ 912 US$ 1,270 US$ 798 US$ 13,007 US$ 1.11 US$ 1.42 6 16.5x 12.9x 16.0x 12.4x 12.7x 11.8xGold Fields Limited NYSE:GFI C$ 4.40 820.6 US$ 2,808 US$ 527 US$ 193 US$ 1,505 US$ 4,120 US$ 1.05 US$ 1.18 6 3.2x 2.9x 4.8x 4.3x 3.3x 3.9xGoldcorp Inc. TSX:G C$ 16.15 864.9 US$ 10,854 US$ 212 US$ 404 US$ 2,081 US$ 12,531 US$ 1.49 US$ 1.66 16 8.4x 7.6x 9.7x 8.7x 8.7x 8.2xKinross Gold Corporation TSX:K C$ 4.95 1246.9 US$ 4,796 US$ 832 US$ 1,733 US$ 1,734 US$ 4,797 US$ 0.79 US$ 0.82 16 4.9x 4.7x 4.9x 4.7x 4.3x 4.1xNewcrest Mining Limited ASX:NCM C$ 19.44 766.2 US$ 11,574 US$ 248 US$ 479 US$ 2,016 US$ 13,111 US$ 1.51 US$ 1.56 8 10.0x 9.7x 11.3x 11.0x 9.9x 9.7xNewmont Mining Corporation NYSE:NEM C$ 41.22 533.2 US$ 17,079 US$ 2,970 US$ 3,273 US$ 4,038 US$ 17,844 US$ 3.97 US$ 4.09 9 8.1x 7.8x 8.4x 8.2x 6.1x 7.4xRandgold Resources Limited LSE:RRS C$ 110.49 94.0 US$ 8,071 US$ 600 US$ 771 US$ 3 US$ 7,303 US$ 5.38 US$ 5.88 7 15.9x 14.6x 14.4x 13.2x 13.3x 11.5xYamana Gold Inc. TSX:YRI C$ 2.88 948.1 US$ 2,122 US$ 216 US$ 80 US$ 1,595 US$ 3,636 US$ 0.51 US$ 0.74 16 4.4x 3.0x 7.5x 5.2x 5.6x 6.0x
Group Average - Senior Producers 8.8x 7.6x 9.3x 8.1x 7.7x 7.4xGroup Average - Senior Producers (excluding high/low) 8.6x 7.4x 9.1x 8.0x 7.6x 7.3x
Intermediate Precious Metals ProducersAcacia Mining plc LSE:ACA C$ 4.58 410.1 US$ 1,461 US$ 318 US$ 413 - US$ 1,048 US$ 0.86 US$ 1.05 6 4.1x 3.4x 3.0x 2.4x 2.6x 2.7xAlamos Gold Inc. TSX:AGI C$ 8.66 255.5 US$ 1,719 US$ 403 US$ 494 US$ 313 US$ 1,538 US$ 0.56 US$ 0.70 10 12.1x 9.7x 10.8x 8.7x 10.7x 8.8xB2Gold Corp. TSX:BTO C$ 3.38 976.1 US$ 2,564 US$ 103 US$ 62 US$ 507 US$ 3,008 US$ 0.23 US$ 0.49 12 11.3x 5.4x 13.3x 6.3x 9.4x 12.1xCentamin Plc LSE:CEY C$ 2.54 1150.0 US$ 2,267 US$ 266 US$ 371 - US$ 1,895 US$ 0.26 US$ 0.25 6 7.7x 7.8x 6.4x 6.6x 5.1x 5.5xCenterra Gold Inc. TSX:CG C$ 6.92 291.3 US$ 1,566 US$ 81.4 US$ 740.5 US$ 380.0 US$ 1,205.8 US$ 1.55 US$ 1.39 10 3.5x 3.9x 2.7x 3.0x 2.8x 2.4xDetour Gold Corporation TSX:DGC C$ 13.96 174.7 US$ 1,895 US$ 133 (US$ 165) - US$ 2,060 US$ 1.58 US$ 2.04 16 6.9x 5.3x 7.5x 5.8x 8.8x 7.3xEndeavour Mining Corporation TSX:EDV C$ 22.29 96.5 US$ 1,671 US$ 87.2 US$ 74.1 US$ 141.1 US$ 1,738.3 US$ 2.48 US$ 3.92 7 7.0x 4.4x 7.3x 4.6x 7.5x 6.6xGuyana Goldfields Inc. TSX:GUY C$ 5.53 173.0 US$ 744 US$ 131.2 US$ 147.2 US$ 54.0 US$ 650.4 US$ 0.50 US$ 0.72 5 8.6x 5.9x 7.5x 5.2x 7.6x 7.7xHarmony Gold Mining Company LimNYSE:HMY C$ 2.02 439.4 US$ 689 US$ 89 US$ 219 US$ 110 US$ 579 US$ 0.67 US$ 0.99 5 2.3x 1.6x 2.0x 1.3x 1.8x 1.7xHecla Mining Company NYSE:HL C$ 6.40 396.0 US$ 1,968 US$ 213 US$ 183 US$ 501 US$ 2,287 US$ 0.53 US$ 0.62 6 9.4x 8.1x 10.9x 9.4x 9.6x 12.0xIAMGOLD Corporation TSX:IMG C$ 6.36 464.7 US$ 2,297 US$ 1,073 US$ 720 US$ 394 US$ 1,970 US$ 0.64 US$ 0.66 15 7.7x 7.5x 6.6x 6.4x 6.1x 5.9xKirkland Lake Gold Ltd. TSX:KL C$ 11.40 210.4 US$ 1,864 US$ 279.7 US$ 125.0 US$ 0.0 US$ 1,739.1 US$ 1.48 US$ 1.51 8 6.0x 5.8x 5.6x 5.5x 10.9x 5.1xNew Gold Inc. TSX:NGD C$ 3.65 575.5 US$ 1,632 US$ 350 US$ 377 US$ 890 US$ 2,145 US$ 0.50 US$ 0.73 15 5.7x 3.9x 7.5x 5.1x 7.2x 6.8xOceanaGold Corporation TSX:OGC C$ 3.69 615.0 US$ 1,763 US$ 71 US$ 7 US$ 200 US$ 1,956 US$ 0.56 US$ 0.57 14 5.1x 5.0x 5.7x 5.6x 7.0x 4.8xPretium Resources Inc. TSX:PVG C$ 12.39 180.8 US$ 1,741 US$ 172 US$ 88 US$ 674 US$ 2,326 US$ 0.37 US$ 1.97 5 26.0x 4.9x 34.8x 6.5x - 43.1xSEMAFO Inc. TSX:SMF C$ 2.90 324.9 US$ 732 US$ 255 US$ 268 US$ 57 US$ 521 US$ 0.25 US$ 0.47 11 9.0x 4.8x 6.4x 3.4x 3.5x 5.8xTMAC Resources Inc. TSX:TMR C$ 14.75 84.0 US$ 963 US$ 22 US$ 16 US$ 71 US$ 1,018 US$ 0.64 US$ 1.95 6 18.0x 5.9x 19.0x 6.2x - 21.2xTorex Gold Resources Inc TSX:TXG C$ 23.19 79.8 US$ 1,437 US$ 94 US$ 121 US$ 394 US$ 1,710 US$ 2.26 US$ 2.53 8 8.0x 7.1x 9.5x 8.5x 10.5x 7.2x
Group Average - Intermediate Producers 8.8x 5.6x 9.2x 5.6x 6.9x 9.3xGroup Average - Intermediate Producers (excluding high/low) 8.1x 5.6x 8.1x 5.6x - 7.6x
Junior Precious Metals ProducersAlacer Gold Corp. TSX:ASR C$ 2.05 293.0 US$ 467 US$ 154 US$ 190 - US$ 277 US$ 0.27 US$ 0.26 8 5.8x 6.2x 3.4x 3.7x 7.6x 3.4xAlio Gold Inc. TSX:ALO C$ 5.08 35.6 US$ 140 US$ 39.2 US$ 41.0 US$ 0.0 US$ 99.4 US$ 0.71 US$ 0.81 10 5.6x 4.9x 4.0x 3.5x 2.3x 3.8xArgonaut Gold Inc. TSX:AR C$ 2.23 176.9 US$ 307 US$ 55.2 US$ 99.3 US$ 0.0 US$ 207.3 US$ 0.26 US$ 0.41 7 6.6x 4.2x 4.5x 2.8x 5.1x 4.5xAsanko Gold Inc. TSX:AKG C$ 1.96 203.4 US$ 310 US$ 48.2 US$ 76.8 US$ 155.2 US$ 388.2 US$ 0.51 US$ 0.53 7 3.0x 2.9x 3.8x 3.6x 5.5x 2.9xBrio Gold Inc. TSX:BRIO C$ 2.37 112.5 US$ 207 US$ 17 US$ 27 US$ 33 US$ 213 US$ 0.64 US$ 1.34 3 2.9x 1.4x 3.0x 1.4x 2.9x 3.1xDundee Precious Metals Inc. TSX:DPM C$ 2.45 178.4 US$ 340 US$ 35.5 US$ 26.4 US$ 0.0 US$ 313.3 US$ 0.43 US$ 0.64 3 4.5x 3.0x 4.1x 2.7x 5.4x 4.4xGolden Star Resources Ltd. TSX:GSC C$ 0.79 376.2 US$ 231 US$ 36.5 US$ (50.1) US$ 79.2 US$ 360.2 US$ 0.15 US$ 0.23 5 4.0x 2.7x 6.3x 4.2x 25.1x 4.2xHighland Gold Mining Limited AIM:HGM C$ 2.25 312.0 US$ 547 US$ 8.7 US$ 34.1 US$ 164.6 US$ 677.0 US$ 0.40 US$ 0.46 2 4.4x 3.8x 5.5x 4.7x 5.1x 4.4xMcEwen Mining Inc. TSX:MUX C$ 3.18 0.0 US$ 0 US$ 40.6 US$ 58.3 US$ 0.0 US$ (58.3) - - 0 - - - - - -Primero Mining Corp. TSX:P C$ 0.41 63.2 US$ 20 US$ 15.6 US$ (14.5) US$ 46.5 US$ 80.9 US$ 0.21 US$ 0.35 8 1.5x 0.9x 6.2x 3.7x 2.3x 1.8xRichmont Mines Inc. TSX:RIC C$ 8.83 615.0 US$ 4,220 US$ 56.4 US$ 49.7 US$ 0.7 US$ 4,170.9 US$ 0.85 US$ 1.07 11 8.1x 6.4x 8.0x 6.4x 3.2x 3.3xRoxgold Inc. TSX:ROXG C$ 1.07 371.4 US$ 309 US$ 52.3 US$ 38.6 US$ 41.1 US$ 311.4 US$ 0.17 US$ 0.22 8 4.9x 3.9x 5.0x 3.9x 16.1x 4.1xTeranga Gold Corporation TSX:TGZ C$ 3.34 107.3 US$ 279 US$ 97.0 US$ 63.9 US$ 13.9 US$ 228.6 US$ 0.64 US$ 0.54 4 4.1x 4.8x 3.4x 3.9x 2.1x 3.5xWesdome Gold Mines Ltd. TSX:WDO C$ 2.70 133.8 US$ 281 US$ 22.2 US$ 15.4 US$ 0.0 US$ 265.2 US$ 0.19 US$ 0.25 6 11.2x 8.5x 10.6x 8.0x 21.7x 10.7x
Group Average - Junior Producers 5.1x 4.1x 5.2x 4.0x 8.0x 4.2xGroup Average - Junior Producers (excluding high/low) 4.9x 4.0x 4.9x 3.9x 7.0x 3.8x
All data sourced from Capital IQ
P/CF Ratio EV/CF Ratio EV/EBITDA Ratio
The Weekly Dig 7/7/17
Haywood Mining [email protected] Page 19
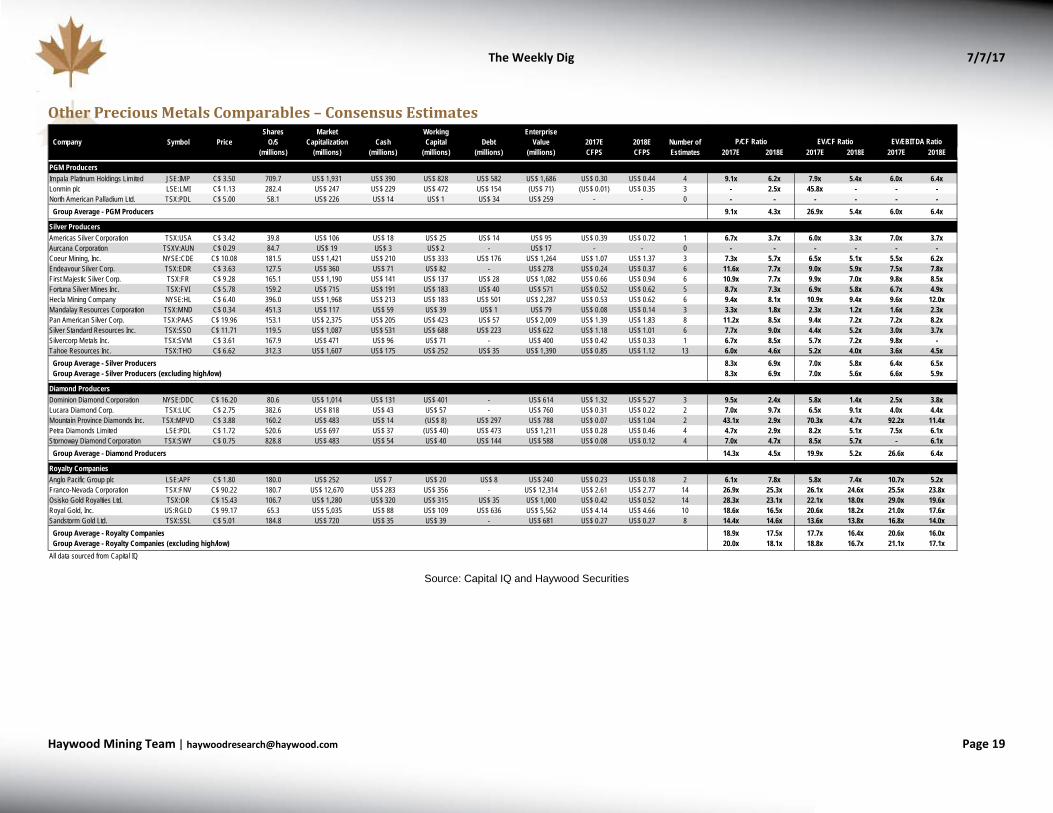
Other Precious Metals Comparables – Consensus Estimates
Source: Capital IQ and Haywood Securities
Shares Market Working EnterpriseCompany Symbol Price O/S Capitalization Cash Capital Debt Value 2017E 2018E Number of
(millions) (millions) (millions) (millions) (millions) (millions) CFPS CFPS Estimates 2017E 2018E 2017E 2018E 2017E 2018E
PGM ProducersImpala Platinum Holdings Limited JSE:IMP C$ 3.50 709.7 US$ 1,931 US$ 390 US$ 828 US$ 582 US$ 1,686 US$ 0.30 US$ 0.44 4 9.1x 6.2x 7.9x 5.4x 6.0x 6.4xLonmin plc LSE:LMI C$ 1.13 282.4 US$ 247 US$ 229 US$ 472 US$ 154 (US$ 71) (US$ 0.01) US$ 0.35 3 - 2.5x 45.8x - - -North American Palladium Ltd. TSX:PDL C$ 5.00 58.1 US$ 226 US$ 14 US$ 1 US$ 34 US$ 259 - - 0 - - - - - -
Group Average - PGM Producers 9.1x 4.3x 26.9x 5.4x 6.0x 6.4x
Silver ProducersAmericas Silver Corporation TSX:USA C$ 3.42 39.8 US$ 106 US$ 18 US$ 25 US$ 14 US$ 95 US$ 0.39 US$ 0.72 1 6.7x 3.7x 6.0x 3.3x 7.0x 3.7xAurcana Corporation TSXV:AUN C$ 0.29 84.7 US$ 19 US$ 3 US$ 2 - US$ 17 - - 0 - - - - - -Coeur Mining, Inc. NYSE:CDE C$ 10.08 181.5 US$ 1,421 US$ 210 US$ 333 US$ 176 US$ 1,264 US$ 1.07 US$ 1.37 3 7.3x 5.7x 6.5x 5.1x 5.5x 6.2xEndeavour Silver Corp. TSX:EDR C$ 3.63 127.5 US$ 360 US$ 71 US$ 82 - US$ 278 US$ 0.24 US$ 0.37 6 11.6x 7.7x 9.0x 5.9x 7.5x 7.8xFirst Majestic Silver Corp. TSX:FR C$ 9.28 165.1 US$ 1,190 US$ 141 US$ 137 US$ 28 US$ 1,082 US$ 0.66 US$ 0.94 6 10.9x 7.7x 9.9x 7.0x 9.8x 8.5xFortuna Silver Mines Inc. TSX:FVI C$ 5.78 159.2 US$ 715 US$ 191 US$ 183 US$ 40 US$ 571 US$ 0.52 US$ 0.62 5 8.7x 7.3x 6.9x 5.8x 6.7x 4.9xHecla Mining Company NYSE:HL C$ 6.40 396.0 US$ 1,968 US$ 213 US$ 183 US$ 501 US$ 2,287 US$ 0.53 US$ 0.62 6 9.4x 8.1x 10.9x 9.4x 9.6x 12.0xMandalay Resources Corporation TSX:MND C$ 0.34 451.3 US$ 117 US$ 59 US$ 39 US$ 1 US$ 79 US$ 0.08 US$ 0.14 3 3.3x 1.8x 2.3x 1.2x 1.6x 2.3xPan American Silver Corp. TSX:PAAS C$ 19.96 153.1 US$ 2,375 US$ 205 US$ 423 US$ 57 US$ 2,009 US$ 1.39 US$ 1.83 8 11.2x 8.5x 9.4x 7.2x 7.2x 8.2xSilver Standard Resources Inc. TSX:SSO C$ 11.71 119.5 US$ 1,087 US$ 531 US$ 688 US$ 223 US$ 622 US$ 1.18 US$ 1.01 6 7.7x 9.0x 4.4x 5.2x 3.0x 3.7xSilvercorp Metals Inc. TSX:SVM C$ 3.61 167.9 US$ 471 US$ 96 US$ 71 - US$ 400 US$ 0.42 US$ 0.33 1 6.7x 8.5x 5.7x 7.2x 9.8x -Tahoe Resources Inc. TSX:THO C$ 6.62 312.3 US$ 1,607 US$ 175 US$ 252 US$ 35 US$ 1,390 US$ 0.85 US$ 1.12 13 6.0x 4.6x 5.2x 4.0x 3.6x 4.5x
Group Average - Silver Producers 8.3x 6.9x 7.0x 5.8x 6.4x 6.5xGroup Average - Silver Producers (excluding high/low) 8.3x 6.9x 7.0x 5.6x 6.6x 5.9x
Diamond ProducersDominion Diamond Corporation NYSE:DDC C$ 16.20 80.6 US$ 1,014 US$ 131 US$ 401 - US$ 614 US$ 1.32 US$ 5.27 3 9.5x 2.4x 5.8x 1.4x 2.5x 3.8xLucara Diamond Corp. TSX:LUC C$ 2.75 382.6 US$ 818 US$ 43 US$ 57 - US$ 760 US$ 0.31 US$ 0.22 2 7.0x 9.7x 6.5x 9.1x 4.0x 4.4xMountain Province Diamonds Inc. TSX:MPVD C$ 3.88 160.2 US$ 483 US$ 14 (US$ 8) US$ 297 US$ 788 US$ 0.07 US$ 1.04 2 43.1x 2.9x 70.3x 4.7x 92.2x 11.4xPetra Diamonds Limited LSE:PDL C$ 1.72 520.6 US$ 697 US$ 37 (US$ 40) US$ 473 US$ 1,211 US$ 0.28 US$ 0.46 4 4.7x 2.9x 8.2x 5.1x 7.5x 6.1xStornoway Diamond Corporation TSX:SWY C$ 0.75 828.8 US$ 483 US$ 54 US$ 40 US$ 144 US$ 588 US$ 0.08 US$ 0.12 4 7.0x 4.7x 8.5x 5.7x - 6.1x
Group Average - Diamond Producers 14.3x 4.5x 19.9x 5.2x 26.6x 6.4x
Royalty CompaniesAnglo Pacific Group plc LSE:APF C$ 1.80 180.0 US$ 252 US$ 7 US$ 20 US$ 8 US$ 240 US$ 0.23 US$ 0.18 2 6.1x 7.8x 5.8x 7.4x 10.7x 5.2xFranco-Nevada Corporation TSX:FNV C$ 90.22 180.7 US$ 12,670 US$ 283 US$ 356 - US$ 12,314 US$ 2.61 US$ 2.77 14 26.9x 25.3x 26.1x 24.6x 25.5x 23.8xOsisko Gold Royalties Ltd. TSX:OR C$ 15.43 106.7 US$ 1,280 US$ 320 US$ 315 US$ 35 US$ 1,000 US$ 0.42 US$ 0.52 14 28.3x 23.1x 22.1x 18.0x 29.0x 19.6xRoyal Gold, Inc. US:RGLD C$ 99.17 65.3 US$ 5,035 US$ 88 US$ 109 US$ 636 US$ 5,562 US$ 4.14 US$ 4.66 10 18.6x 16.5x 20.6x 18.2x 21.0x 17.6xSandstorm Gold Ltd. TSX:SSL C$ 5.01 184.8 US$ 720 US$ 35 US$ 39 - US$ 681 US$ 0.27 US$ 0.27 8 14.4x 14.6x 13.6x 13.8x 16.8x 14.0x
Group Average - Royalty Companies 18.9x 17.5x 17.7x 16.4x 20.6x 16.0xGroup Average - Royalty Companies (excluding high/low) 20.0x 18.1x 18.8x 16.7x 21.1x 17.1x
All data sourced from Capital IQ
P/CF Ratio EV/CF Ratio EV/EBITDA Ratio
The Weekly Dig 7/7/17
Haywood Mining [email protected] Page 20
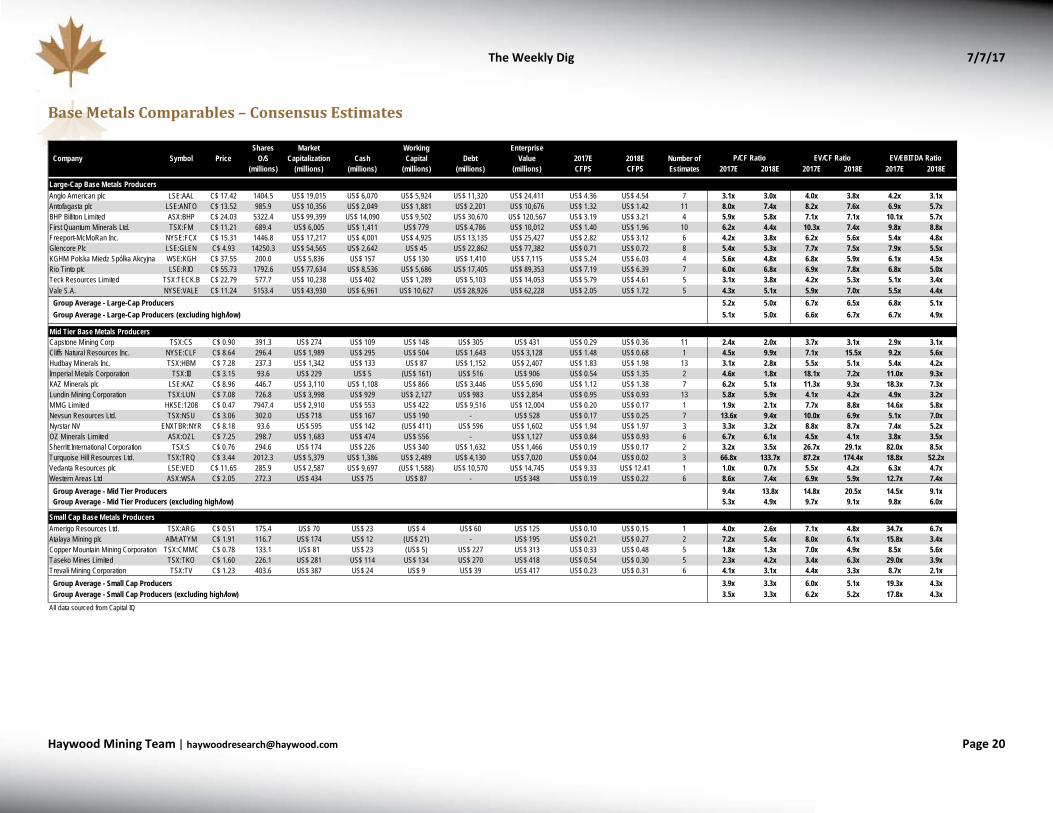
Base Metals Comparables – Consensus Estimates
Shares Market Working EnterpriseCompany Symbol Price O/S Capitalization Cash Capital Debt Value 2017E 2018E Number of
(millions) (millions) (millions) (millions) (millions) (millions) CFPS CFPS Estimates 2017E 2018E 2017E 2018E 2017E 2018E
Large-Cap Base Metals ProducersAnglo American plc LSE:AAL C$ 17.42 1404.5 US$ 19,015 US$ 6,070 US$ 5,924 US$ 11,320 US$ 24,411 US$ 4.36 US$ 4.54 7 3.1x 3.0x 4.0x 3.8x 4.2x 3.1xAntofagasta plc LSE:ANTO C$ 13.52 985.9 US$ 10,356 US$ 2,049 US$ 1,881 US$ 2,201 US$ 10,676 US$ 1.32 US$ 1.42 11 8.0x 7.4x 8.2x 7.6x 6.9x 5.7xBHP Billiton Limited ASX:BHP C$ 24.03 5322.4 US$ 99,399 US$ 14,090 US$ 9,502 US$ 30,670 US$ 120,567 US$ 3.19 US$ 3.21 4 5.9x 5.8x 7.1x 7.1x 10.1x 5.7xFirst Quantum Minerals Ltd. TSX:FM C$ 11.21 689.4 US$ 6,005 US$ 1,411 US$ 779 US$ 4,786 US$ 10,012 US$ 1.40 US$ 1.96 10 6.2x 4.4x 10.3x 7.4x 9.8x 8.8xFreeport-McMoRan Inc. NYSE:FCX C$ 15.31 1446.8 US$ 17,217 US$ 4,001 US$ 4,925 US$ 13,135 US$ 25,427 US$ 2.82 US$ 3.12 6 4.2x 3.8x 6.2x 5.6x 5.4x 4.8xGlencore Plc LSE:GLEN C$ 4.93 14250.3 US$ 54,565 US$ 2,642 US$ 45 US$ 22,862 US$ 77,382 US$ 0.71 US$ 0.72 8 5.4x 5.3x 7.7x 7.5x 7.9x 5.5xKGHM Polska Miedz Spólka Akcyjna WSE:KGH C$ 37.55 200.0 US$ 5,836 US$ 157 US$ 130 US$ 1,410 US$ 7,115 US$ 5.24 US$ 6.03 4 5.6x 4.8x 6.8x 5.9x 6.1x 4.5xRio Tinto plc LSE:RIO C$ 55.73 1792.6 US$ 77,634 US$ 8,536 US$ 5,686 US$ 17,405 US$ 89,353 US$ 7.19 US$ 6.39 7 6.0x 6.8x 6.9x 7.8x 6.8x 5.0xTeck Resources Limited TSX:TECK.B C$ 22.79 577.7 US$ 10,238 US$ 402 US$ 1,289 US$ 5,103 US$ 14,053 US$ 5.79 US$ 4.61 5 3.1x 3.8x 4.2x 5.3x 5.1x 3.4xVale S.A. NYSE:VALE C$ 11.24 5153.4 US$ 43,930 US$ 6,961 US$ 10,627 US$ 28,926 US$ 62,228 US$ 2.05 US$ 1.72 5 4.3x 5.1x 5.9x 7.0x 5.5x 4.4x
Group Average - Large-Cap Producers 5.2x 5.0x 6.7x 6.5x 6.8x 5.1xGroup Average - Large-Cap Producers (excluding high/low) 5.1x 5.0x 6.6x 6.7x 6.7x 4.9x
Mid Tier Base Metals ProducersCapstone Mining Corp TSX:CS C$ 0.90 391.3 US$ 274 US$ 109 US$ 148 US$ 305 US$ 431 US$ 0.29 US$ 0.36 11 2.4x 2.0x 3.7x 3.1x 2.9x 3.1xCliffs Natural Resources Inc. NYSE:CLF C$ 8.64 296.4 US$ 1,989 US$ 295 US$ 504 US$ 1,643 US$ 3,128 US$ 1.48 US$ 0.68 1 4.5x 9.9x 7.1x 15.5x 9.2x 5.6xHudbay Minerals Inc. TSX:HBM C$ 7.28 237.3 US$ 1,342 US$ 133 US$ 87 US$ 1,152 US$ 2,407 US$ 1.83 US$ 1.98 13 3.1x 2.8x 5.5x 5.1x 5.4x 4.2xImperial Metals Corporation TSX:III C$ 3.15 93.6 US$ 229 US$ 5 (US$ 161) US$ 516 US$ 906 US$ 0.54 US$ 1.35 2 4.6x 1.8x 18.1x 7.2x 11.0x 9.3xKAZ Minerals plc LSE:KAZ C$ 8.96 446.7 US$ 3,110 US$ 1,108 US$ 866 US$ 3,446 US$ 5,690 US$ 1.12 US$ 1.38 7 6.2x 5.1x 11.3x 9.3x 18.3x 7.3xLundin Mining Corporation TSX:LUN C$ 7.08 726.8 US$ 3,998 US$ 929 US$ 2,127 US$ 983 US$ 2,854 US$ 0.95 US$ 0.93 13 5.8x 5.9x 4.1x 4.2x 4.9x 3.2xMMG Limited HKSE:1208 C$ 0.47 7947.4 US$ 2,910 US$ 553 US$ 422 US$ 9,516 US$ 12,004 US$ 0.20 US$ 0.17 1 1.9x 2.1x 7.7x 8.8x 14.6x 5.8xNevsun Resources Ltd. TSX:NSU C$ 3.06 302.0 US$ 718 US$ 167 US$ 190 - US$ 528 US$ 0.17 US$ 0.25 7 13.6x 9.4x 10.0x 6.9x 5.1x 7.0xNyrstar NV ENXTBR:NYR C$ 8.18 93.6 US$ 595 US$ 142 (US$ 411) US$ 596 US$ 1,602 US$ 1.94 US$ 1.97 3 3.3x 3.2x 8.8x 8.7x 7.4x 5.2xOZ Minerals Limited ASX:OZL C$ 7.25 298.7 US$ 1,683 US$ 474 US$ 556 - US$ 1,127 US$ 0.84 US$ 0.93 6 6.7x 6.1x 4.5x 4.1x 3.8x 3.5xSherritt International Corporation TSX:S C$ 0.76 294.6 US$ 174 US$ 226 US$ 340 US$ 1,632 US$ 1,466 US$ 0.19 US$ 0.17 2 3.2x 3.5x 26.7x 29.1x 82.0x 8.5xTurquoise Hill Resources Ltd. TSX:TRQ C$ 3.44 2012.3 US$ 5,379 US$ 1,386 US$ 2,489 US$ 4,130 US$ 7,020 US$ 0.04 US$ 0.02 3 66.8x 133.7x 87.2x 174.4x 18.8x 52.2xVedanta Resources plc LSE:VED C$ 11.65 285.9 US$ 2,587 US$ 9,697 (US$ 1,588) US$ 10,570 US$ 14,745 US$ 9.33 US$ 12.41 1 1.0x 0.7x 5.5x 4.2x 6.3x 4.7xWestern Areas Ltd ASX:WSA C$ 2.05 272.3 US$ 434 US$ 75 US$ 87 - US$ 348 US$ 0.19 US$ 0.22 6 8.6x 7.4x 6.9x 5.9x 12.7x 7.4x
Group Average - Mid Tier Producers 9.4x 13.8x 14.8x 20.5x 14.5x 9.1xGroup Average - Mid Tier Producers (excluding high/low) 5.3x 4.9x 9.7x 9.1x 9.8x 6.0x
Small Cap Base Metals ProducersAmerigo Resources Ltd. TSX:ARG C$ 0.51 175.4 US$ 70 US$ 23 US$ 4 US$ 60 US$ 125 US$ 0.10 US$ 0.15 1 4.0x 2.6x 7.1x 4.8x 34.7x 6.7xAtalaya Mining plc AIM:ATYM C$ 1.91 116.7 US$ 174 US$ 12 (US$ 21) - US$ 195 US$ 0.21 US$ 0.27 2 7.2x 5.4x 8.0x 6.1x 15.8x 3.4xCopper Mountain Mining Corporation TSX:CMMC C$ 0.78 133.1 US$ 81 US$ 23 (US$ 5) US$ 227 US$ 313 US$ 0.33 US$ 0.48 5 1.8x 1.3x 7.0x 4.9x 8.5x 5.6xTaseko Mines Limited TSX:TKO C$ 1.60 226.1 US$ 281 US$ 114 US$ 134 US$ 270 US$ 418 US$ 0.54 US$ 0.30 5 2.3x 4.2x 3.4x 6.3x 29.0x 3.9xTrevali Mining Corporation TSX:TV C$ 1.23 403.6 US$ 387 US$ 24 US$ 9 US$ 39 US$ 417 US$ 0.23 US$ 0.31 6 4.1x 3.1x 4.4x 3.3x 8.7x 2.1x
Group Average - Small Cap Producers 3.9x 3.3x 6.0x 5.1x 19.3x 4.3xGroup Average - Small Cap Producers (excluding high/low) 3.5x 3.3x 6.2x 5.2x 17.8x 4.3x
All data sourced from Capital IQ
P/CF Ratio EV/CF Ratio EV/EBITDA Ratio

The Weekly Dig 7/7/17
Haywood Mining [email protected] Page 21
Iron Comparables – Consensus Estimates
Bloomberg Shares Market Daily Enterprise
Company (T icker) Share PriceConsensus
TargetImplied Return β
Outstanding (millions)
Capitalization (millions)
Volume (millions)
Weekly Liquidity WACC
Debt (millions)
Value (millions) 2017 2018 2019 2017 2018 2019 2017 2018 2019 2017 2018 2019
Diversified Mining HousesVALE SA (VALE3-BZ) R$ 28.89 R$ 39.85 37.9% 1.49 3,217 R$ 147,758 5.7 0.6% 15.7% R$ 95,563 R$ 225,030 6.74 5.56 5.62 4.3x 5.2x 5.1x 7.3x 8.8x 8.7x 4.7x 5.4x 5.3xBHP BILLITON (BHP-AU) A$ 24.59 A$ 27.10 10.2% 1.58 3,212 A$ 123,456 10.7 1.8% 10.9% A$ 36,421 A$ 119,672 3.87 3.67 3.72 6.4x 6.7x 6.6x 13.5x 15.7x 16.2x 5.7x 6.1x 6.2xRIO TINTO (RIO-AU) A$ 65.04 A$ 70.60 8.6% 1.21 424 A$ 105,569 2.7 2.7% 13.0% A$ 17,630 A$ 95,777 9.60 8.32 8.66 6.8x 7.8x 7.5x 11.1x 14.4x 13.9x 5.4x 6.3x 6.1xGroup Average - Diversifed Mining Avg. -> 5.8x 6.6x 6.4x 10.6x 13.0x 12.9x 5.3x 5.9x 5.9x
ProducersKUMBA IRON (KIO-SJE) ZAR 17,639 ZAR 16,917 (4.1)% 1.95 322 ZAR 56,813 0.8 0.8% 11.7% ZAR 4,500 ZAR 59,334 3510 2780 2619 5.0x 6.3x 6.7x 6.9x 10.1x 12.9x 3.4x 4.8x 5.6xFORTESCUE METALS (FMG-AU) A$ 5.19 A$ 5.35 3.1% 1.61 3,114 A$ 16,161 30.0 4.0% 11.1% A$ 6,771 A$ 16,294 1.53 1.02 1.14 3.4x 5.1x 4.6x 5.7x 10.0x 11.1x 3.4x 4.9x 5.3xCLIFFS NATURAL (CLF-US) US$ 6.71 US$ 7.57 12.8% 1.93 296 US$ 1,989 14.9 15.6% 11.2% US$ 2,231 US$ 3,518 7.3x 9.0x 15.7x 6.6x 7.6x 10.0xMMX MINERACAO (MMXM3-BRZ) R$ 3.70 0.70 6 R$ 24 0.0 2.3% 12.7% R$ 134 R$ 154 FERREXPO PLC (FXPO-LSE) GBp 206 GBp 179.80 (12.5)% 1.42 589 GBp 1,210 5.1 3.4% 5.7% GBp 734 GBp 2,147 47.59 36.95 43.85 4.3x 5.6x 4.7x 4.8x 7.3x 9.1x 4.4x 6.1x 7.0xMOUNT GIBSON (MGX-AU) A$ 0.37 A$ 0.39 6.8% 0.85 1,097 A$ 400 4.0 1.6% 8.8% A$ 0 A$(46) 0.02 (0.00) 0.04 20.3x 8.5x 15.2xGRANGE RESOURCES (GRR-AU) A$ 0.13 0.78 1,157 A$ 150 1.6 0.7% 8.0% A$ 9 A$(6)BC IRON (BCI-AU) A$ 0.14 A$ 0.33 135.7% 1.91 393 A$ 55 1.8 0.8% 16.3% A$ 2 A$ 23 Group Average - Producers Avg. -> 8.3x 5.7x 6.1x 8.0x 9.1x 12.2x 4.5x 5.8x 7.0x
Advanced Development / Exploration (Select Group)SUNDANCE RESOURCES (SDL-AU) A$ 0.00 1.03 7,102 A$ 21.3 5.5 0.2% 3.5% A$ 97 A$ 98 NEW MILLENNIUM (NML-T) C$ 0.15 1.16 181 C$ 26.3 0.1 0.1% 12.4% C$ 0 C$ 14 ZANAGA IRON (ZIOC-LSE) GBp 6 0.19 279 GBp 15.7 0.7 1.4% 5.2% GBp 0 GBp 15 CENTURY GLOBAL (CNT-T) C$ 0.17 98 C$ 16.7 0.0 0.0% 11.0% C$ 0 C$ 11 CHAMPION IRON (CIA-T) C$ 1.05 1.47 387 C$ 406.4 0.4 0.4% 12.7% C$ 44 C$ 439 BLACK IRON (BKI-T) C$ 0.09 (0.38) 160 C$ 13.6 0.3 0.2% -1.6% C$ 0 C$ 6 OCEANIC IRON (FEO-T) C$ 0.12 0.57 50 C$ 6.0 0.0 0.6% 6.9% C$ 2 C$ 6 MACARTHUR MINERALS (MMS-T) C$ 0.06 0.77 147 C$ 8.8 0.4 0.7% 9.2% C$ 0 C$ 9 Group Average - Developers / Explorers Avg. ->All data sourced from Bloomberg
EV/EBITDAP/EPSCFPS (LoC) P/CFPS

The Weekly Dig 7/7/17
Haywood Mining [email protected] Page 22
Uranium Comparables – Consensus Estimates
IBES Shares Market Enterprise Total Reserves IBESCompany (T icker)Haywood Covered Names bold
Share Price
Consensus Target
Implied Return
Outst. (millions)
Capitalization (millions)
Value (USD)(millions)
& Resources (M lb)
USD EV/lb Resource
Consensus NAV
Price / Nav 2016 2017 2018 2016 2017 2018 2016 2017 2018 2016 2017 2018
Cameco Corporation (CCO-T) $11.96 $15.81 32% 396 $4,734 $4,621 $15.60 0.77x $0.98 $1.17 $1.46 12.2x 10.3x 8.2x $0.44 $0.38 $0.72 27.2x 31.6x 16.7xPaladin Energy (PDN-T) $0.05 1,713 $77.1 $410.6 $0.08 0.56x $0.01 ($0.03) ($0.01) 6.7x ($0.02) ($0.05) ($0.01)Uranium Energy (UEC-US) $1.61 $2.98 85% 139 $223.3 $212.8 $2.78 0.58x ($0.16) ($0.08) ($0.14) ($0.16) ($0.10) ($0.07)Energy Fuels (UUUU-US) $1.58 $4.27 170% 70 $111.3 $137.3 $4.03 0.39x $0.05 ($0.08) ($0.07) 31.6x ($0.51) ($0.34) ($0.36)UR-Energy Inc. (URE-T) $0.79 $1.90 141% 146 $115.2 $107.3 $2.25 0.35x $0.03 $0.08 $0.08 30.0x 10.5x 9.6x ($0.03) $0.04 $0.01 21.5x 112.9xPeninsula Energy (PEN-AU) $0.37 $0.86 136% 231 $84.2 $88.2 $1.01 0.36x ($0.03) $0.03 11.9x ($0.07) ($0.03) $0.00 112.3xEnergy Resources (ERA-AU) $0.47 518 $243.3 ($115.6) $0.60 0.78x $0.02 ($0.05) 23.5x ($0.37) ($0.13) ($0.08)Group Average - Producers 0.54x 20.8x 10.4x 9.9x 27.2x 26.6x 80.6x
NexGen Energy (NXE-T) $2.87 $4.61 61% 313 $898 $743.8 $4.94 0.58x ($0.04) ($0.02) ($0.02) ($0.06) ($0.05) ($0.04)Denison Mines (DML-T) $0.58 $0.97 67% 559 $324.3 $201.6 $0.96 0.60x ($0.02) $0.03 ($0.02) 23.2x ($0.02) ($0.02) ($0.01)Fission Uranium (FCU-T) $0.60 $1.63 172% 485 $290.8 $190.2 $1.96 0.31x ($0.02) ($0.01) ($0.01) ($0.02) ($0.02) ($0.01)Berkeley Energia (BKY-AU) $0.80 $1.29 63% 255 $202.3 $120.9 ($0.03) ($0.05) ($0.05) ($0.03) ($0.05) $0.12 6.8xGoviEx Uranium (GXU-V) $0.20 322 $62.8 $54.2Toro Energy (TOE-AU) $0.03 $0.04 43% 2,008 $56.2 $46.6 $0.07 0.40xUEX Corporation (UEX-T) $0.19 $0.40 116% 319 $59.1 $39.3 $0.51 0.36x ($0.03) ($0.02) ($0.02) ($0.03) ($0.02) ($0.02)Vimy Resources (VMY-AU) $0.17 $0.46 170% 317 $53.9 $42.3 $0.45 0.38x ($0.02) ($0.02) ($0.01) ($0.05) ($0.03) ($0.01)Deep Yellow (DYL-AU) $0.28 190 $52.3 $37.9Summit Resources (SMM-AU) $0.18 218 $39.2 $28.7A-Cap Resources (ACB-AU) $0.05 872 $46.2 $30.4Western Uranium (WUC-L) $1.19 20 $23.3 $17.6Energy Metals (EME-AU) $0.09 210 $18.9 ($1.3)Group Average - Developers 0.44x 23.2x 6.8x
Aurania Resources (ARU-V) $2.20 27 $60.1 $46.6Mega Uranium (MGA-T) $0.19 293 $54.2 $44.3Laramide Resources (LAM-T) $0.32 $0.60 90% 115 $36.2 $36.2 $0.72 0.44xIsoEnergy Ltd. (ISO-V) $0.78 42 $32.8 $21.8Kivalliq Energy (KIV-V) $0.10 $0.15 50% 247 $24.7 $15.8 $0.16 0.63xBannerman Resources (BMN-AU) $0.03 850 $24.6 $15.3Skyharbour Resources (SYH-V) $0.45 54 $23.9 $17.2Globex Mining (GMX-T) $0.50 51 $25.6 $17.8Forsys Metals (FSY-T) $0.13 146 $18.2 $15.4Plateau Uranium (PLU-V) $0.32 58 $18.6 $13.4Fission 3.0 (FUU-V) $0.07 220 $14.3 $10.3Azimut Exploration (AZM-V) $0.27 45 $12.0 $7.5Purepoint Uranium (PTU-V) $0.07 189 $13.2 $6.9U3O8 Corp. (UWE-T) $0.03 345 $8.6 $7.8Melkior Resources (MKR-V) $0.05 144 $7.2 $5.8Avrupa Minerals (AVU-V) $0.10 77 $7.3 $5.9CanAlaska Uranium (CVV-V) $0.36 27 $9.7 $5.5Marenica Energy (MEY-AU) $0.16 42 $6.6 $6.2X-Terra Resources (XTT-V) $0.36 24 $8.6 $5.8Zadar Ventures (ZAD-V) $0.08 88 $7.0 $4.7Blue Sky (BSK-V) $0.12 58 $6.6 $4.8Anfield Resources (ARY-V) $0.06 109 $6.0 $4.5Eros Resources (ERC-V) $0.17 48 $8.2 $4.4Cauldron Energy (CXU-AU) $0.03 329 $11.2 $4.5Tajiri Resources (TAJ-V) $0.14 51 $6.9 $4.3Benton Resources (BEX-V) $0.08 79 $6.4 $3.0Pele Mountain (GEM-V) $0.02 210 $4.2 $3.192 Resources (NTY-V) $0.08 56 $4.5 $2.3Uracan Resources (URC-V) $0.03 106 $3.2 $2.6enCore Energy (:EU-V) $0.05 111 $5.6 $2.3Aben Resources (ABN-V) $0.10 46 $4.4 $3.2Tarku Resources (TKU-V) $0.05 47 $2.4 $1.8Montero Mining (MON-V) $0.02 85 $1.7 $1.8Forum Uranium (FDC-V) $0.05 75 $3.8 $1.5Aldever Resources (ALD-V) $0.05 41 $2.0 $1.2Roughrider Exploration (REL-V) $0.07 37 $2.6 $1.7Uravan Minerals (UVN-V) $0.06 42 $2.3 $1.6Spruce Ridge (SHL-V) $0.02 73 $1.1 $1.0Elysee Development (ELC-V) $0.31 22 $6.7 ($3.8)Group Average - Explorers 0.53x
INVENTORY FUNDSUranium Participation (U-T) $3.71 $5.16 39% 121 $448.35 $353.5 15.5 $22.81 $5.21 0.71x
All data sourced from S&P Capital IQ, SNL Financial, Bloomberg
EPS (LoC) P/EPS
PROD
UCER
SDE
VELO
PERS
EXPL
ORER
S
CFPS (LoC) P/CFPS
The Weekly Dig 7/7/17
Haywood Mining [email protected] Page 23
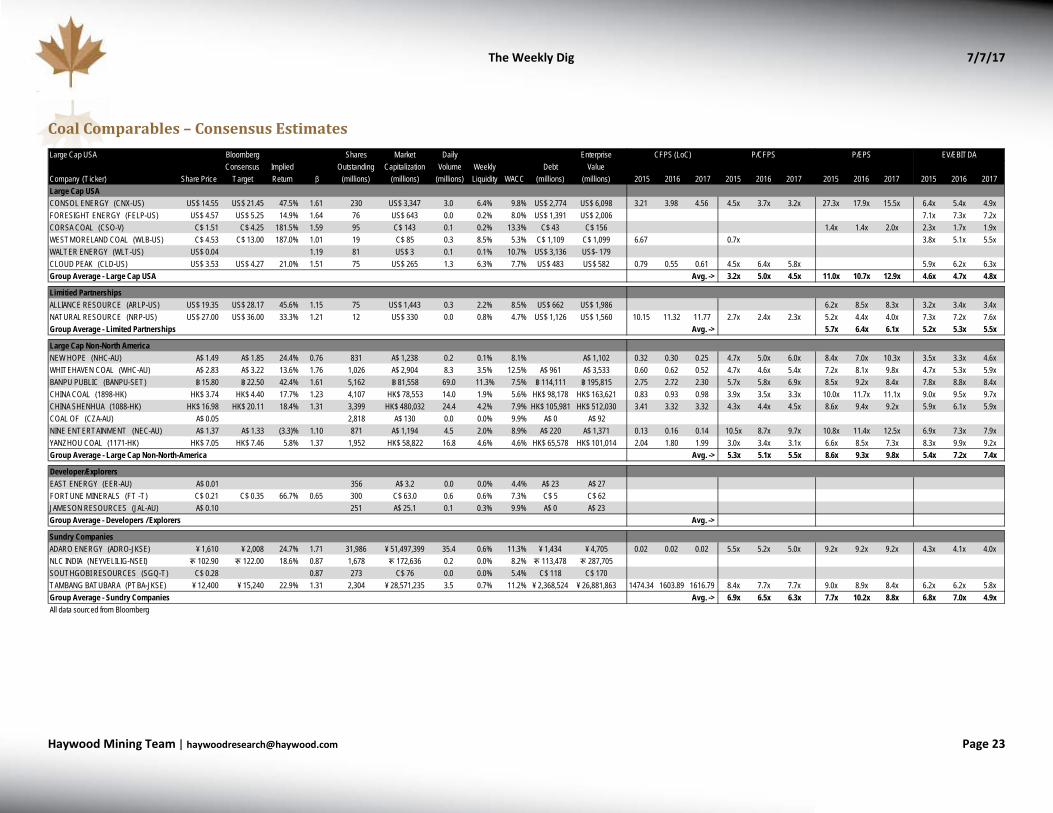
Coal Comparables – Consensus Estimates
Large Cap USA Bloomberg Shares Market Daily Enterprise
Company (T icker) Share PriceConsensus
TargetImplied Return β
Outstanding (millions)
Capitalization (millions)
Volume (millions)
Weekly Liquidity WACC
Debt (millions)
Value (millions) 2015 2016 2017 2015 2016 2017 2015 2016 2017 2015 2016 2017
Large Cap USACONSOL ENERGY (CNX-US) US$ 14.55 US$ 21.45 47.5% 1.61 230 US$ 3,347 3.0 6.4% 9.8% US$ 2,774 US$ 6,098 3.21 3.98 4.56 4.5x 3.7x 3.2x 27.3x 17.9x 15.5x 6.4x 5.4x 4.9xFORESIGHT ENERGY (FELP-US) US$ 4.57 US$ 5.25 14.9% 1.64 76 US$ 643 0.0 0.2% 8.0% US$ 1,391 US$ 2,006 7.1x 7.3x 7.2xCORSA COAL (CSO-V) C$ 1.51 C$ 4.25 181.5% 1.59 95 C$ 143 0.1 0.2% 13.3% C$ 43 C$ 156 1.4x 1.4x 2.0x 2.3x 1.7x 1.9xWESTMORELAND COAL (WLB-US) C$ 4.53 C$ 13.00 187.0% 1.01 19 C$ 85 0.3 8.5% 5.3% C$ 1,109 C$ 1,099 6.67 0.7x 3.8x 5.1x 5.5xWALTER ENERGY (WLT-US) US$ 0.04 1.19 81 US$ 3 0.1 0.1% 10.7% US$ 3,136 US$- 179CLOUD PEAK (CLD-US) US$ 3.53 US$ 4.27 21.0% 1.51 75 US$ 265 1.3 6.3% 7.7% US$ 483 US$ 582 0.79 0.55 0.61 4.5x 6.4x 5.8x 5.9x 6.2x 6.3xGroup Average - Large Cap USA Avg. -> 3.2x 5.0x 4.5x 11.0x 10.7x 12.9x 4.6x 4.7x 4.8x
Limitied PartnershipsALLIANCE RESOURCE (ARLP-US) US$ 19.35 US$ 28.17 45.6% 1.15 75 US$ 1,443 0.3 2.2% 8.5% US$ 662 US$ 1,986 6.2x 8.5x 8.3x 3.2x 3.4x 3.4xNATURAL RESOURCE (NRP-US) US$ 27.00 US$ 36.00 33.3% 1.21 12 US$ 330 0.0 0.8% 4.7% US$ 1,126 US$ 1,560 10.15 11.32 11.77 2.7x 2.4x 2.3x 5.2x 4.4x 4.0x 7.3x 7.2x 7.6xGroup Average - Limited Partnerships Avg. -> 5.7x 6.4x 6.1x 5.2x 5.3x 5.5x
Large Cap Non-North AmericaNEW HOPE (NHC-AU) A$ 1.49 A$ 1.85 24.4% 0.76 831 A$ 1,238 0.2 0.1% 8.1% A$ 15 A$ 1,102 0.32 0.30 0.25 4.7x 5.0x 6.0x 8.4x 7.0x 10.3x 3.5x 3.3x 4.6xWHITEHAVEN COAL (WHC-AU) A$ 2.83 A$ 3.22 13.6% 1.76 1,026 A$ 2,904 8.3 3.5% 12.5% A$ 961 A$ 3,533 0.60 0.62 0.52 4.7x 4.6x 5.4x 7.2x 8.1x 9.8x 4.7x 5.3x 5.9xBANPU PUBLIC (BANPU-SET) ฿ 15.80 ฿ 22.50 42.4% 1.61 5,162 ฿ 81,558 69.0 11.3% 7.5% ฿ 114,111 ฿ 195,815 2.75 2.72 2.30 5.7x 5.8x 6.9x 8.5x 9.2x 8.4x 7.8x 8.8x 8.4xCHINA COAL (1898-HK) HK$ 3.74 HK$ 4.40 17.7% 1.23 4,107 HK$ 78,553 14.0 1.9% 5.6% HK$ 98,178 HK$ 163,621 0.83 0.93 0.98 3.9x 3.5x 3.3x 10.0x 11.7x 11.1x 9.0x 9.5x 9.7xCHINA SHENHUA (1088-HK) HK$ 16.98 HK$ 20.11 18.4% 1.31 3,399 HK$ 480,032 24.4 4.2% 7.9% HK$ 105,981 HK$ 512,030 3.41 3.32 3.32 4.3x 4.4x 4.5x 8.6x 9.4x 9.2x 5.9x 6.1x 5.9xCOAL OF (CZA-AU) A$ 0.05 2,818 A$ 130 0.0 0.0% 9.9% A$ 0 A$ 92NINE ENTERTAINMENT (NEC-AU) A$ 1.37 A$ 1.33 (3.3)% 1.10 871 A$ 1,194 4.5 2.0% 8.9% A$ 220 A$ 1,371 0.13 0.16 0.14 10.5x 8.7x 9.7x 10.8x 11.4x 12.5x 6.9x 7.3x 7.9xYANZHOU COAL (1171-HK) HK$ 7.05 HK$ 7.46 5.8% 1.37 1,952 HK$ 58,822 16.8 4.6% 4.6% HK$ 65,578 HK$ 101,014 2.04 1.80 1.99 3.0x 3.4x 3.1x 6.6x 8.5x 7.3x 8.3x 9.9x 9.2xGroup Average - Large Cap Non-North-America Avg. -> 5.3x 5.1x 5.5x 8.6x 9.3x 9.8x 5.4x 7.2x 7.4x
Developer/ExplorersEAST ENERGY (EER-AU) A$ 0.01 356 A$ 3.2 0.0 0.0% 4.4% A$ 23 A$ 27FORTUNE MINERALS (FT -T) C$ 0.21 C$ 0.35 66.7% 0.65 300 C$ 63.0 0.6 0.6% 7.3% C$ 5 C$ 62JAMESON RESOURCES (JAL-AU) A$ 0.10 251 A$ 25.1 0.1 0.3% 9.9% A$ 0 A$ 23Group Average - Developers / Explorers Avg. ->
Sundry CompaniesADARO ENERGY (ADRO-JKSE) ¥ 1,610 ¥ 2,008 24.7% 1.71 31,986 ¥ 51,497,399 35.4 0.6% 11.3% ¥ 1,434 ¥ 4,705 0.02 0.02 0.02 5.5x 5.2x 5.0x 9.2x 9.2x 9.2x 4.3x 4.1x 4.0xNLC INDIA (NEYVELILIG-NSEI) रू 102.90 रू 122.00 18.6% 0.87 1,678 रू 172,636 0.2 0.0% 8.2% रू 113,478 रू 287,705SOUTHGOBI RESOURCES (SGQ-T) C$ 0.28 0.87 273 C$ 76 0.0 0.0% 5.4% C$ 118 C$ 170TAMBANG BATUBARA (PTBA-JKSE) ¥ 12,400 ¥ 15,240 22.9% 1.31 2,304 ¥ 28,571,235 3.5 0.7% 11.2% ¥ 2,368,524 ¥ 26,881,863 1474.34 1603.89 1616.79 8.4x 7.7x 7.7x 9.0x 8.9x 8.4x 6.2x 6.2x 5.8xGroup Average - Sundry Companies Avg. -> 6.9x 6.5x 6.3x 7.7x 10.2x 8.8x 6.8x 7.0x 4.9xAll data sourced from Bloomberg
EV/EBITDAP/EPSCFPS (LoC) P/CFPS
The Weekly Dig 7/7/17
Haywood Mining [email protected] Page 24
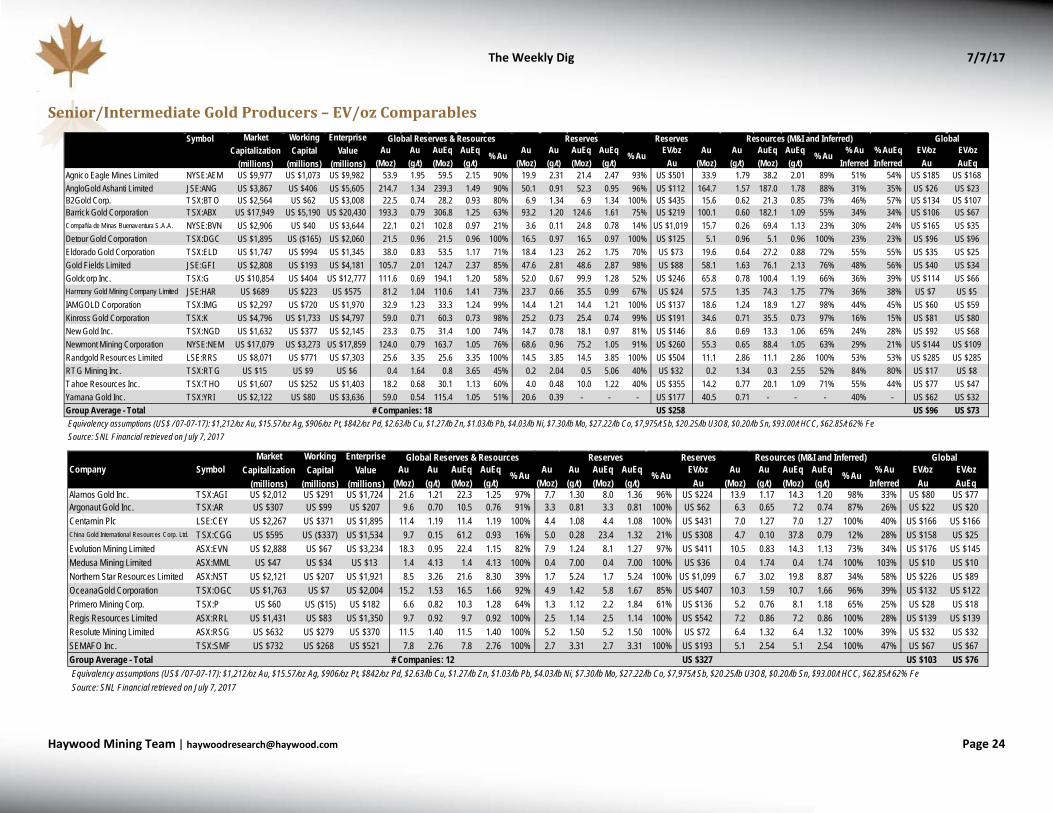
Senior/Intermediate Gold Producers – EV/oz Comparables
Symbol Reserves
Agnico Eagle Mines Limited NYSE:AEM US $9,977 US $1,073 US $9,982 53.9 1.95 59.5 2.15 90% 19.9 2.31 21.4 2.47 93% US $501 33.9 1.79 38.2 2.01 89% 51% 54% US $185 US $168AngloGold Ashanti Limited JSE:ANG US $3,867 US $406 US $5,605 214.7 1.34 239.3 1.49 90% 50.1 0.91 52.3 0.95 96% US $112 164.7 1.57 187.0 1.78 88% 31% 35% US $26 US $23B2Gold Corp. TSX:BTO US $2,564 US $62 US $3,008 22.5 0.74 28.2 0.93 80% 6.9 1.34 6.9 1.34 100% US $435 15.6 0.62 21.3 0.85 73% 46% 57% US $134 US $107Barrick Gold Corporation TSX:ABX US $17,949 US $5,190 US $20,430 193.3 0.79 306.8 1.25 63% 93.2 1.20 124.6 1.61 75% US $219 100.1 0.60 182.1 1.09 55% 34% 34% US $106 US $67Compañía de Minas Buenaventura S.A.A. NYSE:BVN US $2,906 US $40 US $3,644 22.1 0.21 102.8 0.97 21% 3.6 0.11 24.8 0.78 14% US $1,019 15.7 0.26 69.4 1.13 23% 30% 24% US $165 US $35Detour Gold Corporation TSX:DGC US $1,895 US ($165) US $2,060 21.5 0.96 21.5 0.96 100% 16.5 0.97 16.5 0.97 100% US $125 5.1 0.96 5.1 0.96 100% 23% 23% US $96 US $96Eldorado Gold Corporation TSX:ELD US $1,747 US $994 US $1,345 38.0 0.83 53.5 1.17 71% 18.4 1.23 26.2 1.75 70% US $73 19.6 0.64 27.2 0.88 72% 55% 55% US $35 US $25Gold Fields Limited JSE:GFI US $2,808 US $193 US $4,181 105.7 2.01 124.7 2.37 85% 47.6 2.81 48.6 2.87 98% US $88 58.1 1.63 76.1 2.13 76% 48% 56% US $40 US $34Goldcorp Inc. TSX:G US $10,854 US $404 US $12,777 111.6 0.69 194.1 1.20 58% 52.0 0.67 99.9 1.28 52% US $246 65.8 0.78 100.4 1.19 66% 36% 39% US $114 US $66Harmony Gold Mining Company Limited JSE:HAR US $689 US $223 US $575 81.2 1.04 110.6 1.41 73% 23.7 0.66 35.5 0.99 67% US $24 57.5 1.35 74.3 1.75 77% 36% 38% US $7 US $5IAMGOLD Corporation TSX:IMG US $2,297 US $720 US $1,970 32.9 1.23 33.3 1.24 99% 14.4 1.21 14.4 1.21 100% US $137 18.6 1.24 18.9 1.27 98% 44% 45% US $60 US $59Kinross Gold Corporation TSX:K US $4,796 US $1,733 US $4,797 59.0 0.71 60.3 0.73 98% 25.2 0.73 25.4 0.74 99% US $191 34.6 0.71 35.5 0.73 97% 16% 15% US $81 US $80New Gold Inc. TSX:NGD US $1,632 US $377 US $2,145 23.3 0.75 31.4 1.00 74% 14.7 0.78 18.1 0.97 81% US $146 8.6 0.69 13.3 1.06 65% 24% 28% US $92 US $68Newmont Mining Corporation NYSE:NEM US $17,079 US $3,273 US $17,859 124.0 0.79 163.7 1.05 76% 68.6 0.96 75.2 1.05 91% US $260 55.3 0.65 88.4 1.05 63% 29% 21% US $144 US $109Randgold Resources Limited LSE:RRS US $8,071 US $771 US $7,303 25.6 3.35 25.6 3.35 100% 14.5 3.85 14.5 3.85 100% US $504 11.1 2.86 11.1 2.86 100% 53% 53% US $285 US $285RTG Mining Inc. TSX:RTG US $15 US $9 US $6 0.4 1.64 0.8 3.65 45% 0.2 2.04 0.5 5.06 40% US $32 0.2 1.34 0.3 2.55 52% 84% 80% US $17 US $8Tahoe Resources Inc. TSX:THO US $1,607 US $252 US $1,403 18.2 0.68 30.1 1.13 60% 4.0 0.48 10.0 1.22 40% US $355 14.2 0.77 20.1 1.09 71% 55% 44% US $77 US $47Yamana Gold Inc. TSX:YRI US $2,122 US $80 US $3,636 59.0 0.54 115.4 1.05 51% 20.6 0.39 - - - US $177 40.5 0.71 - - - 40% - US $62 US $32Group Average - Total # Companies: 18 US $258 US $96 US $73Equivalency assumptions (US$ / 07-07-17): $1,212/oz Au, $15.57/oz Ag, $906/oz Pt, $842/oz Pd, $2.63/lb Cu, $1.27/lb Zn, $1.03/lb Pb, $4.03/lb Ni, $7.30/lb Mo, $27.22/lb Co, $7,975/t Sb, $20.25/lb U3O8, $0.20/lb Sn, $93.00/t HCC, $62.85/t 62% FeSource: SNL Financial retrieved on July 7, 2017
EV/ozAu
Resources (M&I and Inferred) GlobalAu
(Moz)Au(g/t)
AuEq(Moz)
AuEq(g/t)
% Au % AuInferred
% AuEqInferred
EV/ozAu
EV/ozAuEq
ReservesAu
(Moz)Au(g/t)
AuEq(Moz)
AuEq(g/t)
% Au
MarketCapitalization
(millions)
WorkingCapital
(millions)
EnterpriseValue
(millions)
Global Reserves & ResourcesAu
(Moz)Au(g/t)
AuEq(Moz)
AuEq(g/t)
% Au
Reserves
Alamos Gold Inc. TSX:AGI US $2,012 US $291 US $1,724 21.6 1.21 22.3 1.25 97% 7.7 1.30 8.0 1.36 96% US $224 13.9 1.17 14.3 1.20 98% 33% US $80 US $77Argonaut Gold Inc. TSX:AR US $307 US $99 US $207 9.6 0.70 10.5 0.76 91% 3.3 0.81 3.3 0.81 100% US $62 6.3 0.65 7.2 0.74 87% 26% US $22 US $20Centamin Plc LSE:CEY US $2,267 US $371 US $1,895 11.4 1.19 11.4 1.19 100% 4.4 1.08 4.4 1.08 100% US $431 7.0 1.27 7.0 1.27 100% 40% US $166 US $166China Gold International Resources Corp. Ltd. TSX:CGG US $595 US ($337) US $1,534 9.7 0.15 61.2 0.93 16% 5.0 0.28 23.4 1.32 21% US $308 4.7 0.10 37.8 0.79 12% 28% US $158 US $25Evolution Mining Limited ASX:EVN US $2,888 US $67 US $3,234 18.3 0.95 22.4 1.15 82% 7.9 1.24 8.1 1.27 97% US $411 10.5 0.83 14.3 1.13 73% 34% US $176 US $145Medusa Mining Limited ASX:MML US $47 US $34 US $13 1.4 4.13 1.4 4.13 100% 0.4 7.00 0.4 7.00 100% US $36 0.4 1.74 0.4 1.74 100% 103% US $10 US $10Northern Star Resources Limited ASX:NST US $2,121 US $207 US $1,921 8.5 3.26 21.6 8.30 39% 1.7 5.24 1.7 5.24 100% US $1,099 6.7 3.02 19.8 8.87 34% 58% US $226 US $89OceanaGold Corporation TSX:OGC US $1,763 US $7 US $2,004 15.2 1.53 16.5 1.66 92% 4.9 1.42 5.8 1.67 85% US $407 10.3 1.59 10.7 1.66 96% 39% US $132 US $122Primero Mining Corp. TSX:P US $60 US ($15) US $182 6.6 0.82 10.3 1.28 64% 1.3 1.12 2.2 1.84 61% US $136 5.2 0.76 8.1 1.18 65% 25% US $28 US $18Regis Resources Limited ASX:RRL US $1,431 US $83 US $1,350 9.7 0.92 9.7 0.92 100% 2.5 1.14 2.5 1.14 100% US $542 7.2 0.86 7.2 0.86 100% 28% US $139 US $139Resolute Mining Limited ASX:RSG US $632 US $279 US $370 11.5 1.40 11.5 1.40 100% 5.2 1.50 5.2 1.50 100% US $72 6.4 1.32 6.4 1.32 100% 39% US $32 US $32SEMAFO Inc. TSX:SMF US $732 US $268 US $521 7.8 2.76 7.8 2.76 100% 2.7 3.31 2.7 3.31 100% US $193 5.1 2.54 5.1 2.54 100% 47% US $67 US $67Group Average - Total # Companies: 12 US $327 US $103 US $76Equivalency assumptions (US$ / 07-07-17): $1,212/oz Au, $15.57/oz Ag, $906/oz Pt, $842/oz Pd, $2.63/lb Cu, $1.27/lb Zn, $1.03/lb Pb, $4.03/lb Ni, $7.30/lb Mo, $27.22/lb Co, $7,975/t Sb, $20.25/lb U3O8, $0.20/lb Sn, $93.00/t HCC, $62.85/t 62% FeSource: SNL Financial retrieved on July 7, 2017
EnterpriseValue
(millions)Company Symbol
MarketCapitalization
(millions)
WorkingCapital
(millions)
Global Reserves & Resources Reserves Resources (M&I and Inferred)Au
(Moz)Au(g/t)
AuEq(Moz)
AuEq(g/t)
% Au
GlobalEV/oz
Au% Au Au
(Moz)Au(g/t)
AuEq(Moz)
AuEq(g/t)
EV/ozAu
EV/ozAuEq
Au(Moz)
Au(g/t)
AuEq(Moz)
AuEq(g/t)
% Au % AuInferred
The Weekly Dig 7/7/17
Haywood Mining [email protected] Page 25
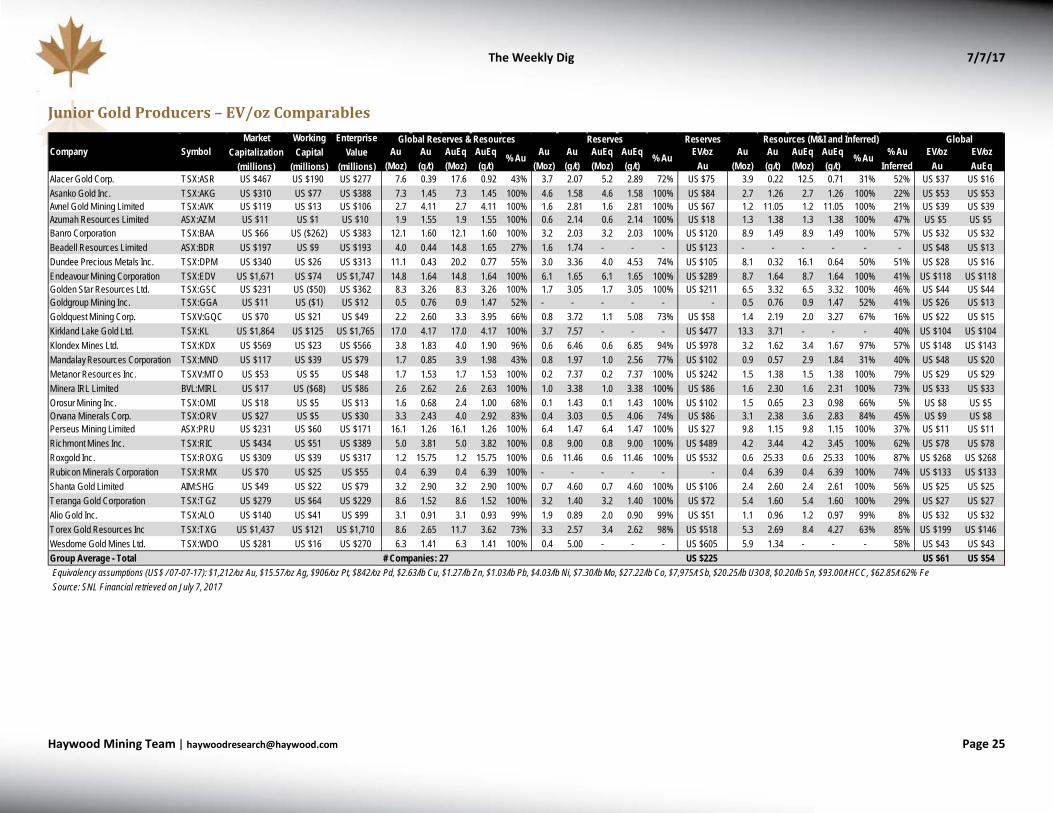
Junior Gold Producers – EV/oz Comparables
Reserves
Alacer Gold Corp. TSX:ASR US $467 US $190 US $277 7.6 0.39 17.6 0.92 43% 3.7 2.07 5.2 2.89 72% US $75 3.9 0.22 12.5 0.71 31% 52% US $37 US $16Asanko Gold Inc. TSX:AKG US $310 US $77 US $388 7.3 1.45 7.3 1.45 100% 4.6 1.58 4.6 1.58 100% US $84 2.7 1.26 2.7 1.26 100% 22% US $53 US $53Avnel Gold Mining Limited TSX:AVK US $119 US $13 US $106 2.7 4.11 2.7 4.11 100% 1.6 2.81 1.6 2.81 100% US $67 1.2 11.05 1.2 11.05 100% 21% US $39 US $39Azumah Resources Limited ASX:AZM US $11 US $1 US $10 1.9 1.55 1.9 1.55 100% 0.6 2.14 0.6 2.14 100% US $18 1.3 1.38 1.3 1.38 100% 47% US $5 US $5Banro Corporation TSX:BAA US $66 US ($262) US $383 12.1 1.60 12.1 1.60 100% 3.2 2.03 3.2 2.03 100% US $120 8.9 1.49 8.9 1.49 100% 57% US $32 US $32Beadell Resources Limited ASX:BDR US $197 US $9 US $193 4.0 0.44 14.8 1.65 27% 1.6 1.74 - - - US $123 - - - - - - US $48 US $13Dundee Precious Metals Inc. TSX:DPM US $340 US $26 US $313 11.1 0.43 20.2 0.77 55% 3.0 3.36 4.0 4.53 74% US $105 8.1 0.32 16.1 0.64 50% 51% US $28 US $16Endeavour Mining Corporation TSX:EDV US $1,671 US $74 US $1,747 14.8 1.64 14.8 1.64 100% 6.1 1.65 6.1 1.65 100% US $289 8.7 1.64 8.7 1.64 100% 41% US $118 US $118Golden Star Resources Ltd. TSX:GSC US $231 US ($50) US $362 8.3 3.26 8.3 3.26 100% 1.7 3.05 1.7 3.05 100% US $211 6.5 3.32 6.5 3.32 100% 46% US $44 US $44Goldgroup Mining Inc. TSX:GGA US $11 US ($1) US $12 0.5 0.76 0.9 1.47 52% - - - - - - 0.5 0.76 0.9 1.47 52% 41% US $26 US $13Goldquest Mining Corp. TSXV:GQC US $70 US $21 US $49 2.2 2.60 3.3 3.95 66% 0.8 3.72 1.1 5.08 73% US $58 1.4 2.19 2.0 3.27 67% 16% US $22 US $15Kirkland Lake Gold Ltd. TSX:KL US $1,864 US $125 US $1,765 17.0 4.17 17.0 4.17 100% 3.7 7.57 - - - US $477 13.3 3.71 - - - 40% US $104 US $104Klondex Mines Ltd. TSX:KDX US $569 US $23 US $566 3.8 1.83 4.0 1.90 96% 0.6 6.46 0.6 6.85 94% US $978 3.2 1.62 3.4 1.67 97% 57% US $148 US $143Mandalay Resources Corporation TSX:MND US $117 US $39 US $79 1.7 0.85 3.9 1.98 43% 0.8 1.97 1.0 2.56 77% US $102 0.9 0.57 2.9 1.84 31% 40% US $48 US $20Metanor Resources Inc. TSXV:MTO US $53 US $5 US $48 1.7 1.53 1.7 1.53 100% 0.2 7.37 0.2 7.37 100% US $242 1.5 1.38 1.5 1.38 100% 79% US $29 US $29Minera IRL Limited BVL:MIRL US $17 US ($68) US $86 2.6 2.62 2.6 2.63 100% 1.0 3.38 1.0 3.38 100% US $86 1.6 2.30 1.6 2.31 100% 73% US $33 US $33Orosur Mining Inc. TSX:OMI US $18 US $5 US $13 1.6 0.68 2.4 1.00 68% 0.1 1.43 0.1 1.43 100% US $102 1.5 0.65 2.3 0.98 66% 5% US $8 US $5Orvana Minerals Corp. TSX:ORV US $27 US $5 US $30 3.3 2.43 4.0 2.92 83% 0.4 3.03 0.5 4.06 74% US $86 3.1 2.38 3.6 2.83 84% 45% US $9 US $8Perseus Mining Limited ASX:PRU US $231 US $60 US $171 16.1 1.26 16.1 1.26 100% 6.4 1.47 6.4 1.47 100% US $27 9.8 1.15 9.8 1.15 100% 37% US $11 US $11Richmont Mines Inc. TSX:RIC US $434 US $51 US $389 5.0 3.81 5.0 3.82 100% 0.8 9.00 0.8 9.00 100% US $489 4.2 3.44 4.2 3.45 100% 62% US $78 US $78Roxgold Inc. TSX:ROXG US $309 US $39 US $317 1.2 15.75 1.2 15.75 100% 0.6 11.46 0.6 11.46 100% US $532 0.6 25.33 0.6 25.33 100% 87% US $268 US $268Rubicon Minerals Corporation TSX:RMX US $70 US $25 US $55 0.4 6.39 0.4 6.39 100% - - - - - - 0.4 6.39 0.4 6.39 100% 74% US $133 US $133Shanta Gold Limited AIM:SHG US $49 US $22 US $79 3.2 2.90 3.2 2.90 100% 0.7 4.60 0.7 4.60 100% US $106 2.4 2.60 2.4 2.61 100% 56% US $25 US $25Teranga Gold Corporation TSX:TGZ US $279 US $64 US $229 8.6 1.52 8.6 1.52 100% 3.2 1.40 3.2 1.40 100% US $72 5.4 1.60 5.4 1.60 100% 29% US $27 US $27Alio Gold Inc. TSX:ALO US $140 US $41 US $99 3.1 0.91 3.1 0.93 99% 1.9 0.89 2.0 0.90 99% US $51 1.1 0.96 1.2 0.97 99% 8% US $32 US $32Torex Gold Resources Inc TSX:TXG US $1,437 US $121 US $1,710 8.6 2.65 11.7 3.62 73% 3.3 2.57 3.4 2.62 98% US $518 5.3 2.69 8.4 4.27 63% 85% US $199 US $146Wesdome Gold Mines Ltd. TSX:WDO US $281 US $16 US $270 6.3 1.41 6.3 1.41 100% 0.4 5.00 - - - US $605 5.9 1.34 - - - 58% US $43 US $43Group Average - Total # Companies: 27 US $225 US $61 US $54Equivalency assumptions (US$ / 07-07-17): $1,212/oz Au, $15.57/oz Ag, $906/oz Pt, $842/oz Pd, $2.63/lb Cu, $1.27/lb Zn, $1.03/lb Pb, $4.03/lb Ni, $7.30/lb Mo, $27.22/lb Co, $7,975/t Sb, $20.25/lb U3O8, $0.20/lb Sn, $93.00/t HCC, $62.85/t 62% FeSource: SNL Financial retrieved on July 7, 2017
EnterpriseValue
(millions)Company Symbol
MarketCapitalization
(millions)
WorkingCapital
(millions)
Global Reserves & Resources Reserves Resources (M&I and Inferred)Au
(Moz)Au(g/t)
AuEq(Moz)
AuEq(g/t)
% Au
Global
% Au Au(Moz)
Au(g/t)
AuEq(Moz)
AuEq(g/t)
EV/ozAu
EV/ozAuEq
Au(Moz)
Au(g/t)
AuEq(Moz)
AuEq(g/t)
% Au % AuInferred
EV/ozAu
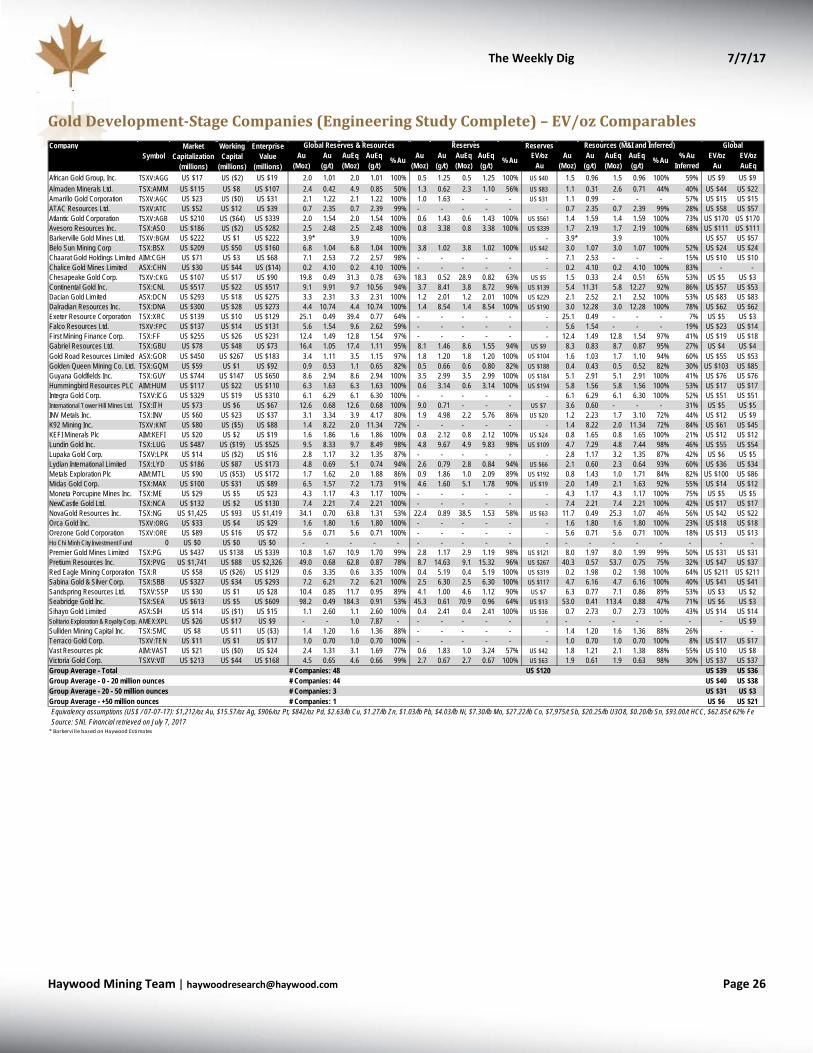
The Weekly Dig 7/7/17
Haywood Mining [email protected] Page 26
Gold Development-Stage Companies (Engineering Study Complete) – EV/oz Comparables
Company Reserves
African Gold Group, Inc. TSXV:AGG US $17 US ($2) US $19 2.0 1.01 2.0 1.01 100% 0.5 1.25 0.5 1.25 100% US $40 1.5 0.96 1.5 0.96 100% 59% US $9 US $9Almaden Minerals Ltd. TSX:AMM US $115 US $8 US $107 2.4 0.42 4.9 0.85 50% 1.3 0.62 2.3 1.10 56% US $83 1.1 0.31 2.6 0.71 44% 40% US $44 US $22Amarillo Gold Corporation TSXV:AGC US $23 US ($0) US $31 2.1 1.22 2.1 1.22 100% 1.0 1.63 - - - US $31 1.1 0.99 - - - 57% US $15 US $15ATAC Resources Ltd. TSXV:ATC US $52 US $12 US $39 0.7 2.35 0.7 2.39 99% - - - - - - 0.7 2.35 0.7 2.39 99% 28% US $58 US $57Atlantic Gold Corporation TSXV:AGB US $210 US ($64) US $339 2.0 1.54 2.0 1.54 100% 0.6 1.43 0.6 1.43 100% US $561 1.4 1.59 1.4 1.59 100% 73% US $170 US $170Avesoro Resources Inc. TSX:ASO US $186 US ($2) US $282 2.5 2.48 2.5 2.48 100% 0.8 3.38 0.8 3.38 100% US $339 1.7 2.19 1.7 2.19 100% 68% US $111 US $111Barkerville Gold Mines Ltd. TSXV:BGM US $222 US $1 US $222 3.9* 3.9 100% - 3.9* 3.9 100% US $57 US $57Belo Sun Mining Corp TSX:BSX US $209 US $50 US $160 6.8 1.04 6.8 1.04 100% 3.8 1.02 3.8 1.02 100% US $42 3.0 1.07 3.0 1.07 100% 52% US $24 US $24Chaarat Gold Holdings Limited AIM:CGH US $71 US $3 US $68 7.1 2.53 7.2 2.57 98% - - - - - - 7.1 2.53 - - - 15% US $10 US $10Chalice Gold Mines Limited ASX:CHN US $30 US $44 US ($14) 0.2 4.10 0.2 4.10 100% - - - - - - 0.2 4.10 0.2 4.10 100% 83% - - Chesapeake Gold Corp. TSXV:CKG US $107 US $17 US $90 19.8 0.49 31.3 0.78 63% 18.3 0.52 28.9 0.82 63% US $5 1.5 0.33 2.4 0.51 65% 53% US $5 US $3Continental Gold Inc. TSX:CNL US $517 US $22 US $517 9.1 9.91 9.7 10.56 94% 3.7 8.41 3.8 8.72 96% US $139 5.4 11.31 5.8 12.27 92% 86% US $57 US $53Dacian Gold Limited ASX:DCN US $293 US $18 US $275 3.3 2.31 3.3 2.31 100% 1.2 2.01 1.2 2.01 100% US $229 2.1 2.52 2.1 2.52 100% 53% US $83 US $83Dalradian Resources Inc. TSX:DNA US $300 US $28 US $273 4.4 10.74 4.4 10.74 100% 1.4 8.54 1.4 8.54 100% US $190 3.0 12.28 3.0 12.28 100% 78% US $62 US $62Exeter Resource Corporation TSX:XRC US $139 US $10 US $129 25.1 0.49 39.4 0.77 64% - - - - - - 25.1 0.49 - - - 7% US $5 US $3Falco Resources Ltd. TSXV:FPC US $137 US $14 US $131 5.6 1.54 9.6 2.62 59% - - - - - - 5.6 1.54 - - - 19% US $23 US $14First Mining Finance Corp. TSX:FF US $255 US $26 US $231 12.4 1.49 12.8 1.54 97% - - - - - - 12.4 1.49 12.8 1.54 97% 41% US $19 US $18Gabriel Resources Ltd. TSX:GBU US $78 US $48 US $73 16.4 1.05 17.4 1.11 95% 8.1 1.46 8.6 1.55 94% US $9 8.3 0.83 8.7 0.87 95% 27% US $4 US $4Gold Road Resources Limited ASX:GOR US $450 US $267 US $183 3.4 1.11 3.5 1.15 97% 1.8 1.20 1.8 1.20 100% US $104 1.6 1.03 1.7 1.10 94% 60% US $55 US $53Golden Queen Mining Co. Ltd. TSX:GQM US $59 US $1 US $92 0.9 0.53 1.1 0.65 82% 0.5 0.66 0.6 0.80 82% US $188 0.4 0.43 0.5 0.52 82% 30% US $103 US $85Guyana Goldfields Inc. TSX:GUY US $744 US $147 US $650 8.6 2.94 8.6 2.94 100% 3.5 2.99 3.5 2.99 100% US $184 5.1 2.91 5.1 2.91 100% 41% US $76 US $76Hummingbird Resources PLC AIM:HUM US $117 US $22 US $110 6.3 1.63 6.3 1.63 100% 0.6 3.14 0.6 3.14 100% US $194 5.8 1.56 5.8 1.56 100% 53% US $17 US $17Integra Gold Corp. TSXV:ICG US $329 US $19 US $310 6.1 6.29 6.1 6.30 100% - - - - - - 6.1 6.29 6.1 6.30 100% 52% US $51 US $51International Tower Hill Mines Ltd. TSX:ITH US $73 US $6 US $67 12.6 0.68 12.6 0.68 100% 9.0 0.71 - - - US $7 3.6 0.60 - - - 31% US $5 US $5INV Metals Inc. TSX:INV US $60 US $23 US $37 3.1 3.34 3.9 4.17 80% 1.9 4.98 2.2 5.76 86% US $20 1.2 2.23 1.7 3.10 72% 44% US $12 US $9K92 Mining Inc. TSXV:KNT US $80 US ($5) US $88 1.4 8.22 2.0 11.34 72% - - - - - - 1.4 8.22 2.0 11.34 72% 84% US $61 US $45KEFI Minerals Plc AIM:KEFI US $20 US $2 US $19 1.6 1.86 1.6 1.86 100% 0.8 2.12 0.8 2.12 100% US $24 0.8 1.65 0.8 1.65 100% 21% US $12 US $12Lundin Gold Inc. TSX:LUG US $487 US ($19) US $525 9.5 8.33 9.7 8.49 98% 4.8 9.67 4.9 9.83 98% US $109 4.7 7.29 4.8 7.44 98% 46% US $55 US $54Lupaka Gold Corp. TSXV:LPK US $14 US ($2) US $16 2.8 1.17 3.2 1.35 87% - - - - - - 2.8 1.17 3.2 1.35 87% 42% US $6 US $5Lydian International Limited TSX:LYD US $186 US $87 US $173 4.8 0.69 5.1 0.74 94% 2.6 0.79 2.8 0.84 94% US $66 2.1 0.60 2.3 0.64 93% 60% US $36 US $34Metals Exploration Plc AIM:MTL US $90 US ($53) US $172 1.7 1.62 2.0 1.88 86% 0.9 1.86 1.0 2.09 89% US $192 0.8 1.43 1.0 1.71 84% 82% US $100 US $86Midas Gold Corp. TSX:MAX US $100 US $31 US $89 6.5 1.57 7.2 1.73 91% 4.6 1.60 5.1 1.78 90% US $19 2.0 1.49 2.1 1.63 92% 55% US $14 US $12Moneta Porcupine Mines Inc. TSX:ME US $29 US $5 US $23 4.3 1.17 4.3 1.17 100% - - - - - - 4.3 1.17 4.3 1.17 100% 75% US $5 US $5NewCastle Gold Ltd. TSX:NCA US $132 US $2 US $130 7.4 2.21 7.4 2.21 100% - - - - - - 7.4 2.21 7.4 2.21 100% 42% US $17 US $17NovaGold Resources Inc. TSX:NG US $1,425 US $93 US $1,419 34.1 0.70 63.8 1.31 53% 22.4 0.89 38.5 1.53 58% US $63 11.7 0.49 25.3 1.07 46% 56% US $42 US $22Orca Gold Inc. TSXV:ORG US $33 US $4 US $29 1.6 1.80 1.6 1.80 100% - - - - - - 1.6 1.80 1.6 1.80 100% 23% US $18 US $18Orezone Gold Corporation TSXV:ORE US $89 US $16 US $72 5.6 0.71 5.6 0.71 100% - - - - - - 5.6 0.71 5.6 0.71 100% 18% US $13 US $13Ho Chi Minh City Investment Fund 0 US $0 US $0 US $0 - - - - - - - - - - - - - - - - - - - Premier Gold Mines Limited TSX:PG US $437 US $138 US $339 10.8 1.67 10.9 1.70 99% 2.8 1.17 2.9 1.19 98% US $121 8.0 1.97 8.0 1.99 99% 50% US $31 US $31Pretium Resources Inc. TSX:PVG US $1,741 US $88 US $2,326 49.0 0.68 62.8 0.87 78% 8.7 14.63 9.1 15.32 96% US $267 40.3 0.57 53.7 0.75 75% 32% US $47 US $37Red Eagle Mining Corporation TSX:R US $58 US ($26) US $129 0.6 3.35 0.6 3.35 100% 0.4 5.19 0.4 5.19 100% US $319 0.2 1.98 0.2 1.98 100% 64% US $211 US $211Sabina Gold & Silver Corp. TSX:SBB US $327 US $34 US $293 7.2 6.21 7.2 6.21 100% 2.5 6.30 2.5 6.30 100% US $117 4.7 6.16 4.7 6.16 100% 40% US $41 US $41Sandspring Resources Ltd. TSXV:SSP US $30 US $1 US $28 10.4 0.85 11.7 0.95 89% 4.1 1.00 4.6 1.12 90% US $7 6.3 0.77 7.1 0.86 89% 53% US $3 US $2Seabridge Gold Inc. TSX:SEA US $613 US $5 US $609 98.2 0.49 184.3 0.91 53% 45.3 0.61 70.9 0.96 64% US $13 53.0 0.41 113.4 0.88 47% 71% US $6 US $3Sihayo Gold Limited ASX:SIH US $14 US ($1) US $15 1.1 2.60 1.1 2.60 100% 0.4 2.41 0.4 2.41 100% US $36 0.7 2.73 0.7 2.73 100% 43% US $14 US $14Solitario Exploration & Royalty Corp. AMEX:XPL US $26 US $17 US $9 - - 1.0 7.87 - - - - - - - - - - - - - - US $9Sulliden Mining Capital Inc. TSX:SMC US $8 US $11 US ($3) 1.4 1.20 1.6 1.36 88% - - - - - - 1.4 1.20 1.6 1.36 88% 26% - - Terraco Gold Corp. TSXV:TEN US $11 US $1 US $17 1.0 0.70 1.0 0.70 100% - - - - - - 1.0 0.70 1.0 0.70 100% 8% US $17 US $17Vast Resources plc AIM:VAST US $21 US ($0) US $24 2.4 1.31 3.1 1.69 77% 0.6 1.83 1.0 3.24 57% US $42 1.8 1.21 2.1 1.38 88% 55% US $10 US $8Victoria Gold Corp. TSXV:VIT US $213 US $44 US $168 4.5 0.65 4.6 0.66 99% 2.7 0.67 2.7 0.67 100% US $63 1.9 0.61 1.9 0.63 98% 30% US $37 US $37Group Average - Total # Companies: 48 US $120 US $39 US $36Group Average - 0 - 20 million ounces # Companies: 44 US $40 US $38Group Average - 20 - 50 million ounces # Companies: 3 US $31 US $3Group Average - +50 million ounces # Companies: 1 US $6 US $21Equivalency assumptions (US$ / 07-07-17): $1,212/oz Au, $15.57/oz Ag, $906/oz Pt, $842/oz Pd, $2.63/lb Cu, $1.27/lb Zn, $1.03/lb Pb, $4.03/lb Ni, $7.30/lb Mo, $27.22/lb Co, $7,975/t Sb, $20.25/lb U3O8, $0.20/lb Sn, $93.00/t HCC, $62.85/t 62% FeSource: SNL Financial retrieved on July 7, 2017
* Barkervil le based on Haywood Estimates
SymbolMarket
Capitalization(millions)
WorkingCapital
(millions)
EnterpriseValue
(millions)
Global Reserves & ResourcesAu
(Moz)Au
(g/t)AuEq(Moz)
AuEq(g/t) % Au
GlobalEV/oz
AuEV/ozAuEq
Resources (M&I and Inferred)Au
(Moz)Au
(g/t)AuEq(Moz) % AuAuEq
(g/t)% Au
InferredEV/oz
Au
ReservesAu
(Moz)Au
(g/t)AuEq(Moz) % AuAuEq
(g/t)
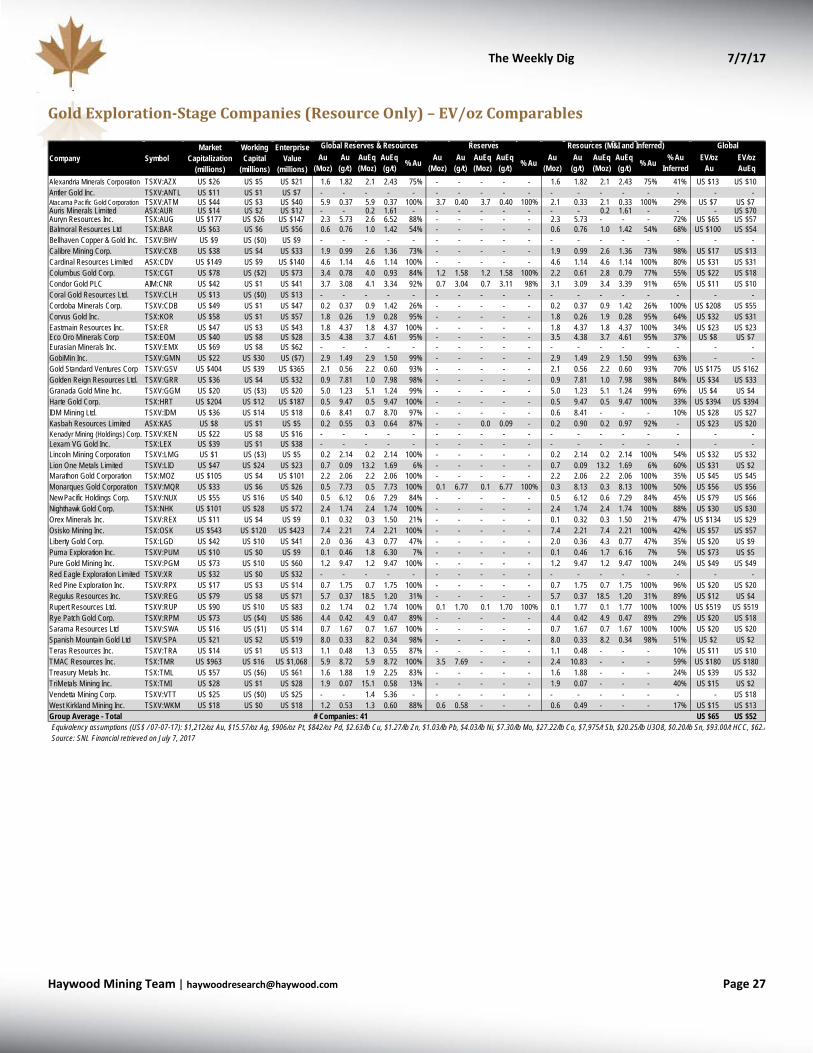
The Weekly Dig 7/7/17
Haywood Mining [email protected] Page 27
Gold Exploration-Stage Companies (Resource Only) – EV/oz Comparables
Alexandria Minerals Corporation TSXV:AZX US $26 US $5 US $21 1.6 1.82 2.1 2.43 75% - - - - - 1.6 1.82 2.1 2.43 75% 41% US $13 US $10Antler Gold Inc. TSXV:ANTL US $11 US $1 US $7 - - - - - - - - - - - - - - - - - - Atacama Pacific Gold Corporation TSXV:ATM US $44 US $3 US $40 5.9 0.37 5.9 0.37 100% 3.7 0.40 3.7 0.40 100% 2.1 0.33 2.1 0.33 100% 29% US $7 US $7Auris Minerals Limited ASX:AUR US $14 US $2 US $12 - - 0.2 1.61 - - - - - - - - 0.2 1.61 - - - US $70Auryn Resources Inc. TSX:AUG US $177 US $26 US $147 2.3 5.73 2.6 6.52 88% - - - - - 2.3 5.73 - - - 72% US $65 US $57Balmoral Resources Ltd TSX:BAR US $63 US $6 US $56 0.6 0.76 1.0 1.42 54% - - - - - 0.6 0.76 1.0 1.42 54% 68% US $100 US $54Bellhaven Copper & Gold Inc. TSXV:BHV US $9 US ($0) US $9 - - - - - - - - - - - - - - - - - - Calibre Mining Corp. TSXV:CXB US $38 US $4 US $33 1.9 0.99 2.6 1.36 73% - - - - - 1.9 0.99 2.6 1.36 73% 98% US $17 US $13Cardinal Resources Limited ASX:CDV US $149 US $9 US $140 4.6 1.14 4.6 1.14 100% - - - - - 4.6 1.14 4.6 1.14 100% 80% US $31 US $31Columbus Gold Corp. TSX:CGT US $78 US ($2) US $73 3.4 0.78 4.0 0.93 84% 1.2 1.58 1.2 1.58 100% 2.2 0.61 2.8 0.79 77% 55% US $22 US $18Condor Gold PLC AIM:CNR US $42 US $1 US $41 3.7 3.08 4.1 3.34 92% 0.7 3.04 0.7 3.11 98% 3.1 3.09 3.4 3.39 91% 65% US $11 US $10Coral Gold Resources Ltd. TSXV:CLH US $13 US ($0) US $13 - - - - - - - - - - - - - - - - - - Cordoba Minerals Corp. TSXV:CDB US $49 US $1 US $47 0.2 0.37 0.9 1.42 26% - - - - - 0.2 0.37 0.9 1.42 26% 100% US $208 US $55Corvus Gold Inc. TSX:KOR US $58 US $1 US $57 1.8 0.26 1.9 0.28 95% - - - - - 1.8 0.26 1.9 0.28 95% 64% US $32 US $31Eastmain Resources Inc. TSX:ER US $47 US $3 US $43 1.8 4.37 1.8 4.37 100% - - - - - 1.8 4.37 1.8 4.37 100% 34% US $23 US $23Eco Oro Minerals Corp TSX:EOM US $40 US $8 US $28 3.5 4.38 3.7 4.61 95% - - - - - 3.5 4.38 3.7 4.61 95% 37% US $8 US $7Eurasian Minerals Inc. TSXV:EMX US $69 US $8 US $62 - - - - - - - - - - - - - - - - - - GobiMin Inc. TSXV:GMN US $22 US $30 US ($7) 2.9 1.49 2.9 1.50 99% - - - - - 2.9 1.49 2.9 1.50 99% 63% - - Gold Standard Ventures Corp TSXV:GSV US $404 US $39 US $365 2.1 0.56 2.2 0.60 93% - - - - - 2.1 0.56 2.2 0.60 93% 70% US $175 US $162Golden Reign Resources Ltd. TSXV:GRR US $36 US $4 US $32 0.9 7.81 1.0 7.98 98% - - - - - 0.9 7.81 1.0 7.98 98% 84% US $34 US $33Granada Gold Mine Inc. TSXV:GGM US $20 US ($3) US $20 5.0 1.23 5.1 1.24 99% - - - - - 5.0 1.23 5.1 1.24 99% 69% US $4 US $4Harte Gold Corp. TSX:HRT US $204 US $12 US $187 0.5 9.47 0.5 9.47 100% - - - - - 0.5 9.47 0.5 9.47 100% 33% US $394 US $394IDM Mining Ltd. TSXV:IDM US $36 US $14 US $18 0.6 8.41 0.7 8.70 97% - - - - - 0.6 8.41 - - - 10% US $28 US $27Kasbah Resources Limited ASX:KAS US $8 US $1 US $5 0.2 0.55 0.3 0.64 87% - - 0.0 0.09 - 0.2 0.90 0.2 0.97 92% - US $23 US $20Kenadyr Mining (Holdings) Corp. TSXV:KEN US $22 US $8 US $16 - - - - - - - - - - - - - - - - - - Lexam VG Gold Inc. TSX:LEX US $39 US $1 US $38 - - - - - - - - - - - - - - - - - - Lincoln Mining Corporation TSXV:LMG US $1 US ($3) US $5 0.2 2.14 0.2 2.14 100% - - - - - 0.2 2.14 0.2 2.14 100% 54% US $32 US $32Lion One Metals Limited TSXV:LIO US $47 US $24 US $23 0.7 0.09 13.2 1.69 6% - - - - - 0.7 0.09 13.2 1.69 6% 60% US $31 US $2Marathon Gold Corporation TSX:MOZ US $105 US $4 US $101 2.2 2.06 2.2 2.06 100% - - - - - 2.2 2.06 2.2 2.06 100% 35% US $45 US $45Monarques Gold Corporation TSXV:MQR US $33 US $6 US $26 0.5 7.73 0.5 7.73 100% 0.1 6.77 0.1 6.77 100% 0.3 8.13 0.3 8.13 100% 50% US $56 US $56New Pacific Holdings Corp. TSXV:NUX US $55 US $16 US $40 0.5 6.12 0.6 7.29 84% - - - - - 0.5 6.12 0.6 7.29 84% 45% US $79 US $66Nighthawk Gold Corp. TSX:NHK US $101 US $28 US $72 2.4 1.74 2.4 1.74 100% - - - - - 2.4 1.74 2.4 1.74 100% 88% US $30 US $30Orex Minerals Inc. TSXV:REX US $11 US $4 US $9 0.1 0.32 0.3 1.50 21% - - - - - 0.1 0.32 0.3 1.50 21% 47% US $134 US $29Osisko Mining Inc. TSX:OSK US $543 US $120 US $423 7.4 2.21 7.4 2.21 100% - - - - - 7.4 2.21 7.4 2.21 100% 42% US $57 US $57Liberty Gold Corp. TSX:LGD US $42 US $10 US $41 2.0 0.36 4.3 0.77 47% - - - - - 2.0 0.36 4.3 0.77 47% 35% US $20 US $9Puma Exploration Inc. TSXV:PUM US $10 US $0 US $9 0.1 0.46 1.8 6.30 7% - - - - - 0.1 0.46 1.7 6.16 7% 5% US $73 US $5Pure Gold Mining Inc. TSXV:PGM US $73 US $10 US $60 1.2 9.47 1.2 9.47 100% - - - - - 1.2 9.47 1.2 9.47 100% 24% US $49 US $49Red Eagle Exploration Limited TSXV:XR US $32 US $0 US $32 - - - - - - - - - - - - - - - - - - Red Pine Exploration Inc. TSXV:RPX US $17 US $3 US $14 0.7 1.75 0.7 1.75 100% - - - - - 0.7 1.75 0.7 1.75 100% 96% US $20 US $20Regulus Resources Inc. TSXV:REG US $79 US $8 US $71 5.7 0.37 18.5 1.20 31% - - - - - 5.7 0.37 18.5 1.20 31% 89% US $12 US $4Rupert Resources Ltd. TSXV:RUP US $90 US $10 US $83 0.2 1.74 0.2 1.74 100% 0.1 1.70 0.1 1.70 100% 0.1 1.77 0.1 1.77 100% 100% US $519 US $519Rye Patch Gold Corp. TSXV:RPM US $73 US ($4) US $86 4.4 0.42 4.9 0.47 89% - - - - - 4.4 0.42 4.9 0.47 89% 29% US $20 US $18Sarama Resources Ltd TSXV:SWA US $16 US ($1) US $14 0.7 1.67 0.7 1.67 100% - - - - - 0.7 1.67 0.7 1.67 100% 100% US $20 US $20Spanish Mountain Gold Ltd TSXV:SPA US $21 US $2 US $19 8.0 0.33 8.2 0.34 98% - - - - - 8.0 0.33 8.2 0.34 98% 51% US $2 US $2Teras Resources Inc. TSXV:TRA US $14 US $1 US $13 1.1 0.48 1.3 0.55 87% - - - - - 1.1 0.48 - - - 10% US $11 US $10TMAC Resources Inc. TSX:TMR US $963 US $16 US $1,068 5.9 8.72 5.9 8.72 100% 3.5 7.69 - - - 2.4 10.83 - - - 59% US $180 US $180Treasury Metals Inc. TSX:TML US $57 US ($6) US $61 1.6 1.88 1.9 2.25 83% - - - - - 1.6 1.88 - - - 24% US $39 US $32TriMetals Mining Inc. TSX:TMI US $28 US $1 US $28 1.9 0.07 15.1 0.58 13% - - - - - 1.9 0.07 - - - 40% US $15 US $2Vendetta Mining Corp. TSXV:VTT US $25 US ($0) US $25 - - 1.4 5.36 - - - - - - - - - - - - - US $18West Kirkland Mining Inc. TSXV:WKM US $18 US $0 US $18 1.2 0.53 1.3 0.60 88% 0.6 0.58 - - - 0.6 0.49 - - - 17% US $15 US $13Group Average - Total # Companies: 41 US $65 US $52Equivalency assumptions (US$ / 07-07-17): $1,212/oz Au, $15.57/oz Ag, $906/oz Pt, $842/oz Pd, $2.63/lb Cu, $1.27/lb Zn, $1.03/lb Pb, $4.03/lb Ni, $7.30/lb Mo, $27.22/lb Co, $7,975/t Sb, $20.25/lb U3O8, $0.20/lb Sn, $93.00/t HCC, $62.8 Source: SNL Financial retrieved on July 7, 2017
EV/ozAu
EV/ozAuEq
Au(Moz)
Au(g/t)
AuEq(Moz)
AuEq(g/t) % Au
Global
% Au% Au Au(Moz)
Au(g/t)
AuEq(Moz)
Global Reserves & Resources Reserves Resources (M&I and Inferred)Au
(Moz)Au
(g/t)AuEq(Moz)
AuEq(g/t)
AuEq(g/t)
% AuInferred
Company SymbolMarket
Capitalization(millions)
WorkingCapital
(millions)
EnterpriseValue
(millions)
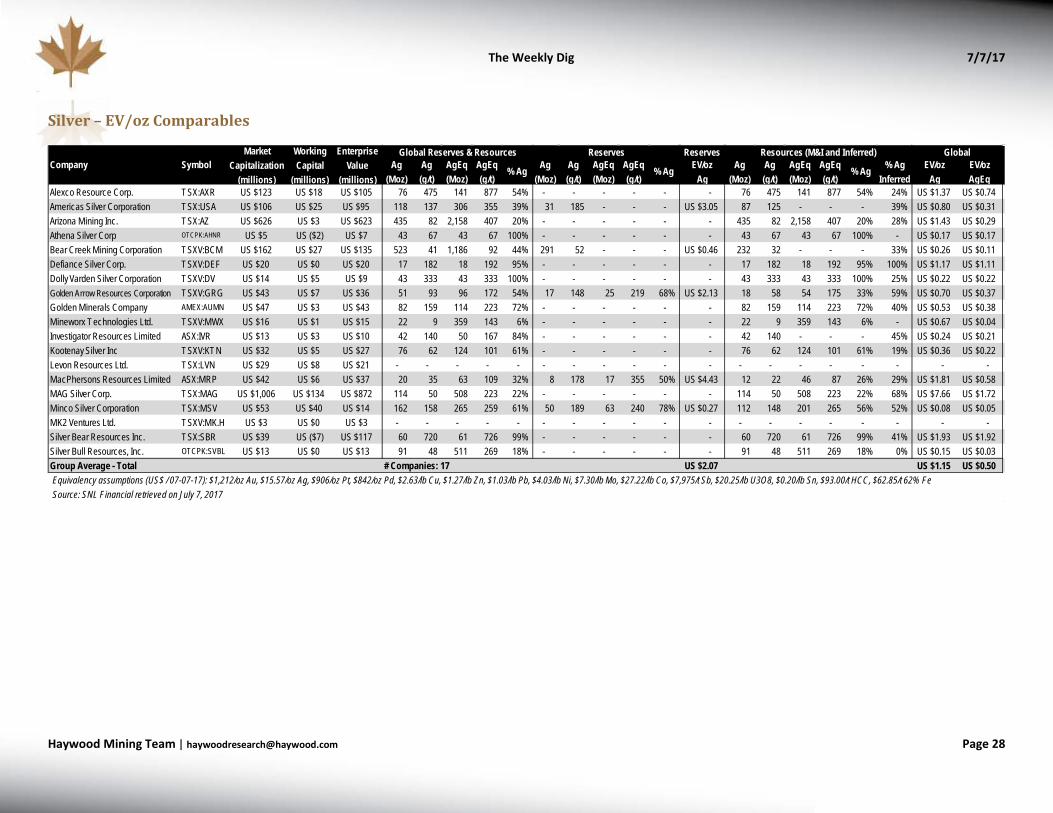
The Weekly Dig 7/7/17
Haywood Mining [email protected] Page 28
Silver – EV/oz Comparables
Reserves
Alexco Resource Corp. TSX:AXR US $123 US $18 US $105 76 475 141 877 54% - - - - - - 76 475 141 877 54% 24% US $1.37 US $0.74Americas Silver Corporation TSX:USA US $106 US $25 US $95 118 137 306 355 39% 31 185 - - - US $3.05 87 125 - - - 39% US $0.80 US $0.31Arizona Mining Inc. TSX:AZ US $626 US $3 US $623 435 82 2,158 407 20% - - - - - - 435 82 2,158 407 20% 28% US $1.43 US $0.29Athena Silver Corp OTCPK:AHNR US $5 US ($2) US $7 43 67 43 67 100% - - - - - - 43 67 43 67 100% - US $0.17 US $0.17Bear Creek Mining Corporation TSXV:BCM US $162 US $27 US $135 523 41 1,186 92 44% 291 52 - - - US $0.46 232 32 - - - 33% US $0.26 US $0.11Defiance Silver Corp. TSXV:DEF US $20 US $0 US $20 17 182 18 192 95% - - - - - - 17 182 18 192 95% 100% US $1.17 US $1.11Dolly Varden Silver Corporation TSXV:DV US $14 US $5 US $9 43 333 43 333 100% - - - - - - 43 333 43 333 100% 25% US $0.22 US $0.22Golden Arrow Resources Corporation TSXV:GRG US $43 US $7 US $36 51 93 96 172 54% 17 148 25 219 68% US $2.13 18 58 54 175 33% 59% US $0.70 US $0.37Golden Minerals Company AMEX:AUMN US $47 US $3 US $43 82 159 114 223 72% - - - - - - 82 159 114 223 72% 40% US $0.53 US $0.38Mineworx Technologies Ltd. TSXV:MWX US $16 US $1 US $15 22 9 359 143 6% - - - - - - 22 9 359 143 6% - US $0.67 US $0.04Investigator Resources Limited ASX:IVR US $13 US $3 US $10 42 140 50 167 84% - - - - - - 42 140 - - - 45% US $0.24 US $0.21Kootenay Silver Inc TSXV:KTN US $32 US $5 US $27 76 62 124 101 61% - - - - - - 76 62 124 101 61% 19% US $0.36 US $0.22Levon Resources Ltd. TSX:LVN US $29 US $8 US $21 - - - - - - - - - - - - - - - - - - - MacPhersons Resources Limited ASX:MRP US $42 US $6 US $37 20 35 63 109 32% 8 178 17 355 50% US $4.43 12 22 46 87 26% 29% US $1.81 US $0.58MAG Silver Corp. TSX:MAG US $1,006 US $134 US $872 114 50 508 223 22% - - - - - - 114 50 508 223 22% 68% US $7.66 US $1.72Minco Silver Corporation TSX:MSV US $53 US $40 US $14 162 158 265 259 61% 50 189 63 240 78% US $0.27 112 148 201 265 56% 52% US $0.08 US $0.05MK2 Ventures Ltd. TSXV:MK.H US $3 US $0 US $3 - - - - - - - - - - - - - - - - - - - Silver Bear Resources Inc. TSX:SBR US $39 US ($7) US $117 60 720 61 726 99% - - - - - - 60 720 61 726 99% 41% US $1.93 US $1.92Silver Bull Resources, Inc. OTCPK:SVBL US $13 US $0 US $13 91 48 511 269 18% - - - - - - 91 48 511 269 18% 0% US $0.15 US $0.03Group Average - Total # Companies: 17 US $2.07 US $1.15 US $0.50Equivalency assumptions (US$ / 07-07-17): $1,212/oz Au, $15.57/oz Ag, $906/oz Pt, $842/oz Pd, $2.63/lb Cu, $1.27/lb Zn, $1.03/lb Pb, $4.03/lb Ni, $7.30/lb Mo, $27.22/lb Co, $7,975/t Sb, $20.25/lb U3O8, $0.20/lb Sn, $93.00/t HCC, $62.85/t 62% FeSource: SNL Financial retrieved on July 7, 2017
EV/ozAg
EV/ozAgEq
Ag(Moz)
Ag(g/t)
AgEq(Moz)
AgEq(g/t)
% Ag
Global
% Ag% Ag Ag(Moz)
Ag(g/t)
AgEq(Moz)
Global Reserves & Resources Reserves Resources (M&I and Inferred)Ag
(Moz)Ag(g/t)
AgEq(Moz)
AgEq(g/t)
AgEq(g/t)
% AgInferred
EV/ozAg
Company SymbolMarket
Capitalization(millions)
WorkingCapital
(millions)
EnterpriseValue
(millions)
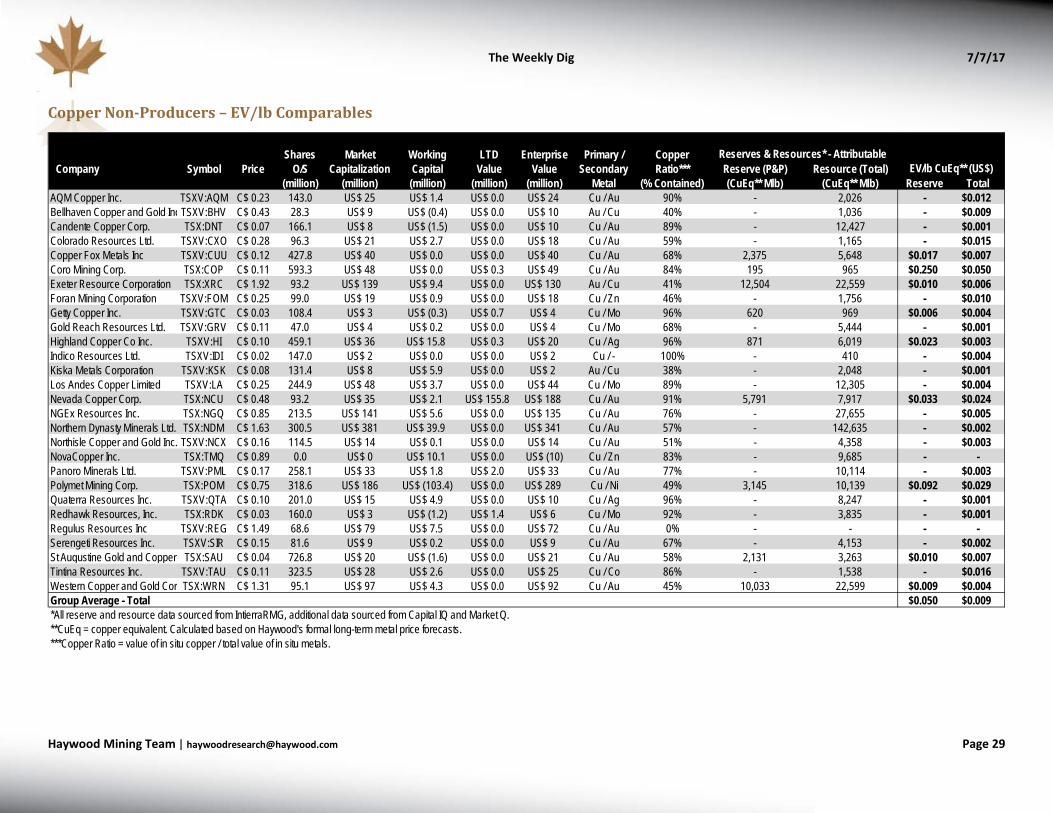
The Weekly Dig 7/7/17
Haywood Mining [email protected] Page 29
Copper Non-Producers – EV/lb Comparables
Shares Market Working LTD Enterprise CopperCompany Symbol Price O/S Capitalization Capital Value Value Ratio*** Reserve (P&P) Resource (Total)
(million) (million) (million) (million) (million) (% Contained) (CuEq** Mlb) (CuEq** Mlb) Reserve TotalAQM Copper Inc. TSXV:AQM C$ 0.23 143.0 US$ 25 US$ 1.4 US$ 0.0 US$ 24 Cu / Au 90% - 2,026 - $0.012Bellhaven Copper and Gold IncTSXV:BHV C$ 0.43 28.3 US$ 9 US$ (0.4) US$ 0.0 US$ 10 Au / Cu 40% - 1,036 - $0.009Candente Copper Corp. TSX:DNT C$ 0.07 166.1 US$ 8 US$ (1.5) US$ 0.0 US$ 10 Cu / Au 89% - 12,427 - $0.001Colorado Resources Ltd. TSXV:CXO C$ 0.28 96.3 US$ 21 US$ 2.7 US$ 0.0 US$ 18 Cu / Au 59% - 1,165 - $0.015Copper Fox Metals Inc TSXV:CUU C$ 0.12 427.8 US$ 40 US$ 0.0 US$ 0.0 US$ 40 Cu / Au 68% 2,375 5,648 $0.017 $0.007Coro Mining Corp. TSX:COP C$ 0.11 593.3 US$ 48 US$ 0.0 US$ 0.3 US$ 49 Cu / Au 84% 195 965 $0.250 $0.050Exeter Resource Corporation TSX:XRC C$ 1.92 93.2 US$ 139 US$ 9.4 US$ 0.0 US$ 130 Au / Cu 41% 12,504 22,559 $0.010 $0.006Foran Mining Corporation TSXV:FOM C$ 0.25 99.0 US$ 19 US$ 0.9 US$ 0.0 US$ 18 Cu / Zn 46% - 1,756 - $0.010Getty Copper Inc. TSXV:GTC C$ 0.03 108.4 US$ 3 US$ (0.3) US$ 0.7 US$ 4 Cu / Mo 96% 620 969 $0.006 $0.004Gold Reach Resources Ltd. TSXV:GRV C$ 0.11 47.0 US$ 4 US$ 0.2 US$ 0.0 US$ 4 Cu / Mo 68% - 5,444 - $0.001Highland Copper Co Inc. TSXV:HI C$ 0.10 459.1 US$ 36 US$ 15.8 US$ 0.3 US$ 20 Cu / Ag 96% 871 6,019 $0.023 $0.003Indico Resources Ltd. TSXV:IDI C$ 0.02 147.0 US$ 2 US$ 0.0 US$ 0.0 US$ 2 Cu / - 100% - 410 - $0.004Kiska Metals Corporation TSXV:KSK C$ 0.08 131.4 US$ 8 US$ 5.9 US$ 0.0 US$ 2 Au / Cu 38% - 2,048 - $0.001Los Andes Copper Limited TSXV:LA C$ 0.25 244.9 US$ 48 US$ 3.7 US$ 0.0 US$ 44 Cu / Mo 89% - 12,305 - $0.004Nevada Copper Corp. TSX:NCU C$ 0.48 93.2 US$ 35 US$ 2.1 US$ 155.8 US$ 188 Cu / Au 91% 5,791 7,917 $0.033 $0.024NGEx Resources Inc. TSX:NGQ C$ 0.85 213.5 US$ 141 US$ 5.6 US$ 0.0 US$ 135 Cu / Au 76% - 27,655 - $0.005Northern Dynasty Minerals Ltd. TSX:NDM C$ 1.63 300.5 US$ 381 US$ 39.9 US$ 0.0 US$ 341 Cu / Au 57% - 142,635 - $0.002Northisle Copper and Gold Inc. TSXV:NCX C$ 0.16 114.5 US$ 14 US$ 0.1 US$ 0.0 US$ 14 Cu / Au 51% - 4,358 - $0.003NovaCopper Inc. TSX:TMQ C$ 0.89 0.0 US$ 0 US$ 10.1 US$ 0.0 US$ (10) Cu / Zn 83% - 9,685 - -Panoro Minerals Ltd. TSXV:PML C$ 0.17 258.1 US$ 33 US$ 1.8 US$ 2.0 US$ 33 Cu / Au 77% - 10,114 - $0.003Polymet Mining Corp. TSX:POM C$ 0.75 318.6 US$ 186 US$ (103.4) US$ 0.0 US$ 289 Cu / Ni 49% 3,145 10,139 $0.092 $0.029Quaterra Resources Inc. TSXV:QTA C$ 0.10 201.0 US$ 15 US$ 4.9 US$ 0.0 US$ 10 Cu / Ag 96% - 8,247 - $0.001Redhawk Resources, Inc. TSX:RDK C$ 0.03 160.0 US$ 3 US$ (1.2) US$ 1.4 US$ 6 Cu / Mo 92% - 3,835 - $0.001Regulus Resources Inc TSXV:REG C$ 1.49 68.6 US$ 79 US$ 7.5 US$ 0.0 US$ 72 Cu / Au 0% - - - -Serengeti Resources Inc. TSXV:SIR C$ 0.15 81.6 US$ 9 US$ 0.2 US$ 0.0 US$ 9 Cu / Au 67% - 4,153 - $0.002St Augustine Gold and Copper TSX:SAU C$ 0.04 726.8 US$ 20 US$ (1.6) US$ 0.0 US$ 21 Cu / Au 58% 2,131 3,263 $0.010 $0.007Tintina Resources Inc. TSXV:TAU C$ 0.11 323.5 US$ 28 US$ 2.6 US$ 0.0 US$ 25 Cu / Co 86% - 1,538 - $0.016Western Copper and Gold Cor TSX:WRN C$ 1.31 95.1 US$ 97 US$ 4.3 US$ 0.0 US$ 92 Cu / Au 45% 10,033 22,599 $0.009 $0.004Group Average - Total $0.050 $0.009*All reserve and resource data sourced from IntierraRMG, additional data sourced from Capital IQ and Market Q.**CuEq = copper equivalent. Calculated based on Haywood's formal long-term metal price forecasts.***Copper Ratio = value of in situ copper / total value of in situ metals.
Primary / Secondary
Metal
Reserves & Resources* - AttributableEV/lb CuEq** (US$)
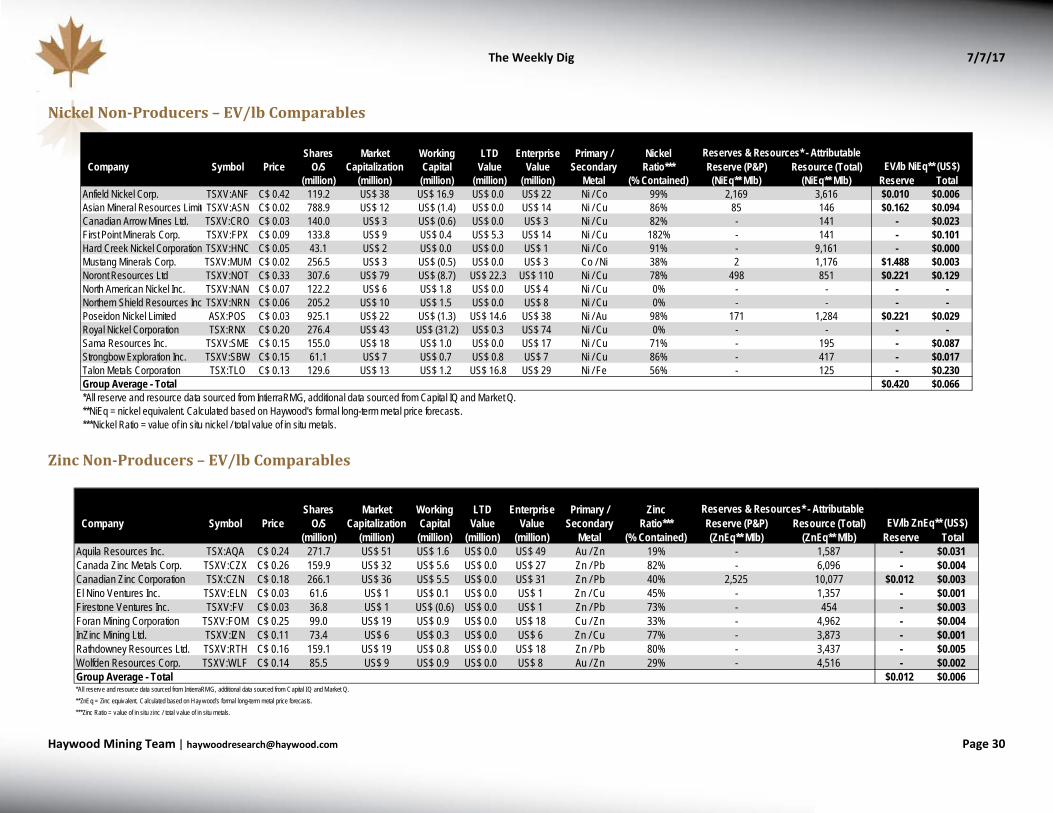
The Weekly Dig 7/7/17
Haywood Mining [email protected] Page 30
Nickel Non-Producers – EV/lb Comparables
Zinc Non-Producers – EV/lb Comparables
Shares Market Working LTD Enterprise NickelCompany Symbol Price O/S Capitalization Capital Value Value Ratio*** Reserve (P&P) Resource (Total)
(million) (million) (million) (million) (million) (% Contained) (NiEq** Mlb) (NiEq** Mlb) Reserve TotalAnfield Nickel Corp. TSXV:ANF C$ 0.42 119.2 US$ 38 US$ 16.9 US$ 0.0 US$ 22 Ni / Co 99% 2,169 3,616 $0.010 $0.006Asian Mineral Resources LimiteTSXV:ASN C$ 0.02 788.9 US$ 12 US$ (1.4) US$ 0.0 US$ 14 Ni / Cu 86% 85 146 $0.162 $0.094Canadian Arrow Mines Ltd. TSXV:CRO C$ 0.03 140.0 US$ 3 US$ (0.6) US$ 0.0 US$ 3 Ni / Cu 82% - 141 - $0.023First Point Minerals Corp. TSXV:FPX C$ 0.09 133.8 US$ 9 US$ 0.4 US$ 5.3 US$ 14 Ni / Cu 182% - 141 - $0.101Hard Creek Nickel Corporation TSXV:HNC C$ 0.05 43.1 US$ 2 US$ 0.0 US$ 0.0 US$ 1 Ni / Co 91% - 9,161 - $0.000Mustang Minerals Corp. TSXV:MUM C$ 0.02 256.5 US$ 3 US$ (0.5) US$ 0.0 US$ 3 Co / Ni 38% 2 1,176 $1.488 $0.003Noront Resources Ltd TSXV:NOT C$ 0.33 307.6 US$ 79 US$ (8.7) US$ 22.3 US$ 110 Ni / Cu 78% 498 851 $0.221 $0.129North American Nickel Inc. TSXV:NAN C$ 0.07 122.2 US$ 6 US$ 1.8 US$ 0.0 US$ 4 Ni / Cu 0% - - - -Northern Shield Resources Inc TSXV:NRN C$ 0.06 205.2 US$ 10 US$ 1.5 US$ 0.0 US$ 8 Ni / Cu 0% - - - -Poseidon Nickel Limited ASX:POS C$ 0.03 925.1 US$ 22 US$ (1.3) US$ 14.6 US$ 38 Ni / Au 98% 171 1,284 $0.221 $0.029Royal Nickel Corporation TSX:RNX C$ 0.20 276.4 US$ 43 US$ (31.2) US$ 0.3 US$ 74 Ni / Cu 0% - - - -Sama Resources Inc. TSXV:SME C$ 0.15 155.0 US$ 18 US$ 1.0 US$ 0.0 US$ 17 Ni / Cu 71% - 195 - $0.087Strongbow Exploration Inc. TSXV:SBW C$ 0.15 61.1 US$ 7 US$ 0.7 US$ 0.8 US$ 7 Ni / Cu 86% - 417 - $0.017Talon Metals Corporation TSX:TLO C$ 0.13 129.6 US$ 13 US$ 1.2 US$ 16.8 US$ 29 Ni / Fe 56% - 125 - $0.230Group Average - Total $0.420 $0.066*All reserve and resource data sourced from IntierraRMG, additional data sourced from Capital IQ and Market Q.**NiEq = nickel equivalent. Calculated based on Haywood's formal long-term metal price forecasts.***Nickel Ratio = value of in situ nickel / total value of in situ metals.
Primary / Secondary
Metal
Reserves & Resources* - AttributableEV/lb NiEq** (US$)
Shares Market Working LTD Enterprise ZincCompany Symbol Price O/S Capitalization Capital Value Value Ratio*** Reserve (P&P) Resource (Total)
(million) (million) (million) (million) (million) (% Contained) (ZnEq** Mlb) (ZnEq** Mlb) Reserve TotalAquila Resources Inc. TSX:AQA C$ 0.24 271.7 US$ 51 US$ 1.6 US$ 0.0 US$ 49 Au / Zn 19% - 1,587 - $0.031Canada Zinc Metals Corp. TSXV:CZX C$ 0.26 159.9 US$ 32 US$ 5.6 US$ 0.0 US$ 27 Zn / Pb 82% - 6,096 - $0.004Canadian Zinc Corporation TSX:CZN C$ 0.18 266.1 US$ 36 US$ 5.5 US$ 0.0 US$ 31 Zn / Pb 40% 2,525 10,077 $0.012 $0.003El Nino Ventures Inc. TSXV:ELN C$ 0.03 61.6 US$ 1 US$ 0.1 US$ 0.0 US$ 1 Zn / Cu 45% - 1,357 - $0.001Firestone Ventures Inc. TSXV:FV C$ 0.03 36.8 US$ 1 US$ (0.6) US$ 0.0 US$ 1 Zn / Pb 73% - 454 - $0.003Foran Mining Corporation TSXV:FOM C$ 0.25 99.0 US$ 19 US$ 0.9 US$ 0.0 US$ 18 Cu / Zn 33% - 4,962 - $0.004InZinc Mining Ltd. TSXV:IZN C$ 0.11 73.4 US$ 6 US$ 0.3 US$ 0.0 US$ 6 Zn / Cu 77% - 3,873 - $0.001Rathdowney Resources Ltd. TSXV:RTH C$ 0.16 159.1 US$ 19 US$ 0.8 US$ 0.0 US$ 18 Zn / Pb 80% - 3,437 - $0.005Wolfden Resources Corp. TSXV:WLF C$ 0.14 85.5 US$ 9 US$ 0.9 US$ 0.0 US$ 8 Au / Zn 29% - 4,516 - $0.002Group Average - Total $0.012 $0.006*All reserve and resource data sourced from IntierraRMG, additional data sourced from Capital IQ and Market Q.**ZnEq = Zinc equivalent. Calculated based on Haywood's formal long-term metal price forecasts.***Zinc Ratio = value of in situ zinc / total value of in situ metals.
Primary / Secondary
Metal
Reserves & Resources* - AttributableEV/lb ZnEq** (US$)

The Weekly Dig 7/7/17
Haywood Mining [email protected] Page 31
Dissemination of Research Research reports are disseminated either through electronic medium or in printed copy. Clients may access reports on our website, or receive publications directly via email. Haywood strives to ensure all clients receive research in a timely manner and at the same time. It is against our policy for analysts to discuss or circulate their recommendations internally prior to public distribution. This policy applies equally to recommendation changes, target changes and/or forecast revisions. For Canadian residents: Haywood Securities Inc. is a Canadian registered broker-dealer and a member of the Investment Industry Regulatory Organization of Canada, the Toronto Stock Exchange, the Toronto Venture Exchange and the Canadian Investor Protection Fund and accepts responsibility for the dissemination of this report. Any Canadian client that wishes further information on any securities discussed in this report should contact a qualified salesperson of Haywood Securities Inc. For U.S. residents: This investment research is distributed in the United States, as third party research by Haywood Securities (USA) Inc. Haywood Securities (USA) Inc. is a wholly owned subsidiary of Haywood Securities Inc., registered with the U.S. Securities and Exchange Commission, and is a member of FINRA and the Securities Investor Protection Corporation (SIPC). Haywood Securities (USA) Inc. as a U.S. registered broker-dealer accepts responsibility for this Research Report and its dissemination in the United States. Any U.S. client that wishes further information on any securities discussed in this report or wish to effect a transaction in these securities should contact a qualified salesperson of Haywood Securities (USA) Inc. Haywood Securities Inc. Research Analysts are considered Foreign Research Analysts to the USA and are not registered/qualified as Research Analysts with FINRA. As these analysts are considered Foreign Research Analysts they may not be specifically subject to FINRA (formerly NASD) Rule 2711 and FINRA (formerly NYSE) Rule 472 restrictions on communications with a Subject Company, Public Appearances and trading securities held by a Research Analyst Account. This report may be distributed in the following states: nil. Otherwise, this report may only be distributed into those states with an institutional buyer state securities registration exemption.
Analyst Certification We, Mick Carew, Geordie Mark, Colin Healey, Pierre Vaillancourt, and Kerry Smith, hereby certify that the views expressed in this report (which includes the rating assigned to the issuer’s shares as well as the analytical substance and tone of the report) accurately reflect my/our personal views about the subject securities and the issuer. No part of my/our compensation was, is, or will be directly or indirectly related to the specific recommendations.
Important Disclosures Of the companies included in the report the following Important Disclosures apply:
Ticker Company 1 2 3 4 5 6 7 8
TSX:AGI Alamos Gold Inc. X X X TSX:AKG Asanko Gold Inc. X X TSXV:AGB Atlantic Gold Corp. X X X X TSX:AVK Avnel Gold Mining Limited X X TSX:BTO B2Gold Corp. X X TSXV:BGM Barkerville Gold Mines Ltd. X X TSX:ABX Barrick Gold Corporation X TSX:CS Capstone Mining Corp. X TSX:CMMC Copper Mountain Mining Corp. X X TSXV:CXB Calibre Mining Corp. X X TSX:DML Denison Mines Corp. X X X TSX:DGC Detour Gold Corporation X X TSX:ELD Eldorado Gold Corporation X X TSX:EDV Endeavour Mining Corp. X X TSX:EFR Energy Fuels Inc. X X X
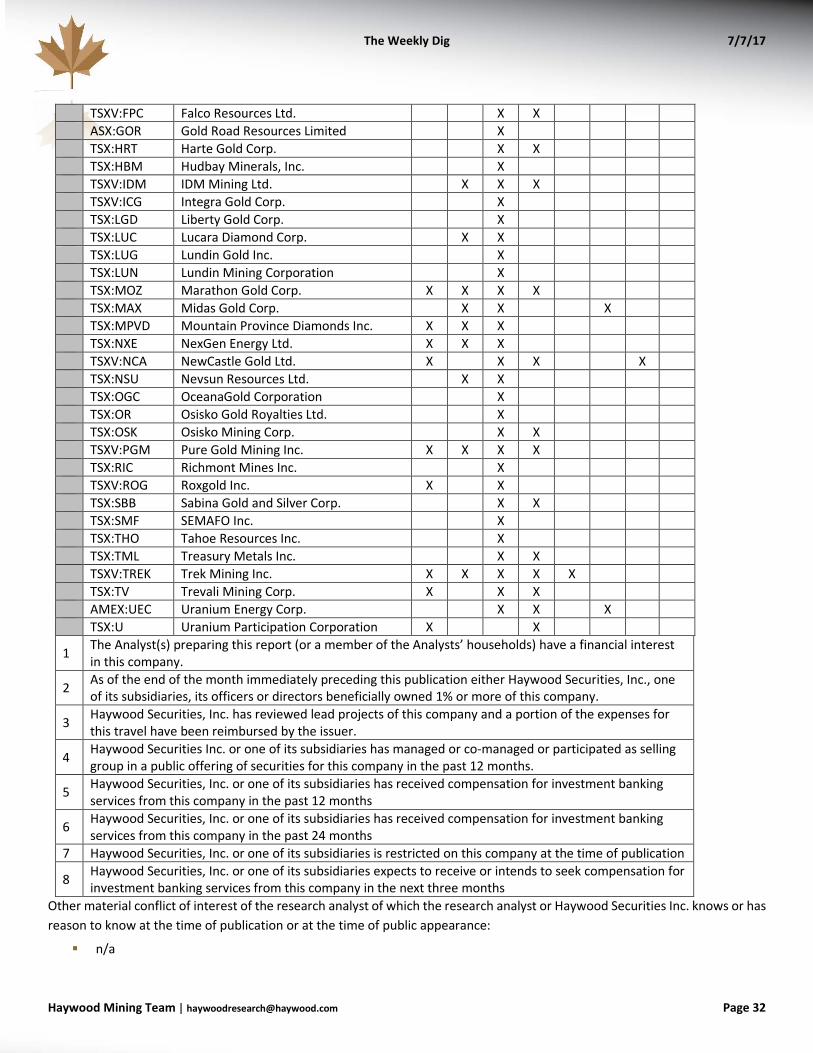
The Weekly Dig 7/7/17
Haywood Mining [email protected] Page 32
TSXV:FPC Falco Resources Ltd. X X ASX:GOR Gold Road Resources Limited X TSX:HRT Harte Gold Corp. X X TSX:HBM Hudbay Minerals, Inc. X TSXV:IDM IDM Mining Ltd. X X X TSXV:ICG Integra Gold Corp. X TSX:LGD Liberty Gold Corp. X TSX:LUC Lucara Diamond Corp. X X TSX:LUG Lundin Gold Inc. X TSX:LUN Lundin Mining Corporation X TSX:MOZ Marathon Gold Corp. X X X X TSX:MAX Midas Gold Corp. X X X TSX:MPVD Mountain Province Diamonds Inc. X X X TSX:NXE NexGen Energy Ltd. X X X TSXV:NCA NewCastle Gold Ltd. X X X X TSX:NSU Nevsun Resources Ltd. X X TSX:OGC OceanaGold Corporation X TSX:OR Osisko Gold Royalties Ltd. X TSX:OSK Osisko Mining Corp. X X TSXV:PGM Pure Gold Mining Inc. X X X X TSX:RIC Richmont Mines Inc. X TSXV:ROG Roxgold Inc. X X TSX:SBB Sabina Gold and Silver Corp. X X TSX:SMF SEMAFO Inc. X TSX:THO Tahoe Resources Inc. X TSX:TML Treasury Metals Inc. X X TSXV:TREK Trek Mining Inc. X X X X X TSX:TV Trevali Mining Corp. X X X AMEX:UEC Uranium Energy Corp. X X X TSX:U Uranium Participation Corporation X X
1 The Analyst(s) preparing this report (or a member of the Analysts’ households) have a financial interest in this company.
2 As of the end of the month immediately preceding this publication either Haywood Securities, Inc., one of its subsidiaries, its officers or directors beneficially owned 1% or more of this company.
3 Haywood Securities, Inc. has reviewed lead projects of this company and a portion of the expenses for this travel have been reimbursed by the issuer.
4 Haywood Securities Inc. or one of its subsidiaries has managed or co-managed or participated as selling group in a public offering of securities for this company in the past 12 months.
5 Haywood Securities, Inc. or one of its subsidiaries has received compensation for investment banking services from this company in the past 12 months
6 Haywood Securities, Inc. or one of its subsidiaries has received compensation for investment banking services from this company in the past 24 months
7 Haywood Securities, Inc. or one of its subsidiaries is restricted on this company at the time of publication
8 Haywood Securities, Inc. or one of its subsidiaries expects to receive or intends to seek compensation for investment banking services from this company in the next three months
Other material conflict of interest of the research analyst of which the research analyst or Haywood Securities Inc. knows or has reason to know at the time of publication or at the time of public appearance:
n/a
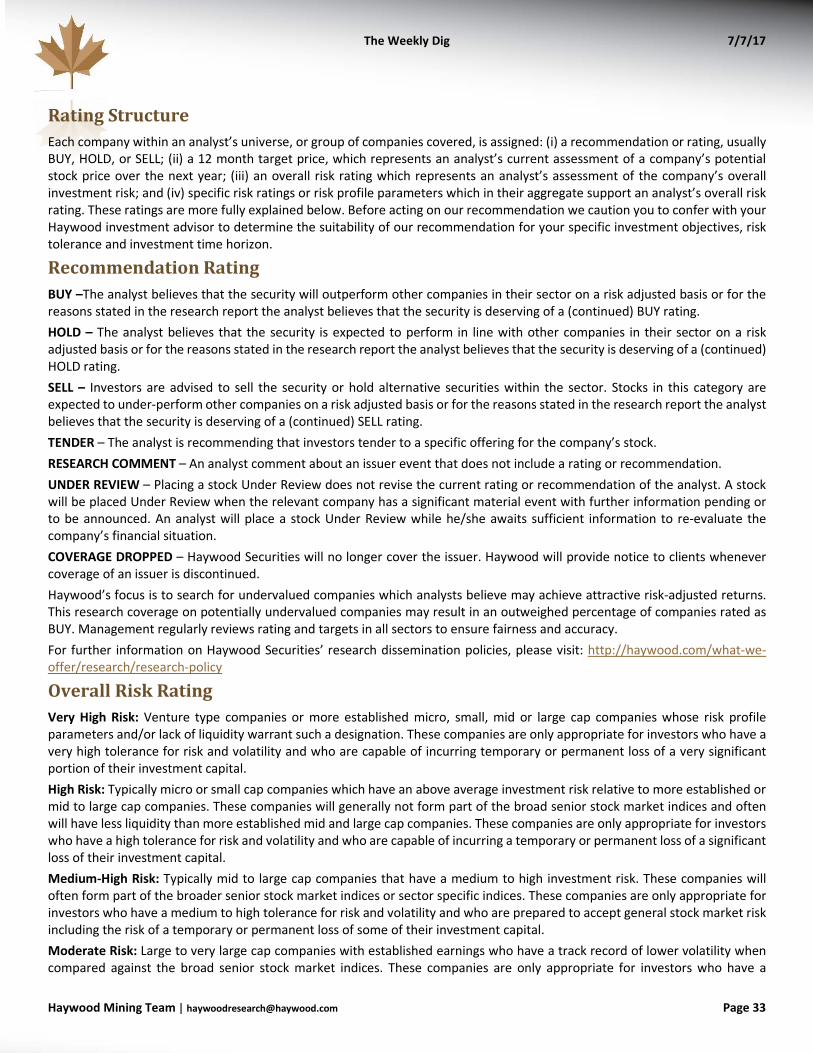
The Weekly Dig 7/7/17
Haywood Mining [email protected] Page 33
Rating Structure Each company within an analyst’s universe, or group of companies covered, is assigned: (i) a recommendation or rating, usually BUY, HOLD, or SELL; (ii) a 12 month target price, which represents an analyst’s current assessment of a company’s potential stock price over the next year; (iii) an overall risk rating which represents an analyst’s assessment of the company’s overall investment risk; and (iv) specific risk ratings or risk profile parameters which in their aggregate support an analyst’s overall risk rating. These ratings are more fully explained below. Before acting on our recommendation we caution you to confer with your Haywood investment advisor to determine the suitability of our recommendation for your specific investment objectives, risk tolerance and investment time horizon.
Recommendation Rating BUY –The analyst believes that the security will outperform other companies in their sector on a risk adjusted basis or for the reasons stated in the research report the analyst believes that the security is deserving of a (continued) BUY rating. HOLD – The analyst believes that the security is expected to perform in line with other companies in their sector on a risk adjusted basis or for the reasons stated in the research report the analyst believes that the security is deserving of a (continued) HOLD rating. SELL – Investors are advised to sell the security or hold alternative securities within the sector. Stocks in this category are expected to under-perform other companies on a risk adjusted basis or for the reasons stated in the research report the analyst believes that the security is deserving of a (continued) SELL rating. TENDER – The analyst is recommending that investors tender to a specific offering for the company’s stock. RESEARCH COMMENT – An analyst comment about an issuer event that does not include a rating or recommendation. UNDER REVIEW – Placing a stock Under Review does not revise the current rating or recommendation of the analyst. A stock will be placed Under Review when the relevant company has a significant material event with further information pending or to be announced. An analyst will place a stock Under Review while he/she awaits sufficient information to re-evaluate the company’s financial situation. COVERAGE DROPPED – Haywood Securities will no longer cover the issuer. Haywood will provide notice to clients whenever coverage of an issuer is discontinued. Haywood’s focus is to search for undervalued companies which analysts believe may achieve attractive risk-adjusted returns. This research coverage on potentially undervalued companies may result in an outweighed percentage of companies rated as BUY. Management regularly reviews rating and targets in all sectors to ensure fairness and accuracy. For further information on Haywood Securities’ research dissemination policies, please visit: http://haywood.com/what-we-offer/research/research-policy
Overall Risk Rating Very High Risk: Venture type companies or more established micro, small, mid or large cap companies whose risk profile parameters and/or lack of liquidity warrant such a designation. These companies are only appropriate for investors who have a very high tolerance for risk and volatility and who are capable of incurring temporary or permanent loss of a very significant portion of their investment capital. High Risk: Typically micro or small cap companies which have an above average investment risk relative to more established or mid to large cap companies. These companies will generally not form part of the broad senior stock market indices and often will have less liquidity than more established mid and large cap companies. These companies are only appropriate for investors who have a high tolerance for risk and volatility and who are capable of incurring a temporary or permanent loss of a significant loss of their investment capital. Medium-High Risk: Typically mid to large cap companies that have a medium to high investment risk. These companies will often form part of the broader senior stock market indices or sector specific indices. These companies are only appropriate for investors who have a medium to high tolerance for risk and volatility and who are prepared to accept general stock market risk including the risk of a temporary or permanent loss of some of their investment capital. Moderate Risk: Large to very large cap companies with established earnings who have a track record of lower volatility when compared against the broad senior stock market indices. These companies are only appropriate for investors who have a
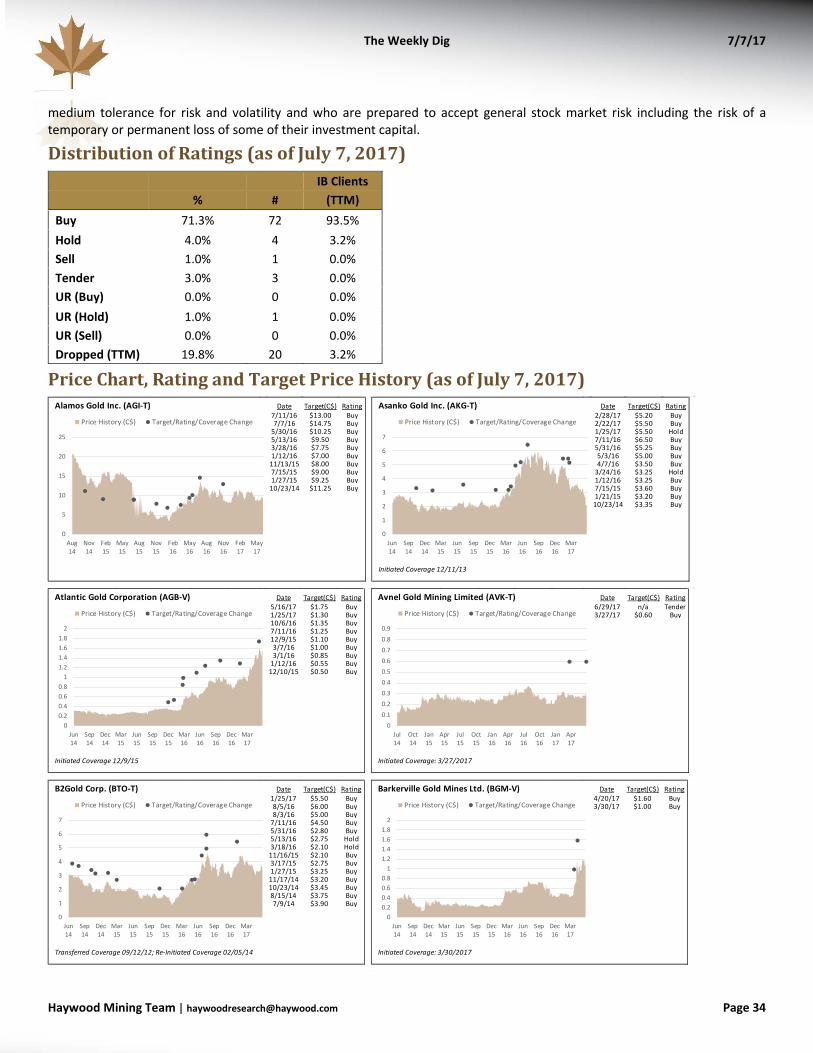
The Weekly Dig 7/7/17
Haywood Mining [email protected] Page 34
medium tolerance for risk and volatility and who are prepared to accept general stock market risk including the risk of a temporary or permanent loss of some of their investment capital.
Distribution of Ratings (as of July 7, 2017) IB Clients
% # (TTM) Buy 71.3% 72 93.5% Hold 4.0% 4 3.2% Sell 1.0% 1 0.0% Tender 3.0% 3 0.0% UR (Buy) 0.0% 0 0.0% UR (Hold) 1.0% 1 0.0% UR (Sell) 0.0% 0 0.0% Dropped (TTM) 19.8% 20 3.2%
Price Chart, Rating and Target Price History (as of July 7, 2017)
Alamos Gold Inc. (AGI-T) Date Target(C$) Rating7/11/16 $13.00 Buy7/7/16 $14.75 Buy
5/30/16 $10.25 Buy5/13/16 $9.50 Buy3/28/16 $7.75 Buy1/12/16 $7.00 Buy
11/13/15 $8.00 Buy7/15/15 $9.00 Buy1/27/15 $9.25 Buy
10/23/14 $11.25 Buy
0
5
10
15
20
25
Aug14
Nov14
Feb15
May15
Aug15
Nov15
Feb16
May16
Aug16
Nov16
Feb17
May17
Price History (C$) Target/Rating/Coverage Change
Asanko Gold Inc. (AKG-T) Date Target(C$) Rating2/28/17 $5.20 Buy2/22/17 $5.50 Buy1/25/17 $5.50 Hold7/11/16 $6.50 Buy5/31/16 $5.25 Buy5/3/16 $5.00 Buy4/7/16 $3.50 Buy
3/24/16 $3.25 Hold1/12/16 $3.25 Buy7/15/15 $3.60 Buy1/21/15 $3.20 Buy
10/23/14 $3.35 Buy
Initiated Coverage 12/11/13
0
1
2
3
4
5
6
7
Jun14
Sep14
Dec14
Mar15
Jun15
Sep15
Dec15
Mar16
Jun16
Sep16
Dec16
Mar17
Price History (C$) Target/Rating/Coverage Change
Atlantic Gold Corporation (AGB-V) Date Target(C$) Rating5/16/17 $1.75 Buy1/25/17 $1.30 Buy10/6/16 $1.35 Buy7/11/16 $1.25 Buy12/9/15 $1.10 Buy3/7/16 $1.00 Buy3/1/16 $0.85 Buy
1/12/16 $0.55 Buy12/10/15 $0.50 Buy
Initiated Coverage 12/9/15
00.20.40.60.8
11.21.41.61.8
2
Jun14
Sep14
Dec14
Mar15
Jun15
Sep15
Dec15
Mar16
Jun16
Sep16
Dec16
Mar17
Price History (C$) Target/Rating/Coverage Change
Avnel Gold Mining Limited (AVK-T) Date Target(C$) Rating6/29/17 n/a Tender3/27/17 $0.60 Buy
Initiated Coverage: 3/27/2017
00.10.20.30.40.50.60.70.80.9
Jul14
Oct14
Jan15
Apr15
Jul15
Oct15
Jan16
Apr16
Jul16
Oct16
Jan17
Apr17
Price History (C$) Target/Rating/Coverage Change
B2Gold Corp. (BTO-T) Date Target(C$) Rating1/25/17 $5.50 Buy8/5/16 $6.00 Buy8/3/16 $5.00 Buy
7/11/16 $4.50 Buy5/31/16 $2.80 Buy5/13/16 $2.75 Hold3/18/16 $2.10 Hold
11/16/15 $2.10 Buy3/17/15 $2.75 Buy1/27/15 $3.25 Buy
11/17/14 $3.20 Buy10/23/14 $3.45 Buy8/15/14 $3.75 Buy7/9/14 $3.90 Buy
Transferred Coverage 09/12/12; Re-Initiated Coverage 02/05/14
0
1
2
3
4
5
6
7
Jun14
Sep14
Dec14
Mar15
Jun15
Sep15
Dec15
Mar16
Jun16
Sep16
Dec16
Mar17
Price History (C$) Target/Rating/Coverage Change
Barkerville Gold Mines Ltd. (BGM-V) Date Target(C$) Rating4/20/17 $1.60 Buy3/30/17 $1.00 Buy
Initiated Coverage: 3/30/2017
00.20.40.60.8
11.21.41.61.8
2
Jun14
Sep14
Dec14
Mar15
Jun15
Sep15
Dec15
Mar16
Jun16
Sep16
Dec16
Mar17
Price History (C$) Target/Rating/Coverage Change

The Weekly Dig 7/7/17
Haywood Mining [email protected] Page 35
Barrick Gold Corporation (ABX-T) Date Target(C$) Rating4/26/17 $37.00 Buy2/17/17 $38.50 Buy1/25/17 $33.00 Buy7/11/16 $37.50 Buy5/31/16 $25.25 Buy4/27/16 $25.00 Buy4/18/16 $20.50 Buy2/19/16 $19.50 Buy1/12/16 $14.50 Buy8/7/15 $11.00 Buy
7/15/15 $15.65 Hold4/29/15 $15.75 Hold2/20/15 $15.00 Hold1/27/15 $14.25 Hold
10/23/14 $17.25 Hold7/9/14 $23.50 Hold0
51015202530354045
Jun14
Sep14
Dec14
Mar15
Jun15
Sep15
Dec15
Mar16
Jun16
Sep16
Dec16
Mar17
Price History (C$) Target/Rating/Coverage Change
Capstone Mining Corp (CS-T) Date Target(C$) Rating6/20/17 $1.20 Buy
11/11/16 $1.00 Hold4/28/16 $1.00 Buy4/6/16 $0.80 Buy
2/18/16 $0.60 Buy1/12/16 $0.50 Buy7/9/15 $1.50 Buy
1/27/15 $2.00 Buy
Initiated Coverage 07/10/07; Name change Capstone Mining Corp. 11/25/08; Transferred Coverage 6/20/2017
0
0.5
1
1.5
2
2.5
3
Jun14
Sep14
Dec14
Mar15
Jun15
Sep15
Dec15
Mar16
Jun16
Sep16
Dec16
Mar17
Price History (C$) Target/Rating/Coverage Change
Copper Mountain Mining Corporation (CMMC-T) Date Target(C$) Rating6/20/17 $0.90 Hold11/8/16 $0.75 Buy10/7/16 $0.60 Buy5/3/16 $0.60 Hold
1/12/16 $0.60 Buy11/10/15 UR Buy7/15/15 $1.85 Buy1/27/15 $2.00 Buy1/19/15 $3.50 UR(Buy)8/11/14 $3.50 Buy7/7/14 $3.00 Buy
Initiated Coverage: 8/26/10; Transferred Coverage 6/20/2017
00.5
11.5
22.5
33.5
44.5
Jun14
Sep14
Dec14
Mar15
Jun15
Sep15
Dec15
Mar16
Jun16
Sep16
Dec16
Mar17
Price History (C$) Target/Rating/Coverage Change
Denison Mines Corp. (DML-T) Date Target(C$) Rating5/31/16 $1.80 Buy1/12/16 $1.90 Buy
Transferred & Re-initiated Coverage 08/20/12
00.20.40.60.8
11.21.41.61.8
2
Mar14
Jun14
Sep14
Dec14
Mar15
Jun15
Sep15
Dec15
Mar16
Jun16
Sep16
Dec16
Price History (C$) Target/Rating/Coverage Change
Detour Gold Corporation (DGC-T) Date Target(C$) Rating3/24/17 $27.50 Buy1/25/17 $32.00 Buy11/3/16 $38.00 Buy7/11/16 $49.00 Buy5/31/16 $32.00 Buy4/15/16 $28.00 Buy3/11/16 $24.00 Buy1/27/16 $19.50 Buy1/12/16 $18.75 Buy7/15/15 $18.50 Buy1/27/15 $14.00 Buy
10/23/14 $13.50 Buy7/31/14 $15.50 Buy7/9/14 $16.50 Buy
0
10
20
30
40
50
60
Jun14
Sep14
Dec14
Mar15
Jun15
Sep15
Dec15
Mar16
Jun16
Sep16
Dec16
Mar17
Price History (C$) Target/Rating/Coverage Change
Eldorado Gold Corporation (ELD-T) Date Target(C$) Rating1/25/17 $8.25 Buy7/29/16 $8.75 Buy7/11/16 $9.25 Buy5/31/16 $7.50 Buy5/13/16 $6.75 Buy1/26/16 $4.50 Buy1/12/16 $6.50 Buy7/15/15 $6.75 Buy2/23/15 $7.75 Buy1/27/15 $9.00 Buy
10/23/14 $9.50 Buy7/9/14 $8.50 Hold
0123456789
10
Jun14
Sep14
Dec14
Mar15
Jun15
Sep15
Dec15
Mar16
Jun16
Sep16
Dec16
Mar17
Price History (C$) Target/Rating/Coverage Change
Endeavour Mining Corporation (EDV-T) Date Target(C$) Rating1/25/17 $31.00 Buy
10/20/16 $33.00 Buy7/11/16 $33.00 Buy5/31/16 $22.00 Buy4/21/16 $19.75 Buy3/21/16 $14.50 Buy1/18/16 $12.00 Buy12/3/15 $11.00 Buy1/27/15 $13.00 Buy11/5/14 $11.50 Buy
10/23/14 $10.50 Buy8/21/14 $12.50 Buy
Initiated Coverage 08/21/14; 10:1 Prices/Targets adjusted to reflect Stock Consolidation 12/02/15; Transfer of Coverage 10/20/16
0
5
10
15
20
25
30
35
Jun14
Sep14
Dec14
Mar15
Jun15
Sep15
Dec15
Mar16
Jun16
Sep16
Dec16
Mar17
Price History (C$) Target/Rating/Coverage Change
Falco Resources Ltd. (FPC-V) Date Target(C$) Rating5/11/17 $2.00 Buy
Initiated Coverage: 5/11/2017
0
0.5
1
1.5
2
2.5
Jun14
Sep14
Dec14
Mar15
Jun15
Sep15
Dec15
Mar16
Jun16
Sep16
Dec16
Mar17
Price History (C$) Target/Rating/Coverage Change
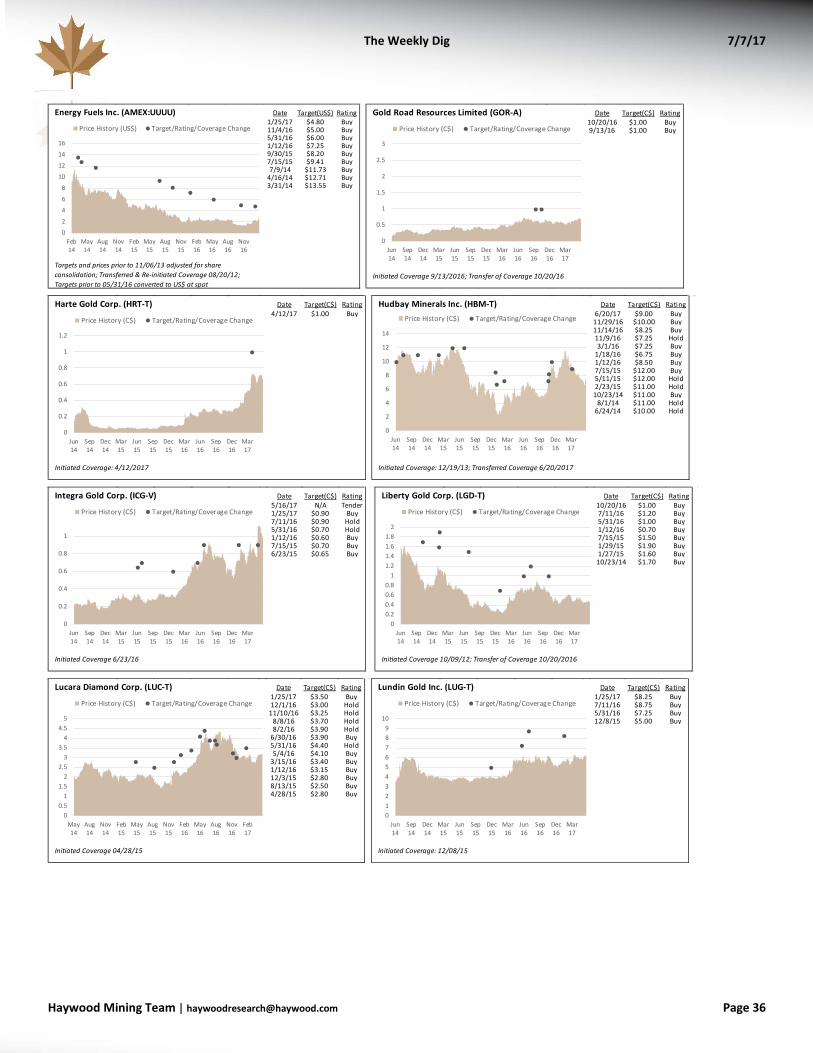
The Weekly Dig 7/7/17
Haywood Mining [email protected] Page 36
Energy Fuels Inc. (AMEX:UUUU) Date Target(US$) Rating1/25/17 $4.80 Buy11/4/16 $5.00 Buy5/31/16 $6.00 Buy1/12/16 $7.25 Buy9/30/15 $8.20 Buy7/15/15 $9.41 Buy7/9/14 $11.73 Buy
4/16/14 $12.71 Buy3/31/14 $13.55 Buy
Targets and prices prior to 11/06/13 adjusted for share consolidation; Transferred & Re-initiated Coverage 08/20/12; Targets prior to 05/31/16 converted to US$ at spot
0
2
4
6
8
10
12
14
16
Feb14
May14
Aug14
Nov14
Feb15
May15
Aug15
Nov15
Feb16
May16
Aug16
Nov16
Price History (US$) Target/Rating/Coverage Change
Gold Road Resources Limited (GOR-A) Date Target(C$) Rating10/20/16 $1.00 Buy9/13/16 $1.00 Buy
Initiated Coverage 9/13/2016; Transfer of Coverage 10/20/16
0
0.5
1
1.5
2
2.5
3
Jun14
Sep14
Dec14
Mar15
Jun15
Sep15
Dec15
Mar16
Jun16
Sep16
Dec16
Mar17
Price History (C$) Target/Rating/Coverage Change
Harte Gold Corp. (HRT-T) Date Target(C$) Rating4/12/17 $1.00 Buy
Initiated Coverage: 4/12/2017
0
0.2
0.4
0.6
0.8
1
1.2
Jun14
Sep14
Dec14
Mar15
Jun15
Sep15
Dec15
Mar16
Jun16
Sep16
Dec16
Mar17
Price History (C$) Target/Rating/Coverage Change
Hudbay Minerals Inc. (HBM-T) Date Target(C$) Rating6/20/17 $9.00 Buy
11/29/16 $10.00 Buy11/14/16 $8.25 Buy11/9/16 $7.25 Hold3/1/16 $7.25 Buy
1/18/16 $6.75 Buy1/12/16 $8.50 Buy7/15/15 $12.00 Buy5/11/15 $12.00 Hold2/23/15 $11.00 Hold
10/23/14 $11.00 Buy8/1/14 $11.00 Hold
6/24/14 $10.00 Hold
Initiated Coverage: 12/19/13; Transferred Coverage 6/20/2017
0
2
4
6
8
10
12
14
Jun14
Sep14
Dec14
Mar15
Jun15
Sep15
Dec15
Mar16
Jun16
Sep16
Dec16
Mar17
Price History (C$) Target/Rating/Coverage Change
Integra Gold Corp. (ICG-V) Date Target(C$) Rating5/16/17 N/A Tender1/25/17 $0.90 Buy7/11/16 $0.90 Hold5/31/16 $0.70 Hold1/12/16 $0.60 Buy7/15/15 $0.70 Buy6/23/15 $0.65 Buy
Initiated Coverage 6/23/16
0
0.2
0.4
0.6
0.8
1
Jun14
Sep14
Dec14
Mar15
Jun15
Sep15
Dec15
Mar16
Jun16
Sep16
Dec16
Mar17
Price History (C$) Target/Rating/Coverage Change
Liberty Gold Corp. (LGD-T) Date Target(C$) Rating10/20/16 $1.00 Buy7/11/16 $1.20 Buy5/31/16 $1.00 Buy1/12/16 $0.70 Buy7/15/15 $1.50 Buy1/29/15 $1.90 Buy1/27/15 $1.60 Buy
10/23/14 $1.70 Buy
Initiated Coverage 10/09/12; Transfer of Coverage 10/20/2016
00.20.40.60.8
11.21.41.61.8
2
Jun14
Sep14
Dec14
Mar15
Jun15
Sep15
Dec15
Mar16
Jun16
Sep16
Dec16
Mar17
Price History (C$) Target/Rating/Coverage Change
Lucara Diamond Corp. (LUC-T) Date Target(C$) Rating1/25/17 $3.50 Buy12/1/16 $3.00 Hold
11/10/16 $3.25 Hold8/8/16 $3.70 Hold8/2/16 $3.90 Hold
6/30/16 $3.90 Buy5/31/16 $4.40 Hold5/4/16 $4.10 Buy
3/15/16 $3.40 Buy1/12/16 $3.15 Buy12/3/15 $2.80 Buy8/13/15 $2.50 Buy4/28/15 $2.80 Buy
Initiated Coverage 04/28/15
00.5
11.5
22.5
33.5
44.5
5
May14
Aug14
Nov14
Feb15
May15
Aug15
Nov15
Feb16
May16
Aug16
Nov16
Feb17
Price History (C$) Target/Rating/Coverage Change
Lundin Gold Inc. (LUG-T) Date Target(C$) Rating1/25/17 $8.25 Buy7/11/16 $8.75 Buy5/31/16 $7.25 Buy12/8/15 $5.00 Buy
Initiated Coverage: 12/08/15
0123456789
10
Jun14
Sep14
Dec14
Mar15
Jun15
Sep15
Dec15
Mar16
Jun16
Sep16
Dec16
Mar17
Price History (C$) Target/Rating/Coverage Change
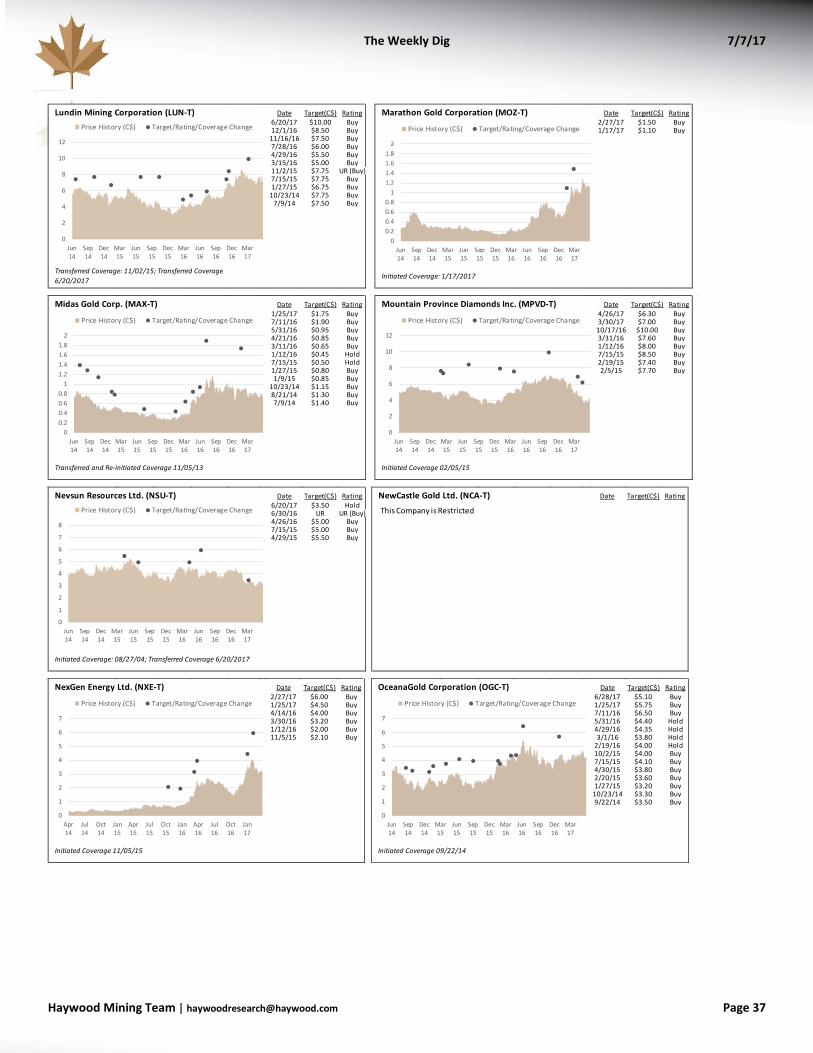
The Weekly Dig 7/7/17
Haywood Mining [email protected] Page 37
Lundin Mining Corporation (LUN-T) Date Target(C$) Rating6/20/17 $10.00 Buy12/1/16 $8.50 Buy
11/16/16 $7.50 Buy7/28/16 $6.00 Buy4/29/16 $5.50 Buy3/15/16 $5.00 Buy11/2/15 $7.75 UR (Buy)7/15/15 $7.75 Buy1/27/15 $6.75 Buy
10/23/14 $7.75 Buy7/9/14 $7.50 Buy
Transferred Coverage: 11/02/15; Transferred Coverage 6/20/2017
0
2
4
6
8
10
12
Jun14
Sep14
Dec14
Mar15
Jun15
Sep15
Dec15
Mar16
Jun16
Sep16
Dec16
Mar17
Price History (C$) Target/Rating/Coverage Change
Marathon Gold Corporation (MOZ-T) Date Target(C$) Rating2/27/17 $1.50 Buy1/17/17 $1.10 Buy
Initiated Coverage: 1/17/2017
00.20.40.60.8
11.21.41.61.8
2
Jun14
Sep14
Dec14
Mar15
Jun15
Sep15
Dec15
Mar16
Jun16
Sep16
Dec16
Mar17
Price History (C$) Target/Rating/Coverage Change
Midas Gold Corp. (MAX-T) Date Target(C$) Rating1/25/17 $1.75 Buy7/11/16 $1.90 Buy5/31/16 $0.95 Buy4/21/16 $0.85 Buy3/11/16 $0.65 Buy1/12/16 $0.45 Hold7/15/15 $0.50 Hold1/27/15 $0.80 Buy1/9/15 $0.85 Buy
10/23/14 $1.15 Buy8/21/14 $1.30 Buy7/9/14 $1.40 Buy
Transferred and Re-initiated Coverage 11/05/13
00.20.40.60.8
11.21.41.61.8
2
Jun14
Sep14
Dec14
Mar15
Jun15
Sep15
Dec15
Mar16
Jun16
Sep16
Dec16
Mar17
Price History (C$) Target/Rating/Coverage Change
Mountain Province Diamonds Inc. (MPVD-T) Date Target(C$) Rating4/26/17 $6.30 Buy3/30/17 $7.00 Buy
10/17/16 $10.00 Buy3/31/16 $7.60 Buy1/12/16 $8.00 Buy7/15/15 $8.50 Buy2/19/15 $7.40 Buy2/5/15 $7.70 Buy
Initiated Coverage 02/05/15
0
2
4
6
8
10
12
Jun14
Sep14
Dec14
Mar15
Jun15
Sep15
Dec15
Mar16
Jun16
Sep16
Dec16
Mar17
Price History (C$) Target/Rating/Coverage Change
Nevsun Resources Ltd. (NSU-T) Date Target(C$) Rating6/20/17 $3.50 Hold6/30/16 UR UR (Buy)4/26/16 $5.00 Buy7/15/15 $5.00 Buy4/29/15 $5.50 Buy
Initiated Coverage: 08/27/04; Transferred Coverage 6/20/2017
0
1
2
3
4
5
6
7
8
Jun14
Sep14
Dec14
Mar15
Jun15
Sep15
Dec15
Mar16
Jun16
Sep16
Dec16
Mar17
Price History (C$) Target/Rating/Coverage Change
NewCastle Gold Ltd. (NCA-T) Date Target(C$) Rating1/10/17 $1.60 Buy
10/31/16 UR UR7/11/16 $1.20 Buy5/31/16 $0.80 Buy1/12/16 $0.45 Buy9/3/15 $0.30 Buy
7/15/15 $0.60 Buy1/27/15 $0.70 Buy
12/12/14 $0.65 Buy10/23/14 $0.75 Buy
7/9/14 $1.40 Buy
Initiated Coverage 11/28/13; Name changed to NewCastle Gold 06/30/15; Transfer of Coverage 10/20/2016
00.20.40.60.8
11.21.41.61.8
Jun14
Sep14
Dec14
Mar15
Jun15
Sep15
Dec15
Mar16
Jun16
Sep16
Dec16
Mar17
Price History (C$) Target/Rating/Coverage ChangeThis Company is Restricted
NexGen Energy Ltd. (NXE-T) Date Target(C$) Rating2/27/17 $6.00 Buy1/25/17 $4.50 Buy4/14/16 $4.00 Buy3/30/16 $3.20 Buy1/12/16 $2.00 Buy11/5/15 $2.10 Buy
Initiated Coverage 11/05/15
0
1
2
3
4
5
6
7
Apr14
Jul14
Oct14
Jan15
Apr15
Jul15
Oct15
Jan16
Apr16
Jul16
Oct16
Jan17
Price History (C$) Target/Rating/Coverage Change
OceanaGold Corporation (OGC-T) Date Target(C$) Rating6/28/17 $5.10 Buy1/25/17 $5.75 Buy7/11/16 $6.50 Buy5/31/16 $4.40 Hold4/29/16 $4.35 Hold3/1/16 $3.80 Hold
2/19/16 $4.00 Hold10/2/15 $4.00 Buy7/15/15 $4.10 Buy4/30/15 $3.80 Buy2/20/15 $3.60 Buy1/27/15 $3.20 Buy
10/23/14 $3.30 Buy9/22/14 $3.50 Buy
Initiated Coverage 09/22/14
0
1
2
3
4
5
6
7
Jun14
Sep14
Dec14
Mar15
Jun15
Sep15
Dec15
Mar16
Jun16
Sep16
Dec16
Mar17
Price History (C$) Target/Rating/Coverage Change

The Weekly Dig 7/7/17
Haywood Mining [email protected] Page 38
Osisko Gold Royalties Ltd. (OR-T) Date Target(C$) Rating1/25/17 $18.25 Buy
10/20/16 $19.00 Buy7/11/16 $20.25 Buy3/2/16 $19.00 Buy
12/16/15 $18.75 Buy
Initiated Coverage 12/16/2015; Transfer of Coverage 10/20/2016
0
5
10
15
20
25
Jun14
Sep14
Dec14
Mar15
Jun15
Sep15
Dec15
Mar16
Jun16
Sep16
Dec16
Mar17
Price History (C$) Target/Rating/Coverage Change
Osisko Mining Inc. (OSK-T) Date Target(C$) Rating4/6/17 $6.50 Buy
3/17/17 $5.00 Buy10/20/16 $4.00 Buy7/11/16 $4.00 Buy5/31/16 $3.00 Buy2/4/16 $2.00 Buy
12/10/15 $2.50 Buy
Initiated Coverage 12/10/2016; Transfer of Coverage 10/20/2016
0
1
2
3
4
5
6
7
Jun14
Sep14
Dec14
Mar15
Jun15
Sep15
Dec15
Mar16
Jun16
Sep16
Dec16
Mar17
Price History (C$) Target/Rating/Coverage Change
Richmont Mines Inc. (RIC-T) Date Target(C$) Rating1/25/17 $14.00 Buy7/11/16 $20.00 Buy5/31/16 $15.75 Buy5/13/16 $12.25 Buy4/13/16 $10.00 Buy3/7/16 $8.00 Buy
Initiated Coverage: 3/7/16
0
5
10
15
20
25
Jun14
Sep14
Dec14
Mar15
Jun15
Sep15
Dec15
Mar16
Jun16
Sep16
Dec16
Mar17
Price History (C$) Target/Rating/Coverage Change
Roxgold Inc. (ROXG-T) Date Target(C$) Rating1/25/17 $2.00 Buy
10/20/16 $2.10 Buy7/11/16 $2.15 Buy5/31/16 $1.60 Buy4/28/16 $1.50 Buy7/15/15 $1.10 Buy11/5/14 $1.00 Buy7/9/14 $1.25 Buy
Initiated Coverage 01/27/14; Transfer of Coverage 10/20/2016
0
0.5
1
1.5
2
2.5
May14
Aug14
Nov14
Feb15
May15
Aug15
Nov15
Feb16
May16
Aug16
Nov16
Feb17
Price History (C$) Target/Rating/Coverage Change
Sabina Gold & Silver Corp. (SBB-T) Date Target(C$) Rating1/25/17 $1.70 Buy6/16/16 UR UR (Buy)5/31/16 $1.65 Buy1/12/16 $1.00 Buy
12/15/15 $0.90 Buy
Initiated Coverage 12-15-15
0
0.5
1
1.5
2
2.5
Jun14
Sep14
Dec14
Mar15
Jun15
Sep15
Dec15
Mar16
Jun16
Sep16
Dec16
Mar17
Price History (C$) Target/Rating/Coverage Change
SEMAFO Inc. (SMF-T) Date Target(C$) Rating4/25/17 $4.50 Buy3/9/17 $5.50 Buy
1/25/17 $7.00 Buy11/10/16 $7.50 Buy7/11/16 $8.25 Buy5/12/16 $6.50 Buy2/26/16 $6.00 Buy7/15/15 $5.00 Buy1/27/15 $5.75 Buy
10/23/14 $6.25 Buy7/9/14 $6.50 Buy
0123456789
Jun14
Sep14
Dec14
Mar15
Jun15
Sep15
Dec15
Mar16
Jun16
Sep16
Dec16
Mar17
Price History (C$) Target/Rating/Coverage Change
Tahoe Resources Inc. (THO-T) Date Target(C$) Rating7/6/17 $9.00 Sell5/3/17 $13.00 Hold
3/13/17 $12.00 Hold1/25/17 $14.00 Hold11/4/16 $25.00 Buy8/11/16 $28.00 Buy7/11/16 $25.00 Buy5/9/16 $20.00 Buy
7/15/15 $16.50 Buy4/29/15 $19.25 Buy4/2/15 $16.00 Hold
1/27/15 $14.50 Sell12/5/14 $12.75 Sell11/7/14 $15.00 Sell
10/23/14 $17.25 Sell7/9/14 $18.75 Sell
Initiated Coverage 11/05/13
0
5
10
15
20
25
30
35
Jun14
Sep14
Dec14
Mar15
Jun15
Sep15
Dec15
Mar16
Jun16
Sep16
Dec16
Mar17
Price History (C$) Target/Rating/Coverage Change
Trek Mining Inc. (TREK-V) Date Target(C$) Rating4/4/17 $3.00 Buy
Initiated Coverage: 4/4/2017
0
1
2
3
4
5
6
Jun14
Sep14
Dec14
Mar15
Jun15
Sep15
Dec15
Mar16
Jun16
Sep16
Dec16
Mar17
Price History (C$) Target/Rating/Coverage Change
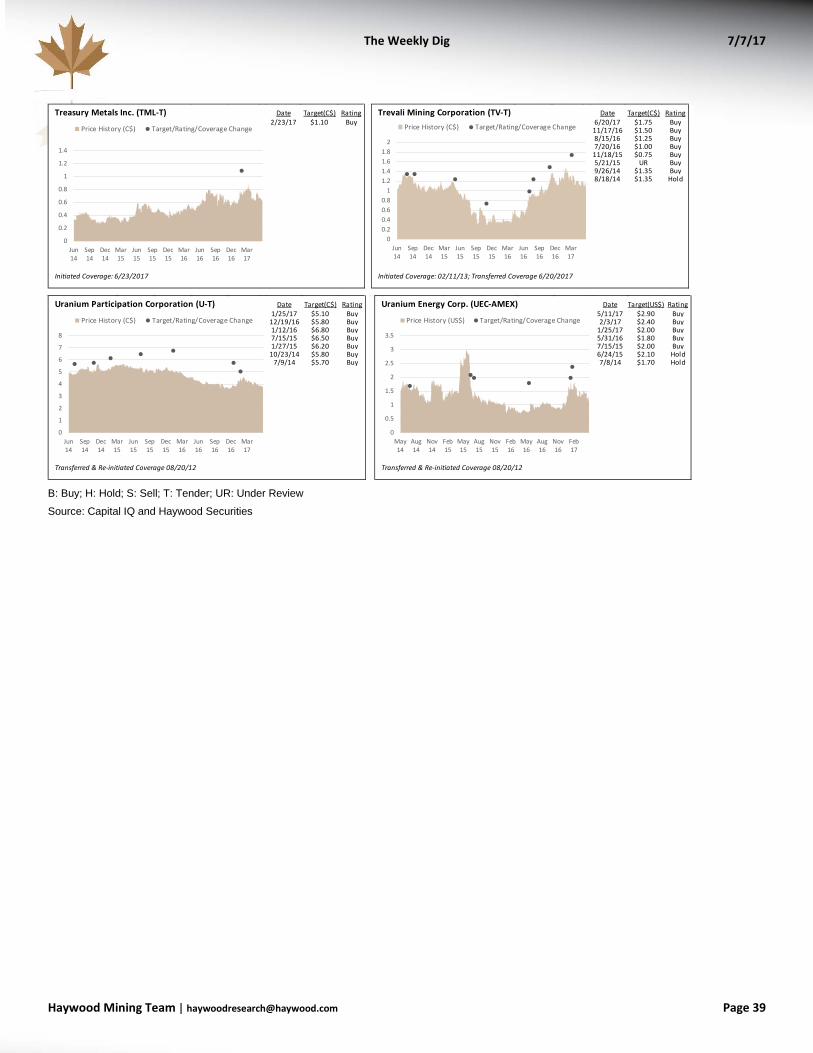
The Weekly Dig 7/7/17
Haywood Mining [email protected] Page 39
B: Buy; H: Hold; S: Sell; T: Tender; UR: Under Review
Source: Capital IQ and Haywood Securities
Treasury Metals Inc. (TML-T) Date Target(C$) Rating2/23/17 $1.10 Buy
Initiated Coverage: 6/23/2017
0
0.2
0.4
0.6
0.8
1
1.2
1.4
Jun14
Sep14
Dec14
Mar15
Jun15
Sep15
Dec15
Mar16
Jun16
Sep16
Dec16
Mar17
Price History (C$) Target/Rating/Coverage Change
Trevali Mining Corporation (TV-T) Date Target(C$) Rating6/20/17 $1.75 Buy
11/17/16 $1.50 Buy8/15/16 $1.25 Buy7/20/16 $1.00 Buy
11/18/15 $0.75 Buy5/21/15 UR Buy9/26/14 $1.35 Buy8/18/14 $1.35 Hold
Initiated Coverage: 02/11/13; Transferred Coverage 6/20/2017
00.20.40.60.8
11.21.41.61.8
2
Jun14
Sep14
Dec14
Mar15
Jun15
Sep15
Dec15
Mar16
Jun16
Sep16
Dec16
Mar17
Price History (C$) Target/Rating/Coverage Change
Uranium Participation Corporation (U-T) Date Target(C$) Rating1/25/17 $5.10 Buy
12/19/16 $5.80 Buy1/12/16 $6.80 Buy7/15/15 $6.50 Buy1/27/15 $6.20 Buy
10/23/14 $5.80 Buy7/9/14 $5.70 Buy
Transferred & Re-initiated Coverage 08/20/12
0
1
2
3
4
5
6
7
8
Jun14
Sep14
Dec14
Mar15
Jun15
Sep15
Dec15
Mar16
Jun16
Sep16
Dec16
Mar17
Price History (C$) Target/Rating/Coverage Change
Uranium Energy Corp. (UEC-AMEX) Date Target(US$) Rating5/11/17 $2.90 Buy2/3/17 $2.40 Buy
1/25/17 $2.00 Buy5/31/16 $1.80 Buy7/15/15 $2.00 Buy6/24/15 $2.10 Hold7/8/14 $1.70 Hold
Transferred & Re-initiated Coverage 08/20/12
0
0.5
1
1.5
2
2.5
3
3.5
May14
Aug14
Nov14
Feb15
May15
Aug15
Nov15
Feb16
May16
Aug16
Nov16
Feb17
Price History (US$) Target/Rating/Coverage Change