Embed Size (px)
Citation preview

The Weekly Dig – April 28, 2017 Mick Carew, PhD [email protected]
Emma Boggio, MSA, CPA, CA604-697-6166 [email protected]
and the Haywood Mining Team
Member of the Canadian Investor Protection Fund
Please see page 39 for Analyst Certification, and pages 39 to 46 for Important Information and Legal Disclaimers, Rating Structure, and notes.
Gold Recovers Slightly as US Government Releases Perfunctory Tax Plan On Wednesday, gold futures traded around their lowest level in just over two weeks, as the dollar firmed, bond yields rose and stocks looked to cautiously test new highs. However, after somewhat subdued trading ahead of what the Trump administration had teased as a “massive” tax plan, markets appeared to settle Wednesday following the plan’s release. The S&P 500 and Down Jones Industrial Average both finished slightly lower for the day following Treasury Secretary Steven Mnuchin and White House economic adviser Gary Cohn’s outline of the plan. Although the announced proposal includes a 15% corporate rate, down from the current 35% rate, and if enacted would have the potential to boost US economic growth considerably, the plan that was presented was only a one-page set of bullet points, containing around 200 words. Simultaneous to this rather lack luster proposal, came commentary regarding the US potentially withdrawing from NAFTA and the country’s trade complaints about Canadian lumber and imported steel. Following the release of the proposal on Wednesday, the price of gold edged up to US$1,269 before finishing the week at US$1,268 per ounce. It was a mixed week for other precious metals with silver (down 4.0%) and platinum (down 2.66%) both finishing the week down at US$17.24 and US$947 per ounce, while palladium finished up 3.96% at US$827 per ounce. Meanwhile, base metals recovered slightly this week, with copper (up 2.04%), nickel (up 1.16%), lead (up 6.17%), and zinc (up 1.79%), each finishing the week at US$2.59, US$4.27, US$1.04, and US$1.19 per pound respectively. It was a negative week for WTI crude, which continued to fall this week (down 0.87%) to finish at $49.19 per barrel while the Broker Average Price for uranium finished the week down 0.83% at US$22.75.
DIGGING IN… Metals Sector Macro: Gold down, finishing at US$1,268 per ounce ....................... 2 Junior Explorer – Weekly Vantage Point: News from the Junior sector this week included a site visit report for Regulus Resources Inc. (REG-V), drilling results from Pure Gold Mining Inc. (PGM-V), and drilling results form Calibre Mining Corp. (CXB-V) ............................................................................................................. 3 Haywood Research – The Week in Review: Publications from the Haywood Research team this week included Q1/17 production results from SEMAFO Inc. (SMF-T), Barrick Gold Corporation (ABX-T), Mountain Province Diamonds Inc. (MPVD-T), and OceanGold Corporation (OGC-T); drilling results from Pilot Gold Inc. (PLG-T), Osisko Mining Inc. (OSK-T), Barkerville Gold Mines Ltd. (BGM-V), Harte Gold Corp. (HRT-T), NexGen Energy Ltd. (NXE-T), and Marathon Gold Corp. (MOZ-T); and a financing from Barkerville Gold Mines Ltd. (BGM-V) ...... 8 Weekly Commodities / Indices / Exchange Rates: The S&P/TSX Comp finished at 15,586 while the S&P/TSX Composite Venture Index was up (2.25)% to finish at 807 …..….…..…… .............................................................................................. 16 Commodities and ETFs: Gold finishes at 1,268 per ounce on Friday…..…………..17 Upcoming Macroeconomic News: Change in payrolls for April on May 5th….….21 Comparables Tables: Consensus and Haywood forecasts and multiples, plus market valuations for in situ resources ............................................................... 22
The Dig is intended to provide general information only and it is written for an institutional audience. It is not a solicitation for the purchase of securities, an offer of securities, or intended as investment research or advice. The information presented, while obtained from sources we believe reliable is not guaranteed against errors or omissions. For Canadian residents: Haywood Securities Inc. is a Canadian registered broker-dealer and a member of the Investment Industry Regulatory Organization of Canada, the Toronto Stock Exchange, the Toronto Venture Exchange and the Canadian Investor Protection Fund. Any Canadian client that wishes further information about anything contained herein should contact a qualified salesperson of Haywood Securities Inc. For U.S. residents: The Dig is distributed in the United States by Haywood Securities (USA) Inc.
$1,240
$1,270
$1,300
4/24 4/28
Gold (US$/oz)Last: $1,270
$16.04/24 4/28
Silver (US$/oz)Last: $17.26
$2.50
$2.60
$2.70
4/24 4/28
Hund
reds Copper (US$/lb)
Last: $2.61
$47
$49
$51
4/24 4/28
WTI Crude (US$/bbl)Last: $49.19

The Weekly Dig 4/28/17
Haywood Mining [email protected] Page 2
Metals Sector Macro
Macroeconomic News
United States New home sales in the United States unexpectedly jumped by 5.8% to a seasonally adjusted annual rate of 621,000 in March. This increase follows a downwardly revised 587,000 in February. The figure came in well above the surveyed expectations of 584,000 to hit the highest level since July 2016.
The Conference Board Consumer Confidence Index, which had increased in March to 124.9, declined in April to a reading of 120.3 and fell below surveyed expectations of 123. Consumers’ assessment of current conditions cooled in April. Those saying business conditions are “good” declined from 32.4% to 30.2%, while those saying business conditions are “bad” increased slightly, from 13.1% to 13.8%. Meanwhile, consumers were less optimistic about the short-term outlook in April. The percentage of consumers expecting business conditions to improve over the next 6 months decreased from 26.9% to 24.8%, while those expecting business conditions to worsen rose from 8.5% to 10.9%.
According to the Mortgage Bankers Association (MBA), mortgage applications rose 2.7 in the week ended April 21, following a 1.8% decrease in the previous period. Refinancing applications increased by 7.2%, while applications to purchase a home dropped by 1%. Meanwhile, average fixed 30-year mortgage rates fell by 2 basis points, to finish at 4.2%.
According to preliminary estimates, wholesale inventories decreased by 0.1% month over month to US$592.8 billion in March, after rising by 0.2% in February, and were below surveyed expectations of a 0.3% increase. Nondurable stocks declined by 0.9%, while durable inventories went up 0.5%. In addition, wholesale stocks excluding autos fell by 0.2%.
Canada
The Canadian economy showed no growth in February after the GDP advanced 0.6% percent in the previous month and fell below market expectations of 0.1%. The service-producing industries grew less in February than it did in January (0.2% from 0.5% in January) and the goods-producing contracted (-0.3% percent from 1.1%).

The Weekly Dig 4/28/17
Haywood Mining [email protected] Page 3
Junior Explorer: Weekly Vantage Point
News from the Junior sector this week included:
Mining Flashes Other News
• Regulus Resources Inc. (REG-V)
• Pure Gold Mining Inc. (PGM-V)
• Calibre Mining Corp. (CXB-V)
Mining Flash
Regulus Resources Inc. (REG-V, $1.67, [Not Rated]) – Site Visit: Complexity Provides Opportunity for Regulus at AntaKori
Mick Carew, PhD [email protected], Emma Boggio, MSA, CPA, CA, [email protected]
We recently visited Regulus Resources’ (REG-V) AntaKori copper-gold deposit in northern Peru. Regulus is managed by the same team responsible for Antares Minerals Inc., which discovered the Haquira porphyry copper deposit and was subsequently acquired by First Quantum Minerals Inc. (FM-T; not rated) for C$460 million in 2010. Following this success, the team formed Regulus Resources, and after merging with Southern Legacy Minerals Inc. in 2014, has been focused on advancing its AntaKori deposit.
Regulus has just mobilized a drill rig to site, where drilling is expected to begin shortly. The Company is also well funded with ~$11 million, plus 5.5 million warrants exercisable at $0.70 per share that are due to expire in November this year. Most of the $11 million is expected to be used to fund a 15,000- to 18,000-metre drilling program in 2017.
We note that there are several important factors that are critical to understanding the Regulus story:
First, a sound interpretation of the complex geology at AntaKori is crucial; specifically, the relationship between the three main mineralization events that are responsible for copper-gold-silver mineralization, and the grade distribution of arsenic, stibnite, and other deleterious elements at AntaKori.
Second, the location, ownership, and underlying agreements that compose the mineral rights overlying the greater AntaKori deposit are also important; Regulus’ mineral rights abut the Tantahuatay mine immediately to the south.
Finally, the relationship between the local population (specifically the Tingo community) and previous operators was reportedly tense. Regulus has implemented several initiatives to help mend these relations. The site visit allowed us to address each of these factors.
See Haywood Securities for the full report

The Weekly Dig 4/28/17
Haywood Mining [email protected] Page 4
Pure Gold Mining Inc. (PGM-V, $0.55, [Not Rated]) – Pure Gold Reports Highest Grade Result to Date at McVeigh
Mick Carew, PhD [email protected], Emma Boggio, MSA, CPA, CA, [email protected]
Pure Gold announced new drilling results from the Company's ongoing 70,000 metre exploration program at its 100% owned Madsen Gold Project. Pure Gold's 2017 exploration program is on-going with four drill rigs currently testing resource growth potential near the mine infrastructure and along the more than five-kilometre strike length of the Madsen mineral system. Yesterday's release showed both the highest grade returned to date from McVeigh (2 metres grading 133.4 g/t gold from drill hole PG17-307), as well at the deepest gold mineralized intercept returned to date at 600 metres in the A3 Zone (drill hole PG170-320 returning 3.3 metres grading 6.2 g/t gold).
In addition, step out drilling in the Fork Zone was able to support an extending the zone's strike length as drill hole PG17-359 returned results reportedly 600 metres to the south of the southernmost McVeigh drilling to date. Please see below for highlights of the recent drilling results:
• Drill hole PG17-307: 2.0 metres grading 133.4 g/t gold from a downhole depth of 281.7 metres, including 1.0 metre grading 264.9 g/t gold,
• Drill hole PG17-320: 3.3 metres grading 6.2 g/t gold from a downhole depth of 697 metres, and
• Drill hole PG17-359: 6.6 metres grading 3.9 g/t gold from a downhole depth of 164 metres, including 1.5 metres grading 13.9 g/t gold.
See Haywood Securities for the full report

The Weekly Dig 4/28/17
Haywood Mining [email protected] Page 5
Other News
Calibre Mining Corp. (CXB-V, [Not Rated])
Share Price: $0.22 52-week high/low: $0.30/$0.10 Average Daily Volume for the Week: 255,550 shares Market Capitalization: $67.86 million Shares Outstanding: 308.44 million Cash: $5.2 million (March, 2017) Date of Release: April 28, 2017 Thing morning, Calibre Mining Corp. (CXB-V) released results and announced the completion of its phase 1 drilling at its 100% owned Monte Carmelo Gold project in Nicaragua. The gold skarn project consisted of 8 holes for 2,100 metres, all of which intersected skarn mineralization with variable anomalous in gold, silver, copper, and iron. The Company also announced that the maiden drilling program on its 100% owned Santa Maria low sulphidation epithermal gold-silver project will commence in the near term and will consist of a minimum of 2,500 metres of diamond drilling. Please find results in Table 1 below.
Table 1: Drilling results
Source: Calibre Mining

The Weekly Dig 4/28/17
Haywood Mining [email protected] Page 6
Performance of Companies Included in Junior X and Notable News Flow
Source: Capital IQ and Haywood Securities
Close Price Market Capitalization
Cash at Quarter End Weekly Performance QTD Performance
QTD Performance vs. TSXV Index
Company Ticker (C$) (C$M) (C$M)Junior Exploration Names Antler Gold Inc. TSXV:ANTL 0.59 9.46 3.50 0.0% 0.0% 3.0%Aurion Resources Ltd. TSXV:AU 1.79 110.61 12.00 2.9% (1.6)% 1.3%Auryn Resources Inc. TSX:AUG 3.23 247.45 40.00 (2.1)% (7.7)% (4.7)%Calibre M ining Corp. TSXV:CXB 0.22 67.22 5.20 0.0% 0.0% 3.0%Cordoba Minerals Corp. TSXV:CDB 1.16 103.29 2.00 7.4% 1.8% 4.8%IDM Mining Ltd. TSXV:IDM 0.15 53.30 20.00 (6.3)% (9.1)% (6.1)%Kenadyr M ining (Holdings) Corp. TSXV:KEN 0.66 55.41 8.50 (18.5)% (22.4)% (19.4)%Monarques Gold Corporation TSXV:MQR 0.36 48.09 5.41 (2.7)% 0.0% 3.0%Nighthawk Gold Corp. TSXV:NHK 0.96 179.35 37.00 (3.0)% 7.9% 10.9%Plateau Uranium Inc. TSXV:PLU 0.55 31.92 2.50 (3.5)% 3.8% 6.8%Pure Gold M ining Inc. TSXV:PGM 0.57 109.17 17.50 (9.5)% (5.0)% (2.0)%Purepoint Uranium Group Inc. TSXV:PTU 0.08 15.13 1.00 0.0% (15.8)% (12.8)%Red Eagle Exploration Limited TSXV:XR 0.15 53.31 1.00 (3.3)% (25.6)% (22.6)%Regulus Resources Inc. TSXV:REG 1.75 120.04 11.50 0.0% 0.0% 3.0%Rupert Resources Ltd. TSXV:RUP 1.28 123.23 10.00 (1.5)% (3.0)% (0.0)%Vendetta M ining Corp. TSXV:VTT 0.23 19.44 0.35 (4.2)% 7.0% 10.0%Other Companies in the News No other news for the week
The Weekly Dig 4/28/17
Haywood Mining [email protected] Page 7
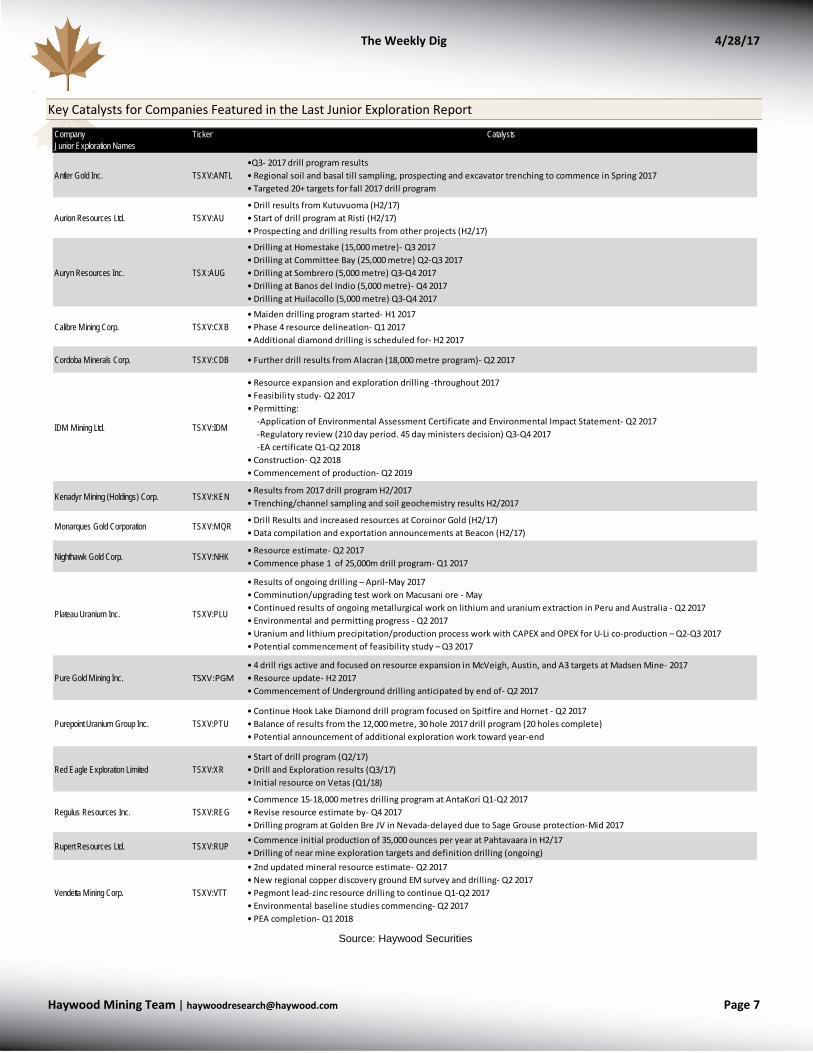
Key Catalysts for Companies Featured in the Last Junior Exploration Report
Source: Haywood Securities
Company Ticker CatalystsJunior Exploration Names
Antler Gold Inc. TSXV:ANTL•Q3- 2017 drill program results• Regional soil and basal till sampling, prospecting and excavator trenching to commence in Spring 2017• Targeted 20+ targets for fall 2017 drill program
Aurion Resources Ltd. TSXV:AU• Drill results from Kutuvuoma (H2/17)• Start of drill program at Risti (H2/17)• Prospecting and drilling results from other projects (H2/17)
Auryn Resources Inc. TSX:AUG
• Drilling at Homestake (15,000 metre)- Q3 2017• Drilling at Committee Bay (25,000 metre) Q2-Q3 2017• Drilling at Sombrero (5,000 metre) Q3-Q4 2017 • Drilling at Banos del Indio (5,000 metre)- Q4 2017• Drilling at Huilacollo (5,000 metre) Q3-Q4 2017
Calibre M ining Corp. TSXV:CXB• Maiden drilling program started- H1 2017• Phase 4 resource delineation- Q1 2017• Additional diamond drilling is scheduled for- H2 2017
Cordoba Minerals Corp. TSXV:CDB • Further drill results from Alacran (18,000 metre program)- Q2 2017
IDM Mining Ltd. TSXV:IDM
• Resource expansion and exploration drilling -throughout 2017• Feasibility study- Q2 2017• Permitting: -Application of Environmental Assessment Certificate and Environmental Impact Statement- Q2 2017 -Regulatory review (210 day period. 45 day ministers decision) Q3-Q4 2017 -EA certificate Q1-Q2 2018• Construction- Q2 2018• Commencement of production- Q2 2019
Kenadyr M ining (Holdings) Corp. TSXV:KEN• Results from 2017 drill program H2/2017• Trenching/channel sampling and soil geochemistry results H2/2017
Monarques Gold Corporation TSXV:MQR• Drill Results and increased resources at Coroinor Gold (H2/17)• Data compilation and exportation announcements at Beacon (H2/17)
Nighthawk Gold Corp. TSXV:NHK• Resource estimate- Q2 2017• Commence phase 1 of 25,000m drill program- Q1 2017
Plateau Uranium Inc. TSXV:PLU
• Results of ongoing drilling – April-May 2017• Comminution/upgrading test work on Macusani ore - May• Continued results of ongoing metallurgical work on lithium and uranium extraction in Peru and Australia - Q2 2017• Environmental and permitting progress - Q2 2017• Uranium and lithium precipitation/production process work with CAPEX and OPEX for U-Li co-production – Q2-Q3 2017• Potential commencement of feasibility study – Q3 2017
Pure Gold M ining Inc. TSXV:PGM• 4 drill rigs active and focused on resource expansion in McVeigh, Austin, and A3 targets at Madsen Mine- 2017• Resource update- H2 2017• Commencement of Underground drilling anticipated by end of- Q2 2017
Purepoint Uranium Group Inc. TSXV:PTU• Continue Hook Lake Diamond drill program focused on Spitfire and Hornet - Q2 2017• Balance of results from the 12,000 metre, 30 hole 2017 drill program (20 holes complete)• Potential announcement of additional exploration work toward year-end
Red Eagle Exploration Limited TSXV:XR• Start of drill program (Q2/17)• Drill and Exploration results (Q3/17)• Initial resource on Vetas (Q1/18)
Regulus Resources Inc. TSXV:REG• Commence 15-18,000 metres drilling program at AntaKori Q1-Q2 2017• Revise resource estimate by- Q4 2017• Drilling program at Golden Bre JV in Nevada-delayed due to Sage Grouse protection-Mid 2017
Rupert Resources Ltd. TSXV:RUP• Commence initial production of 35,000 ounces per year at Pahtavaara in H2/17• Drilling of near mine exploration targets and definition drilling (ongoing)
Vendetta M ining Corp. TSXV:VTT
• 2nd updated mineral resource estimate- Q2 2017• New regional copper discovery ground EM survey and drilling- Q2 2017• Pegmont lead-zinc resource drilling to continue Q1-Q2 2017• Environmental baseline studies commencing- Q2 2017• PEA completion- Q1 2018

The Weekly Dig 4/28/17
Haywood Mining [email protected] Page 8
Haywood Research: The Week in Review
Publications from the Haywood Research team for the week included the following:
• Q1/17 production results from SEMAFO Inc. (SMF-T)
• Q1/17 operating and financial results from Barrick Gold Corporation (ABX-T)
• Q1/17 production results from Mountain Province Diamonds Inc. (MPVD-T)
• Q1/17 operating and financial results from OceanaGold Corporation (OGC-T)
• Drilling results from Pilot Gold Inc. (PLG-T)
• Drilling results from Osisko Mining Inc. (OSK-T)
• Drilling results Barkerville Gold Mines Ltd. (BGM-V)
• Drilling results from Harte Gold Corp. (HRT-T)
• Drilling Results from NexGen Energy Ltd. (NXE-T)
• Financing from Barkerville Gold Mines Ltd. (BGM-V)
• Drilling results from Marathon Gold Corp. (MOZ-T)
Research Reports
SEMAFO Inc. (SMF-T, $3.32 [Buy Rating, $4.50 Target Price]) – 2017 Production Guidance Reduced by ~12%
Kerry Smith, MBA, PEng [email protected], Danny Ochoa, PEng, CFA, [email protected]
SEMAFO released Q1/17 production results and negatively revised 2017 production guidance.
• Q1/17 Production Comes in Light – SEMAFO reported Q1/17 production of 55,400 ounces at a total cash cost of US$699/oz and all-in sustaining cost (AISC) of US$892/oz, which compares with our estimate of 57,500 ounces at US$600/oz and US$875/oz. The production miss was due to lower than expected tonnes of ore and lower mined grade (about 35% lower than the model) from an incorrect geological interpretation of the upper portion of Zone 9, which will carry over into May.
• Q2/17 Production Expected to Be Very Light – SEMAFO is guiding towards Q2/17 production of only 45,000 ounces, as it does not expect to be finished mining this lower grade portion of Zone 9 until May.
• 2017 Production Guidance Reduced by ~12% – SEMAFO has adjusted 2017 gold production guidance downward by about 25,000 ounces from between 215,000 and 235,000 ounces to between 190,000 and 205,000 ounces, a 12% decrease at the guidance mid-points. Cash-cost guidance for the year has been increased by ~16.7% to between US$685 and US$715/oz, and AISC guidance has been increased by 15% to between US$920 and US$960/oz. We have adjusted our modelled 2017 production from 230,000 ounces previously, to 200,000 ounces, and have increased our total cash cost from US$600/oz to US$725/oz, and AISC from US$875/oz to US$1,035/oz.
• Target Price, Ratings – Following these revisions to our model, our 2017 cash flow per share (CFPS) drops from US$0.40 to US$0.29. Our target price, which continues to be based on an 8.5x enterprise value (EV)/CFPS multiple, drops from $5.50 to $4.50 per share. We maintain our BUY rating, but the shares will need time to build back credibility given the expected poor Q2 to come.
See Haywood Securities for the full report

The Weekly Dig 4/28/17
Haywood Mining [email protected] Page 9
Barrick Gold Corporation (ABX-T, $22.89, [Buy Rating, $37.00 Target Price]) – Q1 CFPS in Line…Full-Year Guidance Reduced 5%, Mostly Owing to Veladero
Kerry Smith, MBA, PEng [email protected], Danny Ochoa, PEng, CFA, [email protected]
Barrick Gold reported Q1/17 operating and financial results.
• Cash Flow Slightly Below Consensus, But Overall a Decent Q1 – Barrick reported Q1/17 cash flow (before non-cash working-capital changes) of US$691 million at an average realized gold price of US$1,220/oz, or US$0.59 per share, which was above our estimate of US$0.58 per share and slightly below consensus of US$0.61 per share. Gold production during the quarter totalled 1.31 million ounces (Moz) at a cash cost of US$545/oz and AISC of US$772/oz. Production during the quarter was below our expectations of 1.4 Moz, while cash cost was better than our expectation of US$570/oz, and slightly above our estimated AISC of US$760/oz.
• Operations at Veladero Expected to Resume in June Following Leak on March 28 – Barrick presented a remediation plan to the San Juan provincial authorities last Friday, and the provincial government expects to take 2 weeks to review the proposal. Barrick now assumes a restart of leaching in June, the date of which is dependent on the time required to complete the proposed modifications to the leach pad.
• Full-Year Guidance Revised Downward…Mostly Owing to Veladero Sale – Barrick is decreasing full-year gold production guidance from 5.6 Moz to 5.9 Moz to between 5.3 Moz and 5.6 Moz, or about 5%, with about two-thirds of the reduction from the anticipated sale of a 50% interest in Veladero. Cost guidance is unchanged for the year.
• Model Adjustments Decrease 2017 CFPS – We have adjusted our model to reflect Q1/17 actual results and revised 2017 guidance, which includes the anticipated sale of a 50% interest in Veladero effective mid-year. Our 2017 CFPS decreases to $2.35 from $2.50 per share, and our target price based on a 13.0x 2017 EV/CFPS multiple decreases to $37.00 from $38.50 per share. We maintain our BUY rating.
See Haywood Securities for the full report
Mountain Province Diamonds Inc. (MPVD-T, $4.53, [Buy Rating, $6.30 Target Price]) – Q1/17 Production Exceeds Estimates As 2017 Pricing Guidance Lower Than Expected
Geordie Mark, PhD, FAusIMM [email protected]
Q1/17 Production Summary and Stone Pricing Guidance.
• Operating Results: Q1/17 operations summary showed that for the period the plant processed 492 kilotonnes (kt) of material at an average grade of 1.76 carats per tonne (cpt) to produce 867 kct (425 kct attributable to Mountain Province). Gahcho Kué production was marginally higher than our production expectations of 822 kct (483 kt grading 1.70 cpt). We note that Gahcho Kué produced > 420 kct in March (commercial production declared on March 1), which we believe bodes well for ramp-up as the month’s production exceeds 2017 expectations on an annualized basis.
• Q1/17 Financials Are Due to Be Published on May 11, with forward diamond sales guidance for the balance of the year indicating a range in prices from US$70 to US$90 per carat. This new diamond pricing estimate for 2017 sales is significantly below the original base-case scenario in the technical report (even considering relative differences in market conditions and other pricing discounts), and we have now adjusted our estimate for commercial prices down to US$88 per

The Weekly Dig 4/28/17
Haywood Mining [email protected] Page 10
carat. Reportedly, the lower pricing range relates to the recovery of a higher population of lower quality diamonds than considered average for the 5034 kimberlite, and such populations were manifest in Q1/17 production from shallow transitional material (e.g., tuffisitic kimberlite facies) from the Northeast Lobe. This occurrence marks a negative deviation from the expected size frequency distribution (SFD) and average pricing of diamonds from this part of the kimberlite, and shows a greater than expected variability in the quality and SFD of stones between kimberlite facies than originally projected.
• 2018 Forecasts: We project diamond production of 5.6 million carats (100% basis). Sales are expected to deliver attributable operating cash flow of $1.51 per share.
• Target Price, Ratings: We have lowered our target to $6.30 per share (from $7.00 per share), and maintained our BUY rating.
See Haywood Securities for the full report
OceanaGold Corporation (OGC-T, OGC-AU; C$4.30 [Buy Rating, $5.75 Target Price]) – Q1/17 Exceeds Expectations on Exceptional Execution at Didipio
Geordie Mark, PhD, FAusIMM [email protected]
OceanaGold reported Q1/17 operating and financial results. Q1/17 Results - OceanaGold reported revenues of US$162 million, EBITDA of US$101
million and OCF of US$93 million / US$0.15/sh, which came in ahead our OCF estimates of US$0.13/sh despite inventory build on sales lower than consolidated production. Operationally, consolidated production totaled 148 koz of gold and 13.1 Mlb of copper with sales of 126 koz of gold and 9.145 Mlb of copper at a cash cost of US$306 per ounce gold (net of copper) and AISC of US$521 per ounce. Total production beat our estimates of 136 koz gold and 10.8 Mlb copper.
Philippine Operations - Production of 62.7 koz gold and 13.1 Mlb copper was delivered by processing 1.0 Mt at an average gold and copper grade of 2.10 g/t and 0.60% respectively. Mill throughput represents a record in average daily rates (11.2 ktpd), and points to materially lower average throughput rates for the remainder of 2017. Despite the elevated throughput and grade profile, gold and copper recoveries performed a little better than expected at 92% and 95% respectively…
New Zealand Operations - production of 64.41 koz gold at a cash cost of US$725/oz. Waihi - 25.86 koz Au production at a cash cost of US$517/oz (AISC: US$841/oz) by processing 0.129 kt grading 8.25 g/t Au with recoveries of 90.8% (est. 92%). Macraes - 38.55 koz Au production at a cash cost of US$864/oz (AISC: $1,182/oz) by processing 1.38 Mt grading 1.05 g/t Au with recoveries at 83.3% (est. 85%).
Haile - production of 20.8 koz gold was less than our estimate of 27 koz gold. Total ore mined was 0.377 Mt grading 1.68 g/t gold. Little mill performance data were outlined with sulphide only ore now being processed with mill utilization improving and having averaged ~80% in March with Q1/17 material blend (grading ~2.5-3.0 g/t gold) promised 50/50 oxide/sulphide material. Commercial production is expected to be declared in Q2/17 with gold production expected to be greatest in Q4/17.
2017 Forecasts - 593 koz gold plus 38 Mlb copper at a cash cost of US$414/oz gold (AISC: US$647/oz) with revenue of US$819 million, and OCPS: US$0.76.
See Haywood Securities for the full report

The Weekly Dig 4/28/17
Haywood Mining [email protected] Page 11
Radar Flashes
Pilot Gold Inc. (PLG-T, $0.51, [BUY Rating, $1.00 Target Price]) – Drilling Expands New Target Within Main Zone at Goldstrike
Mick Carew, PhD [email protected], Emma Boggio, MSA, CPA, CA, [email protected]
Pilot Gold announced additional drill results from the Warrior, Aggie, Peg Leg, and Dip Slope targets, all located within the larger Main Zone, at the 100% controlled Goldstrike oxide gold project. Goldstrike, which is a Carlin-style gold system, is located in the eastern Great Basin, immediately adjacent to the Utah/Nevada border. The primary target is shallow Carlin-style, oxide gold mineralization within the 14 km2 “Historic Mine Trend”, between and downdip of historical open pits. Gold mineralization within the Main Zone has now been defined over an area of approximately 4 km2, and gold mineralization at each of these targets remains open for further drilling. The focus of drilling continues to be the definition of gold mineralization beyond the extents of the 8 historical open pits that are situated within the Main Zone. Highlights from the newly released drill holes are summarized below:
• Highlights from the Warrior and Aggie targets include:
PGS197: 15.2 metres grading 1.93 g/t gold from a downhole depth of 106.7 metres.
• Highlights from the Peg Leg target include:
PGS227: 13.7 metres grading 1.61 g/t gold from a downhole depth of 62.5 metres, including 9.1 metres grading 2.05 g/t gold, and 15.2 metres grading 0.98 g/t gold from a downhole depth of 86.9 metres.
• Highlights from the Dip Slope target include:
PGS212: 56.4 metres grading 0.41 g/t gold from a downhole depth of 106.7 metres, including 9.1 metres grading 1.02 g/t gold.
See Haywood Securities for the full report

The Weekly Dig 4/28/17
Haywood Mining [email protected] Page 12
Osisko Mining Inc. (OSK-T, $4.91, [BUY Rating, $6.50 Target Price]) – More Drilling at Windfall
Mick Carew, PhD [email protected], Emma Boggio, MSA, CPA, CA, [email protected]
Osisko Mining announced additional drill results from its ongoing 400,000-metre drill program at its 100% owned Windfall Lake gold project located in Urban Township, Québec. The latest drill results consist of eight drill holes focused on infill and expansion drilling in the Lynx discovery, as well as the Caribou, Underdog, and the 27 Zones. Highlights from the newly released drill holes are summarized below:
Drill Hole OSK-W-17-800: 2.8 metres grading 35.2 g/t gold (uncut) from a downhole depth of 306 metres, including 0.7 metres grading 139 g/t gold (uncut)
Drill Hole OSK-W-17-790: 8.6 metres grading 10.5 g/t gold (uncut) from a downhole depth of 316.9 metres, including 0.7 metres grading 102 g/t gold (uncut)
Drill Hole OSK-W-17-812: 4.1 metres grading 18.6 g/t gold (uncut) from a downhole depth of 304.8 metres, including 0.3 metres grading 59.7 g/t gold and 0.3 metres grading 184 g/t gold (uncut)
Drill Hole OSK-W-17-789-W1: 4.9 metres grading 5.63 g/t gold from a downhole depth of 799.5 metres, including 0.6 metres grading 20.4 g/t gold.
See Haywood Securities for the full report
Barkerville Gold Mines Ltd. (BGM-V, $0.94, [BUY Rating, $1.60 Target Price]) – Barkerville Continues to Deliver at Island Mountain
Mick Carew, PhD [email protected], Emma Boggio, MSA, CPA, CA, [email protected]
Barkerville announced further results from its ongoing 130,000-metre Phase II Island Mountain exploration drilling program at the Company’s flagship Cariboo gold project. The Company currently has eight rigs in operation. Seven of these rigs are on Island Mountain, and the additional rig is testing the area between the former Aurum and Cariboo gold-quartz mines. Of the seven rigs on Island Mountain, four are currently exploring and delineating the Valley Zone. The Company released results from an additional seven drill holes in this morning’s announcement.
Highlights of Drill Hole IM-17-081 include:
• 7.80 metres grading 23.32 g/t gold from a downhole depth of 280 metres
• 2.00 metres grading 7.43 g/t gold from a downhole depth of 400 metres.
Highlights of Drill Hole IM-17-085 include:
• 14.55 metres grading 13.63 g/t gold from a downhole depth of 250 metres.
See Haywood Securities for the full report

The Weekly Dig 4/28/17
Haywood Mining [email protected] Page 13
Harte Gold Corp. (HRT-T, $0.71, [BUY Rating, $1.00 Target Price]) – Encouraging Drill Results from the Sugar Zone Deposit
Pierre Vaillancourt [email protected], Douglas Ibbitson, [email protected]
Harte Reported on Results from Four Drill Holes in the Sugar Zone – The infill drill results at the Sugar Zone confirm mineralization for commercial production starting in early 2018. Highlights from the holes reported included 17.8 g/t over 1.9 metres, 18.4 g/t over 1.7 metres, and 41.7 g/t over 1.8 metres, well above the average grade of the deposit. The remaining eight unreported drill holes were also mineralized, but closer to the average grade of the zone of 10 g/t gold.
High Grades over Narrow Widths – Drilling in the Sugar Zone was conducted in part to test longhole mining applicability on the narrowest part of the Sugar Zone. While widths were limited, featuring very high grades over intervals of less than 1 metre, they were sufficient to be economic in the context of the minimum longhole mining width of 2.2 metres, albeit with dilution of up to 30%.
Harte Also Reported on Results from Six Drill Holes in the Middle Zone – The results expanded the mineralized envelope, which now measures 400 metres on strike and 700 metres downdip, comparable in size to the Sugar Zone. Highlights from six holes reported include 7.3 g/t over 3.6 metres, 9 g/t over 1.6 metres, and 9 g/t over 2.1 metres . As with the Sugar Zone, mineralized widths feature a very high-grade core, including 47.1 g/t over 0.3 metres, or 50.1 g/t over 0.4 metres, suggesting a coarse gold effect.
Promising Potential – Relative to the Sugar Zone, the Middle Zone is characterized by less distinct high-grade veins, but more sulphide mineralization and broader zones of silicification. Overall, the Middle Zone appears to be a better mineralized package, with stronger grades and widths. The Middle Zone remains open downdip and on strike to the south. The remaining four drill holes from the Middle Zone were testing the boundary of the zone and were not mineralized.
See Haywood Securities for the full report
NexGen Energy Ltd. (NXE-T, $3.11, [BUY Rating, $6.00 Target Price]) – NexGen Kicks Off Arrow PEA for Delivery Mid-2017 and Positive Results from Gap Zone
Colin Healey, MBA [email protected]
We expect the maiden Preliminary Economic Assessment (PEA) on the Arrow deposit will confirm our view that Arrow has the potential to become one of the lowest cost uranium mines on the planet, and could be a significant catalyst for the stock when delivered mid-year. Drill results from the gap between the 180 Zone and the main Arrow deposit highlight the resource expansion potential of the Rook 1 project, as none of this area is captured in any resource estimate to date on the project.
Results include relatively shallow intersection of the A2 shear zone (from 175 metres depth) with very strong radioactivity registering up to 32,000 counts per second (cps) on the scintillometer, and intersection of the A2 through A5 shear zones in the true “gap area” (at depth), with excellent wider intersections of radioactivity, including off-scale intervals.
The ~180-metre gap area to the southwest of Arrow and northeast of the 180 Zone along strike presents great resource growth potential, as drilling is now showing the presence of significant high-grade uranium with scintillometer results, and we note that none of the successful 2017 winter drilling is included in the current resource estimate for Arrow, which stands at 301.6 million pounds (Mlb) of U3O8 comprising 179.5 Mlb indicated (1.2 Mt grading 18.8%), plus 122.1 Mlb inferred (4.3 Mt grading 1.3%).

The Weekly Dig 4/28/17
Haywood Mining [email protected] Page 14
Highlights of New Scintillometer Results from Gap Zone:
• Southwest (of main Arrow Zone) Shallow Dravite A2:
Hole AR-17-128: 6.0 metres total composite radioactivity, including 1.1 metres total composite radioactivity measuring > 10,000 to 32,000 cps within a 23.0-metre section (from 195.0 metres depth)
• Southwest (of main Arrow Zone) A3/4 Shear Gap Results:
Hole AR-17-131c3: 64.5 metres total composite radioactivity, including 6.6 metres total composite radioactivity measuring > 10,000 to > 61,000 cps within a 337.0-metre section (from 646.0 metres depth) in the A3 through A5 shears.
See Haywood Securities for the full report
Barkerville Gold Mines Ltd. (BGM-V, $1.01, [BUY Rating, $1.60 Target Price]) – Barkerville Announces $15M Bought-Deal Financing and $15.8M Private Placement
Mick Carew, PhD [email protected], Emma Boggio, MSA, CPA, CA, [email protected]
Barkerville announced a bought-deal private-placement equity financing, co-led by Haywood Securities, for 15,790,000 units at a price of $0.95 per unit for total gross proceeds of $15,000,500. In addition, Barkerville announced that it plans to complete a concurrent non-brokered private-placement of 16,657,962 units to Osisko Gold Royalties Ltd. (OR-T, Buy, TP $18.25) and Osisko Mining Inc. (OSK-T, Buy, TP $6.50) for gross proceeds of $15,825,064.
The announcement of the financing is deemed ‘Neutral’ in that the scale and pricing fall generally in line with our modelled assumptions, and as such, do not materially affect our valuation, which implies significant upside from current levels. That said, the announcement removes any uncertainty surrounding the timing of a potential financing, leaving Barkerville in a very strong financial position, and allowing investors to focus squarely on results. All units under the concurrent financings will consist of one common share and one-half warrant of Barkerville. Each full warrant will be exercisable to acquire one common share of the Company at a price of $1.30 for a period of 18 months from the closing of the offerings, which is expected to occur on or about May 16, 2017.
After closing of the offerings in mid-May, the Company will be well financed for the coming year as it fortifies its financial position to conduct ongoing drilling and exploration/development programs at the Cariboo project, where currently eight drill rigs continue to expand and delineate gold mineralization at Island Mountain. The financing announced falls generally in line with our expectations, and the proceeds, along with cash generated in the next few quarters from the Company’s operations at Bonanza Ledge, will serve to remove near-term financing risk and ensure Barkerville maintains strong operational flexibility as it proves up the Cariboo project.
See Haywood Securities for the full report

The Weekly Dig 4/28/17
Haywood Mining [email protected] Page 15
Marathon Gold Corp. (MOZ-T, $1.30, [BUY Rating, $1.50 Target Price]) – Gold Mineralization at Marathon Extended to Depth
Mick Carew, PhD [email protected], Emma Boggio, MSA, CPA, CA, [email protected]
Marathon Gold released high-grade gold assay results from the previously announced visible gold in drill holes MA-17-174 and MA-17-175. These holes are the deepest ever drilled at the Marathon deposit, Valentine Lake Gold Camp. Spaced 180 metres apart along strike, they were drilled down through the mineralized corridor of the Marathon deposit, and both intersected abundant, wide intervals of quartz-tourmaline-pyrite (QTP) veining with numerous occurrences of visible gold (VG) at depths of up to 950 metres.
• Drill hole MA-17-174:
3.0 metres grading 3.05 g/t gold from a downhole depth of 515 metres
3.0 metres grading 6.65 g/t gold from a downhole depth of 720 metres
3.0 metres grading 3.31 g/t gold from a downhole depth of 779 metres.
• Drill hole MA-17-175:
101 metres grading 1.77 g/t gold from a downhole depth of 196 metres, including 7 metres grading 6.48 g/t gold and 4 metres grading 7.92 g/t gold
19 metres grading 4.09 g/t gold from a downhole depth of 531 metres, including 5 metres grading 12.54 g/t gold
32 metres grading 3.25 g/t gold from a downhole depth of 881 metres, including 5 metres grading 11.08 g/t gold.
See Haywood Securities for the full report
The Weekly Dig 4/28/17
Haywood Mining [email protected] Page 16
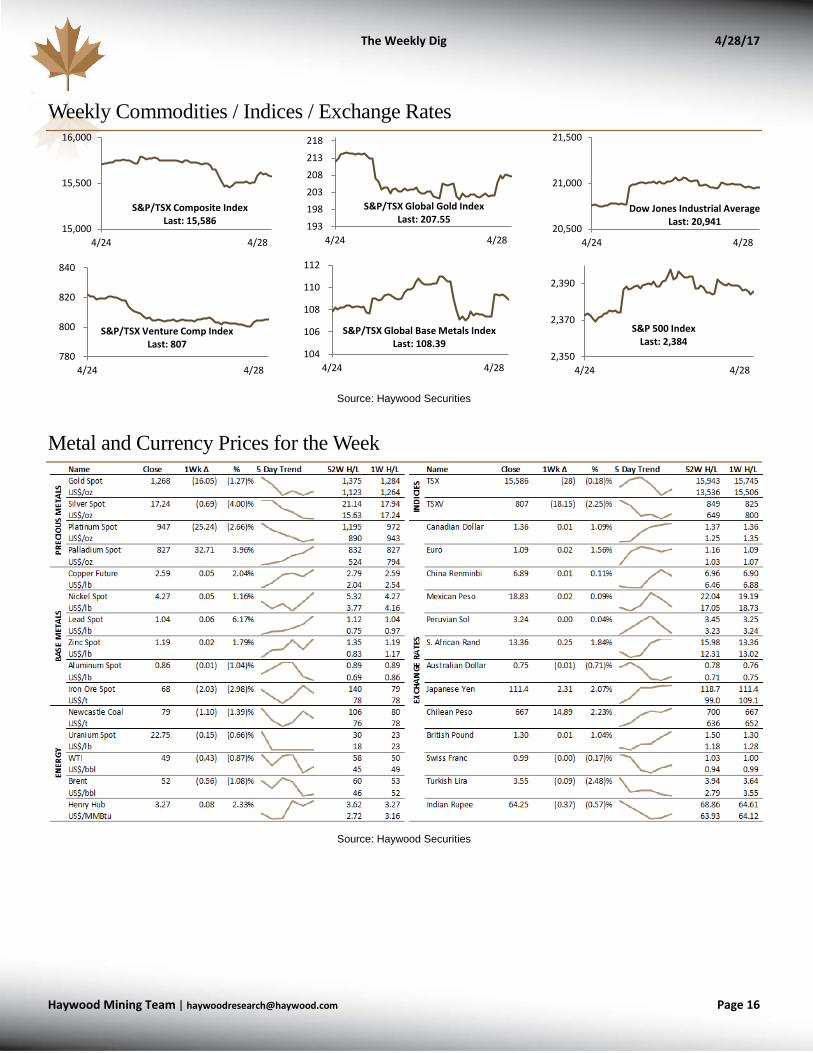
Weekly Commodities / Indices / Exchange Rates
Source: Haywood Securities
Metal and Currency Prices for the Week
Source: Haywood Securities
15,000
15,500
16,000
4/24 4/28
S&P/TSX Composite IndexLast: 15,586 193
198
203
208
213
218
4/24 4/28
S&P/TSX Global Gold IndexLast: 207.55
20,500
21,000
21,500
4/24 4/28
Dow Jones Industrial AverageLast: 20,941
780
800
820
840
4/24 4/28
S&P/TSX Venture Comp IndexLast: 807
104
106
108
110
112
4/24 4/28
S&P/TSX Global Base Metals IndexLast: 108.39
2,350
2,370
2,390
4/24 4/28
S&P 500 IndexLast: 2,384

The Weekly Dig 4/28/17
Haywood Mining [email protected] Page 17
Commodities and ETFs: A Week in Action
Gold - 1-Year US$/oz (left) and Total ETF Holdings (right)
• Spot: Loss (-1.2%) for the week
• ETF Holdings: 59,810,974 ounces, down 117,806 ounces for the week
Silver - 1-Year US$/oz (left) and Total ETF Holdings (right)
• Spot: Gain (+2.1%) for the week
• ETF Holdings: 646,088,412 ounces, up 5,146,320 ounces for the week
Platinum - 1-Year US$/oz (left) and Total ETF Holdings (right)
• Spot: Loss (-2.6%) for the week
• ETF Holdings: 2,422,070 ounces, up 7,377 ounces for the week
Palladium - 1-Year US$/oz (left) and Total ETF Holdings (right)
• Spot: Gain (+4.1%) for the week
• ETF Holdings: 1,522,743 ounces, down 10,987 ounces for the week
Copper - 1-Year US$/lb (left) and LME Inventory (right)
• Futures: Gain (+2.1%) for the week
• LME Copper: 257,150 tonnes, down 6,625 tonnes for the week
$1,000
$1,100
$1,200
$1,300
$1,400
Apr-16 Apr-17Gold ($/oz)
Price100D MA
47
57
67
Apr-16 Apr-17Gold ETF Holdings (Moz)
$13.00
$16.00
$19.00
$22.00
Apr-16 Apr-17Silver ($/oz)
Price
100D MA
570590610630650670690
Apr-16 Apr-17Silver ETF Holdings (Moz)
$800
$1,000
$1,200
Apr-16 Apr-17Platinum ($/oz)
Price
100D MA
2.1
2.2
2.3
2.4
2.5
Apr-16 Apr-17Platinum ETF Holdings (Moz)
$460
$660
$860
Apr-16 Apr-17Palladium ($/oz)
Price
100D MA
1.5
1.7
1.9
2.1
2.3
2.5
Apr-16 Apr-17Palladium ETF Holdings (Moz)
$1.90
$2.40
$2.90
Apr-16 Apr-17Copper ($/lb)
Price
100D MA
130,000
230,000
330,000
Apr-16 Apr-17LME Copper Inventories (t)

The Weekly Dig 4/28/17
Haywood Mining [email protected] Page 18
Nickel - 1-Year US$/lb (left) and LME Inventory (right)
• Spot: Gain (+1.2%) for the week
• LME Nickel: 379,644 tonnes, down 1,302 tonnes for the week
Lead - 1-Year US$/lb (left) and LME Inventory (right)
• Spot: Gain (+6.6%) for the week
• LME Lead: 165,275 tonnes, down 1,900 tonnes for the week
Zinc - 1-Year US$/lb (left) and LME Inventory (right)
• Spot: Gain (+1.8%) for the week
• LME Zinc: 349,050 tonnes, down 6,100 tonnes for the week
Iron – 1-Year US$/t 62% Fe (left) and 1-Year US$/t Newcastle (right)
• Newcastle Thermal Futures: Loss (-0.7%) for the week
• 62% Fe Iron Ore: Loss (-2.9%) for the week
Uranium – 1-Year US$/lb Short-Term (left) and Long-Term (right)
• Uranium Spot: Loss (-1.1%) for the week
• Uranium Long-Term: Unchanged
Source: Bloomberg, UxC Consulting, and Haywood Securities
$3.50
$4.50
Apr-16 Apr-17Nickel ($/lb)
Price
100D MA
350,000
400,000
450,000
Apr-16 Apr-17LME Nickel Inventories (t)
$0.70
$0.90
$1.10
Apr-16 Apr-1Lead ($/lb)
Price
100D MA
140,000
160,000
180,000
200,000
220,000
Apr-16 Apr-17LME Lead Inventories (t)
$0.65
$1.15
Apr-16 Apr-17Zinc ($/lb)
Price
100D MA
300,000
400,000
500,000
600,000
Apr-16 Apr-17LME Zinc Inventories (t)
$35
$55
$75
Apr-16 Apr-1762% Iron Ore ($/t)
Price
100D MA
$30
$50
$70
$90
Apr-16 Apr-17Newcastle Coal (AUD/t)
Price
100D MA
$18
$23
$28
$33
$38
Apr-16 Apr-17Uranium Spot ($/lb)
Price
100D MA
$30
$35
$40
$45
Apr-16 Apr-17Uranium Long-Term ($/lb)
Price
100D MA

The Weekly Dig 4/28/17
Haywood Mining [email protected] Page 19
Equities: Weekly Performances S&P TSX Global Mining Index – Top and Bottom Performance (upper) and Constituent Performance (lower)
Source: Capital IQ and Haywood Securities
Top Companies Close $∆ %∆Constellium N.V 6.95 1.40 25% Century Aluminum Company 13.64 1.76 15% Materion Corporation 38.05 3.80 11% Alcoa Corporation 33.73 2.03 6% Altius Minerals Corporation 12.07 0.59 5% Agnico Eagle Mines Limited 65.25 3.12 5% Vedanta Limited 15.20 0.71 5% Freeport-McMoRan Inc. 12.75 0.52 4% Turquoise Hill Resources Ltd. 3.72 0.11 3% Northern Dynasty Minerals Ltd. 2.09 0.06 3%
1Wk 1WkBottom Companies Close $∆ %∆SEMAFO Inc. 3.14 (0.80) (20)% Sandstorm Gold Ltd. 4.73 (1.14) (19)% Gold Fields Limited 3.25 (0.59) (15)% Cloud Peak Energy Inc. 3.37 (0.52) (13)% Denison Mines Corp. 0.70 (0.10) (13)% Mountain Province Diamonds Inc. 3.94 (0.55) (12)% Barrick Gold Corporation 22.82 (3.16) (12)% Seabridge Gold Inc. 10.30 (1.40) (12)% Sibanye Gold Limited 8.01 (0.98) (11)% New Gold Inc. 3.87 (0.46) (11)%
1Wk 52Wk 1Wk 52WkTicker Company Close $∆ %∆ High Low Ticker Company Close $∆ %∆ High LowTSX:AEM Agnico Eagle Mines Limited 65.25 3.12 5% 78.35 46.91 TSX:IMG IAMGOLD Corporation 5.64 (0.20) (3)% 7.65 3.98 TSX:ASR Alacer Gold Corp. 2.16 (0.17) (7)% 3.79 1.75 TSX:IVN Ivanhoe Mines Ltd. 4.79 (0.17) (3)% 5.47 0.92 TSX:AGI Alamos Gold Inc. 9.77 (0.50) (5)% 13.65 7.68 NasdaqGS:KALU Kaiser Aluminum Corporation 84.41 1.05 1% 96.06 69.41 NYSE:AA Alcoa Corporation 33.73 2.03 6% 39.78 20.00 TSX:K Kinross Gold Corporation 4.75 (0.47) (9)% 7.56 3.87 NasdaqGS:ARLP Alliance Resource Partners, L.P. 21.25 (0.45) (2)% 26.65 13.95 TSX:KL Kirkland Lake Gold Ltd. 9.45 (0.57) (6)% 11.15 6.33 TSX:ALS Altius Minerals Corporation 12.07 0.59 5% 14.06 9.01 TSX:KDX Klondex Mines Ltd. 4.88 0.08 2% 7.95 4.07 NYSE:ACH Aluminum Corporation Of China Limited 12.35 (0.51) (4)% 13.85 7.22 TSX:LUC Lucara Diamond Corp. 3.15 0.01 0% 4.39 2.62 NYSE:AU AngloGold Ashanti Limited 11.43 (1.00) (8)% 22.91 9.28 TSX:LUN Lundin Mining Corporation 7.28 0.09 1% 8.94 3.86 NYSE:ARCH Arch Coal, Inc. 70.24 (0.34) (0)% 86.47 59.05 TSX:MAG MAG Silver Corp. 16.70 (0.26) (2)% 23.32 12.75 TSX:AR Argonaut Gold Inc. 2.20 (0.12) (5)% 4.45 1.48 TSX:MDI Major Drilling Group International Inc. 7.57 0.08 1% 8.66 5.72 TSX:AZ Arizona Mining Inc. 1.89 (0.19) (9)% 3.49 1.08 NYSE:MTRN Materion Corporation 38.05 3.80 11% 41.23 22.36 TSX:AKG Asanko Gold Inc. 3.31 (0.02) (1)% 6.09 3.00 NYSE:MUX McEwen Mining Inc. 3.04 (0.03) (1)% 4.92 2.09 TSX:BTO B2Gold Corp. 3.43 (0.25) (7)% 4.74 2.28 TSX:MPVD Mountain Province Diamonds Inc. 3.94 (0.55) (12)% 7.18 3.97 TSX:ABX Barrick Gold Corporation 22.82 (3.16) (12)% 30.45 18.52 TSX:NSU Nevsun Resources Ltd. 3.03 (0.22) (7)% 4.74 3.01 NYSE:BHP BHP Billiton Limited 35.60 (0.16) (0)% 41.79 25.75 TSX:NGD New Gold Inc. 3.87 (0.46) (11)% 7.87 3.11 NYSE:BBL BHP Billiton plc 30.73 (0.02) (0)% 37.44 22.37 NYSE:NEM Newmont Mining Corporation 33.81 (0.32) (1)% 46.07 30.19 TSX:CCO Cameco Corporation 13.09 (1.39) (10)% 17.65 9.88 TSX:NXE NexGen Energy Ltd. 2.95 (0.16) (5)% 4.45 1.42 TSX:CS Capstone Mining Corp 1.06 0.02 2% 1.81 0.60 TSX:NDM Northern Dynasty Minerals Ltd. 2.09 0.06 3% 4.54 0.37 TSX:CG Centerra Gold Inc. 7.05 (0.30) (4)% 8.13 5.56 TSX:NG NovaGold Resources Inc. 5.66 (0.30) (5)% 9.56 5.09 NasdaqGS:CENX Century Aluminum Company 13.64 1.76 15% 16.53 5.53 TSX:OGC OceanaGold Corporation 4.45 0.08 2% 5.56 3.24 TSX:CGG China Gold International Resources Corp. Ltd. 2.03 (0.10) (5)% 3.67 1.84 TSX:OR Osisko Gold Royalties Ltd. 14.54 (0.45) (3)% 18.64 11.90 NYSE:CLD Cloud Peak Energy Inc. 3.37 (0.52) (13)% 8.04 1.64 TSX:OSK Osisko Mining Inc. 4.93 (0.13) (3)% 5.65 1.38 NYSE:CDE Coeur Mining, Inc. 9.06 (0.30) (3)% 16.41 6.98 TSX:PAAS Pan American Silver Corp. 22.89 (1.52) (6)% 27.99 17.26 NYSE:BVN Compañía de Minas Buenaventura S.A.A. 12.01 (0.19) (2)% 16.45 8.90 TSX:PG Premier Gold Mines Limited 2.76 (0.19) (6)% 5.05 1.87 NYSE:CMP Compass Minerals International, Inc. 66.00 (1.00) (1)% 84.40 65.30 TSX:PVG Pretium Resources Inc. 13.53 (0.61) (4)% 16.48 9.05 NYSE:CNX CONSOL Energy Inc. 15.18 (0.17) (1)% 22.34 12.62 NasdaqGS:GOLD Randgold Resources Limited 87.99 (2.62) (3)% 126.55 67.54 NYSE:CSTM Constellium N.V 6.95 1.40 25% 8.85 4.02 TSX:RIC Richmont Mines Inc. 10.32 (0.14) (1)% 15.01 7.36 TSX:CNL Continental Gold Inc. 3.08 (0.24) (7)% 5.75 2.30 NYSE:RIO Rio Tinto plc 39.82 0.29 1% 47.11 26.95 TSX:DML Denison Mines Corp. 0.70 (0.10) (13)% 1.10 0.49 NasdaqGS:RGLD Royal Gold, Inc. 70.68 (1.72) (2)% 87.74 51.76 TSX:DGC Detour Gold Corporation 17.25 0.20 1% 35.93 14.35 TSX:SSL Sandstorm Gold Ltd. 4.73 (1.14) (19)% 8.73 4.29 TSX:DDC Dominion Diamond Corporation 16.59 0.20 1% 17.82 10.47 NYSE:SA Seabridge Gold Inc. 10.30 (1.40) (12)% 15.88 7.35 TSX:ELD Eldorado Gold Corporation 4.99 0.13 3% 6.71 3.46 TSX:SMF SEMAFO Inc. 3.14 (0.80) (20)% 7.46 2.93 TSX:EDV Endeavour Mining Corporation 22.52 (1.91) (8)% 28.81 15.83 NYSE:SBGL Sibanye Gold Limited 8.01 (0.98) (11)% 20.97 6.16 TSX:EDR Endeavour Silver Corp. 4.18 - - 7.75 3.75 TSX:SSO Silver Standard Resources Inc. 14.08 (0.31) (2)% 20.48 10.32 NasdaqGS:GSM Ferroglobe PLC 9.65 0.09 1% 12.53 7.67 TSX:SLW Silver Wheaton Corp. 27.24 (1.25) (4)% 40.80 22.63 TSX:FR First Majestic Silver Corp. 11.10 (0.73) (6)% 24.96 8.89 TSX:SVM Silvercorp Metals Inc. 4.30 (0.19) (4)% 5.90 2.03 TSX:FM First Quantum Minerals Ltd. 13.01 0.03 0% 17.55 7.77 NYSE:SCCO Southern Copper Corporation 35.37 0.09 0% 39.50 24.90 TSX:FVI Fortuna Silver Mines Inc. 6.27 (0.46) (7)% 12.73 5.96 TSX:SWY Stornoway Diamond Corporation 0.82 0.01 1% 1.33 0.80 TSX:FNV Franco-Nevada Corporation 92.84 (0.46) (0)% 105.69 71.44 TSX:THO Tahoe Resources Inc. 11.06 (0.55) (5)% 22.13 9.58 NYSE:FCX Freeport-McMoRan Inc. 12.75 0.52 4% 17.06 9.24 TSX:TECK.B Teck Resources Limited 28.32 (1.14) (4)% 35.67 11.80 NYSE:GFI Gold Fields Limited 3.25 (0.59) (15)% 6.60 2.60 TSX:TGZ Teranga Gold Corporation 0.66 (0.02) (3)% 1.40 0.63 TSX:G Goldcorp Inc. 19.02 (1.40) (7)% 26.56 15.95 TSX:TMR TMAC Resources Inc. 15.57 0.41 3% 20.18 11.41 TSX:GSC Golden Star Resources Ltd. 0.98 (0.03) (3)% 1.46 0.62 TSX:TXG Torex Gold Resources Inc 23.12 (2.49) (10)% 35.17 17.05 TSX:GPR Great Panther Silver Limited 1.71 (0.09) (5)% 2.95 1.51
The Weekly Dig 4/28/17
Haywood Mining [email protected] Page 20
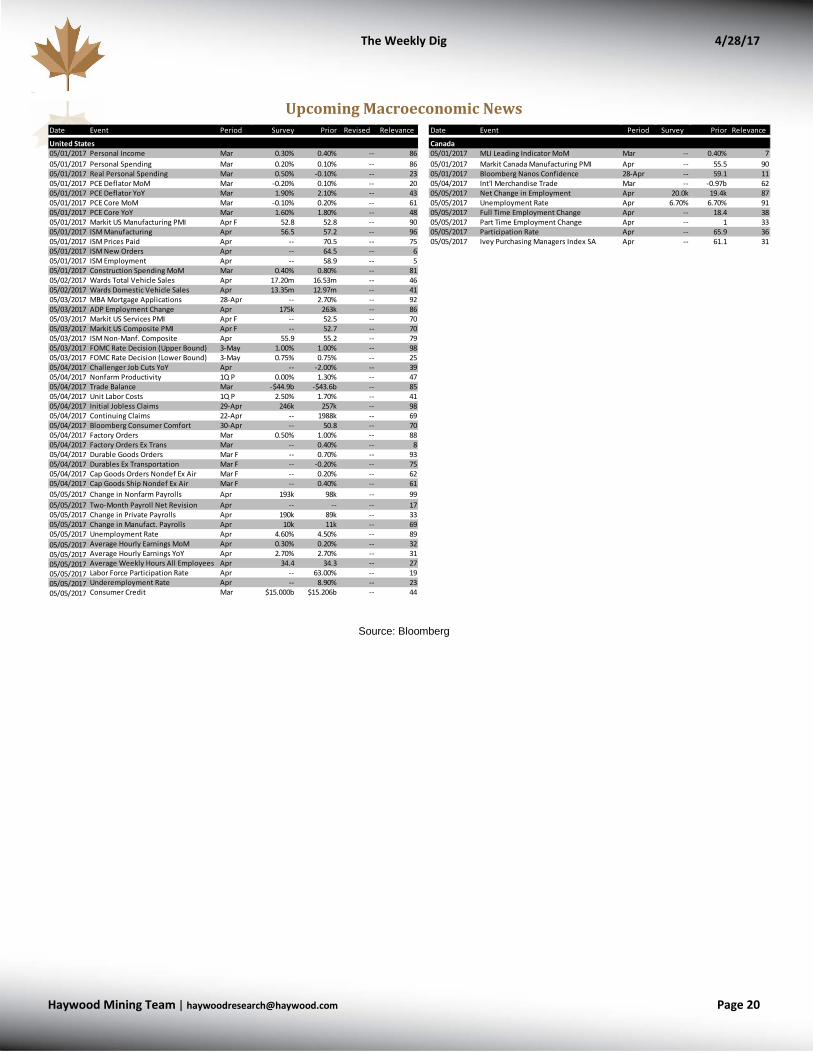
Upcoming Macroeconomic News
Source: Bloomberg
Date Event Period Survey Prior Revised Relevance Date Event Period Survey Prior Relevance
United States Canada05/01/2017 Personal Income Mar 0.30% 0.40% -- 86 05/01/2017 MLI Leading Indicator MoM Mar -- 0.40% 705/01/2017 Personal Spending Mar 0.20% 0.10% -- 86 05/01/2017 Markit Canada Manufacturing PMI Apr -- 55.5 9005/01/2017 Real Personal Spending Mar 0.50% -0.10% -- 23 05/01/2017 Bloomberg Nanos Confidence 28-Apr -- 59.1 1105/01/2017 PCE Deflator MoM Mar -0.20% 0.10% -- 20 05/04/2017 Int'l Merchandise Trade Mar -- -0.97b 6205/01/2017 PCE Deflator YoY Mar 1.90% 2.10% -- 43 05/05/2017 Net Change in Employment Apr 20.0k 19.4k 8705/01/2017 PCE Core MoM Mar -0.10% 0.20% -- 61 05/05/2017 Unemployment Rate Apr 6.70% 6.70% 9105/01/2017 PCE Core YoY Mar 1.60% 1.80% -- 48 05/05/2017 Full Time Employment Change Apr -- 18.4 3805/01/2017 Markit US Manufacturing PMI Apr F 52.8 52.8 -- 90 05/05/2017 Part Time Employment Change Apr -- 1 3305/01/2017 ISM Manufacturing Apr 56.5 57.2 -- 96 05/05/2017 Participation Rate Apr -- 65.9 3605/01/2017 ISM Prices Paid Apr -- 70.5 -- 75 05/05/2017 Ivey Purchasing Managers Index SA Apr -- 61.1 3105/01/2017 ISM New Orders Apr -- 64.5 -- 605/01/2017 ISM Employment Apr -- 58.9 -- 505/01/2017 Construction Spending MoM Mar 0.40% 0.80% -- 8105/02/2017 Wards Total Vehicle Sales Apr 17.20m 16.53m -- 4605/02/2017 Wards Domestic Vehicle Sales Apr 13.35m 12.97m -- 4105/03/2017 MBA Mortgage Applications 28-Apr -- 2.70% -- 9205/03/2017 ADP Employment Change Apr 175k 263k -- 8605/03/2017 Markit US Services PMI Apr F -- 52.5 -- 7005/03/2017 Markit US Composite PMI Apr F -- 52.7 -- 7005/03/2017 ISM Non-Manf. Composite Apr 55.9 55.2 -- 7905/03/2017 FOMC Rate Decision (Upper Bound) 3-May 1.00% 1.00% -- 9805/03/2017 FOMC Rate Decision (Lower Bound) 3-May 0.75% 0.75% -- 2505/04/2017 Challenger Job Cuts YoY Apr -- -2.00% -- 3905/04/2017 Nonfarm Productivity 1Q P 0.00% 1.30% -- 4705/04/2017 Trade Balance Mar -$44.9b -$43.6b -- 8505/04/2017 Unit Labor Costs 1Q P 2.50% 1.70% -- 4105/04/2017 Initial Jobless Claims 29-Apr 246k 257k -- 9805/04/2017 Continuing Claims 22-Apr -- 1988k -- 6905/04/2017 Bloomberg Consumer Comfort 30-Apr -- 50.8 -- 7005/04/2017 Factory Orders Mar 0.50% 1.00% -- 8805/04/2017 Factory Orders Ex Trans Mar -- 0.40% -- 805/04/2017 Durable Goods Orders Mar F -- 0.70% -- 9305/04/2017 Durables Ex Transportation Mar F -- -0.20% -- 7505/04/2017 Cap Goods Orders Nondef Ex Air Mar F -- 0.20% -- 6205/04/2017 Cap Goods Ship Nondef Ex Air Mar F -- 0.40% -- 6105/05/2017 Change in Nonfarm Payrolls Apr 193k 98k -- 9905/05/2017 Two-Month Payroll Net Revision Apr -- -- -- 1705/05/2017 Change in Private Payrolls Apr 190k 89k -- 3305/05/2017 Change in Manufact. Payrolls Apr 10k 11k -- 6905/05/2017 Unemployment Rate Apr 4.60% 4.50% -- 8905/05/2017 Average Hourly Earnings MoM Apr 0.30% 0.20% -- 3205/05/2017 Average Hourly Earnings YoY Apr 2.70% 2.70% -- 3105/05/2017 Average Weekly Hours All Employees Apr 34.4 34.3 -- 2705/05/2017 Labor Force Participation Rate Apr -- 63.00% -- 1905/05/2017 Underemployment Rate Apr -- 8.90% -- 2305/05/2017 Consumer Credit Mar $15.000b $15.206b -- 44

The Weekly Dig 4/28/17
Haywood Mining [email protected] Page 21
Precious Metals Comparables – Consensus Estimates
Source: Capital IQ and Haywood Securities
Shares Market Working EnterpriseCompany Symbol Price O/S Capitalization Cash Capital Debt Value 2017E 2018E Number of
(millions) (millions) (millions) (millions) (millions) (millions) CFPS CFPS Estimates 2017E 2018E 2017E 2018E 2017E 2018E
Senior Precious Metals ProducersAgnico Eagle Mines Limited TSX:AEM C$ 59.07 228.7 US$ 9,886 US$ 641 US$ 807 US$ 1,073 US$ 10,152 US$ 3.23 US$ 3.56 10 13.4x 12.2x 13.8x 12.5x 11.6x 11.9xAngloGold Ashanti Limited NYSE:AU C$ 15.55 408.4 US$ 4,648 US$ 220 US$ 406 US$ 2,144 US$ 6,386 US$ 2.60 US$ 2.98 6 4.4x 3.8x 6.0x 5.2x 4.0x 4.4xBarrick Gold Corporation TSX:ABX C$ 22.78 1165.8 US$ 19,435 US$ 2,277 US$ 5,190 US$ 7,633 US$ 21,878 US$ 2.15 US$ 2.26 8 7.8x 7.4x 8.7x 8.3x 5.4x 5.1xCompañía de Minas Buenaventura NYSE:BVN C$ 15.76 254.0 US$ 2,930 US$ 81 US$ 57 US$ 272 US$ 3,145 US$ 1.32 US$ 1.54 3 8.7x 7.5x 9.4x 8.0x 9.3x 7.0xEldorado Gold Corporation TSX:ELD C$ 4.60 715.3 US$ 2,406 US$ 917 US$ 1,001 US$ 592 US$ 1,996 US$ 0.23 US$ 0.38 12 14.4x 8.9x 12.0x 7.4x 10.2x 9.2xFresnillo PLC LSE:FRES C$ 25.33 736.9 US$ 13,660 US$ 912 US$ 1,270 US$ 798 US$ 13,188 US$ 1.08 US$ 1.42 5 17.1x 13.1x 16.5x 12.6x 12.9x 11.8xGold Fields Limited NYSE:GFI C$ 4.58 820.6 US$ 2,749 US$ 527 US$ 193 US$ 1,505 US$ 4,060 US$ 1.04 US$ 1.18 6 3.2x 2.8x 4.8x 4.2x 3.2x 3.9xGoldcorp Inc. TSX:G C$ 18.72 855.4 US$ 11,718 US$ 212 US$ 404 US$ 2,081 US$ 13,395 US$ 1.48 US$ 1.68 14 9.2x 8.1x 10.6x 9.3x 9.3x 8.2xKinross Gold Corporation TSX:K C$ 4.65 1246.8 US$ 4,243 US$ 838 US$ 1,443 US$ 1,733 US$ 4,533 US$ 0.78 US$ 0.82 14 4.4x 4.1x 4.7x 4.4x 4.1x 4.1xNewcrest Mining Limited ASX:NCM C$ 22.43 765.8 US$ 12,571 US$ 248 US$ 479 US$ 2,016 US$ 14,108 US$ 1.55 US$ 1.72 7 10.6x 9.5x 11.9x 10.7x 10.9x 9.7xNewmont Mining Corporation NYSE:NEM C$ 44.93 533.2 US$ 17,533 US$ 2,970 US$ 3,273 US$ 4,049 US$ 18,309 US$ 3.84 US$ 4.12 7 8.6x 8.0x 8.9x 8.3x 6.3x 7.5xRandgold Resources Limited LSE:RRS C$ 118.19 94.0 US$ 8,129 US$ 516 US$ 678 US$ 3 US$ 7,453 US$ 5.32 US$ 5.69 6 16.2x 15.2x 14.9x 13.9x 13.6x 12.3xYamana Gold Inc. TSX:YRI C$ 3.61 948.0 US$ 2,505 US$ 168 US$ 77 US$ 1,574 US$ 4,001 US$ 0.53 US$ 0.77 15 5.0x 3.4x 8.0x 5.5x 6.2x 6.6x
Group Average - Senior Producers 9.5x 8.0x 10.0x 8.5x 8.2x 7.8xGroup Average - Senior Producers (excluding high/low) 9.3x 7.8x 9.9x 8.4x 8.2x 7.8x
Intermediate Precious Metals ProducersAcacia Mining plc LSE:ACA C$ 7.01 410.1 US$ 2,103 US$ 318 US$ 413 - US$ 1,690 US$ 1.01 US$ 0.93 7 5.1x 5.5x 4.1x 4.4x 4.2x 3.5xAlamos Gold Inc. TSX:AGI C$ 9.58 255.5 US$ 1,791 US$ 403 US$ 494 US$ 313 US$ 1,610 US$ 0.56 US$ 0.69 11 12.6x 10.1x 11.3x 9.1x 11.2x 9.4xB2Gold Corp. TSX:BTO C$ 3.39 973.2 US$ 2,414 US$ 145 US$ 101 US$ 473 US$ 2,786 US$ 0.20 US$ 0.49 12 12.4x 5.0x 14.3x 5.8x 8.7x 13.6xCentamin Plc LSE:CEY C$ 3.13 1150.0 US$ 2,631 US$ 400 US$ 509 - US$ 2,122 US$ 0.25 US$ 0.27 6 9.0x 8.6x 7.3x 7.0x 5.7x 6.0xCenterra Gold Inc. TSX:CG C$ 7.09 291.3 US$ 1,510 US$ 160.1 US$ 788.6 US$ 392.9 US$ 1,114.5 US$ 1.44 US$ 1.38 10 3.6x 3.8x 2.7x 2.8x 2.6x 2.3xDetour Gold Corporation TSX:DGC C$ 15.24 174.6 US$ 1,947 US$ 129 (US$ 159) - US$ 2,106 US$ 1.46 US$ 1.92 17 7.7x 5.8x 8.3x 6.3x 9.5x 8.3xEndeavour Mining Corporation TSX:EDV C$ 22.04 93.8 US$ 1,513 US$ 124.3 US$ 133.9 US$ 141.0 US$ 1,520.0 US$ 2.64 US$ 4.10 7 6.1x 3.9x 6.1x 4.0x 6.9x 5.9xGuyana Goldfields Inc. TSX:GUY C$ 6.57 171.1 US$ 823 US$ 103.9 US$ 111.4 US$ 58.8 US$ 770.3 US$ 0.52 US$ 0.74 6 9.3x 6.5x 8.7x 6.1x 8.9x 9.1xHarmony Gold Mining Company LimNYSE:HMY C$ 2.93 439.4 US$ 942 US$ 89 US$ 219 US$ 110 US$ 832 US$ 0.69 US$ 1.10 5 3.1x 1.9x 2.7x 1.7x 2.5x 2.3xHecla Mining Company NYSE:HL C$ 7.32 395.8 US$ 2,120 US$ 199 US$ 176 US$ 501 US$ 2,445 US$ 0.54 US$ 0.58 6 10.0x 9.2x 11.5x 10.6x 10.3x 10.8xIAMGOLD Corporation TSX:IMG C$ 5.46 464.6 US$ 1,856 US$ 652 US$ 817 US$ 485 US$ 1,524 US$ 0.62 US$ 0.67 14 6.4x 5.9x 5.3x 4.9x 4.7x 4.5xKirkland Lake Gold Ltd. TSX:KL C$ 9.32 206.4 US$ 1,408 US$ 234.9 US$ 92.3 US$ 0.0 US$ 1,315.5 US$ 1.21 US$ 1.43 9 5.6x 4.8x 5.3x 4.5x 8.8x 4.8xNew Gold Inc. TSX:NGD C$ 3.85 575.5 US$ 1,619 US$ 350 US$ 377 US$ 890 US$ 2,133 US$ 0.49 US$ 0.74 12 5.7x 3.8x 7.6x 5.0x 7.2x 6.3xOceanaGold Corporation TSX:OGC C$ 4.31 613.8 US$ 1,934 US$ 69 (US$ 52) - US$ 1,986 US$ 0.60 US$ 0.59 14 5.2x 5.4x 5.4x 5.5x 7.1x 4.8xPretium Resources Inc. TSX:PVG C$ 13.21 180.8 US$ 1,748 US$ 142 US$ 46 US$ 501 US$ 2,203 US$ 0.40 US$ 1.86 3 24.5x 5.2x 30.8x 6.6x - 36.3xSEMAFO Inc. TSX:SMF C$ 3.13 324.9 US$ 744 US$ 274 US$ 287 US$ 57 US$ 514 US$ 0.27 US$ 0.48 12 8.6x 4.8x 5.9x 3.3x 3.5x 5.4xTMAC Resources Inc. TSX:TMR C$ 14.78 83.9 US$ 908 US$ 47 US$ 53 US$ 86 US$ 940 US$ 0.85 US$ 1.73 5 12.8x 6.2x 13.2x 6.5x - 8.9xTorex Gold Resources Inc TSX:TXG C$ 23.09 79.7 US$ 1,348 US$ 104 US$ 125 US$ 388 US$ 1,611 US$ 2.25 US$ 2.43 8 7.5x 7.0x 9.0x 8.3x 10.5x 7.1x
Group Average - Intermediate Producers 8.6x 5.8x 8.9x 5.7x 7.0x 8.3xGroup Average - Intermediate Producers (excluding high/low) 8.0x 5.7x 7.9x 5.6x - 6.9x
Junior Precious Metals ProducersAlacer Gold Corp. TSX:ASR C$ 2.12 292.9 US$ 454 US$ 215 US$ 269 - US$ 185 US$ 0.28 US$ 0.26 8 5.5x 6.1x 2.2x 2.5x 5.1x 2.0xArgonaut Gold Inc. TSX:AR C$ 2.15 176.9 US$ 278 US$ 42.1 US$ 95.4 US$ 0.0 US$ 183.0 US$ 0.24 US$ 0.41 8 6.5x 3.9x 4.3x 2.5x 4.5x 4.0xAsanko Gold Inc. TSX:AKG C$ 3.24 203.3 US$ 482 US$ 59.7 US$ 72.3 US$ 154.5 US$ 564.2 US$ 0.45 US$ 0.57 7 5.3x 4.2x 6.2x 4.9x 7.9x 5.2xDundee Precious Metals Inc. TSX:DPM C$ 2.67 178.4 US$ 349 US$ 12 US$ 33 US$ 25 US$ 341 US$ 0.43 US$ 0.60 3 4.5x 3.2x 4.4x 3.2x 6.2x 5.0xGolden Star Resources Ltd. TSX:GSC C$ 0.95 376.2 US$ 262 US$ 21.8 US$ (60.5) US$ 88.6 US$ 410.6 US$ 0.15 US$ 0.25 6 4.8x 2.7x 7.5x 4.3x 28.6x 5.7xHighland Gold Mining Limited AIM:HGM C$ 2.58 325.2 US$ 614 US$ 8.7 US$ 34.1 US$ 164.6 US$ 744.5 US$ 0.42 US$ 0.44 2 4.5x 4.3x 5.5x 5.2x 5.6x 4.7xMcEwen Mining Inc. TSX:MUX C$ 3.95 299.6 US$ 866 US$ 44.2 US$ 58.0 US$ 0.0 US$ 808.0 - - 0 - - - - - -Primero Mining Corp. TSX:P C$ 0.63 190.9 US$ 88 US$ 19.9 US$ (3.2) US$ 52.5 US$ 143.7 US$ 0.18 US$ 0.35 10 2.6x 1.3x 4.3x 2.1x 4.1x 4.2xRichmont Mines Inc. TSX:RIC C$ 9.83 63.2 US$ 455 US$ 55.9 US$ 45.4 US$ 1.2 US$ 410.7 US$ 0.83 US$ 1.03 9 8.6x 7.0x 7.8x 6.3x 12.0x 8.2xRoxgold Inc. TSX:ROXG C$ 1.23 613.8 US$ 553 US$ 68.9 US$ 43.2 US$ 53.3 US$ 562.6 US$ 0.17 US$ 0.20 7 5.4x 4.5x 5.5x 4.6x 3.2x 3.3xTeranga Gold Corporation TSX:TGZ C$ 0.65 536.7 US$ 255 US$ 97.0 US$ 63.9 US$ 13.9 US$ 205.3 US$ 0.09 US$ 0.11 5 5.1x 4.3x 4.1x 3.5x 1.9x 3.8xTimmins Gold Corp. TSX:TMM C$ 0.52 355.6 US$ 135 US$ 33.9 US$ 37.8 US$ 0.0 US$ 97.6 US$ 0.05 US$ 0.05 9 7.2x 7.7x 5.2x 5.6x 2.4x 5.7xWesdome Gold Mines Ltd. TSX:WDO C$ 3.39 130.6 US$ 324 US$ 19.9 US$ 11.6 US$ 0.0 US$ 312.5 US$ 0.15 US$ 0.23 8 16.3x 11.0x 15.8x 10.6x 27.2x 13.4x
Group Average - Junior Producers 6.4x 5.0x 6.1x 4.6x 9.1x 5.4xGroup Average - Junior Producers (excluding high/low) 5.7x 4.8x 5.5x 4.2x 7.8x 5.0x
All data sourced from Capital IQ
P/CF Ratio EV/CF Ratio EV/EBITDA Ratio
The Weekly Dig 4/28/17
Haywood Mining [email protected] Page 22
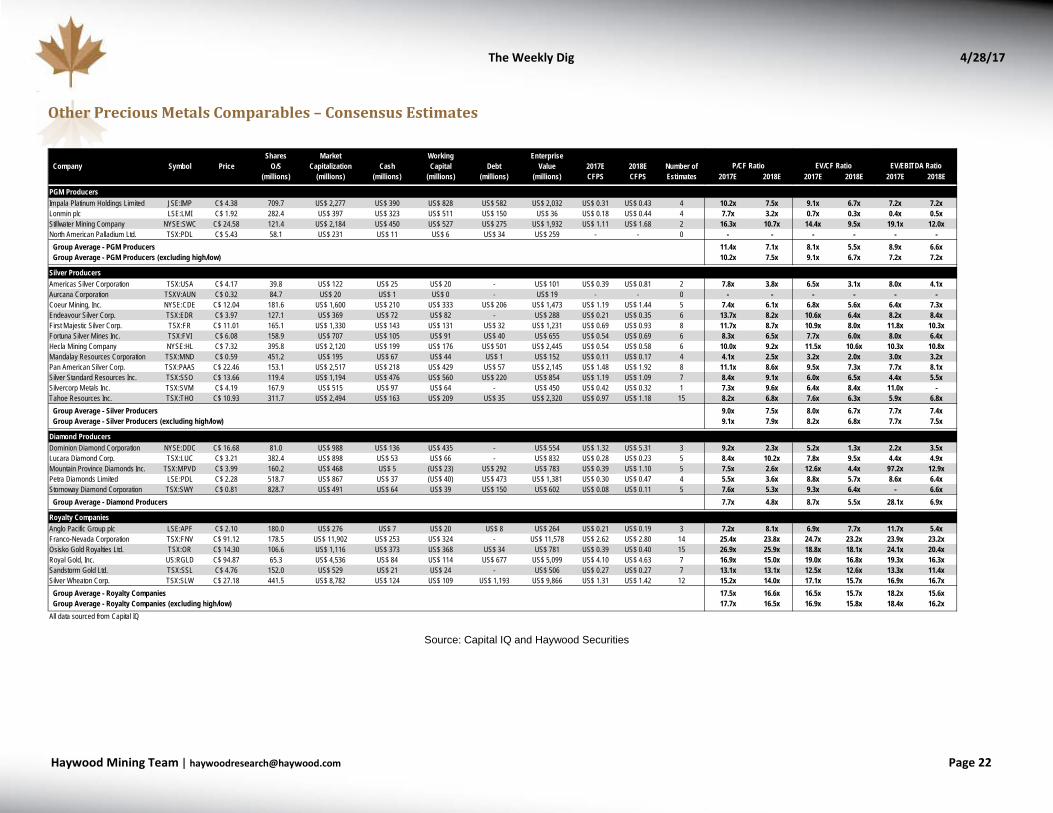
Other Precious Metals Comparables – Consensus Estimates
Source: Capital IQ and Haywood Securities
Shares Market Working EnterpriseCompany Symbol Price O/S Capitalization Cash Capital Debt Value 2017E 2018E Number of
(millions) (millions) (millions) (millions) (millions) (millions) CFPS CFPS Estimates 2017E 2018E 2017E 2018E 2017E 2018E
PGM ProducersImpala Platinum Holdings Limited JSE:IMP C$ 4.38 709.7 US$ 2,277 US$ 390 US$ 828 US$ 582 US$ 2,032 US$ 0.31 US$ 0.43 4 10.2x 7.5x 9.1x 6.7x 7.2x 7.2xLonmin plc LSE:LMI C$ 1.92 282.4 US$ 397 US$ 323 US$ 511 US$ 150 US$ 36 US$ 0.18 US$ 0.44 4 7.7x 3.2x 0.7x 0.3x 0.4x 0.5xStillwater Mining Company NYSE:SWC C$ 24.58 121.4 US$ 2,184 US$ 450 US$ 527 US$ 275 US$ 1,932 US$ 1.11 US$ 1.68 2 16.3x 10.7x 14.4x 9.5x 19.1x 12.0xNorth American Palladium Ltd. TSX:PDL C$ 5.43 58.1 US$ 231 US$ 11 US$ 6 US$ 34 US$ 259 - - 0 - - - - - -
Group Average - PGM Producers 11.4x 7.1x 8.1x 5.5x 8.9x 6.6xGroup Average - PGM Producers (excluding high/low) 10.2x 7.5x 9.1x 6.7x 7.2x 7.2x
Silver ProducersAmericas Silver Corporation TSX:USA C$ 4.17 39.8 US$ 122 US$ 25 US$ 20 - US$ 101 US$ 0.39 US$ 0.81 2 7.8x 3.8x 6.5x 3.1x 8.0x 4.1xAurcana Corporation TSXV:AUN C$ 0.32 84.7 US$ 20 US$ 1 US$ 0 - US$ 19 - - 0 - - - - - -Coeur Mining, Inc. NYSE:CDE C$ 12.04 181.6 US$ 1,600 US$ 210 US$ 333 US$ 206 US$ 1,473 US$ 1.19 US$ 1.44 5 7.4x 6.1x 6.8x 5.6x 6.4x 7.3xEndeavour Silver Corp. TSX:EDR C$ 3.97 127.1 US$ 369 US$ 72 US$ 82 - US$ 288 US$ 0.21 US$ 0.35 6 13.7x 8.2x 10.6x 6.4x 8.2x 8.4xFirst Majestic Silver Corp. TSX:FR C$ 11.01 165.1 US$ 1,330 US$ 143 US$ 131 US$ 32 US$ 1,231 US$ 0.69 US$ 0.93 8 11.7x 8.7x 10.9x 8.0x 11.8x 10.3xFortuna Silver Mines Inc. TSX:FVI C$ 6.08 158.9 US$ 707 US$ 105 US$ 91 US$ 40 US$ 655 US$ 0.54 US$ 0.69 6 8.3x 6.5x 7.7x 6.0x 8.0x 6.4xHecla Mining Company NYSE:HL C$ 7.32 395.8 US$ 2,120 US$ 199 US$ 176 US$ 501 US$ 2,445 US$ 0.54 US$ 0.58 6 10.0x 9.2x 11.5x 10.6x 10.3x 10.8xMandalay Resources Corporation TSX:MND C$ 0.59 451.2 US$ 195 US$ 67 US$ 44 US$ 1 US$ 152 US$ 0.11 US$ 0.17 4 4.1x 2.5x 3.2x 2.0x 3.0x 3.2xPan American Silver Corp. TSX:PAAS C$ 22.46 153.1 US$ 2,517 US$ 218 US$ 429 US$ 57 US$ 2,145 US$ 1.48 US$ 1.92 8 11.1x 8.6x 9.5x 7.3x 7.7x 8.1xSilver Standard Resources Inc. TSX:SSO C$ 13.66 119.4 US$ 1,194 US$ 476 US$ 560 US$ 220 US$ 854 US$ 1.19 US$ 1.09 7 8.4x 9.1x 6.0x 6.5x 4.4x 5.5xSilvercorp Metals Inc. TSX:SVM C$ 4.19 167.9 US$ 515 US$ 97 US$ 64 - US$ 450 US$ 0.42 US$ 0.32 1 7.3x 9.6x 6.4x 8.4x 11.0x -Tahoe Resources Inc. TSX:THO C$ 10.93 311.7 US$ 2,494 US$ 163 US$ 209 US$ 35 US$ 2,320 US$ 0.97 US$ 1.18 15 8.2x 6.8x 7.6x 6.3x 5.9x 6.8x
Group Average - Silver Producers 9.0x 7.5x 8.0x 6.7x 7.7x 7.4xGroup Average - Silver Producers (excluding high/low) 9.1x 7.9x 8.2x 6.8x 7.7x 7.5x
Diamond ProducersDominion Diamond Corporation NYSE:DDC C$ 16.68 81.0 US$ 988 US$ 136 US$ 435 - US$ 554 US$ 1.32 US$ 5.31 3 9.2x 2.3x 5.2x 1.3x 2.2x 3.5xLucara Diamond Corp. TSX:LUC C$ 3.21 382.4 US$ 898 US$ 53 US$ 66 - US$ 832 US$ 0.28 US$ 0.23 5 8.4x 10.2x 7.8x 9.5x 4.4x 4.9xMountain Province Diamonds Inc. TSX:MPVD C$ 3.99 160.2 US$ 468 US$ 5 (US$ 23) US$ 292 US$ 783 US$ 0.39 US$ 1.10 5 7.5x 2.6x 12.6x 4.4x 97.2x 12.9xPetra Diamonds Limited LSE:PDL C$ 2.28 518.7 US$ 867 US$ 37 (US$ 40) US$ 473 US$ 1,381 US$ 0.30 US$ 0.47 4 5.5x 3.6x 8.8x 5.7x 8.6x 6.4xStornoway Diamond Corporation TSX:SWY C$ 0.81 828.7 US$ 491 US$ 64 US$ 39 US$ 150 US$ 602 US$ 0.08 US$ 0.11 5 7.6x 5.3x 9.3x 6.4x - 6.6x
Group Average - Diamond Producers 7.7x 4.8x 8.7x 5.5x 28.1x 6.9x
Royalty CompaniesAnglo Pacific Group plc LSE:APF C$ 2.10 180.0 US$ 276 US$ 7 US$ 20 US$ 8 US$ 264 US$ 0.21 US$ 0.19 3 7.2x 8.1x 6.9x 7.7x 11.7x 5.4xFranco-Nevada Corporation TSX:FNV C$ 91.12 178.5 US$ 11,902 US$ 253 US$ 324 - US$ 11,578 US$ 2.62 US$ 2.80 14 25.4x 23.8x 24.7x 23.2x 23.9x 23.2xOsisko Gold Royalties Ltd. TSX:OR C$ 14.30 106.6 US$ 1,116 US$ 373 US$ 368 US$ 34 US$ 781 US$ 0.39 US$ 0.40 15 26.9x 25.9x 18.8x 18.1x 24.1x 20.4xRoyal Gold, Inc. US:RGLD C$ 94.87 65.3 US$ 4,536 US$ 84 US$ 114 US$ 677 US$ 5,099 US$ 4.10 US$ 4.63 7 16.9x 15.0x 19.0x 16.8x 19.3x 16.3xSandstorm Gold Ltd. TSX:SSL C$ 4.76 152.0 US$ 529 US$ 21 US$ 24 - US$ 506 US$ 0.27 US$ 0.27 7 13.1x 13.1x 12.5x 12.6x 13.3x 11.4xSilver Wheaton Corp. TSX:SLW C$ 27.18 441.5 US$ 8,782 US$ 124 US$ 109 US$ 1,193 US$ 9,866 US$ 1.31 US$ 1.42 12 15.2x 14.0x 17.1x 15.7x 16.9x 16.7x
Group Average - Royalty Companies 17.5x 16.6x 16.5x 15.7x 18.2x 15.6xGroup Average - Royalty Companies (excluding high/low) 17.7x 16.5x 16.9x 15.8x 18.4x 16.2x
All data sourced from Capital IQ
P/CF Ratio EV/CF Ratio EV/EBITDA Ratio

The Weekly Dig 4/28/17
Haywood Mining [email protected] Page 23
Base Metals Comparables – Consensus Estimates
Shares Market Working EnterpriseCompany Symbol Price O/S Capitalization Cash Capital Debt Value 2017E 2018E Number of
(millions) (millions) (millions) (millions) (millions) (millions) CFPS CFPS Estimates 2017E 2018E 2017E 2018E 2017E 2018E
Large-Cap Base Metals ProducersAnglo American plc LSE:AAL C$ 19.58 1399.9 US$ 20,045 US$ 6,070 US$ 5,924 US$ 11,320 US$ 25,441 US$ 4.71 US$ 4.69 8 3.0x 3.0x 3.9x 3.9x 4.4x 3.1xAntofagasta plc LSE:ANTO C$ 14.83 985.9 US$ 10,691 US$ 2,049 US$ 1,881 US$ 2,201 US$ 11,011 US$ 1.37 US$ 1.45 11 7.7x 7.3x 8.2x 7.7x 7.1x 5.6xBHP Billiton Limited ASX:BHP C$ 24.24 5322.4 US$ 94,349 US$ 14,090 US$ 9,502 US$ 30,670 US$ 115,517 US$ 3.23 US$ 3.27 3 5.5x 5.4x 6.7x 6.6x 9.7x 5.3xFirst Quantum Minerals Ltd. TSX:FM C$ 13.01 689.4 US$ 6,558 US$ 1,463 US$ 849 US$ 4,561 US$ 10,270 US$ 1.67 US$ 2.01 9 5.6x 4.7x 8.9x 7.4x 10.0x 8.9xFreeport-McMoRan Inc. NYSE:FCX C$ 17.44 1446.6 US$ 18,445 US$ 4,001 US$ 4,925 US$ 13,135 US$ 26,655 US$ 2.93 US$ 2.92 6 4.5x 4.5x 6.3x 6.3x 5.6x 5.0xGlencore Plc LSE:GLEN C$ 5.37 14250.3 US$ 55,998 US$ 2,642 US$ 45 US$ 22,862 US$ 78,815 US$ 0.69 US$ 0.71 9 5.6x 5.4x 8.1x 7.8x 8.1x 5.5xKGHM Polska Miedz Spólka Akcyjna WSE:KGH C$ 43.38 200.0 US$ 6,345 US$ 242 US$ 90 US$ 1,566 US$ 7,821 US$ 5.59 US$ 6.76 4 5.7x 4.7x 7.0x 5.8x 7.0x 5.2xRio Tinto plc LSE:RIO C$ 54.19 1797.2 US$ 71,214 US$ 8,536 US$ 5,686 US$ 17,405 US$ 82,933 US$ 7.49 US$ 6.34 7 5.2x 6.2x 6.2x 7.3x 6.3x 4.6xTeck Resources Limited TSX:TECK.B C$ 28.32 576.1 US$ 11,934 US$ 402 US$ 1,289 US$ 5,103 US$ 15,748 US$ 6.30 US$ 4.68 5 3.3x 4.4x 4.3x 5.8x 6.1x 3.6xVale S.A. NYSE:VALE C$ 11.74 5153.4 US$ 42,659 US$ 8,937 US$ 10,627 US$ 27,237 US$ 59,270 US$ 2.23 US$ 1.78 7 3.8x 4.7x 5.2x 6.4x 5.3x 3.8x
Group Average - Large-Cap Producers 5.0x 5.0x 6.5x 6.5x 6.9x 5.1xGroup Average - Large-Cap Producers (excluding high/low) 4.9x 5.0x 6.5x 6.7x 6.9x 4.8x
Mid Tier Base Metals ProducersCapstone Mining Corp TSX:CS C$ 1.06 391.3 US$ 303 US$ 109 US$ 148 US$ 305 US$ 460 US$ 0.31 US$ 0.35 8 2.1x 1.9x 3.8x 3.3x 3.1x 3.2xCliffs Natural Resources Inc. NYSE:CLF C$ 9.19 296.4 US$ 1,992 US$ 295 US$ 504 US$ 1,643 US$ 3,131 US$ 1.68 US$ 0.94 1 4.0x 7.2x 6.3x 11.2x 9.2x 5.0xHudbay Minerals Inc. TSX:HBM C$ 8.15 237.3 US$ 1,414 US$ 147 US$ 122 US$ 1,216 US$ 2,508 US$ 1.96 US$ 2.10 11 3.0x 2.8x 5.4x 5.0x 5.7x 4.2xImperial Metals Corporation TSX:III C$ 6.07 93.6 US$ 415 US$ 11 (US$ 66) US$ 598 US$ 1,080 US$ 1.04 US$ 1.43 1 4.3x 3.1x 11.1x 8.1x 14.0x 9.3xKAZ Minerals plc LSE:KAZ C$ 8.91 446.5 US$ 2,909 US$ 1,108 US$ 866 US$ 3,446 US$ 5,489 US$ 1.02 US$ 1.44 6 6.2x 4.4x 12.0x 8.5x 17.7x 7.1xLundin Mining Corporation TSX:LUN C$ 7.28 726.7 US$ 3,869 US$ 929 US$ 2,127 US$ 983 US$ 2,725 US$ 1.04 US$ 0.92 7 5.0x 5.6x 3.6x 4.1x 4.6x 3.0xMMG Limited HKSE:1208 C$ 0.47 7947.0 US$ 2,718 US$ 553 US$ 422 US$ 9,516 US$ 11,812 US$ 0.20 US$ 0.16 1 1.7x 2.1x 7.6x 9.6x 14.4x 5.3xNevsun Resources Ltd. TSX:NSU C$ 3.03 301.9 US$ 669 US$ 199 US$ 201 - US$ 468 US$ 0.21 US$ 0.29 6 10.5x 7.8x 7.3x 5.4x 4.5x 6.5xNyrstar NV ENXTBR:NYR C$ 7.75 93.6 US$ 530 US$ 142 (US$ 411) US$ 596 US$ 1,537 US$ 2.49 US$ 2.22 3 2.2x 2.5x 6.6x 7.4x 7.4x 4.6xOZ Minerals Limited ASX:OZL C$ 7.24 298.7 US$ 1,580 US$ 474 US$ 556 - US$ 1,024 US$ 1.04 US$ 0.92 3 5.0x 5.7x 3.3x 3.7x 3.5x 3.2xSherritt International Corporation TSX:S C$ 0.90 294.3 US$ 194 US$ 230 US$ 368 US$ 1,627 US$ 1,452 US$ 0.12 US$ 0.15 2 5.3x 4.2x 42.1x 33.2x 86.3x 6.8xTurquoise Hill Resources Ltd. TSX:TRQ C$ 3.72 2012.3 US$ 5,474 US$ 1,418 US$ 2,434 US$ 4,126 US$ 7,166 - (US$ 0.01) 3 - - - - 19.2x 85.1xVedanta Resources plc LSE:VED C$ 12.24 285.9 US$ 2,558 US$ 8,167 US$ 1,358 US$ 12,022 US$ 13,223 US$ 12.46 - 1 0.7x - 3.7x - 5.7x 4.2xWestern Areas Ltd ASX:WSA C$ 2.27 272.3 US$ 452 US$ 75 US$ 87 - US$ 365 US$ 0.21 US$ 0.25 6 7.5x 6.4x 6.3x 5.4x 13.6x 7.3x
Group Average - Mid Tier Producers 4.4x 4.5x 9.2x 8.7x 14.9x 11.1xGroup Average - Mid Tier Producers (excluding high/low) 3.9x 3.8x 6.4x 6.0x 10.0x 5.6x
Small Cap Base Metals ProducersAmerigo Resources Ltd. TSX:ARG C$ 0.62 175.4 US$ 80 US$ 16 US$ 1 US$ 59 US$ 138 US$ 0.13 - 1 3.5x - 6.1x - 38.4x 7.7xAtalaya Mining plc AIM:ATYM C$ 2.50 116.7 US$ 214 US$ 2 (US$ 27) - US$ 240 US$ 0.15 US$ 0.35 2 12.1x 5.3x 13.7x 5.9x 19.5x 4.9xCopper Mountain Mining Corporation TSX:CMMC C$ 0.90 132.7 US$ 87 US$ 23 (US$ 5) US$ 231 US$ 324 US$ 0.31 US$ 0.50 3 2.2x 1.3x 7.9x 4.8x 9.3x 6.4xTaseko Mines Limited TSX:TKO C$ 1.53 224.1 US$ 251 US$ 67 US$ 82 US$ 269 US$ 437 US$ 0.40 US$ 0.27 4 2.8x 4.2x 4.9x 7.3x 32.3x 4.8xTrevali Mining Corporation TSX:TV C$ 1.22 403.6 US$ 361 US$ 12 US$ 8 US$ 43 US$ 397 US$ 0.22 US$ 0.31 3 4.0x 2.8x 4.5x 3.2x 8.8x 1.9x
Group Average - Small Cap Producers 4.9x 3.4x 7.4x 5.3x 21.6x 5.1xGroup Average - Small Cap Producers (excluding high/low) 3.4x 2.8x 6.3x 4.7x 20.3x 5.4x
All data sourced from Capital IQ
P/CF Ratio EV/CF Ratio EV/EBITDA Ratio

The Weekly Dig 4/28/17
Haywood Mining [email protected] Page 24
Iron Comparables – Consensus Estimates
Bloomberg Shares Market Daily Enterprise
Company (T icker) Share PriceConsensus
TargetImplied Return β
Outstanding (millions)
Capitalization (millions)
Volume (millions)
Weekly Liquidity WACC
Debt (millions)
Value (millions) 2017 2018 2019 2017 2018 2019 2017 2018 2019 2017 2018 2019
Diversified Mining HousesVALE SA (VALE3-BZ) R$ 27.47 R$ 45.00 63.8% 1.60 3,217 R$ 141,609 5.8 0.9% 14.9% R$ 95,563 R$ 218,880 7.12 5.43 5.41 3.9x 5.1x 5.1x 6.6x 8.8x 8.4x 4.3x 5.4x 5.2xBHP BILLITON (BHP-AU) A$ 23.72 A$ 27.70 16.8% 1.57 3,212 A$ 119,094 9.9 1.4% 11.1% A$ 36,421 A$ 115,017 4.16 3.96 3.84 5.7x 6.0x 6.2x 11.9x 13.4x 15.2x 5.2x 5.7x 5.8xRIO TINTO (RIO-AU) A$ 60.44 A$ 70.24 16.2% 1.19 424 A$ 98,334 2.8 3.2% 10.7% A$ 17,630 A$ 89,171 10.25 8.36 8.63 5.9x 7.2x 7.0x 9.7x 13.2x 13.2x 4.9x 5.9x 5.8xGroup Average - Diversifed Mining Avg. -> 5.2x 6.1x 6.1x 9.4x 11.8x 12.2x 4.8x 5.6x 5.6x
ProducersKUMBA IRON (KIO-SJE) ZAR 17,406 ZAR 18,500 6.3% 1.94 322 ZAR 56,062 0.9 1.7% 12.7% ZAR 4,500 ZAR 58,583 4364 2953 2534 4.0x 5.9x 6.9x 6.3x 9.9x 12.0x 3.0x 4.5x 5.1xFORTESCUE METALS (FMG-AU) A$ 5.31 A$ 6.21 16.9% 1.61 3,114 A$ 16,534 25.7 4.1% 11.3% A$ 6,771 A$ 16,392 1.69 1.09 1.16 3.2x 4.9x 4.6x 5.1x 7.9x 10.1x 3.1x 4.3x 5.0xCLIFFS NATURAL (CLF-US) US$ 6.72 US$ 8.17 21.5% 2.07 296 US$ 1,992 21.3 39.7% 11.7% US$ 2,231 US$ 3,467 4.5x 7.1x 18.7x 5.1x 6.6x 9.1xMMX MINERACAO (MMXM3-BRZ) R$ 4.84 0.63 6 R$ 31 0.0 0.4% 13.1% R$ 134 R$ 161 FERREXPO PLC (FXPO-LSE) GBp 158 GBp 167.00 5.6% 1.42 589 GBp 931 5.0 3.7% 10.6% GBp 734 GBp 1,793 55.36 38.38 42.69 2.9x 4.1x 3.7x 3.5x 6.0x 7.6x 3.6x 5.5x 6.2xMOUNT GIBSON (MGX-AU) A$ 0.36 A$ 0.49 37.0% 0.88 1,097 A$ 395 4.3 0.8% 9.1% A$ 0 A$(52) 0.06 0.02 0.04 6.4x 16.4x 8.8x 7.7x 16.4x 32.7xGRANGE RESOURCES (GRR-AU) A$ 0.17 0.74 1,157 A$ 191 2.3 0.4% 7.8% A$ 9 A$ 34 BC IRON (BCI-AU) A$ 0.14 A$ 0.34 142.9% 1.88 393 A$ 55 3.4 3.0% 16.6% A$ 2 A$ 23 Group Average - Producers Avg. -> 4.1x 7.8x 6.0x 5.4x 9.4x 16.2x 3.7x 5.2x 6.4x
Advanced Development / Exploration (Select Group)SUNDANCE RESOURCES (SDL-AU) A$ 0.00 1.05 7,102 A$ 28.4 31.4 0.3% 3.4% A$ 97 A$ 105 NEW MILLENNIUM (NML-T) C$ 0.13 1.28 181 C$ 23.5 0.6 0.7% 14.3% C$ 0 C$ 10 ZANAGA IRON (ZIOC-LSE) GBp 6 0.10 279 GBp 17.5 0.2 0.7% 4.6% GBp 0 GBp 17 CENTURY GLOBAL (CNT-T) C$ 0.21 98 C$ 20.7 0.0 0.0% 11.5% C$ 0 C$ 7 CHAMPION IRON (CIA-T) C$ 1.02 1.23 387 C$ 394.7 1.3 0.4% 13.6% C$ 0 C$ 381 BLACK IRON (BKI-T) C$ 0.10 (0.36) 160 C$ 15.2 1.0 0.3% -2.0% C$ 0 C$ 6 OCEANIC IRON (FEO-T) C$ 0.17 0.50 50 C$ 8.5 0.1 0.2% 6.4% C$ 2 C$ 8 MACARTHUR MINERALS (MMS-T) C$ 0.10 0.87 140 C$ 14.0 1.5 1.0% 12.4% C$ 0 C$ 13 Group Average - Developers / Explorers Avg. ->All data sourced from Bloomberg
EV/EBITDAP/EPSCFPS (LoC) P/CFPS

The Weekly Dig 4/28/17
Haywood Mining [email protected] Page 25
Uranium Comparables – Consensus Estimates
IBES Shares Market Enterprise Total Reserves IBESCompany (T icker)Haywood Covered Names bold
Share Price
Consensus Target
Implied Return
Outst. (millions)
Capitalization (millions)
Value (USD)(millions)
& Resources (M lb)
USD EV/lb Resource
Consensus NAV
Price / Nav 2016 2017 2018 2016 2017 2018 2016 2017 2018 2016 2017 2018
Cameco Corporation (CCO-T) $13.09 $16.54 26% 396 $5,181 $4,646 $16.75 0.78x $0.98 $1.28 $1.71 13.4x 10.2x 7.7x $0.44 $0.46 $0.89 29.8x 28.4x 14.7xPaladin Energy (PDN-T) $0.11 $0.06 (46)% 1,713 $188.4 $482.1 $0.11 0.97x $0.01 ($0.01) $0.00 16.5x 33.0x ($0.02) ($0.02)Uranium Energy (UEC-US) $1.24 $2.80 126% 138 $170.8 $162.8 $2.29 0.54x ($0.16) ($0.11) ($0.07) ($0.16) ($0.12) ($0.11)Energy Fuels (UUUU-US) $1.75 $4.27 144% 70 $122.7 $138.2 $4.33 0.40x $0.05 ($0.28) $0.17 35.0x 10.3x ($0.51) ($0.36) ($0.11)UR-Energy Inc. (URE-T) $0.78 $2.08 166% 146 $113.8 $105.2 $2.27 0.34x $0.03 $0.06 $0.03 29.6x 13.7x 28.9x ($0.03) $0.06 $0.03 12.5x 25.2xPeninsula Energy (PEN-AU) $0.35 $1.15 233% 229 $79.0 $83.0 $1.16 0.30x ($0.03) $0.03 11.4x ($0.07) ($0.05) $0.04 9.6xEnergy Resources (ERA-AU) $0.60 $0.08 (87)% 518 $310.6 ($63.5) $0.60 1.00x $0.02 ($0.05) 30.0x ($0.26) ($0.06) ($0.02)Group Average - Producers 0.62x 24.9x 12.0x 18.2x 29.8x 20.4x 16.5x
NexGen Energy (NXE-T) $2.95 $4.73 60% 307 $904 $662.2 $4.88 0.61x ($0.04) ($0.02) ($0.02) ($0.06) ($0.04) ($0.04)Denison Mines (DML-T) $0.70 $1.02 46% 559 $391.3 $274.8 $1.05 0.67x ($0.02) ($0.02) ($0.02) ($0.02) ($0.02) ($0.01)Fission Uranium (FCU-T) $0.62 $1.75 182% 485 $300.5 $183.0 $1.96 0.32x ($0.02) ($0.01) ($0.01) ($0.02) ($0.01) ($0.01)Berkeley Energia (BKY-AU) $0.70 $1.10 58% 254 $176.9 $99.9 ($0.03) ($0.05) ($0.09) ($0.03) ($0.07) $0.05 13.0xSummit Resources (SMM-AU) $0.38 218 $82.8 $60.8UEX Corporation (UEX-T) $0.23 $0.55 139% 319 $73.4 $50.7 $0.53 0.43x ($0.03) ($0.02) ($0.02) ($0.03) ($0.02) ($0.02)Toro Energy (TOE-AU) $0.04 $0.07 89% 2,008 $74.3 $59.4 $0.09 0.41xVimy Resources (VMY-AU) $0.20 $0.46 130% 317 $63.4 $48.7 $0.48 0.42x ($0.02) ($0.02) ($0.01) ($0.05) ($0.03) ($0.01)GoviEx Uranium (GXU-V) $0.20 321 $64.3 $49.6A-Cap Resources (ACB-AU) $0.06 872 $51.4 $33.8Deep Yellow (DYL-AU) $0.28 130 $35.6 $24.8Western Uranium (WUC-L) $1.61 20 $31.5 $22.9Energy Metals (EME-AU) $0.10 210 $21.0 $0.3Group Average - Developers 0.48x 13.0x
Mega Uranium (MGA-T) $0.17 286 $48.6 $34.8Aurania Resources (ARU-V) $2.12 23 $48.3 $35.6Laramide Resources (LAM-T) $0.51 $0.75 47% 115 $58.6 $43.3 $0.93 0.55xBannerman Resources (BMN-AU) $0.05 850 $38.2 $25.2Plateau Uranium (PLU-V) $0.55 58 $31.9 $22.5Kivalliq Energy (KIV-V) $0.09 $0.15 67% 247 $22.2 $15.9 $0.16 0.56xGlobex Mining (GMX-T) $0.54 $1.00 85% 49 $26.5 $18.4Skyharbour Resources (SYH-V) $0.46 52 $23.9 $16.1Forsys Metals (FSY-T) $0.14 146 $19.7 $14.0Fission 3.0 (FUU-V) $0.09 196 $16.6 $11.6Purepoint Uranium (PTU-V) $0.08 189 $15.1 $9.6Blue Sky (BSK-V) $0.29 49 $13.9 $9.1Cauldron Energy (CXU-AU) $0.05 329 $16.5 $8.4Azimut Exploration (AZM-V) $0.27 45 $12.3 $7.1Melkior Resources (MKR-V) $0.07 141 $9.9 $6.9CanAlaska Uranium (CVV-V) $0.45 27 $12.2 $7.4enCore Energy (:EU-V) $0.08 111 $8.4 $6.0U3O8 Corp. (UWE-T) $0.03 345 $10.4 $7.5Zadar Ventures (ZAD-V) $0.11 88 $9.2 $6.6Anfield Resources (ARY-V) $0.07 109 $7.7 $4.9Avrupa Minerals (AVU-V) $0.10 77 $7.7 $4.9Uracan Resources (URC-V) $0.05 106 $5.3 $3.9Pele Mountain (GEM-V) $0.02 210 $4.2 $3.0Tajiri Resources (TAJ-V) $0.12 51 $6.1 $3.8Marenica Energy (MEY-AU) $0.11 36 $3.8 $4.092 Resources (NTY-V) $0.10 56 $5.3 $3.1Benton Resources (BEX-V) $0.10 79 $7.9 $3.8X-Terra Resources (XTT-V) $0.25 18 $4.4 $3.0Forum Uranium (FDC-V) $0.07 75 $5.3 $2.5Aben Resources (ABN-V) $0.13 31 $4.0 $2.5Uravan Minerals (UVN-V) $0.08 42 $3.4 $2.2Montero Mining (MON-V) $0.02 85 $1.7 $1.7Eros Resources (ERC-V) $0.18 42 $7.5 $2.7Tarku Resources (TKU-V) $0.07 37 $2.4 $1.7Roughrider Exploration (REL-V) $0.09 37 $3.3 $2.1Spruce Ridge (SHL-V) $0.02 73 $1.5 $1.2Aldever Resources (ALD-V) $0.06 40 $2.4 $1.6IsoEnergy Ltd. (ISO-V) $1.01 15 $14.7Elysee Development (ELC-V) $0.44 22 $9.6 ($1.8)Group Average - Explorers 0.56x
INVENTORY FUNDSUranium Participation (U-T) $3.92 $5.40 38% 121 $473.73 $342.7 15.5 $22.11 $5.64 0.70x
All data sourced from S&P Capital IQ, SNL Financial, Bloomberg
EPS (LoC) P/EPS
PROD
UCER
SDE
VELO
PERS
EXPL
ORER
S
CFPS (LoC) P/CFPSEarnings CompsConsensus Targets In-Situ Comps - EV/lb U3O8 NAV Comps Cash Flow Comps

The Weekly Dig 4/28/17
Haywood Mining [email protected] Page 26
Coal Comparables – Consensus Estimates
Large Cap USA Bloomberg Shares Market Daily Enterprise
Company (T icker) Share PriceConsensus
TargetImplied Return β
Outstanding (millions)
Capitalization (millions)
Volume (millions)
Weekly Liquidity WACC
Debt (millions)
Value (millions) 2015 2016 2017 2015 2016 2017 2015 2016 2017 2015 2016 2017
Large Cap USACONSOL ENERGY (CNX-US) US$ 15.18 US$ 21.64 42.5% 1.69 230 US$ 3,492 3.6 7.3% 10.1% US$ 2,774 US$ 6,348 2.90 3.97 4.73 5.2x 3.8x 3.2x 28.4x 17.8x 13.4x 6.9x 5.7x 5.1xFORESIGHT ENERGY (FELP-US) US$ 5.21 US$ 7.00 34.4% 1.72 66 US$ 683 0.1 0.3% 7.7% US$ 1,391 US$ 1,970 91.4x 9.6x 10.7x 7.4xCORSA COAL (CSO-V) C$ 1.85 C$ 4.25 129.7% 1.56 95 C$ 175 0.1 0.1% 14.5% C$ 43 C$ 179 1.8x 1.7x 2.3x 2.7x 2.4x 2.6xWESTMORELAND COAL (WLB-US) C$ 10.66 C$ 18.33 72.0% 1.06 19 C$ 198 0.3 6.5% 5.3% C$ 1,109 C$ 1,245 9.25 5.30 6.36 1.2x 2.0x 1.7x 20.8x 4.2x 5.1x 4.8xWALTER ENERGY (WLT-US) US$ 0.07 1.24 81 US$ 5 0.2 0.7% 10.8% US$ 3,136 US$- 177CLOUD PEAK (CLD-US) US$ 3.37 US$ 5.22 54.9% 1.66 75 US$ 253 2.0 13.9% 8.1% US$ 483 US$ 570 0.74 0.84 0.91 4.6x 4.0x 3.7x 5.4x 5.6x 5.6xGroup Average - Large Cap USA Avg. -> 3.7x 3.3x 2.9x 29.5x 9.5x 9.1x 5.0x 5.2x 4.5x
Limitied PartnershipsALLIANCE RESOURCE (ARLP-US) US$ 21.25 US$ 27.67 30.2% 1.16 75 US$ 1,585 0.3 1.8% 8.4% US$ 662 US$ 2,213 7.7x 8.9x 8.7x 3.7x 3.8x 3.7xNATURAL RESOURCE (NRP-US) US$ 31.95 US$ 37.67 17.9% 1.26 12 US$ 391 0.1 2.1% 5.8% US$ 1,126 US$ 1,473 5.3x 5.4x 4.7x 7.1x 7.1x 7.2xGroup Average - Limited Partnerships Avg. -> 6.5x 7.1x 6.7x 5.4x 5.5x 5.4x
Large Cap Non-North AmericaNEW HOPE (NHC-AU) A$ 1.68 A$ 2.00 19.0% 0.82 831 A$ 1,396 0.2 0.0% 8.7% A$ 15 A$ 1,259 0.32 0.32 0.22 5.3x 5.3x 7.6x 10.3x 8.7x 11.0x 4.3x 4.0x 4.7xWHITEHAVEN COAL (WHC-AU) A$ 2.74 A$ 3.18 15.9% 1.78 1,026 A$ 2,811 8.0 3.6% 13.0% A$ 961 A$ 3,440 0.62 0.64 0.53 4.4x 4.3x 5.2x 6.8x 7.6x 9.4x 4.5x 5.0x 5.8xBANPU PUBLIC (BANPU-SET) ฿ 19.20 ฿ 22.81 18.8% 1.53 5,061 ฿ 97,164 57.9 11.1% 6.7% ฿ 114,111 ฿ 213,699 2.83 2.86 2.93 6.8x 6.7x 6.6x 10.1x 10.3x 8.9x 9.1x 9.7x 8.9xCHINA COAL (1898-HK) HK$ 3.78 HK$ 4.71 24.5% 1.31 4,107 HK$ 75,676 13.5 1.5% 5.2% HK$ 98,178 HK$ 162,259 0.86 1.00 1.01 3.9x 3.3x 3.3x 10.3x 11.0x 12.0x 8.7x 9.2x 9.8xCHINA SHENHUA (1088-HK) HK$ 18.14 HK$ 18.90 4.2% 1.34 3,399 HK$ 424,255 23.3 3.2% 7.1% HK$ 105,981 HK$ 469,888 3.29 3.10 3.35 4.9x 5.2x 4.8x 10.3x 10.8x 11.0x 5.7x 5.9x 5.9xCOAL OF (CZA-AU) A$ 0.06 2,216 A$ 131 0.0 0.0% 10.1% A$ 0 A$ 91NINE ENTERTAINMENT (NEC-AU) A$ 1.23 A$ 1.15 (6.7)% 1.06 871 A$ 1,072 4.5 2.3% 8.8% A$ 220 A$ 1,249 0.10 0.17 0.15 12.2x 7.4x 8.5x 11.0x 10.9x 11.9x 7.0x 7.1x 7.7xYANZHOU COAL (1171-HK) HK$ 6.73 HK$ 7.82 16.2% 1.47 1,952 HK$ 52,616 15.7 2.3% 4.5% HK$ 63,250 HK$ 110,521 2.05 1.79 1.96 2.9x 3.3x 3.0x 6.2x 8.3x 5.7x 9.2x 10.7x 10.1xGroup Average - Large Cap Non-North-America Avg. -> 5.8x 5.1x 5.6x 9.3x 9.6x 10.0x 5.9x 7.4x 7.6x
Developer/ExplorersEAST ENERGY (EER-AU) A$ 0.01 356 A$ 2.5 0.0 0.0% 4.2% A$ 23 A$ 26FORTUNE MINERALS (FT -T) C$ 0.21 C$ 0.35 70.7% 0.76 297 C$ 60.8 1.8 1.0% 8.1% C$ 5 C$ 65JAMESON RESOURCES (JAL-AU) A$ 0.10 0.64 223 A$ 21.2 0.1 0.3% 7.3% A$ 0 A$ 19Group Average - Developers / Explorers Avg. ->
Sundry CompaniesADARO ENERGY (ADRO-JKSE) ¥ 1,775 ¥ 2,041 15.0% 1.74 31,986 ¥ 56,775,083 28.8 0.5% 12.1% ¥ 1,434 ¥ 5,128 0.02 0.02 0.02 6.1x 6.1x 5.5x 10.2x 11.1x 9.5x 5.0x 4.7x 4.5xNLC INDIA (NEYVELILIG-NSEI) रू 105.30 रू 122.00 15.9% 0.82 1,678 रू 176,663 0.5 0.1% 9.2% रू 83,844 रू 230,728SOUTHGOBI RESOURCES (SGQ-T) C$ 0.33 0.87 273 C$ 89 0.0 0.0% 4.4% C$ 118 C$ 182TAMBANG BATUBARA (PTBA-JKSE) ¥ 12,675 ¥ 15,532 22.5% 1.38 2,304 ¥ 29,204,871 3.3 0.8% 12.1% ¥ 2,368,524 ¥ 28,029,776 1458.01 1502.45 1864.26 8.7x 8.4x 6.8x 9.5x 9.5x 7.4x 7.0x 6.8x 5.1xGroup Average - Sundry Companies Avg. -> 7.4x 7.2x 6.2x 8.8x 9.7x 8.4x 6.0x 6.2x 4.8xAll data sourced from Bloomberg
EV/EBITDAP/EPSCFPS (LoC) P/CFPS

The Weekly Dig 4/28/17
Haywood Mining [email protected] Page 27
Senior/Intermediate Gold Producers – EV/oz Comparables
Symbol Reserves
Agnico Eagle Mines Limited NYSE:AEM US $10,938 US $1,073 US $10,943 53.4 1.95 59.2 2.17 90% 19.1 2.37 20.4 2.54 93% US $574 34.3 1.78 38.8 2.01 88% 54% US $205 US $185AngloGold Ashanti Limited JSE:ANG US $4,624 US $406 US $6,362 208.7 1.23 234.3 1.38 89% 51.9 0.80 55.2 0.86 94% US $123 157.0 1.55 179.3 1.77 88% 32% US $30 US $27B2Gold Corp. TSX:BTO US $2,441 US $101 US $2,813 23.2 0.75 28.7 0.93 81% 7.5 1.38 7.5 1.38 100% US $377 15.7 0.62 21.2 0.84 74% 47% US $121 US $98Barrick Gold Corporation TSX:ABX US $19,457 US $5,190 US $21,938 199.0 0.80 311.4 1.25 64% 102.3 1.13 138.6 1.53 74% US $214 96.7 0.61 172.8 1.10 56% 33% US $110 US $70Compañía de Minas Buenaventura S.A.A. NYSE:BVN US $3,050 US $40 US $3,200 20.2 0.22 85.0 0.92 24% 3.6 0.11 23.6 0.72 15% US $890 16.4 0.28 61.2 1.03 27% 35% US $159 US $38Detour Gold Corporation TSX:DGC US $2,202 US ($165) US $2,368 21.4 0.98 21.4 0.98 100% 16.4 0.99 16.4 0.99 100% US $144 5.0 0.96 5.0 0.96 100% 22% US $111 US $111Eldorado Gold Corporation TSX:ELD US $2,611 US $994 US $2,209 37.4 0.76 52.4 1.07 71% 20.6 1.10 28.2 1.51 73% US $107 16.9 0.56 24.3 0.80 70% 59% US $59 US $42Gold Fields Limited JSE:GFI US $2,689 US $193 US $4,061 111.3 2.09 129.5 2.43 86% 48.0 2.78 49.1 2.84 98% US $85 63.3 1.76 80.4 2.24 79% 44% US $36 US $31Goldcorp Inc. TSX:G US $11,897 US $404 US $13,820 113.6 0.77 185.7 1.25 61% 42.3 0.71 82.3 1.38 51% US $327 71.2 0.80 103.5 1.17 69% 35% US $122 US $74Harmony Gold Mining Company Limited JSE:HAR US $954 US $225 US $838 81.2 1.04 109.6 1.40 74% 23.7 0.66 34.9 0.98 68% US $35 57.5 1.35 73.8 1.74 78% 36% US $10 US $8IAMGOLD Corporation TSX:IMG US $1,916 US $817 US $1,584 33.4 1.22 33.4 1.22 100% 8.8 1.39 8.8 1.39 100% US $180 24.6 1.17 24.6 1.17 100% 33% US $47 US $47Kinross Gold Corporation TSX:K US $4,331 US $1,443 US $4,621 67.1 0.70 73.4 0.77 91% 33.2 0.71 36.7 0.79 90% US $139 33.9 0.70 36.7 0.75 92% 15% US $69 US $63New Gold Inc. TSX:NGD US $1,629 US $377 US $2,142 23.5 0.76 30.6 0.99 77% 15.0 0.78 18.4 0.96 81% US $143 8.5 0.72 12.2 1.03 70% 22% US $91 US $70Newmont Mining Corporation NYSE:NEM US $18,029 US $3,273 US $18,809 122.6 0.72 161.0 0.95 76% 71.3 0.82 79.0 0.90 90% US $264 51.3 0.62 82.0 0.99 63% 34% US $153 US $117Randgold Resources Limited LSE:RRS US $8,277 US $678 US $7,601 27.9 3.31 27.9 3.31 100% 14.8 3.69 14.8 3.69 100% US $515 13.1 2.96 13.1 2.96 100% 51% US $273 US $273Tahoe Resources Inc. TSX:THO US $2,521 US $209 US $2,363 18.9 0.66 31.1 1.08 61% 4.5 0.48 11.3 1.21 40% US $529 14.4 0.74 19.8 1.02 73% 56% US $125 US $76Yamana Gold Inc. TSX:YRI US $2,544 US $77 US $4,081 64.5 0.55 118.7 1.01 54% 22.3 0.41 53.9 1.00 41% US $183 42.2 0.67 64.8 1.03 65% 39% US $63 US $34Group Average - Total # Companies: 17 US $284 US $105 US $80Equivalency assumptions (US$ / 04-28-17): $1,268/oz Au, $17.24/oz Ag, $947/oz Pt, $826/oz Pd, $2.59/lb Cu, $1.19/lb Zn, $1.04/lb Pb, $4.27/lb Ni, $9.00/lb Mo, $24.95/lb Co, $8,925/t Sb, $22.75/lb U3O8, $0.20/lb Sn, $93.00/t HCC, $69.97/t 62% FeSource: SNL Financial retrieved on April 28, 2017
EV/ozAu
Resources (M&I and Inferred) GlobalAu
(Moz)Au(g/t)
AuEq(Moz)
AuEq(g/t)
% Au % AuInferred
EV/ozAu
EV/ozAuEq
ReservesAu
(Moz)Au(g/t)
AuEq(Moz)
AuEq(g/t)
% Au
MarketCapitalization
(millions)
WorkingCapital
(millions)
EnterpriseValue
(millions)
Global Reserves & ResourcesAu
(Moz)Au(g/t)
AuEq(Moz)
AuEq(g/t)
% Au
Reserves
Alamos Gold Inc. TSX:AGI US $2,136 US $355 US $2,083 21.7 1.20 22.3 1.23 97% 5.9 1.67 5.9 1.67 100% US $354 15.9 1.08 16.4 1.12 96% 30% US $96 US $93Argonaut Gold Inc. TSX:AR US $285 US $95 US $189 9.3 0.67 9.9 0.71 95% 3.3 0.82 3.3 0.82 100% US $57 6.0 0.61 6.5 0.67 92% 23% US $20 US $19Centamin Plc LSE:CEY US $2,633 US $509 US $2,124 10.1 1.18 10.1 1.18 100% 4.4 1.08 4.4 1.08 100% US $483 5.7 1.27 5.7 1.27 100% 31% US $210 US $210China Gold International Resources Corp. Ltd. TSX:CGG US $588 US ($339) US $1,486 12.2 0.18 63.4 0.92 19% 5.4 0.29 23.5 1.28 23% US $277 6.9 0.13 39.9 0.78 17% 51% US $122 US $23Evolution Mining Limited ASX:EVN US $2,880 US $65 US $3,226 16.2 1.33 16.8 1.38 96% 7.6 1.29 7.7 1.31 98% US $425 8.2 1.38 8.7 1.46 94% 46% US $200 US $192G-Resources Group Limited SEHK:1051 US $476 US $922 US ($446) - - - - - - - - - - - - - - - - - - - Northern Star Resources Limited ASX:NST US $1,921 US $203 US $1,724 8.5 3.26 21.0 8.08 40% 1.7 5.24 1.7 5.24 100% US $987 6.7 3.02 19.3 8.61 35% 58% US $203 US $82OceanaGold Corporation TSX:OGC US $1,997 US $0 US $2,322 15.8 1.53 17.1 1.65 93% 5.3 1.47 6.1 1.70 87% US $435 10.5 1.56 11.0 1.63 96% 32% US $147 US $136Primero Mining Corp. TSX:P US $89 US ($3) US $196 6.8 0.84 10.6 1.31 64% 1.8 1.38 2.8 2.23 62% US $112 5.0 0.73 7.8 1.14 64% 27% US $29 US $18Regis Resources Limited ASX:RRL US $1,224 US $81 US $1,145 8.6 0.96 8.6 0.96 100% 2.1 1.09 2.1 1.09 100% US $539 6.4 0.93 6.4 0.93 100% 25% US $134 US $134Resolute Mining Limited ASX:RSG US $669 US $274 US $411 11.5 1.40 11.5 1.40 100% 5.2 1.50 5.2 1.50 100% US $80 5.9 1.26 5.9 1.26 100% 42% US $36 US $36SEMAFO Inc. TSX:SMF US $746 US $287 US $516 7.6 2.80 7.6 2.80 100% 3.0 3.29 3.0 3.29 100% US $173 4.6 2.56 4.6 2.56 100% 42% US $68 US $68Group Average - Total # Companies: 11 US $356 US $115 US $92Equivalency assumptions (US$ / 04-28-17): $1,268/oz Au, $17.24/oz Ag, $947/oz Pt, $826/oz Pd, $2.59/lb Cu, $1.19/lb Zn, $1.04/lb Pb, $4.27/lb Ni, $9.00/lb Mo, $24.95/lb Co, $8,925/t Sb, $22.75/lb U3O8, $0.20/lb Sn, $93.00/t HCC, $69.97/t 62% FeSource: SNL Financial retrieved on April 28, 2017
% AuInferred
EnterpriseValue
(millions)Company Symbol
MarketCapitalization
(millions)
WorkingCapital
(millions)
Global Reserves & Resources Reserves Resources (M&I and Inferred)Au
(Moz)Au(g/t)
AuEq(Moz)
AuEq(g/t)
% Au
GlobalEV/oz
Au% Au Au
(Moz)Au(g/t)
AuEq(Moz)
AuEq(g/t)
EV/ozAu
EV/ozAuEq
Au(Moz)
Au(g/t)
AuEq(Moz)
AuEq(g/t)
% Au
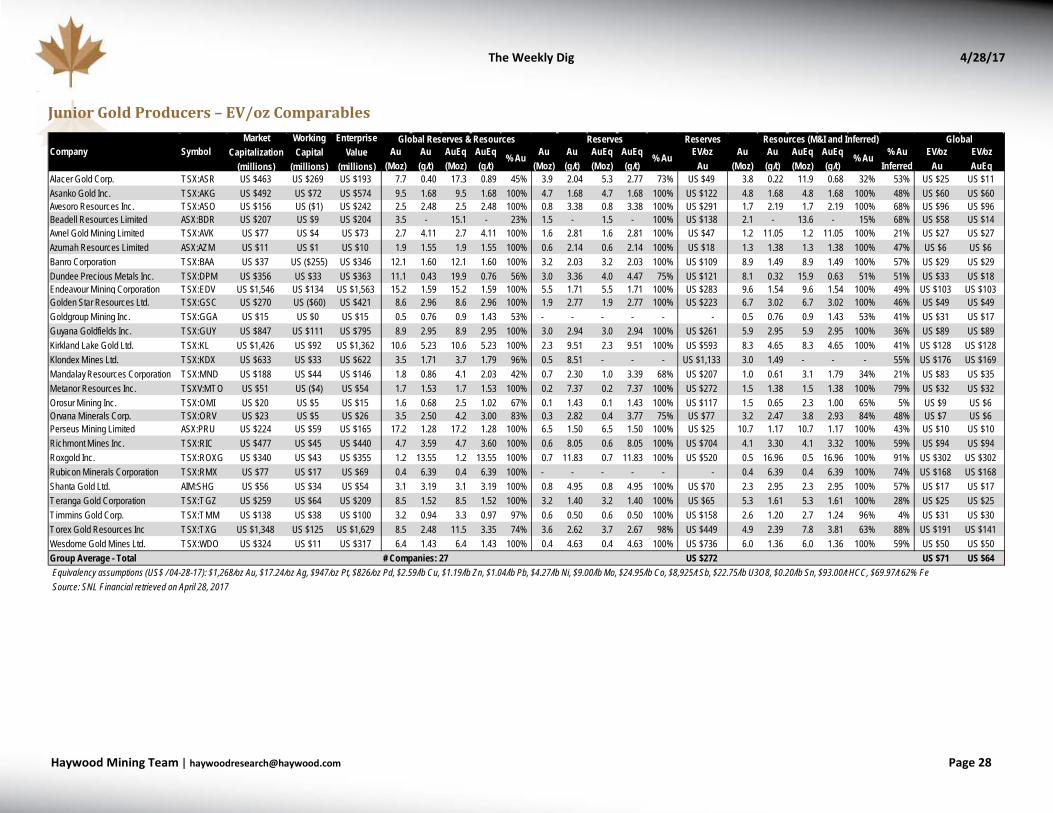
The Weekly Dig 4/28/17
Haywood Mining [email protected] Page 28
Junior Gold Producers – EV/oz Comparables
Reserves
Alacer Gold Corp. TSX:ASR US $463 US $269 US $193 7.7 0.40 17.3 0.89 45% 3.9 2.04 5.3 2.77 73% US $49 3.8 0.22 11.9 0.68 32% 53% US $25 US $11Asanko Gold Inc. TSX:AKG US $492 US $72 US $574 9.5 1.68 9.5 1.68 100% 4.7 1.68 4.7 1.68 100% US $122 4.8 1.68 4.8 1.68 100% 48% US $60 US $60Avesoro Resources Inc. TSX:ASO US $156 US ($1) US $242 2.5 2.48 2.5 2.48 100% 0.8 3.38 0.8 3.38 100% US $291 1.7 2.19 1.7 2.19 100% 68% US $96 US $96Beadell Resources Limited ASX:BDR US $207 US $9 US $204 3.5 - 15.1 - 23% 1.5 - 1.5 - 100% US $138 2.1 - 13.6 - 15% 68% US $58 US $14Avnel Gold Mining Limited TSX:AVK US $77 US $4 US $73 2.7 4.11 2.7 4.11 100% 1.6 2.81 1.6 2.81 100% US $47 1.2 11.05 1.2 11.05 100% 21% US $27 US $27Azumah Resources Limited ASX:AZM US $11 US $1 US $10 1.9 1.55 1.9 1.55 100% 0.6 2.14 0.6 2.14 100% US $18 1.3 1.38 1.3 1.38 100% 47% US $6 US $6Banro Corporation TSX:BAA US $37 US ($255) US $346 12.1 1.60 12.1 1.60 100% 3.2 2.03 3.2 2.03 100% US $109 8.9 1.49 8.9 1.49 100% 57% US $29 US $29Dundee Precious Metals Inc. TSX:DPM US $356 US $33 US $363 11.1 0.43 19.9 0.76 56% 3.0 3.36 4.0 4.47 75% US $121 8.1 0.32 15.9 0.63 51% 51% US $33 US $18Endeavour Mining Corporation TSX:EDV US $1,546 US $134 US $1,563 15.2 1.59 15.2 1.59 100% 5.5 1.71 5.5 1.71 100% US $283 9.6 1.54 9.6 1.54 100% 49% US $103 US $103Golden Star Resources Ltd. TSX:GSC US $270 US ($60) US $421 8.6 2.96 8.6 2.96 100% 1.9 2.77 1.9 2.77 100% US $223 6.7 3.02 6.7 3.02 100% 46% US $49 US $49Goldgroup Mining Inc. TSX:GGA US $15 US $0 US $15 0.5 0.76 0.9 1.43 53% - - - - - - 0.5 0.76 0.9 1.43 53% 41% US $31 US $17Guyana Goldfields Inc. TSX:GUY US $847 US $111 US $795 8.9 2.95 8.9 2.95 100% 3.0 2.94 3.0 2.94 100% US $261 5.9 2.95 5.9 2.95 100% 36% US $89 US $89Kirkland Lake Gold Ltd. TSX:KL US $1,426 US $92 US $1,362 10.6 5.23 10.6 5.23 100% 2.3 9.51 2.3 9.51 100% US $593 8.3 4.65 8.3 4.65 100% 41% US $128 US $128Klondex Mines Ltd. TSX:KDX US $633 US $33 US $622 3.5 1.71 3.7 1.79 96% 0.5 8.51 - - - US $1,133 3.0 1.49 - - - 55% US $176 US $169Mandalay Resources Corporation TSX:MND US $188 US $44 US $146 1.8 0.86 4.1 2.03 42% 0.7 2.30 1.0 3.39 68% US $207 1.0 0.61 3.1 1.79 34% 21% US $83 US $35Metanor Resources Inc. TSXV:MTO US $51 US ($4) US $54 1.7 1.53 1.7 1.53 100% 0.2 7.37 0.2 7.37 100% US $272 1.5 1.38 1.5 1.38 100% 79% US $32 US $32Orosur Mining Inc. TSX:OMI US $20 US $5 US $15 1.6 0.68 2.5 1.02 67% 0.1 1.43 0.1 1.43 100% US $117 1.5 0.65 2.3 1.00 65% 5% US $9 US $6Orvana Minerals Corp. TSX:ORV US $23 US $5 US $26 3.5 2.50 4.2 3.00 83% 0.3 2.82 0.4 3.77 75% US $77 3.2 2.47 3.8 2.93 84% 48% US $7 US $6Perseus Mining Limited ASX:PRU US $224 US $59 US $165 17.2 1.28 17.2 1.28 100% 6.5 1.50 6.5 1.50 100% US $25 10.7 1.17 10.7 1.17 100% 43% US $10 US $10Richmont Mines Inc. TSX:RIC US $477 US $45 US $440 4.7 3.59 4.7 3.60 100% 0.6 8.05 0.6 8.05 100% US $704 4.1 3.30 4.1 3.32 100% 59% US $94 US $94Roxgold Inc. TSX:ROXG US $340 US $43 US $355 1.2 13.55 1.2 13.55 100% 0.7 11.83 0.7 11.83 100% US $520 0.5 16.96 0.5 16.96 100% 91% US $302 US $302Rubicon Minerals Corporation TSX:RMX US $77 US $17 US $69 0.4 6.39 0.4 6.39 100% - - - - - - 0.4 6.39 0.4 6.39 100% 74% US $168 US $168Shanta Gold Ltd. AIM:SHG US $56 US $34 US $54 3.1 3.19 3.1 3.19 100% 0.8 4.95 0.8 4.95 100% US $70 2.3 2.95 2.3 2.95 100% 57% US $17 US $17Teranga Gold Corporation TSX:TGZ US $259 US $64 US $209 8.5 1.52 8.5 1.52 100% 3.2 1.40 3.2 1.40 100% US $65 5.3 1.61 5.3 1.61 100% 28% US $25 US $25T immins Gold Corp. TSX:TMM US $138 US $38 US $100 3.2 0.94 3.3 0.97 97% 0.6 0.50 0.6 0.50 100% US $158 2.6 1.20 2.7 1.24 96% 4% US $31 US $30Torex Gold Resources Inc TSX:TXG US $1,348 US $125 US $1,629 8.5 2.48 11.5 3.35 74% 3.6 2.62 3.7 2.67 98% US $449 4.9 2.39 7.8 3.81 63% 88% US $191 US $141Wesdome Gold Mines Ltd. TSX:WDO US $324 US $11 US $317 6.4 1.43 6.4 1.43 100% 0.4 4.63 0.4 4.63 100% US $736 6.0 1.36 6.0 1.36 100% 59% US $50 US $50Group Average - Total # Companies: 27 US $272 US $71 US $64Equivalency assumptions (US$ / 04-28-17): $1,268/oz Au, $17.24/oz Ag, $947/oz Pt, $826/oz Pd, $2.59/lb Cu, $1.19/lb Zn, $1.04/lb Pb, $4.27/lb Ni, $9.00/lb Mo, $24.95/lb Co, $8,925/t Sb, $22.75/lb U3O8, $0.20/lb Sn, $93.00/t HCC, $69.97/t 62% FeSource: SNL Financial retrieved on April 28, 2017
EV/ozAu
EnterpriseValue
(millions)Company Symbol
MarketCapitalization
(millions)
WorkingCapital
(millions)
Global Reserves & Resources Reserves Resources (M&I and Inferred)Au
(Moz)Au(g/t)
AuEq(Moz)
AuEq(g/t)
% Au
Global
% Au Au(Moz)
Au(g/t)
AuEq(Moz)
AuEq(g/t)
EV/ozAu
EV/ozAuEq
Au(Moz)
Au(g/t)
AuEq(Moz)
AuEq(g/t)
% Au % AuInferred

The Weekly Dig 4/28/17
Haywood Mining [email protected] Page 29
Gold Development-Stage Companies (Engineering Study Complete) – EV/oz Comparables
Company Reserves
African Gold Group, Inc. TSXV:AGG US $15 US ($1) US $16 2.0 1.01 2.0 1.01 100% 0.5 1.25 0.5 1.25 100% 1.5 0.96 1.5 0.96 100% 59% US $8 US $8Almaden Minerals Ltd. TSX:AMM US $131 US $7 US $125 2.0 0.54 3.6 0.96 56% - - - - - 2.0 0.54 3.6 0.96 56% 18% US $62 US $35Amarillo Gold Corporation TSXV:AGC US $23 US ($1) US $31 2.0 1.30 2.0 1.30 100% - - - - - 2.0 1.30 - - - 29% US $15 US $15ATAC Resources Ltd. TSXV:ATC US $51 US $12 US $40 0.7 2.35 0.7 2.39 99% - - - - - 0.7 2.35 0.7 2.39 99% 28% US $59 US $58Barkerville Gold Mines Ltd. TSXV:BGM US $242 US $15 US $226 5.0 2.43 5.1 2.45 99% 0.0 4.82 - - - 5.0 2.42 - - - 41% US $45 US $45Chaarat Gold Holdings Limited AIM:CGH US $102 US $2 US $100 7.1 2.53 7.2 2.58 98% - - - - - 7.1 2.53 7.2 2.58 98% 15% US $14 US $14Chalice Gold Mines Limited ASX:CHN US $29 US $43 US ($14) 0.2 4.09 0.2 4.09 100% - - - - - 0.2 4.09 0.2 4.09 100% 83% - - Chesapeake Gold Corp. TSXV:CKG US $128 US $17 US $112 19.8 0.49 31.2 0.78 64% 18.3 0.52 28.8 0.81 63% 1.5 0.33 2.4 0.51 65% 53% US $6 US $4Continental Gold Inc. TSX:CNL US $320 US $14 US $305 9.1 9.91 9.7 10.56 94% 3.7 8.41 3.9 8.74 96% 5.4 11.31 5.8 12.25 92% 86% US $34 US $32Dacian Gold Limited ASX:DCN US $253 US $18 US $235 3.3 - 3.3 - 100% 1.2 - - - - 2.1 - - - - 53% US $71 US $71Dalradian Resources Inc. TSX:DNA US $225 US $23 US $202 4.4 10.74 4.4 10.74 100% - - - - - 4.4 10.74 4.4 10.74 100% 52% US $46 US $46Exeter Resource Corporation TSX:XRC US $153 US $13 US $141 25.3 0.49 38.9 0.75 65% 0.0 3.31 0.0 3.31 100% 25.3 0.49 38.9 0.75 65% 7% US $6 US $4Falco Resources Ltd. TSXV:FPC US $155 US $13 US $150 5.6 1.54 9.4 2.56 60% - - - - - 5.6 1.54 9.4 2.56 60% 19% US $27 US $16First Mining Finance Corp. TSXV:FF US $246 US $29 US $219 14.0 1.64 14.4 1.68 97% 0.2 1.50 - - - 13.8 1.64 - - - 41% US $16 US $15Gabriel Resources Ltd. TSX:GBU US $103 US $51 US $94 16.4 - 17.4 - 94% 8.1 - - - - 8.3 - - - - 27% US $6 US $5Gold Road Resources Limited ASX:GOR US $426 US $263 US $164 3.3 1.11 3.4 1.14 97% 1.8 1.20 1.8 1.20 100% 1.5 1.02 1.7 1.09 93% 62% US $49 US $48Golden Queen Mining Co. Ltd. TSX:GQM US $66 US $8 US $93 0.9 0.53 1.1 0.65 81% 0.5 0.66 0.6 0.81 81% 0.4 0.43 0.5 0.53 81% 30% US $104 US $85Goldquest Mining Corp. TSXV:GQC US $83 US $4 US $78 2.2 2.60 3.3 3.86 67% 0.8 3.72 1.1 5.00 74% 1.4 2.19 2.0 3.21 68% 16% US $36 US $24Hummingbird Resources PLC AIM:HUM US $108 US $37 US $101 6.4 1.64 6.4 1.64 100% 0.6 3.14 0.6 3.14 100% US $168 5.8 1.57 5.8 1.57 100% 53% US $16 US $16Integra Gold Corp. TSXV:ICG US $277 US $14 US $264 5.4 6.38 5.4 6.39 100% - - - - - - 5.4 6.38 5.4 6.39 100% 60% US $49 US $49International Tower Hill Mines Ltd. TSX:ITH US $82 US $8 US $74 12.6 0.68 12.6 0.68 100% 9.0 0.71 9.0 0.71 100% US $8 3.6 0.60 3.6 0.60 100% 31% US $6 US $6INV Metals Inc. TSX:INV US $63 US $6 US $57 3.1 - 3.9 - 80% 1.9 - - - - US $31 1.2 - - - - 44% US $18 US $15K92 Mining Inc. TSXV:KNT US $74 US $14 US $66 1.4 8.09 2.0 11.06 73% - - - - - - 1.4 8.09 - - - 84% US $46 US $34KEFI Minerals Plc AIM:KEFI US $25 US ($2) US $27 1.9 1.96 1.9 1.96 100% 1.0 2.12 1.0 2.12 100% US $27 0.9 1.82 0.9 1.82 100% 20% US $14 US $14Lundin Gold Inc. TSX:LUG US $513 US $1 US $512 9.5 - 9.7 - 98% 4.8 - - - - US $106 4.7 - - - - 46% US $54 US $53Lupaka Gold Corp. TSXV:LPK US $15 US ($1) US $17 2.8 1.17 3.2 1.34 87% - - - - - - 2.8 1.17 3.2 1.34 87% 42% US $6 US $5Lydian International Limited TSX:LYD US $166 US $141 US $95 5.0 0.69 5.4 0.73 94% 2.4 0.78 2.6 0.83 94% US $39 2.6 0.62 2.8 0.65 94% 77% US $19 US $18Metals Exploration Plc AIM:MTL US $77 US ($45) US $165 1.7 1.62 2.1 1.92 84% 0.9 1.86 1.0 2.13 87% US $184 0.8 1.43 1.0 1.76 81% 82% US $95 US $80Midas Gold Corp. TSX:MAX US $103 US $34 US $88 6.5 1.57 7.3 1.74 90% 4.6 1.60 5.1 1.79 90% US $19 2.0 1.49 2.1 1.64 91% 55% US $13 US $12Moneta Porcupine Mines Inc. TSX:ME US $31 US $5 US $26 4.3 1.17 4.3 1.17 100% - - - - - - 4.3 1.17 4.3 1.17 100% 75% US $6 US $6NewCastle Gold Ltd. TSX:NCA US $127 US $8 US $118 5.4 0.24 13.7 0.60 39% - - - - - - 5.4 0.24 13.7 0.60 39% 17% US $22 US $9NovaGold Resources Inc. TSX:NG US $1,331 US $99 US $1,319 28.7 - 43.3 - 66% 19.6 - - - - US $67 9.1 - - - - 58% US $46 US $30Orca Gold Inc. TSXV:ORG US $33 US $6 US $27 1.6 1.88 1.9 2.23 84% - - - - - - 1.6 1.88 1.9 2.23 84% 24% US $17 US $15Orezone Gold Corporation TSXV:ORE US $68 US $22 US $46 4.5 0.77 4.5 0.77 100% - - - - - - 4.5 0.77 4.5 0.77 100% 15% US $10 US $10Pershimco Resources Inc. TSXV:PRO US $54 US ($12) US $66 0.8 0.69 1.0 0.86 80% 0.5 0.77 0.5 0.82 94% US $135 0.1 7.46 0.1 7.46 100% 12% US $82 US $66Pilot Gold Inc. TSX:PLG US $54 US $12 US $42 2.0 0.36 4.2 0.76 48% - - - - - - 2.0 0.36 4.2 0.76 48% 35% US $21 US $10Premier Gold Mines Limited TSX:PG US $407 US $123 US $323 7.2 1.74 7.3 1.77 98% 2.9 1.20 2.9 1.22 98% US $112 4.3 2.49 4.4 2.54 98% 54% US $45 US $44Pretium Resources Inc. TSX:PVG US $1,789 US $45 US $2,245 49.0 0.68 62.8 0.88 78% 7.5 14.14 7.9 14.92 95% US $299 41.5 0.58 54.9 0.77 76% 31% US $46 US $36Red Eagle Mining Corporation TSX:R US $136 US ($25) US $209 0.6 3.35 0.6 3.35 100% 0.4 5.19 0.4 5.19 100% US $516 0.2 1.98 0.2 1.98 100% 64% US $341 US $341RTG Mining Inc. TSX:RTG US $16 US $12 US $4 0.6 1.66 1.3 3.60 46% 0.3 2.04 0.8 4.89 42% US $12 0.3 1.35 0.5 2.55 53% 84% US $7 US $3Sabina Gold & Silver Corp. TSX:SBB US $281 US $30 US $252 7.2 6.21 7.2 6.21 100% 2.5 6.30 2.5 6.30 100% US $101 4.7 6.16 4.7 6.16 100% 40% US $35 US $35Sandspring Resources Ltd. TSXV:SSP US $41 US $5 US $36 10.0 0.84 11.2 0.94 89% 4.1 1.00 4.5 1.11 91% US $9 5.9 0.75 6.6 0.85 89% 53% US $4 US $3Seabridge Gold Inc. TSX:SEA US $561 US $5 US $555 109.8 0.48 215.1 0.93 51% 45.3 0.61 70.0 0.95 65% US $12 64.6 0.41 145.1 0.93 44% 76% US $5 US $3Sihayo Gold Limited ASX:SIH US $14 US ($1) US $15 1.1 2.60 1.1 2.60 100% 0.4 2.41 0.4 2.41 100% US $36 0.7 2.73 0.7 2.73 100% 43% US $14 US $14Sulliden Mining Capital Inc. TSX:SMC US $8 US $12 US ($4) 1.4 - 1.6 - 89% - - - - - - 1.4 - - - - 26% - - Terraco Gold Corp. TSXV:TEN US $13 US $2 US $18 1.0 0.70 1.0 0.70 100% - - - - - - 1.0 0.70 1.0 0.70 100% 8% US $18 US $18Vast Resources plc AIM:VAST US $28 US ($0) US $32 2.4 1.53 2.9 1.87 82% 0.6 1.83 1.0 3.17 58% US $55 1.8 1.45 1.9 1.54 94% 75% US $13 US $11Victoria Gold Corp. TSXV:VIT US $270 US $40 US $229 4.5 0.65 4.6 0.66 99% 2.7 0.67 2.7 0.67 100% US $86 1.9 0.62 1.9 0.63 98% 30% US $51 US $50Group Average - Total # Companies: 48 US $101 US $37 US $33Group Average - 0 - 20 million ounces # Companies: 44 US $37 US $34Group Average - 20 - 50 million ounces # Companies: 3 US $32 US $13Group Average - +50 million ounces # Companies: 1 US $5 US $19Equivalency assumptions (US$ / 04-28-17): $1,268/oz Au, $17.24/oz Ag, $947/oz Pt, $826/oz Pd, $2.59/lb Cu, $1.19/lb Zn, $1.04/lb Pb, $4.27/lb Ni, $9.00/lb Mo, $24.95/lb Co, $8,925/t Sb, $22.75/lb U3O8, $0.20/lb Sn, $93.00/t HCC, $69.97/t 62% FeSource: SNL Financial retrieved on April 28, 2017
SymbolMarket
Capitalization(millions)
WorkingCapital
(millions)
EnterpriseValue
(millions)
Global Reserves & ResourcesAu
(Moz)Au
(g/t)AuEq(Moz)
AuEq(g/t) % Au AuEq
(Moz)AuEq(g/t)
% AuInferre
d% AuAuEq
(g/t)EV/oz
Au
ReservesAu
(Moz)Au
(g/t)
GlobalEV/oz
AuEV/ozAuEq
Resources (M&I and Inferred)Au
(Moz)Au
(g/t)AuEq(Moz) % Au

The Weekly Dig 4/28/17
Haywood Mining [email protected] Page 30
Gold Exploration-Stage Companies (Resource Only) – EV/oz Comparables
Alexandria Minerals Corporation TSXV:AZX US $24 US $5 US $20 1.6 1.82 2.1 2.39 76% - - - - - 1.6 1.82 2.1 2.39 76% 41% US $12 US $9Atacama Pacific Gold Corporation TSXV:ATM US $28 US $3 US $25 5.9 0.37 5.9 0.37 100% 3.7 0.40 3.7 0.40 100% 2.1 0.33 2.1 0.33 100% 29% US $4 US $4Auryn Resources Inc. TSX:AUG US $181 US $2 US $179 2.7 4.85 3.0 5.44 89% - - - - - 2.7 4.85 - - - 70% US $67 US $59Balmoral Resources Ltd TSX:BAR US $66 US $8 US $58 0.6 0.77 1.1 1.39 55% - - - - - 0.6 0.77 1.1 1.39 55% 68% US $99 US $54Bellhaven Copper & Gold Inc. TSXV:BHV US $10 US ($0) US $11 1.0 - 1.4 - 66% - - - - - 1.0 - - - - 27% US $12 US $8Calibre Mining Corp. TSXV:CXB US $49 US $2 US $47 1.1 2.34 1.3 2.80 84% - - - - - 1.1 2.34 1.3 2.80 84% 97% US $42 US $35Cardinal Resources Limited ASX:CDV US $128 US $13 US $115 - - - - - - - - - - - - - - - - - - Columbus Gold Corp. TSX:CGT US $96 US ($4) US $100 2.9 0.86 3.5 1.05 83% - - - - - 2.9 0.86 3.5 1.05 83% 40% US $34 US $28Condor Gold PLC AIM:CNR US $52 US $4 US $48 3.7 3.08 4.1 3.35 92% 0.7 3.04 0.7 3.12 98% 3.1 3.09 3.4 3.41 91% 65% US $13 US $12Coral Gold Resources Ltd. TSXV:CLH US $12 US $0 US $12 2.7 0.49 2.7 0.49 100% - - - - - 2.7 0.49 - - - 100% US $4 US $4Corvus Gold Inc. TSX:KOR US $57 US $2 US $55 1.8 0.26 1.9 0.28 95% - - - - - 1.8 0.26 1.9 0.28 95% 64% US $31 US $30Eastmain Resources Inc. TSX:ER US $62 US $5 US $56 1.8 4.37 1.8 4.37 100% - - - - - 1.8 4.37 1.8 4.37 100% 34% US $30 US $30Eco Oro Minerals Corp TSX:EOM US $34 US $10 US $25 3.5 4.38 3.7 4.62 95% - - - - - 3.5 4.38 3.7 4.62 95% 37% US $7 US $7Eurasian Minerals Inc. TSXV:EMX US $64 US $4 US $60 - - - - - - - - - - - - - - - - - - Falco Resources Ltd. TSXV:FPC US $155 US $13 US $150 5.6 1.54 9.4 2.56 60% - - - - - 5.6 1.54 9.4 2.56 60% 19% US $27 US $16GobiMin Inc. TSXV:GMN US $21 US $31 US ($9) 2.9 1.49 2.9 1.50 99% - - - - - 2.9 1.49 2.9 1.50 99% 63% - - Granada Gold Mine Inc. TSXV:GGM US $20 US ($2) US $23 0.7 3.07 0.7 3.37 91% 0.1 4.24 0.1 4.24 100% 0.6 2.96 0.6 3.29 90% 6% US $35 US $32Gold Standard Ventures Corp TSXV:GSV US $376 US $38 US $338 2.1 0.56 2.3 0.61 93% - - - - - 2.1 0.56 2.3 0.61 93% 70% US $162 US $150Harte Gold Corp. TSX:HRT US $231 US $11 US $221 0.5 9.47 0.5 9.47 100% - - - - - 0.5 9.47 0.5 9.47 100% 33% US $466 US $466IDM Mining Ltd. TSXV:IDM US $39 US $2 US $36 0.5 7.80 0.6 8.09 96% - - - - - 0.5 7.80 0.6 8.09 96% 20% US $66 US $64Kasbah Resources Limited ASX:KAS US $11 US $1 US $11 0.2 0.55 0.3 0.63 88% - - 0.0 0.09 - 0.2 0.90 0.2 0.97 93% - US $48 US $42Lexam VG Gold Inc. TSX:LEX US $37 US $0 US $37 2.4 2.74 2.4 2.74 100% - - - - - 2.4 2.74 2.4 2.74 100% 39% US $15 US $15Lincoln Mining Corporation TSXV:LMG US $1 US ($3) US $7 0.4 2.29 0.4 2.29 100% - - - - - 0.4 2.29 - - - 82% US $17 US $17Lion One Metals Limited TSXV:LIO US $54 US $24 US $29 0.7 0.09 14.0 1.79 5% - - - - - 0.7 0.09 14.0 1.79 5% 60% US $40 US $2Marathon Gold Corporation TSX:MOZ US $109 US $5 US $104 1.3 2.37 1.3 2.37 100% - - - - - 1.3 2.37 1.3 2.37 100% 15% US $79 US $79Orex Minerals Inc. TSXV:REX US $14 US $4 US $10 0.1 0.28 0.4 1.55 18% - - - - - 0.1 0.28 0.4 1.55 18% 47% US $149 US $27Puma Exploration Inc. TSXV:PUM US $8 US ($0) US $9 0.4 0.52 3.0 4.18 12% - - - - - 0.4 0.52 3.0 4.12 13% 2% US $23 US $3Pure Gold Mining Inc. TSXV:PGM US $80 US $9 US $71 1.2 9.47 1.2 9.47 100% - - - - - 1.2 9.47 1.2 9.47 100% 24% US $58 US $58RNI NL ASX:RNI US $17 US $2 US $16 - - 0.2 1.72 - - - - - - - - 0.2 1.72 - - - US $83Rye Patch Gold Corp. TSXV:RPM US $74 US $13 US $62 4.4 0.42 4.9 0.47 88% - - - - - 4.4 0.42 4.9 0.47 88% 29% US $14 US $13Sarama Resources Ltd TSXV:SWA US $20 US ($2) US $22 0.7 1.68 0.7 1.68 100% - - - - - 0.7 1.68 0.7 1.68 100% 100% US $30 US $30Spanish Mountain Gold Ltd TSXV:SPA US $26 US $2 US $24 7.0 0.40 7.2 0.41 98% - - - - - 7.0 0.40 7.2 0.41 98% 50% US $3 US $3Teras Resources Inc. TSXV:TRA US $16 US $1 US $16 1.1 0.48 1.3 0.56 87% - - - - - 1.1 0.48 1.3 0.56 87% 10% US $14 US $12Treasury Metals Inc. TSX:TML US $51 US ($4) US $55 1.6 1.88 1.9 2.23 84% - - - - - 1.6 1.88 1.9 2.23 84% 24% US $36 US $30TriMetals Mining Inc. TSX:TMI US $30 US $2 US $29 1.8 0.07 14.4 0.55 12% - - - - - 1.8 0.07 14.4 0.55 12% 47% US $16 US $2West Kirkland Mining Inc. TSXV:WKM US $19 US ($0) US $19 1.3 0.55 1.6 0.66 84% 0.6 0.58 0.7 0.69 84% 0.7 0.53 0.9 0.64 84% 23% US $15 US $12Group Average - Total # Companies: 38 US $45 US $39Equivalency assumptions (US$ / 04-28-17): $1,268/oz Au, $17.24/oz Ag, $947/oz Pt, $826/oz Pd, $2.59/lb Cu, $1.19/lb Zn, $1.04/lb Pb, $4.27/lb Ni, $9.00/lb Mo, $24.95/lb Co, $8,925/t Sb, $22.75/lb U3O8, $0.20/lb Sn, $93.00/t HCC, Source: SNL Financial retrieved on April 28, 2017
EV/ozAu
EV/ozAuEq
Au(Moz)
Au(g/t)
AuEq(Moz)
AuEq(g/t) % Au
Global% Au% Au Au
(Moz)Au
(g/t)AuEq(Moz)
Global Reserves & Resources Reserves Resources (M&I and Inferred)Au
(MozAu
(g/t)AuEq(Moz)
AuEq(g/t)
AuEq(g/t)
% AuInferre
Company SymbolMarket
Capitalization(millions)
WorkingCapital
(millions)
EnterpriseValue
(millions)

The Weekly Dig 4/28/17
Haywood Mining [email protected] Page 31
Silver – EV/oz Comparables
Reserves
Alexco Resource Corp. TSX:AXR US $130 US $17 US $113 67 319 124 587 54% - - - - - - 67 319 124 587 54% 18% US $1.68 US $0.91Americas Silver Corporation TSX:USA US $116 US $20 US $96 109 150 228 314 48% 31 185 - - - US $3.10 78 140 - - - 35% US $0.88 US $0.42Athena Silver Corp OTCPK:AHNR US $3 US ($2) US $6 43 67 43 67 100% - - - - - - 43 67 43 67 100% - US $0.13 US $0.13Bear Creek Mining Corporation TSXV:BCM US $173 US $29 US $144 523 41 1,104 86 47% 291 52 630 112 46% US $0.49 232 32 474 66 49% 33% US $0.28 US $0.13Defiance Silver Corp. TSXV:DEF US $20 US $1 US $19 17 182 18 191 95% - - - - - - 17 182 18 191 95% 100% US $1.14 US $1.09Dolly Varden Silver Corporation TSXV:DV US $17 US $3 US $13 43 333 43 333 100% - - - - - - 43 333 43 333 100% 25% US $0.31 US $0.31Golden Arrow Resources Corporation TSXV:GRG US $46 US $7 US $39 58 83 102 145 57% 6 145 7 166 87% US $6.39 52 79 95 144 55% 25% US $0.67 US $0.38Golden Minerals Company AMEX:AUMN US $48 US $4 US $45 113 41 289 104 39% - - - - - - 113 41 289 104 39% 58% US $0.40 US $0.16Iberian Minerals Ltd. TSXV:IML US $15 US $0 US $15 22 9 357 142 6% - - - - - - 22 9 357 142 6% - US $0.67 US $0.04Investigator Resources Limited ASX:IVR US $16 US $3 US $14 33 117 33 117 100% - - - - - - 33 117 33 117 100% 100% US $0.41 US $0.41Kootenay Silver Inc TSXV:KTN US $38 US $6 US $32 76 62 119 97 64% - - - - - - 76 62 119 97 64% 19% US $0.41 US $0.26MacPhersons Resources Limited ASX:MRP US $56 US $5 US $50 20 28 67 91 30% 8 44 25 137 32% US $6.07 12 22 41 75 29% 29% US $2.48 US $0.75MAG Silver Corp. TSX:MAG US $986 US $139 US $847 152 65 542 232 28% - - - - - - 152 65 542 232 28% 59% US $5.57 US $1.56Minco Silver Corporation TSX:MSV US $44 US $38 US $6 162 158 255 249 63% 50 189 62 234 81% US $0.13 112 148 194 255 58% 52% US $0.04 US $0.02Silver Bear Resources Inc. TSX:SBR US $45 US $2 US $114 56 723 57 729 99% 23 852 23 852 100% US $5.05 34 - 34 - 99% 67% US $2.02 US $2.01Silver Bull Resources, Inc. OTCPK:SVBL US $14 US $1 US $14 91 48 449 236 20% - - - - - - 91 48 449 236 20% 0% US $0.15 US $0.03Silver Predator Corp. TSXV:SPD US $4 US $0 US $4 21 67 21 67 100% - - - - - - 21 67 21 67 100% 19% US $0.21 US $0.21Silver Range Resources Ltd. TSXV:SNG US $12 US $0 US $12 2 9 76 399 2% - - - - - - 2 9 76 399 2% - US $6.56 US $0.15T inka Resources Limited TSXV:TK US $101 US $8 US $93 39 31 219 170 18% - - - - - - 39 31 219 170 18% 64% US $2.36 US $0.42Group Average - Total # Companies: 19 US $3.54 US $1.39 US $0.50Equivalency assumptions (US$ / 04-28-17): $1,268/oz Au, $17.24/oz Ag, $947/oz Pt, $826/oz Pd, $2.59/lb Cu, $1.19/lb Zn, $1.04/lb Pb, $4.27/lb Ni, $9.00/lb Mo, $24.95/lb Co, $8,925/t Sb, $22.75/lb U3O8, $0.20/lb Sn, $93.00/t HCC, $69.97/t 62% FeSource: SNL Financial retrieved on April 28, 2017
EV/ozAg
EV/ozAgEq
Ag(Moz)
Ag(g/t)
AgEq(Moz)
AgEq(g/t)
% Ag
Global
% Ag% Ag Ag(Moz)
Ag(g/t)
AgEq(Moz)
Global Reserves & Resources Reserves Resources (M&I and Inferred)Ag
(Moz)Ag(g/t)
AgEq(Moz)
AgEq(g/t)
AgEq(g/t)
% AgInferred
EV/ozAg
Company SymbolMarket
Capitalization(millions)
WorkingCapital
(millions)
EnterpriseValue
(millions)

The Weekly Dig 4/28/17
Haywood Mining [email protected] Page 32
Copper Non-Producers – EV/lb Comparables
Shares Market Working LTD Enterprise CopperCompany Symbol Price O/S Capitalization Capital Value Value Ratio*** Reserve (P&P) Resource (Total)
(million) (million) (million) (million) (million) (% Contained) (CuEq** Mlb) (CuEq** Mlb) Reserve TotalAQM Copper Inc. TSXV:AQM C$ 0.23 143.0 US$ 24 US$ 1.4 US$ 0.0 US$ 22 Cu / Au 90% - 2,026 - $0.011Bellhaven Copper and Gold IncTSXV:BHV C$ 0.50 28.3 US$ 10 US$ (0.4) US$ 0.0 US$ 11 Au / Cu 40% - 1,036 - $0.010Candente Copper Corp. TSX:DNT C$ 0.10 164.9 US$ 11 US$ (1.4) US$ 0.0 US$ 13 Cu / Au 89% - 12,427 - $0.001Colorado Resources Ltd. TSXV:CXO C$ 0.28 96.3 US$ 20 US$ 2.7 US$ 0.0 US$ 17 Cu / Au 59% - 1,165 - $0.015Copper Fox Metals Inc TSXV:CUU C$ 0.12 427.8 US$ 38 US$ 0.4 US$ 0.0 US$ 37 Cu / Au 68% 2,375 5,648 $0.016 $0.007Coro Mining Corp. TSX:COP C$ 0.13 593.3 US$ 56 US$ 2.2 US$ 0.4 US$ 55 Cu / Au 84% 195 965 $0.280 $0.057Crazy Horse Resources Inc. TSXV:CZH C$ 0.03 48.6 US$ 1 US$ (0.3) US$ 0.0 US$ 1 Cu / Au 80% 2,638 5,794 $0.000 $0.000Exeter Resource Corporation TSX:XRC C$ 2.27 92.3 US$ 153 US$ 12.7 US$ 0.0 US$ 140 Au / Cu 41% 12,504 22,559 $0.011 $0.006Foran Mining Corporation TSXV:FOM C$ 0.27 99.0 US$ 20 US$ 0.8 US$ 0.0 US$ 19 Cu / Zn 46% - 1,756 - $0.011Getty Copper Inc. TSXV:GTC C$ 0.04 108.4 US$ 3 US$ (0.5) US$ 0.0 US$ 3 Cu / Mo 96% 620 969 $0.005 $0.003Gold Reach Resources Ltd. TSXV:GRV C$ 0.13 47.0 US$ 4 US$ 0.2 US$ 0.0 US$ 4 Cu / Mo 68% - 5,444 - $0.001Highland Copper Co Inc. TSXV:HI C$ 0.14 459.1 US$ 45 US$ (1.7) US$ 0.3 US$ 47 Cu / Ag 96% 871 6,019 $0.054 $0.008Indico Resources Ltd. TSXV:IDI C$ 0.02 147.0 US$ 2 US$ 0.1 US$ 0.0 US$ 2 Cu / - 100% - 410 - $0.005Kiska Metals Corporation TSXV:KSK C$ 0.08 131.4 US$ 8 US$ 5.9 US$ 0.0 US$ 2 Au / Cu 38% - 2,048 - $0.001Los Andes Copper Limited TSXV:LA C$ 0.25 244.9 US$ 45 US$ 4.4 US$ 0.0 US$ 40 Cu / Mo 89% - 12,305 - $0.003Nevada Copper Corp. TSX:NCU C$ 0.66 88.2 US$ 43 US$ 2.4 US$ 152.3 US$ 192 Cu / Au 91% 5,791 7,917 $0.033 $0.024NGEx Resources Inc. TSX:NGQ C$ 1.03 213.5 US$ 161 US$ 8.0 US$ 0.0 US$ 153 Cu / Au 76% - 27,655 - $0.006Northern Dynasty Minerals Ltd. TSX:NDM C$ 2.09 298.8 US$ 457 US$ 4.7 US$ 0.0 US$ 452 Cu / Au 57% - 142,635 - $0.003Northisle Copper and Gold Inc. TSXV:NCX C$ 0.15 105.1 US$ 12 US$ 0.3 US$ 0.0 US$ 11 Cu / Au 51% - 4,358 - $0.003NovaCopper Inc. TSX:TMQ C$ 0.94 0.0 US$ 0 US$ 12.5 US$ 0.0 US$ (12) Cu / Zn 83% - 9,685 - -Panoro Minerals Ltd. TSXV:PML C$ 0.18 258.1 US$ 33 US$ 4.8 US$ 0.0 US$ 28 Cu / Au 77% - 10,114 - $0.003Polymet Mining Corp. TSX:POM C$ 0.97 318.5 US$ 226 US$ 16.3 US$ 107.9 US$ 318 Cu / Ni 49% 3,145 10,139 $0.101 $0.031Quaterra Resources Inc. TSXV:QTA C$ 0.13 201.0 US$ 18 US$ 5.7 US$ 0.0 US$ 13 Cu / Ag 96% - 8,247 - $0.002Redhawk Resources, Inc. TSX:RDK C$ 0.04 157.7 US$ 4 US$ (1.1) US$ 1.3 US$ 6 Cu / Mo 92% - 3,835 - $0.002Regulus Resources Inc TSXV:REG C$ 1.75 68.6 US$ 88 US$ 8.5 US$ 0.0 US$ 79 Cu / Au 0% - - - -Serengeti Resources Inc. TSXV:SIR C$ 0.13 71.5 US$ 7 US$ 0.4 US$ 0.0 US$ 6 Cu / Au 67% - 4,153 - $0.002St Augustine Gold and Copper TSX:SAU C$ 0.02 726.8 US$ 11 US$ (1.0) US$ 0.0 US$ 12 Cu / Au 58% 2,131 3,263 $0.005 $0.004Tintina Resources Inc. TSXV:TAU C$ 0.12 323.5 US$ 27 US$ 3.6 US$ 0.0 US$ 24 Cu / Co 86% - 1,538 - $0.015Western Copper and Gold Cor TSX:WRN C$ 1.50 95.1 US$ 104 US$ 5.0 US$ 0.0 US$ 99 Cu / Au 45% 10,033 22,599 $0.010 $0.004Group Average - Total $0.052 $0.009*All reserve and resource data sourced from IntierraRMG, additional data sourced from Capital IQ and Market Q.**CuEq = copper equivalent. Calculated based on Haywood's formal long-term metal price forecasts.***Copper Ratio = value of in situ copper / total value of in situ metals.
Primary / Secondary
Metal
Reserves & Resources* - AttributableEV/lb CuEq** (US$)

The Weekly Dig 4/28/17
Haywood Mining [email protected] Page 33
Nickel Non-Producers – EV/lb Comparables
Zinc Non-Producers – EV/lb Comparables
Shares Market Working LTD Enterprise NickelCompany Symbol Price O/S Capitalization Capital Value Value Ratio*** Reserve (P&P) Resource (Total)
(million) (million) (million) (million) (million) (% Contained) (NiEq** Mlb) (NiEq** Mlb) Reserve TotalAnfield Nickel Corp. TSXV:ANF C$ 0.81 119.2 US$ 71 US$ 21.2 US$ 0.0 US$ 49 Ni / Co 99% 2,169 3,616 $0.023 $0.014Asian Mineral Resources LimiteTSXV:ASN C$ 0.04 788.9 US$ 20 US$ (1.0) US$ 0.0 US$ 21 Ni / Cu 86% 85 146 $0.250 $0.145Canadian Arrow Mines Ltd. TSXV:CRO C$ 0.02 140.0 US$ 2 US$ (0.6) US$ 0.0 US$ 2 Ni / Cu 82% - 141 - $0.015First Point Minerals Corp. TSXV:FPX C$ 0.10 122.3 US$ 9 US$ 0.1 US$ 5.3 US$ 14 Ni / Cu 182% - 141 - $0.100Hard Creek Nickel Corporation TSXV:HNC C$ 0.05 43.1 US$ 1 US$ 0.1 US$ 0.0 US$ 1 Ni / Co 91% - 9,161 - $0.000Mustang Minerals Corp. TSXV:MUM C$ 0.02 256.5 US$ 4 US$ (0.5) US$ 0.0 US$ 4 Co / Ni 38% 2 1,176 $1.796 $0.004Noront Resources Ltd TSXV:NOT C$ 0.24 306.3 US$ 53 US$ (7.1) US$ 21.4 US$ 81 Ni / Cu 78% 498 851 $0.163 $0.095North American Nickel Inc. TSXV:NAN C$ 0.08 122.2 US$ 7 US$ 2.4 US$ 0.0 US$ 5 Ni / Cu 0% - - - -Northern Shield Resources Inc TSXV:NRN C$ 0.06 205.0 US$ 9 US$ 1.7 US$ 0.0 US$ 7 Ni / Cu 0% - - - -Poseidon Nickel Limited ASX:POS C$ 0.03 891.7 US$ 22 US$ (1.3) US$ 14.6 US$ 38 Ni / Au 98% 171 1,284 $0.224 $0.030Royal Nickel Corporation TSX:RNX C$ 0.23 276.2 US$ 45 US$ (19.5) US$ 0.0 US$ 65 Ni / Cu 0% - - - -Sama Resources Inc. TSXV:SME C$ 0.21 132.8 US$ 20 US$ (0.0) US$ 0.0 US$ 20 Ni / Cu 71% - 195 - $0.105Strongbow Exploration Inc. TSXV:SBW C$ 0.15 60.6 US$ 6 US$ 0.4 US$ 1.1 US$ 7 Ni / Cu 86% - 417 - $0.017Talon Metals Corporation TSX:TLO C$ 0.10 129.6 US$ 9 US$ 0.2 US$ 13.9 US$ 23 Ni / Fe 56% - 125 - $0.182Group Average - Total $0.491 $0.064*All reserve and resource data sourced from IntierraRMG, additional data sourced from Capital IQ and Market Q.**NiEq = nickel equivalent. Calculated based on Haywood's formal long-term metal price forecasts.***Nickel Ratio = value of in situ nickel / total value of in situ metals.
Primary / Secondary
Metal
Reserves & Resources* - AttributableEV/lb NiEq** (US$)
Shares Market Working LTD Enterprise ZincCompany Symbol Price O/S Capitalization Capital Value Value Ratio*** Reserve (P&P) Resource (Total)
(million) (million) (million) (million) (million) (% Contained) (ZnEq** Mlb) (ZnEq** Mlb) Reserve TotalAquila Resources Inc. TSX:AQA C$ 0.26 271.5 US$ 51 US$ (0.5) US$ 0.0 US$ 51 Au / Zn 19% - 1,587 - $0.032Canada Zinc Metals Corp. TSXV:CZX C$ 0.28 158.6 US$ 32 US$ 5.9 US$ 0.0 US$ 27 Zn / Pb 82% - 6,096 - $0.004Canadian Zinc Corporation TSX:CZN C$ 0.18 265.9 US$ 35 US$ 7.1 US$ 0.0 US$ 28 Zn / Pb 40% 2,525 10,077 $0.011 $0.003El Nino Ventures Inc. TSXV:ELN C$ 0.03 61.6 US$ 1 US$ 0.2 US$ 0.0 US$ 1 Zn / Cu 45% - 1,357 - $0.001Firestone Ventures Inc. TSXV:FV C$ 0.04 36.8 US$ 1 US$ (0.6) US$ 0.0 US$ 2 Zn / Pb 73% - 454 - $0.004Foran Mining Corporation TSXV:FOM C$ 0.27 99.0 US$ 20 US$ 0.8 US$ 0.0 US$ 19 Cu / Zn 33% - 4,962 - $0.004InZinc Mining Ltd. TSXV:IZN C$ 0.13 73.4 US$ 7 US$ 0.4 US$ 0.0 US$ 6 Zn / Cu 77% - 3,873 - $0.002Rathdowney Resources Ltd. TSXV:RTH C$ 0.26 176.2 US$ 34 US$ (1.5) US$ 0.0 US$ 35 Zn / Pb 80% - 3,437 - $0.010Wolfden Resources Corp. TSXV:WLF C$ 0.14 81.1 US$ 8 US$ 1.2 US$ 0.0 US$ 7 Au / Zn 29% - 4,516 - $0.002Group Average - Total $0.011 $0.007*All reserve and resource data sourced from IntierraRMG, additional data sourced from Capital IQ and Market Q.**ZnEq = Zinc equivalent. Calculated based on Haywood's formal long-term metal price forecasts.***Zinc Ratio = value of in situ zinc / total value of in situ metals.
Primary / Secondary
Metal
Reserves & Resources* - AttributableEV/lb ZnEq** (US$)

The Weekly Dig 4/28/17
Haywood Mining [email protected] Page 34
Dissemination of Research Research reports are disseminated either through electronic medium or in printed copy. Clients may access reports on our website, or receive publications directly via email. Haywood strives to ensure all clients receive research in a timely manner and at the same time. It is against our policy for analysts to discuss or circulate their recommendations internally prior to public distribution. This policy applies equally to recommendation changes, target changes and/or forecast revisions. For Canadian residents: Haywood Securities Inc. is a Canadian registered broker-dealer and a member of the Investment Industry Regulatory Organization of Canada, the Toronto Stock Exchange, the Toronto Venture Exchange and the Canadian Investor Protection Fund and accepts responsibility for the dissemination of this report. Any Canadian client that wishes further information on any securities discussed in this report should contact a qualified salesperson of Haywood Securities Inc. For U.S. residents: This investment research is distributed in the United States, as third party research by Haywood Securities (USA) Inc. Haywood Securities (USA) Inc. is a wholly owned subsidiary of Haywood Securities Inc., registered with the U.S. Securities and Exchange Commission, and is a member of FINRA and the Securities Investor Protection Corporation (SIPC). Haywood Securities (USA) Inc. as a U.S. registered broker-dealer accepts responsibility for this Research Report and its dissemination in the United States. Any U.S. client that wishes further information on any securities discussed in this report or wish to effect a transaction in these securities should contact a qualified salesperson of Haywood Securities (USA) Inc. Haywood Securities Inc. Research Analysts are considered Foreign Research Analysts to the USA and are not registered/qualified as Research Analysts with FINRA. As these analysts are considered Foreign Research Analysts they may not be specifically subject to FINRA (formerly NASD) Rule 2711 and FINRA (formerly NYSE) Rule 472 restrictions on communications with a Subject Company, Public Appearances and trading securities held by a Research Analyst Account. This report may be distributed in the following states: nil. Otherwise, this report may only be distributed into those states with an institutional buyer state securities registration exemption.
Analyst Certification We, Mick Carew, Geordie Mark, Colin Healey, Pierre Vaillancourt, and Kerry Smith, hereby certify that the views expressed in this report (which includes the rating assigned to the issuer’s shares as well as the analytical substance and tone of the report) accurately reflect my/our personal views about the subject securities and the issuer. No part of my/our compensation was, is, or will be directly or indirectly related to the specific recommendations.
Important Disclosures Of the companies included in the report the following Important Disclosures apply:
Ticker Company 1 2 3 4 5 6 7 8
TSX:AGI Alamos Gold Inc. X X X TSX:AKG Asanko Gold Inc. X TSXV:AGB Atlantic Gold Corp. X X X X TSX:AVK Avnel Gold Mining Limited X X TSX:BTO B2Gold Corp. X X TSXV:BGM Barkerville Gold Mines Ltd. X X X X TSX:ABX Barrick Gold Corporation X TSXV:CXB Calibre Mining Corp. X X X TSX:DML Denison Mines Corp. X X X TSX:DGC Detour Gold Corporation X X TSX:ELD Eldorado Gold Corporation X X TSX:EDV Endeavour Mining Corp. X X X TSX:EFR Energy Fuels Inc. X X X ASX:GOR Gold Road Resources Limited X TSX:HRT Harte Gold Corp. X

The Weekly Dig 4/28/17
Haywood Mining [email protected] Page 35
TSXV:ICG Integra Gold Corp. X X TSX:LUC Lucara Diamond Corp. X X TSX:LUG Lundin Gold Inc. X X TSX:MOZ Marathon Gold Corp. X X X X TSX:MAX Midas Gold Corp. X X X TSX:MPVD Mountain Province Diamonds Inc. X X X TSX:NXE NexGen Energy Ltd. X X TSXV:NCA NewCastle Gold Ltd. X X X TSX:OGC OceanaGold Corporation X TSX:OR Osisko Gold Royalties Ltd. X TSX:OSK Osisko Mining Corp. X X TSX:PLG Pilot Gold Inc. X X TSXV:PGM Pure Gold Mining Inc. X X X TSXV:REG Regulus Resources Inc. X X X TSX:RIC Richmont Mines Inc. X X TSXV:ROG Roxgold Inc. X X X TSX:SBB Sabina Gold and Silver Corp. X X TSX:SMF SEMAFO Inc. X TSX:THO Tahoe Resources Inc. X TSXV:TREK Trek Mining Inc. X X X X X AMEX:UEC Uranium Energy Corp. X X X TSX:U Uranium Participation Corporation X X
1 The Analyst(s) preparing this report (or a member of the Analysts’ households) have a financial interest in this company.
2 As of the end of the month immediately preceding this publication either Haywood Securities, Inc., one of its subsidiaries, its officers or directors beneficially owned 1% or more of this company.
3 Haywood Securities, Inc. has reviewed lead projects of this company and a portion of the expenses for this travel have been reimbursed by the issuer.
4 Haywood Securities Inc. or one of its subsidiaries has managed or co-managed or participated as selling group in a public offering of securities for this company in the past 12 months.
5 Haywood Securities, Inc. or one of its subsidiaries has received compensation for investment banking services from this company in the past 12 months
6 Haywood Securities, Inc. or one of its subsidiaries has received compensation for investment banking services from this company in the past 24 months
7 Haywood Securities, Inc. or one of its subsidiaries is restricted on this company at the time of publication
8 Haywood Securities, Inc. or one of its subsidiaries expects to receive or intends to seek compensation for investment banking services from this company in the next three months
Other material conflict of interest of the research analyst of which the research analyst or Haywood Securities Inc. knows or has reason to know at the time of publication or at the time of public appearance: Haywood Securities, Inc. pro group holdings exceed 10% of the issued and outstanding shares of Trek Mining Inc. (TREK-V).
Rating Structure Each company within an analyst’s universe, or group of companies covered, is assigned: (i) a recommendation or rating, usually BUY, HOLD, or SELL; (ii) a 12 month target price, which represents an analyst’s current assessment of a company’s potential stock price over the next year; (iii) an overall risk rating which represents an analyst’s assessment of the company’s overall investment risk; and (iv) specific risk ratings or risk profile parameters which in their aggregate support an analyst’s overall risk rating. These ratings are more fully explained below. Before acting on our recommendation we caution you to confer with your Haywood investment advisor to determine the suitability of our recommendation for your specific investment objectives, risk tolerance and investment time horizon.

The Weekly Dig 4/28/17
Haywood Mining [email protected] Page 36
Recommendation Rating BUY –The analyst believes that the security will outperform other companies in their sector on a risk adjusted basis or for the reasons stated in the research report the analyst believes that the security is deserving of a (continued) BUY rating. HOLD – The analyst believes that the security is expected to perform in line with other companies in their sector on a risk adjusted basis or for the reasons stated in the research report the analyst believes that the security is deserving of a (continued) HOLD rating. SELL – Investors are advised to sell the security or hold alternative securities within the sector. Stocks in this category are expected to under-perform other companies on a risk adjusted basis or for the reasons stated in the research report the analyst believes that the security is deserving of a (continued) SELL rating. TENDER – The analyst is recommending that investors tender to a specific offering for the company’s stock. RESEARCH COMMENT – An analyst comment about an issuer event that does not include a rating or recommendation. UNDER REVIEW – Placing a stock Under Review does not revise the current rating or recommendation of the analyst. A stock will be placed Under Review when the relevant company has a significant material event with further information pending or to be announced. An analyst will place a stock Under Review while he/she awaits sufficient information to re-evaluate the company’s financial situation. COVERAGE DROPPED – Haywood Securities will no longer cover the issuer. Haywood will provide notice to clients whenever coverage of an issuer is discontinued. Haywood’s focus is to search for undervalued companies which analysts believe may achieve attractive risk-adjusted returns. This research coverage on potentially undervalued companies may result in an outweighed percentage of companies rated as BUY. Management regularly reviews rating and targets in all sectors to ensure fairness and accuracy. For further information on Haywood Securities’ research dissemination policies, please visit: http://haywood.com/what-we-offer/research/research-policy
Overall Risk Rating Very High Risk: Venture type companies or more established micro, small, mid or large cap companies whose risk profile parameters and/or lack of liquidity warrant such a designation. These companies are only appropriate for investors who have a very high tolerance for risk and volatility and who are capable of incurring temporary or permanent loss of a very significant portion of their investment capital. High Risk: Typically micro or small cap companies which have an above average investment risk relative to more established or mid to large cap companies. These companies will generally not form part of the broad senior stock market indices and often will have less liquidity than more established mid and large cap companies. These companies are only appropriate for investors who have a high tolerance for risk and volatility and who are capable of incurring a temporary or permanent loss of a significant loss of their investment capital. Medium-High Risk: Typically mid to large cap companies that have a medium to high investment risk. These companies will often form part of the broader senior stock market indices or sector specific indices. These companies are only appropriate for investors who have a medium to high tolerance for risk and volatility and who are prepared to accept general stock market risk including the risk of a temporary or permanent loss of some of their investment capital. Moderate Risk: Large to very large cap companies with established earnings who have a track record of lower volatility when compared against the broad senior stock market indices. These companies are only appropriate for investors who have a medium tolerance for risk and volatility and who are prepared to accept general stock market risk including the risk of a temporary or permanent loss of some of their investment capital.
Distribution of Ratings (as of April 28, 2017) IB Clients
% # (TTM) Buy 77.9% 74 95.8% Hold 7.4% 7 0.0% Sell 0.0% 0 0.0%

The Weekly Dig 4/28/17
Haywood Mining [email protected] Page 37
Tender 1.1% 1 0.0% UR (Buy) 0.0% 0 0.0% UR (Hold) 0.0% 0 0.0% UR (Sell) 0.0% 0 0.0% dropped (TTM) 13.7% 13 4.2%
Price Chart, Rating and Target Price History (as of April 28, 2017) Alamos Gold Inc. (AGI-T) Date Target(C$) Rating
7/11/16 $13.00 Buy7/7/16 $14.75 Buy
5/30/16 $10.25 Buy5/13/16 $9.50 Buy3/28/16 $7.75 Buy1/12/16 $7.00 Buy
11/13/15 $8.00 Buy7/15/15 $9.00 Buy1/27/15 $9.25 Buy
10/23/14 $11.25 Buy4/16/14 $12.00 Buy
0
5
10
15
20
25
Apr14
Jul14
Oct14
Jan15
Apr15
Jul15
Oct15
Jan16
Apr16
Jul16
Oct16
Jan17
Price History (C$) Target/Rating/Coverage Change
Asanko Gold Inc. (AKG-T) Date Target(C$) Rating2/28/17 $5.20 Buy2/22/17 $5.50 Buy1/25/17 $5.50 Hold7/11/16 $6.50 Buy5/31/16 $5.25 Buy5/3/16 $5.00 Buy4/7/16 $3.50 Buy
3/24/16 $3.25 Hold1/12/16 $3.25 Buy7/15/15 $3.60 Buy1/21/15 $3.20 Buy
10/23/14 $3.35 Buy4/16/14 $3.60 Buy
Initiated Coverage 12/11/13
0
1
2
3
4
5
6
7
Apr14
Jul14
Oct14
Jan15
Apr15
Jul15
Oct15
Jan16
Apr16
Jul16
Oct16
Jan17
Price History (C$) Target/Rating/Coverage Change
Atlantic Gold Corporation (AGB-V) Date Target(C$) Rating1/25/17 $1.30 Buy10/6/16 $1.35 Buy7/11/16 $1.25 Buy5/19/16 $1.10 Buy12/9/15 $1.00 Buy3/1/16 $0.85 Buy
1/12/16 $0.55 Buy12/10/15 $0.50 Buy
Initiated Coverage 12/9/15
0
0.2
0.4
0.6
0.8
1
1.2
1.4
1.6
Feb14
May14
Aug14
Nov14
Feb15
May15
Aug15
Nov15
Feb16
May16
Aug16
Nov16
Price History (C$) Target/Rating/Coverage Change
Avnel Gold Mining Limited (AVK-T) Date Target(C$) Rating3/27/17 $0.60 Buy
Initiated Coverage: 3/27/2017
00.10.20.30.40.50.60.70.80.9
Mar14
Jun14
Sep14
Dec14
Mar15
Jun15
Sep15
Dec15
Mar16
Jun16
Sep16
Dec16
Price History (C$) Target/Rating/Coverage Change
B2Gold Corp. (BTO-T) Date Target(C$) Rating1/25/17 $5.50 Buy8/5/16 $6.00 Buy8/3/16 $5.00 Buy
7/11/16 $4.50 Buy5/31/16 $2.80 Buy5/13/16 $2.75 Hold3/18/16 $2.10 Hold
11/16/15 $2.10 Buy3/17/15 $2.75 Buy1/27/15 $3.25 Buy
11/17/14 $3.20 Buy10/23/14 $3.45 Buy8/15/14 $3.75 Buy7/9/14 $3.90 Buy
Transferred Coverage 09/12/12; Re-Initiated Coverage 02/05/14
0
1
2
3
4
5
6
7
Apr14
Jul14
Oct14
Jan15
Apr15
Jul15
Oct15
Jan16
Apr16
Jul16
Oct16
Jan17
Price History (C$) Target/Rating/Coverage Change
Barkerville Gold Mines Ltd. (BGM-V) Date Target(C$) Rating4/20/17 $1.60 Buy3/30/17 $1.00 Buy
Initiated Coverage: 3/30/2017
00.20.40.60.8
11.21.41.61.8
2
Apr14
Jul14
Oct14
Jan15
Apr15
Jul15
Oct15
Jan16
Apr16
Jul16
Oct16
Jan17
Price History (C$) Target/Rating/Coverage Change
Barrick Gold Corporation (ABX-T) Date Target(C$) Rating4/26/17 $37.00 Buy2/17/17 $38.50 Buy1/25/17 $33.00 Buy7/11/16 $37.50 Buy5/31/16 $25.25 Buy4/27/16 $25.00 Buy4/18/16 $20.50 Buy2/19/16 $19.50 Buy1/12/16 $14.50 Buy8/7/15 $11.00 Buy
7/15/15 $15.65 Hold4/29/15 $15.75 Hold2/20/15 $15.00 Hold1/27/15 $14.25 Hold
10/23/14 $17.25 Hold7/9/14 $23.50 Hold5/1/14 $23.00 Hold
05
1015202530354045
Apr14
Jul14
Oct14
Jan15
Apr15
Jul15
Oct15
Jan16
Apr16
Jul16
Oct16
Jan17
Price History (C$) Target/Rating/Coverage Change
Denison Mines Corp. (DML-T) Date Target(C$) Rating5/31/16 $1.80 Buy1/12/16 $1.90 Buy
Transferred & Re-initiated Coverage 08/20/12
00.20.40.60.8
11.21.41.61.8
2
Mar14
Jun14
Sep14
Dec14
Mar15
Jun15
Sep15
Dec15
Mar16
Jun16
Sep16
Dec16
Price History (C$) Target/Rating/Coverage Change

The Weekly Dig 4/28/17
Haywood Mining [email protected] Page 38
Detour Gold Corporation (DGC-T) Date Target(C$) Rating1/25/17 $32.00 Buy11/3/16 $38.00 Buy7/11/16 $49.00 Buy5/31/16 $32.00 Buy4/15/16 $28.00 Buy3/11/16 $24.00 Buy1/27/16 $19.50 Buy1/12/16 $18.75 Buy7/15/15 $18.50 Buy1/27/15 $14.00 Buy
10/23/14 $13.50 Buy7/31/14 $15.50 Buy7/9/14 $16.50 Buy
4/16/14 $13.75 Buy3/6/14 $12.50 Buy
0
10
20
30
40
50
60
Feb14
May14
Aug14
Nov14
Feb15
May15
Aug15
Nov15
Feb16
May16
Aug16
Nov16
Price History (C$) Target/Rating/Coverage Change
Eldorado Gold Corporation (ELD-T) Date Target(C$) Rating1/25/17 $8.25 Buy7/29/16 $8.75 Buy7/11/16 $9.25 Buy5/31/16 $7.50 Buy5/13/16 $6.75 Buy1/26/16 $4.50 Buy1/12/16 $6.50 Buy7/15/15 $6.75 Buy2/23/15 $7.75 Buy1/27/15 $9.00 Buy
10/23/14 $9.50 Buy7/9/14 $8.50 Hold
4/16/14 $8.00 Hold
0123456789
10
Mar14
Jun14
Sep14
Dec14
Mar15
Jun15
Sep15
Dec15
Mar16
Jun16
Sep16
Dec16
Price History (C$) Target/Rating/Coverage Change
Endeavour Mining Corporation (EDV-T) Date Target(C$) Rating1/25/17 $31.00 Buy
10/20/16 $33.00 Buy7/11/16 $33.00 Buy5/31/16 $22.00 Buy4/21/16 $19.75 Buy3/21/16 $14.50 Buy1/18/16 $12.00 Buy12/3/15 $11.00 Buy1/27/15 $13.00 Buy11/5/14 $11.50 Buy
10/23/14 $10.50 Buy8/21/14 $12.50 Buy
Initiated Coverage 08/21/14; 10:1 Prices/Targets adjusted to reflect Stock Consolidation 12/02/15; Transfer of Coverage 10/20/16
0
5
10
15
20
25
30
35
Apr14
Jul14
Oct14
Jan15
Apr15
Jul15
Oct15
Jan16
Apr16
Jul16
Oct16
Jan17
Price History (C$) Target/Rating/Coverage Change
Energy Fuels Inc. (AMEX:UUUU) Date Target(US$) Rating1/25/17 $4.80 Buy11/4/16 $5.00 Buy5/31/16 $6.00 Buy1/12/16 $7.25 Buy9/30/15 $8.20 Buy7/15/15 $9.41 Buy7/9/14 $11.73 Buy
4/16/14 $12.71 Buy3/31/14 $13.55 Buy
Targets and prices prior to 11/06/13 adjusted for share consolidation; Transferred & Re-initiated Coverage 08/20/12; Targets prior to 05/31/16 converted to US$ at spot
0
2
4
6
8
10
12
14
16
Feb14
May14
Aug14
Nov14
Feb15
May15
Aug15
Nov15
Feb16
May16
Aug16
Nov16
Price History (US$) Target/Rating/Coverage Change
Gold Road Resources Limited (GOR-A) Date Target(C$) Rating10/20/16 $1.00 Buy9/13/16 $1.00 Buy
Initiated Coverage 9/13/2016; Transfer of Coverage 10/20/16
0
0.5
1
1.5
2
2.5
3
Jan14
Apr14
Jul14
Oct14
Jan15
Apr15
Jul15
Oct15
Jan16
Apr16
Jul16
Oct16
Price History (C$) Target/Rating/Coverage Change
Harte Gold Corp. (HRT-T) Date Target(C$) Rating4/12/17 $1.00 Buy
Initiated Coverage: 4/12/2017
0
0.2
0.4
0.6
0.8
1
1.2
Apr14
Jul14
Oct14
Jan15
Apr15
Jul15
Oct15
Jan16
Apr16
Jul16
Oct16
Jan17
Price History (C$) Target/Rating/Coverage Change
Integra Gold Corp. (ICG-V) Date Target(C$) Rating1/25/17 $0.90 Buy7/11/16 $0.90 Hold5/31/16 $0.70 Hold1/12/16 $0.60 Buy7/15/15 $0.70 Buy6/23/15 $0.65 Buy
Initiated Coverage 6/23/16
0
0.2
0.4
0.6
0.8
1
Apr14
Jul14
Oct14
Jan15
Apr15
Jul15
Oct15
Jan16
Apr16
Jul16
Oct16
Jan17
Price History (C$) Target/Rating/Coverage Change
Lucara Diamond Corp. (LUC-T) Date Target(C$) Rating1/25/17 $3.50 Buy12/1/16 $3.00 Hold
11/10/16 $3.25 Hold8/8/16 $3.70 Hold8/2/16 $3.90 Hold
6/30/16 $3.90 Buy5/31/16 $4.40 Hold5/4/16 $4.10 Buy
3/15/16 $3.40 Buy1/12/16 $3.15 Buy12/3/15 $2.80 Buy8/13/15 $2.50 Buy4/28/15 $2.80 Buy
Initiated Coverage 04/28/15
00.5
11.5
22.5
33.5
44.5
5
Jan14
Apr14
Jul14
Oct14
Jan15
Apr15
Jul15
Oct15
Jan16
Apr16
Jul16
Oct16
Price History (C$) Target/Rating/Coverage Change
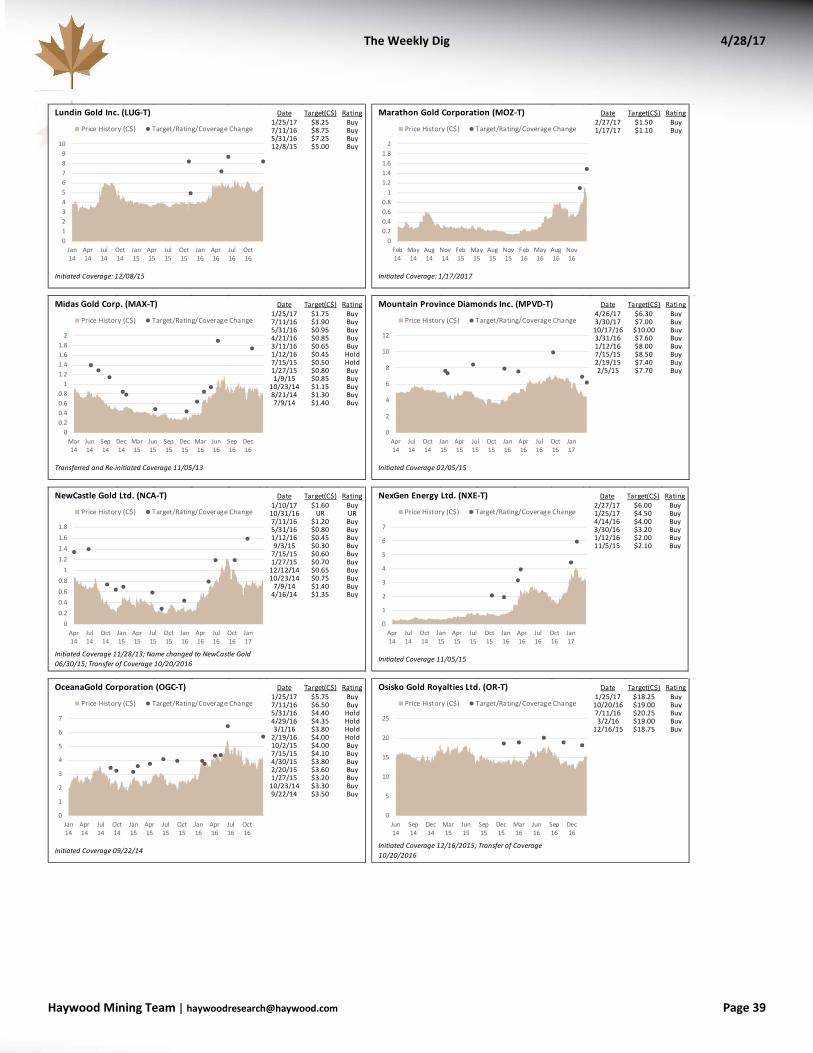
The Weekly Dig 4/28/17
Haywood Mining [email protected] Page 39
Lundin Gold Inc. (LUG-T) Date Target(C$) Rating1/25/17 $8.25 Buy7/11/16 $8.75 Buy5/31/16 $7.25 Buy12/8/15 $5.00 Buy
Initiated Coverage: 12/08/15
0123456789
10
Jan14
Apr14
Jul14
Oct14
Jan15
Apr15
Jul15
Oct15
Jan16
Apr16
Jul16
Oct16
Price History (C$) Target/Rating/Coverage Change
Marathon Gold Corporation (MOZ-T) Date Target(C$) Rating2/27/17 $1.50 Buy1/17/17 $1.10 Buy
Initiated Coverage: 1/17/2017
00.20.40.60.8
11.21.41.61.8
2
Feb14
May14
Aug14
Nov14
Feb15
May15
Aug15
Nov15
Feb16
May16
Aug16
Nov16
Price History (C$) Target/Rating/Coverage Change
Midas Gold Corp. (MAX-T) Date Target(C$) Rating1/25/17 $1.75 Buy7/11/16 $1.90 Buy5/31/16 $0.95 Buy4/21/16 $0.85 Buy3/11/16 $0.65 Buy1/12/16 $0.45 Hold7/15/15 $0.50 Hold1/27/15 $0.80 Buy1/9/15 $0.85 Buy
10/23/14 $1.15 Buy8/21/14 $1.30 Buy7/9/14 $1.40 Buy
Transferred and Re-initiated Coverage 11/05/13
00.20.40.60.8
11.21.41.61.8
2
Mar14
Jun14
Sep14
Dec14
Mar15
Jun15
Sep15
Dec15
Mar16
Jun16
Sep16
Dec16
Price History (C$) Target/Rating/Coverage Change
Mountain Province Diamonds Inc. (MPVD-T) Date Target(C$) Rating4/26/17 $6.30 Buy3/30/17 $7.00 Buy
10/17/16 $10.00 Buy3/31/16 $7.60 Buy1/12/16 $8.00 Buy7/15/15 $8.50 Buy2/19/15 $7.40 Buy2/5/15 $7.70 Buy
Initiated Coverage 02/05/15
0
2
4
6
8
10
12
Apr14
Jul14
Oct14
Jan15
Apr15
Jul15
Oct15
Jan16
Apr16
Jul16
Oct16
Jan17
Price History (C$) Target/Rating/Coverage Change
NewCastle Gold Ltd. (NCA-T) Date Target(C$) Rating1/10/17 $1.60 Buy
10/31/16 UR UR7/11/16 $1.20 Buy5/31/16 $0.80 Buy1/12/16 $0.45 Buy9/3/15 $0.30 Buy
7/15/15 $0.60 Buy1/27/15 $0.70 Buy
12/12/14 $0.65 Buy10/23/14 $0.75 Buy
7/9/14 $1.40 Buy4/16/14 $1.35 Buy
Initiated Coverage 11/28/13; Name changed to NewCastle Gold 06/30/15; Transfer of Coverage 10/20/2016
00.20.40.60.8
11.21.41.61.8
Apr14
Jul14
Oct14
Jan15
Apr15
Jul15
Oct15
Jan16
Apr16
Jul16
Oct16
Jan17
Price History (C$) Target/Rating/Coverage Change
NexGen Energy Ltd. (NXE-T) Date Target(C$) Rating2/27/17 $6.00 Buy1/25/17 $4.50 Buy4/14/16 $4.00 Buy3/30/16 $3.20 Buy1/12/16 $2.00 Buy11/5/15 $2.10 Buy
Initiated Coverage 11/05/15
0
1
2
3
4
5
6
7
Apr14
Jul14
Oct14
Jan15
Apr15
Jul15
Oct15
Jan16
Apr16
Jul16
Oct16
Jan17
Price History (C$) Target/Rating/Coverage Change
OceanaGold Corporation (OGC-T) Date Target(C$) Rating1/25/17 $5.75 Buy7/11/16 $6.50 Buy5/31/16 $4.40 Hold4/29/16 $4.35 Hold3/1/16 $3.80 Hold
2/19/16 $4.00 Hold10/2/15 $4.00 Buy7/15/15 $4.10 Buy4/30/15 $3.80 Buy2/20/15 $3.60 Buy1/27/15 $3.20 Buy
10/23/14 $3.30 Buy9/22/14 $3.50 Buy
Initiated Coverage 09/22/14
0
1
2
3
4
5
6
7
Jan14
Apr14
Jul14
Oct14
Jan15
Apr15
Jul15
Oct15
Jan16
Apr16
Jul16
Oct16
Price History (C$) Target/Rating/Coverage Change
Osisko Gold Royalties Ltd. (OR-T) Date Target(C$) Rating1/25/17 $18.25 Buy
10/20/16 $19.00 Buy7/11/16 $20.25 Buy3/2/16 $19.00 Buy
12/16/15 $18.75 Buy
Initiated Coverage 12/16/2015; Transfer of Coverage 10/20/2016
0
5
10
15
20
25
Jun14
Sep14
Dec14
Mar15
Jun15
Sep15
Dec15
Mar16
Jun16
Sep16
Dec16
Price History (C$) Target/Rating/Coverage Change

The Weekly Dig 4/28/17
Haywood Mining [email protected] Page 40
Osisko Mining Inc. (OSK-T) Date Target(C$) Rating4/6/17 $6.50 Buy
3/17/17 $5.00 Buy10/20/16 $4.00 Buy7/11/16 $4.00 Buy5/31/16 $3.00 Buy2/4/16 $2.00 Buy
12/10/15 $2.50 Buy
Initiated Coverage 12/10/2016; Transfer of Coverage 10/20/2016
0
1
2
3
4
5
6
7
Apr14
Jul14
Oct14
Jan15
Apr15
Jul15
Oct15
Jan16
Apr16
Jul16
Oct16
Jan17
Price History (C$) Target/Rating/Coverage Change
Pilot Gold Inc. (PLG-T) Date Target(C$) Rating10/20/16 $1.00 Buy7/11/16 $1.20 Buy5/31/16 $1.00 Buy1/12/16 $0.70 Buy7/15/15 $1.50 Buy1/29/15 $1.90 Buy1/27/15 $1.60 Buy
10/23/14 $1.70 Buy
Initiated Coverage 10/09/12; Transfer of Coverage 10/20/2016
00.20.40.60.8
11.21.41.61.8
2
Apr14
Jul14
Oct14
Jan15
Apr15
Jul15
Oct15
Jan16
Apr16
Jul16
Oct16
Jan17
Price History (C$) Target/Rating/Coverage Change
Richmont Mines Inc. (RIC-T) Date Target(C$) Rating1/25/17 $14.00 Buy7/11/16 $20.00 Buy5/31/16 $15.75 Buy5/13/16 $12.25 Buy4/13/16 $10.00 Buy3/7/16 $8.00 Buy
Initiated Coverage: 3/7/16
0
5
10
15
20
25
Apr14
Jul14
Oct14
Jan15
Apr15
Jul15
Oct15
Jan16
Apr16
Jul16
Oct16
Jan17
Price History (C$) Target/Rating/Coverage Change
Roxgold Inc. (ROG-V) Date Target(C$) Rating1/25/17 $2.00 Buy
10/20/16 $2.10 Buy7/11/16 $2.15 Buy5/31/16 $1.60 Buy4/28/16 $1.50 Buy7/15/15 $1.10 Buy11/5/14 $1.00 Buy7/9/14 $1.25 Buy
4/23/14 $1.15 Buy
Initiated Coverage 01/27/14; Transfer of Coverage 10/20/2016
0
0.5
1
1.5
2
2.5
Feb14
May14
Aug14
Nov14
Feb15
May15
Aug15
Nov15
Feb16
May16
Aug16
Nov16
Price History (C$) Target/Rating/Coverage Change
Sabina Gold & Silver Corp. (SBB-T) Date Target(C$) Rating1/25/17 $1.70 Buy6/16/16 UR UR (Buy)5/31/16 $1.65 Buy1/12/16 $1.00 Buy
12/15/15 $0.90 Buy
Initiated Coverage 12-15-15
00.20.40.60.8
11.21.41.61.8
2
Feb14
May14
Aug14
Nov14
Feb15
May15
Aug15
Nov15
Feb16
May16
Aug16
Nov16
Price History (C$) Target/Rating/Coverage Change
SEMAFO Inc. (SMF-T) Date Target(C$) Rating4/25/17 $4.50 Buy3/9/17 $5.50 Buy
1/25/17 $7.00 Buy11/10/16 $7.50 Buy7/11/16 $8.25 Buy5/12/16 $6.50 Buy2/26/16 $6.00 Buy7/15/15 $5.00 Buy1/27/15 $5.75 Buy
10/23/14 $6.25 Buy7/9/14 $6.50 Buy
0123456789
Apr14
Jul14
Oct14
Jan15
Apr15
Jul15
Oct15
Jan16
Apr16
Jul16
Oct16
Jan17
Price History (C$) Target/Rating/Coverage Change

The Weekly Dig 4/28/17
Haywood Mining [email protected] Page 41
B: Buy; H: Hold; S: Sell; T: Tender; UR: Under Review
Source: Capital IQ and Haywood Securities
Tahoe Resources Inc. (THO-T) Date Target(C$) Rating3/13/17 $12.00 Hold1/25/17 $14.00 Hold11/4/16 $25.00 Buy8/11/16 $28.00 Buy7/11/16 $25.00 Buy5/9/16 $20.00 Buy
7/15/15 $16.50 Buy4/29/15 $19.25 Buy4/2/15 $16.00 Hold
1/27/15 $14.50 Sell12/5/14 $12.75 Sell11/7/14 $15.00 Sell
10/23/14 $17.25 Sell7/9/14 $18.75 Sell
5/12/14 $17.00 Sell
Initiated Coverage 11/05/13
0
5
10
15
20
25
30
35
Mar14
Jun14
Sep14
Dec14
Mar15
Jun15
Sep15
Dec15
Mar16
Jun16
Sep16
Dec16
Price History (C$) Target/Rating/Coverage Change
Trek Mining Inc. (TREK-V) Date Target(C$) Rating4/4/17 $3.00 Buy
Initiated Coverage: 4/4/2017
0
1
2
3
4
5
6
Apr14
Jul14
Oct14
Jan15
Apr15
Jul15
Oct15
Jan16
Apr16
Jul16
Oct16
Jan17
Price History (C$) Target/Rating/Coverage Change
Uranium Participation Corporation (U-T) Date Target(C$) Rating1/25/17 $5.10 Buy
12/19/16 $5.80 Buy1/12/16 $6.80 Buy7/15/15 $6.50 Buy1/27/15 $6.20 Buy
10/23/14 $5.80 Buy7/9/14 $5.70 Buy
4/16/14 $6.60 Buy
Transferred & Re-initiated Coverage 08/20/12
0
1
2
3
4
5
6
7
8
Jan14
Apr14
Jul14
Oct14
Jan15
Apr15
Jul15
Oct15
Jan16
Apr16
Jul16
Oct16
Price History (C$) Target/Rating/Coverage Change
Uranium Energy Corp. (UEC-AMEX) Date Target(US$) Rating2/3/17 $2.40 Buy
1/25/17 $2.00 Buy5/31/16 $1.80 Buy7/15/15 $2.00 Buy6/24/15 $2.10 Hold7/8/14 $1.70 Hold
4/16/14 $2.00 Hold
Transferred & Re-initiated Coverage 08/20/12
0
0.5
1
1.5
2
2.5
3
3.5
Apr14
Jul14
Oct14
Jan15
Apr15
Jul15
Oct15
Jan16
Apr16
Jul16
Oct16
Jan17
Price History (US$) Target/Rating/Coverage Change