Embed Size (px)
Citation preview
Oscar Salgado Ing. Agr. PUCV-M.B.A
Mercados y países productores de H. Sur
Statistics compiled by A. Hoffmann
Key world table grape countries
producers and exporters
from the
South
Hemisphere
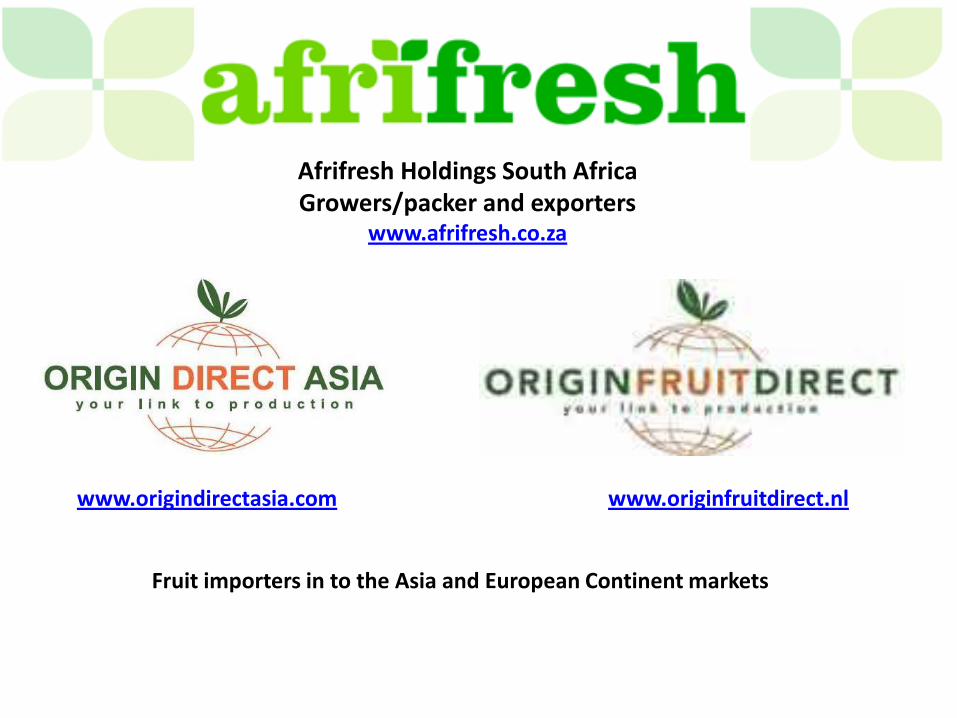
Afrifresh Holdings South AfricaGrowers/packer and exporters
www.afrifresh.co.za
www.origindirectasia.com www.originfruitdirect.nl
Fruit importers in to the Asia and European Continent markets

"El sabio consigue mas ventajas por sus enemigos que el necio por sus
amigos."
Benjamín Franklin

Objetivos
• Tendencias de mercado y lo que se nos viene
• Países productores del Hemisferio Sur, competencias, complementariedad, amenazas y tendencias.
• Entregar información de los otros países Productores de uva de mesa
Todos tenemos esos días en que nos quedamos un poco atascados……..y esperamos que alguien nos ayude………
Con respecto a los que vienen a ayudar o a asesorar ……………!!

…..solo recordar, que no todos los que aparecen, están para ayudarnos!!!!!!.
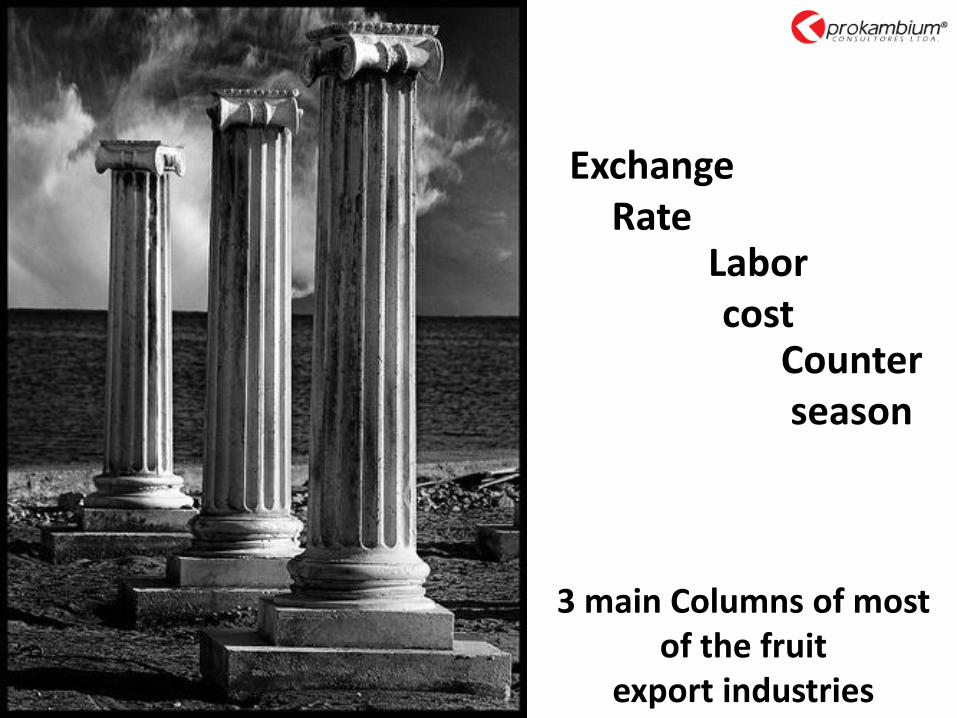
Exchange Rate
Labor cost
Counter season
3 main Columns of most of the fruit
export industries
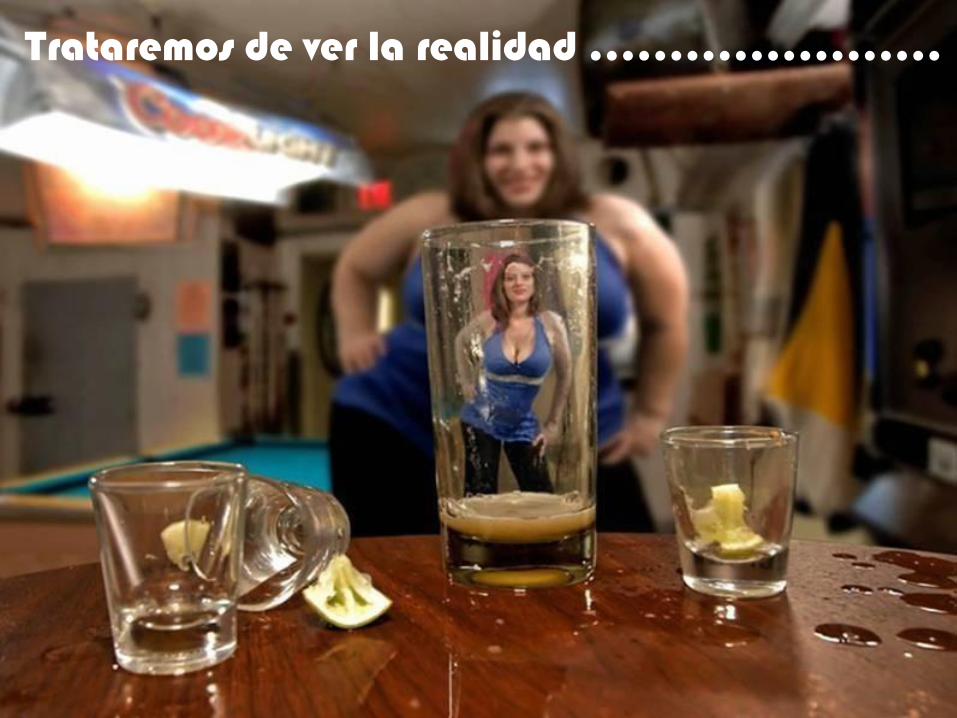
Trataremos de ver la realidad ………………….
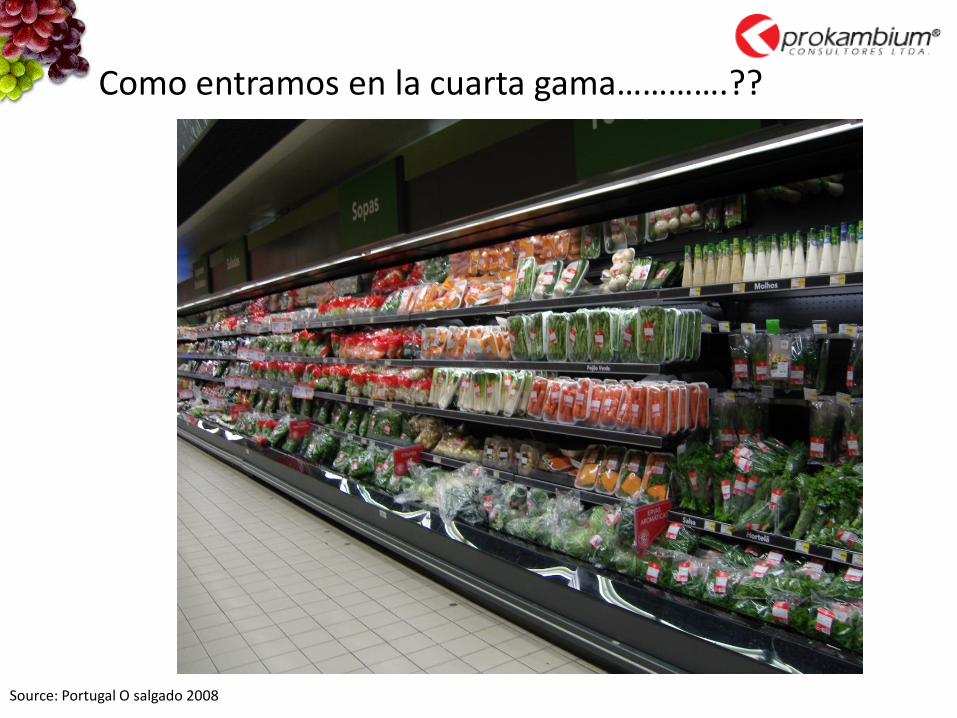
Como entramos en la cuarta gama………….??
Source: Portugal O salgado 2008
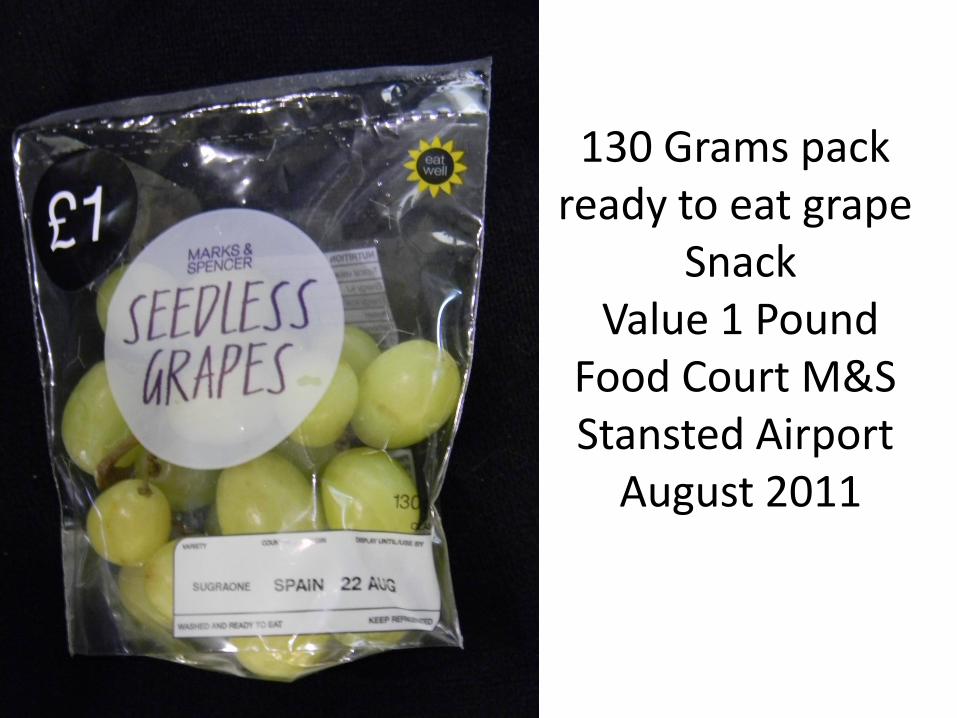
130 Grams pack ready to eat grape
SnackValue 1 Pound
Food Court M&S Stansted Airport
August 2011
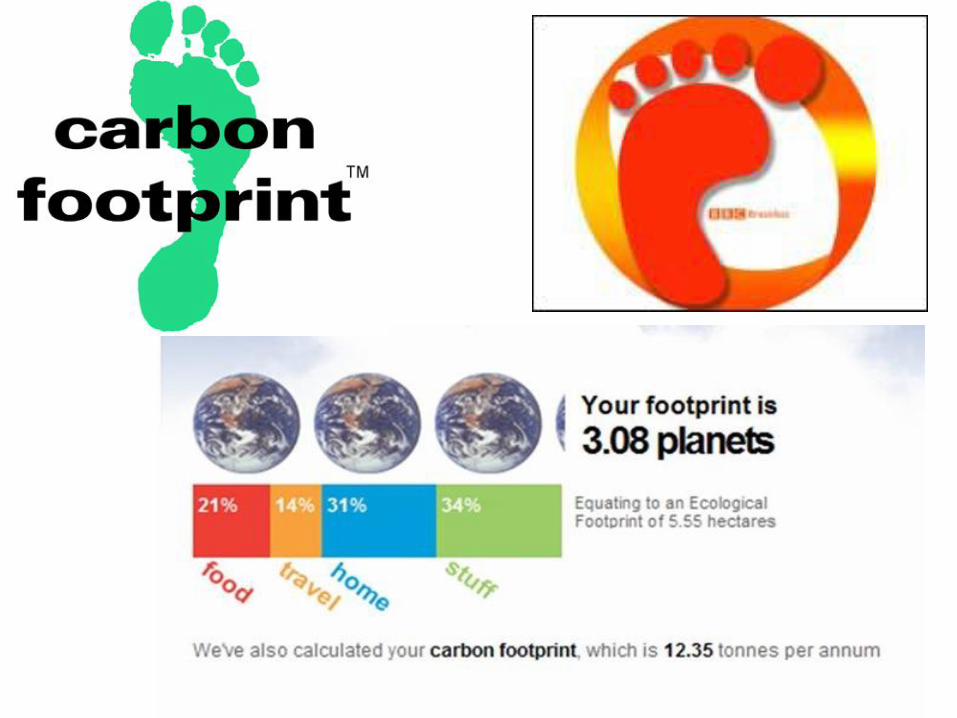

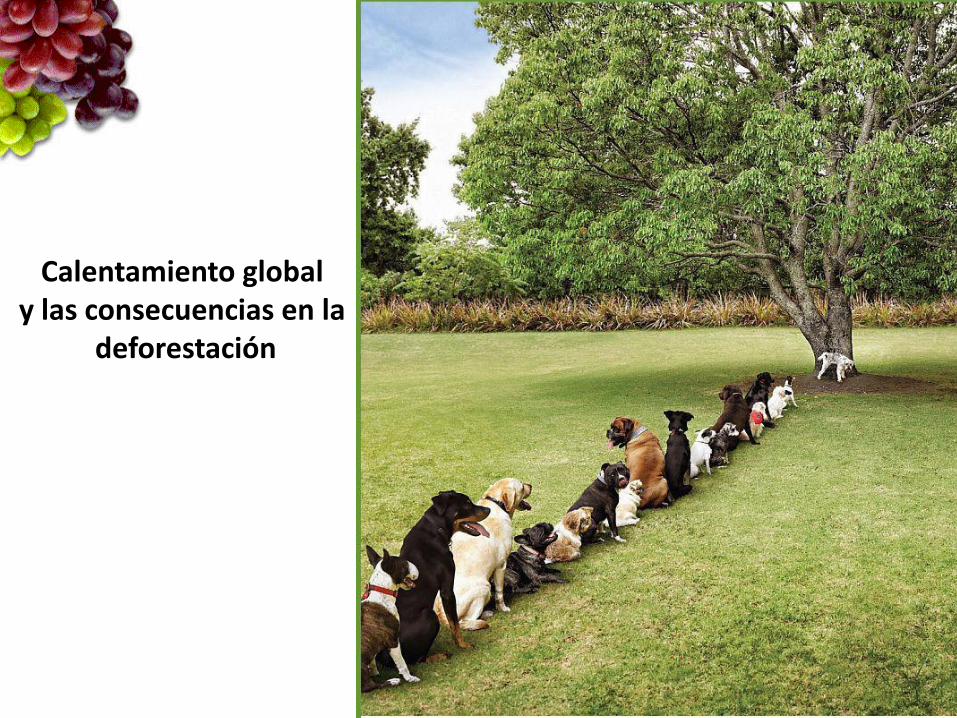
Calentamiento global y las consecuencias en la
deforestación
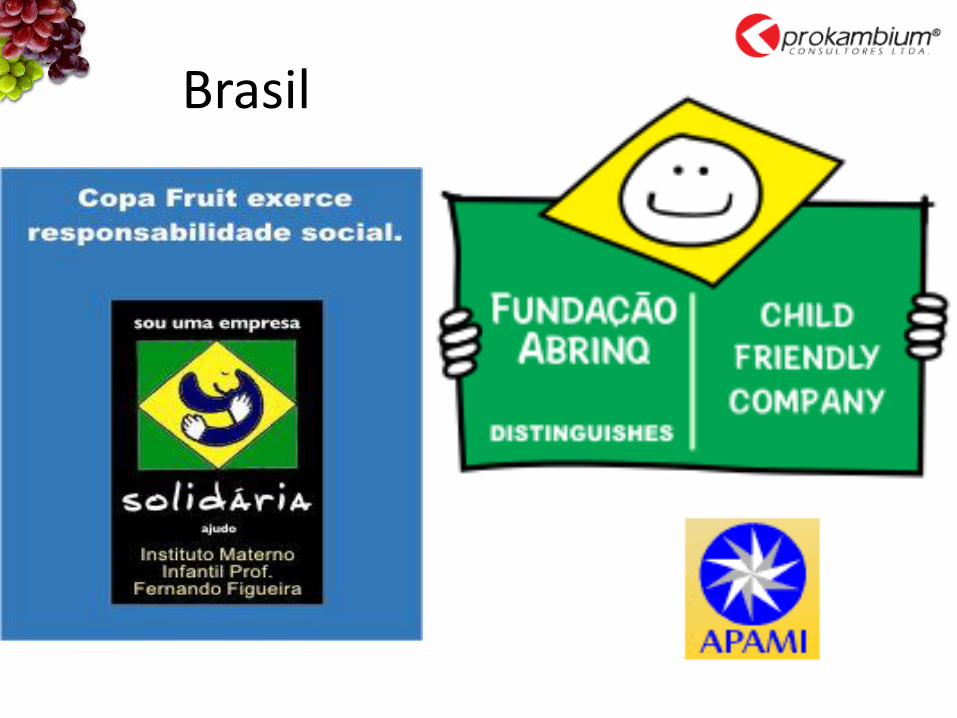
Brasil
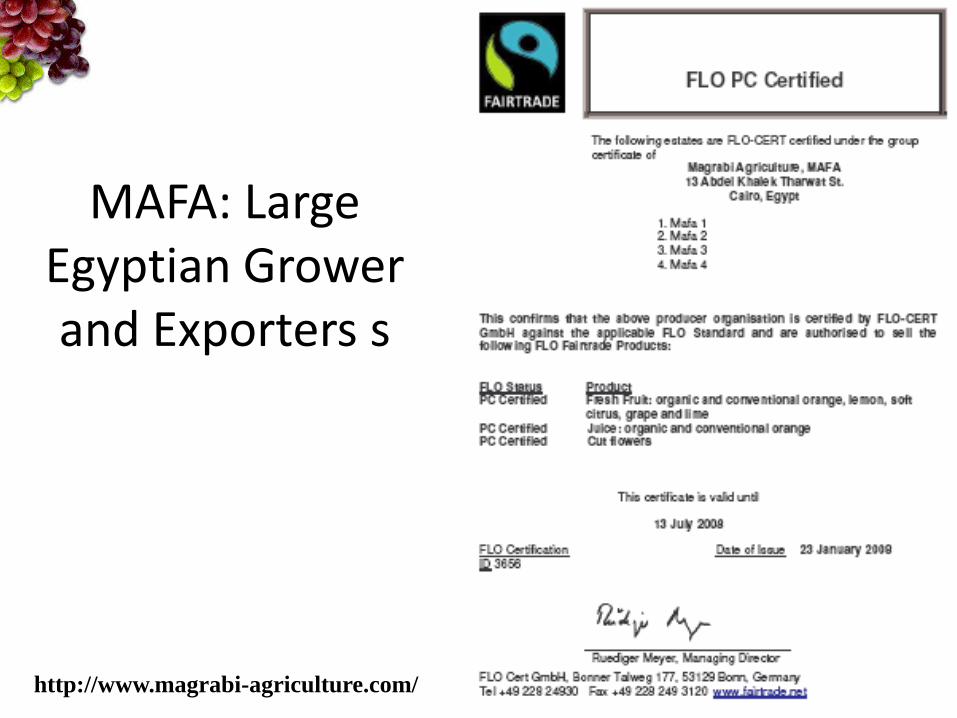
MAFA: Large Egyptian Grower and Exporters s
http://www.magrabi-agriculture.com/
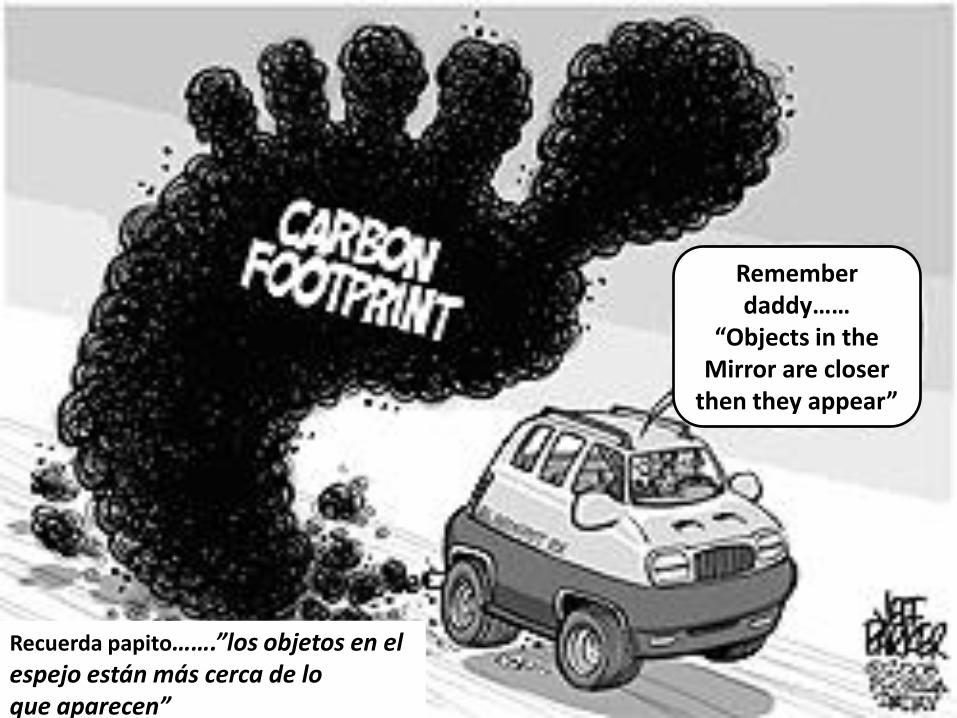
Remember daddy……
“Objects in the Mirror are closer
then they appear”
Recuerda papito…….”los objetos en el espejo están más cerca de lo que aparecen”
Napkin at Starbucks Coffee shop in Davis CA June 2010
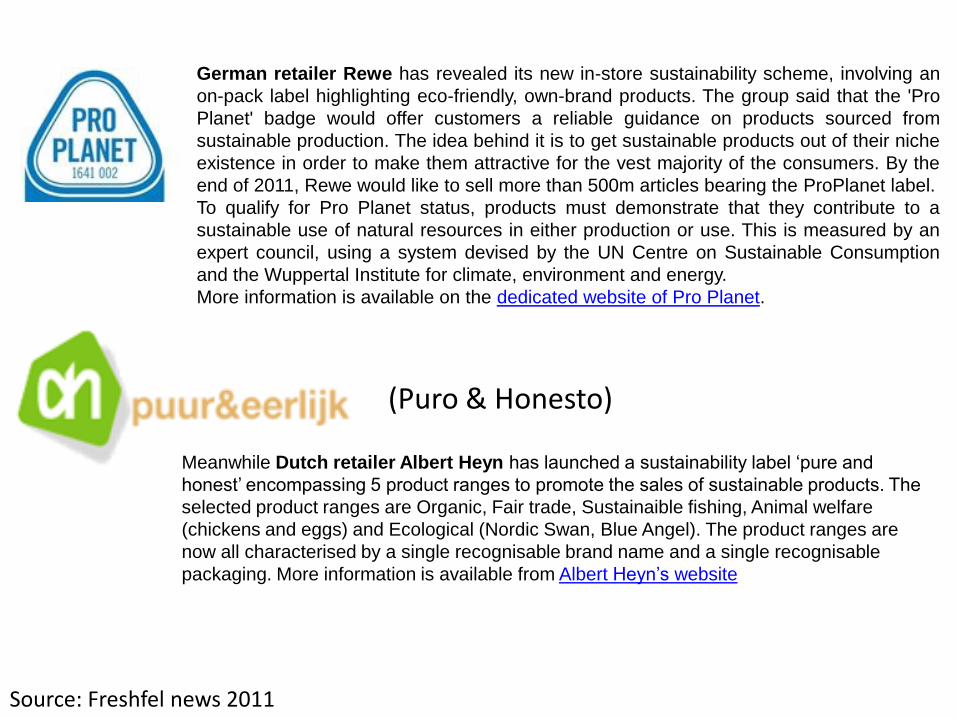
German retailer Rewe has revealed its new in-store sustainability scheme, involving an
on-pack label highlighting eco-friendly, own-brand products. The group said that the 'Pro
Planet' badge would offer customers a reliable guidance on products sourced from
sustainable production. The idea behind it is to get sustainable products out of their niche
existence in order to make them attractive for the vest majority of the consumers. By the
end of 2011, Rewe would like to sell more than 500m articles bearing the ProPlanet label.
To qualify for Pro Planet status, products must demonstrate that they contribute to a
sustainable use of natural resources in either production or use. This is measured by an
expert council, using a system devised by the UN Centre on Sustainable Consumption
and the Wuppertal Institute for climate, environment and energy.
More information is available on the dedicated website of Pro Planet.
Meanwhile Dutch retailer Albert Heyn has launched a sustainability label ‘pure and
honest’ encompassing 5 product ranges to promote the sales of sustainable products. The
selected product ranges are Organic, Fair trade, Sustainaible fishing, Animal welfare
(chickens and eggs) and Ecological (Nordic Swan, Blue Angel). The product ranges are
now all characterised by a single recognisable brand name and a single recognisable
packaging. More information is available from Albert Heyn’s website
Source: Freshfel news 2011
(Puro & Honesto)
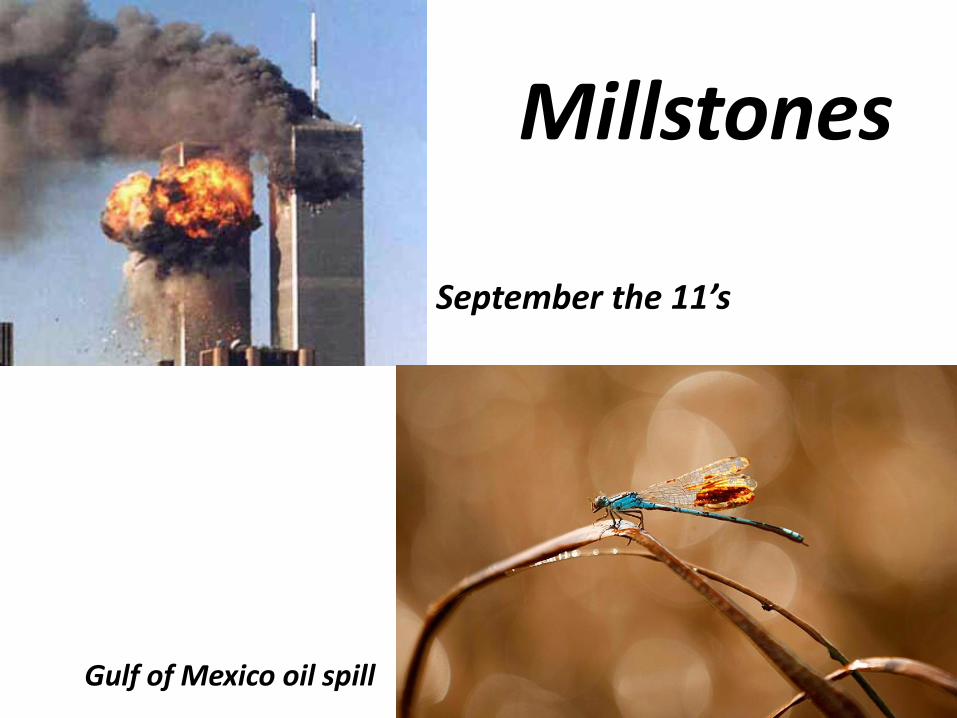
September the 11’s
Gulf of Mexico oil spill
Millstones
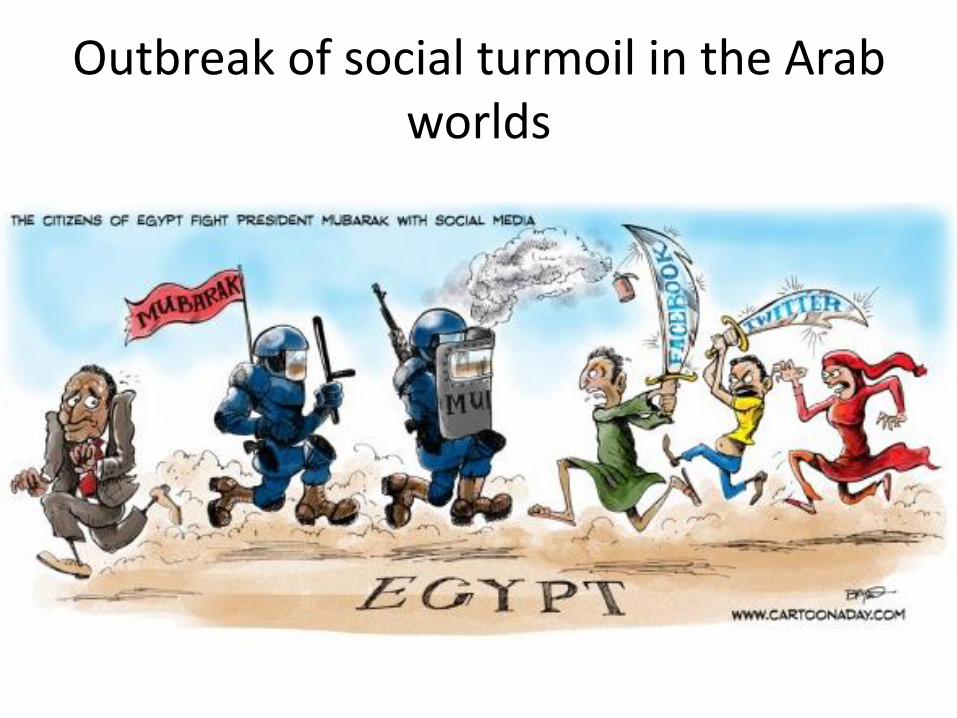
Outbreak of social turmoil in the Arab worlds
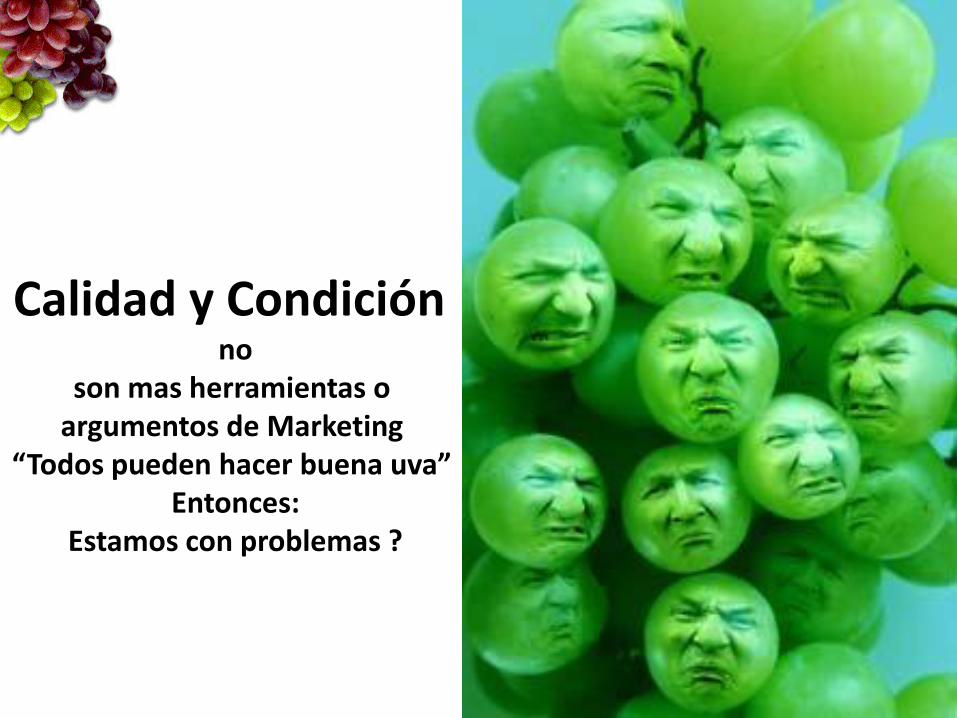
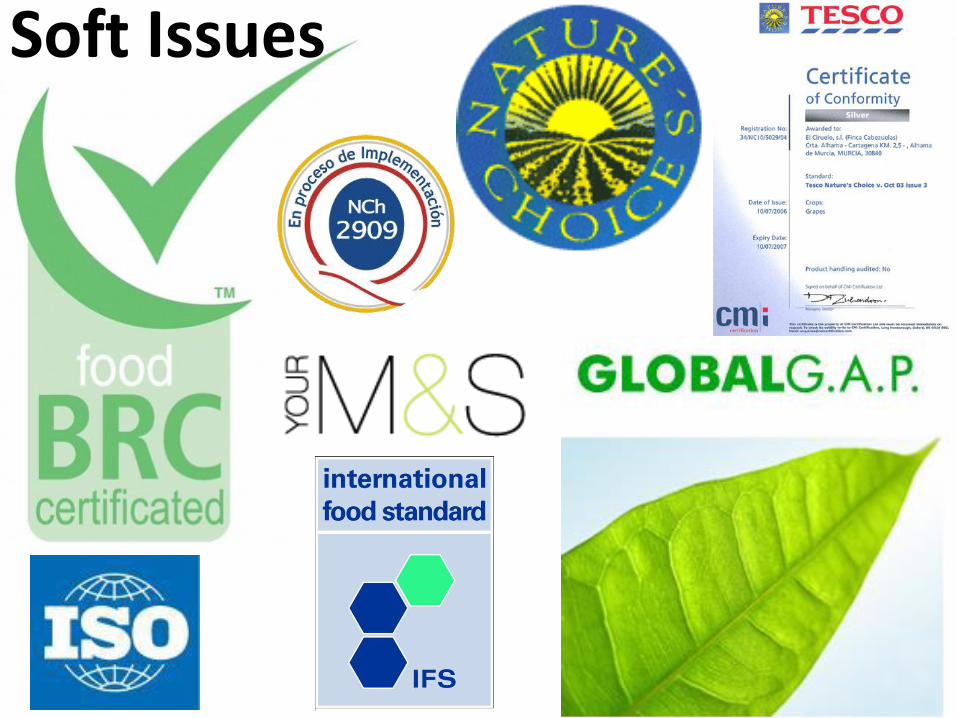
Calidad y Condición no
son mas herramientas o argumentos de Marketing
“Todos pueden hacer buena uva” Entonces:
Estamos con problemas ?
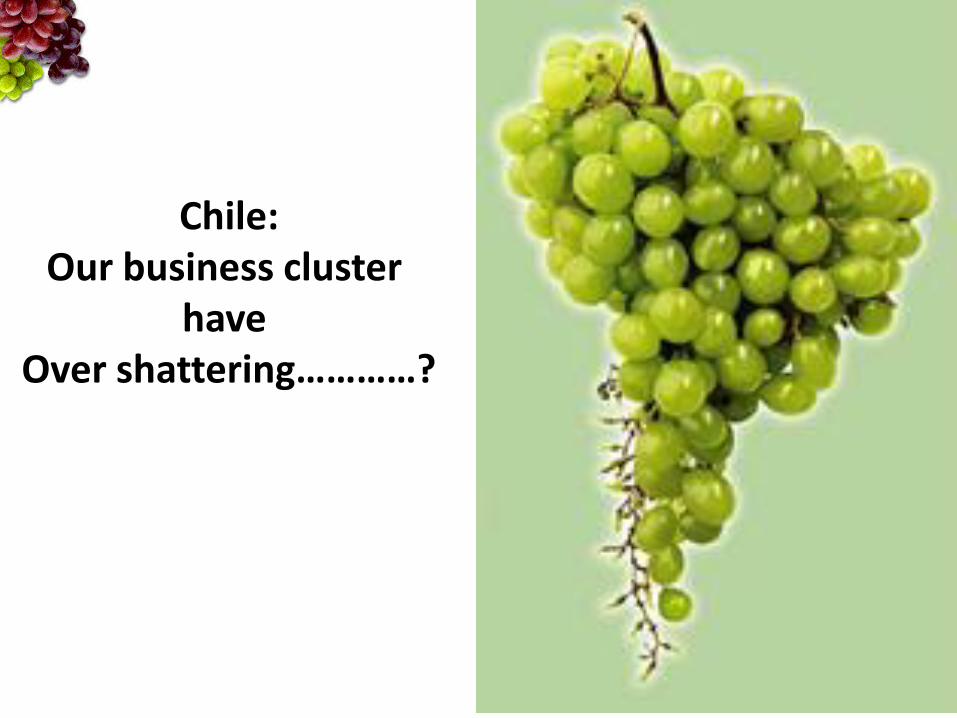
Chile:Our business cluster
have Over shattering…………?
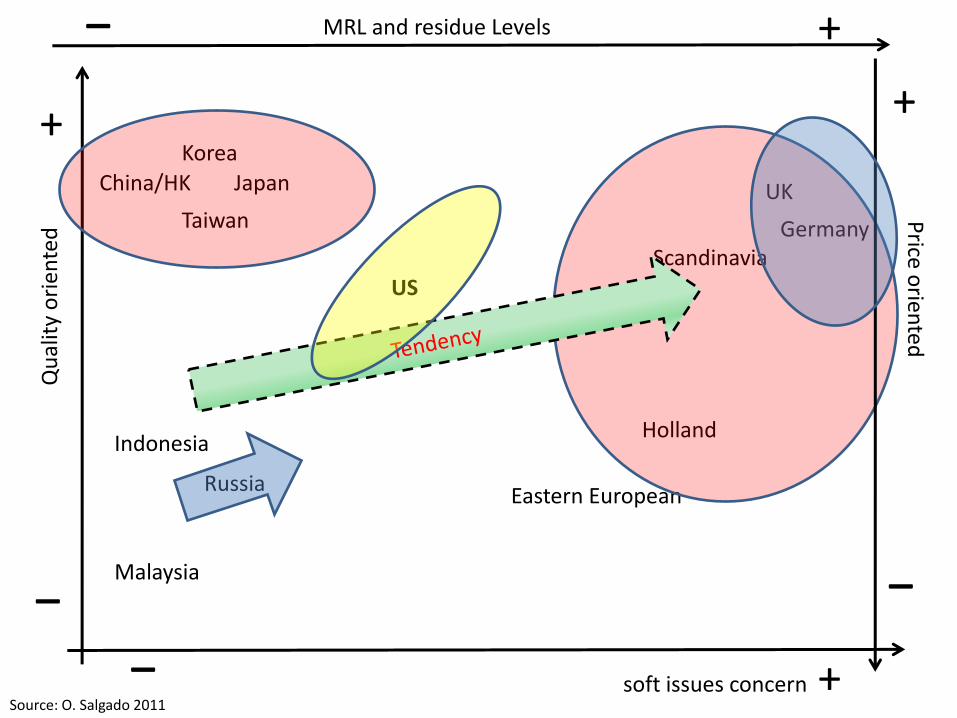
+_
Source: O. Salgado 2011soft issues concern
Qu
alit
y o
rien
ted
Japan UK
Germany
Russia
China/HK
Malaysia
Indonesia
US
Korea
Taiwan
Holland
Eastern European
Scandinavia
Price o
riented
+ +__
_ +MRL and residue Levels
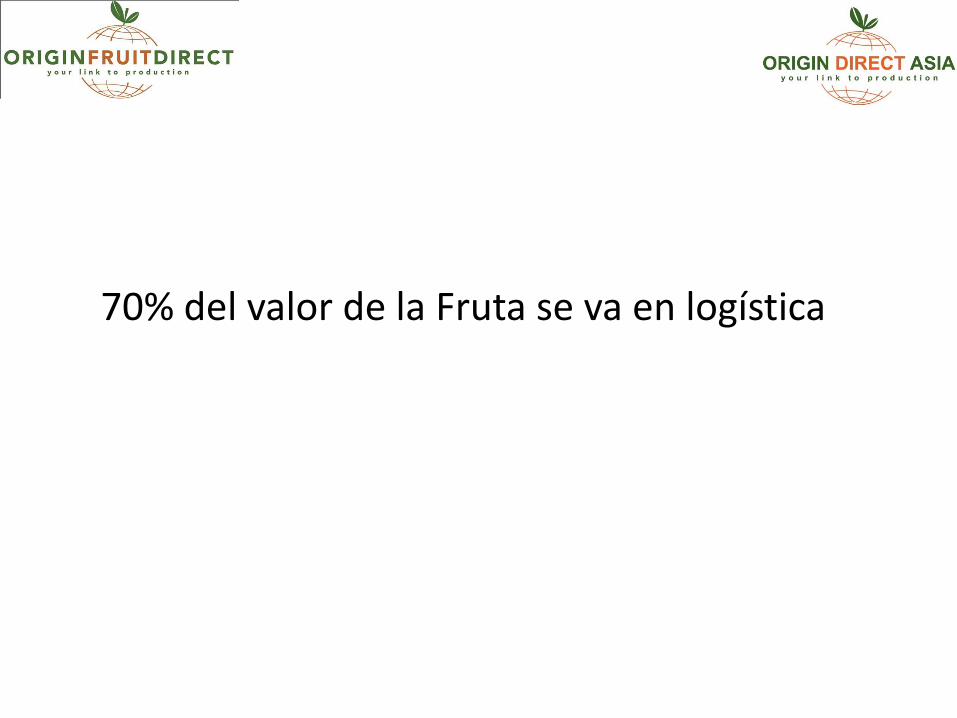
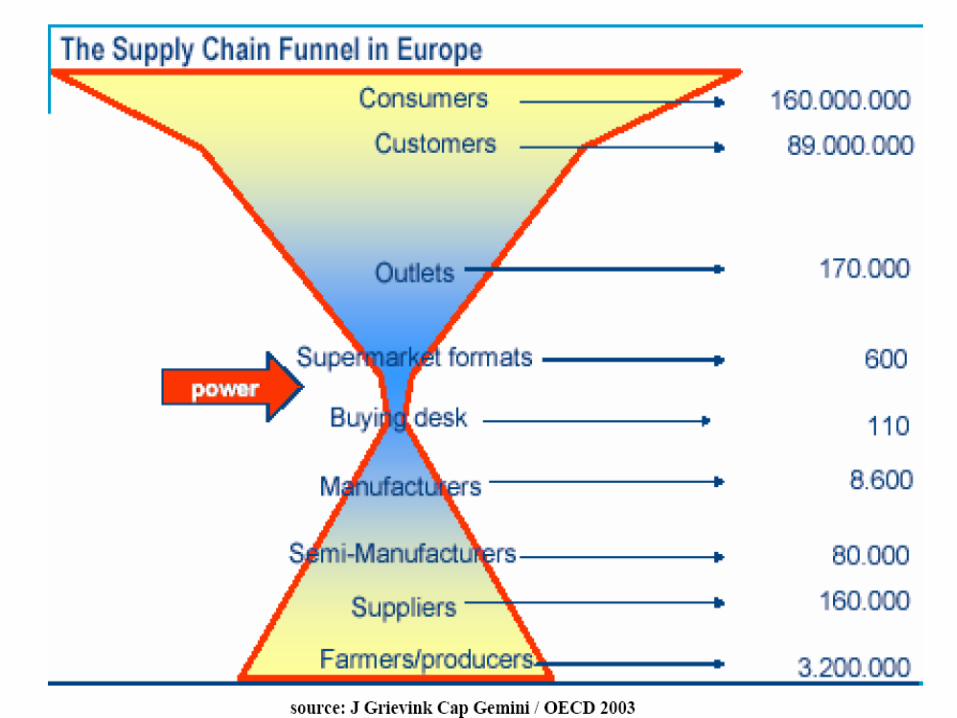
70% del valor de la Fruta se va en logística
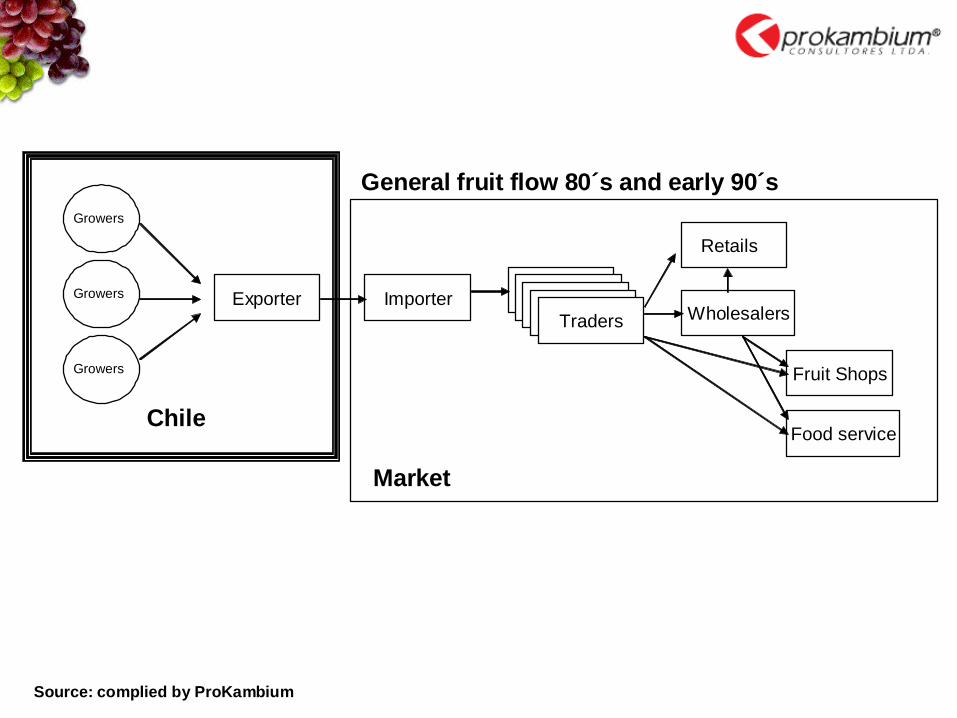
Growers
Growers
Growers
Exporter Importer
Traders
Retails
Wholesalers
Fruit Shops
Food service
General fruit flow 80´s and early 90´s
Chile
Market
Source: complied by ProKambium
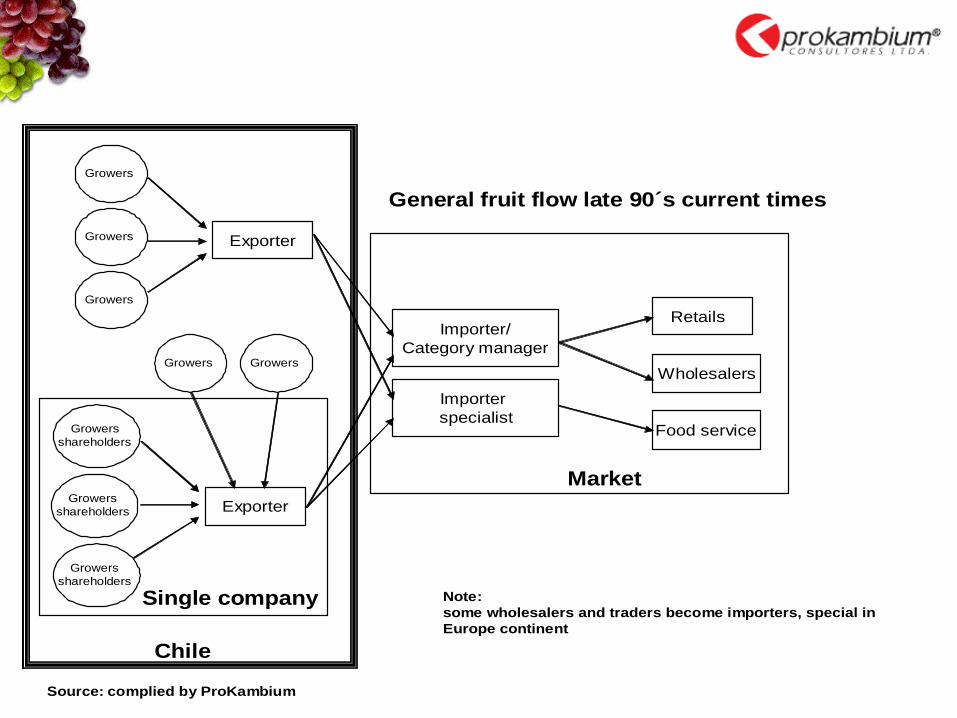
Growers
Growers
Growers
Exporter
Importer/
Category manager
Retails
Wholesalers
Food service
General fruit flow late 90´s current times
Market
Source: complied by ProKambium
Exporter
Single company
Growers Growers
Growers
shareholders
Growers
shareholders
Growers
shareholders
Importer
specialist
Chile
Note:
some wholesalers and traders become importers, special in
Europe continent
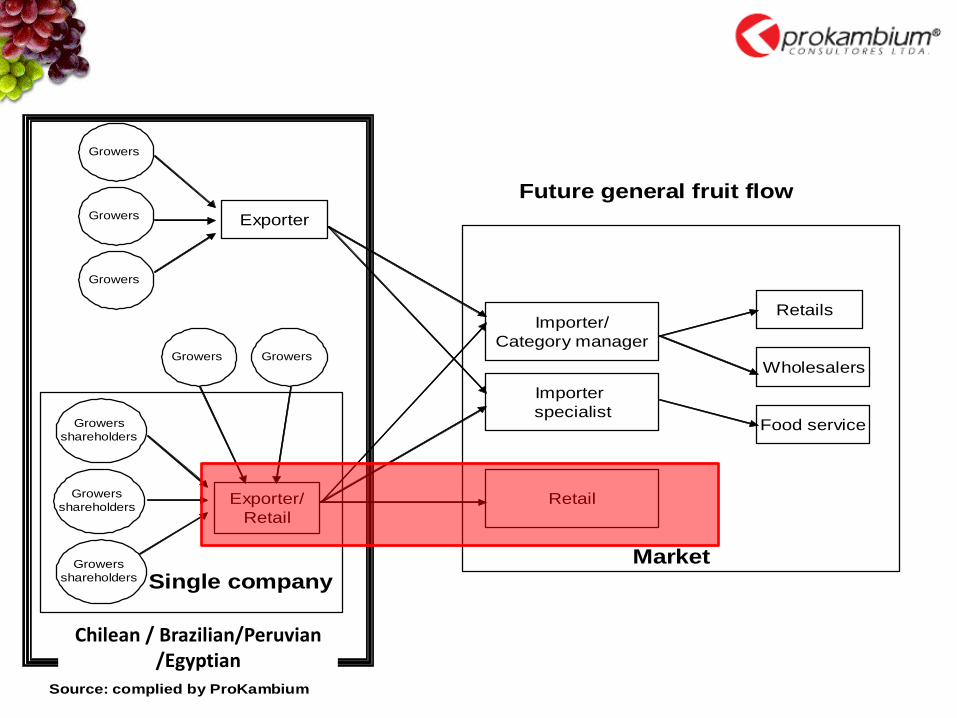
Growers
Growers
Growers
Exporter
Importer/
Category manager
Retails
Wholesalers
Food service
Future general fruit flow
Market
Source: complied by ProKambium
Exporter/
Retail
Single company
Growers Growers
Growers
shareholders
Growers
shareholders
Growers
shareholders
Importer
specialist
Chile
Retail
Chilean / Brazilian/Peruvian /Egyptian
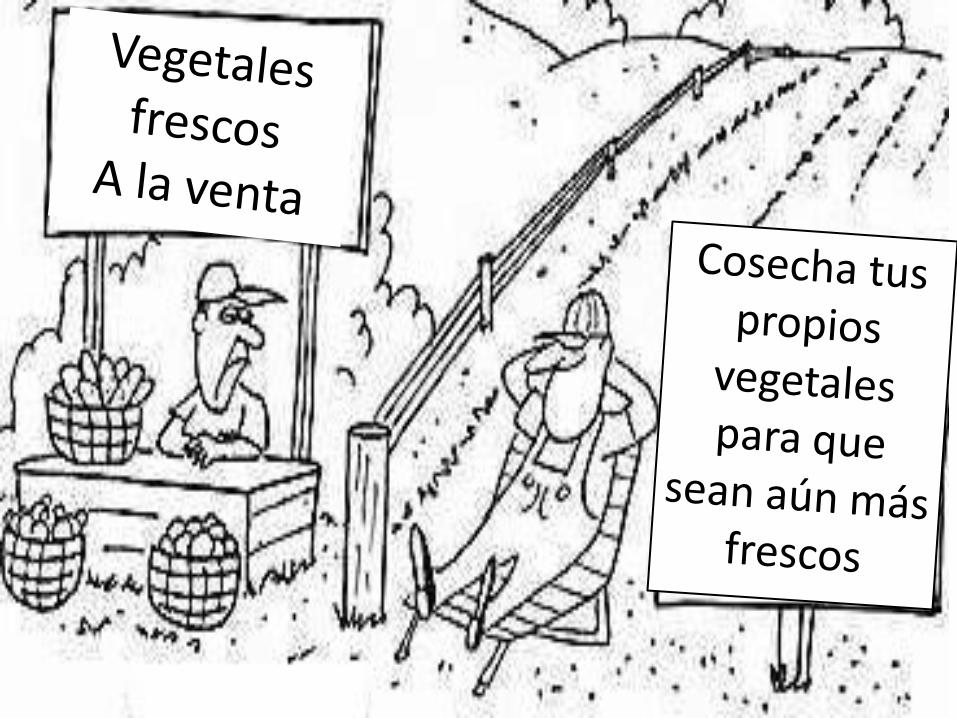
De lo único que estamos seguros es del cambio………….


De las amenazas


Cuando todo va mal …………..
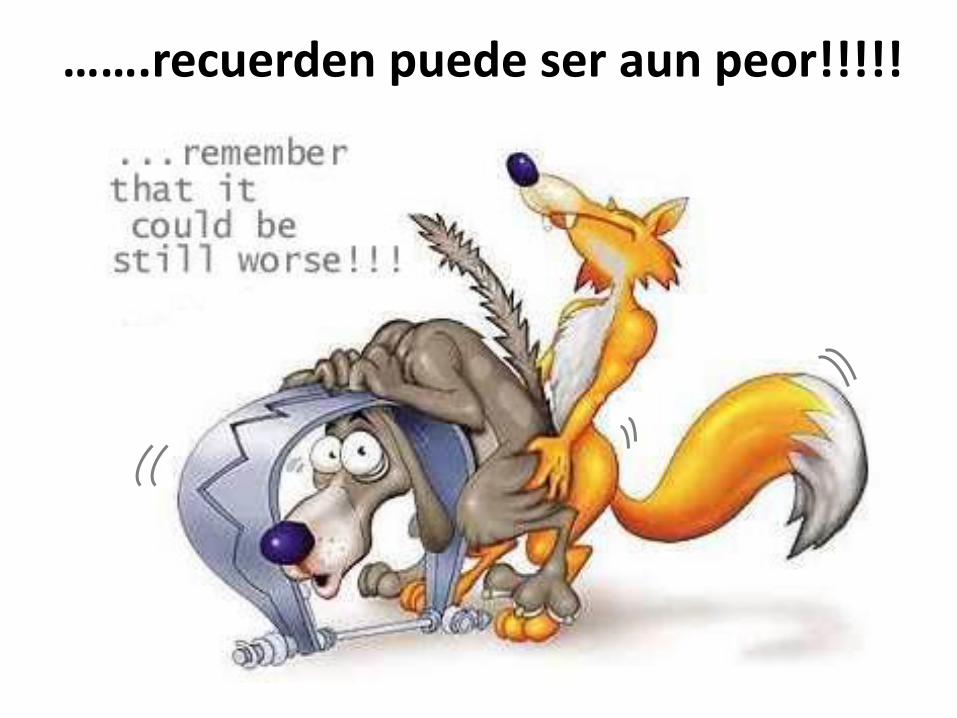
…….recuerden puede ser aun peor!!!!!
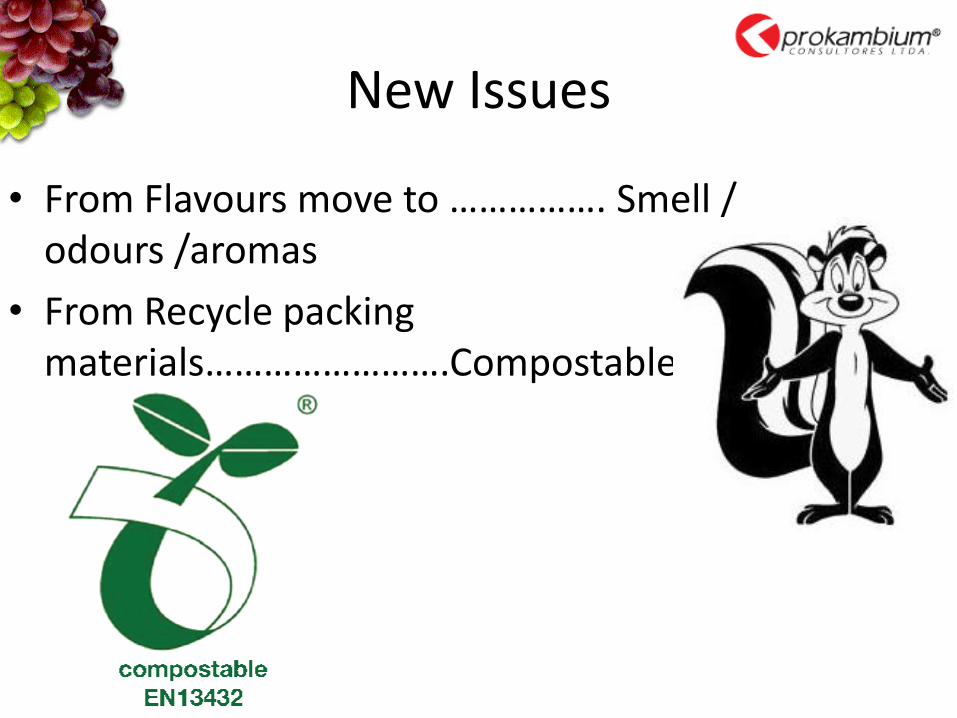
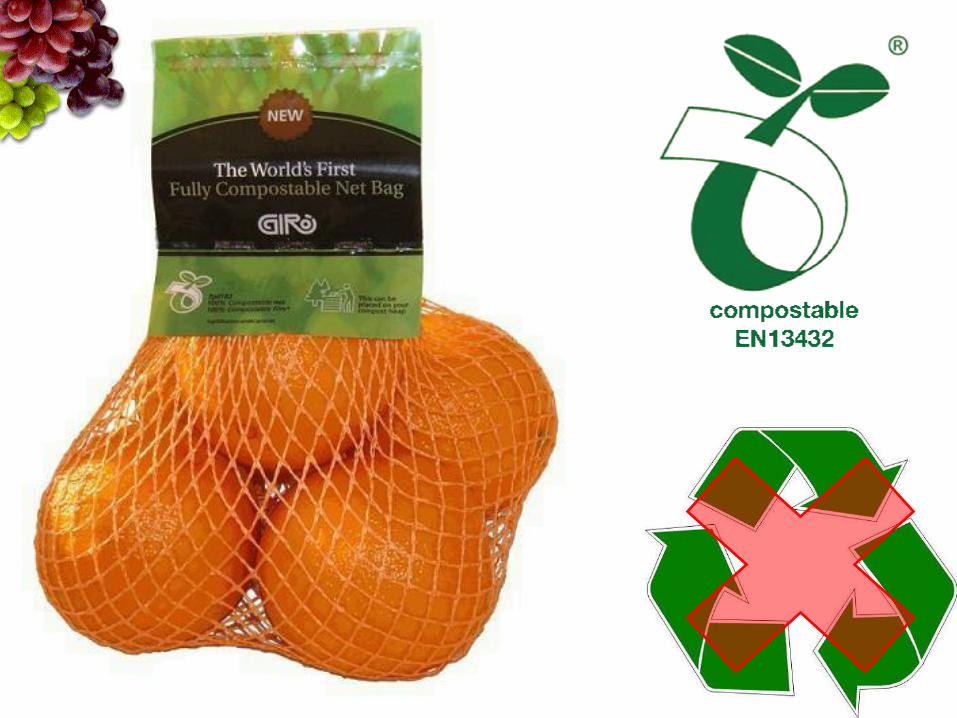
New Issues
• From Flavours move to ……………. Smell / odours /aromas
• From Recycle packing materials…………………….Compostable
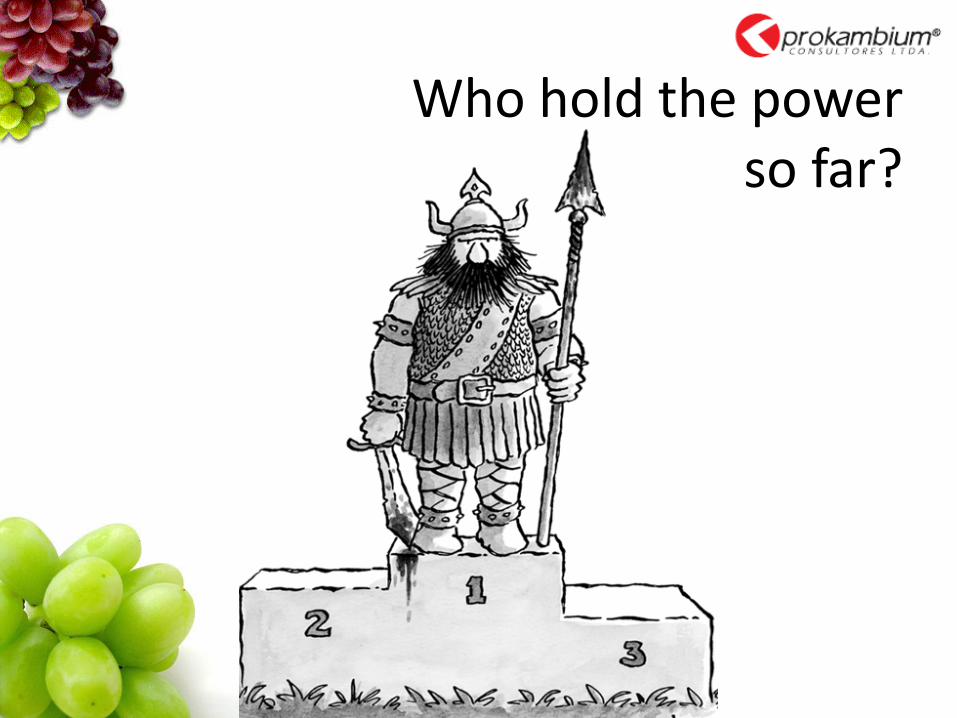
Who hold the power so far?

sell
2006
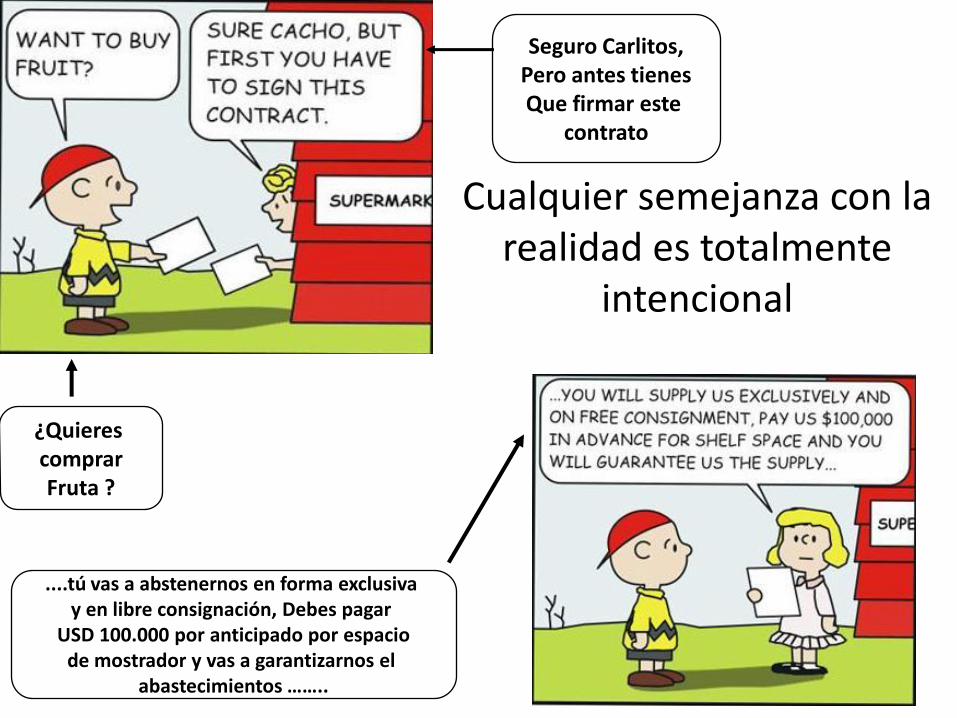
Cualquier semejanza con la realidad es totalmente
intencional
¿Quieres comprarFruta ?
Seguro Carlitos,Pero antes tienesQue firmar este
contrato
....tú vas a abstenernos en forma exclusiva y en libre consignación, Debes pagar
USD 100.000 por anticipado por espaciode mostrador y vas a garantizarnos el
abastecimientos ……..
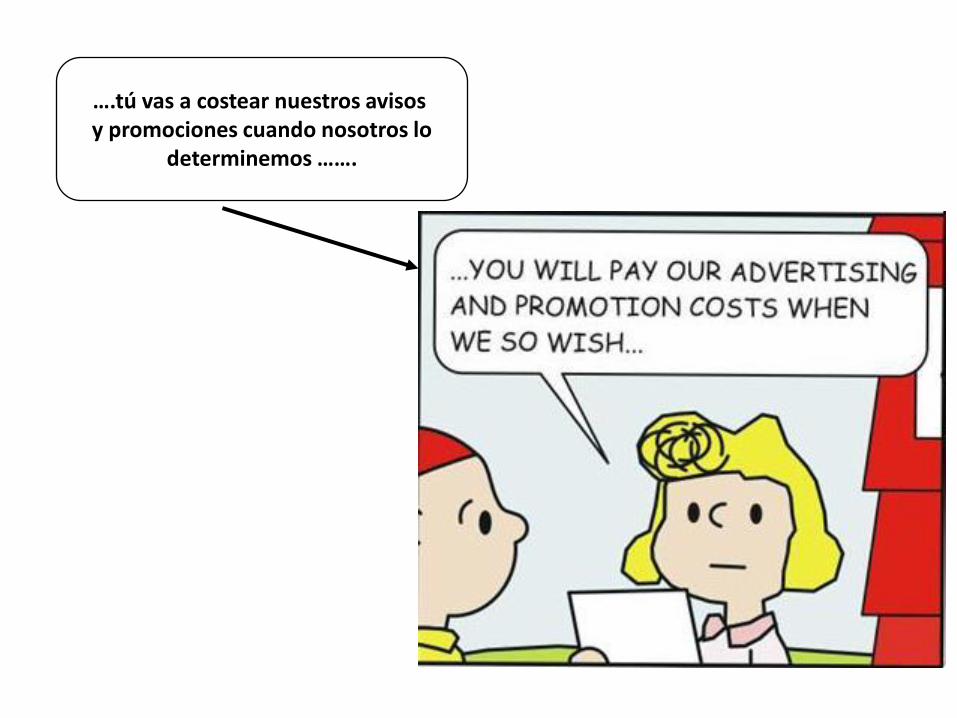
….tú vas a costear nuestros avisos y promociones cuando nosotros lo
determinemos …….
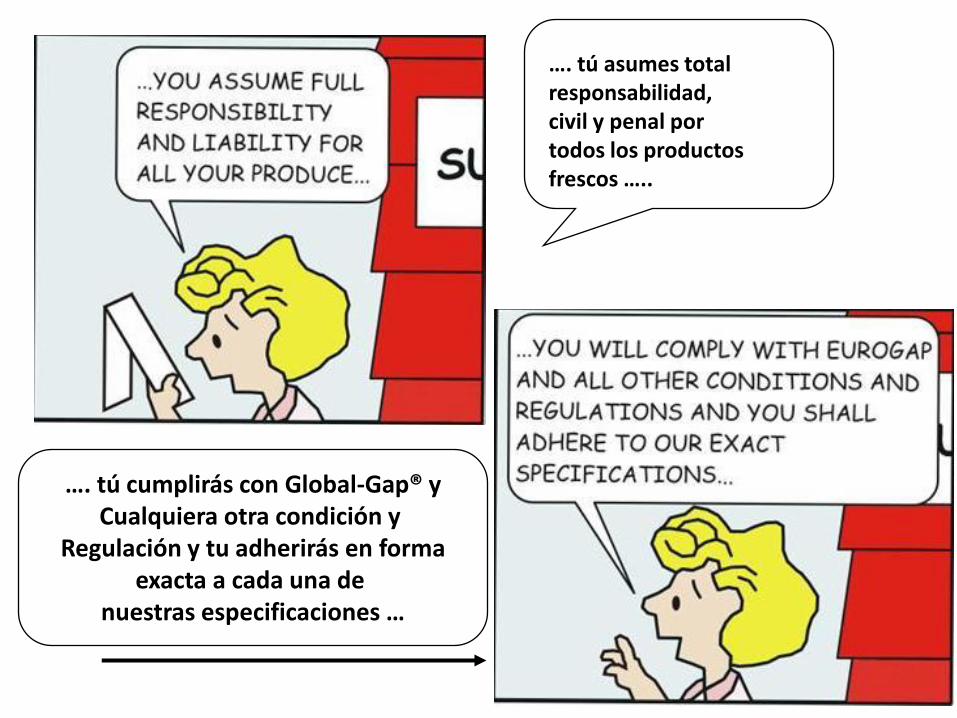
…. tú cumplirás con Global-Gap® yCualquiera otra condición y
Regulación y tu adherirás en formaexacta a cada una de
nuestras especificaciones …
…. tú asumes total responsabilidad, civil y penal por todos los productos frescos …..
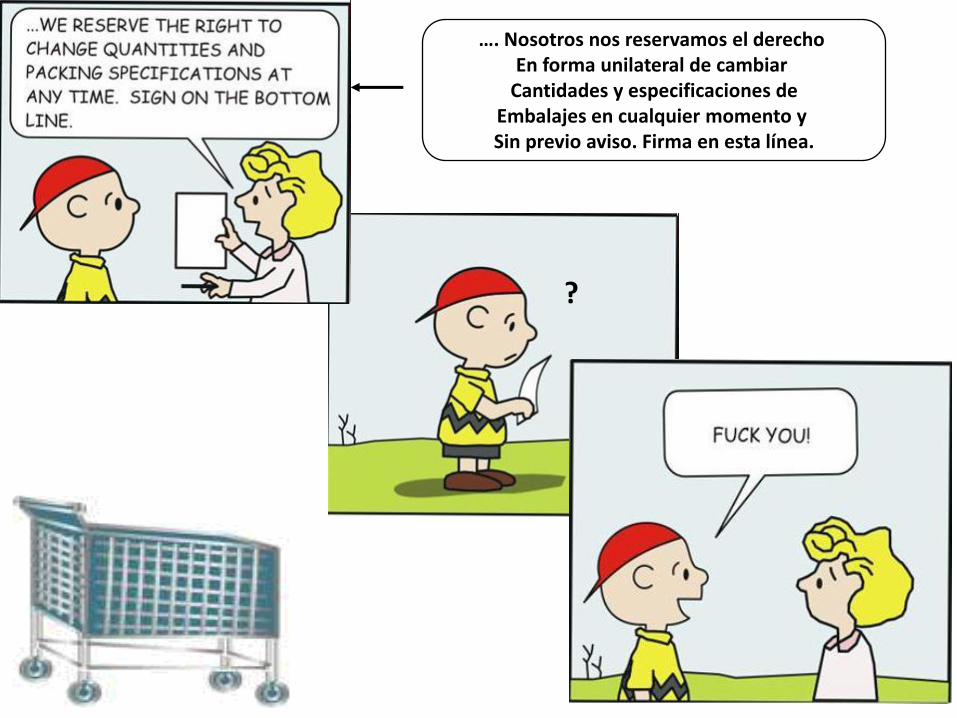
…. Nosotros nos reservamos el derecho En forma unilateral de cambiar
Cantidades y especificaciones deEmbalajes en cualquier momento y Sin previo aviso. Firma en esta línea.
?
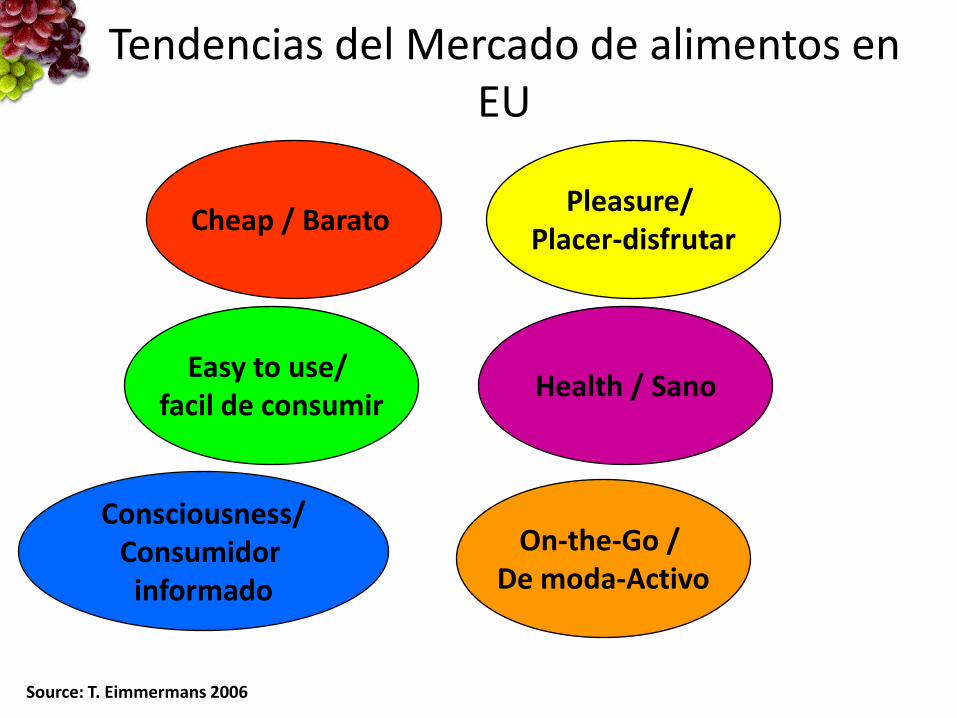
Cheap / Barato
Easy to use/ facil de consumir
Consciousness/Consumidor informado
Pleasure/ Placer-disfrutar
Health / Sano
On-the-Go / De moda-Activo
Tendencias del Mercado de alimentos en EU
Source: T. Eimmermans 2006

Palabras claves
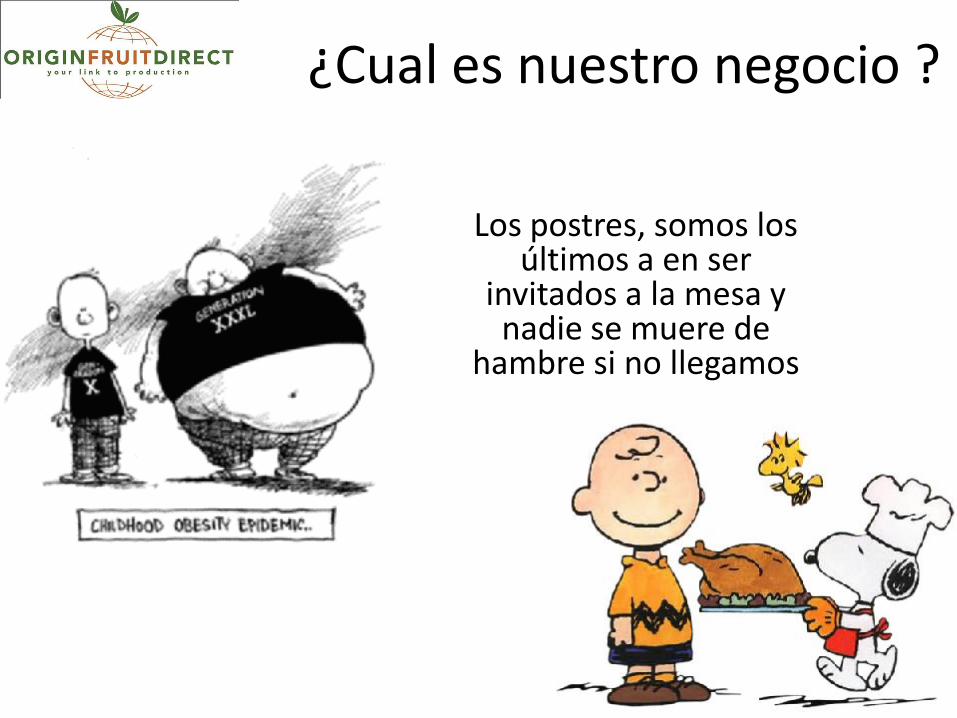
¿Cual es nuestro negocio ?
Los postres, somos los últimos a en ser
invitados a la mesa y nadie se muere de
hambre si no llegamos
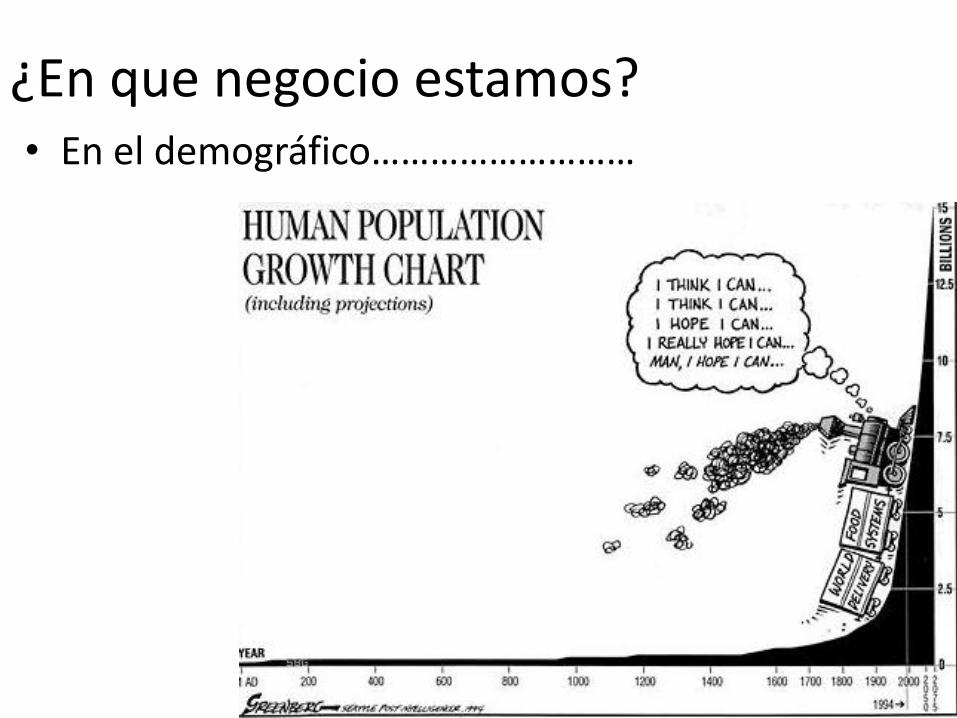
¿En que negocio estamos?• En el demográfico………………………
Food related risk perception in the EU
Euro-barometer on food related risk perception
LAST UPDATE: NOVEMBER 2010
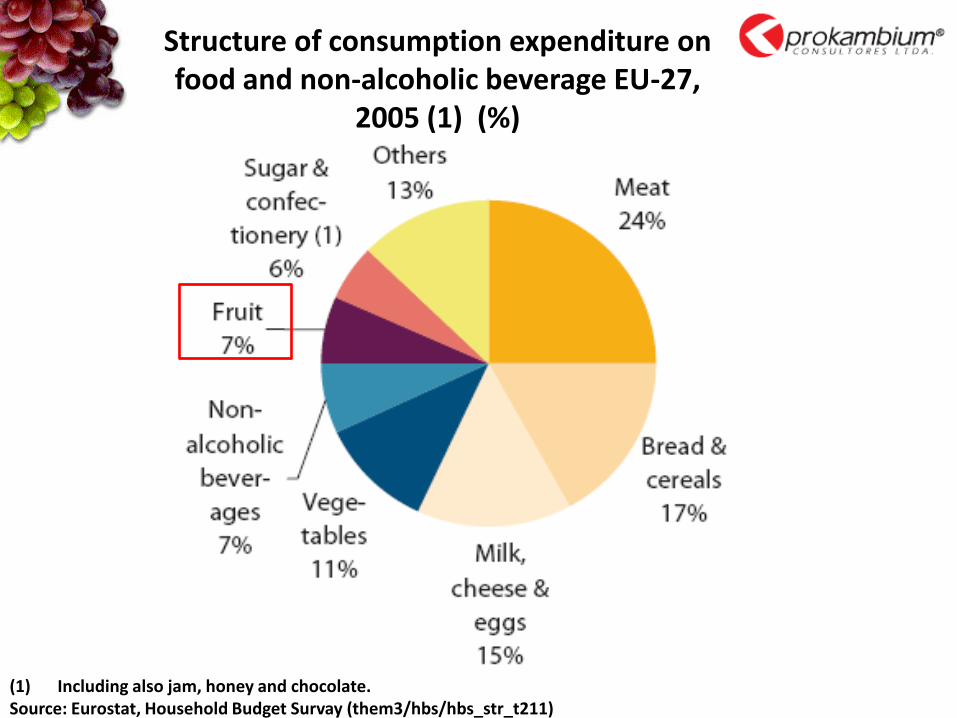
Structure of consumption expenditure on food and non-alcoholic beverage EU-27,
2005 (1) (%)
(1) Including also jam, honey and chocolate.Source: Eurostat, Household Budget Survay (them3/hbs/hbs_str_t211)
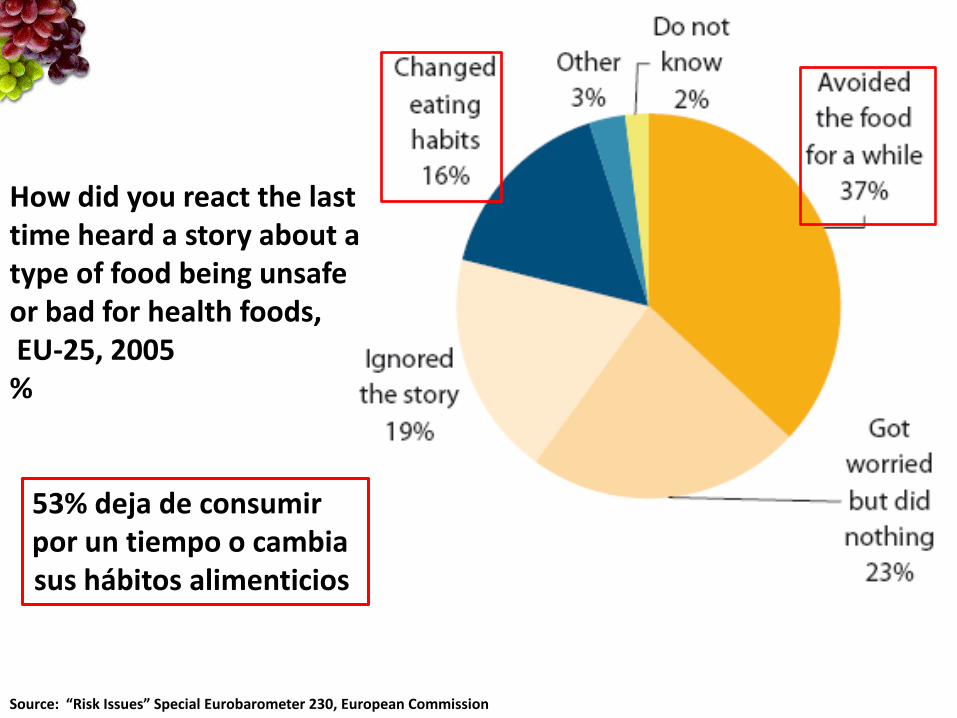
How did you react the last time heard a story about a type of food being unsafe or bad for health foods,EU-25, 2005%
53% deja de consumir por un tiempo o cambia sus hábitos alimenticios
Source: “Risk Issues” Special Eurobarometer 230, European Commission
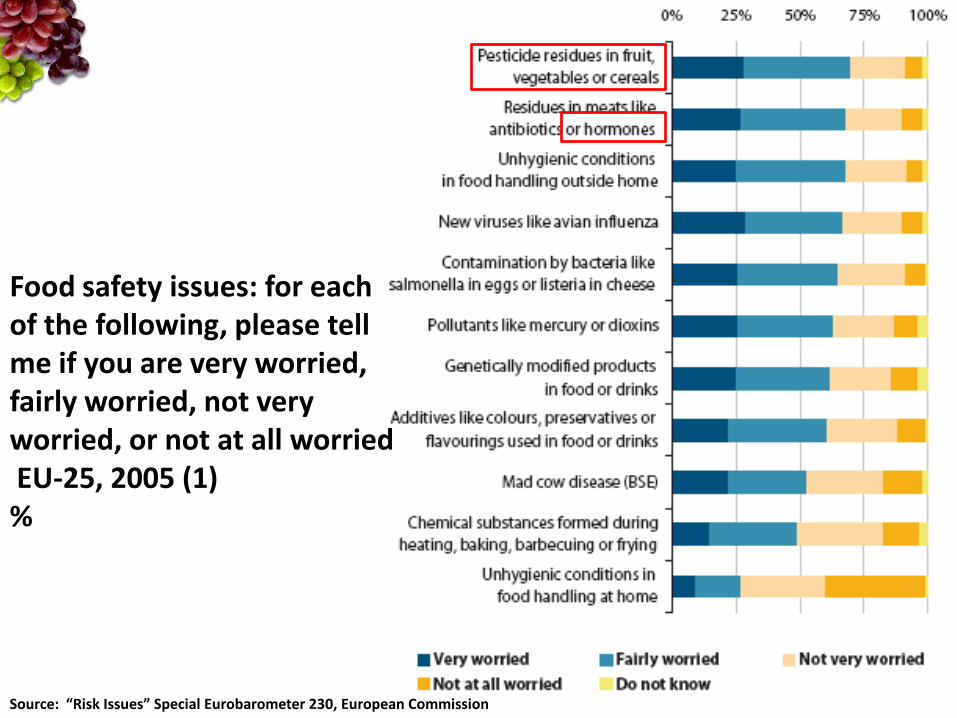
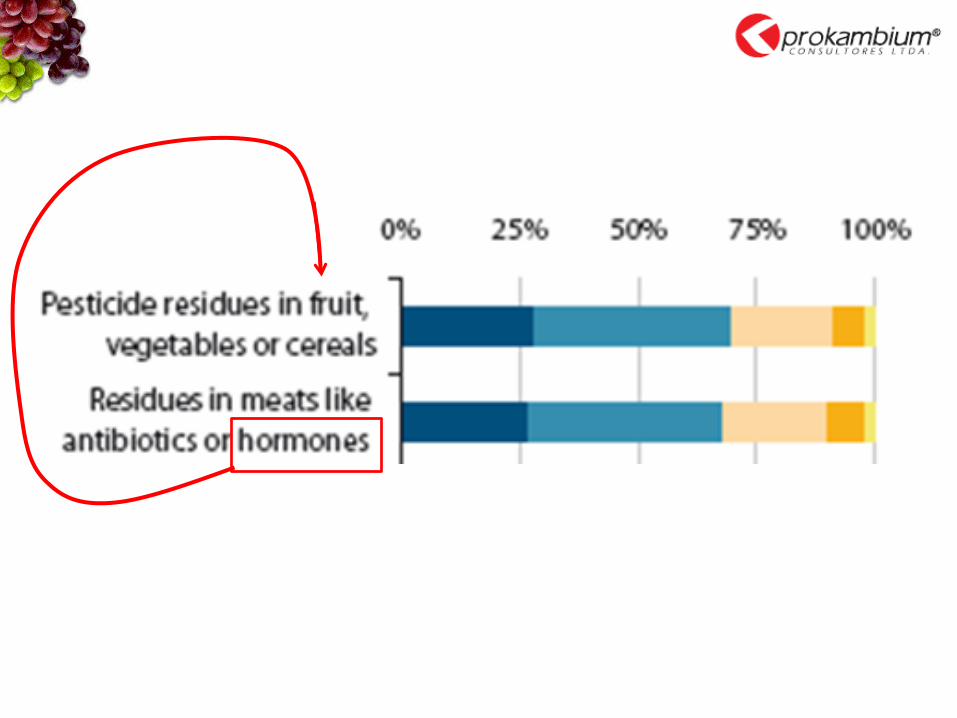
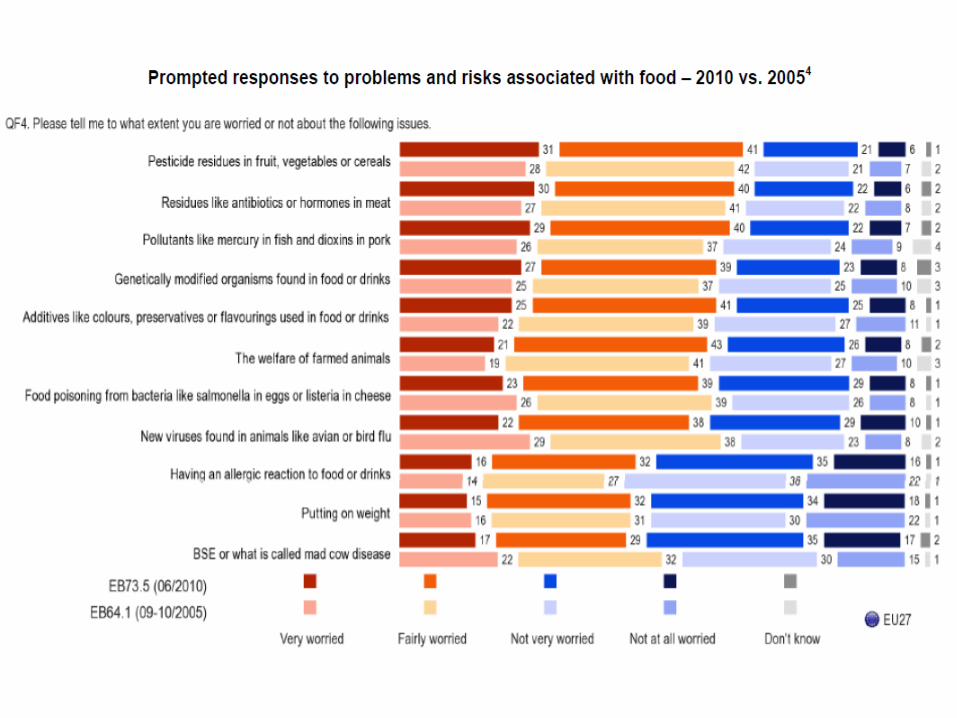
Food safety issues: for each of the following, please tell me if you are very worried, fairly worried, not very worried, or not at all worriedEU-25, 2005 (1)%
Source: “Risk Issues” Special Eurobarometer 230, European Commission
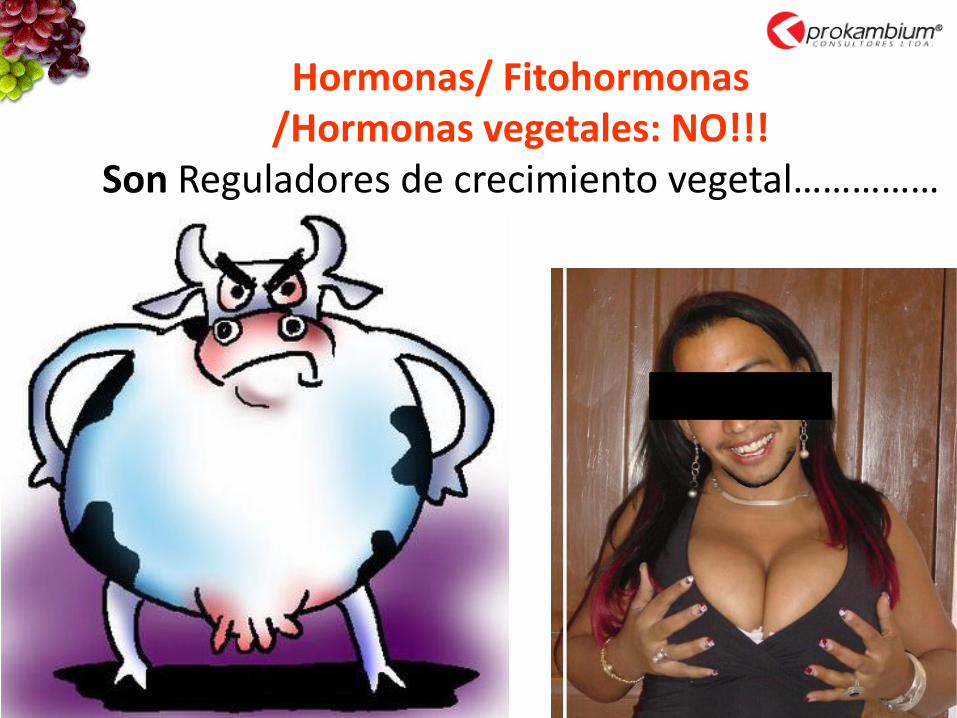
Hormonas/ Fitohormonas/Hormonas vegetales: NO!!!
Son Reguladores de crecimiento vegetal……………
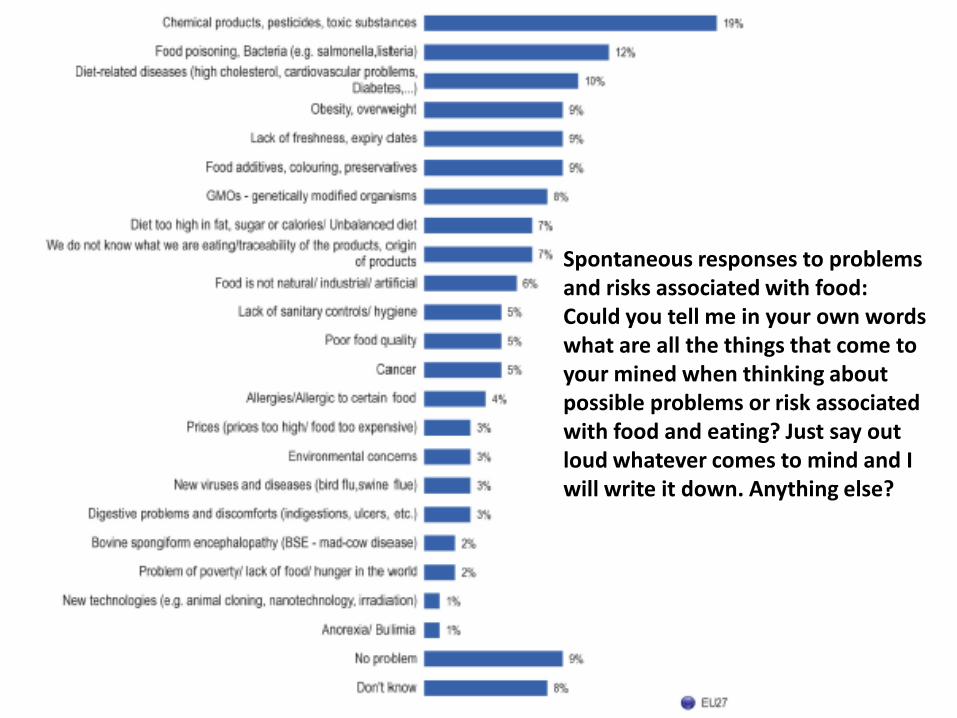
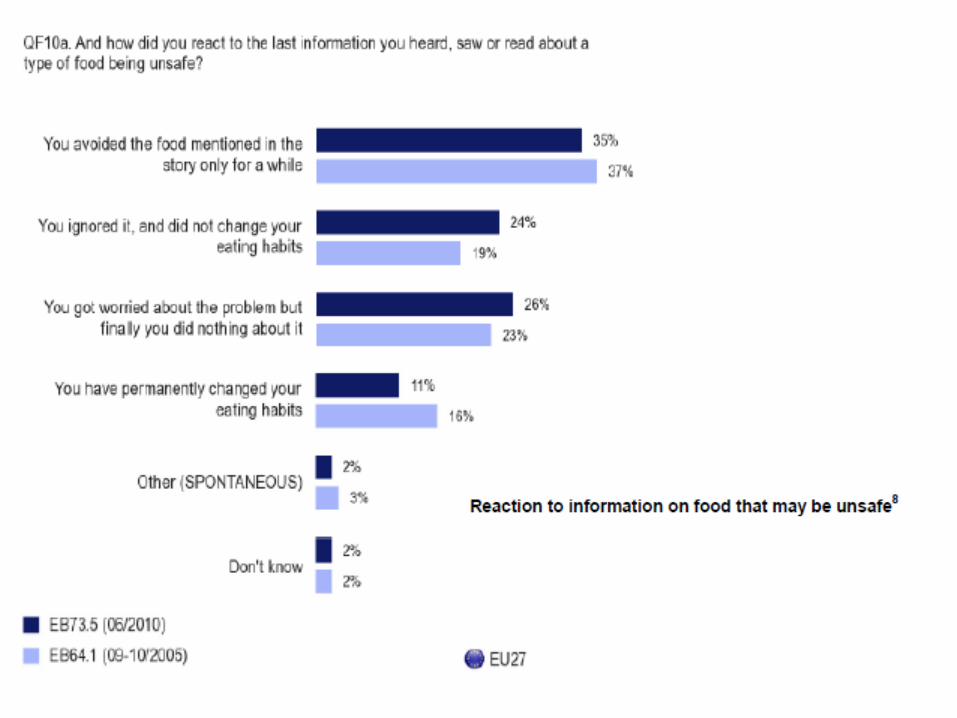
Spontaneous responses to problems and risks associated with food:Could you tell me in your own words what are all the things that come to your mined when thinking about possible problems or risk associated with food and eating? Just say out loud whatever comes to mind and I will write it down. Anything else?
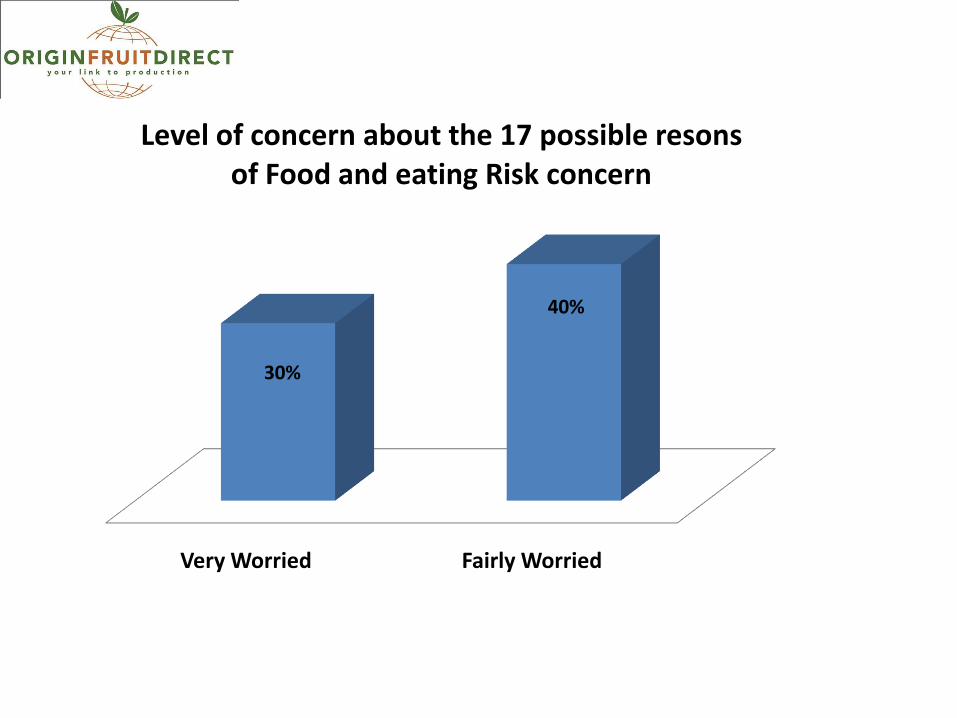
Very Worried Fairly Worried
30%
40%
Level of concern about the 17 possible resons of Food and eating Risk concern
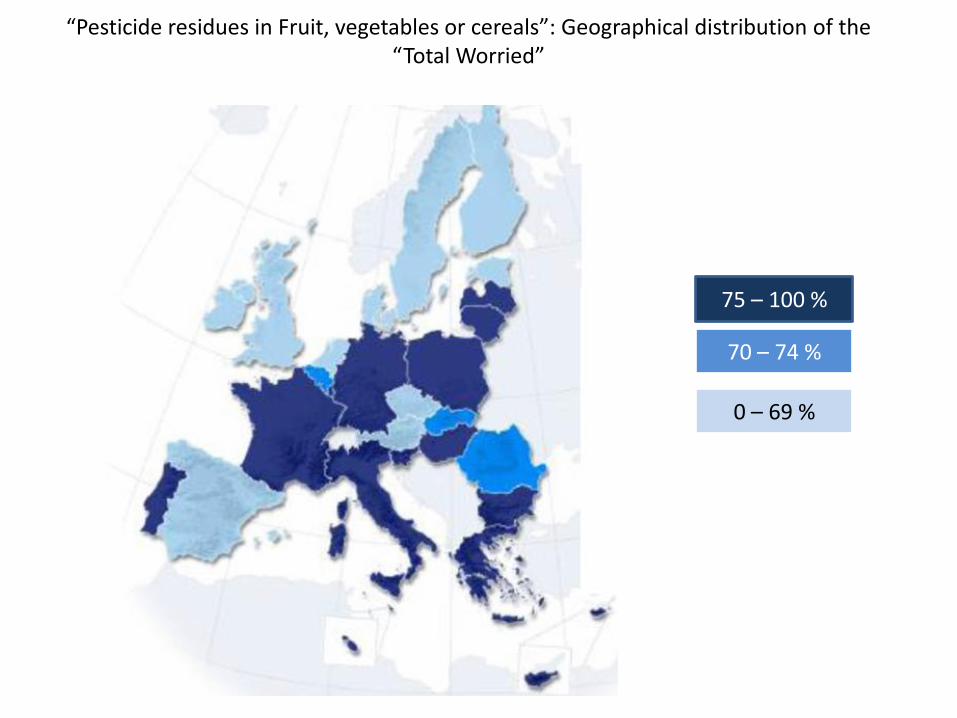
“Pesticide residues in Fruit, vegetables or cereals”: Geographical distribution of the“Total Worried”
75 – 100 %
70 – 74 %
0 – 69 %
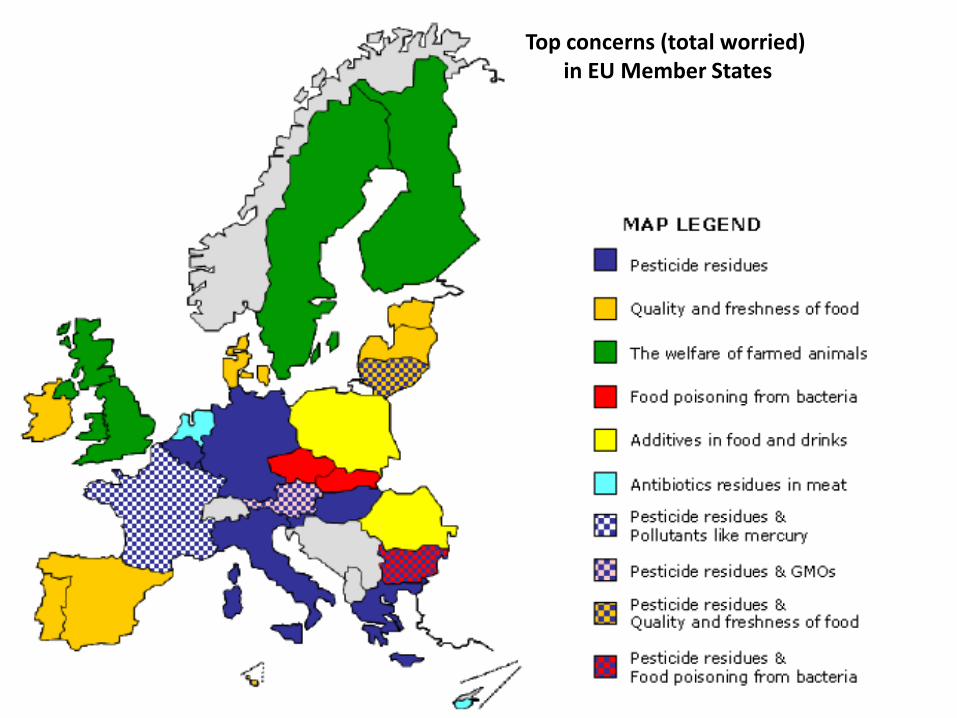
Top concerns (total worried) in EU Member States
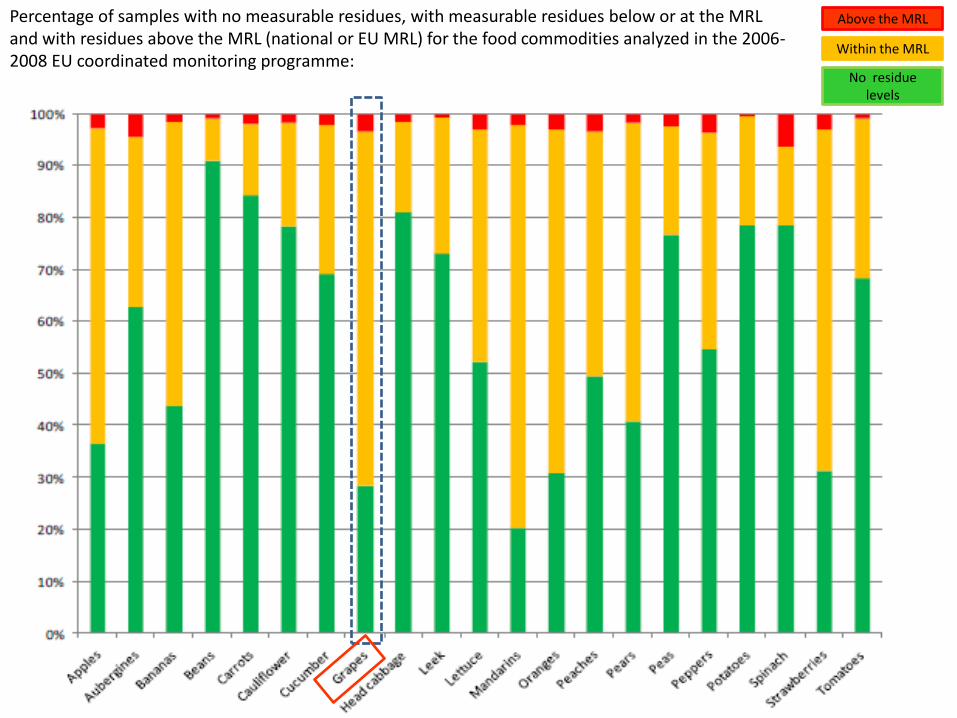
Above the MRL
Within the MRL
No residue levels
Percentage of samples with no measurable residues, with measurable residues below or at the MRL and with residues above the MRL (national or EU MRL) for the food commodities analyzed in the 2006-2008 EU coordinated monitoring programme:
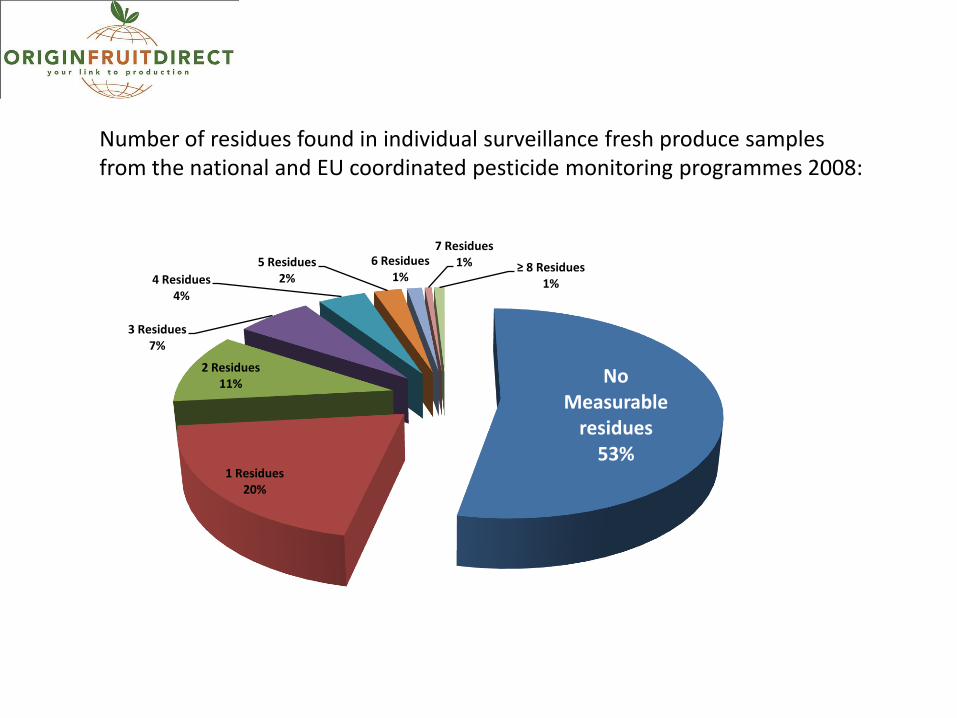
No Measurable
residues 53%
1 Residues 20%
2 Residues 11%
3 Residues7%
4 Residues 4%
5 Residues 2%
6 Residues1%
7 Residues 1% ≥ 8 Residues
1%
Number of residues found in individual surveillance fresh produce samples from the national and EU coordinated pesticide monitoring programmes 2008:
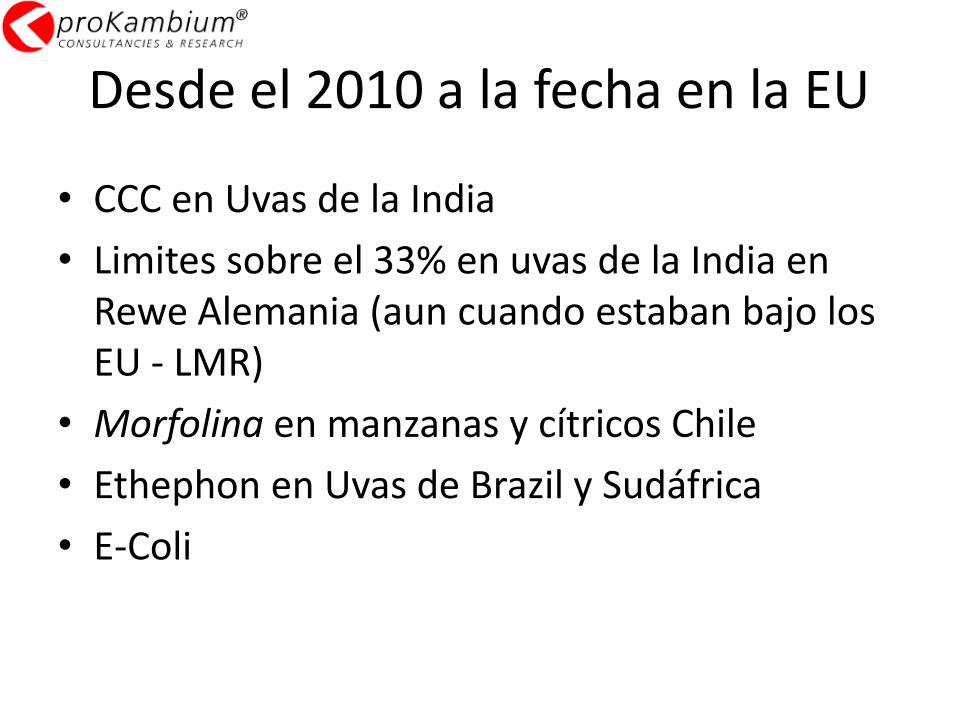
Desde el 2010 a la fecha en la EU
• CCC en Uvas de la India
• Limites sobre el 33% en uvas de la India en Rewe Alemania (aun cuando estaban bajo los EU - LMR)
• Morfolina en manzanas y cítricos Chile
• Ethephon en Uvas de Brazil y Sudáfrica
• E-Coli
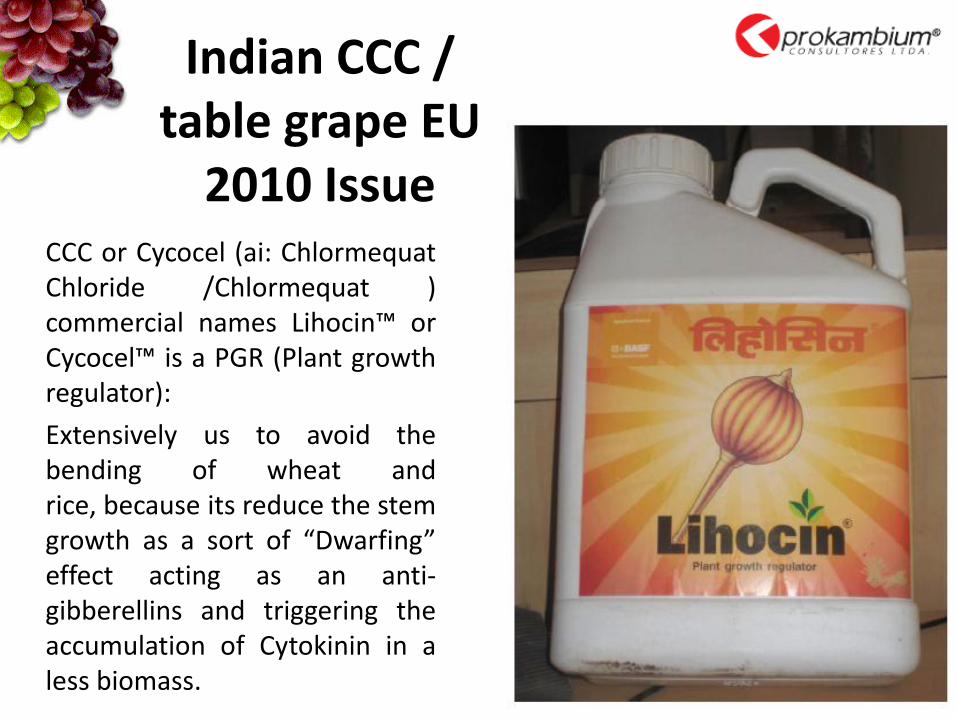
Indian CCC / table grape EU
2010 IssueCCC or Cycocel (ai: ChlormequatChloride /Chlormequat )commercial names Lihocin™ orCycocel™ is a PGR (Plant growthregulator):
Extensively us to avoid thebending of wheat andrice, because its reduce the stemgrowth as a sort of “Dwarfing”effect acting as an anti-gibberellins and triggering theaccumulation of Cytokinin in aless biomass.
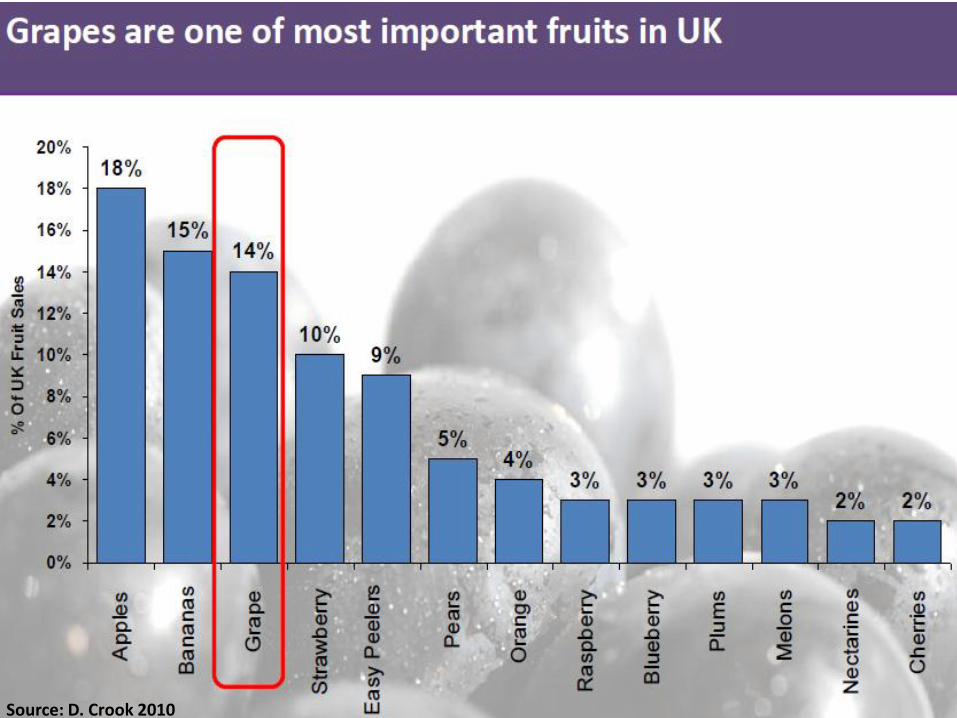
Source: D. Crook 2010
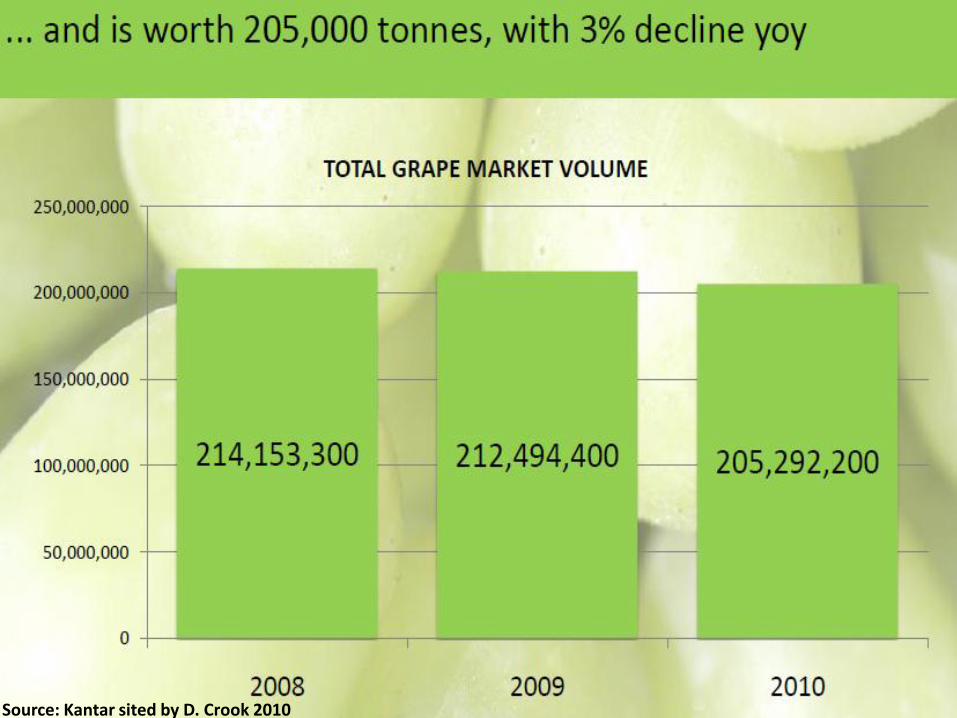
Source: Kantar sited by D. Crook 2010
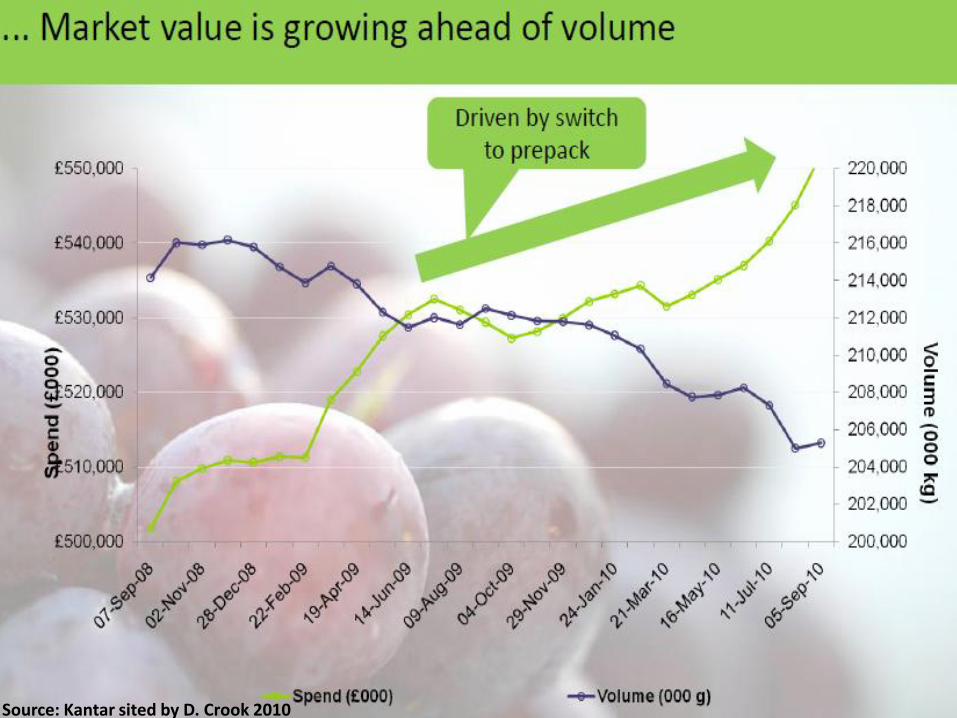
Source: Kantar sited by D. Crook 2010
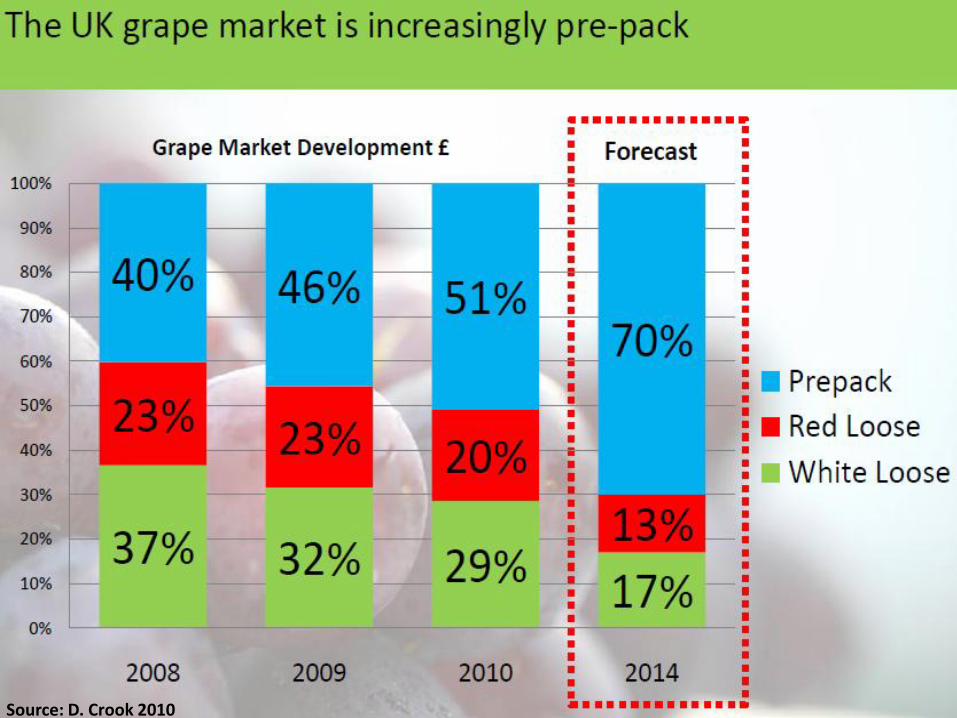
Source: D. Crook 2010
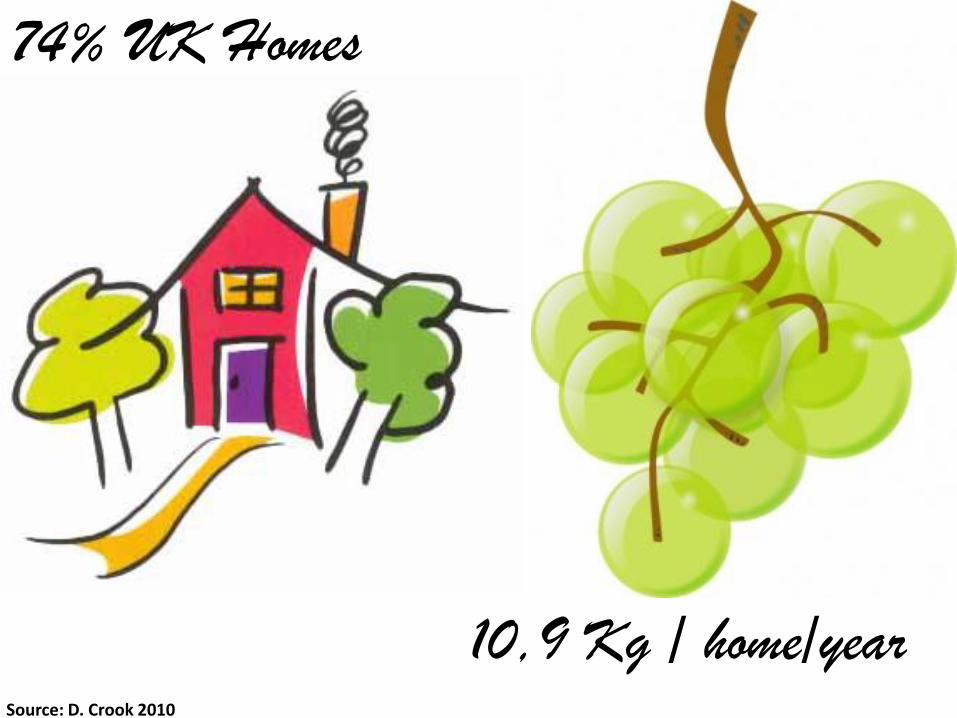
74% UK Homes
10,9 Kg / home/yearSource: D. Crook 2010
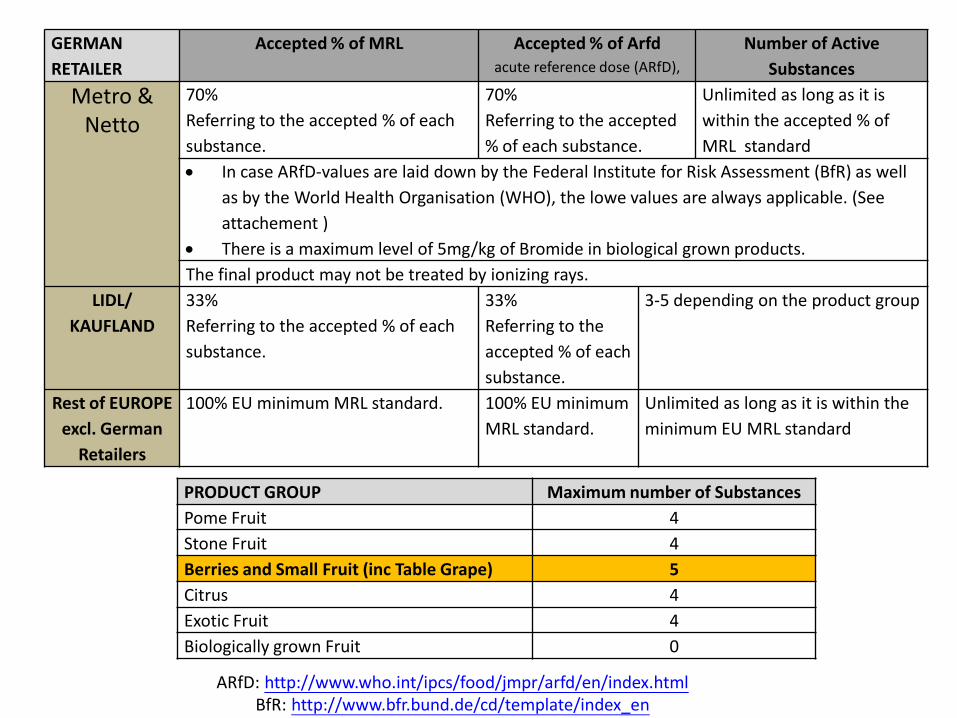
GERMAN
RETAILER
Accepted % of MRL Accepted % of Arfdacute reference dose (ARfD),
Number of Active
Substances
Metro &Netto
70%
Referring to the accepted % of each
substance.
70%
Referring to the accepted
% of each substance.
Unlimited as long as it is
within the accepted % of
MRL standard
In case ARfD-values are laid down by the Federal Institute for Risk Assessment (BfR) as well
as by the World Health Organisation (WHO), the lowe values are always applicable. (See
attachement )
There is a maximum level of 5mg/kg of Bromide in biological grown products.
The final product may not be treated by ionizing rays.
LIDL/
KAUFLAND
33%
Referring to the accepted % of each
substance.
33%
Referring to the
accepted % of each
substance.
3-5 depending on the product group
Rest of EUROPE
excl. German
Retailers
100% EU minimum MRL standard. 100% EU minimum
MRL standard.
Unlimited as long as it is within the
minimum EU MRL standard
PRODUCT GROUP Maximum number of Substances
Pome Fruit 4
Stone Fruit 4
Berries and Small Fruit (inc Table Grape) 5
Citrus 4
Exotic Fruit 4
Biologically grown Fruit 0
ARfD: http://www.who.int/ipcs/food/jmpr/arfd/en/index.htmlBfR: http://www.bfr.bund.de/cd/template/index_en
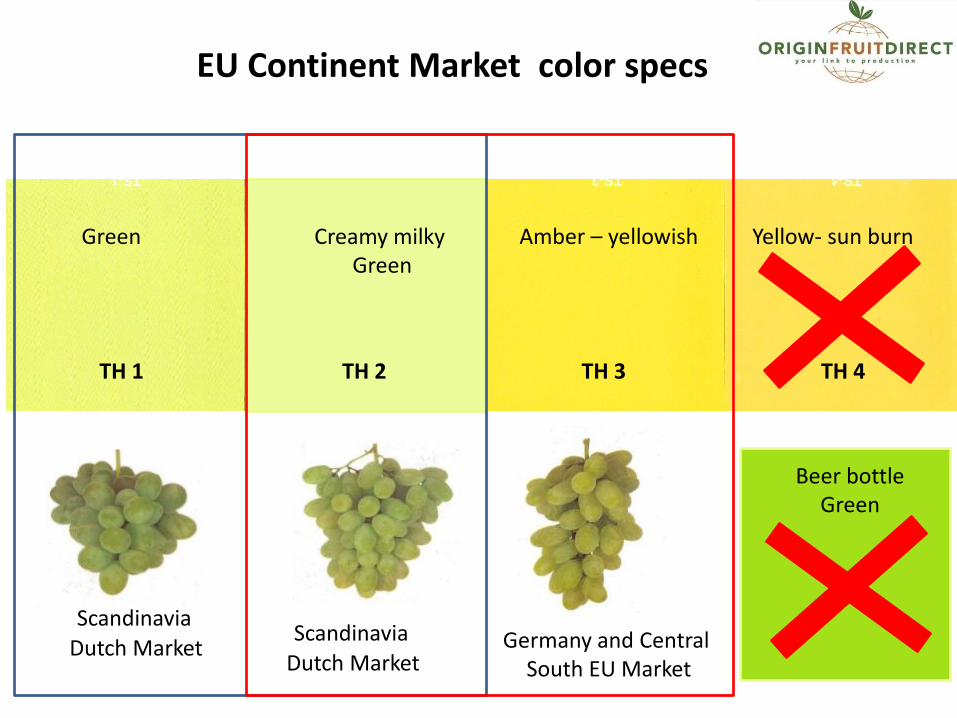
TH 1 TH 3 TH 4TH 2
Dutch Market Germany and Central South EU Market
Green Creamy milky Green
Amber – yellowish Yellow- sun burn
EU Continent Market color specs
Beer bottle Green
Scandinavia
Dutch MarketScandinavia

Monthly Table Grape supply by non EU countries 2005 - 2010 (tones)
Source: Eurostat / Freshfel 2011
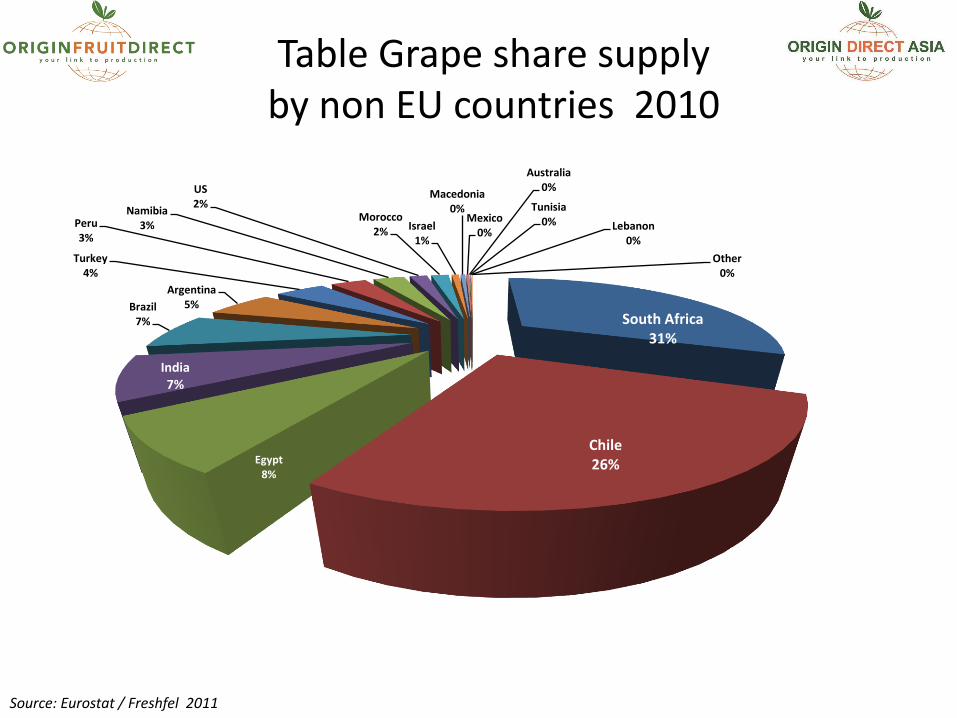
South Africa31%
Chile26%Egypt
8%
India7%
Brazil7%
Argentina5%
Turkey4%
Peru3%
Namibia3%
US2%
Morocco2% Israel
1%
Macedonia0%
Mexico0%
Australia0%
Tunisia0% Lebanon
0%
Other 0%
Table Grape share supply by non EU countries 2010
Source: Eurostat / Freshfel 2011
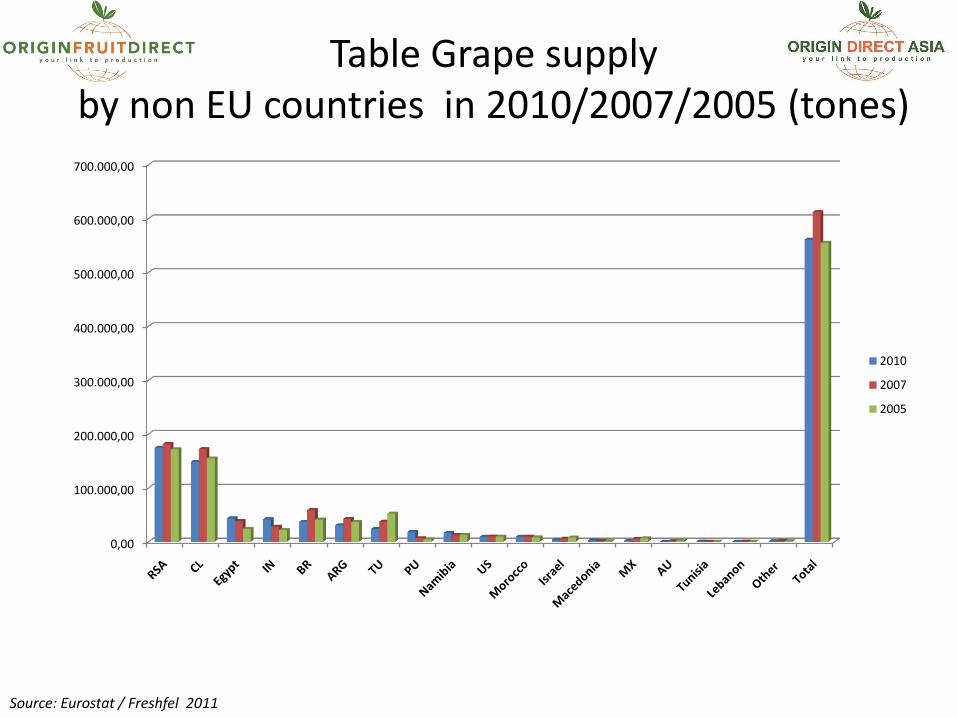
Table Grape supply by non EU countries in 2010/2007/2005 (tones)
Source: Eurostat / Freshfel 2011
0,00
100.000,00
200.000,00
300.000,00
400.000,00
500.000,00
600.000,00
700.000,00
2010
2007
2005
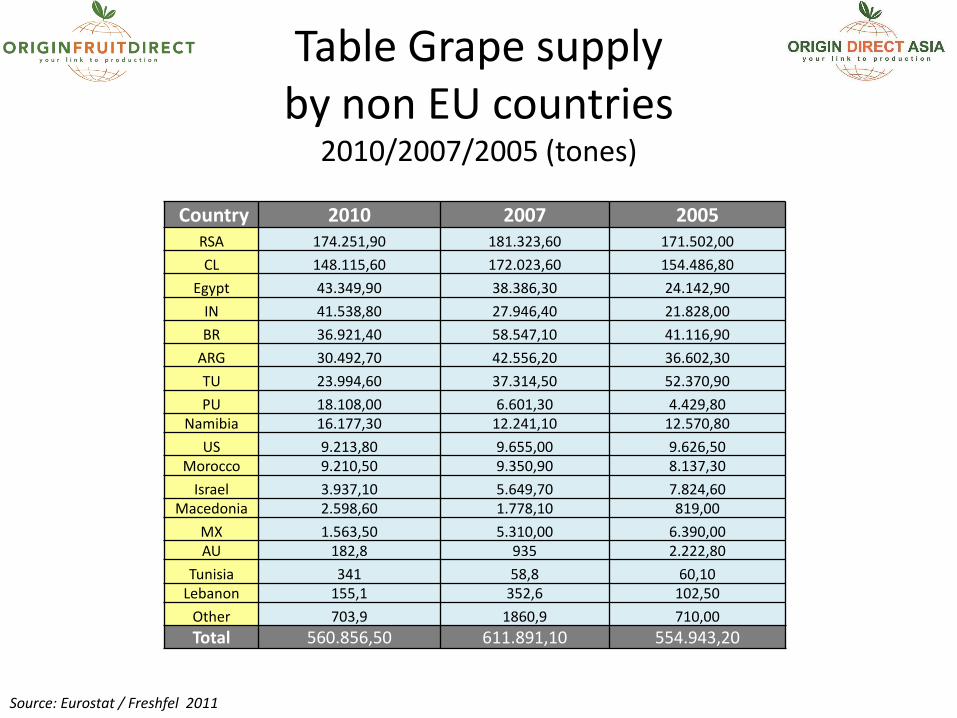
Country 2010 2007 2005RSA 174.251,90 181.323,60 171.502,00
CL 148.115,60 172.023,60 154.486,80
Egypt 43.349,90 38.386,30 24.142,90
IN 41.538,80 27.946,40 21.828,00
BR 36.921,40 58.547,10 41.116,90
ARG 30.492,70 42.556,20 36.602,30
TU 23.994,60 37.314,50 52.370,90
PU 18.108,00 6.601,30 4.429,80Namibia 16.177,30 12.241,10 12.570,80
US 9.213,80 9.655,00 9.626,50Morocco 9.210,50 9.350,90 8.137,30
Israel 3.937,10 5.649,70 7.824,60Macedonia 2.598,60 1.778,10 819,00
MX 1.563,50 5.310,00 6.390,00AU 182,8 935 2.222,80
Tunisia 341 58,8 60,10Lebanon 155,1 352,6 102,50
Other 703,9 1860,9 710,00
Total 560.856,50 611.891,10 554.943,20
Table Grape supply by non EU countries
2010/2007/2005 (tones)
Source: Eurostat / Freshfel 2011
Who are the Tale Grape Players
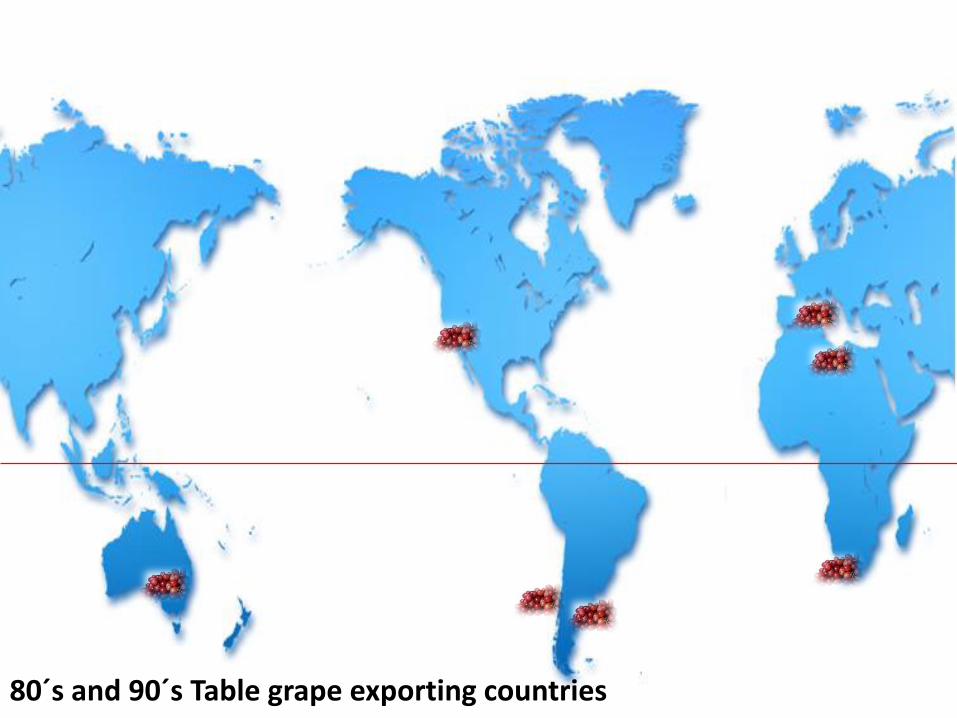
80´s and 90´s Table grape exporting countries
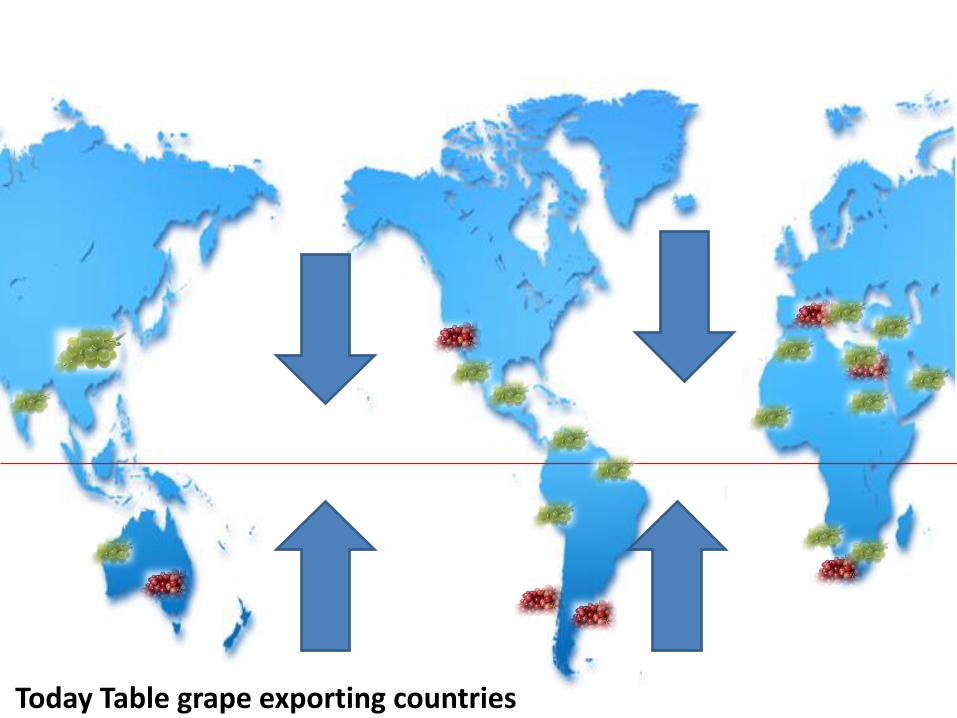
Today Table grape exporting countries
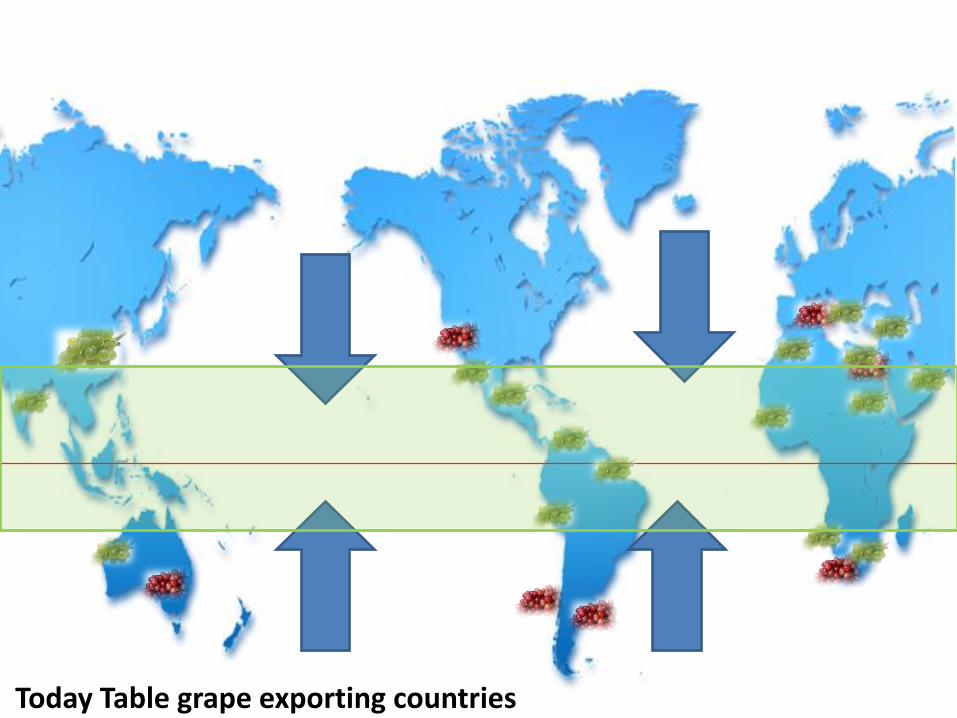
Today Table grape exporting countries
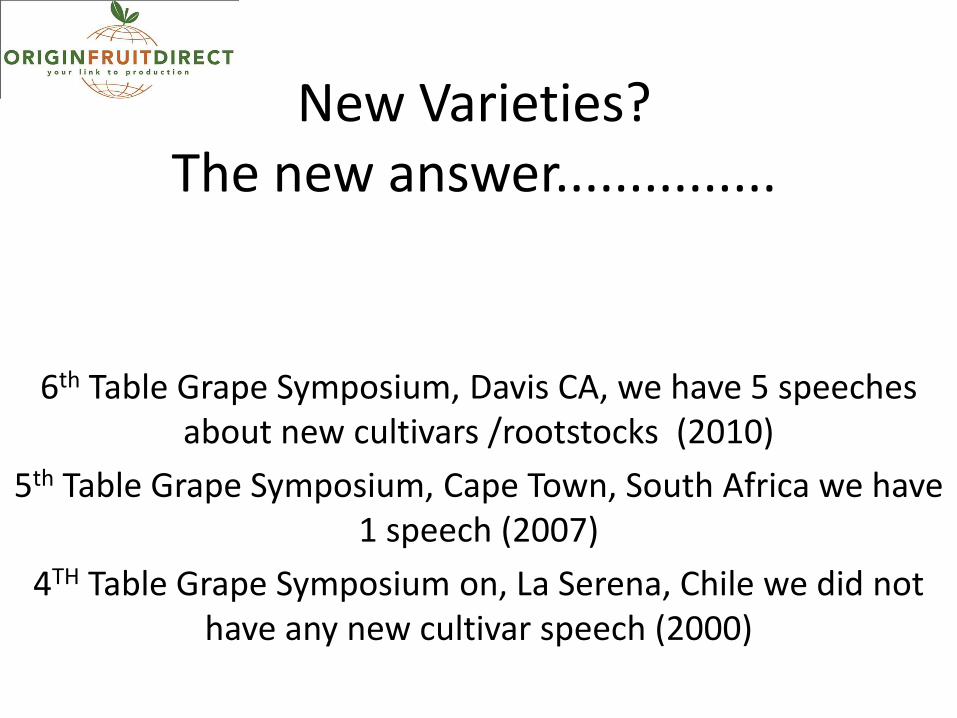
New Varieties?The new answer...............
6th Table Grape Symposium, Davis CA, we have 5 speeches about new cultivars /rootstocks (2010)
5th Table Grape Symposium, Cape Town, South Africa we have 1 speech (2007)
4TH Table Grape Symposium on, La Serena, Chile we did not have any new cultivar speech (2000)
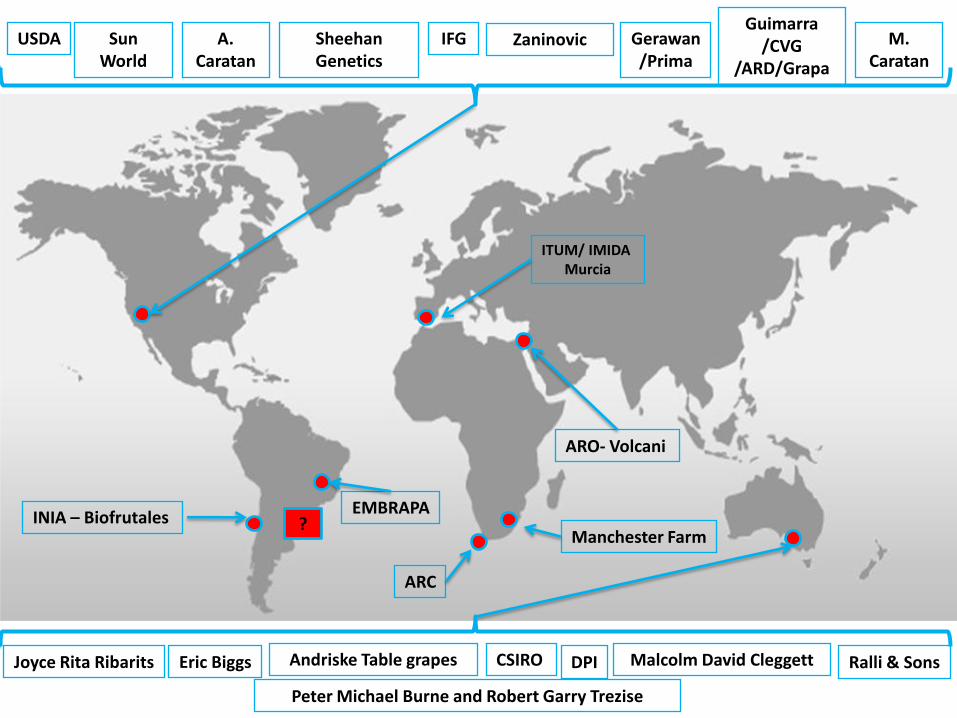
INIA – BiofrutalesEMBRAPA
ARC
Manchester Farm
ARO- Volcani
ITUM/ IMIDA Murcia
USDA Sun World
A. Caratan
Sheehan Genetics
Zaninovic Gerawan/Prima
Guimarra/CVG
/ARD/Grapa
M.Caratan
CSIRO
IFG
Andriske Table grapes DPIEric BiggsJoyce Rita Ribarits Malcolm David Cleggett
Peter Michael Burne and Robert Garry Trezise
Ralli & Sons
?
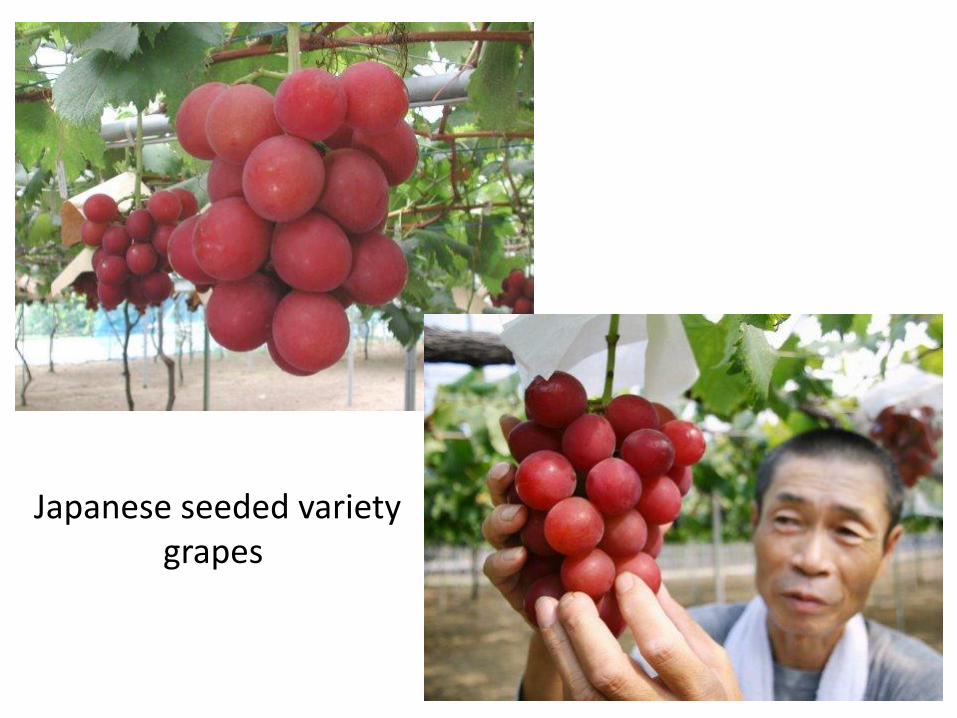
Japanese seeded varietygrapes
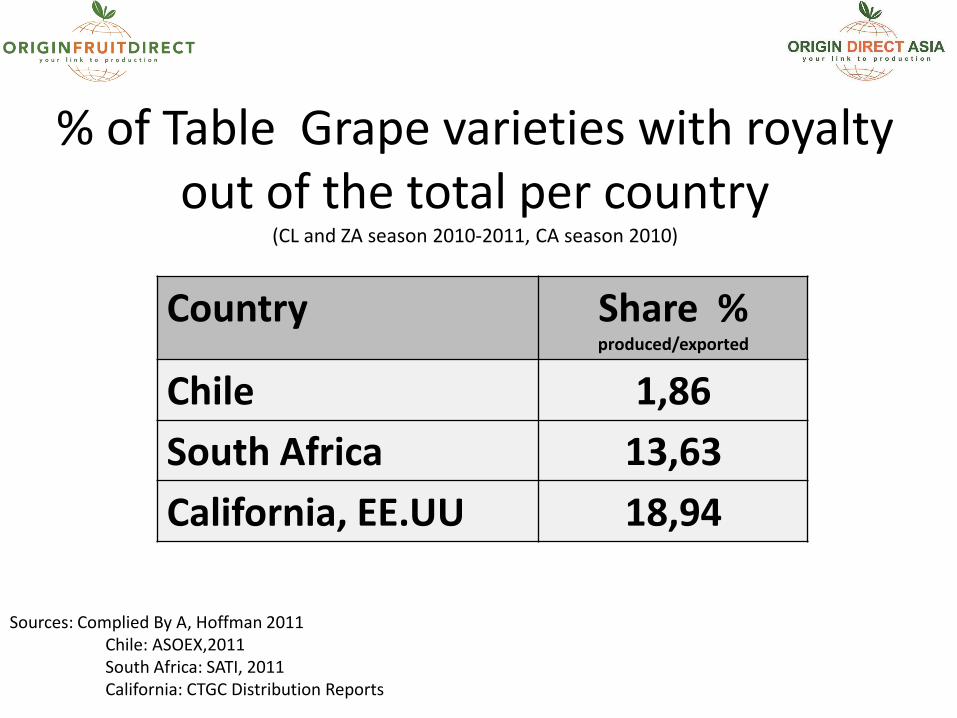
Country Share % produced/exported
Chile 1,86
South Africa 13,63
California, EE.UU 18,94
% of Table Grape varieties with royalty out of the total per country
(CL and ZA season 2010-2011, CA season 2010)
Sources: Complied By A, Hoffman 2011Chile: ASOEX,2011South Africa: SATI, 2011California: CTGC Distribution Reports
Pronósticos………….
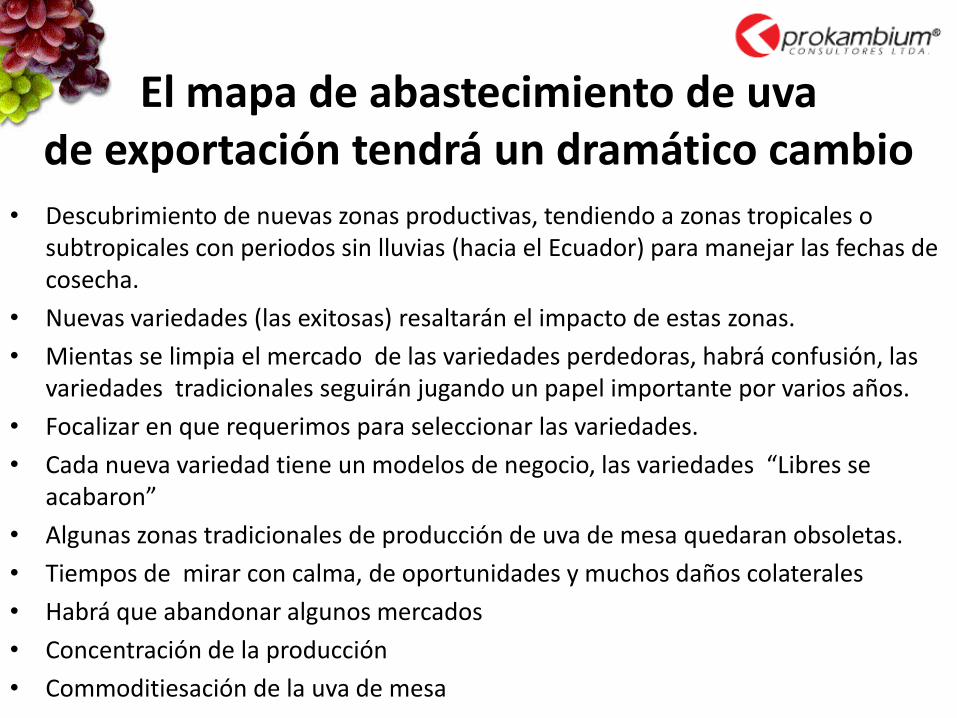
El mapa de abastecimiento de uva de exportación tendrá un dramático cambio
• Descubrimiento de nuevas zonas productivas, tendiendo a zonas tropicales o subtropicales con periodos sin lluvias (hacia el Ecuador) para manejar las fechas de cosecha.
• Nuevas variedades (las exitosas) resaltarán el impacto de estas zonas.
• Mientas se limpia el mercado de las variedades perdedoras, habrá confusión, las variedades tradicionales seguirán jugando un papel importante por varios años.
• Focalizar en que requerimos para seleccionar las variedades.
• Cada nueva variedad tiene un modelos de negocio, las variedades “Libres se acabaron”
• Algunas zonas tradicionales de producción de uva de mesa quedaran obsoletas.
• Tiempos de mirar con calma, de oportunidades y muchos daños colaterales
• Habrá que abandonar algunos mercados
• Concentración de la producción
• Commoditiesación de la uva de mesa

The New frontier
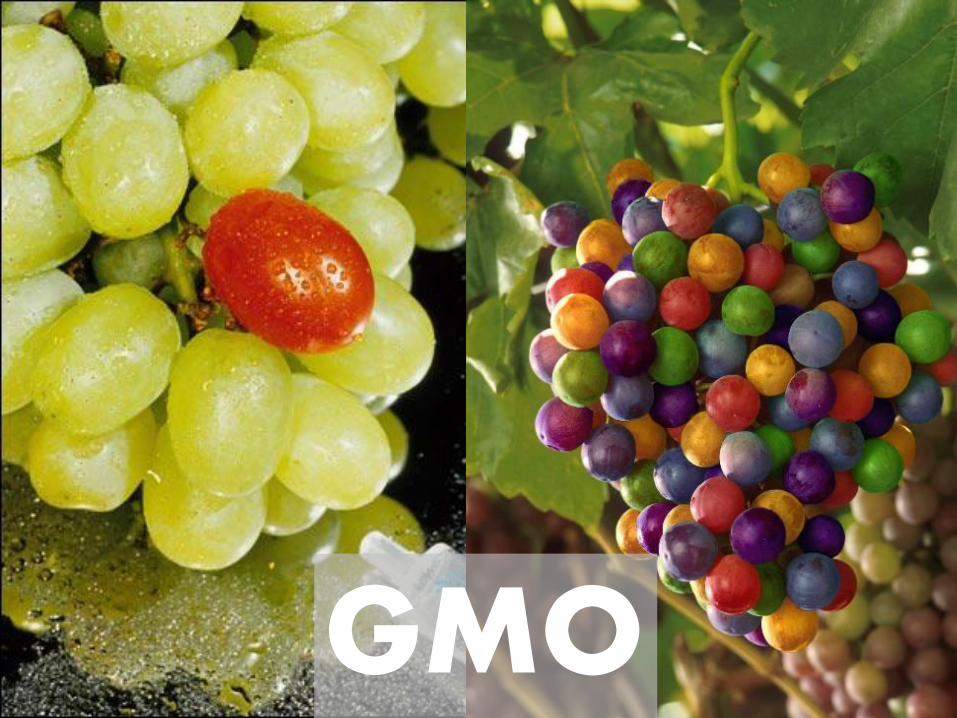
GMO
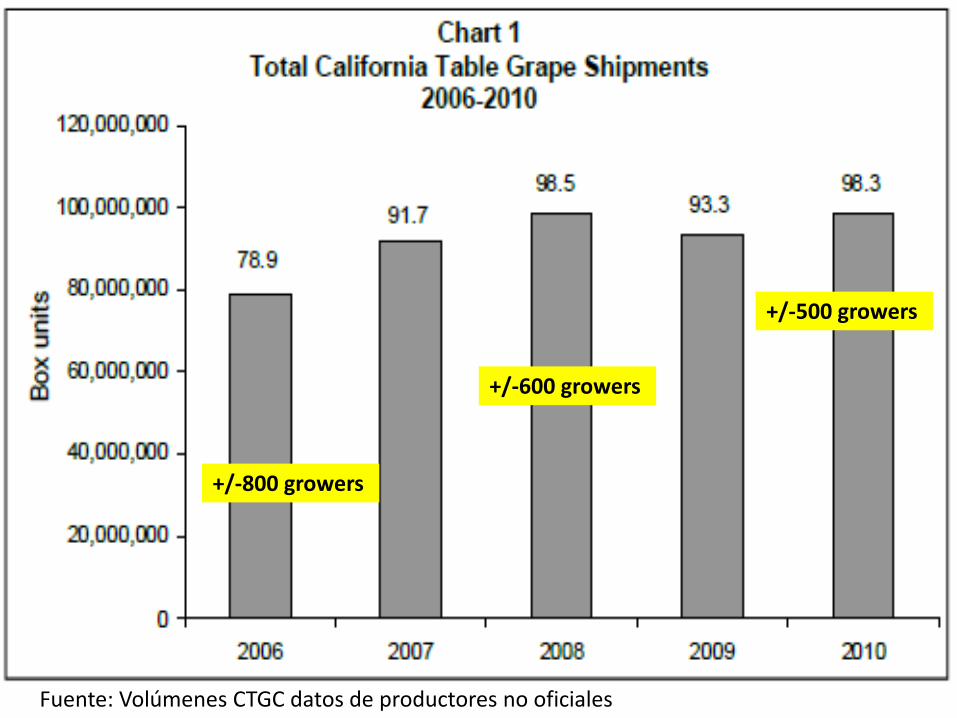
+/-800 growers
+/-600 growers
+/-500 growers
Fuente: Volúmenes CTGC datos de productores no oficiales
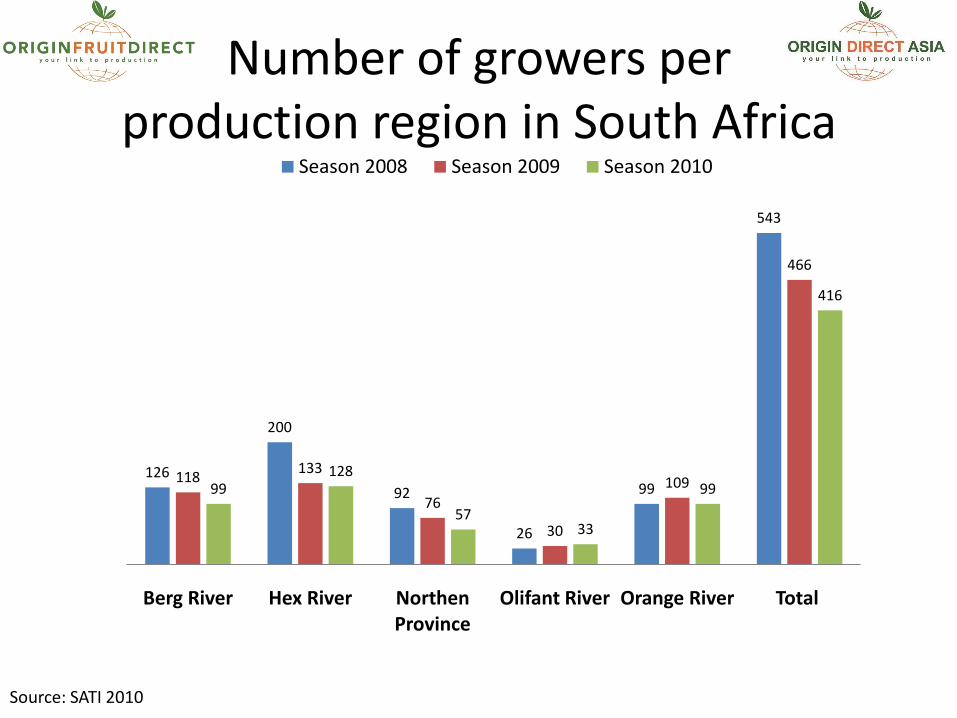
126
200
92
26
99
543
118133
76
30
109
466
99128
5733
99
416
Berg River Hex River Northen Province
Olifant River Orange River Total
Season 2008 Season 2009 Season 2010
Number of growers per production region in South Africa
Source: SATI 2010
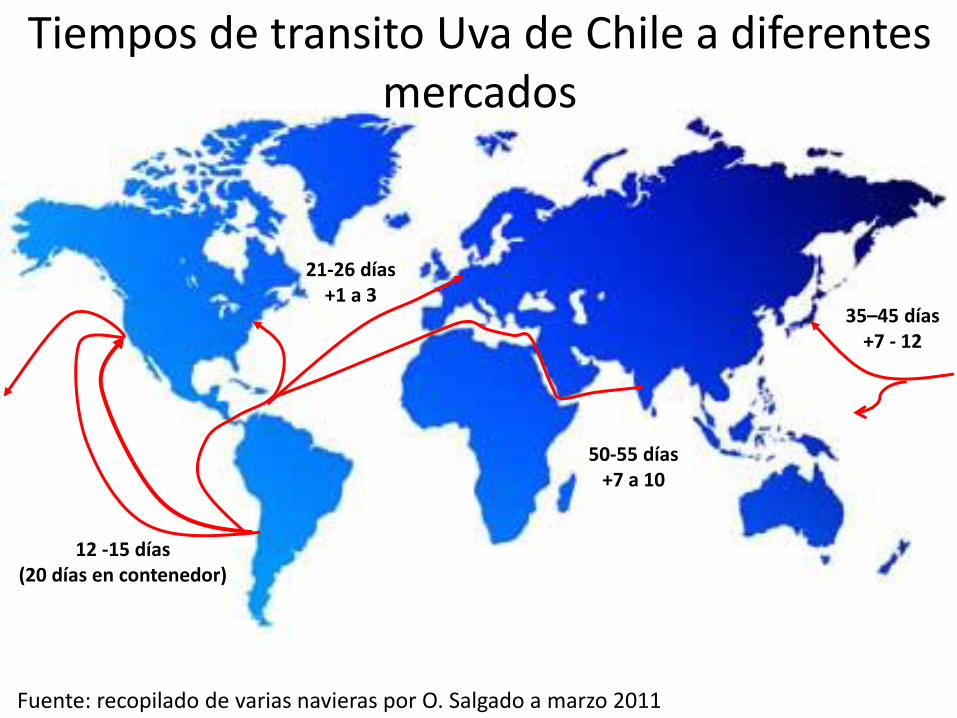
21-26 días+1 a 3
12 -15 días(20 días en contenedor)
35–45 días+7 - 12
50-55 días+7 a 10
Tiempos de transito Uva de Chile a diferentes mercados
Fuente: recopilado de varias navieras por O. Salgado a marzo 2011
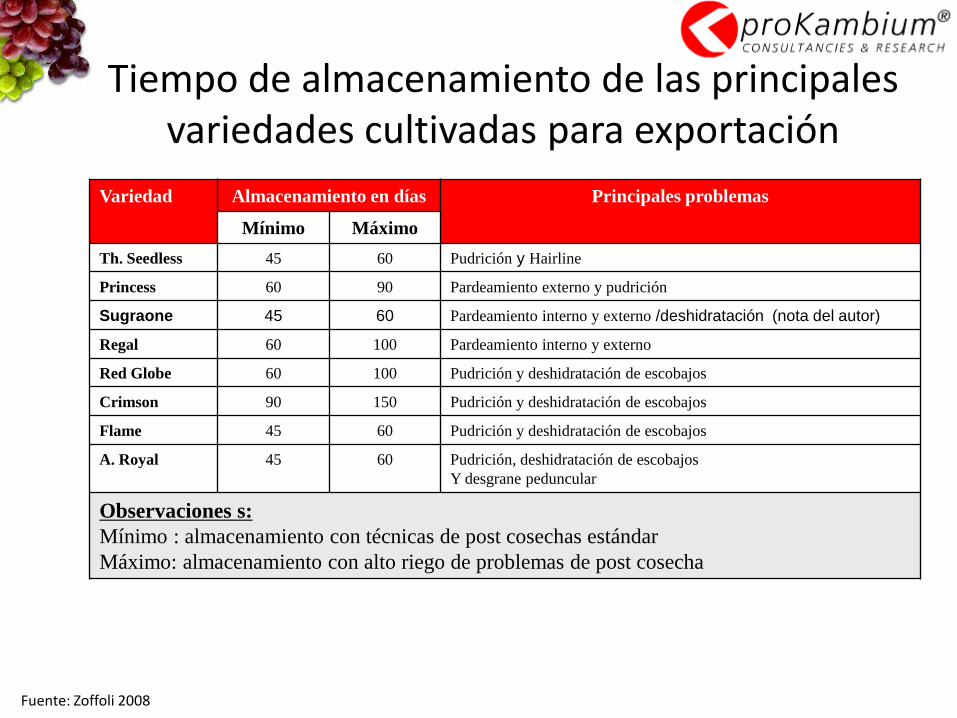
Variedad Almacenamiento en días Principales problemas
Mínimo Máximo
Th. Seedless 45 60 Pudrición y Hairline
Princess 60 90 Pardeamiento externo y pudrición
Sugraone 45 60 Pardeamiento interno y externo /deshidratación (nota del autor)
Regal 60 100 Pardeamiento interno y externo
Red Globe 60 100 Pudrición y deshidratación de escobajos
Crimson 90 150 Pudrición y deshidratación de escobajos
Flame 45 60 Pudrición y deshidratación de escobajos
A. Royal 45 60 Pudrición, deshidratación de escobajos
Y desgrane peduncular
Observaciones s:
Mínimo : almacenamiento con técnicas de post cosechas estándar
Máximo: almacenamiento con alto riego de problemas de post cosecha
Fuente: Zoffoli 2008
Tiempo de almacenamiento de las principales variedades cultivadas para exportación
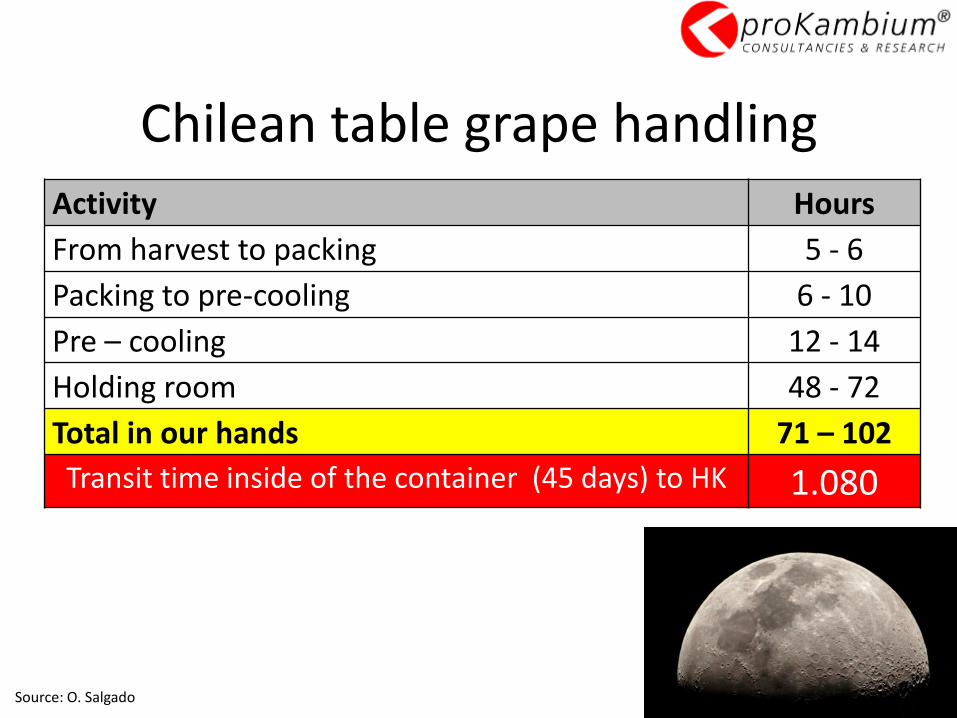
Activity Hours
From harvest to packing 5 - 6
Packing to pre-cooling 6 - 10
Pre – cooling 12 - 14
Holding room 48 - 72
Total in our hands 71 – 102
Transit time inside of the container (45 days) to HK 1.080
Source: O. Salgado
Chilean table grape handling
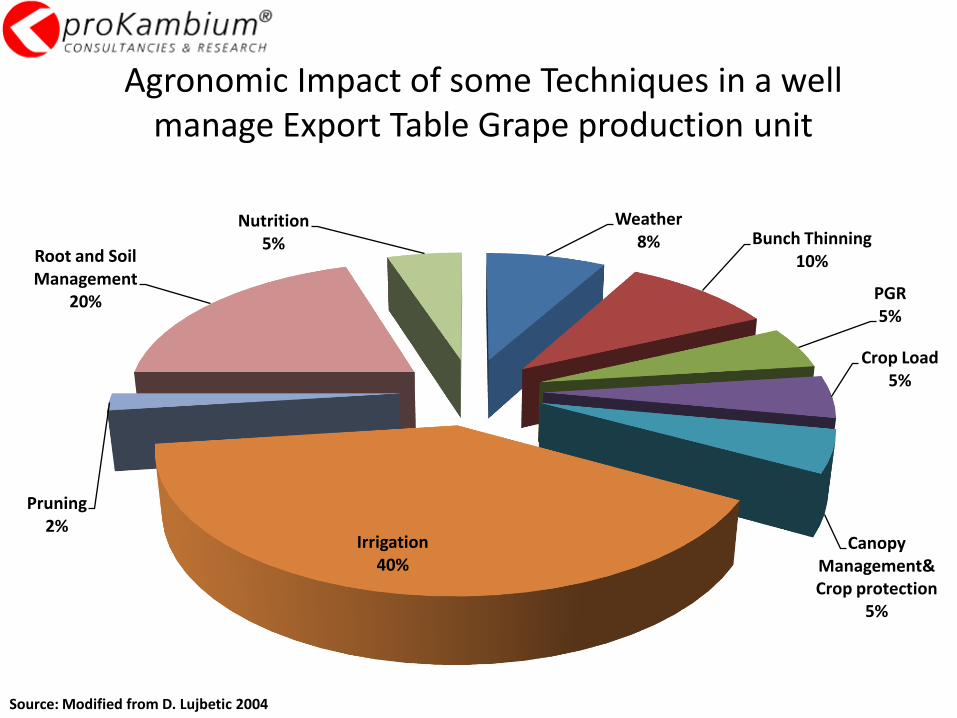
Weather 8% Bunch Thinning
10%
PGR5%
Crop Load 5%
Canopy Management&Crop protection
5%
Irrigation 40%
Pruning 2%
Root and Soil Management
20%
Nutrition 5%
Agronomic Impact of some Techniques in a well manage Export Table Grape production unit
Source: Modified from D. Lujbetic 2004
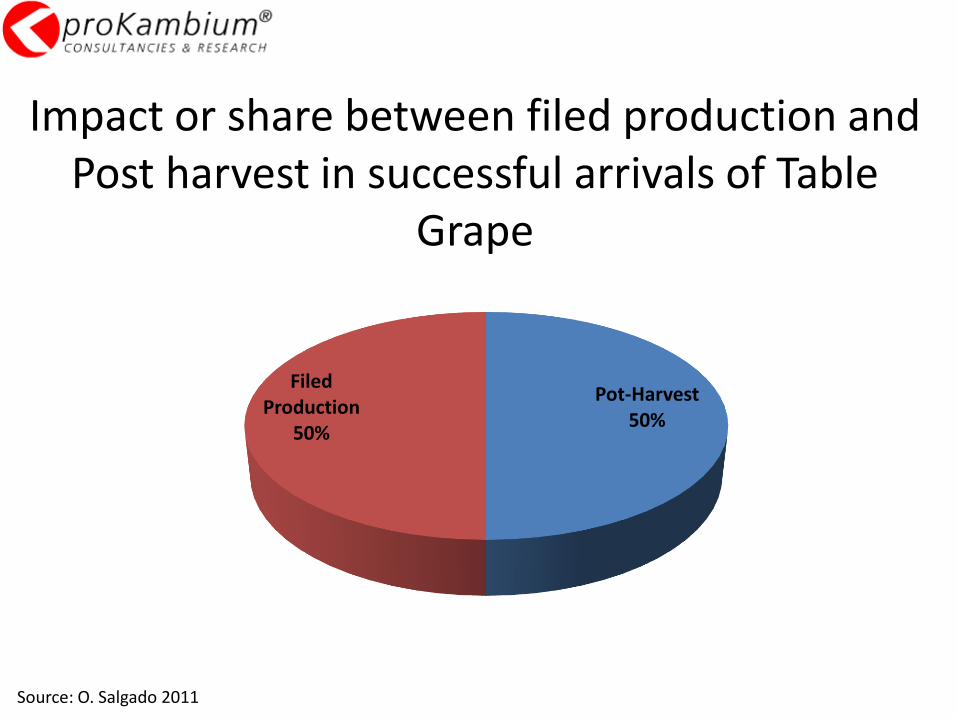
Pot-Harvest 50%
Filed Production
50%
Impact or share between filed production and Post harvest in successful arrivals of Table
Grape
Source: O. Salgado 2011
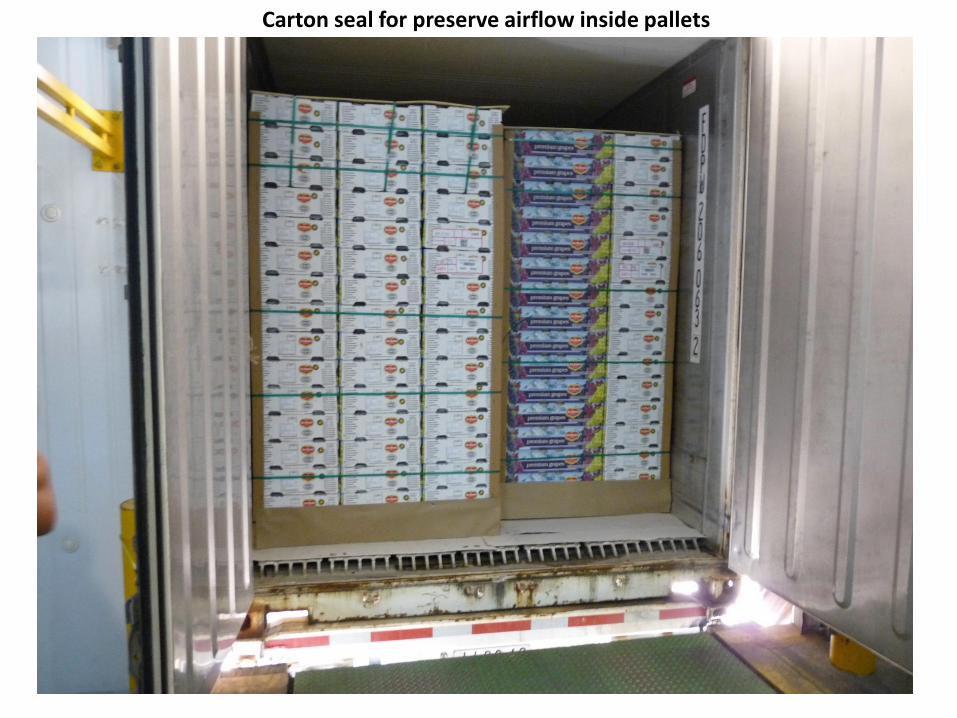
Carton seal for preserve airflow inside pallets

0% Ventilation for Table Grapes
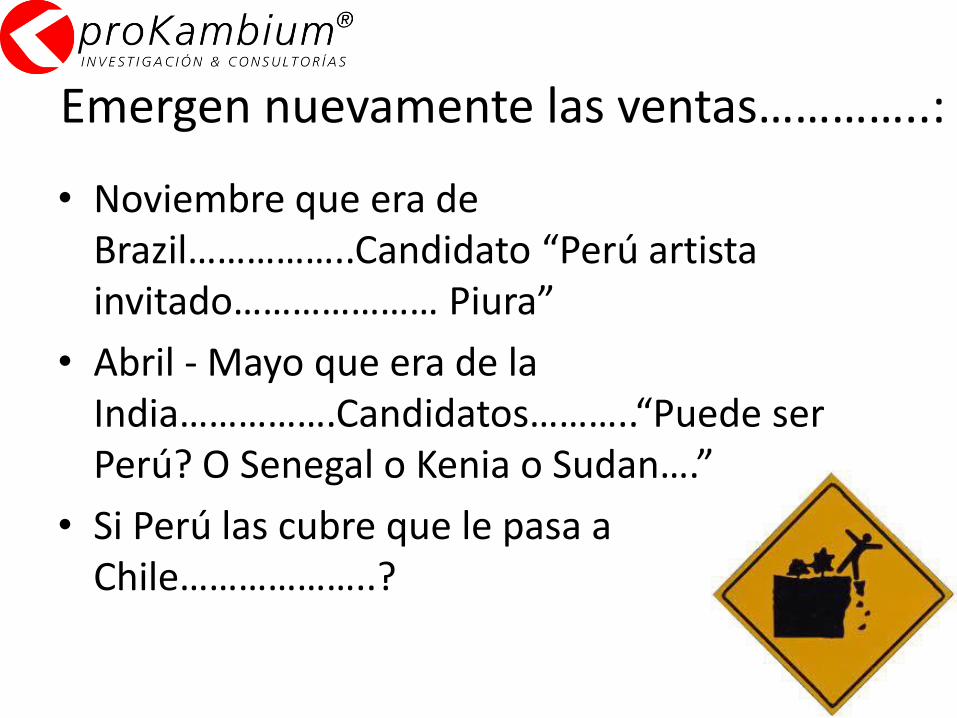
Emergen nuevamente las ventas…………..:
• Noviembre que era de Brazil……………..Candidato “Perú artista invitado………………… Piura”
• Abril - Mayo que era de la India…………….Candidatos………..“Puede ser Perú? O Senegal o Kenia o Sudan….”
• Si Perú las cubre que le pasa a Chile………………..?