Embed Size (px)
Citation preview
BULLETIN OF MARINE SCIENCE, 77(3): 321–345, 2005
321Bulletin of Marine Science© 2005 Rosenstiel School of Marine and Atmospheric Science of the University of Miami
MERCURY IN FLORIDA BAY FISH: SPATIAL DISTRIBUTION OF ELEVATED CONCENTRATIONS AND POSSIBLE
LINKAGES TO EVERGLADES RESTORATION
David W. Evans and Peter H. Crumley
ABSTRACTHealth advisories are now posted in northern Florida Bay, adjacent to the Ever-
glades, warning of high mercury concentrations in some species of gamefish. High-est concentrations of mercury in both forage fish and gamefish have been measured in the northeastern corner of Florida Bay, adjacent to the dominant freshwater in-flows from the Everglades. Thirty percent of spotted seatrout (Cynoscion nebulosus Cuvier, 1830) analyzed exceeded Florida’s no consumption level of 1.5 μg g−1 mer-cury in this area. We hypothesized that freshwater draining the Everglades served as the major source of methylmercury entering the food web supporting gamefish. A lack of correlation between mercury concentrations and salinity did not support this hypothesis, although enhanced bioavailability of methylmercury is possible as freshwater is diluted with estuarine water. Stable isotopes of carbon, nitrogen, and sulfur were measured in fish to elucidate the shared pathways of methylmercury and nutrient elements through the food web. These data support a benthic source of both methylmercury and nutrient elements to gamefish within the eastern bay, as opposed to a dominant watershed source. Ecological characteristics of the east-ern bay, including active redox cycling in near-surface sediments without exces-sive sulfide production are hypothesized to promote methylmercury formation and bioaccumulation in the benthos. Methylmercury may then accumulate in gamefish through a food web supported by benthic microalgae, detritus, pink shrimp (Farfan-tepenaeus duorarum Burkenroad, 1939), and other epibenthic feeders. Uncertainty remains as to the relative importance of watershed imports of methylmercury from the Everglades and in situ production in the bay, an uncertainty that needs resolu-tion if the effects of Everglades restoration on mercury levels in fish are to be mod-eled and managed.
High mercury concentrations in fish have resulted in widespread advisories warn-ing against fish consumption in many parts of the U.S. (U.S. Environmental Protec-tion Agency (EPA), 2001). Most advisories are posted for freshwater habitats, but twelve states list estuarine and coastal advisories. In California, Texas, and Georgia these advisories are linked to specific terrestrial sources of mercury contamination (U.S. EPA, 2004). High levels of mercury are also found in some large pelagic fish and sharks with no identifiable coastal inputs. These high concentrations offshore are thought to result from progressive biomagnification along a lengthy food chain leading to long-lived top predators (Eisler, 1981).
Health advisories were implemented in Florida Bay when high mercury concen-trations were found in spotted seatrout (Cynoscion nebulosus Cuvier, 1830), crevalle jack (Caranx hippos Linnaeus, 1766), ladyfish (Elops saurus Linnaeus, 1766), blue-fish (Pomatomus saltatrix Linnaeus, 1766), and gafftopsail catfish (Bagre marinus Mitchill, 1815) along the northeastern boundary adjacent to the Everglades. Mean mercury concentrations were often greater than Florida’s limited consumption ad-visory level of 0.5 μg g−1 (ppm) mercury, wet weight (Strom and Graves, 1995). Some fish exceeded an additional Florida no-consumption advisory of 1.5 μg g−1 mercury.
BULLETIN OF MARINE SCIENCE, VOL. 77, NO. 3, 2005322
Strom and Graves (2001) speculated that the high mercury levels were associated with proximity to urban sources in nearby Miami-Dade County.
In south Florida, much of the Everglades and adjacent freshwater wetland areas are under mercury advisories. The multi-agency South Florida Mercury Science Pro-gram (SFMSP) has conducted an extensive freshwater research program seeking to understand the causes of elevated mercury concentrations in fish, birds, mammals, and other top predators in the greater Everglades (Atkeson and Parks, 2001). We hy-pothesized that waters draining from the Everglades into northeastern Florida Bay could introduce methylmercury into the food web supporting gamefish caught for human consumption. Alternatively, the origin of elevated mercury concentrations may result from in situ production of methylmercury in the bay and from the food web dependent processes of bioaccumulation and biomagnification.
Florida Bay is a shallow lagoonal estuary with an area of 1928 km2 located between the southern mainland of Florida and the Florida Keys, with broad connection with the Gulf of Mexico on the west (Cosby et al., 1999). Its physical, geological, hydrolog-ical, and ecological setting has been broadly described by Fourqurean and Robblee (1999), with special regard to recent changes. The bay is shallow, grading from about 3 m depth in the west to 1 m in the east, with hard calcareous bottom overlain with calcareous sediments. Extensive mud banks and mangrove islands subdivide the bay into basins and restrict circulation. Tidal fluctuations are largely damped out in the east and high evaporation can lead to periods of hypersalinity, usually most intense in the middle of the bay.
Rainfall is the main source of freshwater to the bay with a seasonal maximum be-tween June and November, but runoff from the Everglades in the northeast leads to strong and variable salinity gradients emanating from major inflows through Joe Bay and Little Madeira Bay. These freshwater inflows have been reduced from historical flows by extensive water management diversions in the Everglades’ watershed. Some limited increases in flows have been recently implemented by Everglades restoration activities, however, and these restoration associated flows are likely to increase fur-ther (McIvor et al., 1994).
Waters of Florida Bay are oligotrophic and mostly phosphorus-limited in the east. The main source of phosphorus enters from the west with marine Gulf of Mexico water (Boyer et al., 1997). Freshwater entering from the Everglades provides a source of nitrogen to the eastern bay that creates a gradient in nitrogen that varies inversely from the west to east phosphorus gradient (Boyer et al., 1997).
Seagrasses cover much of the bay’s bottom, with a general gradient in density de-clining toward the east. This gradient in seagrass density is paralleled by a similar eastward decline in primary productivity by seagrass epiphytes, phytoplankton, and bacterioplankton (Phlips et al., 1995; Frankovich and Fourqurean, 1997; Lavrentyev et al., 1998; Fourqurean and Robblee, 1999). Nuisance algal blooms have occurred in the central part of the bay where circulation is most restricted and hypersalinity events are most intense. Biomass and density of fish and other consumer organisms also parallel the primary productivity gradient.
We sought to estimate the extent of the elevated mercury levels in Florida Bay fish and to determine if spatial patterns can implicate possible sources. We investi-gated associations with salinity from which a source of methylmercury entering with freshwater from the Everglades might be inferred. Finally, we looked for associations of high mercury concentrations with stable carbon, nitrogen, and sulfur isotope ra-
EVANS AND CRUMLEY: MERCURY IN FLORIDA BAY FISH 323
tios in fish from which we might infer the food web base and ecotonal regime from which methylmercury is derived (Peterson and Fry, 1987; Michener and Schell, 1994; Atwell et al., 1998; Kidd et al., 1999).
METHODS
SAMPLING.—Biota were collected between December 1995 and October 2001 throughout Florida Bay for mercury and stable carbon, nitrogen, and sulfur isotope analysis. Initial ef-forts focused on three species of forage fish: bay anchovies (Anchoa mitchilli Valenciennes, 1848), rainwater killifish (Lucania parva Baird and Girard, 1855), and mojarra (Eucinostomus gula Quoy and Gaimard, 1824). These three species are pelagic, seagrass canopy, and benthic feeders, respectively (Odum and Heald, 1972; Carr and Adams, 1973). They are important prey species of fish and avian predators, and they act as important linkages for mercury trans-fer through the food web (Thayer et al., 1987). In addition, three species of gamefish were sampled: spotted seatrout (Cynoscion nebulosus Cuvier, 1830), red drum (Sciaenops ocellatus Linnaeus, 1766), and gray snapper (Lutjanus griseus Linnaeus, 1758). These are the three most important species harvested in the recreational fishery of the bay (Tilmant, 1989). Opportu-nistic collection of invertebrate and plant samples was also conducted.
Forage fish were collected by otter trawl during periodic sampling in support of juvenile fish studies in Florida Bay (Thayer et al., 1999). Additional forage fish were provided by J. Col-vocoresses of the Florida Marine Research Institute (FMRI) from their fisheries-independent sampling program in Florida Bay during 1996 and 1997; these specimens were collected using otter trawls or beach seines.
Top predator fish (spotted seatrout, red drum, and gray snapper) were acquired through cooperation with FMRI during 1996 and 1997 and Everglades National Park during 1998, 1999, and 2000. Most gamefish were sampled by hook and line. Sampling sites were located by GPS and by map reference. Salinity, temperature, and turbidity were recorded at most sample sites.
The number of fish analyzed and the ranges in their sizes are shown in Table 1. Most game-fish were subadults and adults. Fish were not aged, but approximate ages can be estimated from length: gray snapper 1–4 yrs, red drum 1–5 yrs, and spotted seatrout 1–8 yrs (Croker, 1960; Rutherford et al., 1983; Murphy and Taylor, 1990).
MERCURY ANALYSIS.—Edible muscle tissues of gamefish were analyzed for mercury. Sam-ples of approximately 1 g wet weight were dissected from fillets of whole fish. Individual for-age fish were analyzed whole, or if > 1 g wet weight, a sub-sample of this size was taken from a homogenized whole fish. Weighed samples were freeze-dried for 16 hrs, and dry weights were determined.
Tissue samples were analyzed for total mercury by cold vapor atomic absorption spectro-photometry following modified EPA method 245.6, Determination of Mercury in Tissues by Cold Vapor Atomic Absorption Spectrometry (U. S. EPA, 1991). Mercury was determined with a Perkin-Elmer model FIMS 400 automated flow injection atomic absorption spectro-photometric mercury analyzer. Mercury was determined at a wavelength of 253.7 nm by com-paring the absorbance of the unknown samples with the absorbance of standard solutions prepared to mimic sample digest blanks. Concentrations are reported on a wet weight basis. Prior to analysis, samples were digested in tared 30 ml PFA Teflon vials (Savillex, Inc.) with a mixture of 2.5 ml sulfuric and 1.5 ml nitric acids. Sample digests were heated in a microwave oven (CEM Model MDS 81D) for 20 min at 50% power, with the caps sealing the vials for the last 15 min. Additions of 10 ml 5% w/v potassium permanganate and 5 ml 5% w/v potassium persulfate were made, and the 20 min microwave heating program repeated. After cooling, 5 ml of a 10% aqueous solution of hydroxylamine hydrochloride was added to dissolve any precipitated manganese oxides. Three ml of deionized water (Milli-Q™) was added and the digests mixed by shaking. Weights and solution densities were measured from which digest
BULLETIN OF MARINE SCIENCE, VOL. 77, NO. 3, 2005324
volumes were calculated. Acids were ACS grade redistilled (GFS Chemicals) and other re-agents were ACS grade specifically for mercury analysis (J. T. Baker or GFS Chemicals).
Certified reference materials, matrix spikes and duplicates, and blanks were included dur-ing the procedures to ensure acceptable accuracy and precision. Analysis of the certified ref-erence material, DORM-2 (National Research Council, Canada), yielded a mean measured concentration of 5.17 μg g−1, with a stdandard deviation (SE) of 0.40 μg g−1 (n = 91). The certi-fied concentration is 4.64 μg g−1 ± 0.26 μg g−1. Spike recoveries averaged 115% ± 15%. The de-tection limit for tissue was 0.0025 μg g−1 wet weight (based on 3 SE of the blanks).
We also analyzed 12 fish previously analyzed by the Florida Department of Environmen-tal Protection (FDEP) Mercury Laboratory with a range of mercury concentrations reported from 0.047 to 2.30 μg g−1. A regression of our results versus those of FDEP yielded an r2 = 0.993 with a slope of 0.947 ± 0.024 and an intercept of 0.029 ± 0.022.
Mercury concentrations of forage fish are reported as the mean measured concentration in the 5–10 fish analyzed individually from each site. Within any site, mercury concentrations in individual forage fish of a given species showed coefficients of variation that averaged 28%.
STABLE ISOTOPE ANALYSIS.—Samples for stable isotope analysis were freeze-dried before shredding with a stainless steel coffee mill and subsequent milling to a fine powder with a Wig-L-Bug (Crescent Industries). Between samples, the milling devices were wiped free of residual particles with laboratory wipes. Forage fish samples were prepared as a composite of individual fish distinct from those used in mercury analysis but from the same sample. Game-fish samples were prepared from the same fillet used in mercury analysis. A limited number of invertebrate and plant samples were also composited and treated with HCl vapor to remove carbonates that would bias carbon isotope analysis (Bosley and Wainright, 1999). Carbon and nitrogen isotope analyses were performed by Isotope Services Inc., Los Alamos, New Mexico by continuous flow isotope ratio mass spectroscopy. Sulfur isotope analyses were performed by Coastal Science Laboratories Inc., Austin, Texas. Precision, based on duplicate analyses was ± 0.09 for δ13C, ± 0.35 for δ15N, and ± 0.23 for δ34S. Only a subset of the gamefish (n = 81) was analyzed for δ34S.
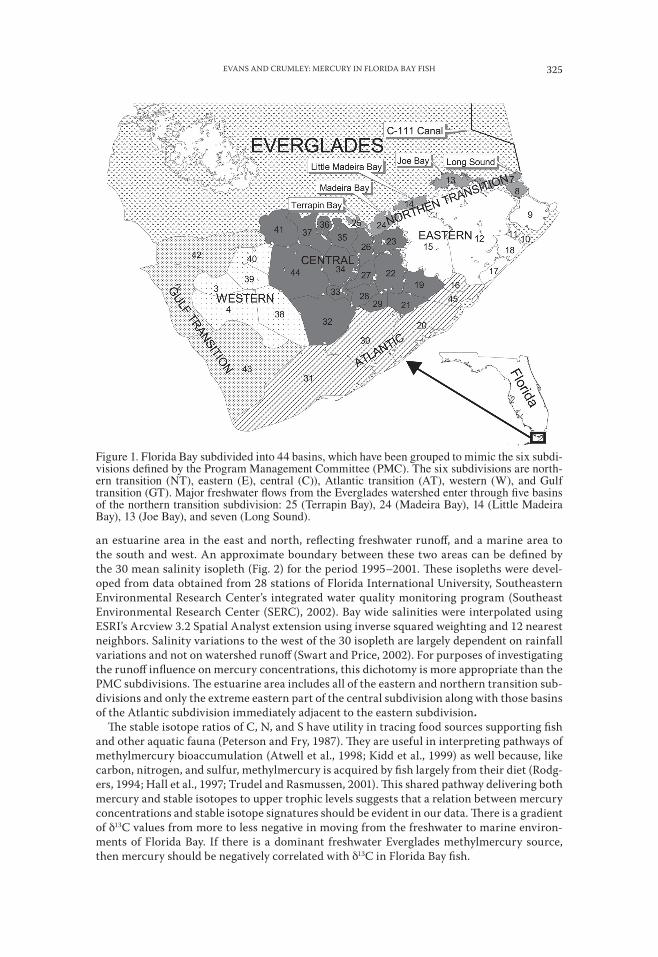
STATISTICAL ANALYSES.—As an initial unit of analysis, we used the 42 basins (Fig. 1) em-ployed in the FATHOM mass balance model of salinity described in Nuttle et al. (2000). These basins were initially grouped into six subdivisions delineated by the Program Manage-ment Committee (PMC) of the Interagency Florida Bay and Adjacent Marine Ecosystems Program (PMC, 2004) to represent areas of similar biological and hydrological character. The northern transition, eastern, and central subdivisions form an inner region that is hydrologi-cally isolated by a series of mud banks and islands from marine influences to some extent. These three subdivisions are proximate to Everglades freshwater inflows through Little Ma-deira Bay and Joe Bay in the northeastern corner of Florida Bay. The PMC’s Gulf transition, Atlantic transition, and western subdivisions form an outer region that is remote from these freshwater flows and they are more influenced by exchanges of marine waters with the Gulf of Mexico and the Atlantic Ocean. These six subdivisions were used in an initial assessment of mean concentrations of mercury in fish.
Subsequent assessments of the patterns of mercury concentrations in fish used a spatial distinction based on average salinity. Salinity patterns divide Florida Bay into two areas:
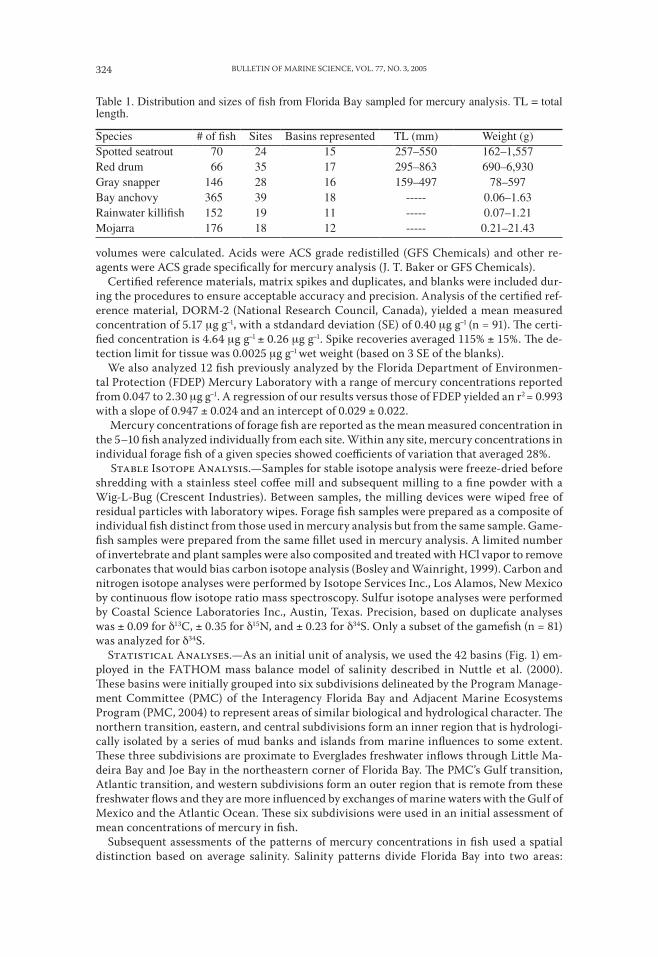
Table 1. Distribution and sizes of fish from Florida Bay sampled for mercury analysis. TL = total length.
Species # of fish Sites Basins represented TL (mm) Weight (g)Spotted seatrout 70 24 15 257–550 162–1,557Red drum 66 35 17 295–863 690–6,930Gray snapper 146 28 16 159–497 78–597Bay anchovy 365 39 18 ----- 0.06–1.63Rainwater killifish 152 19 11 ----- 0.07–1.21Mojarra 176 18 12 ----- 0.21–21.43
EVANS AND CRUMLEY: MERCURY IN FLORIDA BAY FISH 325
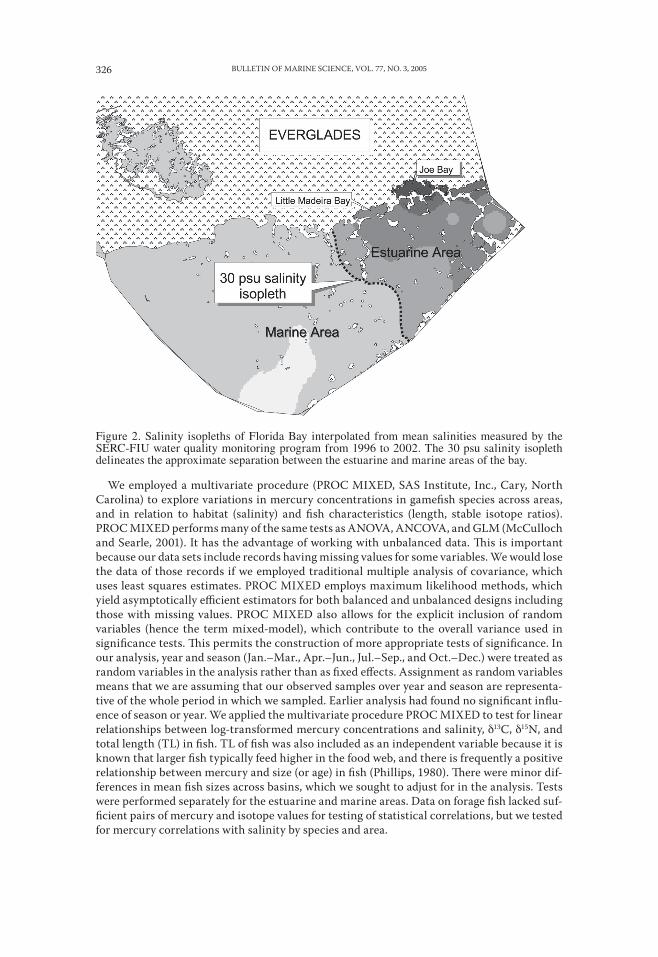
an estuarine area in the east and north, reflecting freshwater runoff, and a marine area to the south and west. An approximate boundary between these two areas can be defined by the 30 mean salinity isopleth (Fig. 2) for the period 1995–2001. These isopleths were devel-oped from data obtained from 28 stations of Florida International University, Southeastern Environmental Research Center’s integrated water quality monitoring program (Southeast Environmental Research Center (SERC), 2002). Bay wide salinities were interpolated using ESRI’s Arcview 3.2 Spatial Analyst extension using inverse squared weighting and 12 nearest neighbors. Salinity variations to the west of the 30 isopleth are largely dependent on rainfall variations and not on watershed runoff (Swart and Price, 2002). For purposes of investigating the runoff influence on mercury concentrations, this dichotomy is more appropriate than the PMC subdivisions. The estuarine area includes all of the eastern and northern transition sub-divisions and only the extreme eastern part of the central subdivision along with those basins of the Atlantic subdivision immediately adjacent to the eastern subdivision.
The stable isotope ratios of C, N, and S have utility in tracing food sources supporting fish and other aquatic fauna (Peterson and Fry, 1987). They are useful in interpreting pathways of methylmercury bioaccumulation (Atwell et al., 1998; Kidd et al., 1999) as well because, like carbon, nitrogen, and sulfur, methylmercury is acquired by fish largely from their diet (Rodg-ers, 1994; Hall et al., 1997; Trudel and Rasmussen, 2001). This shared pathway delivering both mercury and stable isotopes to upper trophic levels suggests that a relation between mercury concentrations and stable isotope signatures should be evident in our data. There is a gradient of δ13C values from more to less negative in moving from the freshwater to marine environ-ments of Florida Bay. If there is a dominant freshwater Everglades methylmercury source, then mercury should be negatively correlated with δ13C in Florida Bay fish.
Figure 1. Florida Bay subdivided into 44 basins, which have been grouped to mimic the six subdi-visions defined by the Program Management Committee (PMC). The six subdivisions are north-ern transition (NT), eastern (E), central (C)), Atlantic transition (AT), western (W), and Gulf transition (GT). Major freshwater flows from the Everglades watershed enter through five basins of the northern transition subdivision: 25 (Terrapin Bay), 24 (Madeira Bay), 14 (Little Madeira Bay), 13 (Joe Bay), and seven (Long Sound).
BULLETIN OF MARINE SCIENCE, VOL. 77, NO. 3, 2005326
We employed a multivariate procedure (PROC MIXED, SAS Institute, Inc., Cary, North Carolina) to explore variations in mercury concentrations in gamefish species across areas, and in relation to habitat (salinity) and fish characteristics (length, stable isotope ratios). PROC MIXED performs many of the same tests as ANOVA, ANCOVA, and GLM (McCulloch and Searle, 2001). It has the advantage of working with unbalanced data. This is important because our data sets include records having missing values for some variables. We would lose the data of those records if we employed traditional multiple analysis of covariance, which uses least squares estimates. PROC MIXED employs maximum likelihood methods, which yield asymptotically efficient estimators for both balanced and unbalanced designs including those with missing values. PROC MIXED also allows for the explicit inclusion of random variables (hence the term mixed-model), which contribute to the overall variance used in significance tests. This permits the construction of more appropriate tests of significance. In our analysis, year and season (Jan.–Mar., Apr.–Jun., Jul.–Sep., and Oct.–Dec.) were treated as random variables in the analysis rather than as fixed effects. Assignment as random variables means that we are assuming that our observed samples over year and season are representa-tive of the whole period in which we sampled. Earlier analysis had found no significant influ-ence of season or year. We applied the multivariate procedure PROC MIXED to test for linear relationships between log-transformed mercury concentrations and salinity, δ13C, δ15N, and total length (TL) in fish. TL of fish was also included as an independent variable because it is known that larger fish typically feed higher in the food web, and there is frequently a positive relationship between mercury and size (or age) in fish (Phillips, 1980). There were minor dif-ferences in mean fish sizes across basins, which we sought to adjust for in the analysis. Tests were performed separately for the estuarine and marine areas. Data on forage fish lacked suf-ficient pairs of mercury and isotope values for testing of statistical correlations, but we tested for mercury correlations with salinity by species and area.
Figure 2. Salinity isopleths of Florida Bay interpolated from mean salinities measured by the SERC-FIU water quality monitoring program from 1996 to 2002. The 30 psu salinity isopleth delineates the approximate separation between the estuarine and marine areas of the bay.
EVANS AND CRUMLEY: MERCURY IN FLORIDA BAY FISH 327
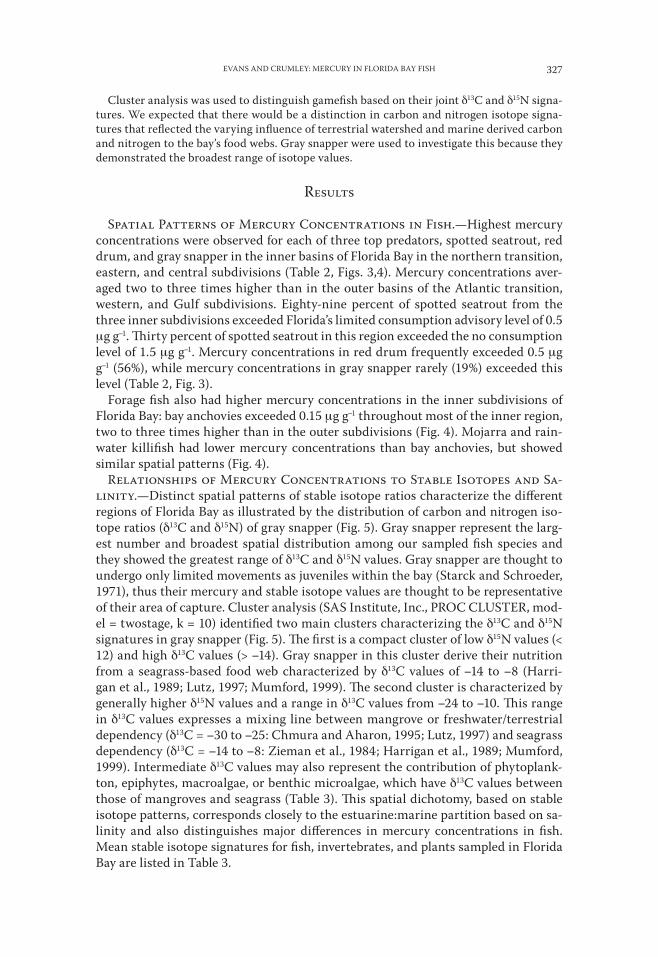
Cluster analysis was used to distinguish gamefish based on their joint δ13C and δ15N signa-tures. We expected that there would be a distinction in carbon and nitrogen isotope signa-tures that reflected the varying influence of terrestrial watershed and marine derived carbon and nitrogen to the bay’s food webs. Gray snapper were used to investigate this because they demonstrated the broadest range of isotope values.
RESULTS
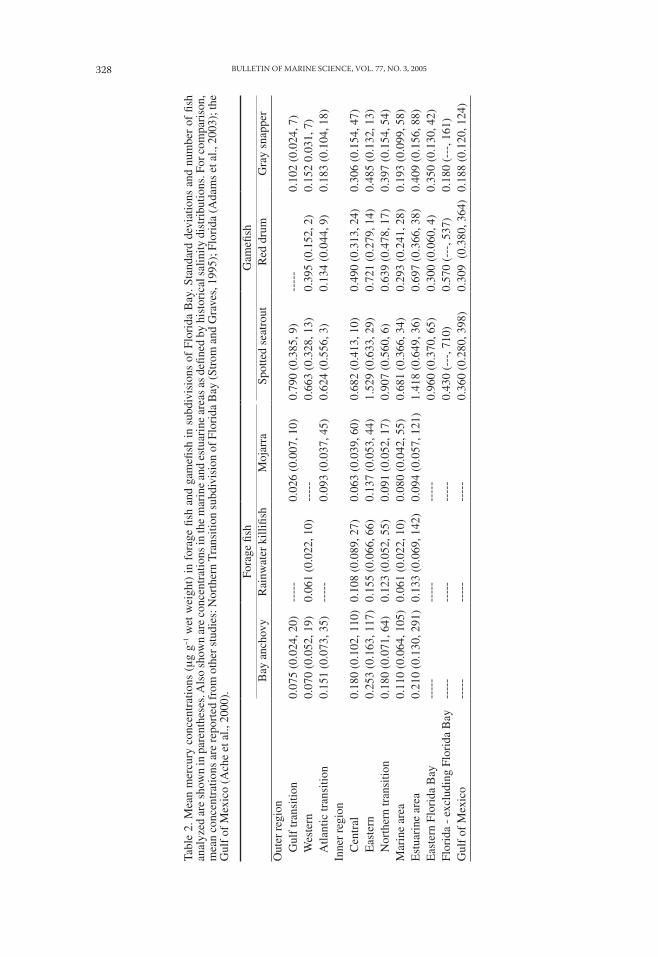
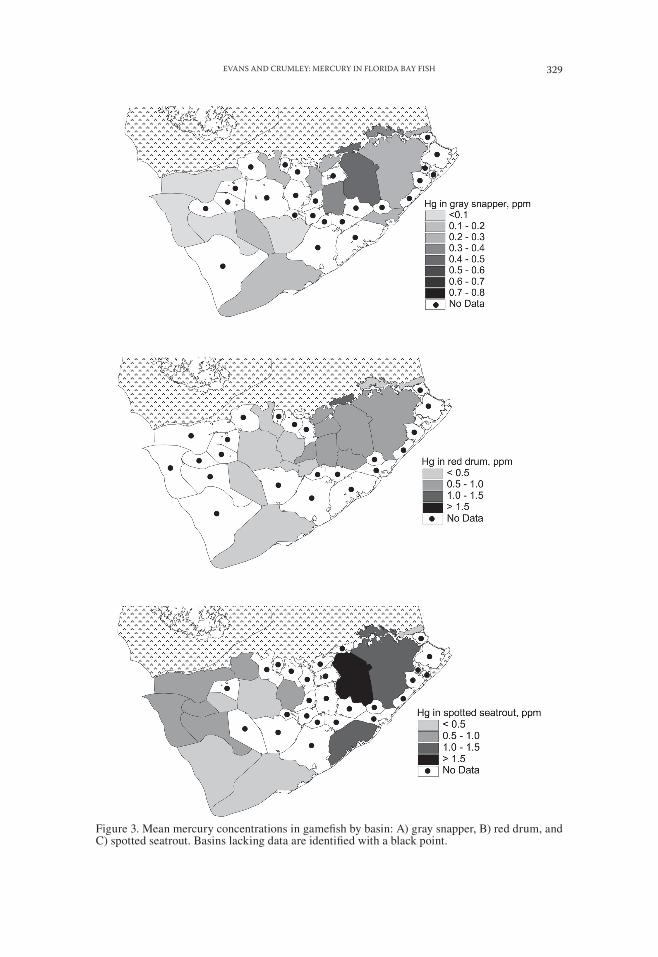
SPATIAL PATTERNS OF MERCURY CONCENTRATIONS IN FISH.—Highest mercury concentrations were observed for each of three top predators, spotted seatrout, red drum, and gray snapper in the inner basins of Florida Bay in the northern transition, eastern, and central subdivisions (Table 2, Figs. 3,4). Mercury concentrations aver-aged two to three times higher than in the outer basins of the Atlantic transition, western, and Gulf subdivisions. Eighty-nine percent of spotted seatrout from the three inner subdivisions exceeded Florida’s limited consumption advisory level of 0.5 μg g−1. Thirty percent of spotted seatrout in this region exceeded the no consumption level of 1.5 μg g−1. Mercury concentrations in red drum frequently exceeded 0.5 μg g−1 (56%), while mercury concentrations in gray snapper rarely (19%) exceeded this level (Table 2, Fig. 3).
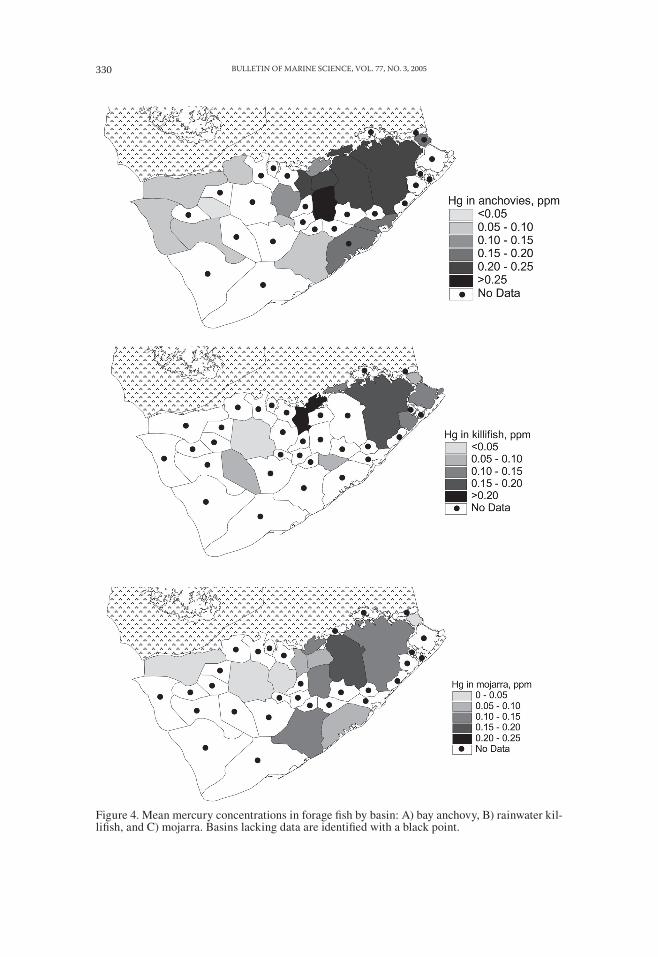
Forage fish also had higher mercury concentrations in the inner subdivisions of Florida Bay: bay anchovies exceeded 0.15 μg g−1 throughout most of the inner region, two to three times higher than in the outer subdivisions (Fig. 4). Mojarra and rain-water killifish had lower mercury concentrations than bay anchovies, but showed similar spatial patterns (Fig. 4).
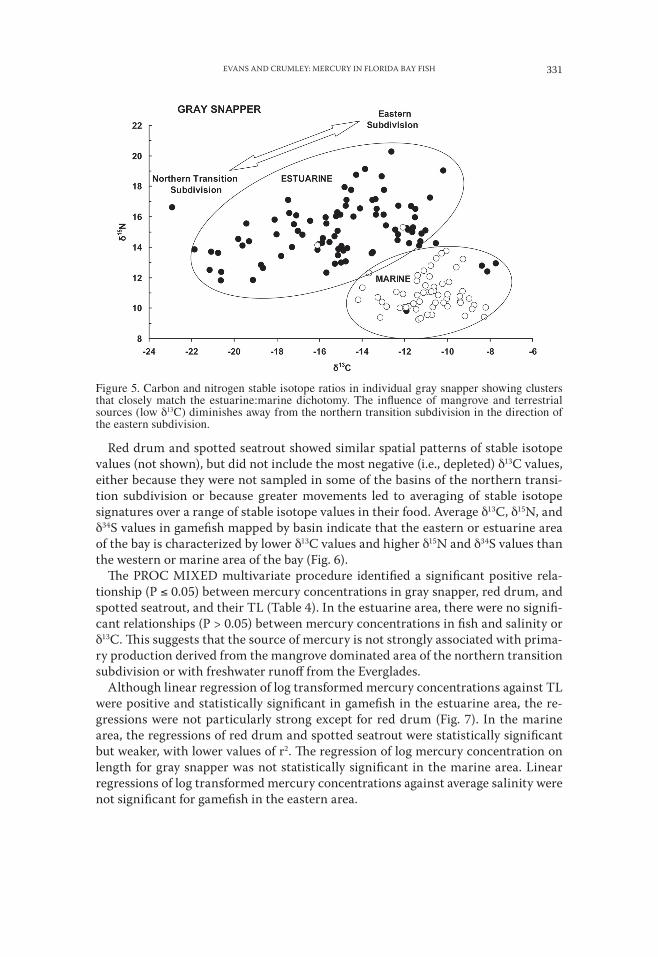
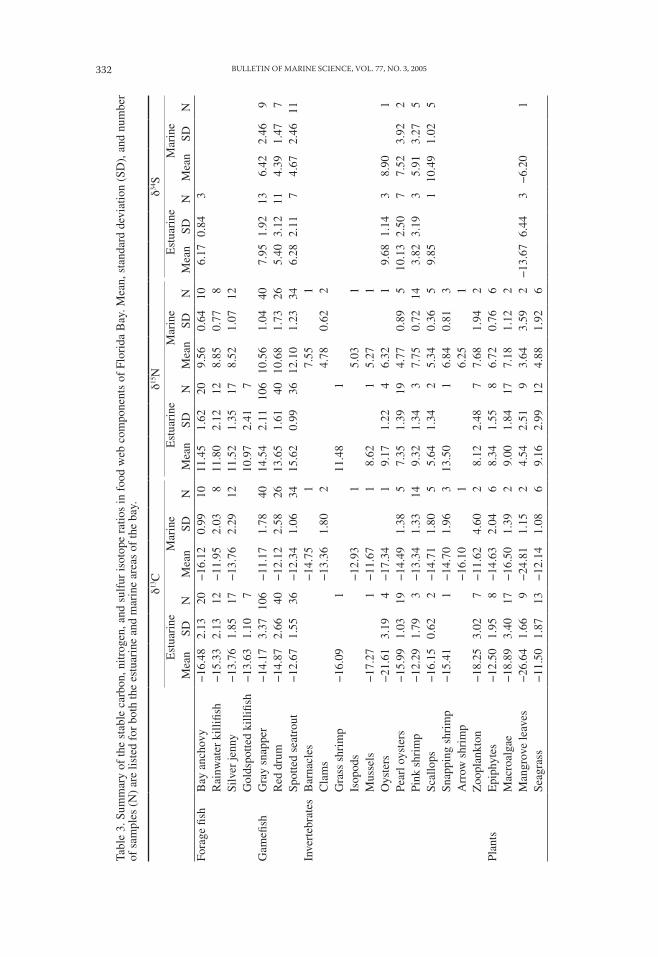
RELATIONSHIPS OF MERCURY CONCENTRATIONS TO STABLE ISOTOPES AND SA-LINITY.—Distinct spatial patterns of stable isotope ratios characterize the different regions of Florida Bay as illustrated by the distribution of carbon and nitrogen iso-tope ratios (δ13C and δ15N) of gray snapper (Fig. 5). Gray snapper represent the larg-est number and broadest spatial distribution among our sampled fish species and they showed the greatest range of δ13C and δ15N values. Gray snapper are thought to undergo only limited movements as juveniles within the bay (Starck and Schroeder, 1971), thus their mercury and stable isotope values are thought to be representative of their area of capture. Cluster analysis (SAS Institute, Inc., PROC CLUSTER, mod-el = twostage, k = 10) identified two main clusters characterizing the δ13C and δ15N signatures in gray snapper (Fig. 5). The first is a compact cluster of low δ15N values (< 12) and high δ13C values (> −14). Gray snapper in this cluster derive their nutrition from a seagrass-based food web characterized by δ13C values of −14 to −8 (Harri-gan et al., 1989; Lutz, 1997; Mumford, 1999). The second cluster is characterized by generally higher δ15N values and a range in δ13C values from −24 to −10. This range in δ13C values expresses a mixing line between mangrove or freshwater/terrestrial dependency (δ13C = −30 to −25: Chmura and Aharon, 1995; Lutz, 1997) and seagrass dependency (δ13C = −14 to −8: Zieman et al., 1984; Harrigan et al., 1989; Mumford, 1999). Intermediate δ13C values may also represent the contribution of phytoplank-ton, epiphytes, macroalgae, or benthic microalgae, which have δ13C values between those of mangroves and seagrass (Table 3). This spatial dichotomy, based on stable isotope patterns, corresponds closely to the estuarine:marine partition based on sa-linity and also distinguishes major differences in mercury concentrations in fish. Mean stable isotope signatures for fish, invertebrates, and plants sampled in Florida Bay are listed in Table 3.
BULLETIN OF MARINE SCIENCE, VOL. 77, NO. 3, 2005328
Tabl
e 2.
Mea
n m
ercu
ry c
once
ntra
tions
(μ
g g−
1 w
et w
eigh
t) i
n fo
rage
fish
and
gam
efish
in
subd
ivis
ions
of
Flor
ida
Bay
. Sta
ndar
d de
viat
ions
and
num
ber
of fi
sh
anal
yzed
are
sho
wn
in p
aren
thes
es. A
lso
show
n ar
e co
ncen
trat
ions
in th
e m
arin
e an
d es
tuar
ine
area
s as
defi
ned
by h
isto
rica
l sal
inity
dis
trib
utio
ns. F
or c
ompa
riso
n,
mea
n co
ncen
trat
ions
are
rep
orte
d fr
om o
ther
stu
dies
: Nor
ther
n T
rans
ition
sub
divi
sion
of
Flor
ida
Bay
(St
rom
and
Gra
ves,
199
5); F
lori
da (
Ada
ms
et a
l., 2
003)
; the
G
ulf
of M
exic
o (A
che
et a
l., 2
000)
.
Fora
ge fi
shG
amefi
shB
ay a
ncho
vyR
ainw
ater
kill
ifish
Moj
arra
Spot
ted
seat
rout
Red
dru
mG
ray
snap
per
Out
er r
egio
n
Gul
f tr
ansi
tion
0.07
5 (0
.024
, 20)
----
-0.
026
(0.0
07, 1
0)0.
790
(0.3
85, 9
)--
---
0.10
2 (0
.024
, 7)
W
este
rn0.
070
(0.0
52, 1
9)0.
061
(0.0
22, 1
0)--
---
0.66
3 (0
.328
, 13)
0.39
5 (0
.152
, 2)
0.15
2 0.
031,
7)
A
tlant
ic tr
ansi
tion
0.15
1 (0
.073
, 35)
----
-0.
093
(0.0
37, 4
5)
0.62
4 (0
.556
, 3)
0.13
4 (0
.044
, 9)
0.18
3 (0
.104
, 18)
Inne
r re
gion
C
entr
al0.
180
(0.1
02, 1
10)
0.10
8 (0
.089
, 27)
0.06
3 (0
.039
, 60)
0.68
2 (0
.413
, 10)
0.49
0 (0
.313
, 24)
0.30
6 (0
.154
, 47)
E
aste
rn
0.25
3 (0
.163
, 117
)0.
155
(0.0
66, 6
6)0.
137
(0.0
53, 4
4)1.
529
(0.6
33, 2
9)0.
721
(0.2
79, 1
4)0.
485
(0.1
32, 1
3)
Nor
ther
n tr
ansi
tion
0.18
0 (0
.071
, 64)
0.12
3 (0
.052
, 55)
0.09
1 (0
.052
, 17)
0.90
7 (0
.560
, 6)
0.63
9 (0
.478
, 17)
0.39
7 (0
.154
, 54)
Mar
ine
area
0.11
0 (0
.064
, 105
)0.
061
(0.0
22, 1
0)0.
080
(0.0
42, 5
5)0.
681
(0.3
66, 3
4)0.
293
(0.2
41, 2
8)0.
193
(0.0
99, 5
8)E
stua
rine
are
a0.
210
(0.1
30, 2
91)
0.13
3 (0
.069
, 142
)0.
094
(0.0
57, 1
21)
1.41
8 (0
.649
, 36)
0.69
7 (0
.366
, 38)
0.40
9 (0
.156
, 88)
Eas
tern
Flo
rida
Bay
--
---
----
---
---
0.96
0 (0
.370
, 65)
0.30
0 (0
.060
, 4)
0.35
0 (0
.130
, 42)
Flor
ida
- ex
clud
ing
Flor
ida
Bay
----
---
---
----
-0.
430
(---
, 710
)0.
570
(---
, 537
)0.
180
(---
, 161
)G
ulf
of M
exic
o--
---
----
---
---
0.36
0 (0
.280
, 398
)0.
309
(0.
380,
364
)0.
188
(0.1
20, 1
24)
EVANS AND CRUMLEY: MERCURY IN FLORIDA BAY FISH 329
Figure 3. Mean mercury concentrations in gamefish by basin: A) gray snapper, B) red drum, and C) spotted seatrout. Basins lacking data are identified with a black point.
BULLETIN OF MARINE SCIENCE, VOL. 77, NO. 3, 2005330
Figure 4. Mean mercury concentrations in forage fish by basin: A) bay anchovy, B) rainwater kil-lifish, and C) mojarra. Basins lacking data are identified with a black point.
EVANS AND CRUMLEY: MERCURY IN FLORIDA BAY FISH 331
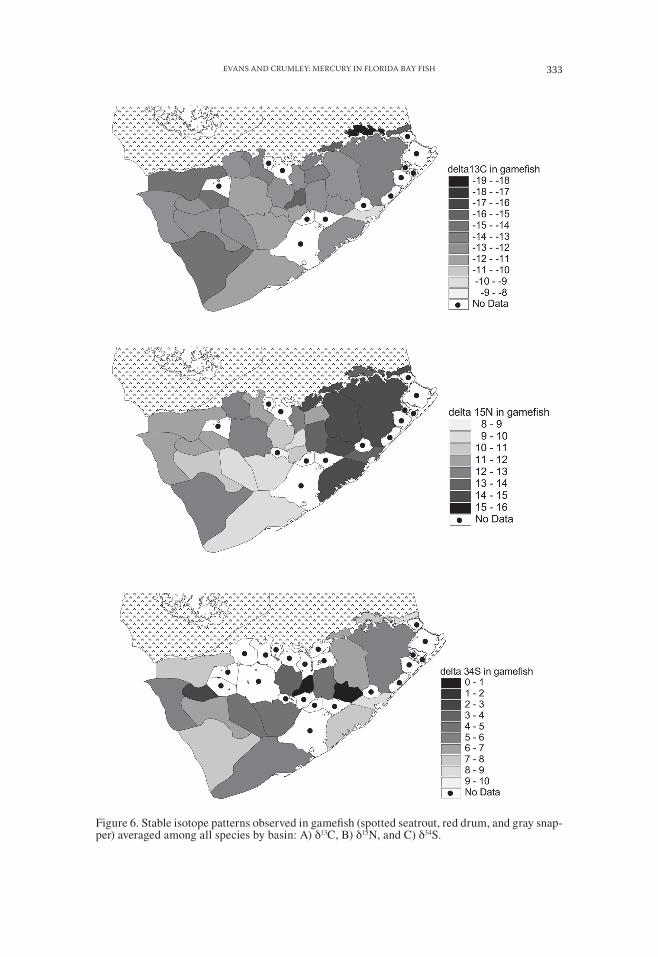
Red drum and spotted seatrout showed similar spatial patterns of stable isotope values (not shown), but did not include the most negative (i.e., depleted) δ13C values, either because they were not sampled in some of the basins of the northern transi-tion subdivision or because greater movements led to averaging of stable isotope signatures over a range of stable isotope values in their food. Average δ13C, δ15N, and δ34S values in gamefish mapped by basin indicate that the eastern or estuarine area of the bay is characterized by lower δ13C values and higher δ15N and δ34S values than the western or marine area of the bay (Fig. 6).
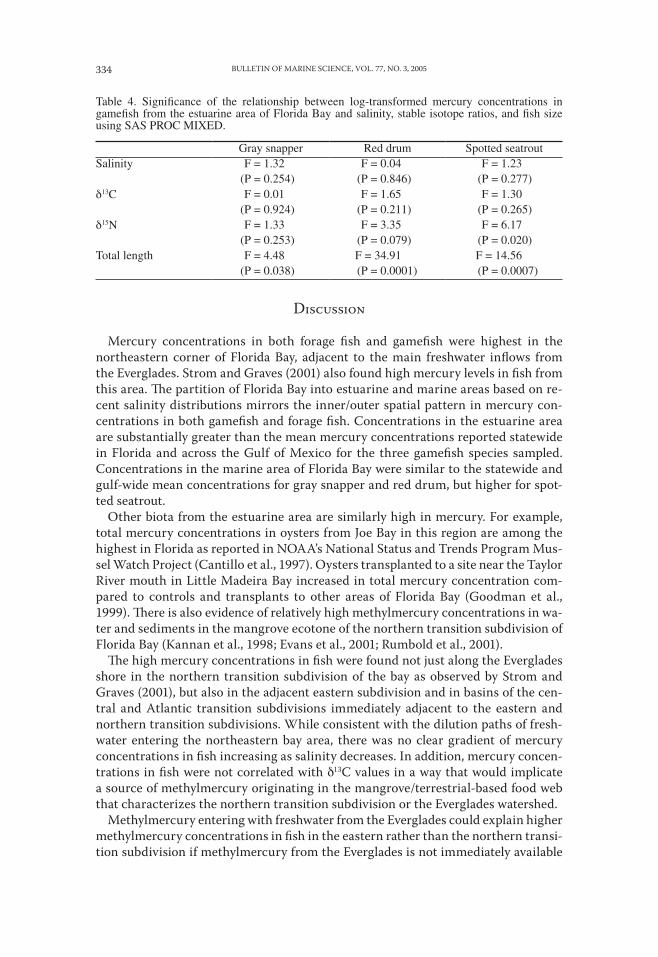
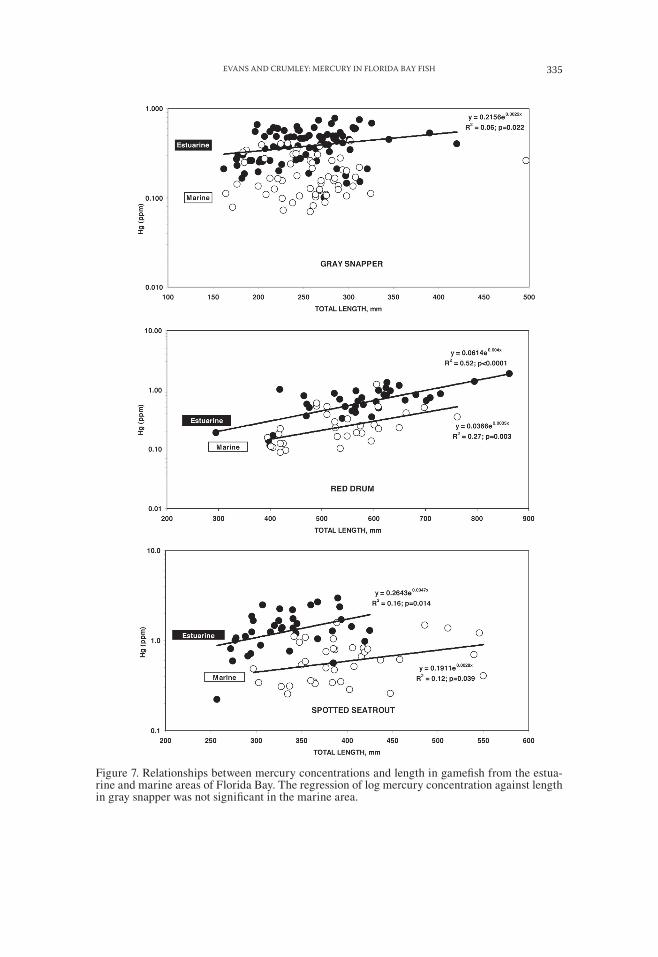
The PROC MIXED multivariate procedure identified a significant positive rela-tionship (P ≤ 0.05) between mercury concentrations in gray snapper, red drum, and spotted seatrout, and their TL (Table 4). In the estuarine area, there were no signifi-cant relationships (P > 0.05) between mercury concentrations in fish and salinity or δ13C. This suggests that the source of mercury is not strongly associated with prima-ry production derived from the mangrove dominated area of the northern transition subdivision or with freshwater runoff from the Everglades.
Although linear regression of log transformed mercury concentrations against TL were positive and statistically significant in gamefish in the estuarine area, the re-gressions were not particularly strong except for red drum (Fig. 7). In the marine area, the regressions of red drum and spotted seatrout were statistically significant but weaker, with lower values of r2. The regression of log mercury concentration on length for gray snapper was not statistically significant in the marine area. Linear regressions of log transformed mercury concentrations against average salinity were not significant for gamefish in the eastern area.
Figure 5. Carbon and nitrogen stable isotope ratios in individual gray snapper showing clusters that closely match the estuarine:marine dichotomy. The influence of mangrove and terrestrial sources (low δ13C) diminishes away from the northern transition subdivision in the direction of the eastern subdivision.
BULLETIN OF MARINE SCIENCE, VOL. 77, NO. 3, 2005332
Tabl
e 3.
Sum
mar
y of
the
stab
le c
arbo
n, n
itrog
en, a
nd s
ulfu
r is
otop
e ra
tios
in f
ood
web
com
pone
nts
of F
lori
da B
ay. M
ean,
sta
ndar
d de
viat
ion
(SD
), a
nd n
umbe
r of
sam
ples
(N
) ar
e lis
ted
for
both
the
estu
arin
e an
d m
arin
e ar
eas
of th
e ba
y.
δ13C
δ15N
δ34S
Est
uari
neM
arin
eE
stua
rine
Mar
ine
Est
uari
neM
arin
eM
ean
SDN
Mea
nSD
NM
ean
SDN
Mea
nSD
NM
ean
SDN
Mea
nSD
NFo
rage
fish
Bay
anc
hovy
−16
.48
2.13
20−
16.1
20.
9910
11.4
51.
6220
9.56
0.64
106.
170.
843
Rai
nwat
er k
illifi
sh−
15.3
32.
1312
−11
.95
2.03
811
.80
2.12
128.
850.
778
Silv
er je
nny
−13
.76
1.85
17−
13.7
62.
2912
11.5
21.
3517
8.52
1.07
12G
olds
potte
d ki
llifis
h−
13.6
31.
107
10.9
72.
417
Gam
efish
Gra
y sn
appe
r−
14.1
73.
3710
6−
11.1
71.
7840
14.5
42.
1110
610
.56
1.04
407.
951.
9213
6.42
2.46
9R
ed d
rum
−14
.87
2.66
40−
12.1
22.
5826
13.6
51.
6140
10.6
81.
7326
5.40
3.12
114.
391.
477
Spot
ted
seat
rout
−12
.67
1.55
36−
12.3
41.
0634
15.6
20.
9936
12.1
01.
2334
6.28
2.11
74.
672.
4611
Inve
rteb
rate
sB
arna
cles
−14
.75
17.
551
Cla
ms
−13
.36
1.80
24.
780.
622
Gra
ss s
hrim
p−
16.0
91
11.4
81
Isop
ods
−12
.93
15.
031
Mus
sels
−17
.27
1−
11.6
71
8.62
15.
271
Oys
ters
−21
.61
3.19
4−
17.3
41
9.17
1.22
46.
321
9.68
1.14
38.
901
Pear
l oys
ters
−15
.99
1.03
19−
14.4
91.
385
7.35
1.39
194.
770.
895
10.1
32.
507
7.52
3.92
2Pi
nk s
hrim
p−
12.2
91.
793
−13
.34
1.33
149.
321.
343
7.75
0.72
143.
823.
193
5.91
3.27
5Sc
allo
ps−
16.1
50.
622
−14
.71
1.80
55.
641.
342
5.34
0.36
59.
851
10.4
91.
025
Snap
ping
shr
imp
−15
.41
1−
14.7
01.
963
13.5
01
6.84
0.81
3A
rrow
shr
imp
−16
.10
16.
251
Zoo
plan
kton
−18
.25
3.02
7−
11.6
24.
602
8.12
2.48
77.
681.
942
Plan
tsE
piph
ytes
−12
.50
1.95
8−
14.6
32.
046
8.34
1.55
86.
720.
766
Mac
roal
gae
−18
.89
3.40
17−
16.5
01.
392
9.00
1.84
177.
181.
122
Man
grov
e le
aves
−26
.64
1.66
9−
24.8
11.
152
4.54
2.51
93.
643.
592
−13
.67
6.44
3−
6.20
1Se
agra
ss−
11.5
01.
8713
−12
.14
1.08
69.
162.
9912
4.88
1.92
6
EVANS AND CRUMLEY: MERCURY IN FLORIDA BAY FISH 333
Figure 6. Stable isotope patterns observed in gamefish (spotted seatrout, red drum, and gray snap-per) averaged among all species by basin: A) δ13C, B) δ15N, and C) δ34S.
BULLETIN OF MARINE SCIENCE, VOL. 77, NO. 3, 2005334
DISCUSSION
Mercury concentrations in both forage fish and gamefish were highest in the northeastern corner of Florida Bay, adjacent to the main freshwater inflows from the Everglades. Strom and Graves (2001) also found high mercury levels in fish from this area. The partition of Florida Bay into estuarine and marine areas based on re-cent salinity distributions mirrors the inner/outer spatial pattern in mercury con-centrations in both gamefish and forage fish. Concentrations in the estuarine area are substantially greater than the mean mercury concentrations reported statewide in Florida and across the Gulf of Mexico for the three gamefish species sampled. Concentrations in the marine area of Florida Bay were similar to the statewide and gulf-wide mean concentrations for gray snapper and red drum, but higher for spot-ted seatrout.
Other biota from the estuarine area are similarly high in mercury. For example, total mercury concentrations in oysters from Joe Bay in this region are among the highest in Florida as reported in NOAA’s National Status and Trends Program Mus-sel Watch Project (Cantillo et al., 1997). Oysters transplanted to a site near the Taylor River mouth in Little Madeira Bay increased in total mercury concentration com-pared to controls and transplants to other areas of Florida Bay (Goodman et al., 1999). There is also evidence of relatively high methylmercury concentrations in wa-ter and sediments in the mangrove ecotone of the northern transition subdivision of Florida Bay (Kannan et al., 1998; Evans et al., 2001; Rumbold et al., 2001).
The high mercury concentrations in fish were found not just along the Everglades shore in the northern transition subdivision of the bay as observed by Strom and Graves (2001), but also in the adjacent eastern subdivision and in basins of the cen-tral and Atlantic transition subdivisions immediately adjacent to the eastern and northern transition subdivisions. While consistent with the dilution paths of fresh-water entering the northeastern bay area, there was no clear gradient of mercury concentrations in fish increasing as salinity decreases. In addition, mercury concen-trations in fish were not correlated with δ13C values in a way that would implicate a source of methylmercury originating in the mangrove/terrestrial-based food web that characterizes the northern transition subdivision or the Everglades watershed.
Methylmercury entering with freshwater from the Everglades could explain higher methylmercury concentrations in fish in the eastern rather than the northern transi-tion subdivision if methylmercury from the Everglades is not immediately available
Table 4. Significance of the relationship between log-transformed mercury concentrations in gamefish from the estuarine area of Florida Bay and salinity, stable isotope ratios, and fish size using SAS PROC MIXED.
Gray snapper Red drum Spotted seatroutSalinity F = 1.32 F = 0.04 F = 1.23
(P = 0.254) (P = 0.846) (P = 0.277)δ13C F = 0.01 F = 1.65 F = 1.30
(P = 0.924) (P = 0.211) (P = 0.265)δ15N F = 1.33 F = 3.35 F = 6.17
(P = 0.253) (P = 0.079) (P = 0.020)Total length F = 4.48 F = 34.91 F = 14.56
(P = 0.038) (P = 0.0001) (P = 0.0007)
EVANS AND CRUMLEY: MERCURY IN FLORIDA BAY FISH 335
Figure 7. Relationships between mercury concentrations and length in gamefish from the estua-rine and marine areas of Florida Bay. The regression of log mercury concentration against length in gray snapper was not significant in the marine area.
BULLETIN OF MARINE SCIENCE, VOL. 77, NO. 3, 2005336
for entry into the food web. Binding of methylmercury with the abundant humic substances in Everglades’ water could limit its availability to biota (Hudson et al., 1994; Cai et al., 1999; O’Driscoll and Evans, 2000), a process that might be partially reversed by dilution and competitive displacement by the abundant divalent cations in more marine waters. Potentially more important is the effect of increased chlo-ride ion concentrations in bay waters, which would shift the dominant complexation of methylmercury from methylmercuric hydroxide in freshwater to methylmercuric chloride in Florida Bay. This would lead to a large increase in availability for uptake by phytoplankton or other primary producers thought to be the sites of entry into the food web (Hudson et al., 1994). Methylmercuric chloride has an octanol-water parti-tion coefficient (which serves as a measure of hydrophobic partitioning into phyto-plankton) that is 23 times that of methylmercuric hydroxide (Mason et al., 1996). In addition, if methylmercury is bound to sulfides in Everglades drainage waters, sulfide oxidation in the turbid, wind-mixed eastern bay could also release methylmercury for bioaccumulation. Thus, methylmercury carried into Florida Bay from a fresh-water source might be at lower concentration upon dilution, but have much greater potential for accumulation in primary producers, leading to higher concentrations at the top of the food web. We have no direct evidence of this enhanced bioavailability as yet.
The alternative to an Everglades’ freshwater source of methylmercury in Florida Bay fish is the in situ production of methylmercury within the bay, especially in the northeastern corner. There are conditions in this region that suggest such a possi-bility. These conditions include atmospheric sources of inorganic mercury, limited dilution and binding of inorganic mercury, abundant sulfate and limited sulfide to promote inorganic mercury methylation, and stable carbon, nitrogen, and carbon isotopic indicators of the source of these elements and mercury to the food web.
Recent work (D. Rumbold, South Florida Water Management District, pers. comm.) suggests that the atmosphere provides most of the inorganic mercury in-put into eastern Florida Bay. Because the eastern bay has a shallower water column and a thinner sediment layer (Fourqurean and Robblee, 1999) in which atmospheric or watershed-derived mercury can be diluted, inorganic mercury is likely to attain higher concentrations in eastern Florida Bay than in the western bay. In addition, sediments in the eastern bay are calcareous with lower organic carbon content (Lutz, 1997) than sediments in the western bay. This should lead to reduced mercury bind-ing to particles and enhanced availability for methylation (King et al., 1999; Mason and Lawrence, 1999).
Sulfate is abundant in Florida Bay water (Ku et al., 1999), which is conducive to mercury methylation by sulfate reducing bacteria (Gilmour and Henry, 1991). In the eastern bay, sulfide concentrations are relatively low (compare Ku et al., 1999 to Carlson et al., 1994 and Carlson et al., 2002), and sulfide levels may be inadequate to inhibit the availability of inorganic mercury for methylation as postulated by Benoit et al. (1999). There is also evidence of enhanced iron binding of sulfide in sediments from northeastern Florida Bay (Chambers et al., 2001), which could further limit the sulfide inhibition of mercury methylation. Ku et al. (1999) suggested that a cycle of sulfate reduction and sulfide reoxidation operates in eastern Florida Bay’s carbonate sediments, which limits the buildup of porewater sulfide concentrations.
The stable sulfur isotope values in gamefish that we measured indicate a source of sulfur intermediate between the oxidized environment of the water column and
EVANS AND CRUMLEY: MERCURY IN FLORIDA BAY FISH 337
the reducing environment of subsurface sediments. Stable sulfur isotope signatures (δ34S) in gamefish and other consumers in Florida Bay are less than the δ34S = 20 of water column sulfate (Ku et al., 1999) that would be indicative of a purely pelagic source, but substantially greater than the δ34S = −16 to −6 we have observed in man-grove leaves or the δ34S = –10.5 to +1.8 in seagrass reported by Fry et al. (1987). Nega-tive δ34S values are indicative of sulfate reduction in sediments and the accumulation of the produced sulfide by rooted plants (Fry et al., 1982). Gamefish in the estuarine area of Florida Bay have more positive δ34S signatures than those in the more marine central and western subdivisions where seagrass is densest. For eastern Florida Bay, this suggests either greater dependence on pelagic foods or less intense sulfate reduc-tion in the sediments, or both.
Stable nitrogen isotopic evidence also indicates that the eastern bay is a region of redox cycling driven by microbial activity in the sediments, where the suboxic zone is near the interface with overlying water. Here both methylmercury produced by sulfate reduction and the products of denitrification could readily diffuse through the aerobic sediment surface layer to become available to the food web of epibenthic biota.
The eastern bay is the area of highest δ15N values in gamefish and in other com-ponents of the food web. Corbett et al. (1999) hypothesized active denitrification in the suboxic sediments of eastern Florida Bay based on elevated δ15N values observed in seagrasses of this area. Cornwell et al. (2001) reported denitrification in eastern bay sediments. Gasc and Szmant (1999) found the area of northeastern Florida Bay to be an area of minimum sediment nitrogen content and high seasonal variation in dissolved inorganic nitrogen, suggesting active nitrogen remineralization in sedi-ments. Orem et al. (1999) also found evidence of nitrogen remineralization in the sediments supplying nutrients to benthic algae in the eastern bay. This was in agree-ment with stable carbon and nitrogen isotope signatures in sediments, which they thought reflected a greater dependency on microalgal productivity than on seagrass productivity. It is known that sulfide (produced by sulfate reducing bacteria) inhibits the nitrification-denitrification cycle (Joye and Hollibaugh, 1995). An active nitri-fication-denitrification cycle also suggests that high levels of sulfide are not widely distributed in the eastern bay.
Our observation of enriched δ15N values and only moderately depleted δ34S lev-els in the estuarine area of Florida Bay is consistent with this process and further supports the idea of a microbially active sediment interface poised near the sub-oxic redox boundary where mercury methylation is thought to be most pronounced (Langer et al., 2001; Ullrich et al., 2001). Under field conditions, Gill et al. (1999) ob-served a diurnal cycle of methylmercury production in the sediments of Lavaca Bay, Texas, which was thought to be linked to photosynthetically-driven redox processes. Recent observations have now identified significant mercury methylation in surface sediments of eastern Florida Bay, with highest potential rates located at the top 1 cm layer adjacent to the overlying water (D. Rumbold, South Florida Water Management District, pers. comm.).
Stable carbon isotope values (δ13C) provide some constraints on the food webs sup-porting gamefish and other biota in Florida Bay. These food webs do not seem to be dominated by mangroves, seagrass, or phytoplankton as sole sources of primary pro-duction. Only in the northern transition subdivision do mangroves appear to have a strong influence on the food web of gamefish. δ13C values of gray snapper in man-
BULLETIN OF MARINE SCIENCE, VOL. 77, NO. 3, 2005338
grove-fringed Joe Bay, Little Madeira Bay, and Long Sound are often more negative than −16. These values are indicative of at least partial dependence on mangrove car-bon (δ13C = -26.64 ± 1.66) or terrestrial sawgrass (Cladium jamaicense Crantz) (δ13C = −26.2; Chmura and Aharon, 1995) in the supporting food web. This dependence on mangrove or terrestrial carbon declines in fish captured at greater distances from the mangrove ecotone of the northern transition subdivision.
In the estuarine area of Florida Bay, δ13C values in seagrass were too positive to completely support the food web of gamefish. Most fish had δ13C values (−12.67 to −14.87) that were substantially more negative than that of seagrass (δ13C = -11.50 ± 1.66) or their epiphytes δ13C = −12.50 ± 1.95). A food web based solely on phytoplank-ton is unlikely as well since filter feeders in the estuarine area had δ13C values (−15.99 to −21.61) that are all more negative than those measured in gamefish. Macroalgae also probably do not contribute significantly to the food web of gamefish since their observed carbon isotope signatures (δ13C = −18.89 ± 3.40) were, on average, more negative than those inferred for phytoplankton.
The observed δ13C values of gamefish in the eastern bay may represent carbon supplied from a mixture of seagrass and phytoplankton sources. We suggest, how-ever, that benthic microalgae may also contribute significantly to the food web of gamefish, although we have not determined their isotopic composition in Florida Bay. The literature reports δ13C values for benthic microalgae that are, on average, more positive than phytoplankton from the same habitat (Currin et al., 1995; France, 1995). This would put the δ13C values of benthic microalgae in the observed range of gamefish in the eastern bay. Benthic microalgae are reported to have δ13C and δ34S values intermediate between phytoplankton and seagrass (Stribling and Cornwell, 1997; Herman et al., 2000; Moncreiff and Sullivan, 2001), consistent with the values we observe in gamefish. The importance of benthic microalgae as contributors to the food webs of shallow waters has been increasingly documented (France, 1995; Miller et al., 1996; Middleburg et al., 2000). Benthic microalgae are reported to be a larger reservoir of chlorophyll in eastern Florida Bay than are phytoplankton (Brand, 2000). Resident at the sediment:water interface, benthic microalgae are positioned to accumulate methylmercury produced in the near surface sediments where methyl-mercury is expected to be in highest concentration (Bloom et al., 1999).
Grazers on benthic microalgae, or alternatively on the bacterial flora of fresh de-tritus would become the next step transferring both stable isotopes of C, N, and S as well as methylmercury to higher trophic levels. Such grazers might include micro-fauna and meiofauna as well as many detritivorous macrofauna such as amphipods, polychaetes, gastropods, and crustaceans. Predators on these grazers, such as pink shrimp and benthic feeding fish such as mojarra, could be the next link in trophic transfers of mercury and stable C, N, and S isotopes to gamefish. Pink shrimp (F. du-orarum) consume benthic microalgae and detritus (Stoner and Zimmerman, 1988; Schwamborn and Criales, 2000) and are predators on small benthic fauna includ-ing amphipods, polychaetes, harpacticoid copepods, and caridean shrimp. They are reported to be the most important prey of gray snapper, spotted seatrout, and red drum in Florida Bay (Rutherford et al., 1983; Thayer et al., 1987; Hettler, 1989; Koenig et al., 2001). Pink shrimp are not abundant in the eastern bay, however, and the pre-sumptive benthic microalgal food web may pass through other benthic-feeding in-termediaries (Costello et al., 1986; Allyn Powell, NOAA National Centers for Coastal
EVANS AND CRUMLEY: MERCURY IN FLORIDA BAY FISH 339
Ocean Science (NCCOS) Center for Fisheries and Habitat Research, Beaufort, North Carolina, pers. comm.).
Other food web and ecological characteristics may also be critical in determining mercury bioaccumulation in Florida Bay. Oligotrophy in the eastern bay, including lower seagrass, epiphyte, phytoplankton, and bacterial abundance should allow entry of methylmercury into the base of the food web with less dilution by newly produced biomass, hence greater mercury concentrations. Such patterns have been observed in freshwater lakes (Kidd et al., 1999). There may also be more intermediate trophic steps in the food web between primary producers and gamefish in eastern Florida Bay. Based on the difference in δ15N values between species, Mumford (1999) hy-pothesized that the food web leading from the seagrass, Thalassia testudinum Banks ex König, to the oyster toadfish (Opsanus beta Goode and Bean, 1879) contained more trophic transfer steps in eastern than in western Florida Bay.
Among the basins of the northern transition subdivision where freshwater from the Everglades first enters, highest mercury concentrations in fish were found in Little Madeira Bay, which draws much of its freshwater from Taylor River Slough. Somewhat lower concentrations were observed in Joe Bay, which receives freshwater from C-111 canal and Taylor River Slough and provides the majority of the Ever-glades freshwater flow to Florida Bay (Hittle et al., 2001). Long Sound, still farther east, draws most of its freshwater from C-111 canal and has even lower mercury con-centrations in fish. This suggests that the Taylor Slough watershed may be a more im-portant source of methylmercury to fish or that there are processes related to habitat differences in these basins, which contribute to differing mercury bioaccumulation. Alternatively, the more open connection of Little Madeira Bay to eastern Florida Bay may permit importation into Little Madeira Bay of methylmercury produced within the adjacent northeastern Florida Bay. It further suggests that, in contrast to the hypothesis of Strom and Graves (2001), high mercury concentrations in Florida Bay fish are not due to a local urban source. Among the Northern Transition basins, Long Sound and Joe Bay are most likely to receive urban or agricultural runoff via C-111 canal, which drains the area immediately west of Miami (Goodman et al., 1999; Hittle et al., 2001; Scott et al., 2002). Similarly, it is unlikely that atmospheric transport from urban sources could explain this pattern either. Atmospheric deposi-tion of mercury in southern Florida is relatively uniform (Guentzel et al., 2001). Kang et al. (2000) reported that sediment in the area of Little Madeira Bay and Joe Bay contained more mercury than could be explained by atmospheric deposition alone. They attributed this surplus to runoff from the Everglades. We agree with Guentzel et al.’s (2001) conclusion that geographical variation in aquatic and terrestrial cycling processes is the more likely cause of “hot spots” in fish Hg concentrations in the Ev-erglades region than are atmospheric or other source strength variations.
In summary, direct importation of methylmercury from the Everglades watershed seems less important than in situ methylmercury production within eastern Florida Bay as a source of methylmercury to fish. Quantifying the relative fluxes between external and internal sources will be critical to predicting the impact of enhanced freshwater flows into Florida Bay during planned Everglades restoration. Quantifica-tion will depend on more detailed monitoring of mercury (especially methylmercury) in water and sediments along the freshwater flow paths into Florida Bay, habitat-spe-cific measurements of mercury methylation rates in these areas, and a better under-
BULLETIN OF MARINE SCIENCE, VOL. 77, NO. 3, 2005340
standing of methylmercury uptake into primary producers and subsequent transfers through the food web to apex predators.
To be useful to managers of the Comprehensive Everglades Restoration Program, the information acquired by these studies will need to be integrated into a model that predicts changes in mercury concentrations in gamefish in response to the altera-tions implemented in the Everglades restoration. Such a model will need to link our understanding of food web methylmercury transfers with methylmercury produc-tion and importation as they respond to hydrologic alterations and other manage-ment actions. In addition, monitoring of mercury in gamefish should continue in order to track the actual response of methylmercury concentrations to implementa-tion of management decisions. This will also provide a test of the predictive model. Monitoring should expand beyond that carried out in Florida Bay to other coastal areas in the Everglades watershed where the impacts of restoration will also be expe-rienced under new hydrologic regimes.
ACKNOWLEDGMENTS
We would like to thank the many people who aided in providing biota samples for analysis: J. Colvocoresses, Florida Marine Research Institute; J. C. Humphrey, Keys Marine Laboratory-Florida Institute of Oceanography; R. Brock and L. Given, Everglades National Park; M. Lac-roix, M, Johnson, M. Greene, D. Peters, A. Powell, and R. Cheshire, NOAA Center for Coastal Fisheries and Habitat Research. Some salinity data were provided by the SERC-FIU Water Quality Monitoring Network which is supported by SFWMD/SERC Cooperative Agreements #C-10244 and #C-13178 as well as EPA Agreement #X994621-94-0. We would also like to ac-knowledge funding support from NOAA Coastal Ocean Program’s South Florida Ecosystem Restoration Prediction and Modeling Program and National Marine Fisheries Service, South-east Fisheries Science Center’s South Florida Living Marine Resources Program.
LITERATURE CITED
Ache, B. W., J. D. Boyle, and C. E. Morse. 2000. A survey of the occurrence of mercury in the fishery resources of the Gulf of Mexico. Prepared by Battelle for the U.S. EPA Gulf of Mexico Program, Stennis Space Center, Mississippi. 71 p.
Adams, D. H., R. H. McMichael, Jr., and G. E. Henderson. 2003. Mercury levels in marine and estuarine fishes of Florida 1989-2001. Tech. Rep. TR-9, 2nd Ed. revised. Florida Marine Re-search Institute, St. Petersburg. 57 p.
Atkeson, T. and P. Parks. 2001. The Everglades mercury problem. Everglades Consolidated Re-port. South Florida Water Management District, West Palm Beach. 41 p.
Atwell, L., K. A. Hobson, and H. E. Welch. 1998. Biomagnification and bioaccumulation of mercury in an arctic marine food web: Insights from stable isotope analysis. Can. J. Fish. Aquat. Sci. 55: 1114–1121.
Benoit, J. M., R. P. Mason, and C. C. Gilmour. 1999. Estimation of mercury-sulfide speciation in sediment porewaters using octanol-water partitioning and implications for availability to methylating bacteria. Environ. Toxicol. Chem. 18: 2138–2141.
Bloom, N. S., G. A. Gill, S. Capelan, C. Dobbs, L. McShea, C. Driscoll, R. Mason, and J. Rudd. 1999. Speciation and cycling of mercury in Lavaca Bay, Texas, sediments. Environ. Sci. Technol. 33: 7–13.
Bosley, K. L. and S. C. Wainright. 1999. Effects of preservatives and acidification on the stable isotope ratios (15N:14N, 13C:12C) of two species of marine animals. Can. J. Fish. Aquat. Sci. 56: 2181–2185.
EVANS AND CRUMLEY: MERCURY IN FLORIDA BAY FISH 341
Boyer, J. N., J. W. Fourqurean, and R. D. Jones. 1997. Spatial characterization of water quality in Florida Bay and Whitewater Bay by multivariate analyses: zones of similar influence. Estuaries 20: 743–758.
Brand, L. 2000. Pools and fluxes of nutrients in Florida Bay sediments and biological and chem-ical barriers to flux at the sediment-water interface. Final report submitted to the South Florida Ecosystem Restoration, Prediction, and Model Program. Available: http://www.aoml.noaa.gov/ocd/sferpm/szmant/szmantcover.html. Last accessed, September 21, 2005.
Cai, Y., R. Jaffe, and R. D. Jones. 1999. Interactions between dissolved organic carbon and mer-cury species in surface waters of the Florida Everglades. Appl. Geochem. 14: 395–407.
Cantillo, A. Y., G. G. Lauenstein, and T. P. O’Connor. 1997. Mollusc and sediment contamina-tion levels and trends in south Florida waters. Mar. Poll. Bull. 34: 511–521.
Carlson, P. R., Jr., L. A. Yarbro, and T. R. Barber. 1994. Relationship of sediment sulfide to mor-tality of Thalassia testudinum in Florida Bay. Bull. Mar. Sci. 54: 733–746.
______________, ___________, B. J. Peterson, A. Ketron, H. Arnold, and K. A. Madley. 2002. The influence of sediment sulfide on the structure of south Florida seagrass communities. Pages 215–227 in H. S. Greening, ed. Seagrass management: it’s not just nutrients! Tampa Bay Estuary Program, St. Petersburg.
Carr. W. E. S. and C. A. Adams. 1973. Food habits of juvenile marine fishes occupying seagrass beds near Crystal River, Florida. Trans. Amer. Fish. Soc. 102: 511–540.
Chambers, R. M., J. W. Fourqurean, S. A. Macko, and R. Hoppenot. 2001. Biogeochemical ef-fects of iron availability on primary producers in a shallow marine carbonate environment. Limnol. Oceanogr. 46: 1278–1286.
Chmura, G. L. and P. Aharon. 1995. Stable isotope signatures of sedimentary carbon in coastal wetlands as indicators of salinity regime. J. Coast. Res. 11: 124–135.
Corbett, D. R., J. Chanton, W. Burnett, K. Dillon, C. Rutkowski, and J. W. Fourqurean. 1999. Patterns of groundwater discharge into Florida Bay. Limnol. Oceanogr. 44: 1045–1055.
Cornwell, J. C., M. S. Owens, and W. M. Kemp. 2001. Nitrogen cycling in Florida Bay mangrove environments: sediment-water exchange and denitrification. Florida Bay Science Confer-ence, Key Largo. 75–76 p.
Cosby, B. J., W. K. Nuttle, and J. W. Fourqurean. 1999. FATHOM: flux accounting and tidal hydrology on the ocean margin- model description and initial application to Florida Bay, project completion report. National Park Service, U.S. Dept. of Interior, Washington, D.C. 106 p.
Costello, T. J., D. M. Allen, and H. Hudson. 1986. Distribution, seasonal abundance, and ecol-ogy of juvenile northern pink shrimp, Penaeus duorarum, in the Florida Bay area. NOAA Tech. Memo. NMFS-SEFC-161. 83 p.
Croker, R. A. 1960. A contribution to the life history of the gray (mangrove) snapper, Lutjanus griseus (Linnaeus). M.S. Thesis, University of Miami, Miami. 93p.
Currin, C. A., S. Y. Newell, and H. W. Paerl. 1995. The role of standing dead Spartina alterni-flora and benthic microalgae in salt marsh food webs: considerations based on multiple stable isotope analysis. Mar. Ecol. Prog. Ser. 121: 99–116.
Eisler, R. 1981. Trace metal concentrations in marine organisms. Pergamon Press, New York. 687 p.
Evans, D. W., P. H. Crumley, D. Rumbold, S. Niemczyck, and K. Laine. 2001. Linking Everglades restoration and enhanced freshwater flows to elevated concentrations of mercury in Florida Bay fish. Florida Bay Science Conference, Key Largo. 181–182 p.
Fourqurean, J. W. and M. B. Robblee. 1999. Florida Bay: a history of recent ecological changes. Estuaries 22: 345–357.
France, R. L. 1995. Carbon-13 enrichment in benthic compared to planktonic algae: foodweb implications. Mar. Prog. Ecol. Ser. 124: 307–312.
Frankovich, T. A. and J. W. Fourqurean. 1997. Seagrass epiphyte loads along a nutrient avail-ability gradient, Florida Bay, USA. Mar. Ecol. Prog. Ser. 159: 37–50.
BULLETIN OF MARINE SCIENCE, VOL. 77, NO. 3, 2005342
Fry, B., R. S. Scalan, J. K. Winters, and P. L. Parker. 1982. Sulfur uptake by salt grasses, mangroves, and seagrasses in anaerobic sediments. Geochim. Cosmochim. Acta 46: 1121–1124.
______, S. A. Macko, and J. Zieman. 1987. Review of stable isotopic investigations of food webs in seagrass meadows. Proc. Symp. Subtropical-Tropical Seagrasses of the Southeast-ern United States, Gainesville. Fla. Sea Grant Coll. Rep. No 84. Fla. Mar. Res. Publ. No. 42. 189–209 p.
Gasc, A. and A. Szmant. 1999. Distribution of Florida Bay nutrients. Progress Report submit-ted to the South Florida Ecosystem Restoration, Prediction, and Modeling Program. Avail-able: http://www.aoml.noaa.gov/ocd/sferpm/szmant/szmant_gasc.html. Last accessed De-cember 22, 2004.
Gill, G. A., N. S. Bloom, S. Cappellino, C. T. Driscoll, C. Dobbs, L. McShea, R. Mason, and J. W. M. Rudd. 1999. Sediment-water fluxes of mercury in Lavaca Bay, Texas. Envriron. Sci. Technol. 33: 663–669.
Gilmour, C. C. and E. A. Henry. 1991. Mercury methylation in aquatic systems affected by acid deposition. Environ. Pollut. 71: 131–169.
Goodman, L. R., M. A. Lewis, J. M. Macauley, R. Smith, Jr. and J. C. Moore. 1999. Preliminary survey of chemical contaminants in water, sediment, and aquatic biota at selected sites in northeastern Florida Bay and canal C-111. Gulf of Mexico Sci. 1: 1–16.
Guentzel, J. L., W. M. Landing, G. A. Gill, and C. D. Pollman. 2001. Processes influencing rain-fall deposition of mercury in Florida. Environ. Sci. Technol. 35: 863–873.
Hall, B. D., R. A. Bodaly, R. J. P. Fudge, J. W. M. Rudd, and D. M Rosenberg. 1997. Food as the dominant pathway of methylmercury uptake by fish. Water Air Soil Pollut. 100: 13–24.
Harrigan, P., J. C. Zieman, and S. A. Macko. 1989. The base of nutritional support for the gray snapper (Lutjanus griseus): an evaluation based on a combined stomach content and stable isotope analysis. Bull. Mar. Sci. 44: 65–77.
Herman, P. M. J., J. J. Middelburg, J. Widdows, C. H. Lucas, and C. H. R. Heip. 2000. Stable isotopes as trophic tracers: combining field sampling and manipulative labeling of food resources for macrobenthos. Mar. Ecol. Prog. Ser. 204: 79–92.
Hettler, W. F., Jr. 1989. Food habits of juveniles of spotted seatrout and gray snapper in western Florida Bay. Bull. Mar. Sci. 44: 155–162.
Hittle, C., E. Patino, and M. Zucker. 2001. Freshwater flow from estuarine creeks into north-eastern Florida Bay. Rep. 01-4164. U.S. Geological Survey, Water-Resources Investigations, Tallahassee. 32 p.
Hudson, R. J. H., S. A. Gherini, C. J. Watras, and D. B. Porcella. 1994. Modeling the biogeo-chemical cycle of mercury in lakes: The mercury cycling model (MCM) and its application to the MTL study lakes. Pages 473–523 in C. J. Watras and J. W. Huckabee, eds. Mercury pollution: integration and synthesis. Lewis Publishers, Boca Raton.
Joye, S. B. and J. T. Hollibaugh. 1995. Influence of sulfide inhibition of nitrification on nitrogen regeneration in sediments. Science 270: 623–625.
Kang, W., J. H. Trefry, T. A. Nelsen, and H. R. Wanless. 2000. Direct atmospheric inputs versus runoff fluxes of mercury to the lower Everglades and Florida Bay. Environ. Sci. Technol. 34: 4058–4063.
Kannan, K., R. G. Smith, R. F. Lee, H. L. Windom, P. T. Heitmuller, J. M. Macauley, and J. K. Summers. 1998. Distribution of total mercury and methyl mercury in water, sediment and fish from south Florida estuaries. Arch. Environ. Contam. Toxicol. 34: 109–118.
Kidd, K. A., M. J. Paterson, R. H. Hesslein, D. C. G. Muir, and R. E. Hecky. 1999. Effects of northern pike (Esox lucius) additions on pollutant accumulation and food web structure, as determined by δ13C and δ15N, of a eutrophic and an oligotrophic lake. Can. J. Fish. Aquat. Sci. 56: 2193–2202.
King, J. K., F. M. Saunders, R. F. Lee, and J. A. Jahnke. 1999. Coupling mercury methylation rates to sulfate reduction rates in marine sediments. Environ. Toxicol. Chem. 18: 1362–1369.
Koenig, C. C., F. Coleman, J. Cavin, and T. Schmidt. 2001. Diet of red drum (Sciaenops ocel-latus) and common snook (Centropomus undecimalis) in Florida Bay and adjacent waters.
EVANS AND CRUMLEY: MERCURY IN FLORIDA BAY FISH 343
Final report submitted by Florida State University to the U.S. Dept. of the Interior, National Park Service, Washington DC. Cooperative Agreement No. CA5280-9-9001.
Ku, T. C. W., L. M. Walter, M. L. Coleman, R. E. Blake, and A. M. Martini. 1999. Coupling between sulfur recycling and syndepositional carbonate dissolution: Evidence from oxygen and sulfur isotope composition of pore water sulfate, South Florida, U.S.A. Geochim. Cos-mochim. Acta 63: 2529–2546.
Langer, C. S., W. F. Fitzgerald, P. T. Visscher, and G. M. Vandal. 2001. Biogeochemical cycling of methylmercury at Barn Island salt marsh, Stonington, CT, USA. Wetlands Ecol. Manage. 9: 295–310.
Lavrentyev, P. J., H. A. Bootsma, T. H. Johengen, J. F. Cavaletto, and W. S. Gardner. 1998. Micro-bial plankton response to resource limitation: Insights from the community structure and seston stoichiometry in Florida Bay, USA. Mar. Ecol. Prog. Ser. 165: 45–57.
Lutz, M. J. 1997. A carbon isotope study of the flux of organic material in a sub-tropical estuary, Florida Bay. MS Thesis, University of Miami, Coral Gables. 142 p.
Mason, R. P., J. R. Reinfelder, and F. M. M. Morel. 1996 Uptake, toxicity, and trophic transfer of mercury in a coastal diatom. Environ. Sci. Technol. 30: 1835–1845.
___________ and A. L. Lawrence. 1999. Concentration, distribution, and bioavailability of mer-cury and methylmercury in sediments of Baltimore Harbor and Chesapeake Bay, Mary-land, USA. Environ. Toxicol. Chem. 18: 2438–2447.
McCulloch, C. E. and S. R. Searle. 2001. Generalized, linear, and mixed models. John Wiley & Sons, New York. 325 p.
McIvor, C. C., J. A. Ley, and R. D. Bjork. 1994. Changes in freshwater inflow from the Everglades to Florida Bay including effects on biota and biotic processes: a review. Pages 117–146 in S. M. Davis and J. C. Ogden eds. Everglades: the ecosystem and its restoration. St. Lucie Press, Delray Beach.
Michener, R. H. and D. M. Schell. 1994. Stable isotope ratios as tracers in marine aquatic food webs. Pages 138–157 in K. Lajtha and R. H. Michener, eds. Stable isotopes in ecology and environmental science. Blackwell Scientific Publications, Oxford.
Middleburg, J. J., C. Barranguet, H. T. S. Boschker, P. M. J. Herman, T. Moens, and C.H. R. Heip. 2000. The fate of intertidal microphytobenthos carbon: an in situ δ13C-labeling study. Limnol. Oceanogr. 45: 1224–1234.
Miller, D. C., R. J. Geider, and H. L. MacIntyre. 1996. Microphytobenthos: The ecological role of the “Secret Garden” of unvegetated, shallow-water marine habitats. II. Role in sediment stability and shallow-water food webs. Estuaries 19: 202–212.
Moncreiff, C. A. and M. J. Sullivan. 2001. Trophic importance of epiphytic algae in subtropical seagrass beds: evidence from multiple stable isotope analyses. Mar. Ecol. Prog. Ser. 215: 93–106.
Mumford, P. L. 1999. The effects of environmental stress and primary productivity on food chain length in Florida Bay. MS thesis, Florida International University, Miami. 102 p.
Murphy, M. D. and R. G. Taylor. 1990. Reproduction, growth, and mortality of red drum Sciae-nops ocellatus in Florida waters. Fish. Bull. 88: 531–542.
Nuttle, W. K., J. W. Fourqurean, B. J. Cosby, J. C. Zieman, and M. B. Robblee. 2000. Influence of net freshwater supply on salinity in Florida Bay. Water Resourc. Res. 26: 1805–1822.
O’Driscoll, N. J. and R. D. Evans. 2000. Analysis of methyl mercury binding to freshwater humic and fulvic acids by gel permeation chromatography/hydride generation ICP/MS. Environ. Sci. Technol. 34: 4039–4043.
Odum, W. E. and E. J. Heald. 1972. Trophic analysis of an estuarine mangrove community. Bull. Mar. Sci. 22: 671–738.
Orem, W. H., C. W. Holmes, C. Kendall, H. E. Lerch, A. L. Bates, S. R. Silva, A. Boylan, M, Co-rum, M. Marot, and C. Hedgman. 1999. Geochemistry of Florida Bay sediments: nutrient history at five sites in eastern and central Florida Bay. J. Coast. Res. 15: 1055–1071.
Peterson, B. J. and B. Fry. 1987. Stable isotopes in ecosystem studies. Ann. Rev. Ecol. Syst. 18: 293–320.
BULLETIN OF MARINE SCIENCE, VOL. 77, NO. 3, 2005344
Phillips, D. J. H. 1980. Quantitative aquatic biological indicators: their use to monitor trace metal and organochlorine pollution. Applied Science Publishers, London. 488 p.
Phlips, E. J., T. C. Lynch, and S. Badylak. 1995. Chlorophyll a, tripton, color, and light avail-ability in a shallow tropical inner-shelf lagoon, Florida Bay, USA. Mar. Ecol. Prog. Ser. 127: 223–234.
Program Management Committee (PMC). 2004. The strategic science plan for Florida Bay. PMC, Homestead. Everglades National Park. 31 p. + apps.
Rodgers, D. W. 1994. You are what you eat and a little bit more: bioenergetics-based models of methylmercury accumulation in fish revisited. Pages 427–439 in C. J. Watras and J. W. Huckabee, eds. Mercury pollution: integration and synthesis. Lewis Publishers, Boca Ra-ton.
Rumbold, D., L. Fink, S. Niemczyk, and K. Laine. 2001. Florida Bay mercury screening study. Everglades Consolidated Report. Appendix 7-12. South Florida Water Management Dis-trict, West Palm Beach.
Rutherford, E. S., E. B. Thue, and D. G. Buker. 1983. Population structure, food habits, and spawning activity of gray snapper, Lutjanus griseus in Everglades National Park. Report SFRC-83/02, National Park Service, South Florida Research Center, Everglades National Park, Homestead. 41 p.
Schwamborn, R. and M. M. Criales. 2000. Feeding strategy and daily ration of juvenile pink shrimp (Farfantepenaeus duorarum) in a South Florida seagrass bed. Mar. Biol. 137: 139–147.
Scott, G. I., M. H. Fulton, E. F. Wirth, G. T. Chandler, P. B. Key, J. W. Daugomah, D. Bearden, K. W. Chung, E. D. Strozier, M. DeLorenzo, S. Sivertsen, A. Dias, M. Sanders, J. M. Macauley, L. R. Goodman, M. W. Lacroix, G. W. Thayer, and J. Kucklick. 2002. Toxicological studies in tropical ecosystems: an ecotoxicological risk assessment of pesticide runoff in south Florida estuarine ecosystems. J. Agr. Food Chem. 50: 4400–4408.
Southeast Environmental Research Center (SERC). 2002. An integrated surface water quality monitoring program for the south Florida coastal waters. Florida International University, Miami, Florida. Available: http://serc.fiu.edu/wqmnetwork. Last accessed September 21, 2005.
Starck, W. A. II. And R. E. Schroeder. 1971. Investigations on the gray snapper, Lutjanus gri-seus. University of Miami Press, Coral Gables. 244 p.
Stoner, A. W. and R. J. Zimmerman. 1988. Food pathways associated with penaeid shrimps in a mangrove-fringed estuary. Fish. Bull. 86: 543–551.
Stribling, J. M. and J. C. Cornwell. 1997. Identification of important primary producers in a Chesapeake Bay tidal creek system using stable isotopes of carbon and sulfur. Estuaries 20: 77–85.
Strom, D. G. and G. A. Graves. 1995. A comparison of mercury in estuarine fish between Flor-ida Bay and the Indian River Lagoon. Ecosystem Management Report. Florida Department of Environmental Protection, Port St. Lucie. 34 p.
__________ and ____________. 2001. A comparison of mercury in estuarine fish: Florida Bay and the Indian River Lagoon, Florida, USA. Estuaries 24: 597–609.
Swart, P. K. and R. Price. 2002. Origin of salinity variations in Florida Bay. Limnol. Oceanogr. 47: 1234–1241.
Thayer, G. W., W. F. Hettler, Jr., A. J. Chester, D. R. Colby, and P. J. McElhaney. 1987. Distribu-tion and abundance of fish communities among selected estuarine and marine habitats in Everglades National Park. Rep. SFRC 87/02. Everglades National Park, South Florida Research Center, Homestead. 166 p.
____________, A. B. Powell, and D. E. Hoss. 1999. Composition of larval, juvenile, and small adult fishes relative to changes in environmental conditions in Florida Bay. Estuaries 22: 518–533.
Tilmant, J. T. 1989. A history and an overview of recent trends in the fisheries of Florida Bay. Bull. Mar. Sci. 44: 3–22.
EVANS AND CRUMLEY: MERCURY IN FLORIDA BAY FISH 345
Trudel, M. and J. B. Rasmussen. 2001. Predicting mercury concentrations in fi sh using mass balance models. Ecol. Appl. 11: 517–529.
Ullrich, S. M., T. W. Tandon, and S. A. Abdrashitova. 2001. Mercury in the aquatic environment: a review of factors aff ecting methylation. Critical Rev. Environ. Sci. Tech. 31: 241–293.
U. S. Environmental Protection Agency (EPA). 1991. Method 245.6. Mercury in tissues by cold vapor (CV/AAS). Methods for the determination of metals in environmental samples. EPA 600/4-91-010. (NTIS/PB91-231498).
______________________________________. 2001. Mercury Update: Impact on Fish Adviso-ries. Fact Sheet EPA-823-F-01-011. 10 p.
______________________________________. 2004. National Listing of Fish and Wildlife Ad-visories. Washington DC, US EPA. Available: http://www.epa.gov/waterscience/fi sh/. Last accessed December 22, 2004.
Zieman, J. C., S. A. Macko, and A. L. Mills. 1984. Role of seagrasses and mangroves in estuarine food webs: Temporal and spatial changes in stable isotope composition and amino acid content during decomposition. Bull. Mar. Sci. 35: 380–392.
DATE SUBMITTED: 5 December, 2002. DATE ACCEPTED: 12 April, 2005.
ADDRESS: NOAA, NOS, National Centers for Coastal Ocean Science, Center for Coastal Fish-eries and Habitat Research, Beaufort Laboratory, 101 Pivers Island Road, Beaufort, North Carolina 28516. CORRESPONDING AUTHOR: (D.W.E.) E-mail: <[email protected]>.