Embed Size (px)
Citation preview
ECONOMIC AND REAL ESTATE ANALYSIS FOR SUSTAINABLE LAND USE OUTCOMES™ECONOMIC AND REAL ESTATE ANALYSIS FOR SUSTAINABLE LAND USE OUTCOMES™
Meriden TOD Market Study and Financial
Feasibility Analysis:
Phase I Market Study
Prepared for: the City of Meriden, Connecticut
[Project Name]
4WARD PLANNING LLC
June 19, 2013
Page 2
Meriden TOD Study: Phase I Market Study
4WARD PLANNING LLC
June 21, 2013
Page 2
Executive Summary
4ward Planning was retained by the City of Meriden, Connecticut to perform a market financial and
economic analysis of transit-oriented development (TOD) adjacent to the Meriden Transit Center in
downtown Meriden. Phase I of this study, herein, includes a detailed quantitative and qualitative analysis
of market conditions impacting the potential TOD Study Area (a half-mile radius surrounding the transit
center).
A socio-economic analysis found that the initial market for the project will not be driven by current
residents in the TOD Study Area, who are primarily of low incomes. Instead, the primary, near-term
demand will be driven by two age cohorts currently living in the primary market area (PMA); these are the
young workers and graduates (age 25-34) and the empty nesters (age 55 to 74). Both age cohorts tend
to favor smaller, rental or homeownership units in an urban setting with access to transit, entertainment,
amenities and jobs. Empty nesters also have higher disposable incomes, which will be advantageous to
future residential and retail development. However, the currently low-values and low-incomes in the
study area represent a challenge; early development around the transit station will need to offer
significant value and quality to attract future residents.
Employees both living and working in the area decreased slightly from 2006 to 2010 and, at about 13
percent, is low relative to the surrounding region. However, the share of workers commuting into the
PMA (nearly 35,000 workers) increased slightly over that timeframe. This trend indicates a latent
demand for housing in the PMA as a percentage of those currently commuting would be expected to
move into the PMA, given more adequate housing choices.
[Project Name]
4WARD PLANNING LLC
June 19, 2013
Page 3
Meriden TOD Study: Phase I Market Study
4WARD PLANNING LLC
June 21, 2013
Page 3
Executive Summary (continued)
Additionally, the NHHS rail service will offer Meriden as a potential housing choice for persons who want
to commute to one of the many employment centers (with nearly 140,000 jobs) along the transit line
(e.g., Hartford and New Haven). Given that many metropolitan area major employers are located within a
mile of rail stations along the NHHS line, Meriden’s potential as a “point of origin” for prospective
commuters (whether they wish to live in the Meriden TOD area or not) will be quite great.
A review of social infrastructure also found that the study area fails to provide adequate open space,
childcare services and affordable quality housing options, based on industry standards.
A land improvement to land value (ILV) analysis found that 35 percent of the land area (and 25 percent
of all parcels) in the study area have ILV ratios of less than 2.0 (that is, where the built structure was
valued at half the value of the assessed land). These are considered to be underdeveloped, or
prospective opportunities for redevelopment. Redeveloping such low-value land parcels close-in to a rail
station could prove fiscally beneficial to the local community, based on the likelihood of generating net
positive tax revenues.
Current low vacancy rates in Meriden suggest a tight rental market and potential latent demand, favoring
residential construction in the area. This trend is supported by strong positive growth in non-family
households, suggesting high receptivity for TOD-style multi-family units. An analysis of residential supply
& demand indicates a potential demand for 600 to 1,000 housing units in the TOD Study Area targeted
to young workers and graduates and empty nesters.
[Project Name]
4WARD PLANNING LLC
June 19, 2013
Page 4
Meriden TOD Study: Phase I Market Study
4WARD PLANNING LLC
June 21, 2013
Page 4
Executive Summary (continued)
The near-term challenge associated with this is financial; due to the current low rents in the market, a
cap on pricing in the near-term can be expected, limiting the upside for developers until housing demand
increases markedly. For the early-phase projects to get underway, public support in the way of up-front
subsidies and incentives will be necessary.
Conversely, the analysis showed little demand for office space, specifically for large corporate office
space users. The low demand for office space is expected to be met largely with existing vacant space,
of which there is plenty around Meriden. The potential opportunity in the near-term is small-scale office
space to provide medical, financial and personal services to serve the local market. In the five- to ten-
year window a potential of 20,000 SF could be readily absorbed. Similar to the residential use, the near-
term challenge for this office space development is that public incentives and subsidies would be
needed to make private investment financially viable.
Retail demand in the vicinity of the Meriden TOD Study Area is expected to be largely limited to
convenience retail and community serving retail with a focus on the local market. Projections of retail
demand outlined in the PB study far exceed what is indicated by the this analysis, estimated to be up to
an additional 28,000 SF.

[Project Name]
4WARD PLANNING LLC
June 19, 2013
Page 5
Meriden TOD Study: Phase I Market Study
4WARD PLANNING LLC
June 21, 2013
Page 5
Executive Summary (continued)
To “ground truth” the quantitative findings, the consultant team conducted interviews with real estate
professionals and both an online area employee survey and a telephone survey of area residents. Key
findings of the employee survey are:
• Less than half of respondents are aware of the improvements coming to Meriden.
• Very few people live near transit (less than ten percent).
• People generally do not have a good impression of downtown Meriden.
The responses reflect a common theme, that in order to attract people to new residential housing in the TOD
study area, there will also need to be a change in perception and/or reality regarding downtown Meriden.
The telephone survey confirmed both the demographic analysis and the employee survey findings, that
young workers and graduates would have the most interest in moving to the TOD study area, followed by
empty nesters (but less so those empty nesters from higher income brackets). Therefore, the focus should
be on providing the amenities of interest to these age groups, primarily basic services (grocery, banking,
medical), parks and outdoor space, and restaurants. It also reiterates the point that providing new, high
quality housing at low price points will be a challenge.
While their outlook was mixed, interviews with developers revealed similar themes. They noted the challenge
of attracting people to the TOD Study Area without significant initial investment in the area’s attractiveness,
including retail and services. They also confirmed that incentives would be necessary to induce developer
interest.
[Project Name]
4WARD PLANNING LLC
June 19, 2013
Page 6
Meriden TOD Study: Phase I Market Study
4WARD PLANNING LLC
June 21, 2013
Page 6
Executive Summary (continued)
In summary, the recommended development program for TOD-style development around the Meriden
Transit Center includes:
• 600 – 1,000 multi-family residential units attractive to young workers and graduates and empty
nesters;
• 20,000 SF of small-scale office space
• 28,000 SF of convenience and community serving retail
In addition, the study area will need additional open space (such as the proposed Meriden Green),
childcare services and a full-service grocery store near the transit center to provide an adequate level of
service. Current low values in the area will be a significant early challenge. Public incentives and
subsidies will be necessary to induce private investment and make early development of the TOD Study
Area possible.

[Project Name]
4WARD PLANNING LLC
June 19, 2013
Page 7
Meriden TOD Study: Phase I Market Study
4WARD PLANNING LLC
June 21, 2013
Page 7
Table of ContentsPHASE I EXECUTIVE SUMMARY
INTRODUCTION
BACKGROUND ANALYSIS
Study Area Site Visit Summary
Background
Land Valuation Analysis
Methodology
Zoning Review
Methodology
Background
TOD Comparables & Benchmarks
Methodology
SOCIO-ECONOMIC, LABOR & INDUSTRY
EVALUATION
Socio-Economic Trends Analysis
Methodology
Key Findings
Takeaway
Labor & Industry Analysis
Methodology
Key Findings
Takeaway
Social Infrastructure Analysis
Methodology
2
8
11
12
20
21
25
26
27
37
38
47
49
50
62
63
64
65
81
82
83
REAL ESTATE ANALYSIS
Key Findings
Methodology - Trends
Residential Trends Analysis
Takeaway
Residential Supply-Demand Analysis
Methodology
Takeaway
Office Trends Analysis
Takeaway
Office Supply-Demand Analysis
Methodology
Takeaway
Retail Trends Analysis
Methodology
Takeaway
TOD VIABILITY ANALYSIS
General & Limiting Conditions
90
93
94
102
103
104
110
111
118
119
120
123
124
125
130
131
142
APPENDIX
A. Underutilized Parcels
B. Infrastructure and Parking Demand Assessment
C. Housing Affordability Analysis
D. Developer Interviews Summary
E. Employee Online Survey Summary
F. Telephone Survey Summary
G. Telephone Survey Full Report

[Project Name]
4WARD PLANNING LLC
June 19, 2013
Page 8
Meriden TOD Study: Phase I Market Study
4WARD PLANNING LLC
June 21, 2013
Page 8
Introduction
4ward Planning was retained by the City of Meriden, Connecticut to perform a market financial and
economic analysis of transit-oriented development (TOD) pursuant to the TOD study area adjacent to the
Meriden Transit Center in downtown Meriden. This work is funded by a TOD Pilot grant, awarded by the
Connecticut Department of Transportation, which includes funding for pre-development analysis of the
City’s proposed TOD zone.
Meriden has been identified as a key node along the New Haven-Hartford-Springfield (NHHS) rail line, a
new commuter rail service planned to commence in 2016. The State of Connecticut will invest nearly
$500 million in the NHHS rail program over the next four years, including significant investments in
Meriden. By 2030, the rail service is expected to serve over 400 daily commuters in Meriden and spur
significant development in the area. The City is positioning itself to realize the maximum economic
development potential that is consistent with TOD design principles. Primarily, TOD principles include the
provision of commercial, residential and retail offerings within walking distance (generally, a half-mile
radius) of transit stations.
The overall goal of this analysis was to prepare the City for anticipated future development. The study
also serves to both validate and supplement the recently completed TOD market analysis and land
assembly study prepared by Parsons Brinkerhoff and their team and to further flesh out the feasibility of
TOD-style development in Meriden.

[Project Name]
4WARD PLANNING LLC
June 19, 2013
Page 9
Meriden TOD Study: Phase I Market Study
4WARD PLANNING LLC
June 21, 2013
Page 9
Introduction (continued)
The goals and objectives of this analysis, as identified by the City and 4ward Planning, include:
• Determine the viability of proposed development strategies recommended in the TOD Plan (PB) with
market analysis and finalize the City’s land assembly strategy.
• Recommend a mix of potential development for the TOD Study Area given market conditions for
office, residential, retail, entertainment, institutional and civic uses.
• Conduct outreach and develop a marketing package for potential developers and development
partners.
• Estimate the costs and funding strategies of preparing key sites and underutilized parcels in the TOD
area for development by conducting an infrastructure analysis and financial assessment.
• Provide a clear understanding of the long-term economic benefits that could result from the proposed
development in the TOD study area with an economic benefits assessment.
Upon completion, this analysis will provide the City of Meriden with a realistic picture of the potential
future build-out of the TOD study area; an understanding of the costs associated and possible funding
sources; and actionable strategies for engaging developers and development partners. This report will
provide the City the confidence and assurance needed to pursue a market feasible and fiscally
responsible TOD strategy.

ECONOMIC AND REAL ESTATE ANALYSIS FOR SUSTAINABLE LAND USE OUTCOMES ™ECONOMIC AND REAL ESTATE ANALYSIS FOR SUSTAINABLE LAND USE OUTCOMES ™
BACKGROUND ANALYSIS

ECONOMIC AND REAL ESTATE ANALYSIS FOR SUSTAINABLE LAND USE OUTCOMES ™ECONOMIC AND REAL ESTATE ANALYSIS FOR SUSTAINABLE LAND USE OUTCOMES ™
Study Area
Site Visit Summary
[Project Name]
4WARD PLANNING LLC
June 19, 2013
Page 12
Meriden TOD Study: Phase I Market Study
4WARD PLANNING LLC
June 21, 2013
Page 12
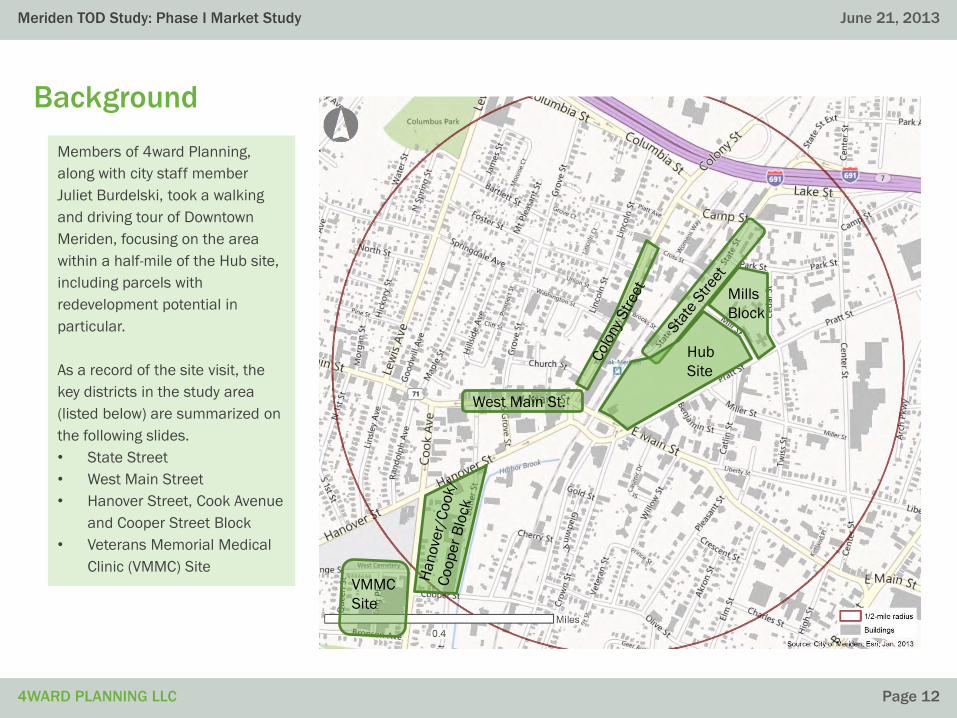
Background
Members of 4ward Planning,
along with city staff member
Juliet Burdelski, took a walking
and driving tour of Downtown
Meriden, focusing on the area
within a half-mile of the Hub site,
including parcels with
redevelopment potential in
particular.
As a record of the site visit, the
key districts in the study area
(listed below) are summarized on
the following slides.
• State Street
• West Main Street
• Hanover Street, Cook Avenue
and Cooper Street Block
• Veterans Memorial Medical
Clinic (VMMC) Site
West Main St.
VMMC
Site
Mills
Block
Hub
Site

[Project Name]
4WARD PLANNING LLC
June 19, 2013
Page 13
Meriden TOD Study: Phase I Market Study
4WARD PLANNING LLC
June 21, 2013
Page 13
Hub Site
Formerly a shopping center, the Hub Site is the largely vacant parcel bounded by State Street, Mill Street, Pratt Street and East Main Street.• The site will be converted into a park that provides flood control for Harbor Brook• Locations at the corner of State Street and Mill Street, as well as along Pratt Street, have
been designated as development sites.
[Project Name]
4WARD PLANNING LLC
June 19, 2013
Page 14
Meriden TOD Study: Phase I Market Study
4WARD PLANNING LLC
June 21, 2013
Page 14
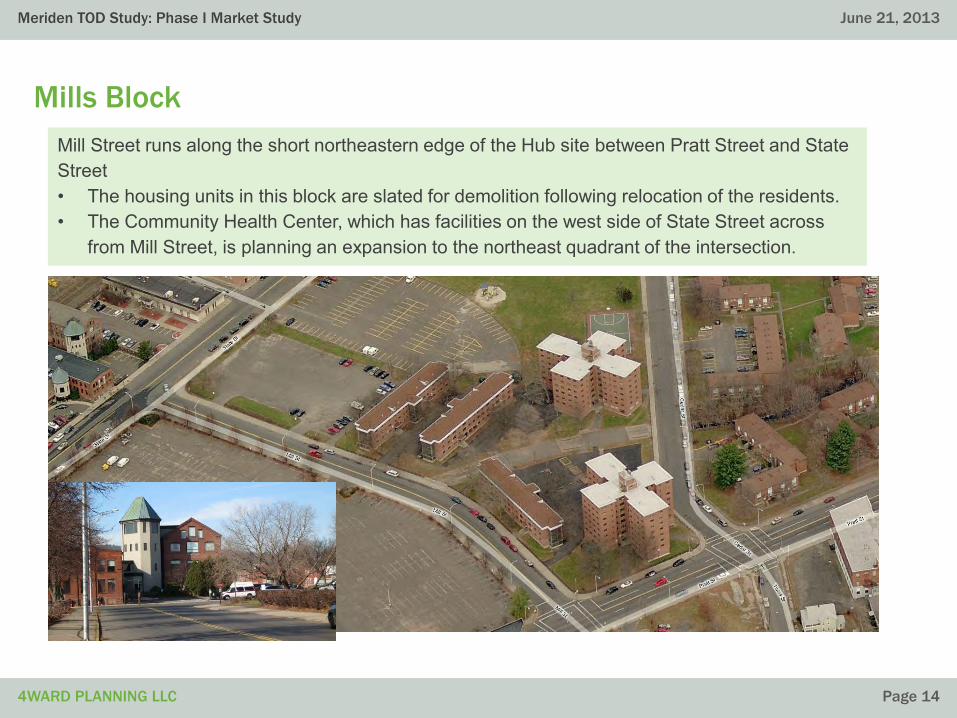
Mills Block
Mill Street runs along the short northeastern edge of the Hub site between Pratt Street and State Street• The housing units in this block are slated for demolition following relocation of the residents.• The Community Health Center, which has facilities on the west side of State Street across
from Mill Street, is planning an expansion to the northeast quadrant of the intersection.
[Project Name]
4WARD PLANNING LLC
June 19, 2013
Page 15
Meriden TOD Study: Phase I Market Study
4WARD PLANNING LLC
June 21, 2013
Page 15
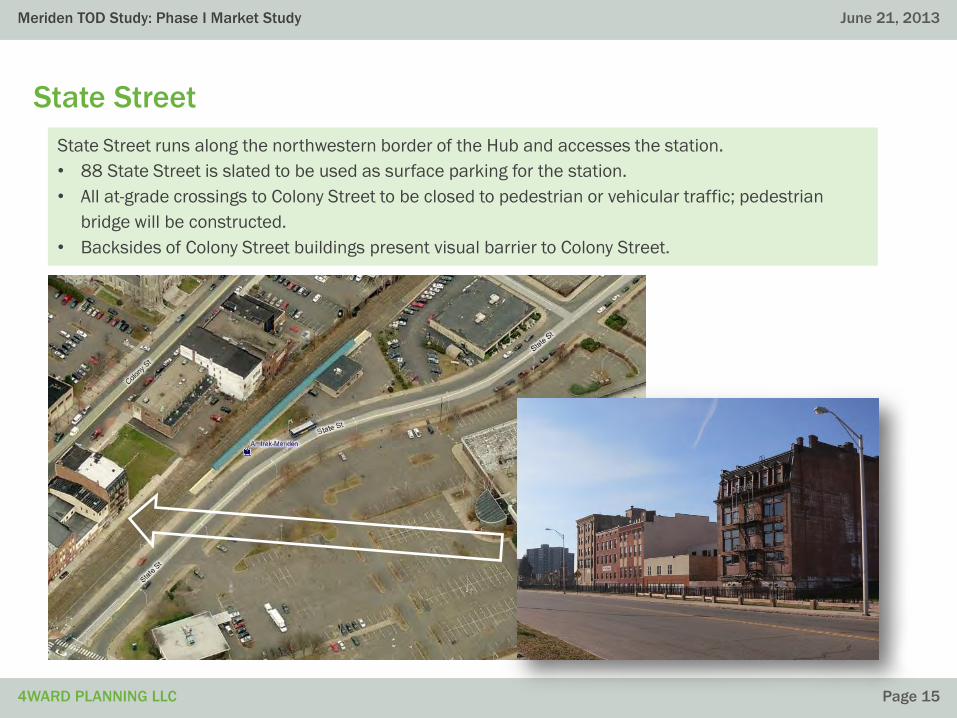
State Street
State Street runs along the northwestern border of the Hub and accesses the station.
• 88 State Street is slated to be used as surface parking for the station.
• All at-grade crossings to Colony Street to be closed to pedestrian or vehicular traffic; pedestrian
bridge will be constructed.
• Backsides of Colony Street buildings present visual barrier to Colony Street.

[Project Name]
4WARD PLANNING LLC
June 19, 2013
Page 16
Meriden TOD Study: Phase I Market Study
4WARD PLANNING LLC
June 21, 2013
Page 16
Colony Street
Colony Street runs parallel to the rail line and connects with West Main Street• The parcel north of Church St. on the west side of Colony St. is under consideration for
redevelopment as a public-private venture to include mixed use and a parking structure.• Current uses along Colony St. include social services and office space, with numerous
vacancies.

[Project Name]
4WARD PLANNING LLC
June 19, 2013
Page 17
Meriden TOD Study: Phase I Market Study
4WARD PLANNING LLC
June 21, 2013
Page 17
West Main Street
West Main Street is the Central Business/Downtown District of the City.
• Traffic circulation flows one-way to the west, away from the intersection with Colony Street.
• This traffic pattern is currently being analyzed and re-visited.
• The street exhibits a concentration of municipal service buildings and support commercial services
(e.g., bail bonds, cash checking retailers, and general social services)

[Project Name]
4WARD PLANNING LLC
June 19, 2013
Page 18
Meriden TOD Study: Phase I Market Study
4WARD PLANNING LLC
June 21, 2013
Page 18
Hanover Street, Cook Avenue and Cooper Street Block
This block, bordered on the east by Harbor Brook, is home to a former industrial building at 116 Cook
Avenue, a potential reuse site.
• Factory H, the adjacent saw tooth-roofed building, was recently demolished down to the
building pad, freeing up acreage for redevelopment.
• The Boiler House (not visible from this photo), a former power plant located east of Harbor Brook, is
a candidate for historic designation.
[Project Name]
4WARD PLANNING LLC
June 19, 2013
Page 19
Meriden TOD Study: Phase I Market Study
4WARD PLANNING LLC
June 21, 2013
Page 19
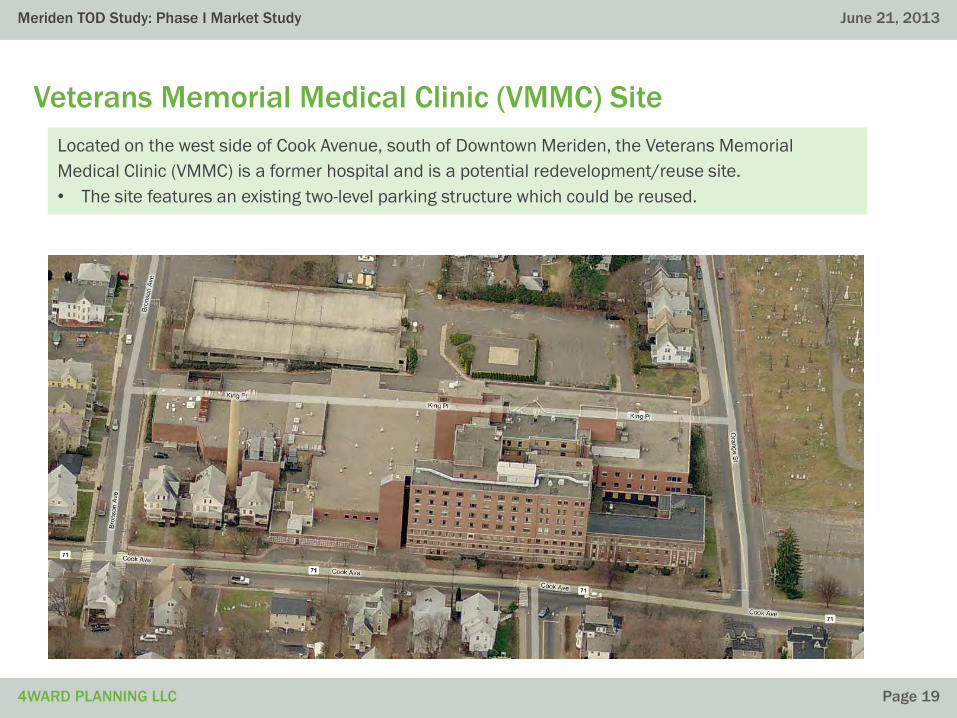
Veterans Memorial Medical Clinic (VMMC) Site
Located on the west side of Cook Avenue, south of Downtown Meriden, the Veterans Memorial
Medical Clinic (VMMC) is a former hospital and is a potential redevelopment/reuse site.
• The site features an existing two-level parking structure which could be reused.

ECONOMIC AND REAL ESTATE ANALYSIS FOR SUSTAINABLE LAND USE OUTCOMES ™ECONOMIC AND REAL ESTATE ANALYSIS FOR SUSTAINABLE LAND USE OUTCOMES ™
Land Valuation Analysis

[Project Name]
4WARD PLANNING LLC
June 19, 2013
Page 21
Meriden TOD Study: Phase I Market Study
4WARD PLANNING LLC
June 21, 2013
Page 21
Methodology
To conduct the land valuation analysis, assessed land values and improvement value data
were obtained from the City of Meriden GIS Department. The ratios of improvement value to
land value (ILV) were calculated and each parcel was categorized based on its ratio. Parcels
with an ILV ratio of less than 2.0 (that is, where the built structure was valued at half the
value of the assessed land) are considered to be underdeveloped, or prospective
opportunities for redevelopment. Redeveloping low-value land parcels close-in to a rail
station could prove fiscally beneficial to the local community, based on the likelihood of
generating net positive tax revenues.
The ILV ratio is one metric used for identifying redevelopment opportunities. This indicator
provides a snapshot based on the current valuation of properties in the area. The ILV ratio
can be used as an indicator of the general economic viability of an area or as a means of
identifying underutilized properties and redevelopment opportunities. Properties with low
ILV ratios are considered underutilized in the sense that these properties present an
opportunity to increase the overall value of the property by renovating or replacing the
structures. In addition, low ILV ratios may reflect a lack of investment in the property
characterized by outdated facilities or disrepair.

[Project Name]
4WARD PLANNING LLC
June 19, 2013
Page 22
Meriden TOD Study: Phase I Market Study
4WARD PLANNING LLC
June 21, 2013
Page 22
Figure A-1

[Project Name]
4WARD PLANNING LLC
June 19, 2013
Page 23
Meriden TOD Study: Phase I Market Study
4WARD PLANNING LLC
June 21, 2013
Page 23
Figure A-2
[Project Name]
4WARD PLANNING LLC
June 19, 2013
Page 24
Meriden TOD Study: Phase I Market Study
4WARD PLANNING LLC
June 21, 2013
Page 24
Land Valuation Analysis
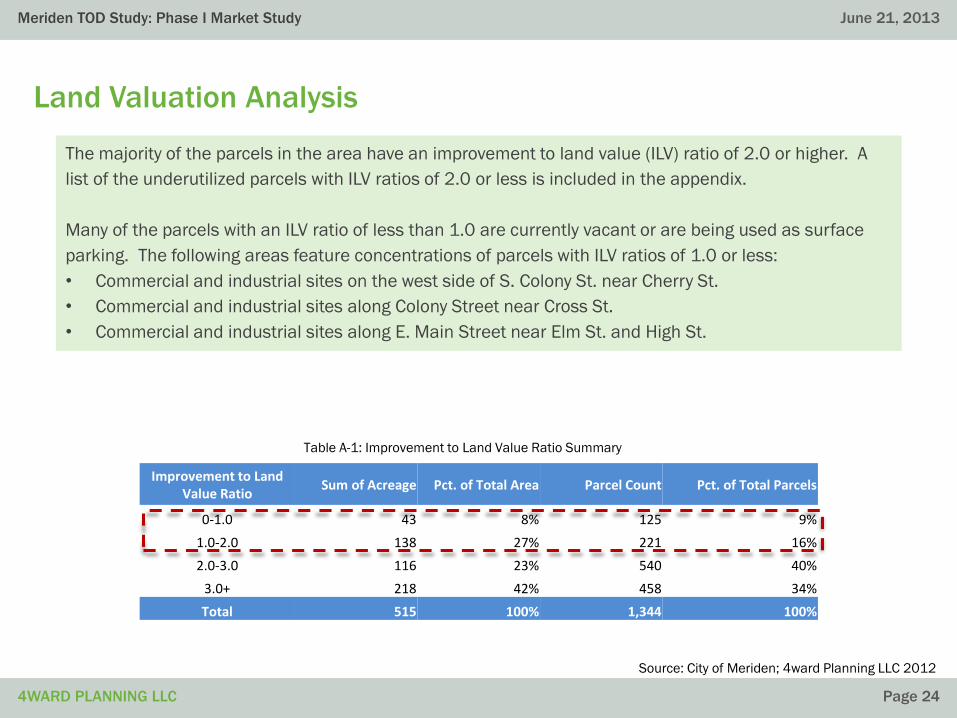
The majority of the parcels in the area have an improvement to land value (ILV) ratio of 2.0 or higher. A
list of the underutilized parcels with ILV ratios of 2.0 or less is included in the appendix.
Many of the parcels with an ILV ratio of less than 1.0 are currently vacant or are being used as surface
parking. The following areas feature concentrations of parcels with ILV ratios of 1.0 or less:
• Commercial and industrial sites on the west side of S. Colony St. near Cherry St.
• Commercial and industrial sites along Colony Street near Cross St.
• Commercial and industrial sites along E. Main Street near Elm St. and High St.
Improvement to Land Value Ratio
Sum of Acreage Pct. of Total Area Parcel Count Pct. of Total Parcels
0-1.0 43 8% 125 9%
1.0-2.0 138 27% 221 16%
2.0-3.0 116 23% 540 40%
3.0+ 218 42% 458 34%
Total 515 100% 1,344 100%
Source: City of Meriden; 4ward Planning LLC 2012
Table A-1: Improvement to Land Value Ratio Summary

ECONOMIC AND REAL ESTATE ANALYSIS FOR SUSTAINABLE LAND USE OUTCOMES ™ECONOMIC AND REAL ESTATE ANALYSIS FOR SUSTAINABLE LAND USE OUTCOMES ™
Zoning Review

[Project Name]
4WARD PLANNING LLC
June 19, 2013
Page 26
Meriden TOD Study: Phase I Market Study
4WARD PLANNING LLC
June 21, 2013
Page 26
Methodology
4ward Planning performed an initial review of Meriden’s current and proposed zoning
requirements for the TOD planning area. Policy objectives for the area, as expressed in
current planning studies, were also reviewed. The goal of this review is to become familiar
with Meriden’s current land-use policy thinking and to apply this framework, later in the
financial analysis portion of the study, so as to determine whether or not congruency exists
between proposed land-use policy, and market and financial viable uses.
[Project Name]
4WARD PLANNING LLC
June 19, 2013
Page 27
Meriden TOD Study: Phase I Market Study
4WARD PLANNING LLC
June 21, 2013
Page 27
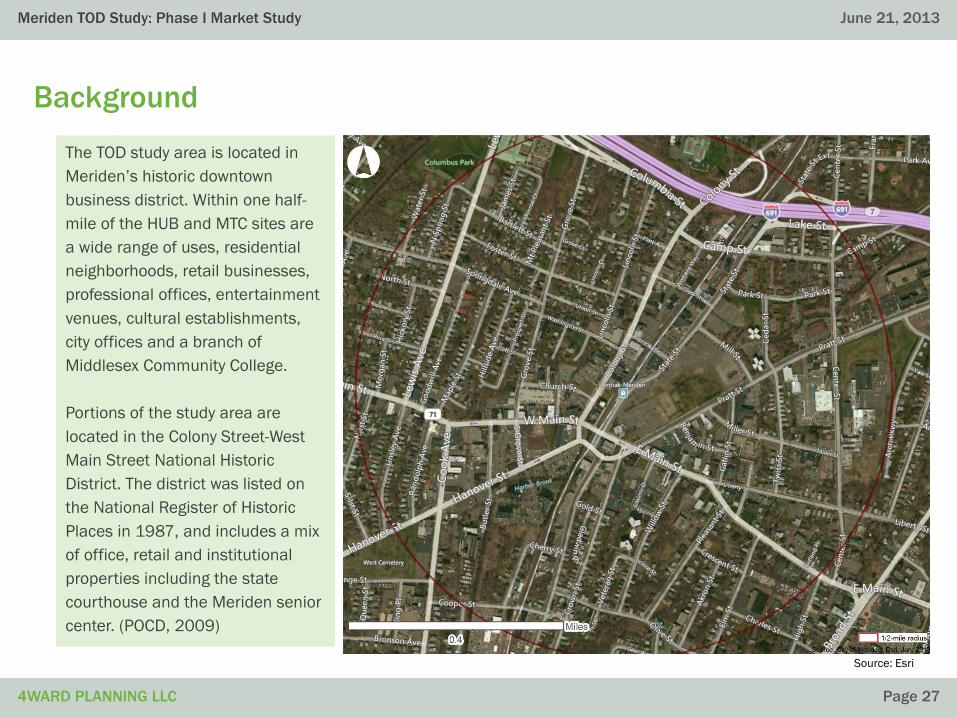
Background
The TOD study area is located in
Meriden’s historic downtown
business district. Within one half-
mile of the HUB and MTC sites are
a wide range of uses, residential
neighborhoods, retail businesses,
professional offices, entertainment
venues, cultural establishments,
city offices and a branch of
Middlesex Community College.
Portions of the study area are
located in the Colony Street-West
Main Street National Historic
District. The district was listed on
the National Register of Historic
Places in 1987, and includes a mix
of office, retail and institutional
properties including the state
courthouse and the Meriden senior
center. (POCD, 2009)
Source: Esri

[Project Name]
4WARD PLANNING LLC
June 19, 2013
Page 28
Meriden TOD Study: Phase I Market Study
4WARD PLANNING LLC
June 21, 2013
Page 28
Background: Downtown District
The Downtown District is identified in Meriden’s 2009 Plan of Conservation and Development (POCD) as
the governmental and cultural center of Meriden. The core of this area is the stretch of East Main Street
and West Main Street from the City Hall/Meriden Public Library/Board of Education “municipal complex”
west to the Hub site and the railroad station, and turning southwest to encompass the “Factory H”
property. (POCD, 2009)
The Downtown District is envisioned as a transit-oriented area, centered around the redeveloped Hub site
and an enhanced multi-modal transportation facility at the current railroad station. According to the
POCD, future land uses in the Downtown District should include ground floor retail and office space
coupled with high-quality residential units on upper floors.
Development should be done at a scale appropriate for Downtown Meriden, with the following suggested
standards to guide future development:
• Buildings are six stories or fewer
• Green space (provided by private-sector where necessary)
• Adequate parking (provided by private-sector where necessary)
• Linkages to surrounding neighborhoods improved
• Enhanced physical environment (landscaping, urban design elements, and façades)
• Improved traffic circulation system
• Stronger review of development
[Project Name]
4WARD PLANNING LLC
June 19, 2013
Page 29
Meriden TOD Study: Phase I Market Study
4WARD PLANNING LLC
June 21, 2013
Page 29
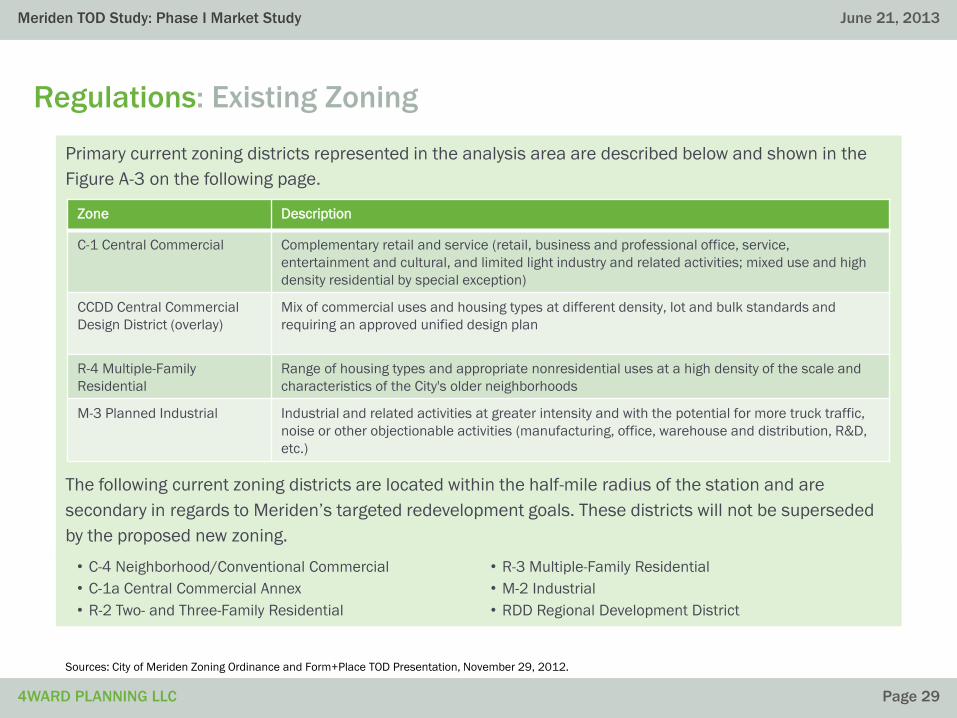
Regulations: Existing Zoning
Primary current zoning districts represented in the analysis area are described below and shown in the
Figure A-3 on the following page.
The following current zoning districts are located within the half-mile radius of the station and are
secondary in regards to Meriden’s targeted redevelopment goals. These districts will not be superseded
by the proposed new zoning.
Sources: City of Meriden Zoning Ordinance and Form+Place TOD Presentation, November 29, 2012.
• C-4 Neighborhood/Conventional Commercial
• C-1a Central Commercial Annex
• R-2 Two- and Three-Family Residential
• R-3 Multiple-Family Residential
• M-2 Industrial
• RDD Regional Development District
Zone Description
C-1 Central Commercial Complementary retail and service (retail, business and professional office, service,
entertainment and cultural, and limited light industry and related activities; mixed use and high
density residential by special exception)
CCDD Central Commercial
Design District (overlay)
Mix of commercial uses and housing types at different density, lot and bulk standards and
requiring an approved unified design plan
R-4 Multiple-Family
Residential
Range of housing types and appropriate nonresidential uses at a high density of the scale and
characteristics of the City's older neighborhoods
M-3 Planned Industrial Industrial and related activities at greater intensity and with the potential for more truck traffic,
noise or other objectionable activities (manufacturing, office, warehouse and distribution, R&D,
etc.)

[Project Name]
4WARD PLANNING LLC
June 19, 2013
Page 30
Meriden TOD Study: Phase I Market Study
4WARD PLANNING LLC
June 21, 2013
Page 30
Figure A-3
[Project Name]
4WARD PLANNING LLC
June 19, 2013
Page 31
Meriden TOD Study: Phase I Market Study
4WARD PLANNING LLC
June 21, 2013
Page 31
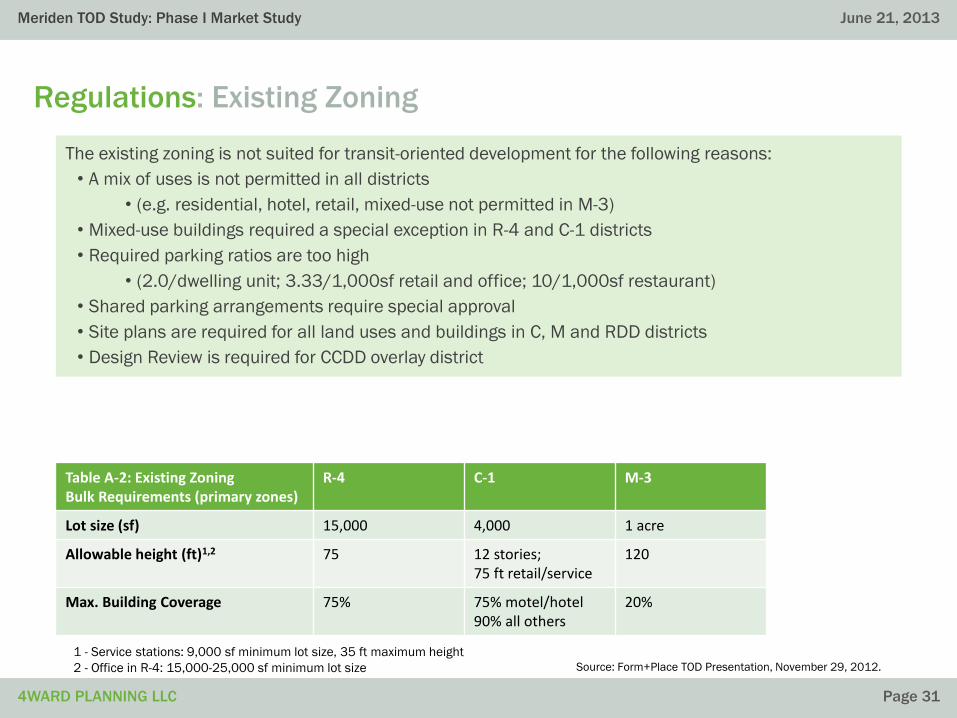
Regulations: Existing Zoning
The existing zoning is not suited for transit-oriented development for the following reasons:
• A mix of uses is not permitted in all districts
• (e.g. residential, hotel, retail, mixed-use not permitted in M-3)
• Mixed-use buildings required a special exception in R-4 and C-1 districts
• Required parking ratios are too high
• (2.0/dwelling unit; 3.33/1,000sf retail and office; 10/1,000sf restaurant)
• Shared parking arrangements require special approval
• Site plans are required for all land uses and buildings in C, M and RDD districts
• Design Review is required for CCDD overlay district
Source: Form+Place TOD Presentation, November 29, 2012.
1 - Service stations: 9,000 sf minimum lot size, 35 ft maximum height
2 - Office in R-4: 15,000-25,000 sf minimum lot size
Table A-2: Existing Zoning Bulk Requirements (primary zones)
R-4 C-1 M-3
Lot size (sf) 15,000 4,000 1 acre
Allowable height (ft)1,2 75 12 stories;75 ft retail/service
120
Max. Building Coverage 75% 75% motel/hotel90% all others
20%
[Project Name]
4WARD PLANNING LLC
June 19, 2013
Page 32
Meriden TOD Study: Phase I Market Study
4WARD PLANNING LLC
June 21, 2013
Page 32
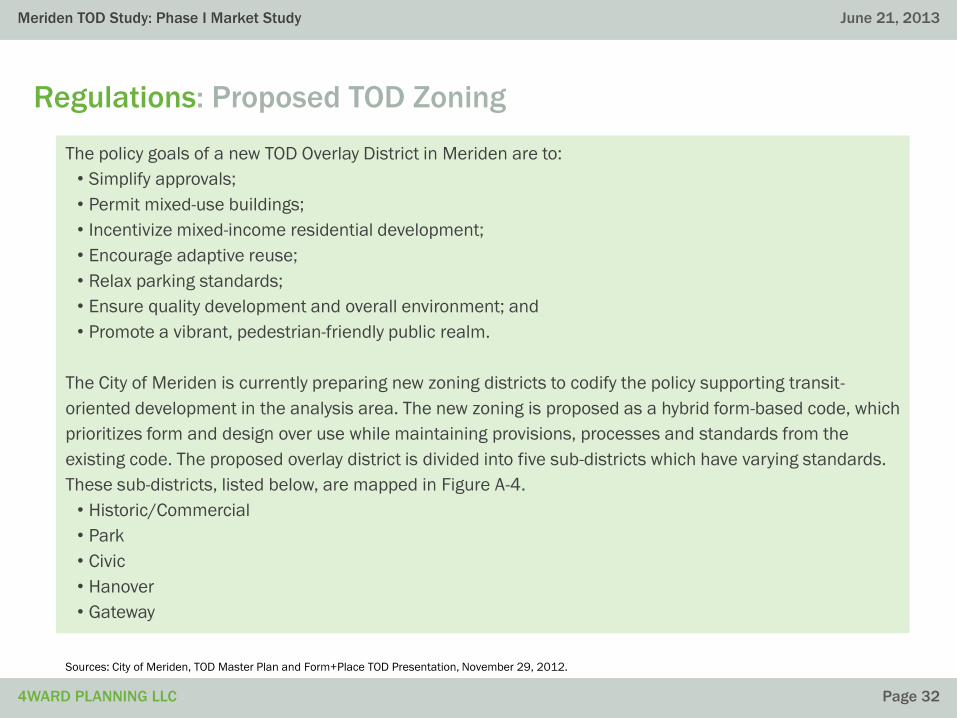
Regulations: Proposed TOD Zoning
The policy goals of a new TOD Overlay District in Meriden are to:
• Simplify approvals;
• Permit mixed-use buildings;
• Incentivize mixed-income residential development;
• Encourage adaptive reuse;
• Relax parking standards;
• Ensure quality development and overall environment; and
• Promote a vibrant, pedestrian-friendly public realm.
The City of Meriden is currently preparing new zoning districts to codify the policy supporting transit-
oriented development in the analysis area. The new zoning is proposed as a hybrid form-based code, which
prioritizes form and design over use while maintaining provisions, processes and standards from the
existing code. The proposed overlay district is divided into five sub-districts which have varying standards.
These sub-districts, listed below, are mapped in Figure A-4.
• Historic/Commercial
• Park
• Civic
• Hanover
• Gateway
Sources: City of Meriden, TOD Master Plan and Form+Place TOD Presentation, November 29, 2012.

[Project Name]
4WARD PLANNING LLC
June 19, 2013
Page 33
Meriden TOD Study: Phase I Market Study
4WARD PLANNING LLC
June 21, 2013
Page 33
Figure A-4
[Project Name]
4WARD PLANNING LLC
June 19, 2013
Page 34
Meriden TOD Study: Phase I Market Study
4WARD PLANNING LLC
June 21, 2013
Page 34
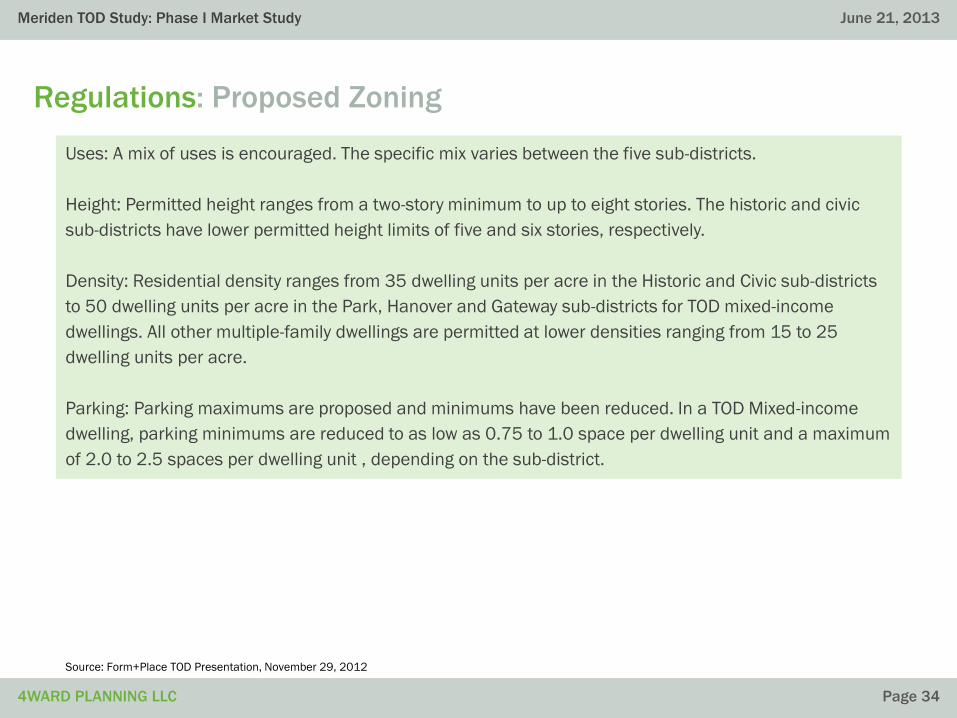
Regulations: Proposed Zoning
Uses: A mix of uses is encouraged. The specific mix varies between the five sub-districts.
Height: Permitted height ranges from a two-story minimum to up to eight stories. The historic and civic
sub-districts have lower permitted height limits of five and six stories, respectively.
Density: Residential density ranges from 35 dwelling units per acre in the Historic and Civic sub-districts
to 50 dwelling units per acre in the Park, Hanover and Gateway sub-districts for TOD mixed-income
dwellings. All other multiple-family dwellings are permitted at lower densities ranging from 15 to 25
dwelling units per acre.
Parking: Parking maximums are proposed and minimums have been reduced. In a TOD Mixed-income
dwelling, parking minimums are reduced to as low as 0.75 to 1.0 space per dwelling unit and a maximum
of 2.0 to 2.5 spaces per dwelling unit , depending on the sub-district.
Source: Form+Place TOD Presentation, November 29, 2012

[Project Name]
4WARD PLANNING LLC
June 19, 2013
Page 35
Meriden TOD Study: Phase I Market Study
4WARD PLANNING LLC
June 21, 2013
Page 35
Regulations: Proposed Zoning
Development Potential Summary
The PB report estimates that Meriden’s TOD site can accommodate 700 dwelling units at a density of 20-
45 dwelling units per acre and 325,000 square feet of non-residential space (equivalent to 200,000
square foot retail/restaurant and 125,000 square foot office).
Source: Form+Place TOD Presentation, November 29, 2012, Draft Zoning Ordinance, February 4, 2013
Historic / Commercial
Park Hanover Civic Gateway
Lot size (sf) 4,000 15,000 10,000 10,000 15,000
Allowable height, min/max (stories)TOD mixed-income dwellingMultiple-family dwellingAll other permitted uses
2/52/42/5
2/82/42/5
2/82/42/5
2/62/32/4
2/82/42/5
Lot Coverage, min/max (%)Multiple-family dwellingsAll other permitted uses
40/10040/100
35/7535/90
35/7535/90
0/7035/80
0/750/90
Allowable Density (units/acre)TOD mixed-income dwellingMultiple-family dwelling
3515
5025
5025
3515
5025
Table A-3: Proposed Zoning Bulk Requirements

[Project Name]
4WARD PLANNING LLC
June 19, 2013
Page 36
Meriden TOD Study: Phase I Market Study
4WARD PLANNING LLC
June 21, 2013
Page 36
Proposed TOD Zoning
Overall, the proposed TOD Zoning for the development area is generally conducive to the market
expectations presented earlier. The following potential conflicts were identified:
Ground Floor Retail
TOD zoning typically encourages mixed-use buildings and specifically retail or commercial uses on ground
floors to promote an active neighborhood. This proposed zoning for Meriden is no different. Generally,
ground floor retail is encouraged and residential uses are prohibited on the ground floor in the Historic Sub-
District, according to Table 213-3 and Section M.3. As mentioned earlier, there is likely not sufficient market
demand for retail on the ground floor of all buildings for which it is encouraged. The City should continue to
encourage, but not require, ground floor retail in the proposed zoning. To ensure the best placement of
limited ground floor retail the City should consider only encouraging ground floor retail in a portion of the
Historic Sub-District, restricted to the downtown core. The nearly 28,000 square feet of retail proposed for
redevelopment at 24/38/44 Colony Street fulfills the anticipated retail demand.
Arts and Entertainment Uses
Section 7.g. (Special Permits) requires impact analyses for Indoor Arts, Recreation and Entertainment with a
gross leasable area equal to or greater than 40,000 square feet. Based on the market analysis, we believe
it is unlikely that the City will see arts, entertainment or indoor recreation uses of 40,000 square feet or
greater. However, there is no harm in having this condition in the zoning.
Source: PB; City of Meriden; 4ward Planning LLC 2013

ECONOMIC AND REAL ESTATE ANALYSIS FOR SUSTAINABLE LAND USE OUTCOMES ™ECONOMIC AND REAL ESTATE ANALYSIS FOR SUSTAINABLE LAND USE OUTCOMES ™
TOD Comparables and
Benchmarks
[Project Name]
4WARD PLANNING LLC
June 19, 2013
Page 38
Meriden TOD Study: Phase I Market Study
4WARD PLANNING LLC
June 21, 2013
Page 38
Methodology
Utilizing the Center for Transit-Oriented Development’s (CTOD) TOD Database for existing
transit stations within the greater New York region, we benchmarked key TOD metrics (i.e.
total population, TOD population, and median household income) for the half-mile area
around the proposed Meriden Transit Center. The TOD Study Area was then compared to
greater New York commuter rail station areas based on residential (housing units per acre)
and employment (jobs per acre) densities. We also examined the zoning regulations of the
other communities. Where possible, contact with key staff supplemented the findings. The
purpose of this analysis was to place existing and proposed densities into context of other
areas that function as TODs or have characteristics of TODs in similarly sized communities.
Extensive research has been performed on TOD throughout the Country. Accordingly, we
conducted a brief literature review to identify the commonly-accepted baseline densities for
transit-oriented development.

[Project Name]
4WARD PLANNING LLC
June 19, 2013
Page 39
Meriden TOD Study: Phase I Market Study
4WARD PLANNING LLC
June 21, 2013
Page 39
TOD Typologies
According to Reconnecting America and the CTOD’s TOD 202: Station Area Planning, How to Make Great
Transit-Oriented Places, there are eight TOD typologies shown in Chart A-1. With the proposed transit
connection, Meriden matches most closely the characteristics of a Transit Town Center, which is defined
as a local center of economic and community activity and served by commuter rail, bus or light rail. The
key features are described in Table A-4.
Source: Reconnecting America and CTOD, TOD 202: Station Area Planning, How to Make Great Transit-Oriented Places.
Table A-4: Transit Town Center Typology
Characteristics Local center of economic and community activity
Transit mode Commuter or light rail, local/regional bus hub
Peak transit frequency 15-30 minutes
Density Moderate
Land use mix Residential, commercial, employment and civic/cultural
Retail characteristics Community-serving and destination-retail; need for local-serving retail
Housing mix Mid-rise, low-rise, townhomes, small-lot single family
Total units target 3,000-7,500
Net Density 20-75 dwelling units/acre
Jobs Target 2,000-7,500
Minimum FAR 2.0 FAR
Chart A-1: TOD Typologies
Regional Center
Urban Center
Suburban Center
Transit Town Center
Urban Neighborhood
Transit Neighborhood
Special Use/Employment District
Mixed-Use Corridor

[Project Name]
4WARD PLANNING LLC
June 19, 2013
Page 40
Meriden TOD Study: Phase I Market Study
4WARD PLANNING LLC
June 21, 2013
Page 40
Residential Density Targets
Over the years, TOD literature has continued to demonstrate the relationship between land use and
transit ridership, suggesting minimum densities for encouraging the utilization of public transit
(Pushkarev & Zupan, 1977; Ewing, 1996; Frank & Pivo, 1994). In general, these minimum densities
depend on the type of transit service, and are applicable for the area within walking distance to the
station (i.e. half-mile walking radius).
Recent research indicates that a minimum density of 20 units per acre is necessary to provide
adequate transit ridership and support for retail and other non-residential uses within walkable
distances (US EPA, 2003; WRT, 2005). Furthermore, a United State Environmental Protection Agency
report finds that 30 units per acre supports high-frequency transit service (10-minute headways).
This research would confirm the residential density proposed for the Meriden TOD, which, currently,
is a proposed average of 35 dwelling units per acre.
Sources: US EPA, Creating Great Neighborhoods: Density in Your Community, 2003; WRT and Nelson/Nygaard, Transit-Oriented
Development Opportunities in Somerset County, NJ, 2005; 4ward Planning LLC, 2012

[Project Name]
4WARD PLANNING LLC
June 19, 2013
Page 41
Meriden TOD Study: Phase I Market Study
4WARD PLANNING LLC
June 21, 2013
Page 41
Commercial Density Targets
Less of the aforementioned research is focused on non-residential densities, as the emphasis has
been on TODs as mixed-use communities with office and retail uses supporting the residential
community. A decrease in single-occupancy vehicle travel is observed at relatively low densities of
between 20 and 50 employees per acre and employment density is believed to have a dramatic
impact on transit use at more than 75 employees per acre (Pivo and Frank, 1995).
While there is not significant research on retail and office land use square footage thresholds (by
building area), there is consensus that increasing commercial densities correlate to increased
transit ridership (Cervero, 2004; Lund, Cervero, Wilson, 2004).
Sources: CTOD, Transit-Oriented Development and Employment, 2011; 4ward Planning LLC, 2012

[Project Name]
4WARD PLANNING LLC
June 19, 2013
Page 42
Meriden TOD Study: Phase I Market Study
4WARD PLANNING LLC
June 21, 2013
Page 42
Case Studies: Comparison
4ward Planning conducted a review of New Jersey cities with transit stations, and of similar size and
character to Meriden. Density figures, provided by the Center for Transit-Oriented Development (CDOT)
TOD Database (displayed in Table A-5 below) show that residential density in similar communities ranges
from 7 units to 25 units per acre. Employment density ranges from 9 to 43 jobs per acre.
Source: Center for Transit-Oriented Development TOD Database; PB Report; Esri Community Analyst, 4ward Planning LLC, 2012
Meriden Existing Meriden Proposed New Brunswick NJ East Orange NJ Union City NJ Perth Amboy NJ
Overall Population 60,838 60,838 55,444 64,270 66,455 50,814
TOD (half-mile) Population 7,294 7,294 11,244 14,861 36,272 17,465
TOD (half-mile) MHI $23,5363 $23,5363 $56,276 $30,251 $39,320 $41,241
Gross Residential Density1 5.92 20 to 45 6.81 11.92 24.89 10.01
Net Residential Density2 10.29 20 to 45 13.94 15.27 25.35 12.46
Jobs per acre 7.44 n/a 42.26 8.95 11.50 12.29
Notes:
1 – Households per acre. Meriden Proposed references the numbers provided in the PB Report
2 – Households per residential acre. Meriden Proposed references the numbers provided in the PB Report
3 – 2012 data
4 – Estimated
Table A-5: Density Comparison

[Project Name]
4WARD PLANNING LLC
June 19, 2013
Page 43
Meriden TOD Study: Phase I Market Study
4WARD PLANNING LLC
June 21, 2013
Page 43
Case Studies: New Brunswick, NJ
The half-mile radius surrounding New Brunswick’s Amtrak station is primarily zoned C-4 Downtown
Commercial/Office District. This zoning designation promotes dense urban development with a focus on
non-vehicular modes of transportation. The C-4 also contains graduated density zoning, which encourages
adjacent property owners to work together to build better projects. New Brunswick uses Floor Area Ratio
(FAR) and other bulk requirements, and does not have density requirements. Residential density (not mixed-
use) is capped at 50 units per acre for a mid-rise apartments and 100 units per acre for high-rise
apartments, and requires a conditional use permit.
The City of New Brunswick was designated a “transit village” by NJ Transit, which provided the City with
priority funding to implement a transit-oriented downtown vision. The Gateway Transit village project, which
is directly adjacent to the train station, is complete.
Sources: City of New Brunswick, Bing Maps, 4ward Planning LLC, 2012
Min. Footprint (SF) AllowableFAR
(max.)
AllowableHeight (max.)
5,000 – 9,999 4 40
10,000 – 19,999 5 60
20,000 – 39,999 12 150
40,000 or higher 15 250
Table A-6: New Brunswick Bulk Requirements
Figure A-5: New Brunswick (NJ) Train Station Area

[Project Name]
4WARD PLANNING LLC
June 19, 2013
Page 44
Meriden TOD Study: Phase I Market Study
4WARD PLANNING LLC
June 21, 2013
Page 44
Case Studies: East Orange, NJ
In June 2011, the City of East Orange, NJ
adopted a Transit Village District (TVD)
overlay surrounding the Brick Church
transit station (one of two in town). East
Orange was recently designated a “transit
village” by NJ Transit, which provides the
City with priority funding to implement a
transit-oriented downtown vision.
Sources: City of East Orange, Bing Maps; 4ward Planning LLC, 2012
MF (up to 12 units)
GardenApartment
High-Rise MF
Office or Mixed-
Use (O/R)
Comm. or Mixed-
Use (C/R)
Lot size (sf) 8,000 30,000 ½ acre ½ acre 1,000
Maximum height (ft) 55 35 - - 651
Maximum height (stories)
5 3 15 15 7
Maximum dwelling units / acre
52 52 100 100 100
1 Up to an additional 25 feet with 10 foot minimum stepback.
Table A-7: East Orange Bulk Requirements
Figure A-6: Brick Church (East Orange NJ) Train Station
Four mixed-use developments are in various
stages in the Brick Church transit village area,
amounting to more than 400 new housing units
and 60,000 square feet of commercial. With
projects ranging from 7 to 15 stories, the City
attributes this influx of redevelopment to the
generous height limits in the TVD as well as low
rents compared to neighboring areas. These
heights exceed that desired or expected in
Meriden’s TOD area.

[Project Name]
4WARD PLANNING LLC
June 19, 2013
Page 45
Meriden TOD Study: Phase I Market Study
4WARD PLANNING LLC
June 21, 2013
Page 45
Case Studies: Perth Amboy, NJ
The half-mile radius surrounding Perth Amboy’s Amtrak
station is zoned C-1 Neighborhood Business, C-2 Central
Business, R-25 Residential (single-family detached) and
R-M(M) Residential (mid-rise multi-family). The City does
not have special transit-oriented zoning to guide
development around it’s transit station.
Perth Amboy has been designated a “transit village” by
NJ Transit, which provides the City with priority funding
to implement a transit-oriented downtown vision.
Sources: City of Perth Amboy, Bing Maps; 4ward Planning LLC, 2012
R-25 R-M(M) C-1 C-2
Lot size (sf) 2,500 40,000 2,500 5,000
Maximum height (ft) 28 40 35 85
Maximum height (stories)
2 4 2.5 7
Maximum lot coverage 40% 40% 50% 80%
Maximum impervious coverage
50% 70% 85% 95%
Maximum dwelling units / acre
12 25 n/a n/a
Maximum dwelling units / building
2 24 n/a n/a
Table A-8: Perth Amboy Bulk Requirements
Figure A-7: Perth Amboy (NJ) Train Station

ECONOMIC AND REAL ESTATE ANALYSIS FOR SUSTAINABLE LAND USE OUTCOMES ™ECONOMIC AND REAL ESTATE ANALYSIS FOR SUSTAINABLE LAND USE OUTCOMES ™
SOCIO-ECONOMIC, LABOR &
INDUSTRY EVALUATION

ECONOMIC AND REAL ESTATE ANALYSIS FOR SUSTAINABLE LAND USE OUTCOMES ™ECONOMIC AND REAL ESTATE ANALYSIS FOR SUSTAINABLE LAND USE OUTCOMES ™
Socio-Economic Trends Analysis

[Project Name]
4WARD PLANNING LLC
June 19, 2013
Page 48
Meriden TOD Study: Phase I Market Study
4WARD PLANNING LLC
June 21, 2013
Page 48
Glossary of Terms
Household Population Household population, as compared to total population, excludes persons living in dormitories, penal
facilities, hospitals, and other institutional settings.
Family A family is a group of two or more people (one of whom is the householder) related by birth, marriage, or adoption
and residing together; all such people are considered as members of one family. The number of families is equal to the
number of family households; however, the count of family members differs from the count of family household members
because family household members include any non-relatives living in the household.
Non-Family A non-family household consists of a householder living alone (a one-person household) or where the
householder shares the home exclusively with people to whom he/she is not related.
Household A household consists of all the people who occupy a housing unit. A house, an apartment or other group of
rooms, or a single room, is regarded as a housing unit when it is occupied or intended for occupancy as separate living
quarters. The count of households excludes group quarters and institutions.
Metropolitan Statistical Area (MSA) Metropolitan Statistical Areas (metro areas) are geographic entities defined by the
Office of Management and Budget. A metro area contains a core urban area of 50,000 or more population. Each metro or
micro area consists of one or more counties and includes the counties containing the core urban area, as well as any
adjacent counties that have a high degree of social and economic integration (as measured by commuting to work) with the
urban core.
Source: US Census Bureau
[Project Name]
4WARD PLANNING LLC
June 19, 2013
Page 49
Meriden TOD Study: Phase I Market Study
4WARD PLANNING LLC
June 21, 2013
Page 49
Methodology
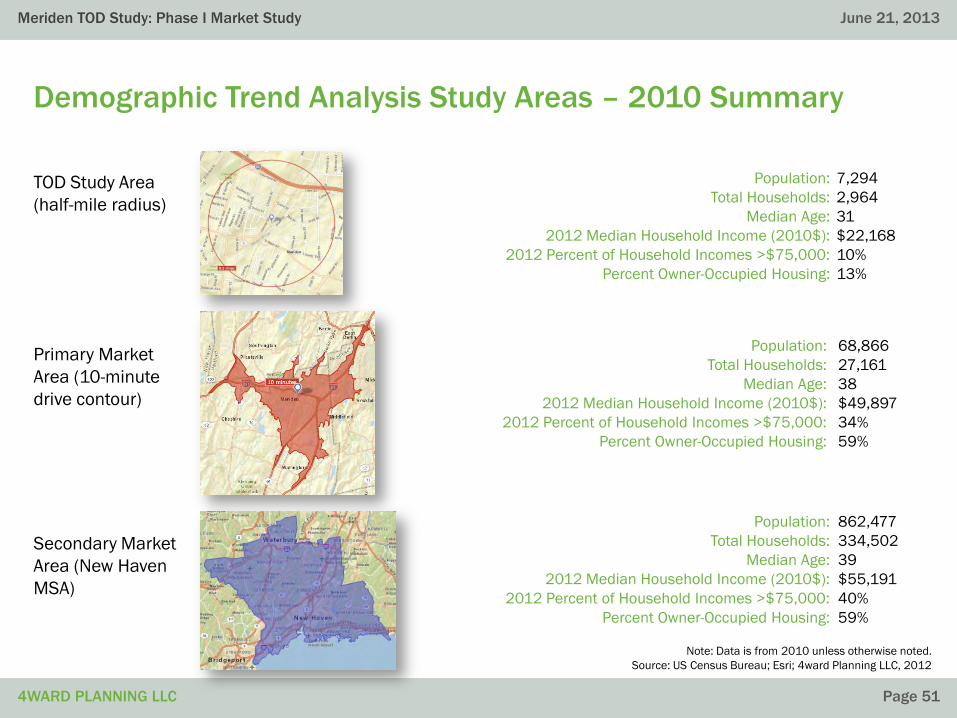
4ward Planning LLC conducted an examination of socio-economic trends (for 2010, 2012 and
2017) in the geographies surrounding the City of Meriden’s Transit Center in support of the
Transit-Oriented Development (TOD) Market Study and Financial Feasibility Analysis. The
geographic areas studied include:
• The Base Area, which is the traditional TOD half-mile radii from the Meriden Transit
Center (MTC);
• The Primary Market Area (PMA), classified as a 10-minute drive-time contour (approximately
a 5-mile contour) from the MTC and typically representing the catchment area where 70
percent or more of consumer patronage originates; and
• The Secondary Market Area (SMA), classified as the New Haven-Milford CT Metropolitan
Statistical Area (MSA), which represents the relatively large catchment area from which the
TOD could prospectively compete for new residents and businesses.
The analysis and recommendations that follow are based on a combination of quantitative and
qualitative techniques. Quantitative analysis was underpinned by a combination of public and
proprietary data sources, including U.S. Census-based data and Esri’s Community Analyst
software — a socio-economic data analysis tool. Estimated and projected socio-economic trends
examined included population and household growth, formation of family and non-family
households, household income, residential tenure, educational attainment and age cohort
characteristics, and consumer expenditure estimates.

[Project Name]
4WARD PLANNING LLC
June 19, 2013
Page 50
Meriden TOD Study: Phase I Market Study
4WARD PLANNING LLC
June 21, 2013
Page 50
Key Findings: Demographics
Flat population and household growth
The Meriden TOD Study Area, PMA and MSA all exhibited flat growth in population and households between 2010 and 2012,
with these trends projected to continue through 2017. This is particularly true for the demographic segment (persons between
the ages of 25 and 54) which tends to utilize transit most often.
Rise in non-family householdsConsistent with national and regional trends, non-family households are growing faster than family households (which are
experiencing decline) in all geographies examined. This finding is particularly informative for prospective TOD activity, as
non-family households represent the greatest demand for small rental housing units – the types of units which would be
developed close-in to the Meriden transit station.
More than 28,000
The number of adult persons 25 to 54 years of age and older, projected to live within 10-minutes of the Meriden Station in 2017.
This age segment has the highest incidence of transit ridership among all adult persons 25-years of age and older and
represents nearly six in ten adult persons 25-years and older within the primary market area.
$100,000 to $300,000
The residential price point that will be affordable to approximately 50 percent of the potential future market, projected to
have incomes ranging from $35,000 to $99,000 per year in 2017 and exhibiting a great influence on the price of future
housing.
[Project Name]
4WARD PLANNING LLC
June 19, 2013
Page 51
Meriden TOD Study: Phase I Market Study
4WARD PLANNING LLC
June 21, 2013
Page 51
Demographic Trend Analysis Study Areas – 2010 Summary
Primary Market
Area (10-minute
drive contour)
Secondary Market
Area (New Haven
MSA)
Note: Data is from 2010 unless otherwise noted.
Source: US Census Bureau; Esri; 4ward Planning LLC, 2012
Population: 7,294
Total Households: 2,964
Median Age: 31
2012 Median Household Income (2010$): $22,168
2012 Percent of Household Incomes >$75,000: 10%
Percent Owner-Occupied Housing: 13%
Population: 68,866
Total Households: 27,161
Median Age: 38
2012 Median Household Income (2010$): $49,897
2012 Percent of Household Incomes >$75,000: 34%
Percent Owner-Occupied Housing: 59%
Population: 862,477
Total Households: 334,502
Median Age: 39
2012 Median Household Income (2010$): $55,191
2012 Percent of Household Incomes >$75,000: 40%
Percent Owner-Occupied Housing: 59%
TOD Study Area
(half-mile radius)
[Project Name]
4WARD PLANNING LLC
June 19, 2013
Page 52
Meriden TOD Study: Phase I Market Study
4WARD PLANNING LLC
June 21, 2013
Page 52
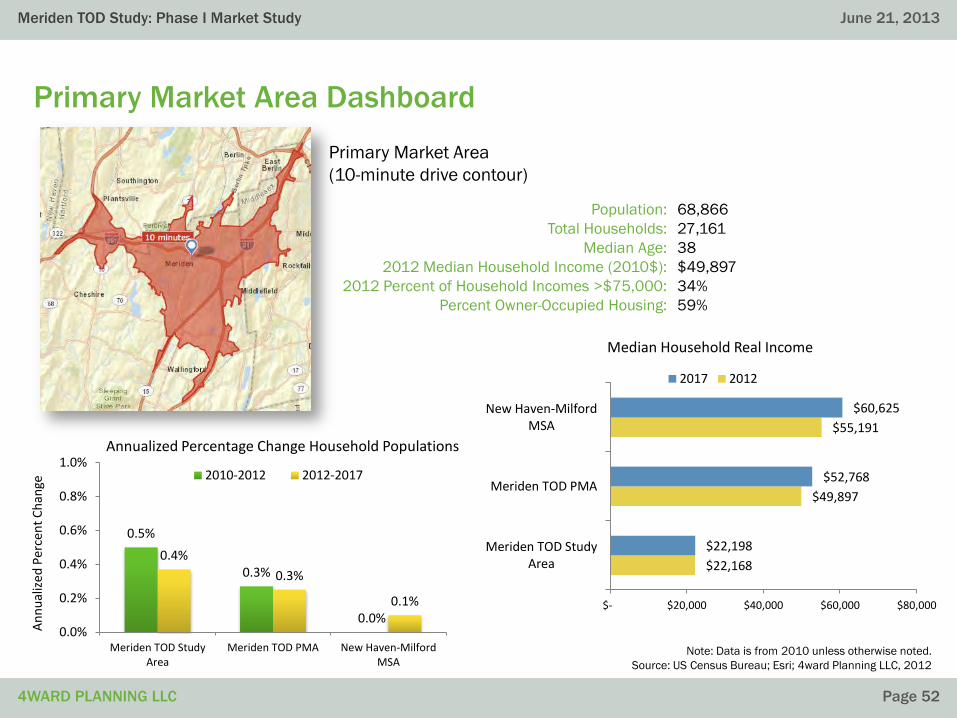
Primary Market Area Dashboard
Primary Market Area
(10-minute drive contour)
Note: Data is from 2010 unless otherwise noted.
Source: US Census Bureau; Esri; 4ward Planning LLC, 2012
Population: 68,866
Total Households: 27,161
Median Age: 38
2012 Median Household Income (2010$): $49,897
2012 Percent of Household Incomes >$75,000: 34%
Percent Owner-Occupied Housing: 59%
0.5%
0.3%
0.0%
0.4%
0.3%
0.1%
0.0%
0.2%
0.4%
0.6%
0.8%
1.0%
Meriden TOD StudyArea
Meriden TOD PMA New Haven-MilfordMSA
An
nu
aliz
ed
Per
cen
t C
han
ge
Annualized Percentage Change Household Populations
2010-2012 2012-2017
$22,168
$49,897
$55,191
$22,198
$52,768
$60,625
$- $20,000 $40,000 $60,000 $80,000
Meriden TOD StudyArea
Meriden TOD PMA
New Haven-MilfordMSA
Median Household Real Income
2017 2012

[Project Name]
4WARD PLANNING LLC
June 19, 2013
Page 53
Meriden TOD Study: Phase I Market Study
4WARD PLANNING LLC
June 21, 2013
Page 53
0.5%
0.3%
0.0%
0.4%
0.3% 0.1%
0.0%
0.1%
0.2%
0.3%
0.4%
0.5%
0.6%
0.7%
0.8%
0.9%
1.0%
Meriden TOD Study Area Meriden TOD PMA New Haven-Milford MSA
An
nu
aliz
ed P
erce
nt
Ch
ange
Figure B-1: Annualized Percentage Change Household Populations
2010-2012 2012-2017
Household Population
Figure B-1 illustrates that household population growth within all three geographies studied was effectively
flat over the 2010 to 2012 period – owing largely to declining in-migration and fewer births. Household
population growth is expected to remain flat through 2017. At the end of 2012, the primary market area’s
household population was nearly 68,000 persons – 47,244 (69.5 percent) of whom were 25 years of age
or older. By 2017, the primary market area is projected to have nearly 69,000 persons – 48,143 (68.6
percent) of whom will be 25 years of age and older. This nearby household population base represents a
modest sized primary market from which to draw prospective TOD residential customers.
Source: US Census Bureau; Esri; 4ward Planning LLC, 2012
Household Population 2012
Household Population 2017
[Project Name]
4WARD PLANNING LLC
June 19, 2013
Page 54
Meriden TOD Study: Phase I Market Study
4WARD PLANNING LLC
June 21, 2013
Page 54
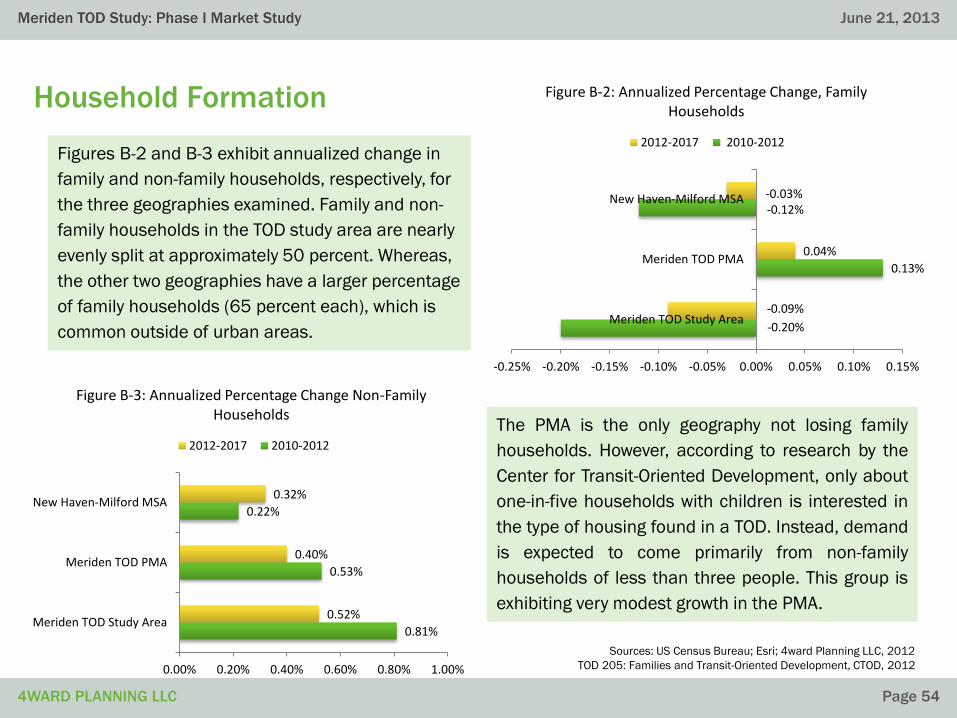
0.81%
0.53%
0.22%
0.52%
0.40%
0.32%
0.00% 0.20% 0.40% 0.60% 0.80% 1.00%
Meriden TOD Study Area
Meriden TOD PMA
New Haven-Milford MSA
Figure B-3: Annualized Percentage Change Non-Family Households
2012-2017 2010-2012
Household Formation
Figures B-2 and B-3 exhibit annualized change in
family and non-family households, respectively, for
the three geographies examined. Family and non-
family households in the TOD study area are nearly
evenly split at approximately 50 percent. Whereas,
the other two geographies have a larger percentage
of family households (65 percent each), which is
common outside of urban areas.
Sources: US Census Bureau; Esri; 4ward Planning LLC, 2012
TOD 205: Families and Transit-Oriented Development, CTOD, 2012
The PMA is the only geography not losing family
households. However, according to research by the
Center for Transit-Oriented Development, only about
one-in-five households with children is interested in
the type of housing found in a TOD. Instead, demand
is expected to come primarily from non-family
households of less than three people. This group is
exhibiting very modest growth in the PMA.
-0.20%
0.13%
-0.12%
-0.09%
0.04%
-0.03%
-0.25% -0.20% -0.15% -0.10% -0.05% 0.00% 0.05% 0.10% 0.15%
Meriden TOD Study Area
Meriden TOD PMA
New Haven-Milford MSA
Figure B-2: Annualized Percentage Change, Family Households
2012-2017 2010-2012
[Project Name]
4WARD PLANNING LLC
June 19, 2013
Page 55
Meriden TOD Study: Phase I Market Study
4WARD PLANNING LLC
June 21, 2013
Page 55
Age
Table B-1: Population Age Trends
Meriden TOD Study Area Percentage Change2010 2012 2017 2010-2012 2012-2017
Total Population 7,294 100.0% 7,380 100.0% 7,519 100.0% 1.2% 1.9%Pre-School-Age Children 605 8.3% 613 8.3% 632 8.4% 1.2% 3.1%
Grade School-Age Children 1,225 16.8% 1,232 16.7% 1,263 16.8% 0.6% 2.5%High School and College-Age 1,131 15.5% 1,137 15.4% 1,090 14.5% 0.5% -4.1%
Young Workers and Grads 1,152 15.8% 1,181 16.0% 1,218 16.2% 2.5% 3.2%Early Stage Families 963 13.2% 945 12.8% 947 12.6% -1.9% 0.3%Late Stage Families 883 12.1% 871 11.8% 827 11.0% -1.3% -5.0%
Young Empty Nesters 635 8.7% 672 9.1% 714 9.5% 5.8% 6.4%Older Empty Nesters 387 5.3% 413 5.6% 496 6.6% 6.9% 20.1%
Mostly Retired 306 4.2% 303 4.1% 323 4.3% -1.2% 6.9%
Median age 31years 31years 31years 0.3% 1.3%
Meriden TOD PMA Percentage Change2010 2012 2017 2010-2012 2012-2017
Total Population 68,866 100.0% 69,268 100.0% 69,878 100.0% 0.6% 0.9%Age < 5 yrs Pre-School-Age Children 4,476 6.5% 4,502 6.5% 4,542 6.5% 0.6% 0.9%
Age 5-14 yrs Grade School-Age Children 8,953 13.0% 8,797 12.7% 8,944 12.8% -1.7% 1.7%Age 15-24 yrs High School and College-Age 8,815 12.8% 8,659 12.5% 8,246 11.8% -1.8% -4.8%Age 25-34 yrs Young Workers and Grads 9,228 13.4% 9,490 13.7% 9,643 13.8% 2.8% 1.6%Age 35-44 yrs Early Stage Families 9,435 13.7% 9,213 13.3% 9,084 13.0% -2.4% -1.4%Age 45-54 yrs Late Stage Families 10,674 15.5% 10,390 15.0% 9,643 13.8% -2.7% -7.2%Age 55-64 yrs Young Empty Nesters 8,402 12.2% 8,797 12.7% 9,294 13.3% 4.7% 5.7%Age 65-74 yrs Older Empty Nesters 4,407 6.4% 4,710 6.8% 5,660 8.1% 6.9% 20.2%
Age 75+ yrs Mostly Retired 4,545 6.6% 4,641 6.7% 4,822 6.9% 2.1% 3.9%
Median age 38years 39years 39years 0.8% 0.8%
New Haven-Milford MSA Percentage Change2010 2012 2017 2010-2012 2012-2017
Total Population 862,477 100.0% 862,521 100.0% 866,067 100.0% 0.0% 0.4%Pre-School-Age Children 48,299 5.6% 48,301 5.6% 48,500 5.6% 0.0% 0.4%
Grade School-Age Children 107,810 12.5% 106,953 12.4% 107,392 12.4% -0.8% 0.4%High School and College-Age 121,609 14.1% 119,890 13.9% 113,455 13.1% -1.4% -5.4%
Young Workers and Grads 107,810 12.5% 109,540 12.7% 110,857 12.8% 1.6% 1.2%Early Stage Families 113,847 13.2% 111,265 12.9% 108,258 12.5% -2.3% -2.7%Late Stage Families 132,821 15.4% 128,516 14.9% 118,651 13.7% -3.2% -7.7%
Young Empty Nesters 105,222 12.2% 109,540 12.7% 114,321 13.2% 4.1% 4.4%Older Empty Nesters 60,373 7.0% 64,689 7.5% 77,080 8.9% 7.2% 19.2%
Mostly Retired 63,823 7.4% 63,827 7.4% 66,687 7.7% 0.0% 4.5%
Median age 39years 40years 40years 1.0% 0.8%
Source: US Census Bureau, Esri Community Analyst; 4ward Planning LLC, 2012
Research indicates
that these three
highlighted age
cohorts have the
highest incidence of
transit use.
Source: American Public
Transportation Association, Public
Profile of Transit Ridership, 2007
These age segments represent nearly
60 percent of the adult population…
…but families are projected to
decrease in population.
This age group has
experienced strong
growth, especially
the older cohort.
[Project Name]
4WARD PLANNING LLC
June 19, 2013
Page 56
Meriden TOD Study: Phase I Market Study
4WARD PLANNING LLC
June 21, 2013
Page 56
Age of the Population
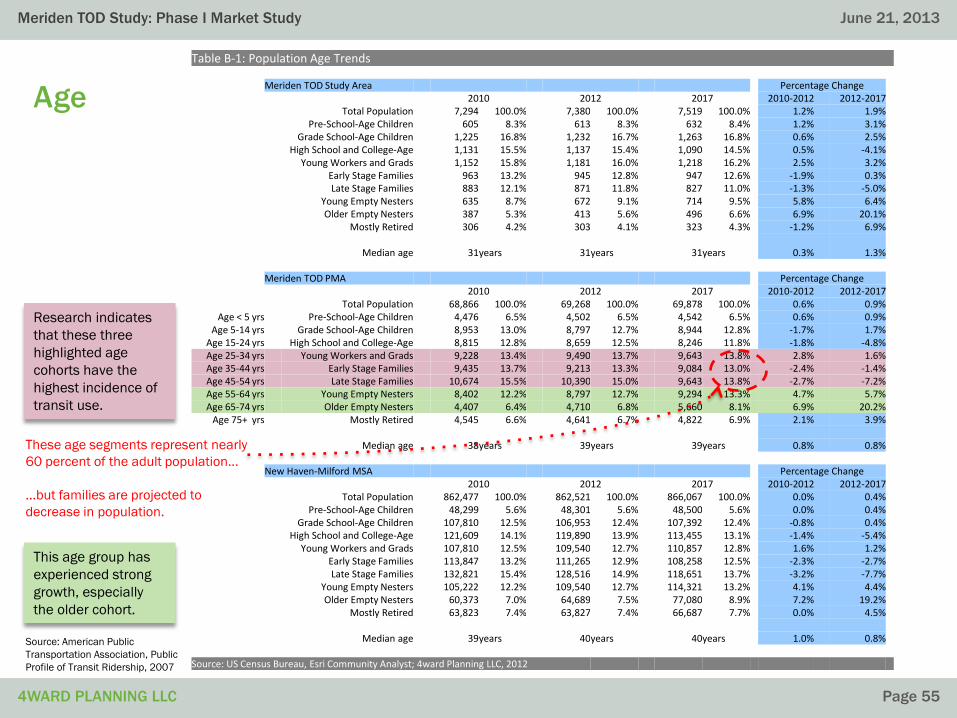
Table B-1 exhibits population trends by age group for all three geographies examined, covering the 2010
to 2017 period (estimates and projections).
As highlighted on the previous page, those age groups shown to use transit the most (ages 25-34, 35-
44, and 45-54) will represent nearly 60 percent (28,370 persons) of all adult persons 25 and older in
the PMA. However, these age cohorts have been exhibiting flat to negative growth, as indicated in the
right hand columns of Table B-1. While this prime market segment for TOD is projected to decrease,
modestly, over the next five plus years resulting in greater competition in the PMA for the target
audience, other markets are growing.
Table B-1 also shows that Empty Nesters (ages 55-64 and 65-74) exhibited weak to strong positive
growth through 2012 and are projected to continue to increase their share of the total population
through 2017. In fact, older empty nesters are projected to increase by 20 percent in the five-year period.
While they may not use transit the most, this age cohort has shown an interest in downsizing and moving
to urban areas with amenities available in the immediate area or by transit. They also tend to have
greater discretionary income than young workers or families.
[Project Name]
4WARD PLANNING LLC
June 19, 2013
Page 57
Meriden TOD Study: Phase I Market Study
4WARD PLANNING LLC
June 21, 2013
Page 57
0.0%
2.0%
4.0%
6.0%
8.0%
10.0%
12.0%
14.0%
16.0%
18.0%
Young Workers and
Grads
Early Stage Families Late Stage Families Young Empty Nesters Older Empty Nesters Mostly Retired
Figure B-4: PMA, Percent of Adult Population by Age Cohort 2010 2012 2017
Near-Term
Demand
Near-Term
Demand
55 to 64 65 to 74 75 +
Age of the Population
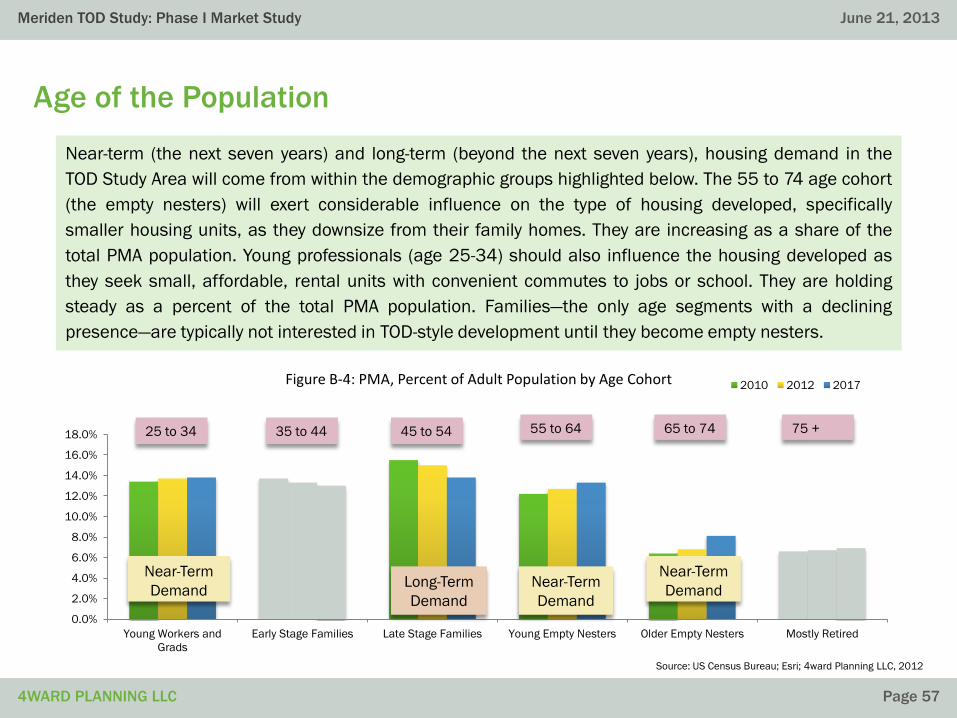
Near-term (the next seven years) and long-term (beyond the next seven years), housing demand in the
TOD Study Area will come from within the demographic groups highlighted below. The 55 to 74 age cohort
(the empty nesters) will exert considerable influence on the type of housing developed, specifically
smaller housing units, as they downsize from their family homes. They are increasing as a share of the
total PMA population. Young professionals (age 25-34) should also influence the housing developed as
they seek small, affordable, rental units with convenient commutes to jobs or school. They are holding
steady as a percent of the total PMA population. Families—the only age segments with a declining
presence—are typically not interested in TOD-style development until they become empty nesters.
Near-Term
Demand
Long-Term
Demand
Source: US Census Bureau; Esri; 4ward Planning LLC, 2012
25 to 34 35 to 44 45 to 54

[Project Name]
4WARD PLANNING LLC
June 19, 2013
Page 58
Meriden TOD Study: Phase I Market Study
4WARD PLANNING LLC
June 21, 2013
Page 58
Housing Ownership Trends
Figures B-5 and B-6, below, illustrate the study area’s relatively high current percentage share of renter-
occupied housing units, when compared to the two larger geographies1. The relatively high number of
renter-occupied units is a common trend in urban areas, but may also be related to the high
concentration of subsidized housing in the area and generally depressed real estate values. The figures
also show that housing tenure has and will continue to hold steady across all geographies. The empty
nesters currently living in the PMA are a primary source of demand; they are typically interested in home
ownership. To meet this demand, the percentage of owned-housing units will need to increase in the TOD
Study Area.
Source: US Census Bureau; Esri; 4ward Planning LLC, 2012
13%
59% 59%
13%
58% 58%
13%
58% 58%
0%
10%
20%
30%
40%
50%
60%
70%
80%
90%
100%
Meriden TOD Study Area Meriden TOD PMA New Haven-Milford MSA
Per
cen
t o
f To
tal H
ou
sin
g U
nit
s
Figure B-5: Owned Housing Units
2010 2012 2017
75%
34% 34%
76%
35% 34%
75%
34% 34%
0%
10%
20%
30%
40%
50%
60%
70%
80%
90%
100%
Meriden TOD Study Area Meriden TOD PMA New Haven-Milford MSA
Per
cen
t o
f To
tal H
ou
sin
g U
nit
s
Figure B-6: Rented Housing Units
2010 2012 2017
1The percentage of vacant homes, about 11.6 percent in each geography, is not shown.
[Project Name]
4WARD PLANNING LLC
June 19, 2013
Page 59
Meriden TOD Study: Phase I Market Study
4WARD PLANNING LLC
June 21, 2013
Page 59
Table B-2: Household Income Trends
Meriden TOD Study Area Percentage Change2012 2017 2012-2017
Total Households 2,981 100.0% 3,012 100.0% 1.0%< $35,000 1,953 65.5% 1,883 62.5% -3.6%
$35K to $74.9K 731 24.5% 715 23.7% -2.2%$75K to $99.9K 118 4.0% 175 5.8% 48.3%
$100K to $149.9K 113 3.8% 152 5.0% 34.5%>$149.9K 66 2.2% 86 2.9% 30.3%
Median household income $23,536 $25,783 9.5%Median household income (2010 dollars) $22,168 $22,198 0.1%
Meriden TOD PMA Percentage Change2012 2017 2012-2017
Total Households 27,305 100.0% 27,535 100.0% 0.8%< $35,000 8,715 31.9% 7,823 28.4% -10.2%
$35K to $74.9K 9,260 33.9% 8,053 29.2% -13.0%$75K to $99.9K 3,530 12.9% 4,782 17.4% 35.5%
$100K to $149.9K 3,977 14.6% 4,627 16.8% 16.3%>$149.9K 1,823 6.7% 2,249 8.2% 23.4%
Median household income $52,977 $61,291 15.7%Median household income (2010 dollars) $49,897 $52,768 5.8%
New Haven-Milford MSA Percentage Change2012 2017 2012-2017
Total Households 334,500 100.0% 336,102 100.0% 0.5%< $35,000 98,837 29.5% 88,090 26.2% -10.9%
$35K to $74.9K 101,836 30.4% 87,073 25.9% -14.5%$75K to $99.9K 39,950 11.9% 52,754 15.7% 32.1%
$100K to $149.9K 56,312 16.8% 63,627 18.9% 13.0%>$149.9K 37,565 11.2% 44,558 13.3% 18.6%
Median household income $58,598 $70,418 20.2%Median household income (2010 dollars) $55,191 $60,625 9.9%
Source: US Census Bureau, Esri Community Analyst; 4ward Planning LLC, 2012
Household Income
…these area
household income
groups serve as
strong potential to
influence the study
area’s long-term
land investments.
While current
household income
within this study area
is relatively low…
[Project Name]
4WARD PLANNING LLC
June 19, 2013
Page 60
Meriden TOD Study: Phase I Market Study
4WARD PLANNING LLC
June 21, 2013
Page 60
Household Income
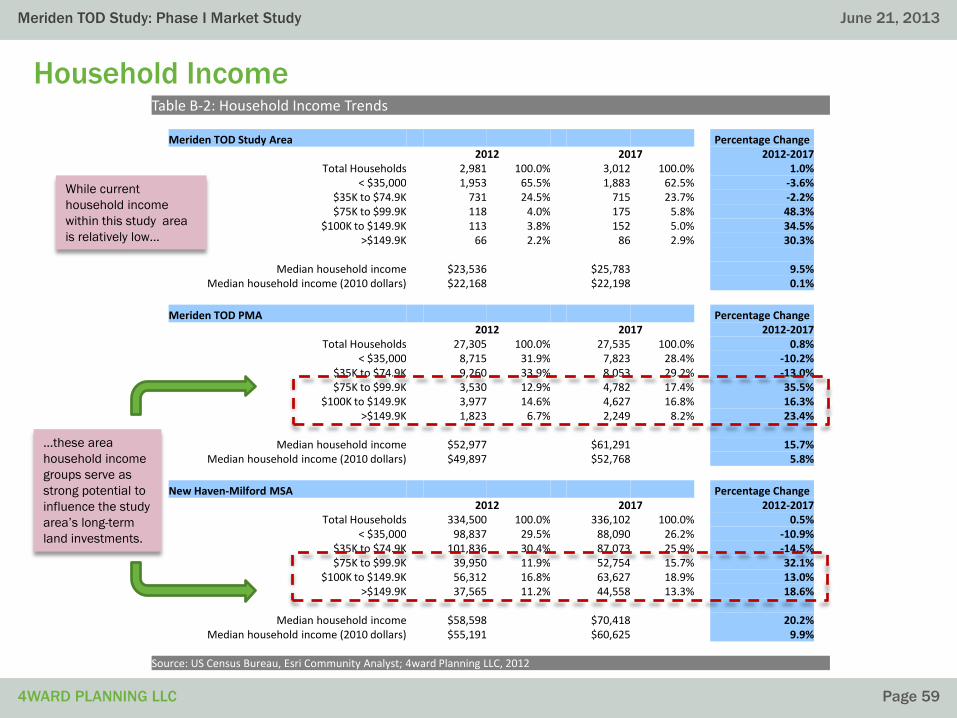
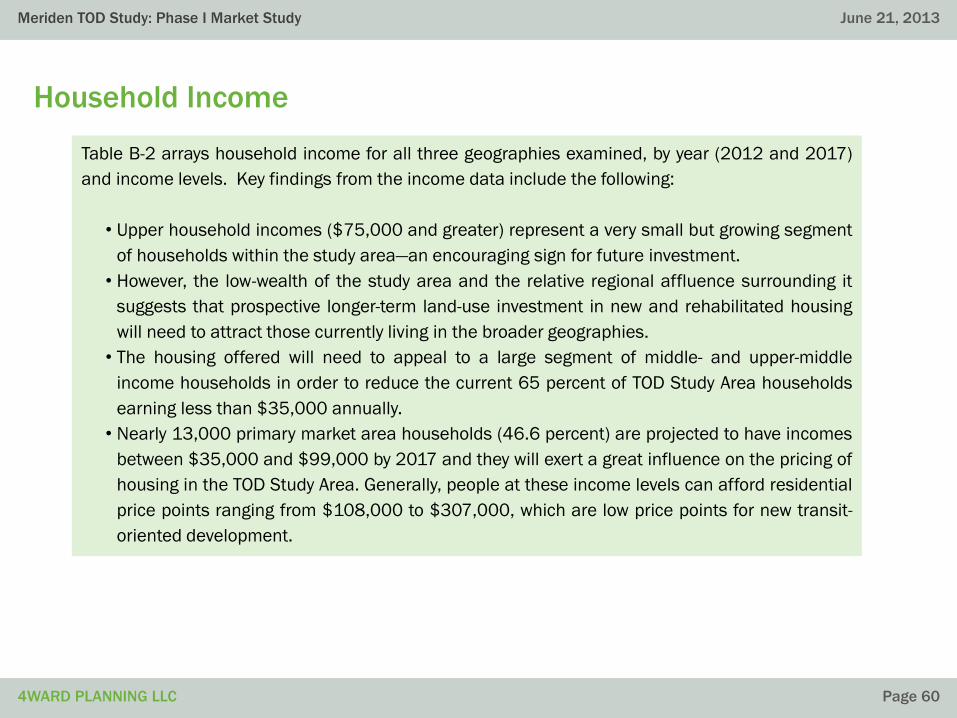
Table B-2 arrays household income for all three geographies examined, by year (2012 and 2017)
and income levels. Key findings from the income data include the following:
• Upper household incomes ($75,000 and greater) represent a very small but growing segment
of households within the study area—an encouraging sign for future investment.
• However, the low-wealth of the study area and the relative regional affluence surrounding it
suggests that prospective longer-term land-use investment in new and rehabilitated housing
will need to attract those currently living in the broader geographies.
• The housing offered will need to appeal to a large segment of middle- and upper-middle
income households in order to reduce the current 65 percent of TOD Study Area households
earning less than $35,000 annually.
• Nearly 13,000 primary market area households (46.6 percent) are projected to have incomes
between $35,000 and $99,000 by 2017 and they will exert a great influence on the pricing of
housing in the TOD Study Area. Generally, people at these income levels can afford residential
price points ranging from $108,000 to $307,000, which are low price points for new transit-
oriented development.
[Project Name]
4WARD PLANNING LLC
June 19, 2013
Page 61
Meriden TOD Study: Phase I Market Study
4WARD PLANNING LLC
June 21, 2013
Page 61
Consumer Expenditures
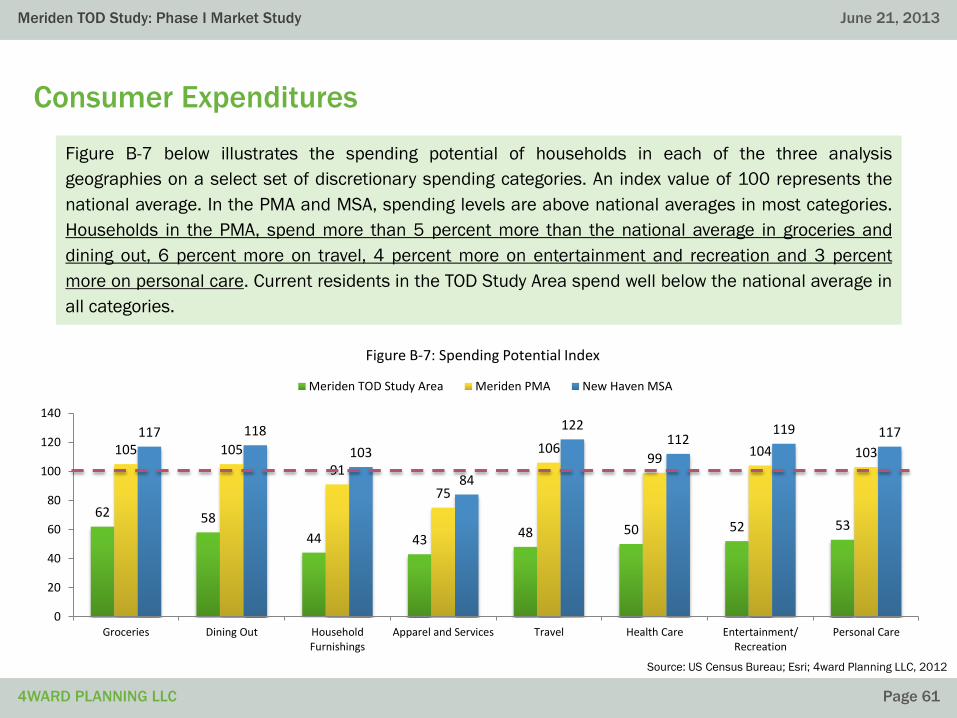
Figure B-7 below illustrates the spending potential of households in each of the three analysis
geographies on a select set of discretionary spending categories. An index value of 100 represents the
national average. In the PMA and MSA, spending levels are above national averages in most categories.
Households in the PMA, spend more than 5 percent more than the national average in groceries and
dining out, 6 percent more on travel, 4 percent more on entertainment and recreation and 3 percent
more on personal care. Current residents in the TOD Study Area spend well below the national average in
all categories.
Source: US Census Bureau; Esri; 4ward Planning LLC, 2012
62 58
44 43 48 50 52 53
105 105
91
75
10699 104 103
117 118
103
84
122112
119 117
0
20
40
60
80
100
120
140
Groceries Dining Out HouseholdFurnishings
Apparel and Services Travel Health Care Entertainment/Recreation
Personal Care
Figure B-7: Spending Potential Index
Meriden TOD Study Area Meriden PMA New Haven MSA

[Project Name]
4WARD PLANNING LLC
June 19, 2013
Page 62
Meriden TOD Study: Phase I Market Study
4WARD PLANNING LLC
June 21, 2013
Page 62
Takeaway: Demographics
The preceding analysis of socio-economic trends for the study area and the primary and secondary
markets of the City of Meriden Transit Center provides insight into the how the population and housing
characteristics of the area will support proposed new development in Meriden. The initial market for the
project will not be driven by current residents in the TOD Study Area (the half-mile radius of the transit
center) who are primarily of low incomes. Instead, the primary, near-term demand will be driven by two
age cohorts currently living in the primary market area (the 10-mile radius from the transit center site).
1. First, the young workers and graduates (age 25-34), who will represent the largest share of the total PMA 2017
population and exhibit flat growth. They are interested in small, multi-family, affordable rental or home ownership
units in an urban setting with a convenient commute to major employers or educational institutions.
2. Second, the empty nesters (55 to 74) represent the fastest growing segment of the PMA population and the near-
term demand for housing. This cohort is downsizing and looking for small, homeownership units with access to jobs,
entertainment, and other amenities. They also tend to have higher disposable incomes.
Higher relative incomes in the primary market area will be advantageous to future development. However,
development will need to overcome the hurdle created by the currently low-values and low-incomes in the
study area. Future development around the transit station will need to offer significant value and quality
to attract future residents.

ECONOMIC AND REAL ESTATE ANALYSIS FOR SUSTAINABLE LAND USE OUTCOMES ™ECONOMIC AND REAL ESTATE ANALYSIS FOR SUSTAINABLE LAND USE OUTCOMES ™
Labor & Industry Analysis

[Project Name]
4WARD PLANNING LLC
June 19, 2013
Page 64
Meriden TOD Study: Phase I Market Study
4WARD PLANNING LLC
June 21, 2013
Page 64
Methodology
As part of the Meriden TOD Market Analysis, 4ward Planning LLC conducted an
examination of labor and industry trends (for 2006, 2008 and 2010) in the geographies
surrounding Meriden. Three study areas were analyzed:
• Primary Market Area (PMA), defined as the 10-minute drive contour from Meriden
Station
• New Haven-Milford Metropolitan Statistical Area (MSA)
• The State of Connecticut
Labor data was gathered from the U.S. Census Bureau’s On The Map data server. Work
area analysis was performed for the most recent available years.
In addition, the areas near stations along the proposed New Haven-Hartford-Springfield
(NHHS) rail line were analyzed with regard to industry trends.
[Project Name]
4WARD PLANNING LLC
June 19, 2013
Page 65
Meriden TOD Study: Phase I Market Study
4WARD PLANNING LLC
June 21, 2013
Page 65
Key Findings: Labor & Industry
46 percent
Nearly half (46 percent) of all primary jobs in the Meriden PMA (10-minute drive contour) are in the top three
industries in the area, Health Care, Manufacturing and Retail. Of these, only the Health Care industry is
growing, the estimate rate of growth is 2.5 percent per year through 2018.
138,620 jobsThe number of primary jobs as of 2010 located within one mile of the train stations in the Meriden
commuting shed (a 40-minute one-way travel time once the new rail service is operational). This
indicates a significant pool of potential future residents of the Meriden TOD who could then commute to
work by transit, alone. In addition, the industries near the rail stations employ the types of workers who
tend to live in urban areas and prefer mass transit more so than the broader workforce.
34,835 commuters
The number of workers with primary jobs in the Meriden PMA who commuted into the area in 2010. This
number represents more than half of all the people who either live or work in the PMA, up two percent from
2006. This indicates a relatively sizeable potential pent-up demand for housing in the area, since it would be
expected that a small portion of these workers (five percent) would be willing to shorten their commute, if they
had more appealing housing choices closer to their workplace.

[Project Name]
4WARD PLANNING LLC
June 19, 2013
Page 66
Meriden TOD Study: Phase I Market Study
4WARD PLANNING LLC
June 21, 2013
Page 66
New Haven-Milford
MSA
Source: US Census Bureau; Esri; 4ward Planning LLC, 2012
Total Primary Jobs: 326,626
Total Primary Jobs: 1,457,513
Study Areas – Labor & Industry Trend Analysis – 2009 Summary
Connecticut
PMATotal Primary Jobs: 43,740

[Project Name]
4WARD PLANNING LLC
June 19, 2013
Page 67
Meriden TOD Study: Phase I Market Study
4WARD PLANNING LLC
June 21, 2013
Page 67
14%
17%
13%
8%
6% 6%
15%
16%
13%
8%
7%6%
16%16%
14%
9%
7%
5%
0%
2%
4%
6%
8%
10%
12%
14%
16%
18%
Health Care and Social
Assistance
Manufacturing Retail Trade Wholesale Trade Accommodation and Food
Services
Administration & Support,
Waste Management and
Remediation
Pe
rce
nt
of
To
tal P
rim
ary
Jo
bs
Figure B-8: PMA Top Six Industries by Percent of Total Employment2006
2008
2010
Top Six Industries by Employment: PMA
Over the 2006 to 2010 period, the PMA featured an average annual primary job base of 43,740 primary jobs (while
an individual may hold more than one job, a primary job is considered that job which pays most in wages or salary). In
2010, the three leading industries in this region, by employment, each held between a 14- and 16-percent share of
total employment—combining for nearly half of the employment in the region. The Health Care and Education industry
experienced slight growth in this timeframe, while the Manufacturing industry shrank slightly and the Retail Trade
industry remained level. Among the three remaining categories, the Administration & Support industry shrank slightly
while growth in the Accommodation and Wholesale Trade industry was flat.
Source: US Census Bureau; Esri; 4ward Planning LLC, 2012
Primary Jobs by
Industry, 2010 7,102 6,767 5,915 3,816 3,037 2,177
Average Annual Job
Change, 2006-2010 143 (208) 2 94 72 (183)

[Project Name]
4WARD PLANNING LLC
June 19, 2013
Page 68
Meriden TOD Study: Phase I Market Study
4WARD PLANNING LLC
June 21, 2013
Page 68
17%
13%12% 12%
6%5%
17%
15%
12% 11%
6%5%
19%
16%
12%
10%
6%5%
0%
5%
10%
15%
20%
25%
Health Care and Social
Assistance
Educational Services Retail Trade Manufacturing Accommodation and Food
Services
Wholesale Trade
Pe
rce
nt
of
To
tal P
rim
ary
Jo
bs
Figure B-9: New Haven-Milford MSA Top Six Industries by Percent of Total Employment
2006
2008
2010
Top Six Industries by Employment: New Haven-Milford MSA
Over the 2006 to 2010 period, the MSA featured an average annual primary job base of 326,626 primary
jobs. In 2010, the three leading industries in this region, by employment, each held between a 12- and 19-
percent share of total employment—combining for nearly half of the employment in the region. The Health
Care and Education industry experienced slight growth in this timeframe, while the Retail Trade industry’s
employment share remained level. Among the three remaining categories, the Manufacturing industry
shrank slightly and while growth in the Accommodation and Wholesale Trade industry was flat.
Source: US Census Bureau; Esri; 4ward Planning LLC, 2012
Primary Jobs by
Industry, 2010 62,282 50,490 38,650 32,665 20,730 16,044
Average Annual Job
Change, 2006-2010 1,472 1,676 (715) (2,067) 190 (278)

[Project Name]
4WARD PLANNING LLC
June 19, 2013
Page 69
Meriden TOD Study: Phase I Market Study
4WARD PLANNING LLC
June 21, 2013
Page 69
14%
11%
13%
11%
8%
6%
14%
11%12%
11%
8%
6%
16%
12% 11%11%
8%
6%
0%
2%
4%
6%
8%
10%
12%
14%
16%
18%
Health Care and Social
Assistance
Educational Services Manufacturing Retail Trade Finance and Insurance Accommodation and Food
Services
Pe
rce
nt
of
To
tal P
rim
ary
Jo
bs
Figure B-10: Connecticut Top Six Industries by Percent of Total Employment
2006
2008
2010
Top Six Industries by Employment: Connecticut
Over the 2006 to 2010 period, the State of Connecticut featured an average annual primary job base of
about 1.5 million primary jobs. In 2010, the three leading industries within the MSA, by employment, each
held between 11- and 16-percent share of total employment—combining for 39 percent of employment in
the state. The Health Care and Education industry experienced slight growth from 2006 to 2010, while
change in the Manufacturing sector was slightly negative. Employment share in the three remaining
categories was relatively flat over the observed time frame.
Source: US Census Bureau; Esri; 4ward Planning LLC, 2012
Primary Jobs by
Industry, 2010 231,494 167,635 166,785 157,537 115,665 89,636
Average Annual Job
Change, 2006-2010 5,316 2,337 (7,021) (2,383) (666) 505

[Project Name]
4WARD PLANNING LLC
June 19, 2013
Page 70
Meriden TOD Study: Phase I Market Study
4WARD PLANNING LLC
June 21, 2013
Page 70
Live-Work Patterns in and around the PMA
2010
2006
Commuted In
Commuted In
Commuted Out
Commuted Out
Lived & Worked
Lived & Worked
52.1%13.3% 34.6%
50.4% 15.2% 34.4%
The figure below shows the inflow-outflow patterns for workers living in and around the PMA. In 2010,
about 13 percent of workers in this radius lived within the area. From 2006 to 2010, the proportion of
those living & working in this radius decreased slightly. Over this same time frame, the proportion
commuting in rose slightly while the shares of those commuting out remained flat. The below trend
suggests likely pent-up demand for better residential dwelling units (e.g., affordable rental units).
Source: US Census Bureau; 4ward Planning LLC, 2012
Figure B-11: Worker Inflow-Outflow, PMA
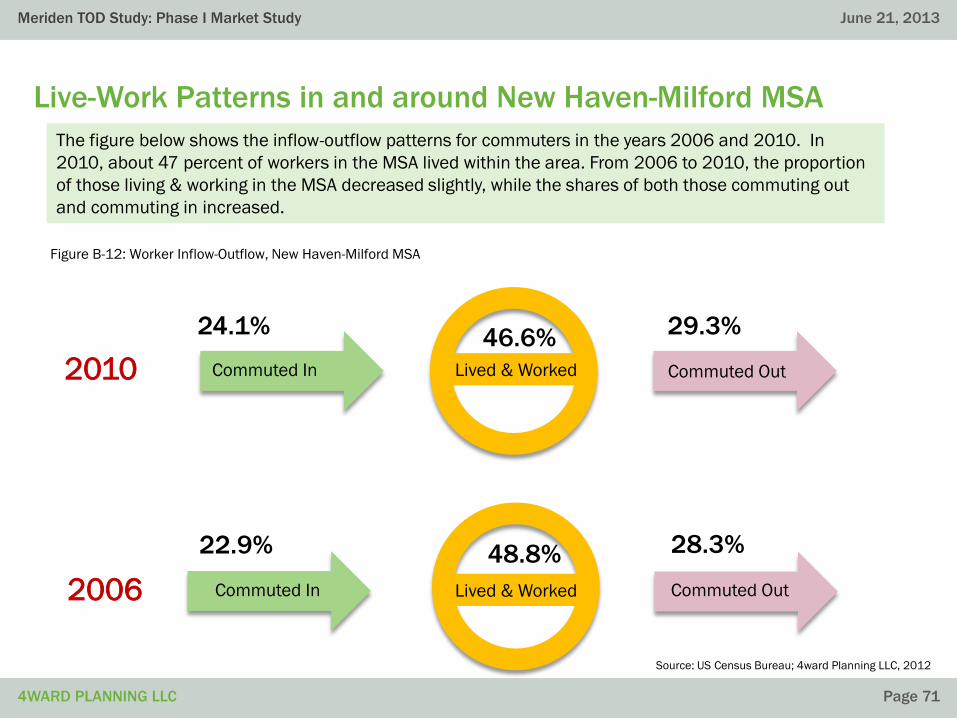
[Project Name]
4WARD PLANNING LLC
June 19, 2013
Page 71
Meriden TOD Study: Phase I Market Study
4WARD PLANNING LLC
June 21, 2013
Page 71
Live-Work Patterns in and around New Haven-Milford MSA
2010
2006
Commuted In
Commuted In
Commuted Out
Commuted Out
Lived & Worked
Lived & Worked
24.1%
Figure B-12: Worker Inflow-Outflow, New Haven-Milford MSA
46.6%29.3%
22.9% 48.8% 28.3%
The figure below shows the inflow-outflow patterns for commuters in the years 2006 and 2010. In
2010, about 47 percent of workers in the MSA lived within the area. From 2006 to 2010, the proportion
of those living & working in the MSA decreased slightly, while the shares of both those commuting out
and commuting in increased.
Source: US Census Bureau; 4ward Planning LLC, 2012

[Project Name]
4WARD PLANNING LLC
June 19, 2013
Page 72
Meriden TOD Study: Phase I Market Study
4WARD PLANNING LLC
June 21, 2013
Page 72
Work Destinations - PMA
The table below shows the work destinations for residents of the PMA in the years 2006, 2008 and 2010.
In 2010, about 18 percent of PMA residents worked in the City of Meriden. Wallingford, New Haven and
Hartford follow as popular work destinations. Those jurisdictions which are shaded have stations which
will be accessible from Meriden via the future New Haven-Hartford-Springfield Rail Line.
Table B-3: Work Destinations for PMA Residents
2006 2008 2010
Meriden city, CT 7,276 21.2% 6,587 19.2% 5,822 18.2%
Wallingford Center CDP, CT 2,323 6.8% 2,399 7.0% 2,045 6.4%
New Haven city, CT 1,719 5.0% 1,909 5.6% 1,805 5.6%
Hartford city, CT 1,408 4.1% 1,568 4.6% 1,638 5.1%
Middletown city, CT 1,653 4.8% 1,504 4.4% 1,224 3.8%
North Haven CDP, CT 1,120 3.3% 1,112 3.2% 1,033 3.2%
Waterbury city, CT 834 2.4% 857 2.5% 816 2.5%
New Britain city, CT 644 1.9% 690 2.0% 708 2.2%
Newington CDP, CT 479 1.4% 536 1.6% 515 1.6%
Milford city (balance), CT 424 1.2% 438 1.3% 415 1.3%
All Other Locations 16,370 47.8% 16,795 48.8% 16,019 50.0%
Source: US Census Bureau, OnTheMap; 4ward Planning LLC, 2012

[Project Name]
4WARD PLANNING LLC
June 19, 2013
Page 73
Meriden TOD Study: Phase I Market Study
4WARD PLANNING LLC
June 21, 2013
Page 73
Workers by Place of Residence - PMA
The below table is a listing of the places of residence for employees working in the PMA in the years
2006, 2008 and 2010. Beyond the City of Meriden, all other workers’ places of residence were
geographically dispersed with no other large single “source” of workers commuting to Meriden. Those
jurisdictions which are shaded have stations which will be accessible via the future New Haven-Hartford-
Springfield Rail Line.
Table B-4: PMA Workers by Place of Residence
2006 2008 2010
Meriden city, CT 9,569 21.1% 8,821 19.4% 8,060 18.4%
Waterbury city, CT 1,801 4.0% 1,768 3.9% 1,783 4.1%
Wallingford Center CDP, CT 1,611 3.6% 1,755 3.9% 1,617 3.7%
Middletown city, CT 1,694 3.7% 1,648 3.6% 1,564 3.6%
New Britain city, CT 1,330 2.9% 1,295 2.9% 1,152 2.6%
Bristol city, CT 930 2.1% 1,012 2.2% 1,065 2.4%
New Haven city, CT 887 2.0% 871 1.9% 827 1.9%
North Haven CDP, CT 517 1.1% 598 1.3% 570 1.3%
Hartford city, CT 693 1.5% 708 1.6% 552 1.3%
Naugatuck borough, CT 481 1.1% 515 1.1% 527 1.2%
All Other Locations 25,731 56.9% 26,447 58.2% 26,023 59.5%
Source: US Census Bureau, OnTheMap; 4ward Planning LLC, 2012

[Project Name]
4WARD PLANNING LLC
June 19, 2013
Page 74
Meriden TOD Study: Phase I Market Study
4WARD PLANNING LLC
June 21, 2013
Page 74
0
2,000
4,000
6,000
8,000
10,000
12,000
Health Care and Social
Assistance
Retail Trade Administrative and Support
and Waste Management and
Remediation Services
Accommodation and Food
Services
Educational Services Construction
Pri
ma
ry J
ob
s
Figure B-13: Top Six Industries by Average New Jobs Created, New Haven-Milford MSA2005
2006
2007
2008
2009
2010
Source: US Census Bureau, QWI Online; 4ward Planning LLC, 2012
Job Creation: New Haven-Milford MSA
Figure B-13 depicts the Bureau of Labor Statistics estimates of average quarterly job creation by industry
for the leading six industries in the MSA for the years 2005 to 2010. The Health Care industry lead job
creation in 2010, with Retail Trade as the second-highest job creator that year. The Retail Trade industry
was the leader in the years 2006 and 2007. The Educational Services industry created the second-
highest number of jobs in 2006 but as of 2010 fell to the fifth-highest rank.

[Project Name]
4WARD PLANNING LLC
June 19, 2013
Page 75
Meriden TOD Study: Phase I Market Study
4WARD PLANNING LLC
June 21, 2013
Page 75
Average Monthly Earnings: New Haven-Milford MSA
Figure B-14 depicts the Bureau of Labor Statistics estimates of average monthly earnings by industry for
the six leading industries in the MSA for the years 2005 to 2010. The Management of Companies and
Enterprises industry was highest in this metric in each of the years. The second-highest industry, Finance
and Insurance, saw a significant increase in monthly earnings over this timeframe, while earnings in the
Wholesale Trade industry (sixth-highest) remained largely flat.
0
1,000
2,000
3,000
4,000
5,000
6,000
7,000
8,000
9,000
Management of
Companies and
Enterprises
Finance and Insurance Utilities Professional,Scientific,and
Technical Services
Information Wholesale Trade
Pri
ma
ry J
ob
s
Figure B-14: Top Six Industries by Average Quarterly Employment, New Haven-Milford MSA
200520062007200820092010
Source: US Census Bureau, QWI Online; 4ward Planning LLC, 2012

[Project Name]
4WARD PLANNING LLC
June 19, 2013
Page 76
Meriden TOD Study: Phase I Market Study
4WARD PLANNING LLC
June 21, 2013
Page 76
Employment Projections: PMA
Using Bureau of Labor Statistics estimates for employment growth, 4ward Planning projected growth in
employment for the top ten industries in the PMA from 2010 through 2018. Of the top ten industries,
highest average annual growth rates are expected in Health Care and Social Assistance (2.5 percent),
Administration & Support, Waste Management and Remediation (1.8 percent), and Accommodation and
Food Services (0.7 percent). The Manufacturing industry is expected to lose jobs through 2018
0
1,000
2,000
3,000
4,000
5,000
6,000
7,000
8,000
9,000
10,000
2006 2008 2010 2010 2011 2012 2013 2014 2015 2016 2017 2018
Em
plo
yme
nt
Figure B-15: PMA Top Six Industries, Projected Growth in Employment
Health Care and Social Assistance
Manufacturing
Retail Trade
Wholesale Trade
Accommodation and Food Services
Administration & Support, Waste
Management and Remediation
Source: US Census Bureau, QWI Online; 4ward Planning LLC, 2012

[Project Name]
4WARD PLANNING LLC
June 19, 2013
Page 77
Meriden TOD Study: Phase I Market Study
4WARD PLANNING LLC
June 21, 2013
Page 77
Employment Projections: New Haven-Milford MSA
Using Bureau of Labor Statistics estimates for employment growth and U.S. Census data for employment
within the top six sectors, 4ward Planning projected growth in employment for the top six industries in the
MSA through 2018, with the results shown below.
0
10,000
20,000
30,000
40,000
50,000
60,000
70,000
80,000
90,000
2006 2008 2010 2010 2011 2012 2013 2014 2015 2016 2017 2018
Pri
ma
ry J
ob
s
Figure B-16: New Haven-Milford MSA Top Six Industries, Projected Growth in Employment
Health Care and Social Assistance
Educational Services
Retail Trade
Manufacturing
Accommodation and Food Services
Wholesale Trade
Source: US Census Bureau, QWI Online; 4ward Planning LLC, 2012

[Project Name]
4WARD PLANNING LLC
June 19, 2013
Page 78
Meriden TOD Study: Phase I Market Study
4WARD PLANNING LLC
June 21, 2013
Page 78
NHHS Station Areas Figure B-17: NHHS Stations Analyzed
As a supplement to the analysis of the PMA and the surrounding
geographies, an analysis was conducted to assess the industry
employment share near the station areas along the proposed New
Haven-Hartford-Springfield (NHHS) rail line. Stations accessible by the
proposed rail service from the Meriden Station within a 40-minute
travel time were selected for analysis. The areas within a one-mile
radius of each station were analyzed. These areas represent locations
to which Meriden residents might commute using the proposed rail
service.
Source: US Census Bureau; 4ward Planning LLC, 2012
Station Address CityApprox. travel time to Meriden (min.)
Windsor 41 Central Street Windsor 36
Hartford 1 Union Place Hartford 24
Berlin 51 Depot Road Kensington 11
Wallingford 37 Hall Avenue Wallingford 9
New Haven 50 Union Avenue New Haven 34
West Hartford 630 Flatbush Avenue West Hartford 20
Newington 200 Francis Avenue Newington 15
North Haven 160 State Street North Haven 25
Table B-5: NHHS Stations Analyzed

[Project Name]
4WARD PLANNING LLC
June 19, 2013
Page 79
Meriden TOD Study: Phase I Market Study
4WARD PLANNING LLC
June 21, 2013
Page 79
18%
16%
10%
17%
7%5%
18%
16%
10%
19%
7%
5%
22%20%
11%
8%7%
5%
0%
5%
10%
15%
20%
25%
Finance and Insurance Health Care and Social
Assistance
Public Administration Educational Services Professional, Scientific, and
Technical Services
Manufacturing
Pe
rce
nt
of
To
tal P
rim
ary
Jo
bs
Figure B-18: NHHS Station Areas Top Six Industries by Percent of Total Employment
2006
2008
2010
Top Six Industries by Employment: NHHS Station Areas
Over the 2006 to 2010 period, the NHHS Station Areas featured an average annual primary job base of
138,620 primary jobs. In 2010, the two leading industries in this region, by employment, each held
between a 20- and 22-percent share of total employment—combining for 44 percent of the employment
in the combined areas. The gain in employment share in the Health Care and Finance industry from
2008 to 2010 was largely due to a substantial loss in employment in the Education industry. Among the
remaining categories, the Public Administration, Professional Services and Manufacturing industries
were flat over the analysis timeframe.
Source: US Census Bureau; Esri; 4ward Planning LLC, 2012
Primary Jobs by
Industry, 2010 28,773 25,877 16,027 23,071 10,376 7,341
Average Annual Job
Change, 2006-2010 426 875 (46) (3,866) (102) (373)

[Project Name]
4WARD PLANNING LLC
June 19, 2013
Page 80
Meriden TOD Study: Phase I Market Study
4WARD PLANNING LLC
June 21, 2013
Page 80
Major employers (with 500 or more employees) located within one-mile of the NHHS Stations that were analyzed are listed below. Once
NHHS service is operational, Meriden residents would potentially be able to take transit to these workplaces within a 40-minute travel time.
Major Employers
Source: infofree.com; 4ward Planning LLC, 2012
Organization Address City Business Description Employees
Aetna Inc. 151 Farmington Ave Hartford Hospital & Medical Services Plans 1,000 to 4,999
Capital Community College 950 Main St Hartford Colleges, Universities & Professional Schools 500 to 999
Hartford Hospital 80 Seymour St # 5037 Hartford Medical Laboratories 5,000 to 9,999
Lincoln Life 350 Church St Fl 9 Hartford Insurance-Life Agents 500 to 999
Max Restaurant Group 249 Pearl St Fl 2 Hartford Restaurant Management 500 to 999
Northeast Utilities 56 Prospect St Hartford Electric Companies 1,000 to 4,999
Shipman & Goodwin 1 Constitution Plz Fl 19 Hartford Attorneys 500 to 999
Travelers 1 Tower Sq # 1PB Hartford Insurance-Property & Casualty 1,000 to 4,999
United Technologies Corp 1 Financial Plz Hartford Aerospace Industries Mfg 500 to 999
XL Center 1 Civic Center Plz Ste 2 Hartford Caterers 500 to 999
AT & T 310 Orange St New Haven Nonclassified Establishments 500 to 999
General Counselors Office 2 Whitney Ave New Haven Business Services 1,000 to 4,999
Knights Of Columbus 1 Columbus Plz Ste 1700 New Haven Fraternal Organizations 500 to 999
New Haven Police Dept 1 Union Ave New Haven Police Departments 500 to 999
Smilow Cancer Hospital 20 York St New Haven Hospitals 5,000 to 9,999
Temple Medical Ctr 40 Temple St Ste 4B New Haven Physicians & Surgeons 1,000 to 4,999
United Illuminating Co 157 Church St Fl 16 New Haven Electric Companies 500 to 999
Yale New Haven Hospital 20 York St New Haven Nutritionists 5,000 to 9,999
Compu-Data 218 Hartford Ave Newington Direct Mail Advertising Services 500 to 999
Data Mail Inc 240 Hartford Ave Newington Direct Mail Advertising Services 500 to 999
VA Medical Ctr-Newington 555 Willard Ave # Ze Newington Hospitals 500 to 999
Masonicare Health Ctr 22 Masonic Ave Wallingford Hospitals 500 to 999
Goodrich Corp 1 Charter Oak Blvd West Hartford Aircraft Components Mfg 500 to 999
Town Of Windsor 275 Broad St Ste 1 Windsor Federal Government-Executive Offices 500 to 999
Table B-6: Major Employers in the NHHS Stations Analyzed

[Project Name]
4WARD PLANNING LLC
June 19, 2013
Page 81
Meriden TOD Study: Phase I Market Study
4WARD PLANNING LLC
June 21, 2013
Page 81
Takeaway: Labor & Industry
Of the top three industries in the PMA, only one is currently expanding. The Health Care Services industry is
leading in all three analysis geographies and is expected to see significant growth through 2018. This industry is
also leading in job creation in the surrounding region. The Manufacturing industry, second-highest in the PMA, is in
decline across the region and is projected to lose jobs through 2018. The Retail Trade industry, with the third-
highest employment share in the PMA, has remained steady across all geographies and is projected to experience
minimal growth through 2018. Additionally, of the six highest-paying industries in the New Haven region, only the
Wholesale Trade industry is among the top six industries in the PMA by employment share.
According to live-work patterns for the PMA, the proportion of employees living and working in the area decreased
slightly from 2006 to 2010 and, at about 13 percent, is low relative to the surrounding region. However, the share
of workers commuting into the PMA increased slightly over that timeframe. This trend indicates a latent demand
for housing in the PMA as a percentage of those currently commuting would be expected to move into the PMA,
given more adequate housing choices.
Finally, the NHHS rail service will offer Meriden as a potential housing choice for persons who want to commute to
one of the many employment centers along the transit line (e.g., Hartford and New Haven). Given that many
metropolitan area major employers are located within a mile of rail stations along the NHHS line, Meriden’s
potential as a “point of origin” for prospective commuters (whether they wish to live in the Meriden TOD area or
not) will be quite great.

ECONOMIC AND REAL ESTATE ANALYSIS FOR SUSTAINABLE LAND USE OUTCOMES ™ECONOMIC AND REAL ESTATE ANALYSIS FOR SUSTAINABLE LAND USE OUTCOMES ™
Social Infrastructure Analysis

[Project Name]
4WARD PLANNING LLC
June 19, 2013
Page 83
Meriden TOD Study: Phase I Market Study
4WARD PLANNING LLC
June 21, 2013
Page 83
Methodology
4ward Planning inventoried and assessed the adequacy of existing socio-economic
infrastructure within the Meriden TOD Study Area (a half-mile radius from the station). This
study element is important for identifying critical human infrastructure deficiencies which, if
left unaddressed, would undermine the long-term sustainability of the overall land-use
strategy.
4ward Planning use appropriate benchmarks as well as comparison to the surrounding
New Haven-Milford MSA to identify levels of adequacy for each of the following categories:
• Number of full-service grocery stores per 10,000 residents
• Number of licensed childcare slots per 100 children five-years of age or less
• Open space acreage per resident
• Adequacy of housing choice for study area workers

[Project Name]
4WARD PLANNING LLC
June 19, 2013
Page 84
Meriden TOD Study: Phase I Market Study
4WARD PLANNING LLC
June 21, 2013
Page 84
Source: US Census Bureau; Esri; Scan US; 4ward Planning LLC, 2012
Population (2012): 7,380
Social Infrastructure Indicators – Analysis Geographies
Population (2012): 862,521New Haven-
Milford MSA
Study Area
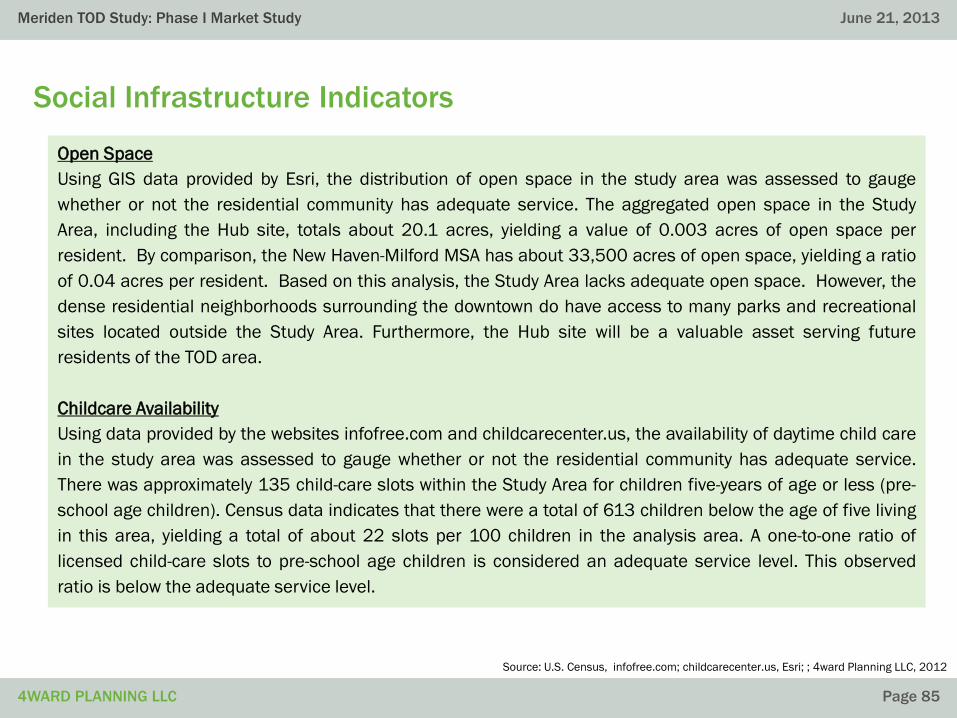
[Project Name]
4WARD PLANNING LLC
June 19, 2013
Page 85
Meriden TOD Study: Phase I Market Study
4WARD PLANNING LLC
June 21, 2013
Page 85
Social Infrastructure Indicators
Source: U.S. Census, infofree.com; childcarecenter.us, Esri; ; 4ward Planning LLC, 2012
Table A-5: Licensed Child Care Facilities within a One-mile Radius from William Street
Open Space
Using GIS data provided by Esri, the distribution of open space in the study area was assessed to gauge
whether or not the residential community has adequate service. The aggregated open space in the Study
Area, including the Hub site, totals about 20.1 acres, yielding a value of 0.003 acres of open space per
resident. By comparison, the New Haven-Milford MSA has about 33,500 acres of open space, yielding a ratio
of 0.04 acres per resident. Based on this analysis, the Study Area lacks adequate open space. However, the
dense residential neighborhoods surrounding the downtown do have access to many parks and recreational
sites located outside the Study Area. Furthermore, the Hub site will be a valuable asset serving future
residents of the TOD area.
Childcare Availability
Using data provided by the websites infofree.com and childcarecenter.us, the availability of daytime child care
in the study area was assessed to gauge whether or not the residential community has adequate service.
There was approximately 135 child-care slots within the Study Area for children five-years of age or less (pre-
school age children). Census data indicates that there were a total of 613 children below the age of five living
in this area, yielding a total of about 22 slots per 100 children in the analysis area. A one-to-one ratio of
licensed child-care slots to pre-school age children is considered an adequate service level. This observed
ratio is below the adequate service level.

[Project Name]
4WARD PLANNING LLC
June 19, 2013
Page 86
Meriden TOD Study: Phase I Market Study
4WARD PLANNING LLC
June 21, 2013
Page 86
Food Access
Source: Esri; 4ward Planning LLC, 2012
There is one full-service grocery store, the Stop-and-
Shop, located on the outer edge of the study area.
Census data indicates the half-mile TOD area has a
population of 7,380, yielding a ratio of 1.36 grocery
stores for every 10,000 residents. As a comparison,
the population of 862,521 residents in the
surrounding MSA is served by about 61 full-service
grocery stores, yielding a ratio of 0.7 facilities for
every 10,000 residents.
An industry rule-of-thumb prescribes one-full service
grocery store per 10,000 persons. While this
indicates that the study area is adequately serviced,
the location of the full-service Stop-and-Shop is
located up a steep grade and more than 2,500 feet
from Colony Street – not likely a trek most residents
would be willing to walk for groceries.
Consequently, another full-service market closer to
the rail station will likely be required.
Meriden
Station
Stop-and-Shop
Neighborhood Market
Figure B-19: Grocery Stores one half-mile radius from Meriden Station
Neighborhood Market
Neighborhood Market
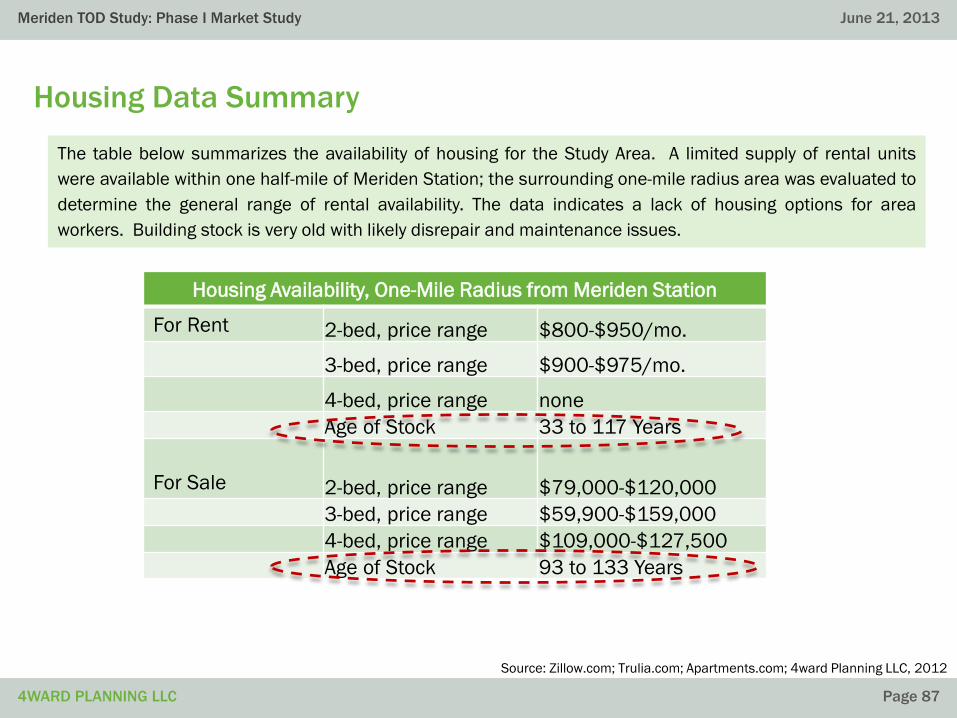
[Project Name]
4WARD PLANNING LLC
June 19, 2013
Page 87
Meriden TOD Study: Phase I Market Study
4WARD PLANNING LLC
June 21, 2013
Page 87
Housing Data Summary
Source: Zillow.com; Trulia.com; Apartments.com; 4ward Planning LLC, 2012
Housing Availability, One-Mile Radius from Meriden Station
For Rent 2-bed, price range $800-$950/mo.
3-bed, price range $900-$975/mo.
4-bed, price range none
Age of Stock 33 to 117 Years
For Sale 2-bed, price range $79,000-$120,000
3-bed, price range $59,900-$159,000
4-bed, price range $109,000-$127,500
Age of Stock 93 to 133 Years
The table below summarizes the availability of housing for the Study Area. A limited supply of rental units
were available within one half-mile of Meriden Station; the surrounding one-mile radius area was evaluated to
determine the general range of rental availability. The data indicates a lack of housing options for area
workers. Building stock is very old with likely disrepair and maintenance issues.

[Project Name]
4WARD PLANNING LLC
June 19, 2013
Page 88
Meriden TOD Study: Phase I Market Study
4WARD PLANNING LLC
June 21, 2013
Page 88
Rental Market
Source: Zillow.com; Trulia.com; Apartments.com; 4ward Planning LLC, 2012
Rentals, Half-Mile Radius from Meriden Station
Location Bedrooms Monthly Rent Yr. Built
65 W. Main St. 1-bed. $725 1900
787 N. Colony St. 1-bed. $725 1980
80 Hanover St. 1-bed. $695 n/a
71 Caitlin St. 1- to 2-bed. $775 to $875 n/a
235 Grove St. 2-bed. $875 n/a
65 Camp St. 2-bed. $950 1930
123 Camp St. 2-bed. $880 1965
72 E. Main St. 3-bed. $900 n/a
51 Park St. 1- to 3-bed. $775 to $950 n/a
The current rental availability in the vicinity of Meriden Station was reviewed as part of evaluating the
adequacy of housing in the area. The properties are listed below.

ECONOMIC AND REAL ESTATE ANALYSIS FOR SUSTAINABLE LAND USE OUTCOMES ™ECONOMIC AND REAL ESTATE ANALYSIS FOR SUSTAINABLE LAND USE OUTCOMES ™
REAL ESTATE ANALYSIS

[Project Name]
4WARD PLANNING LLC
June 19, 2013
Page 90
Meriden TOD Study: Phase I Market Study
4WARD PLANNING LLC
June 21, 2013
Page 90
Key Findings: Residential
Flat inventory growth
No new multi-family rental units entered the North Haven Submarket in the last five years. Reis projects weak
positive growth through 2016, especially as compared to the larger markets. Furthermore, there are only three
multi-family properties currently for sale within the primary market area.
Very low vacancy
Vacancy in the Submarket has hovered around two- to three-percent for the last five years and is expected
to remain low through 2016. Such a low vacancy rate indicates a very tight multi-family rental market – a
favorable trend for new TOD residential construction.
Rents are increasing, but remain lower in the TOD Study Area
Effective monthly rent in the submarket is projected to increase three-percent annually through 2016, after a
five-percent increase over the last five years. However, the average asking rent in the TOD Study Area ($1,077)
remains 11 percent lower than the effective rent ($1,211) in the submarket. This metric is reflective of older
housing stock in fair to poor condition.
More than 600 new units
are projected to be in demand through 2027, within the housing submarket.
[Project Name]
4WARD PLANNING LLC
June 19, 2013
Page 91
Meriden TOD Study: Phase I Market Study
4WARD PLANNING LLC
June 21, 2013
Page 91
Key Findings: Office
Flat to negative growth
Office space in the Northeast Submarket has experienced negative absorption in the last three years and zero
inventory growth in the last five years. However, and notwithstanding these trends, Reis projects that
approximately 150,000 square feet of new space will be constructed in the submarket by 2016.
$20 per square foot
The average asking rent for office space in the submarket is estimated to be $20 per square foot.
However, effective rents in the Meriden TOD Study Area are less than half ($8 per square foot),
suggesting it would be a considerable challenge to construct new office space in the near-term, given
current rent rates.
Demand will largely be filled by existing vacancies
While our analysis shows a projected demand for approximately 600,000 square feet of office space within the
submarket by 2019. the vast majority of this demand is likely to be met by existing vacant space – meaning
little new office space is likely to come on-line in the Meriden TOD within the next ten years.

[Project Name]
4WARD PLANNING LLC
June 19, 2013
Page 92
Meriden TOD Study: Phase I Market Study
4WARD PLANNING LLC
June 21, 2013
Page 92
Key Findings: Retail
28,200 square feet
The projected potential retail demand, in terms of supportable square footage, based on a projected upper
threshold of 1,000 new multi-family housing units being constructed in the TOD over the next ten years. Note,
this is a conservative estimate which does not account for prospective spending by new commuters to the area
or by people living in the surrounding areas, outside of the TOD, who may travel to Meriden to dine or shop.
15 Eating & Drinking Establishments
are currently located in the Meriden TOD Study Area, as of 2011. This total is on the low end of the
range, as compared to a number of similar station areas examined in the Northeast region. Five of the
station areas evaluated featured between 28 and 94 restaurants or food service establishments,
indicating that the TOD area will likely realize increasing demand for dining and drinking establishments,
as build-out occurs.
$13,539 per year
The total amount spent, on average, by each household in the Meriden PMA on a number of retail categories,
including food, clothing, entertainment and personal services. Each new household developed in the TOD
would be expected to spend at similar levels, creating net new demand for retail in the TOD area.
[Project Name]
4WARD PLANNING LLC
June 19, 2013
Page 93
Meriden TOD Study: Phase I Market Study
4WARD PLANNING LLC
June 21, 2013
Page 93
Methodology: Key Steps for Analyzing Trends
4ward Planning utilized Reis, a nationally recognized supplier of office, retail, industrial, and multi-family
rental data, to identify submarket real estate trend data (multi-family residential and office). In addition
to analyzing Reis data, 4ward Planning’s third party data review included industry products, such as
Loopnet.com and Apartments.com, to identify location and character of currently available properties.
4ward Planning focused on the following metrics:
• Change in Unit or Square-foot Inventory: Indicates, in broad terms, whether new real estate construction has
been active in the area.
• Year-over-Year Vacancy Rates: Combined with absorption as a percent of occupied stock, this metric signals
whether new construction is being leased and occupied (signaling high demand), or whether it remains vacant
(signaling an over-supply of real estate).
• Absorption as a Percent of Occupied Stock: Absorption as a percent of occupied inventory reflects the net
square footage which has either become occupied (positive absorption) or vacant (negative absorption) during
the time period, expressed as a percentage of occupied total unit inventory at the end of the time period.
• Effective Monthly or Annual Rent: A measure of the relative value of real estate within the area.
• Existing Properties: Additionally, the location and character of currently available properties is examined using
industry products.

ECONOMIC AND REAL ESTATE ANALYSIS FOR SUSTAINABLE LAND USE OUTCOMES ™ECONOMIC AND REAL ESTATE ANALYSIS FOR SUSTAINABLE LAND USE OUTCOMES ™
Residential Trends Analysis
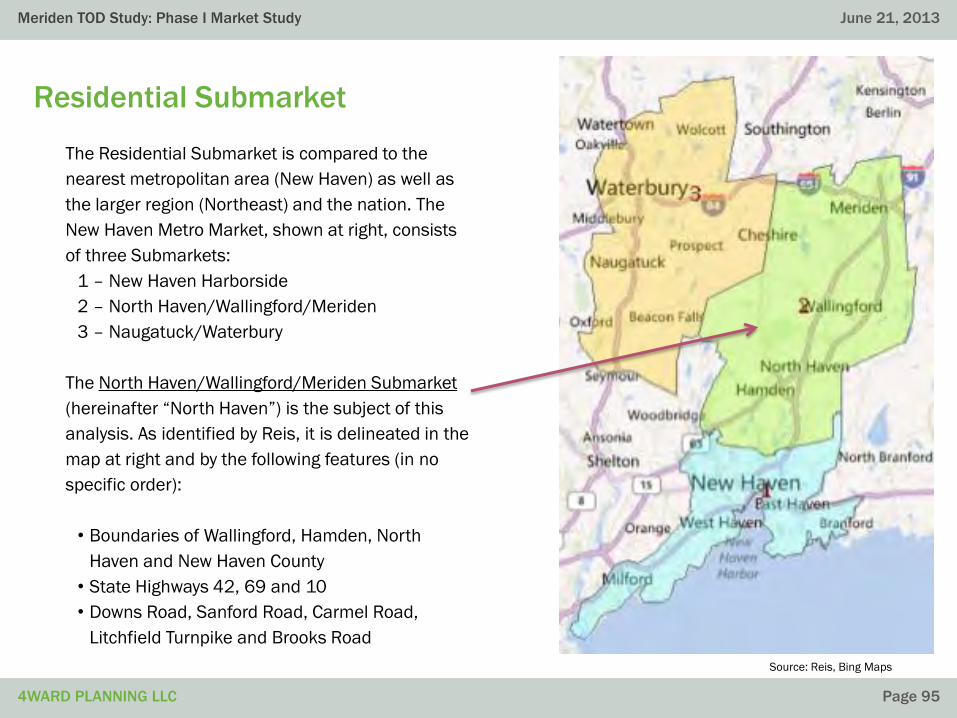
[Project Name]
4WARD PLANNING LLC
June 19, 2013
Page 95
Meriden TOD Study: Phase I Market Study
4WARD PLANNING LLC
June 21, 2013
Page 95
Residential Submarket
Source: Reis, Bing Maps
The Residential Submarket is compared to the
nearest metropolitan area (New Haven) as well as
the larger region (Northeast) and the nation. The
New Haven Metro Market, shown at right, consists
of three Submarkets:
1 – New Haven Harborside
2 – North Haven/Wallingford/Meriden
3 – Naugatuck/Waterbury
The North Haven/Wallingford/Meriden Submarket
(hereinafter “North Haven”) is the subject of this
analysis. As identified by Reis, it is delineated in the
map at right and by the following features (in no
specific order):
• Boundaries of Wallingford, Hamden, North
Haven and New Haven County
• State Highways 42, 69 and 10
• Downs Road, Sanford Road, Carmel Road,
Litchfield Turnpike and Brooks Road

[Project Name]
4WARD PLANNING LLC
June 19, 2013
Page 96
Meriden TOD Study: Phase I Market Study
4WARD PLANNING LLC
June 21, 2013
Page 96
Inventory Growth RatesQuarterly Annualized 5 year
3Q12 2Q12 YTD Avg 1 Year 3 Year 5 Year ForecastNorth Haven 0.0% 0.0% 0.0% 0.0% 0.0% 0.0% 0.7%New Haven 0.0% 0.0% 0.0% 0.0% 0.9% 0.9% 0.8%Northeast 0.1% 0.3% 0.2% 0.6% 0.8% 0.8% 1.1%United States 0.1% 0.1% 0.1% 0.4% 0.9% 1.0% 1.2%Period Ending: 9/30/12 6/30/12 9/30/12 12/31/11 12/31/11 12/31/11 12/31/16
Apartment Inventory
According to Reis, there has been no apartment inventory change in the North Haven Submarket in the
last five years. Apartment inventory growth was also flat in the larger New Haven metropolitan area in the
last year. However, the New Haven Metro exhibited flat growth in the three and five-year periods, which
reflects trends in the Northeast and the United States. Reis projects the North Haven Submarket will see
new units enter the market again in the next five years, resulting in positive, albeit weak, growth; but the
submarket is projected to underperform, compared with the three other geographies studied, and
identified in the below table.
Source: Reis; 4ward Planning LLC 2012
Table C-1: Inventory Growth Rates

[Project Name]
4WARD PLANNING LLC
June 19, 2013
Page 97
Meriden TOD Study: Phase I Market Study
4WARD PLANNING LLC
June 21, 2013
Page 97
Apartment Vacancy Rate
Reis reports the North Haven Submarket apartment vacancy rate declined from third-quarter 2008 to
third-quarter 2012 by more than 13 percent per year, which is a sign of strong demand for rental housing.
Vacancy rates in the submarket are extremely low and less than those in the three other geographies
studied. Interviews with local realtors and property owners confirm that the multi-family market in
Meriden is strong. Reis forecasts apartment vacancy rates in the North Haven Submarket will continue to
fall and remain very tight (below three percent) over the next five years – a favorable trend for TOD
residential investment.
Source: Reis; 4ward Planning LLC 2012
3.0% 3.1%
2.1%1.9%
2.4%
0%
1%
2%
3%
4%
2008 Q3 2009 Q3 2010 Q3 2011 Q3 2012 Q3
Va
ca
ncy
Ra
te
Figure C-1: North Haven Submarket Residential Year-over-Year Vacancy Rates
2.5%
2.1%
2.8% 2.8%
2.3%
0%
1%
2%
3%
4%
2012 2013 2014 2015 2016
Va
ca
ncy
Ra
te
Figure C-2: North Haven Submarket Projected Year-over-Year Vacancy Rates

[Project Name]
4WARD PLANNING LLC
June 19, 2013
Page 98
Meriden TOD Study: Phase I Market Study
4WARD PLANNING LLC
June 21, 2013
Page 98
Apartment Absorption
Apartment absorption, as a percent of occupied units, has been relatively flat in the North Haven
Submarket over the last five years. This is consistent with the flat inventory and low vacancy rates
described earlier and indicates that there is not a wealth of available multi-family units on the market
(which would be reflected in negative absorption). Reis projects apartment absorption to fluctuate in the
next five years, but remain positive, which is a sign of a healthy rental market. Nodes of residential
development, such as near rail stations, will likely fare better than the host submarket, given the
advantage of commuter rail access to major employers, educational institutions, and entertainment.
Source: Reis; 4ward Planning LLC 2012
0.8%
0.2%0.3%
0.1% 0.1%
0%
1%
2%
2008 Q3 2009 Q3 2010 Q3 2011 Q3 2012 Q3Ab
so
rpti
on
/O
ccu
pie
d I
nve
nto
ry
Year
Figure C-3: North Haven Submarket Absorption as Percent of Occupied Inventory
0.2%
1.4%
0.2%
0.8%
1.4%
0%
1%
2%
2012 2013 2014 2015 2016
Ab
so
rpti
on
/O
ccu
pie
d I
nve
nto
ry
Year
Figure C-4: North Haven Submarket Projected Absorption as Percent of Occupied Inventory
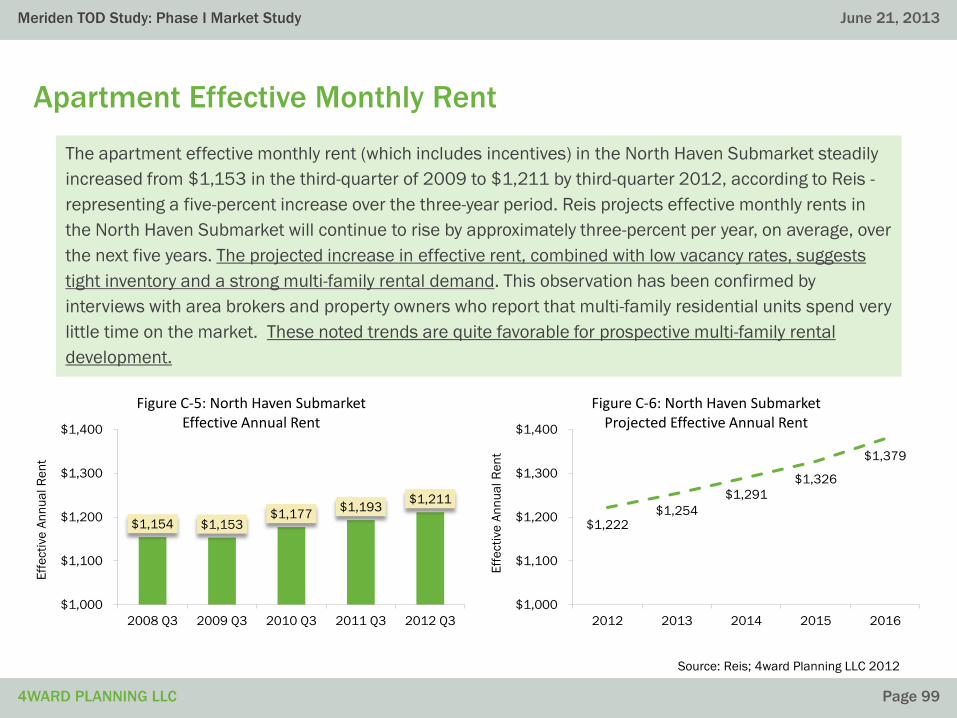
[Project Name]
4WARD PLANNING LLC
June 19, 2013
Page 99
Meriden TOD Study: Phase I Market Study
4WARD PLANNING LLC
June 21, 2013
Page 99
Apartment Effective Monthly Rent
The apartment effective monthly rent (which includes incentives) in the North Haven Submarket steadily
increased from $1,153 in the third-quarter of 2009 to $1,211 by third-quarter 2012, according to Reis -
representing a five-percent increase over the three-year period. Reis projects effective monthly rents in
the North Haven Submarket will continue to rise by approximately three-percent per year, on average, over
the next five years. The projected increase in effective rent, combined with low vacancy rates, suggests
tight inventory and a strong multi-family rental demand. This observation has been confirmed by
interviews with area brokers and property owners who report that multi-family residential units spend very
little time on the market. These noted trends are quite favorable for prospective multi-family rental
development.
Source: Reis; 4ward Planning LLC 2012
$1,154 $1,153 $1,177
$1,193 $1,211
$1,000
$1,100
$1,200
$1,300
$1,400
2008 Q3 2009 Q3 2010 Q3 2011 Q3 2012 Q3
Eff
ecti
ve
An
nu
al R
en
t
Figure C-5: North Haven Submarket Effective Annual Rent
$1,222 $1,254
$1,291
$1,326
$1,379
$1,000
$1,100
$1,200
$1,300
$1,400
2012 2013 2014 2015 2016
Eff
ecti
ve
An
nu
al R
en
t
Figure C-6: North Haven Submarket Projected Effective Annual Rent

[Project Name]
4WARD PLANNING LLC
June 19, 2013
Page 100
Meriden TOD Study: Phase I Market Study
4WARD PLANNING LLC
June 21, 2013
Page 100
Apartment Characteristics: For Rent
According to data provided by Apartment.com and Zillow.com, there were sixteen multi-family properties
with units for rent in Meriden, as of January 2013. The majority of these rentals are found in two- and three-
family structures or townhouses. Table C-2 shows that average rent for properties currently on the market
ranges from $750 for a 1-bedroom to $1,238 for a three-bedroom. Average price per square foot ranges
from $1.00 for a 3-bedroom to $1.26 for a 1-bedroom (unit size was not available for the one studio unit).
The average rent currently asked for in the Meriden area ($1,077) is approximately 11 percent lower than
the effective monthly rent for third quarter 2012 reported by Reis for the North Haven Submarket.
Table C-2: Multifamily Rentals in Meriden, as of January 2013Studio Average 1 Bedroom Average 2 Bedroom Average 3 Bedroom Average
Name City Rent Price per SqFt Rent Price per SqFt Rent Price per SqFt Rent Price per SqFtMerritt Station Apartments Meriden $912 $1.22 $1,128 $1.07Brittannia Commons Meriden $938 $1.34 $1,219 $0.98366 Bee Street (a Hotel) Meriden $1,188 n/a62 Gravel Street, Apt D Meriden $775 $1.1572 E Main Street Meriden $900234 Sherman Ave Meriden $925 $1.46 $1,275 $0.99 $1,250 $1.00Parkside Terrace Meriden $1,07594 Mattabasset Dr, Unit 94 Meriden $1,750 $1.15208 S Colony St Meriden $1,050 $0.8482 Woodland St, 3rd Fl Meriden $600 $1.0067 Metacomet Dr, Unit 67 Meriden $1,300 $1.0025 New Street, 2nd Fl Meriden $550465 Crown St. Meriden $750 $1.3145 Webb Street, Apt 3B Meriden $1,095 $1.11680 N Colony St, Apt. 30 Meriden $1,275 $0.82No address Meriden $1,100 $1.14Average $1,188 n/a $750 $1.26 $1,134 $1.03 $1,238 $1.00
Source: Apartments.com, Zillow.com 4ward Planning LLC, 2012
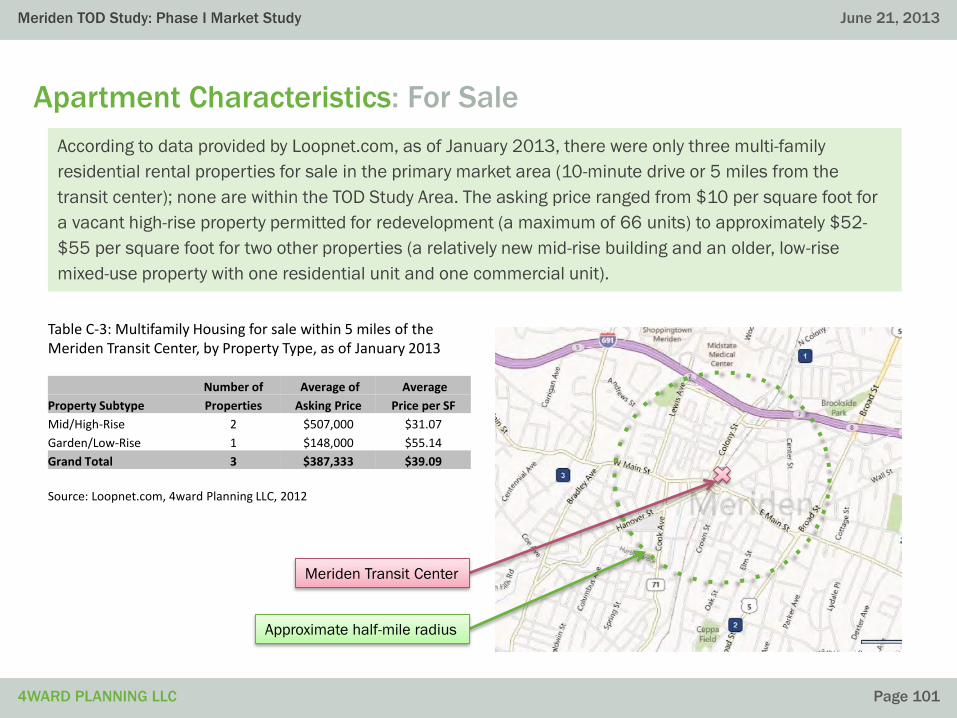
[Project Name]
4WARD PLANNING LLC
June 19, 2013
Page 101
Meriden TOD Study: Phase I Market Study
4WARD PLANNING LLC
June 21, 2013
Page 101
Apartment Characteristics: For Sale
According to data provided by Loopnet.com, as of January 2013, there were only three multi-family
residential rental properties for sale in the primary market area (10-minute drive or 5 miles from the
transit center); none are within the TOD Study Area. The asking price ranged from $10 per square foot for
a vacant high-rise property permitted for redevelopment (a maximum of 66 units) to approximately $52-
$55 per square foot for two other properties (a relatively new mid-rise building and an older, low-rise
mixed-use property with one residential unit and one commercial unit).
Meriden Transit Center
Table C-3: Multifamily Housing for sale within 5 miles of theMeriden Transit Center, by Property Type, as of January 2013
Number of Average of Average
Property Subtype Properties Asking Price Price per SF
Mid/High-Rise 2 $507,000 $31.07
Garden/Low-Rise 1 $148,000 $55.14
Grand Total 3 $387,333 $39.09
Source: Loopnet.com, 4ward Planning LLC, 2012
Approximate half-mile radius
[Project Name]
4WARD PLANNING LLC
June 19, 2013
Page 102
Meriden TOD Study: Phase I Market Study
4WARD PLANNING LLC
June 21, 2013
Page 102
Takeaway: Apartment Trends
Very low projected vacancy rates (below three-percent) and rising rents indicate that the
Northeast Submarket is strong and favorable for new multi-family residential housing units in
the near term. Further, this trend is supported by demographic analysis for the primary
market area (a ten-minute drive from the transit center) showing strong positive growth in
non-family households–young workers and empty nesters in particular. These trends suggest
high receptivity for TOD style multi-family rental units (e.g., small, high-density one- and two-
bedroom units) within Meriden’s HUB district.
However, given the relatively low current apartment rental rates in Meriden, developers of
new multi-family rental units will be financially challenged, initially, to affordably build new
units and price them to be in-line with area rents. Consequently, the city and/or state may
need to provide some up-front subsidy (and possibly land conveyance at a nominal fee), in
order to stimulate financial feasible rental development, up until rents rise to a level
sufficient to support typical market construction costs.
This is will be determined, specifically, within the financial analysis section of this study.

ECONOMIC AND REAL ESTATE ANALYSIS FOR SUSTAINABLE LAND USE OUTCOMES ™ECONOMIC AND REAL ESTATE ANALYSIS FOR SUSTAINABLE LAND USE OUTCOMES ™
Residential Supply-Demand
Analysis

[Project Name]
4WARD PLANNING LLC
June 19, 2013
Page 104
Meriden TOD Study: Phase I Market Study
4WARD PLANNING LLC
June 21, 2013
Page 104
Methodology: Residential Supply-Demand Analysis
Selection of Population and Household Growth Scenario
4ward Planning examined a modest growth scenario based on our 2017 projections for population and households.
While population and household growth trends could increase at a more robust pace through 2017, absent a large influx
of large employers to the area, such a trend is not likely.
Estimation and subtraction of physically obsolescent housing units in the market area
Housing units, like most things, wear out over time. Dependent upon the age of local housing stock and the manner of
care applied to it, generally, the annual housing obsolescence rate can range from 0.5 percent annually (solidly built
homes that are well cared for) to as high as two percent annually (older housing stock which has seen little preventative
maintenance over the years). Based on conditions observed and data analyzed for the Northeast (New Haven) housing
submarket, 4ward Planning utilized a 1.5 percent annual obsolescence rate for its analysis.
Estimation of pent-up housing demand by PMA workers currently living outside of the TOD Study Area
Typically, some percentage of workers who commute to places of employment at considerable distance from their homes
desire living arrangements closer to their place of employment. For reasons of inadequate housing stock (type, price,
location, etc.) currently near their place of employment, these workers do not enter the local housing market and,
therefore, are said to represent pent-up demand for local housing. A survey of workers who commute outside the housing
area about their desire to live locally was conducted, but there is not a precise method for estimating pent-up housing
demand among local workers. 4ward Planning believes that three out of every 100 workers is a very conservative
estimate for the pent-up demand which likely exists in this market, all other things being equal. Accordingly, we have
assumed that three percent of the identified in-commuting workers to the TOD Study Area represent pent-up demand.
[Project Name]
4WARD PLANNING LLC
June 19, 2013
Page 105
Meriden TOD Study: Phase I Market Study
4WARD PLANNING LLC
June 21, 2013
Page 105
Estimation of demand for owner-occupied versus renter-occupied units
Analysis and projection of demand for owner- versus renter-occupied housing units is based on a number of factors within a
given market area. These include:
• Current ratio of owner-occupied to renter-occupied units
• Household income levels and trends
• Household type (e.g., family versus non-family households) and trends
• Population age trends
• Current & forecasted financial conditions (employment outlook, mortgage rates, ease of mortgage qualification, etc.)
All of the above factors pertaining to the Meriden Transit Center PMA were taken into consideration for this analysis.
Estimation of demand for one-, two-, and three-bedroom unit types
The estimation of one-, two-, and three-bedroom units as a percentage of all housing units, whether the housing type is for-
sale or for-rent, involves many of the same factors identified under the estimation of demand for owner-occupied versus
renter-occupied units, as well as an examination of current market trends for various bedroom-unit mixes.
Estimation of the natural vacancy rate
A housing market’s natural vacancy rate is a function of such factors as whether or not the area is a seasonal tourist
destination (higher vacancy rates during the off-season) or whether the area is well established and desirable (typically
associated with relatively low vacancy rates). Every housing market has some degree of vacancy, as households are
constantly in motion. Nationally and regionally, stable and generally well-maintained housing markets exhibit vacancy rates
ranging from three percent to six percent.
Methodology: Residential Supply-Demand Analysis
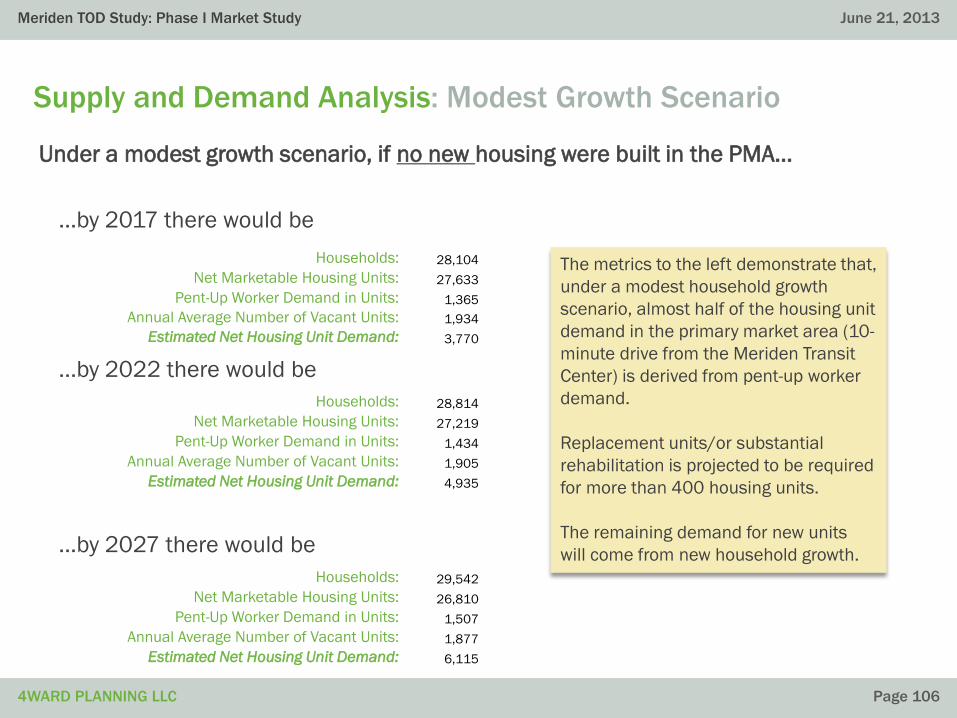
[Project Name]
4WARD PLANNING LLC
June 19, 2013
Page 106
Meriden TOD Study: Phase I Market Study
4WARD PLANNING LLC
June 21, 2013
Page 106
Supply and Demand Analysis: Modest Growth Scenario
Under a modest growth scenario, if no new housing were built in the PMA…
…by 2017 there would be
…by 2022 there would be
…by 2027 there would be
The metrics to the left demonstrate that,
under a modest household growth
scenario, almost half of the housing unit
demand in the primary market area (10-
minute drive from the Meriden Transit
Center) is derived from pent-up worker
demand.
Replacement units/or substantial
rehabilitation is projected to be required
for more than 400 housing units.
The remaining demand for new units
will come from new household growth.
Households: 28,104
Net Marketable Housing Units: 27,633
Pent-Up Worker Demand in Units: 1,365
Annual Average Number of Vacant Units: 1,934
Estimated Net Housing Unit Demand: 3,770
Households: 28,814
Net Marketable Housing Units: 27,219
Pent-Up Worker Demand in Units: 1,434
Annual Average Number of Vacant Units: 1,905
Estimated Net Housing Unit Demand: 4,935
Households: 29,542
Net Marketable Housing Units: 26,810
Pent-Up Worker Demand in Units: 1,507
Annual Average Number of Vacant Units: 1,877
Estimated Net Housing Unit Demand: 6,115

[Project Name]
4WARD PLANNING LLC
June 19, 2013
Page 107
Meriden TOD Study: Phase I Market Study
4WARD PLANNING LLC
June 21, 2013
Page 107
Supply and Demand Analysis: Modest Growth Scenario
Key Assumptions Underpinning the Modest Growth Scenario
Net Household Formation Increases by 0.5 Percent per Annum from 2012 to 2027This assumption is based on increased in-migration from the metropolitan area and increased immigration, in response to local
area job growth.
Number Employed within Meriden Transit Center PMA Increases from 141,406 to 164,168 by 2027This estimate is based on a modest one-percent annualized increase over 2012 base employment.
Three Percent of Those Working in the PMA but Living Elsewhere Represent Pent-Up Demand Based on an assumption that approximately one-in-thirty workers would trade their commute if there were adequate housing
choice in the PMA.
Five percent of the PMA’s Current Housing Stock is Physically Obsolescent and UnmarketableMuch of the PMA’s rental housing stock is more than forty years old, increasing the incidence of physical obsolescence.
1.5 Percent of the PMA’s Remaining Housing Stock Becomes Obsolescent AnnuallyAll housing stock gradually wears out over time and, on average, 1.5 out of every 100 units becomes obsolescent, annually.
65 percent of New Unit Demand will be for Rental HousingBased on current and likely future socio-economic characteristics of the area and tight lending standards into the future.
The PMA will Maintain an Annual Housing Vacancy Rate of approximately Seven-Percent The PMA’s naturally occurring annual vacancy rate will remain relatively low, based on existing and projected conditions.

[Project Name]
4WARD PLANNING LLC
June 19, 2013
Page 108
Meriden TOD Study: Phase I Market Study
4WARD PLANNING LLC
June 21, 2013
Page 108
Projected Growth Scenarios
Source: US Census Bureau; On The Map; 4ward Planning LLC 2012
In 2012, the estimated net housing demand within a 10-minute drive of the Meriden Transit Center (the
PMA) was approximately 2,600 units, as shown in Figure C-7. Based on a modest growth scenario, pent-up
worker housing demand, replacement demand from physically obsolescent housing units and new
household growth, demand is projected to steadily increase to more than 6,100 housing units by 2027.
Assuming a flat growth scenario (should no additional units be built), housing demand would be nearly
4,000 units.
2,617
3,770
4,935
6,115
2,617 3,081
3,536 3,989
0
1,000
2,000
3,000
4,000
5,000
6,000
7,000
2012 2017 2022 2027
Ho
usi
ng
Un
its
Figure C-7: Net Housing Unit Demand
Modest Growth Flat Growth
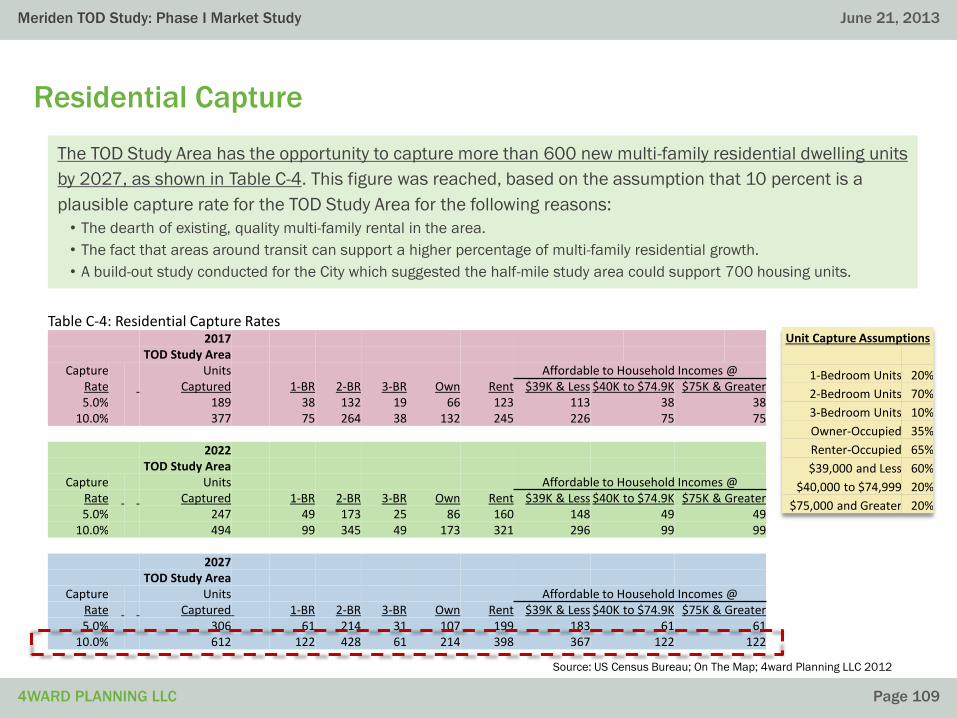
[Project Name]
4WARD PLANNING LLC
June 19, 2013
Page 109
Meriden TOD Study: Phase I Market Study
4WARD PLANNING LLC
June 21, 2013
Page 109
Residential Capture
Source: US Census Bureau; On The Map; 4ward Planning LLC 2012
The TOD Study Area has the opportunity to capture more than 600 new multi-family residential dwelling units
by 2027, as shown in Table C-4. This figure was reached, based on the assumption that 10 percent is a
plausible capture rate for the TOD Study Area for the following reasons:
• The dearth of existing, quality multi-family rental in the area.
• The fact that areas around transit can support a higher percentage of multi-family residential growth.
• A build-out study conducted for the City which suggested the half-mile study area could support 700 housing units.
Table C-4: Residential Capture Rates2017
TOD Study AreaCapture Units Affordable to Household Incomes @
Rate Captured 1-BR 2-BR 3-BR Own Rent $39K & Less $40K to $74.9K $75K & Greater5.0% 189 38 132 19 66 123 113 38 38
10.0% 377 75 264 38 132 245 226 75 75
2022TOD Study Area
Capture Units Affordable to Household Incomes @Rate Captured 1-BR 2-BR 3-BR Own Rent $39K & Less $40K to $74.9K $75K & Greater5.0% 247 49 173 25 86 160 148 49 49
10.0% 494 99 345 49 173 321 296 99 99
2027TOD Study Area
Capture Units Affordable to Household Incomes @Rate Captured 1-BR 2-BR 3-BR Own Rent $39K & Less $40K to $74.9K $75K & Greater5.0% 306 61 214 31 107 199 183 61 61
10.0% 612 122 428 61 214 398 367 122 122
Unit Capture Assumptions
1-Bedroom Units 20%
2-Bedroom Units 70%
3-Bedroom Units 10%
Owner-Occupied 35%
Renter-Occupied 65%
$39,000 and Less 60%
$40,000 to $74,999 20%
$75,000 and Greater 20%

[Project Name]
4WARD PLANNING LLC
June 19, 2013
Page 110
Meriden TOD Study: Phase I Market Study
4WARD PLANNING LLC
June 21, 2013
Page 110
Takeaway: Residential Supply-Demand
Based on the modest household growth estimates, there will be demand for thousands of new housing
units within the primary market area over the coming years. However, not all of this demand will be met
within the TOD Study Area (the half-mile radius of the transit center). Assuming a residential capture rate
of 10 percent, the TOD Study Area can support more than 600 new housing units to meet this demand.
Approximately 16 percent of the population in the TOD Study Area will be young professionals, the largest
age cohort in both the PMA and the Study Area. This population tends to prefer smaller housing units with
access to amenities, jobs and entertainment; these are features more likely to be found in transit-oriented
developments. This population is also one of the groups research shows is more likely to use public transit.

ECONOMIC AND REAL ESTATE ANALYSIS FOR SUSTAINABLE LAND USE OUTCOMES ™ECONOMIC AND REAL ESTATE ANALYSIS FOR SUSTAINABLE LAND USE OUTCOMES ™
Office Trend Analysis
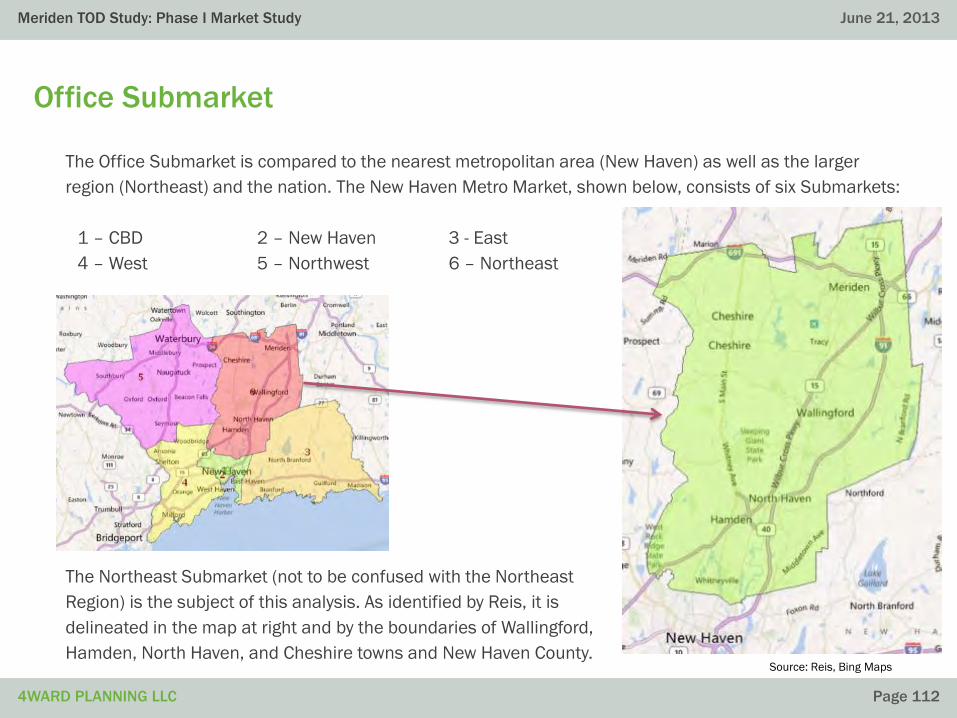
[Project Name]
4WARD PLANNING LLC
June 19, 2013
Page 112
Meriden TOD Study: Phase I Market Study
4WARD PLANNING LLC
June 21, 2013
Page 112
The Northeast Submarket (not to be confused with the Northeast
Region) is the subject of this analysis. As identified by Reis, it is
delineated in the map at right and by the boundaries of Wallingford,
Hamden, North Haven, and Cheshire towns and New Haven County.
Office Submarket
The Office Submarket is compared to the nearest metropolitan area (New Haven) as well as the larger
region (Northeast) and the nation. The New Haven Metro Market, shown below, consists of six Submarkets:
1 – CBD 2 – New Haven 3 - East
4 – West 5 – Northwest 6 – Northeast
Source: Reis, Bing Maps
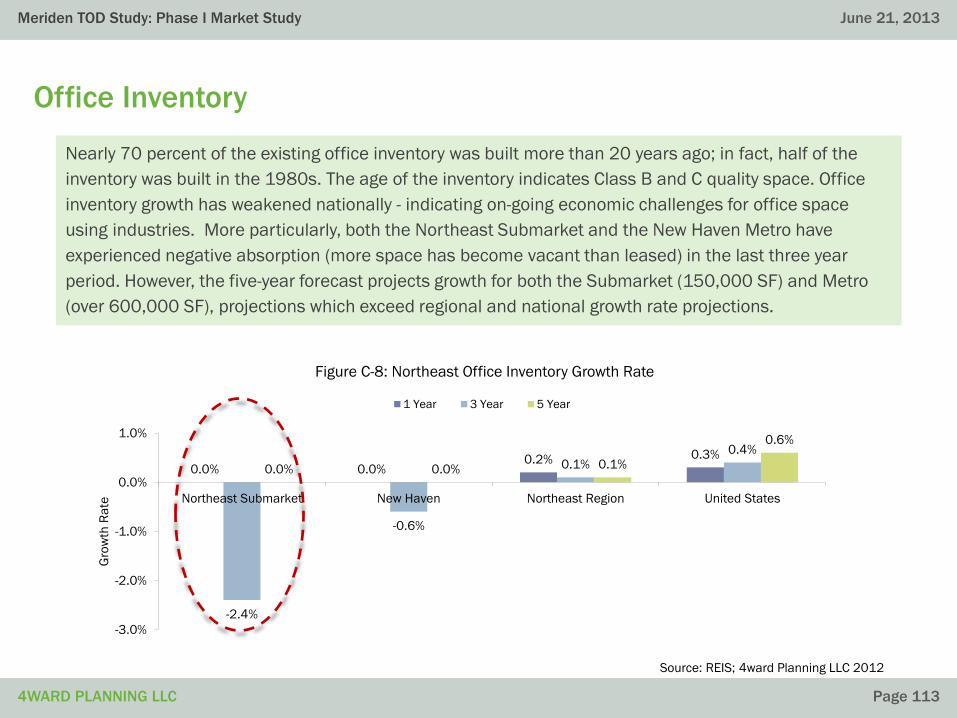
[Project Name]
4WARD PLANNING LLC
June 19, 2013
Page 113
Meriden TOD Study: Phase I Market Study
4WARD PLANNING LLC
June 21, 2013
Page 113
0.0% 0.0%0.2% 0.3%
-2.4%
-0.6%
0.1%
0.4%
0.0% 0.0% 0.1%
0.6%
-3.0%
-2.0%
-1.0%
0.0%
1.0%
Northeast Submarket New Haven Northeast Region United States
Gro
wth
Ra
te
Figure C-8: Northeast Office Inventory Growth Rate
1 Year 3 Year 5 Year
Office Inventory
Nearly 70 percent of the existing office inventory was built more than 20 years ago; in fact, half of the
inventory was built in the 1980s. The age of the inventory indicates Class B and C quality space. Office
inventory growth has weakened nationally - indicating on-going economic challenges for office space
using industries. More particularly, both the Northeast Submarket and the New Haven Metro have
experienced negative absorption (more space has become vacant than leased) in the last three year
period. However, the five-year forecast projects growth for both the Submarket (150,000 SF) and Metro
(over 600,000 SF), projections which exceed regional and national growth rate projections.
Source: REIS; 4ward Planning LLC 2012

[Project Name]
4WARD PLANNING LLC
June 19, 2013
Page 114
Meriden TOD Study: Phase I Market Study
4WARD PLANNING LLC
June 21, 2013
Page 114
Office Asking Rent
The median asking rent for office space in the Northeast Submarket is approximately $19 per square
foot. Asking rents have been relatively flat since 2008 (1.8 percent decline overall) and effective annual
rents (which includes incentives such as free rent and discounts) has decreased by nearly eight-percent.
A lower and decreasing effective rent indicates that landlords are finding it difficult to rent space. Reis
projects that both asking and effective rents in the Northeast Submarket will increase in the next five
years, but growth in lease rates will still lag behind regional and national rates. Broker interviews and
research on Loopnet.com suggests that the effective rent around the Meriden transit station is
approximately $8 per square foot – a rate far too low to justify development of new office space.
Source: REIS; 4ward Planning LLC 2012
$18.85 $18.57 $18.43 $18.59 $18.51
$15.61 $14.47 $14.37 $14.48 $14.40
$0.00
$2.00
$4.00
$6.00
$8.00
$10.00
$12.00
$14.00
$16.00
$18.00
$20.00
2008 Q3 2009 Q3 2010 Q3 2011 Q3 2012 Q3
Le
ase
Ra
te (
$)
Figure C-9: Office Asking and Effective Rent, Northeast Submarket
Asking Rent
Effective Rent
The average submarket lease terms for office properties in
the Northeast Submarket include a four-year lease term, a
6.3 percent leasing commission, and approximately $8.40
per square foot in commercial expenses annually. Tenant
improvements average $23.10 per square foot. Leasing
incentives include an average 7.7 percent contract rent
discount (CRD) from asking price and approximately
two months of free rent.
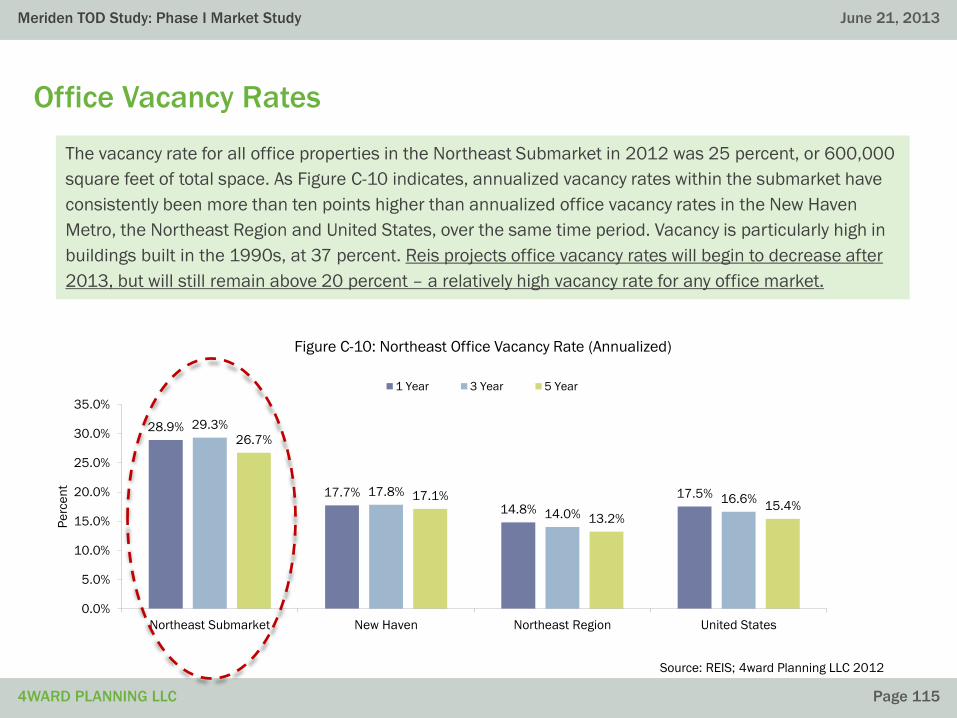
[Project Name]
4WARD PLANNING LLC
June 19, 2013
Page 115
Meriden TOD Study: Phase I Market Study
4WARD PLANNING LLC
June 21, 2013
Page 115
28.9%
17.7%
14.8%
17.5%
29.3%
17.8%
14.0%
16.6%
26.7%
17.1%
13.2%15.4%
0.0%
5.0%
10.0%
15.0%
20.0%
25.0%
30.0%
35.0%
Northeast Submarket New Haven Northeast Region United States
Pe
rce
nt
Figure C-10: Northeast Office Vacancy Rate (Annualized)
1 Year 3 Year 5 Year
The vacancy rate for all office properties in the Northeast Submarket in 2012 was 25 percent, or 600,000
square feet of total space. As Figure C-10 indicates, annualized vacancy rates within the submarket have
consistently been more than ten points higher than annualized office vacancy rates in the New Haven
Metro, the Northeast Region and United States, over the same time period. Vacancy is particularly high in
buildings built in the 1990s, at 37 percent. Reis projects office vacancy rates will begin to decrease after
2013, but will still remain above 20 percent – a relatively high vacancy rate for any office market.
Source: REIS; 4ward Planning LLC 2012
Office Vacancy Rates

[Project Name]
4WARD PLANNING LLC
June 19, 2013
Page 116
Meriden TOD Study: Phase I Market Study
4WARD PLANNING LLC
June 21, 2013
Page 116
Office Absorption
The office space market in the Northeast Submarket has demonstrated fluctuating absorption in the last
five years, with positive absorption in the most recent year and negative absorption over the last three
and five year periods. While there has been no new office space construction in the past three years,
more than 100,000 square feet of office space was absorbed in the last year (2011) within the
submarket. The ratio of construction/absorption of office space in both the submarket and the New
Haven Metro has decreased to zero, according to the Reis third-quarter 2012 report. This trend suggests
little demand for new office development in the Northeast Submarket or the greater region.
Source: REIS; 4ward Planning LLC 2012
25.0%
25.5%
26.0%
26.5%
27.0%
27.5%
28.0%
28.5%
29.0%
29.5%
30.0%
-40,000
-20,000
0
20,000
40,000
60,000
80,000
100,000
120,000
1 Year3 Year5 Year
Pe
rce
nt
Sq
ua
re F
ee
t
Figure C-11: Office Space Trends (Annualized), Northeast Submarket
Construction Absorption Vacancy Rate
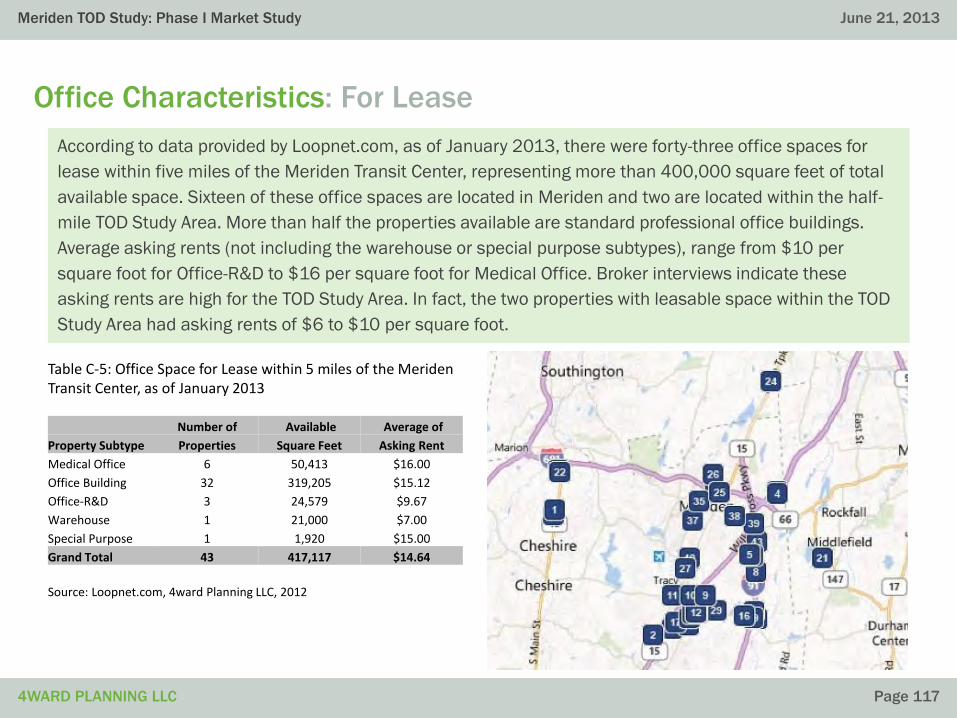
[Project Name]
4WARD PLANNING LLC
June 19, 2013
Page 117
Meriden TOD Study: Phase I Market Study
4WARD PLANNING LLC
June 21, 2013
Page 117
Office Characteristics: For Lease
According to data provided by Loopnet.com, as of January 2013, there were forty-three office spaces for
lease within five miles of the Meriden Transit Center, representing more than 400,000 square feet of total
available space. Sixteen of these office spaces are located in Meriden and two are located within the half-
mile TOD Study Area. More than half the properties available are standard professional office buildings.
Average asking rents (not including the warehouse or special purpose subtypes), range from $10 per
square foot for Office-R&D to $16 per square foot for Medical Office. Broker interviews indicate these
asking rents are high for the TOD Study Area. In fact, the two properties with leasable space within the TOD
Study Area had asking rents of $6 to $10 per square foot.
Table C-5: Office Space for Lease within 5 miles of the Meriden Transit Center, as of January 2013
Number of Available Average of
Property Subtype Properties Square Feet Asking Rent
Medical Office 6 50,413 $16.00
Office Building 32 319,205 $15.12
Office-R&D 3 24,579 $9.67
Warehouse 1 21,000 $7.00
Special Purpose 1 1,920 $15.00
Grand Total 43 417,117 $14.64
Source: Loopnet.com, 4ward Planning LLC, 2012
[Project Name]
4WARD PLANNING LLC
June 19, 2013
Page 118
Meriden TOD Study: Phase I Market Study
4WARD PLANNING LLC
June 21, 2013
Page 118
Takeaway: Office Trends
The combination of high vacancy rates and little new office product delivered within the Northeast
Submarket over the past five years indicates the area encompassing Meriden has little attraction for large
corporate office space users. Anecdotal evidence from real estate brokers and property owners, as well as
general observations, suggest this finding holds particularly true for the half-mile radius surrounding the
transit center. While Reis forecasts indicate that regional office market vacancy rates will decline, effective
rents will increase over the next five years, and 150,000 square feet of inventory will enter the market, the
question remains whether the TOD Study Area will be poised to capture this growth, given the amount of
office space currently vacant and the extremely low rental rates currently asked in the half-mile area.
In the near-term, office demand within the TOD study area will likely need to be met by the existing
inventory of Class B and C buildings (older buildings having relatively few amenities and limited
floorplates). Such buildings will have greatest appeal to small business professionals such as attorneys,
accountants, architects and consultants. Indeed, many of these types of professionals – solo practitioners
and small firms – seek out such space for purposes of achieving lower overhead costs and as a matter of
personal choice (desiring the aesthetics of older buildings).
Like residential development, however, new office development within the TOD study area, if it is to occur
over the near-term, will likely require public incentives (contribution of land, tax abatements and low-cost
financing) in order to make development financially viable.

ECONOMIC AND REAL ESTATE ANALYSIS FOR SUSTAINABLE LAND USE OUTCOMES ™ECONOMIC AND REAL ESTATE ANALYSIS FOR SUSTAINABLE LAND USE OUTCOMES ™
Office Supply-Demand Analysis

[Project Name]
4WARD PLANNING LLC
June 19, 2013
Page 120
Meriden TOD Study: Phase I Market Study
4WARD PLANNING LLC
June 21, 2013
Page 120
Methodology: Key Steps for Deriving Office Demand
Projecting 2019 Primary Jobs
To determine projected office space demand, primary jobs in the Meriden Transit Center PMA were
projected through 2019 based on 2010 primary jobs data and Bureau of Labor Statistics industry
growth rates. Primary jobs were then aggregated into industry sectors.
Estimating the Number of Office Workers
A National Center for Real Estate Research study has estimated the percentage of workers in various
industry sectors that typically work in an office environment. Using these percentages, we were able to
estimate the number of workers in the Meriden Transit Center primary market area who would work in
an office.
Determining Office Space Demand
Assuming a space requirement of 150 square feet per worker, the total demand for office space was
estimated based on the projected office workers for each year through 2019.
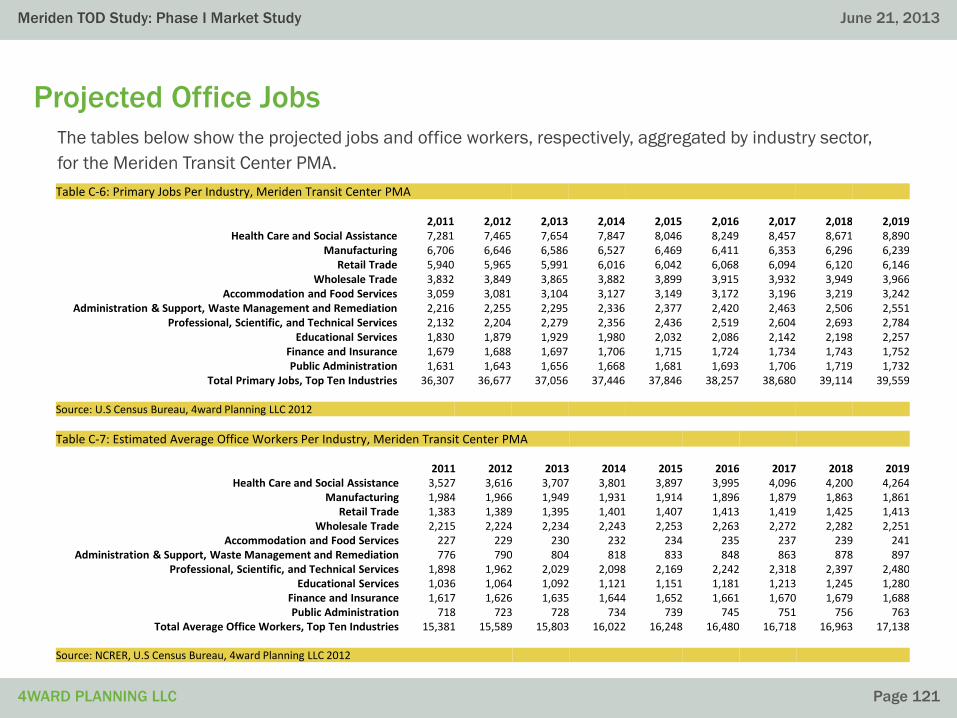
[Project Name]
4WARD PLANNING LLC
June 19, 2013
Page 121
Meriden TOD Study: Phase I Market Study
4WARD PLANNING LLC
June 21, 2013
Page 121
The tables below show the projected jobs and office workers, respectively, aggregated by industry sector,
for the Meriden Transit Center PMA.
Projected Office Jobs
Table C-6: Primary Jobs Per Industry, Meriden Transit Center PMA
2,011 2,012 2,013 2,014 2,015 2,016 2,017 2,018 2,019Health Care and Social Assistance 7,281 7,465 7,654 7,847 8,046 8,249 8,457 8,671 8,890
Manufacturing 6,706 6,646 6,586 6,527 6,469 6,411 6,353 6,296 6,239Retail Trade 5,940 5,965 5,991 6,016 6,042 6,068 6,094 6,120 6,146
Wholesale Trade 3,832 3,849 3,865 3,882 3,899 3,915 3,932 3,949 3,966Accommodation and Food Services 3,059 3,081 3,104 3,127 3,149 3,172 3,196 3,219 3,242
Administration & Support, Waste Management and Remediation 2,216 2,255 2,295 2,336 2,377 2,420 2,463 2,506 2,551Professional, Scientific, and Technical Services 2,132 2,204 2,279 2,356 2,436 2,519 2,604 2,693 2,784
Educational Services 1,830 1,879 1,929 1,980 2,032 2,086 2,142 2,198 2,257Finance and Insurance 1,679 1,688 1,697 1,706 1,715 1,724 1,734 1,743 1,752Public Administration 1,631 1,643 1,656 1,668 1,681 1,693 1,706 1,719 1,732
Total Primary Jobs, Top Ten Industries 36,307 36,677 37,056 37,446 37,846 38,257 38,680 39,114 39,559
Source: U.S Census Bureau, 4ward Planning LLC 2012
Table C-7: Estimated Average Office Workers Per Industry, Meriden Transit Center PMA
2011 2012 2013 2014 2015 2016 2017 2018 2019Health Care and Social Assistance 3,527 3,616 3,707 3,801 3,897 3,995 4,096 4,200 4,264
Manufacturing 1,984 1,966 1,949 1,931 1,914 1,896 1,879 1,863 1,861Retail Trade 1,383 1,389 1,395 1,401 1,407 1,413 1,419 1,425 1,413
Wholesale Trade 2,215 2,224 2,234 2,243 2,253 2,263 2,272 2,282 2,251Accommodation and Food Services 227 229 230 232 234 235 237 239 241
Administration & Support, Waste Management and Remediation 776 790 804 818 833 848 863 878 897Professional, Scientific, and Technical Services 1,898 1,962 2,029 2,098 2,169 2,242 2,318 2,397 2,480
Educational Services 1,036 1,064 1,092 1,121 1,151 1,181 1,213 1,245 1,280Finance and Insurance 1,617 1,626 1,635 1,644 1,652 1,661 1,670 1,679 1,688Public Administration 718 723 728 734 739 745 751 756 763
Total Average Office Workers, Top Ten Industries 15,381 15,589 15,803 16,022 16,248 16,480 16,718 16,963 17,138
Source: NCRER, U.S Census Bureau, 4ward Planning LLC 2012

[Project Name]
4WARD PLANNING LLC
June 19, 2013
Page 122
Meriden TOD Study: Phase I Market Study
4WARD PLANNING LLC
June 21, 2013
Page 122
Table C-8 below shows the projected office space demand, aggregated by industry sector, for the
Meriden Transit Center PMA, as derived based on projected office workers and assuming an estimated
requirement of 150 square feet per worker. As shown, the anticipated increase in office space demand
from 2011 to 2019 is approximately 260,000 square feet. Tables C-6 and C-7 on the previous page,
show an estimated increase of approximately 3,253 primary jobs in the top ten industries and
1,757 new office workers, respectively, from 2011 to 2019 in the PMA. On paper, some of this growth
could be absorbed in the TOD Study Area but it should not be expected that the Study Area will absorb
much of this growth based on weak office market shown in the Office Trends section of this report.
Projected Office Space Demand
Table C-8: Estimated Total Office Space Per Industry, Sq Ft., Meriden Transit Center PMA
2011 2012 2013 2014 2015 2016 2017 2018 2019Health Care and Social Assistance 529,022 542,388 556,093 570,144 584,549 599,319 614,462 629,988 639,566
Manufacturing 297,596 294,924 292,276 289,652 287,051 284,474 281,919 279,388 279,191Retail Trade 207,432 208,315 209,202 210,093 210,988 211,887 212,789 213,695 211,964
Wholesale Trade 332,198 333,623 335,055 336,492 337,936 339,386 340,842 342,305 337,663Accommodation and Food Services 34,044 34,292 34,542 34,795 35,048 35,304 35,562 35,821 36,120
Administration & Support, Waste Management and Remediation 116,425 118,494 120,599 122,742 124,923 127,142 129,401 131,701 134,490Professional, Scientific, and Technical Services 284,675 294,334 304,320 314,645 325,321 336,359 347,771 359,571 372,043
Educational Services 155,472 159,596 163,829 168,175 172,637 177,216 181,917 186,743 191,985Finance and Insurance 242,618 243,915 245,219 246,530 247,849 249,174 250,506 251,845 253,216Public Administration 107,646 108,452 109,265 110,084 110,909 111,740 112,578 113,422 114,417
Total Office Space, Top Ten Industries 2,307,126 2,338,334 2,370,401 2,403,352 2,437,210 2,472,000 2,507,747 2,544,477 2,570,654
Source: NCRER, U.S Census Bureau, 4ward Planning LLC 2012
[Project Name]
4WARD PLANNING LLC
June 19, 2013
Page 123
Meriden TOD Study: Phase I Market Study
4WARD PLANNING LLC
June 21, 2013
Page 123
Takeaway: Office Supply-Demand
The office supply-demand analysis indicates a projected 2019 demand for office space of more
than 2.5 million square feet, based on anticipated jobs in the primary market area. This represents
a net demand increase of about 260,000 square feet over 2011 inventory in the PMA. Although
there will be a demand for office space in the next five to ten years, 4ward Planning projects much
of this space will be met by the approximately 600,000 square feet of currently vacant space in the
Northeast Submarket.
Interviews with brokers working in the TOD Study Area caution that demand for office space in the
Study Area, specifically, is still quite low - as evidenced by low inventory, very low effective rents,
and available properties sitting on the market for years. The uncertainty of future investments
related to the proposed new rail service complicates matters (e.g. space identified for
redevelopment is unmarketable). Brokers and property owners also indicate that rehabilitation
costs are prohibitive to existing property owners, given the low current lease rates.
However, none of this precludes new, small-scale professional office from being built in the TOD
Study Area. As the residential population grows, office space such as medical, financial, and other
personal services may develop from the growing customer base. Over the next ten years, but not
likely before five years, it is feasible that the TOD Study Area will achieve new office development of
up to 20,000 square feet

ECONOMIC AND REAL ESTATE ANALYSIS FOR SUSTAINABLE LAND USE OUTCOMES ™ECONOMIC AND REAL ESTATE ANALYSIS FOR SUSTAINABLE LAND USE OUTCOMES ™
Retail Trends Analysis

[Project Name]
4WARD PLANNING LLC
June 19, 2013
Page 125
Meriden TOD Study: Phase I Market Study
4WARD PLANNING LLC
June 21, 2013
Page 125
Methodology
4ward Planning, LLC, conducted an analysis of retail trends and opportunities for the Meriden
TOD Study Area. For the analysis, station areas in the Northeast comparable to Meriden in
terms of a number of demographic metrics were identified. The existing retail establishments
in the Meriden TOD Study Area were compared to retail in the other station areas to assess
what types and amounts of retail development would be appropriate for Meriden as part of a
TOD project.
According to Reconnecting America and the CTOD’s TOD 202: Station Area Planning, How to
Make Great Transit-Oriented Places, Meriden will match most closely the characteristics of a
Transit Town Center, once the increased transit service is in operation. Appropriate supporting
retail for this type of TOD should be a combination of community-serving and destination
retail, with a need for local-serving retail.
As an additional evaluation, the average annual spending per household on a range of goods
and services in 2011 by residents of the Meriden PMA (a 10-minute drive from the station)
was used as a basis to estimate future retail demand in the Meriden TOD Study Area.

[Project Name]
4WARD PLANNING LLC
June 19, 2013
Page 126
Meriden TOD Study: Phase I Market Study
4WARD PLANNING LLC
June 21, 2013
Page 126
Case Studies: Comparable Station Areas
4ward Planning conducted a review of Northeast region cities with transit stations of similar size and
character to Meriden. Density figures, provided by the Center for Transit-Oriented Development (CDOT)
TOD Database, and displayed in Table C-9 below, show that residential density in these communities
ranges from 7 to 15 households per acre.
Station Area (0.5-mile radius)
Meriden, CT
Forest Hills, Jamaica
Plain, Boston, MA
Salem, MAMattapan,
Boston, MAHaverhill,
MA
Revere Beach,
Revere, MA
Roslindale Village,
Boston, MA
New Brunswick,
NJ
East Orange, NJ
Overall Population 60,838 37,468 41,340 36,480 60,879 51,755 29,116 55,444 64,270
Station Area Population 7,294 6,008 7,447 7,861 8,078 8,475 10,343 11,244 14,861
Households 2,902 2,763 3,944 3,106 3,325 3,514 4,467 2,037 6,291
Median Household Income $23,536 $56,786 $58,127 $61,506 $38,754 $44,595 $63,380 $56,276 $30,251
Median Disposable Income $19,703 $50,304 $44,769 $41,365 $32,139 $33,089 $51,199 $39,787 $22,983
Per Capita Income $15,086 $31,438 $37,897 $25,769 $21,486 $20,250 $29,344 $21,476 $16,499
Net Residential Density1 10.3 11.9 10.1 6.6 9.5 13.1 9.3 13.9 15.3
Total Businesses 349 204 837 229 460 138 347 733 372
Total Employees 3,735 3,123 9,897 2,160 4,103 1,391 4,044 13,885 7,549
Employee/Res. Pop. Ratio 0.51 0.52 1.28 0.27 0.48 0.15 0.40 1.41 0.51
Table C-9: Demographic Metrics, Comparable TOD Station Areas (0.5-mile radius)
Source: Center for Transit-Oriented Development TOD Database; Esri Community Analyst, 4ward Planning LLC, 2013
Notes:
1 – Households per residential acre

[Project Name]
4WARD PLANNING LLC
June 19, 2013
Page 127
Meriden TOD Study: Phase I Market Study
4WARD PLANNING LLC
June 21, 2013
Page 127
Station Area (0.5-mile radius)
Meriden, CT
Forest Hills, Jamaica
Plain, Boston, MA
Salem, MAMattapan,
Boston, MAHaverhill,
MA
Revere Beach,
Revere, MA
Roslindale Village,
Boston, MA
New Brunswick,
NJ
East Orange, NJ
Home Improvement Stores 1 3 10 2 2 1 3 1 1
General Merchandise Stores 0 2 1 5 5 3 3 5 2
Food Stores 15 3 17 8 13 15 17 23 21
Auto Dealers, Gas Stations 6 3 10 1 8 2 1 2 4
Apparel & Accessory Stores 0 1 19 10 7 5 8 15 8
Home Furnishings 1 3 13 6 10 2 6 3 5
Eating & Drinking Places 15 14 67 9 49 13 28 94 28
Miscellaneous Retail 16 8 67 7 21 7 19 33 17
Total Retail Locations 56 36 204 48 114 47 84 177 85
Table C-10 below lists characteristics, and the number and type of retail establishments in each station
area as compared to the Meriden Study Area. As shown, the overall number of retail establishments in
each station area ranges from 36 to 204, with Meriden lying on the lower end of the scale with 56 retail
establishments. In addition, specifically, Meriden is among the station areas with the fewest eating and
drinking establishments, with a total of 15.
Table C-10: Retail Metrics, Comparable TOD Station Areas (0.5-mile radius)
Source: Center for Transit-Oriented Development TOD Database; Esri Community Analyst, 4ward Planning LLC, 2013
Case Studies: Comparable Station Areas
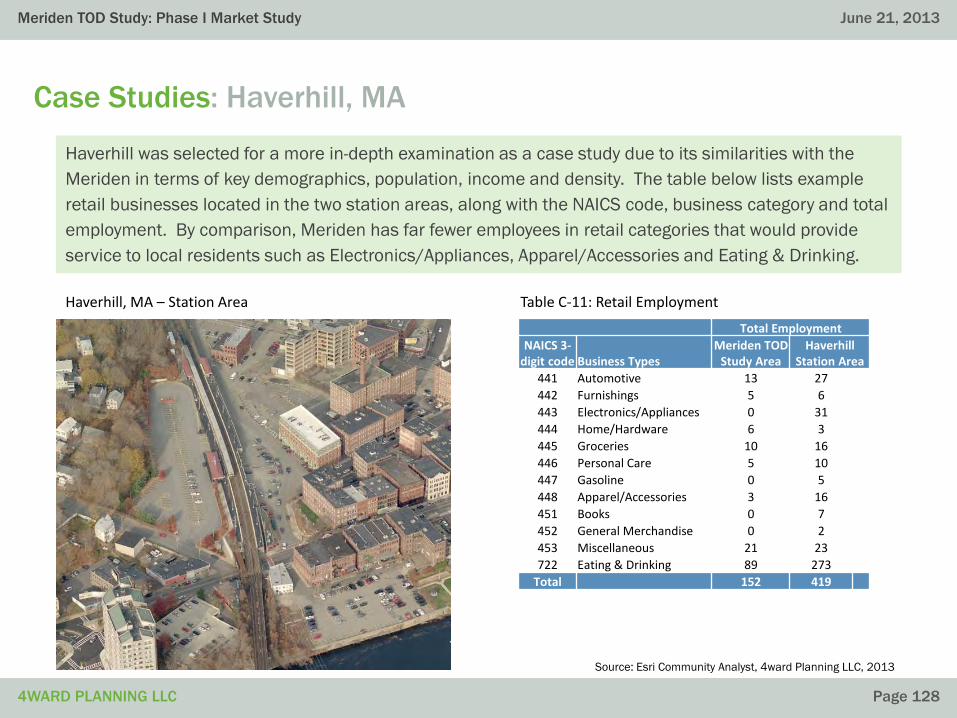
[Project Name]
4WARD PLANNING LLC
June 19, 2013
Page 128
Meriden TOD Study: Phase I Market Study
4WARD PLANNING LLC
June 21, 2013
Page 128
Case Studies: Haverhill, MA
Haverhill was selected for a more in-depth examination as a case study due to its similarities with the
Meriden in terms of key demographics, population, income and density. The table below lists example
retail businesses located in the two station areas, along with the NAICS code, business category and total
employment. By comparison, Meriden has far fewer employees in retail categories that would provide
service to local residents such as Electronics/Appliances, Apparel/Accessories and Eating & Drinking.
Total Employment
NAICS 3-digit code Business Types
Meriden TOD Study Area
Haverhill Station Area
441 Automotive 13 27
442 Furnishings 5 6
443 Electronics/Appliances 0 31
444 Home/Hardware 6 3
445 Groceries 10 16
446 Personal Care 5 10
447 Gasoline 0 5
448 Apparel/Accessories 3 16
451 Books 0 7
452 General Merchandise 0 2
453 Miscellaneous 21 23
722 Eating & Drinking 89 273
Total 152 419
Source: Esri Community Analyst, 4ward Planning LLC, 2013
Table C-11: Retail EmploymentHaverhill, MA – Station Area

[Project Name]
4WARD PLANNING LLC
June 19, 2013
Page 129
Meriden TOD Study: Phase I Market Study
4WARD PLANNING LLC
June 21, 2013
Page 129
Consumer Expenditures: Projected
In order to gauge retail demand based on new residential development in the TOD, retail spending levels were
extrapolated based on estimated dwelling unit totals. A low threshold of 600 new housing units and an upper
threshold of 1,000 new housing units, over the next ten years, were used as estimates. A capture rate of 60 percent
was assumed to represent the percentage of expenditures made within the TOD area, with the balance of
expenditures being made outside of TOD area (e.g., while travelling for work, vacation, etc.) Using Urban Land
Institute standards for retail floor area by spending category, the retail demand, in terms of floor area, was estimated.
As shown below, supportable new retail would range from about 17,000 square feet to 28,000 square feet, based on
the number of new multi-family units constructed and occupied.
The retail demand, as estimated below, is based strictly on consumer expenditures from new multi-family residential
units. It is important to note that these estimates do not account for spending by workers commuting to the area, nor
do they account for spending by people living in the surrounding areas (outside of the half-mile) who may travel to the
TOD to dine and shop. Based on this approach, these retail demand estimates are conservative and represent a
baseline level of demand that would be expected to be higher, given an increase in overall activity within the TOD area.
Retail Expenditures per Household (annually)2011
UnadjustedCapture
Rate 2011 Adjusted Avg. Ann. Sales/SFLow Threshold
600 DUUpper Threshold
1,000 DU
Food: At Home $4,556 60% $2,734 $400 4,100 6,800
Food: Away From Home $3,284 60% $1,971 $320 3,700 6,200
Apparel & Services $1,742 60% $1,045 $240 2,600 4,400
Entertainment $3,258 60% $1,955 $200 5,900 9,800
Personal Care Products & Services $698 60% $419 $400 600 1,000
Total per Household $13,539 Total 16,900 28,200
Table C-12: Retail Demand (SF) by Number of New Dwelling Units
Source: US Census Bureau; Esri; ULI Dollars & Cents of Shopping Centers; 4ward Planning, 2013
[Project Name]
4WARD PLANNING LLC
June 19, 2013
Page 130
Meriden TOD Study: Phase I Market Study
4WARD PLANNING LLC
June 21, 2013
Page 130
Takeaway: Retail
As stated above, appropriate supporting retail for a Transit Town Center, like that proposed for Meriden, is
recommended to be a combination of community-serving and destination retail, with a need for local-
serving retail.
As shown, Meriden currently has fewer retail establishments than existing comparable Transit Town
Center stations. Specifically, the Meriden TOD Study Area currently lags behind similar station areas in
the Eating & Drinking and Miscellaneous Retail categories. Additionally, the Meriden TOD Study Area
currently has no General Merchandise or Apparel and Accessory stores, while each of the comparison
stations has at least one of these types of establishments.
While these comparisons don’t, in and of themselves, indicate a potential demand for particular types of
retail within the proposed Meriden TOD, they serve as instructive for planning purposes. Additionally, as
residential units are planned, accompanying retail should be developed that is targeted towards serving
the convenience needs of those residents, which would call for additional establishments in categories
such as Food/Grocery stores. As office development brings more employees to the area, retail to serve
their needs will be in demand as well – personal services (salons, gyms, dry-cleaners), dining and
drinking establishments.

ECONOMIC AND REAL ESTATE ANALYSIS FOR SUSTAINABLE LAND USE OUTCOMES ™ECONOMIC AND REAL ESTATE ANALYSIS FOR SUSTAINABLE LAND USE OUTCOMES ™
TOD VIABILITY ANALYSIS
[Project Name]
4WARD PLANNING LLC
June 19, 2013
Page 132
Meriden TOD Study: Phase I Market Study
4WARD PLANNING LLC
June 21, 2013
Page 132
Methodology
Incorporating the findings of the various supply & demand analyses conducted as part of the Meriden TOD
Market Study, 4ward Planning, LLC, evaluated the potential to implement each of the TOD projects
identified in the Meriden TOD Master Plan (April 2012) produced by the consulting firm of Parsons
Brinkerhoff (PB).
The purpose of the evaluation is to assess whether or not each land use project is viable as well as to
determine the appropriate timeframes and near-term challenges associated with each project.
[Project Name]
4WARD PLANNING LLC
June 19, 2013
Page 133
Meriden TOD Study: Phase I Market Study
4WARD PLANNING LLC
June 21, 2013
Page 133
Retail Demand
Retail demand in the vicinity of the Meriden TOD Study Area is expected to be largely limited to
convenience retail and community serving retail with a focus on the local market. Some retail may also
serve users of the transit service as they pass through on the way to and from work. As the residential
units come on line, accompanying retail could be developed in categories such as food/grocery, general
merchandise, apparel/accessories and personal services such as salons, gyms, dining/drinking
Projections of retail demand outlined in the PB study far exceed what is indicated by the 4ward analysis.
Given an upper threshold of projected retail to serve potentially 1,000 residential units, an appropriate
amount of retail to serve this market is estimated to be up to an additional 28,000 SF. As this would need
to accompany construction of residential facilities in the area, it would be expected to viable in a five- to
ten-year window.
A limited amount of destination retail or entertainment/museum space may be viable in the long-term if
Meriden were to experience marked growth in key demographic segments such as empty-nesters or young
professionals.

[Project Name]
4WARD PLANNING LLC
June 19, 2013
Page 134
Meriden TOD Study: Phase I Market Study
4WARD PLANNING LLC
June 21, 2013
Page 134
Retail Projects
The table below itemizes the individual retail development proposed as part of the conceptual plan drafted
by Parsons Brinkerhoff. As shown, the development concepts represent a total of nearly 150,000 SF.
Based on limited demand for retail in the area, largely convenience retail serving the local market, the retail
developments proposed by the PB study are not viable beyond a maximum of about 28,000 SF.
District Site Gross Floor Area (SF)
Historical/Commercial 24/38/44 Colony Street 27,250
HUB Park Site 1 (State St.) 22,750
HUB Park Site 2 (Pratt St.) 32,750
HUB Park 29/31/35/45 Pratt St. 4,650
HUB Park Mills Block 18,000
Hanover Factory H/116 Cook 43,600
Total 149,000
Table D-1: Proposed Retail Development Projects
Source: PB; City of Meriden; 4ward Planning LLC 2013
[Project Name]
4WARD PLANNING LLC
June 19, 2013
Page 135
Meriden TOD Study: Phase I Market Study
4WARD PLANNING LLC
June 21, 2013
Page 135
Residential Demand
In the Northeastern market, construction of multi-family residential Inventory is expected to be flat through
2016. Current low vacancy rates in Meriden, however, indicate a tight rental market and potential latent
demand, favoring residential construction in the local area. This trend is supported by strong positive
growth in non-family households, suggesting high receptivity for TOD-style multi-family units.
An analysis of residential supply & demand indicates a potential demand for new housing units in the
Meriden area, a percentage of which can be expected to be captured in the TOD Study Area. The low
threshold is estimated to be 600 units with an upper estimate of 1,000 units. Units developed should be
targeted to young professionals looking for smaller residences with access to amenities, jobs,
entertainment and transit access.
The appropriate timeframe for this development would be paced-out over a ten-year period, beginning at
about the time that the new commuter rail service begins full operations in 2016.
The near-term challenge associated with this is financial in nature. Due to the current low rents in the
market, a cap on pricing in the near-term can be expected, limiting the upside for developers until housing
demand increases markedly. For the early-phase projects to get underway, public support in the way of up-
front subsidies and incentives will be needed to overcome this near-term challenge.
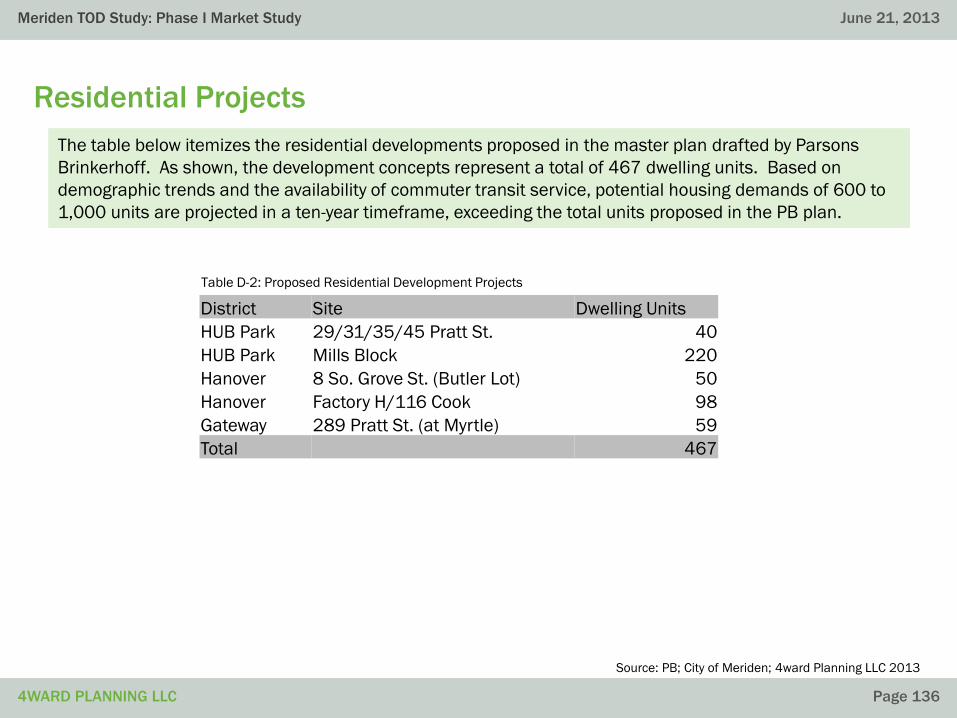
[Project Name]
4WARD PLANNING LLC
June 19, 2013
Page 136
Meriden TOD Study: Phase I Market Study
4WARD PLANNING LLC
June 21, 2013
Page 136
Residential Projects
The table below itemizes the residential developments proposed in the master plan drafted by Parsons
Brinkerhoff. As shown, the development concepts represent a total of 467 dwelling units. Based on
demographic trends and the availability of commuter transit service, potential housing demands of 600 to
1,000 units are projected in a ten-year timeframe, exceeding the total units proposed in the PB plan.
Table D-2: Proposed Residential Development Projects
Source: PB; City of Meriden; 4ward Planning LLC 2013
District Site Dwelling Units
HUB Park 29/31/35/45 Pratt St. 40
HUB Park Mills Block 220
Hanover 8 So. Grove St. (Butler Lot) 50
Hanover Factory H/116 Cook 98
Gateway 289 Pratt St. (at Myrtle) 59
Total 467
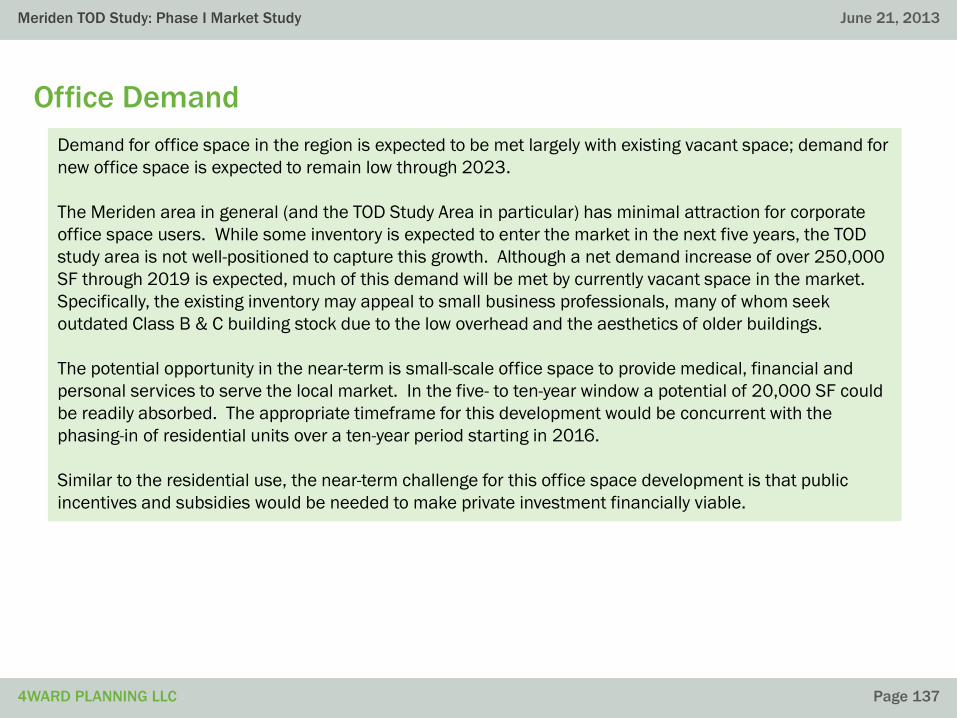
[Project Name]
4WARD PLANNING LLC
June 19, 2013
Page 137
Meriden TOD Study: Phase I Market Study
4WARD PLANNING LLC
June 21, 2013
Page 137
Office Demand
Demand for office space in the region is expected to be met largely with existing vacant space; demand for
new office space is expected to remain low through 2023.
The Meriden area in general (and the TOD Study Area in particular) has minimal attraction for corporate
office space users. While some inventory is expected to enter the market in the next five years, the TOD
study area is not well-positioned to capture this growth. Although a net demand increase of over 250,000
SF through 2019 is expected, much of this demand will be met by currently vacant space in the market.
Specifically, the existing inventory may appeal to small business professionals, many of whom seek
outdated Class B & C building stock due to the low overhead and the aesthetics of older buildings.
The potential opportunity in the near-term is small-scale office space to provide medical, financial and
personal services to serve the local market. In the five- to ten-year window a potential of 20,000 SF could
be readily absorbed. The appropriate timeframe for this development would be concurrent with the
phasing-in of residential units over a ten-year period starting in 2016.
Similar to the residential use, the near-term challenge for this office space development is that public
incentives and subsidies would be needed to make private investment financially viable.

[Project Name]
4WARD PLANNING LLC
June 19, 2013
Page 138
Meriden TOD Study: Phase I Market Study
4WARD PLANNING LLC
June 21, 2013
Page 138
Office Projects
The table below itemizes the office development projects proposed as part of the conceptual plan drafted
by Parsons Brinkerhoff. As shown, the development concepts represent a total of about 160,000 SF.
Based on narrow demand for new office space in the Meriden TOD Study Area, the office developments
proposed by the PB study are not viable beyond a maximum of about 20,000 SF.
District Site Gross Floor Area (SF)
Historical/Commercial 24/38/44 Colony Street 48,250
HUB Park Site 1 (State St.) 22,750
HUB Park Site 2 (Pratt St.) 29,650
HUB Park Mills Block 58,000
Total 158,650
Table D-3: Proposed Office Development Projects
Source: PB; City of Meriden; 4ward Planning LLC 2013
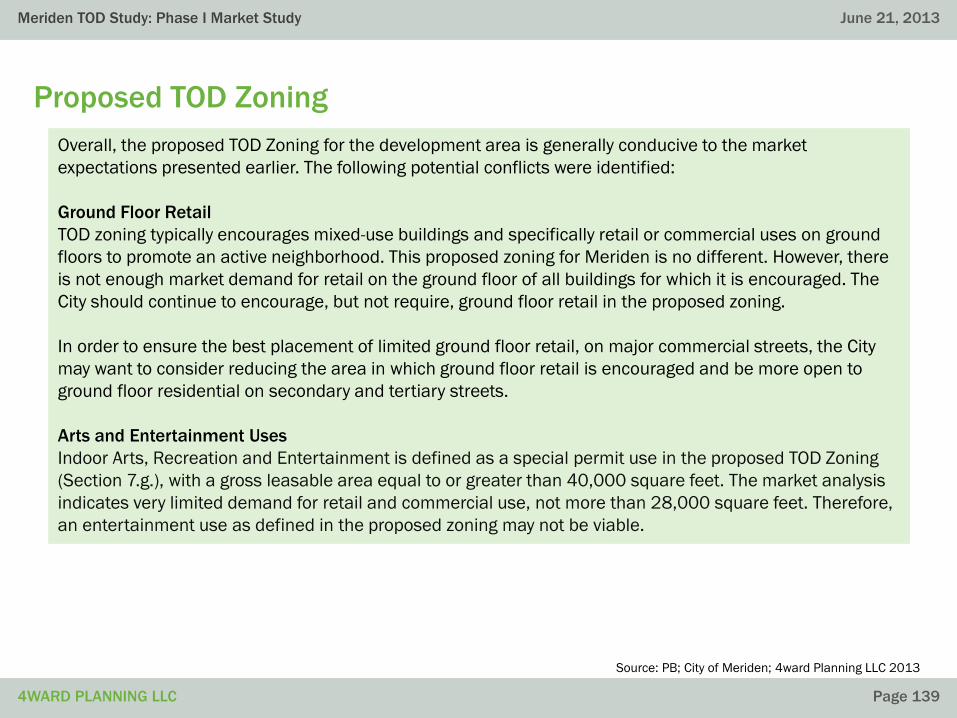
[Project Name]
4WARD PLANNING LLC
June 19, 2013
Page 139
Meriden TOD Study: Phase I Market Study
4WARD PLANNING LLC
June 21, 2013
Page 139
Proposed TOD Zoning
Overall, the proposed TOD Zoning for the development area is generally conducive to the market
expectations presented earlier. The following potential conflicts were identified:
Ground Floor Retail
TOD zoning typically encourages mixed-use buildings and specifically retail or commercial uses on ground
floors to promote an active neighborhood. This proposed zoning for Meriden is no different. However, there
is not enough market demand for retail on the ground floor of all buildings for which it is encouraged. The
City should continue to encourage, but not require, ground floor retail in the proposed zoning.
In order to ensure the best placement of limited ground floor retail, on major commercial streets, the City
may want to consider reducing the area in which ground floor retail is encouraged and be more open to
ground floor residential on secondary and tertiary streets.
Arts and Entertainment Uses
Indoor Arts, Recreation and Entertainment is defined as a special permit use in the proposed TOD Zoning
(Section 7.g.), with a gross leasable area equal to or greater than 40,000 square feet. The market analysis
indicates very limited demand for retail and commercial use, not more than 28,000 square feet. Therefore,
an entertainment use as defined in the proposed zoning may not be viable.
Source: PB; City of Meriden; 4ward Planning LLC 2013

[Project Name]
4WARD PLANNING LLC
June 19, 2013
Page 140
Meriden TOD Study: Phase I Market Study
4WARD PLANNING LLC
June 21, 2013
Page 140
Proposed Uses / Size
District Site
Office
(GSF)
Retail, Museum
or Restaurant
(GSF)
Residential
(Dwelling
Units)
Total Floor
Area (GSF) Ownership
Existing
Zoning
Proposed
TOD Sub-
District Viability
Historical/
Commercial
24/38/44 Colony
Street48,250 27,250 - 75,500
City of
Meriden
C-1/
CCDD
Historic/
CBD
Total retail development of up to
28KSF is viable; proposed office
exceeds local market demand
HUB Park
Site 1 (State St.) 22,750 22,750 - 45,500City of
MeridenC-1 Park
Not viable; proposed
development exceeds local
market demand
Site 2 (Pratt St.) 29,650 32,750 - 62,400City of
MeridenC-1 Park
Office development of up to
30KSF is viable; proposed retail
exceeds local market demand
29/31/35/45
Pratt St.- 4,650 40 48,650
Various
PrivateC-1 Park
Residential component is viable;
proposed retail exceeds local
market demand
Mills Block 58,000 18,000 220 318,000
CSC
Investments/
City of
Meriden
R-4/
M-3Park
Residential component is viable;
proposed office/retail exceeds
local market demand
Hanover
8 So. Grove St.
(Butler Lot)- - 50 55,000
Silver City
Thrift
Store/City of
Meriden
C-1/
CCDDHanover Viable
Factory H/116
Cook- 43,600 98 151,400
City of
Meriden
C-1/R-3/
M-3Hanover
Residential component is viable;
proposed retail exceeds local
market demand
Gateway289 Pratt St. (at
Myrtle)- - 59 64,900
290 Pratt St
LLCM-3 Gateway Viable
Total 158,650 149,000 467 821,350
Notes:
Average floor area per dwelling unit is 1,100 SF
Required parking for each development is accommodated on-site
Table D-4: Project Viability Matrix, Conceptual Development Projects
Source: PB; City of Meriden; 4ward Planning LLC 2013
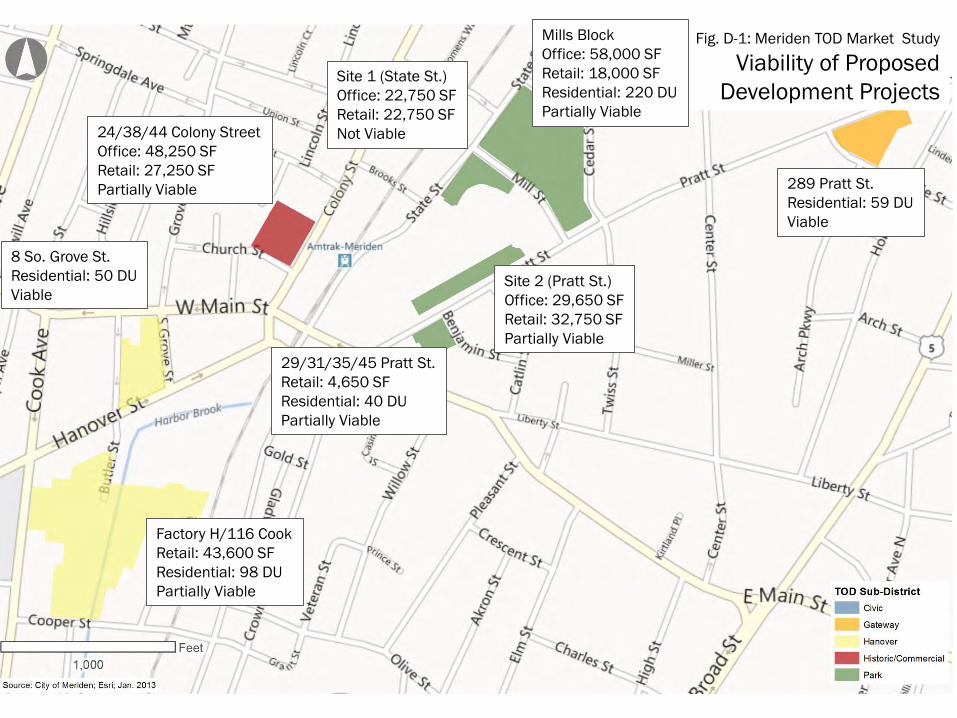
24/38/44 Colony Street
Office: 48,250 SF
Retail: 27,250 SF
Partially Viable
Site 1 (State St.)
Office: 22,750 SF
Retail: 22,750 SF
Not Viable
Site 2 (Pratt St.)
Office: 29,650 SF
Retail: 32,750 SF
Partially Viable
29/31/35/45 Pratt St.
Retail: 4,650 SF
Residential: 40 DU
Partially Viable
Factory H/116 Cook
Retail: 43,600 SF
Residential: 98 DU
Partially Viable
8 So. Grove St.
Residential: 50 DU
Viable
289 Pratt St.
Residential: 59 DU
Viable
Fig. D-1: Meriden TOD Market Study
Viability of Proposed
Development Projects
Mills Block
Office: 58,000 SF
Retail: 18,000 SF
Residential: 220 DU
Partially Viable

[Project Name]
4WARD PLANNING LLC
June 19, 2013
Page 142
Meriden TOD Study: Phase I Market Study
4WARD PLANNING LLC
June 21, 2013
Page 142
General & Limiting Conditions
4ward Planning LLC has endeavored to ensure that the reported data and information contained in this report are
complete, accurate, and relevant. All estimates, assumptions, and extrapolations are based on methodological techniques
employed by 4ward Planning LLC and believed to be reliable. 4ward Planning LLC assumes no responsibility for
inaccuracies in reporting by the client, its agents, representatives, or any other third party data source used in the
preparation of this report.
Further, 4ward Planning LLC makes no warranty or representation concerning the manifestation of the estimated or
projected values or results contained in this study. This study may not be used for purposes other than that for which it is
prepared or for which prior written consent has first been obtained from 4ward Planning LLC. This study is qualified in its
entirety by, and should be considered in light of, the above limitations, conditions, and considerations.

For more information, please contact:Todd Poole
412.428.9644
Sam Eisenbeiser, AICP
617.207.4033

ECONOMIC AND REAL ESTATE ANALYSIS FOR SUSTAINABLE LAND USE OUTCOMES ™ECONOMIC AND REAL ESTATE ANALYSIS FOR SUSTAINABLE LAND USE OUTCOMES ™
APPENDIX
A. Underutilized Parcels
B. Infrastructure and Parking Demand Assessment
C. Housing Affordability Analysis
D. Developer Interviews Summary
E. Meriden-Area Employee Online Survey Summary
F. Meriden-Area Telephone Survey Summary
G. Meriden-Area Telephone Survey Full Report