Embed Size (px)
Citation preview
Systematic reviews of prognostic studies 3
meta-analytical approaches in systematic reviews of
prognostic studies
Thomas PA Debray, Karel GM Moons
for the Cochrane Prognosis Review Methods Group
We have no actual or potential conflict of interest in relation
to this presentation
Conflict of interest

Basic & Advanced CoursesSystematic Reviews, Meta AnalysisClinical Epidemiology & Statistics
• Systematic Reviews of Randomised Intervention Studies
• Systematic Reviews of Diagnostic Studies
• Systematic Reviews of Prognostic Studies
• Meta-Analysis with Individual Participants Data
• Numerous courses on primary studies (randomised trials,
side effects, diagnostic accuracy, prognosis and etiology studies)
• ….and many more
www.msc-epidemiology.eu www.msc-epidemiology.online
Face to Face & OnlineAccessible from all over the world
More than 50 courses…
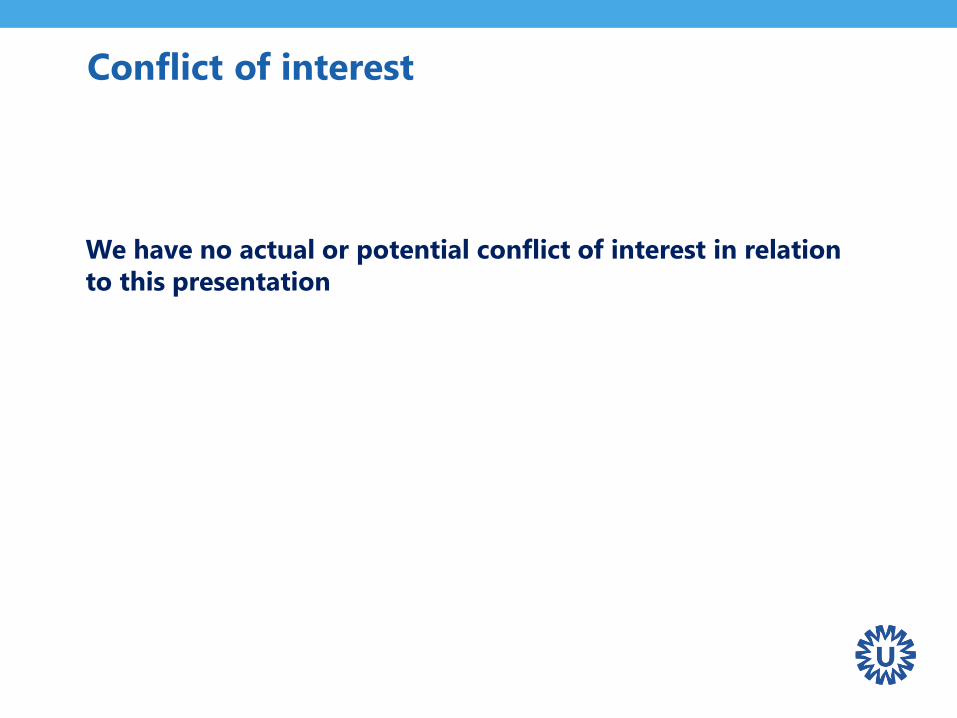
Prediction
• Risk prediction = foreseeing / foretelling
… (probability) of something that is yet unknown
• Turn available information (predictors) into a statement
about the probability:
… diagnosis
… prognosis
What is the big difference between diagnostic and
prognostic ‘prediction’?
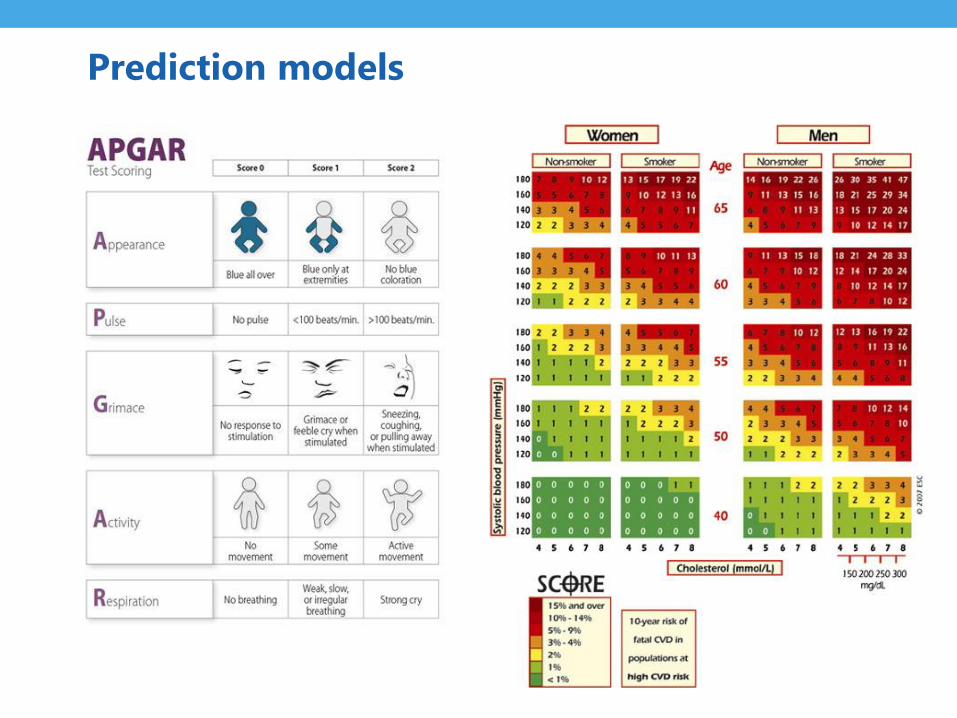
Prediction models
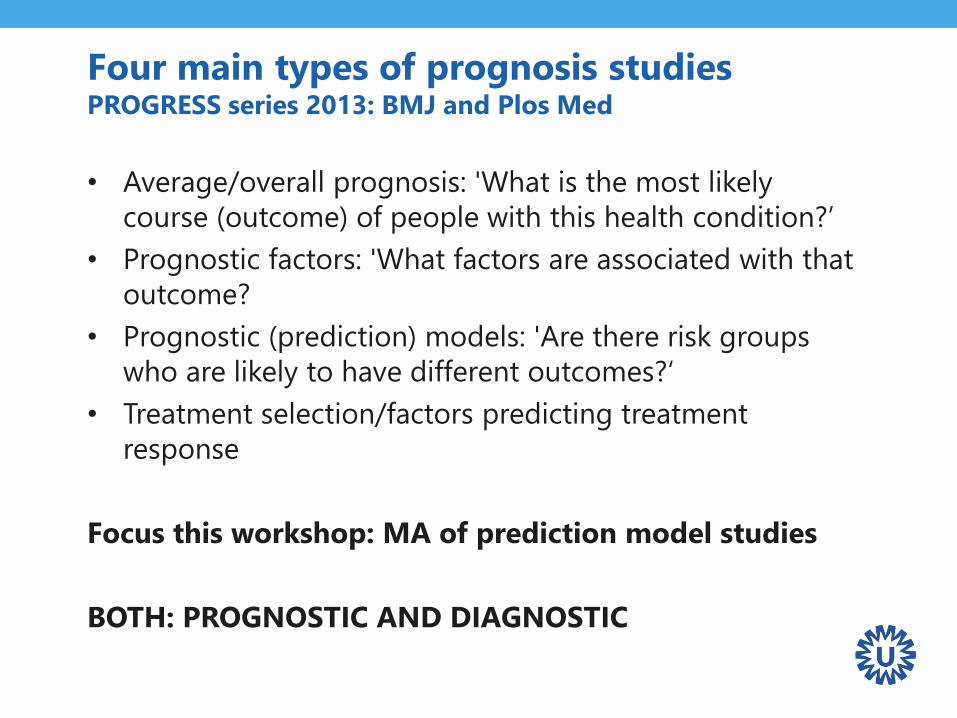
Four main types of prognosis studiesPROGRESS series 2013: BMJ and Plos Med
• Average/overall prognosis: 'What is the most likely
course (outcome) of people with this health condition?’
• Prognostic factors: 'What factors are associated with that
outcome?
• Prognostic (prediction) models: 'Are there risk groups
who are likely to have different outcomes?‘
• Treatment selection/factors predicting treatment
response
Focus this workshop: MA of prediction model studies
BOTH: PROGNOSTIC AND DIAGNOSTIC
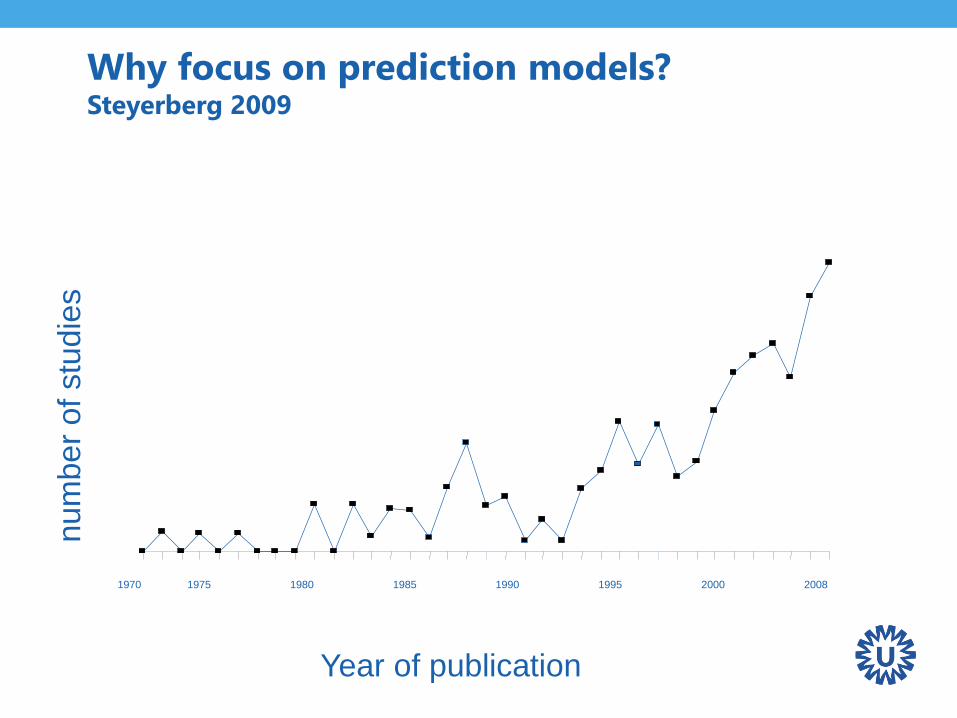
Why focus on prediction models? Steyerberg 2009
1970 1975 1980 1985 1990 1995 2000 2008
Year of publication
num
ber
of
stu
die
s
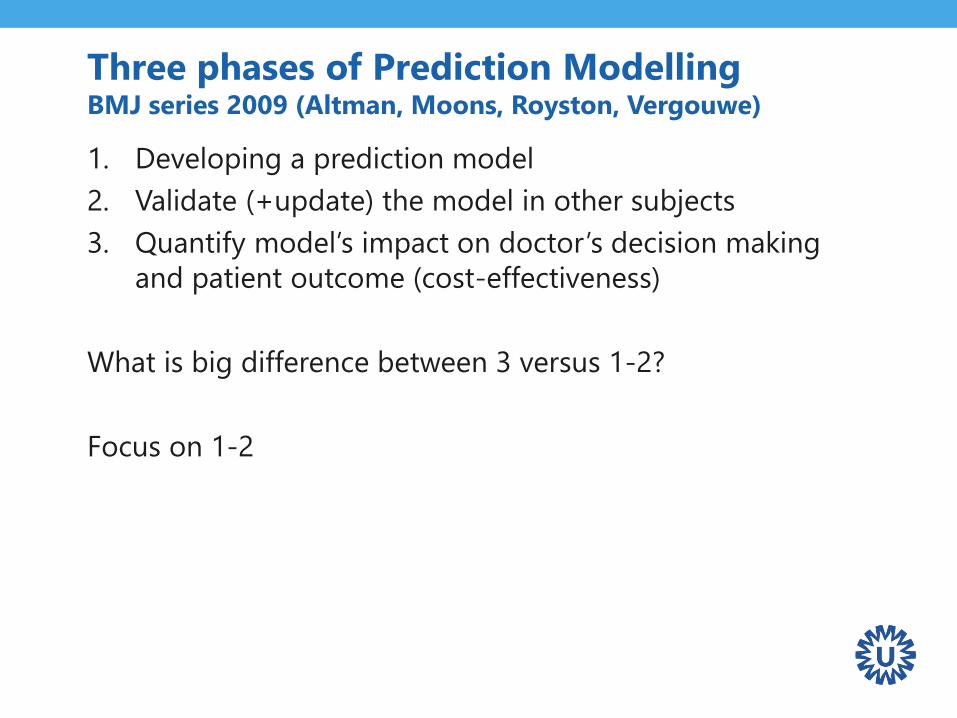
Three phases of Prediction ModellingBMJ series 2009 (Altman, Moons, Royston, Vergouwe)
1. Developing a prediction model
2. Validate (+update) the model in other subjects
3. Quantify model’s impact on doctor’s decision making
and patient outcome (cost-effectiveness)
What is big difference between 3 versus 1-2?
Focus on 1-2
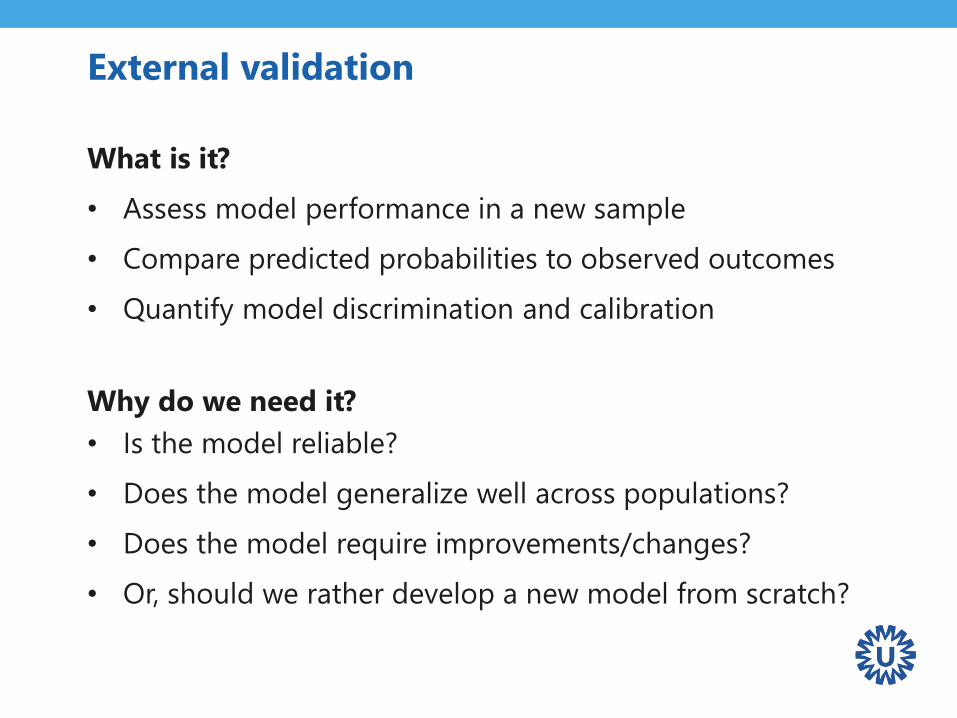
External validation
What is it?
• Assess model performance in a new sample
• Compare predicted probabilities to observed outcomes
• Quantify model discrimination and calibration
Why do we need it?
• Is the model reliable?
• Does the model generalize well across populations?
• Does the model require improvements/changes?
• Or, should we rather develop a new model from scratch?
Prediction model performance measures
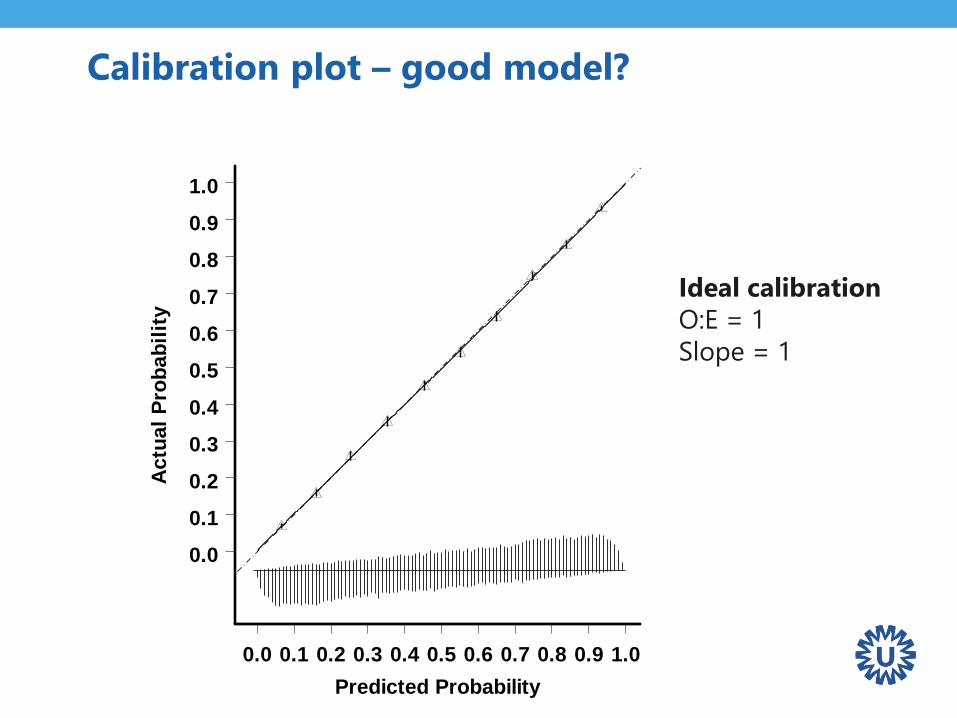
Calibration plot – good model?
0.0 0.1 0.2 0.3 0.4 0.5 0.6 0.7 0.8 0.9 1.0
Predicted Probability
0.0
0.1
0.2
0.3
0.4
0.5
0.6
0.7
0.8
0.9
1.0
Actu
al
Pro
bab
ilit
y
Ideal calibration
O:E = 1
Slope = 1
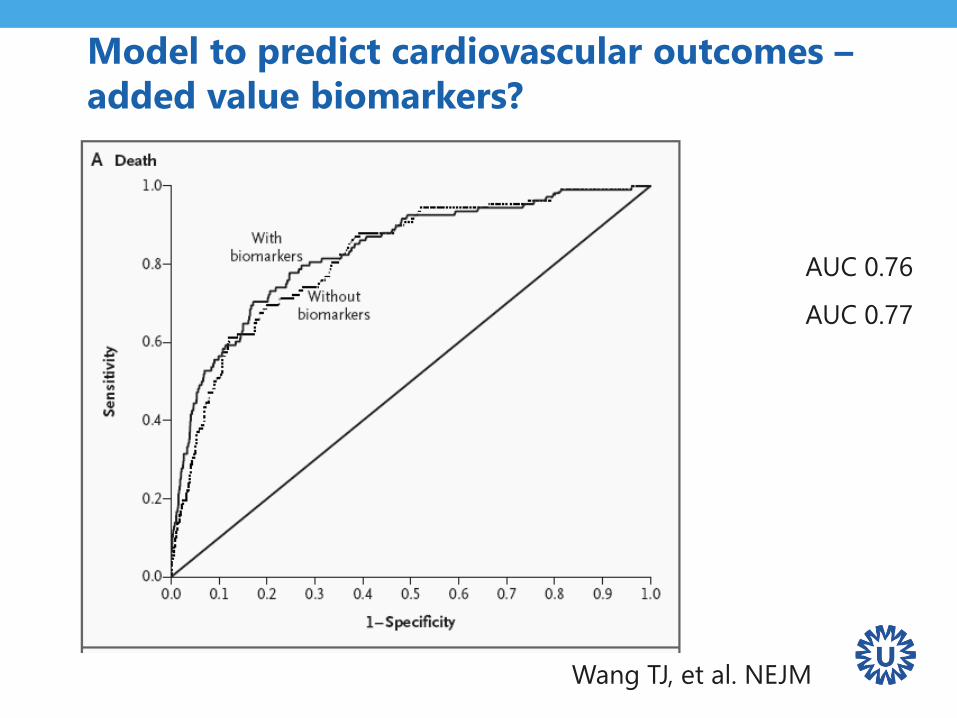
Model to predict cardiovascular outcomes –
added value biomarkers?
AUC 0.76
AUC 0.77
Wang TJ, et al. NEJM
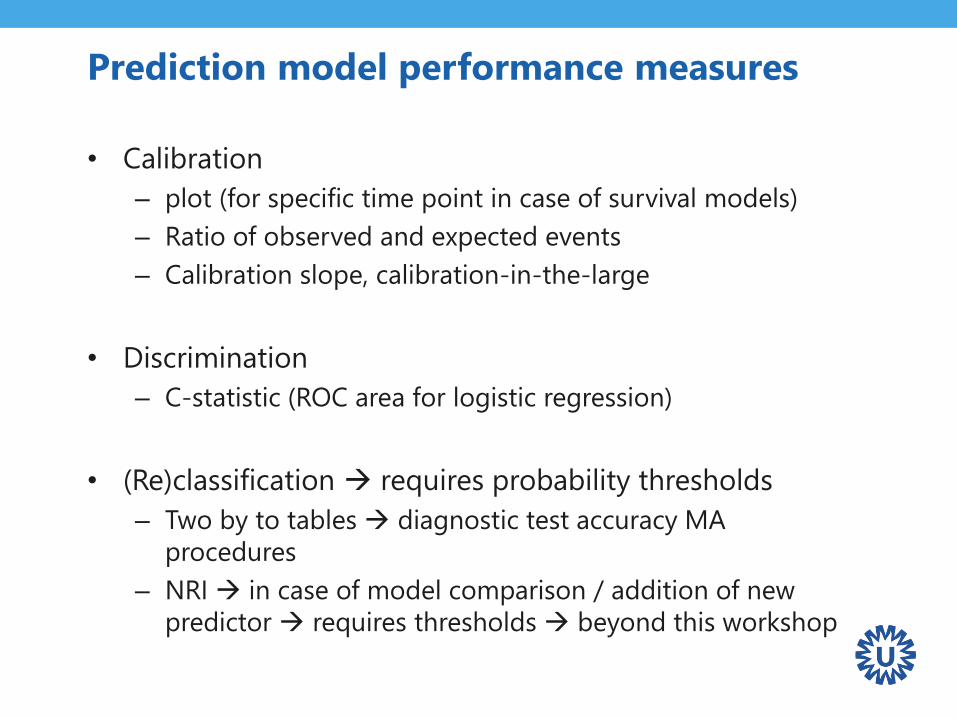
Prediction model performance measures
• Calibration
– plot (for specific time point in case of survival models)
– Ratio of observed and expected events
– Calibration slope, calibration-in-the-large
• Discrimination
– C-statistic (ROC area for logistic regression)
• (Re)classification requires probability thresholds
– Two by to tables diagnostic test accuracy MA
procedures
– NRI in case of model comparison / addition of new
predictor requires thresholds beyond this workshop
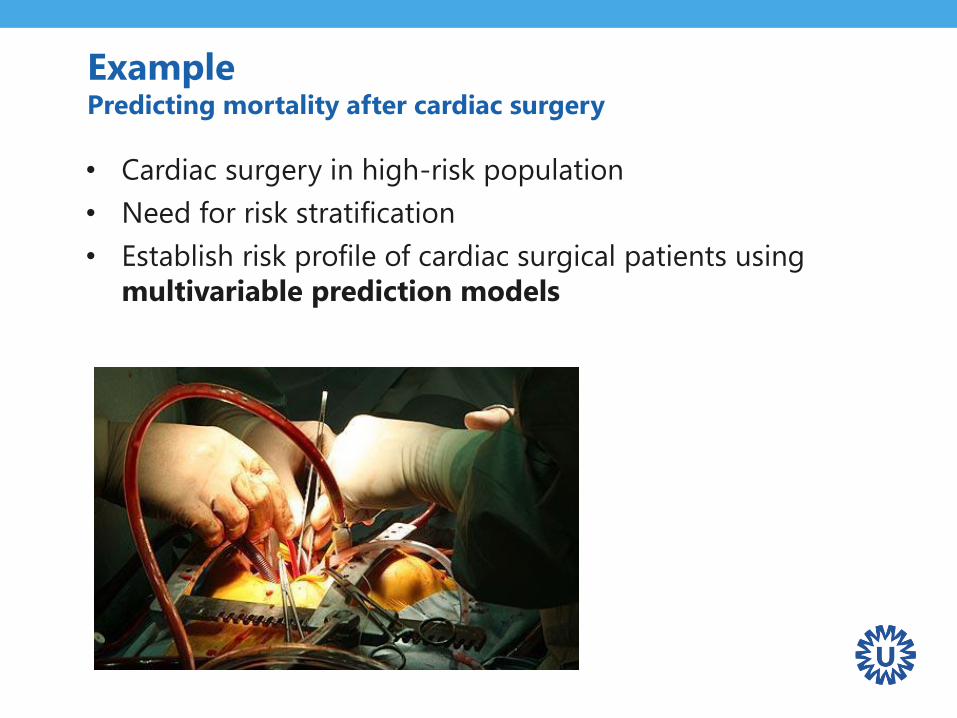
ExamplePredicting mortality after cardiac surgery
• Cardiac surgery in high-risk population
• Need for risk stratification
• Establish risk profile of cardiac surgical patients using
multivariable prediction models
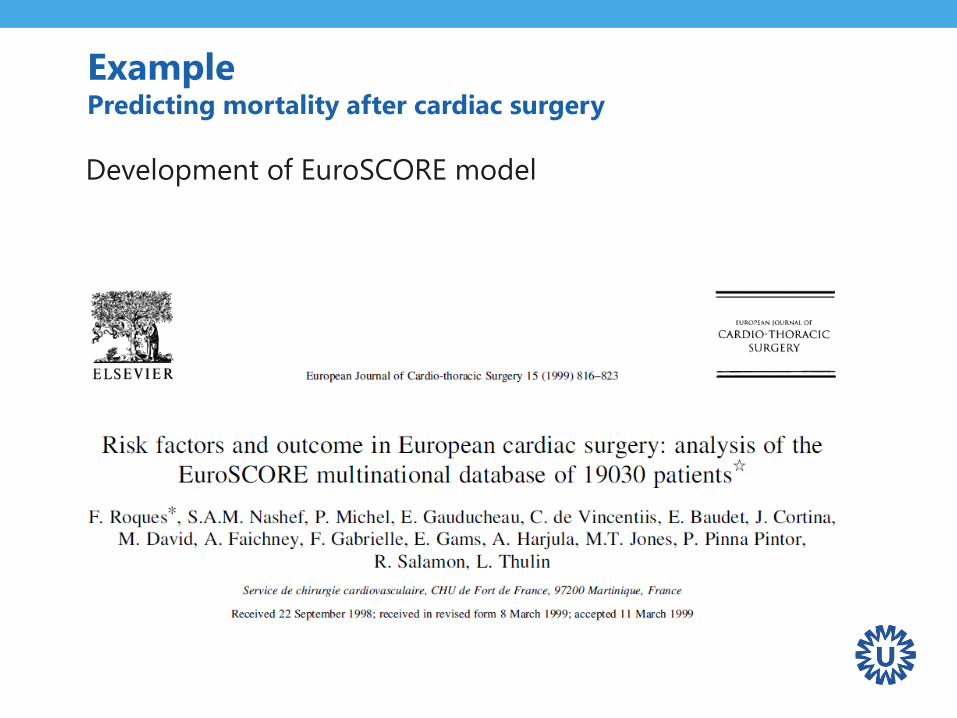
ExamplePredicting mortality after cardiac surgery
Development of EuroSCORE model
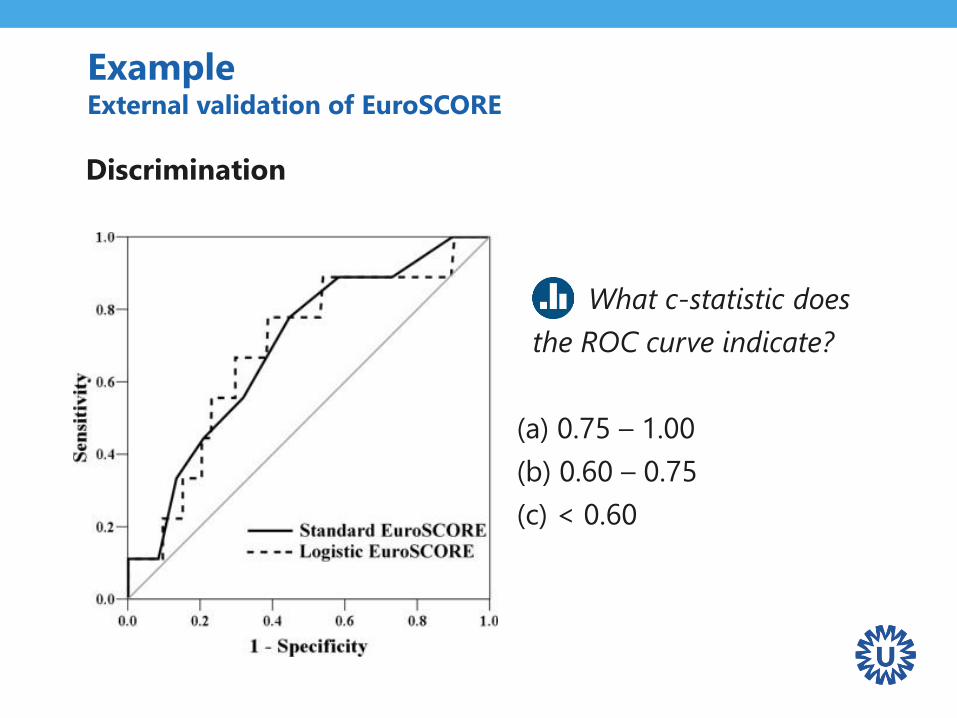
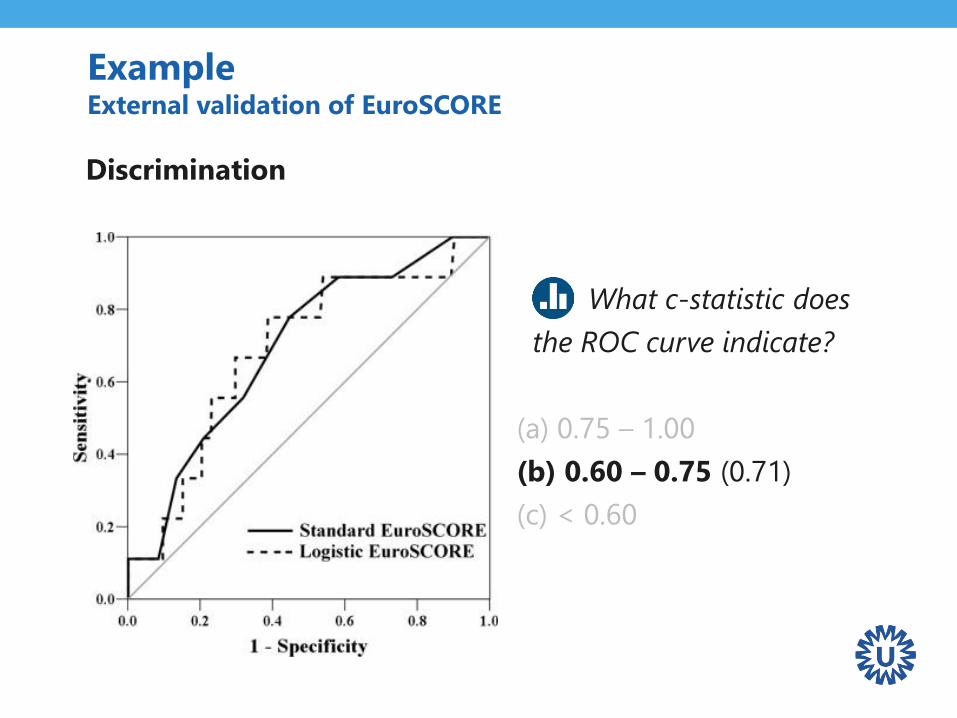
ExampleExternal validation of EuroSCORE
Discrimination
What c-statistic does
the ROC curve indicate?
(a) 0.75 – 1.00
(b) 0.60 – 0.75
(c) < 0.60
ExampleExternal validation of EuroSCORE
Discrimination
What c-statistic does
the ROC curve indicate?
(a) 0.75 – 1.00
(b) 0.60 – 0.75 (0.71)
(c) < 0.60
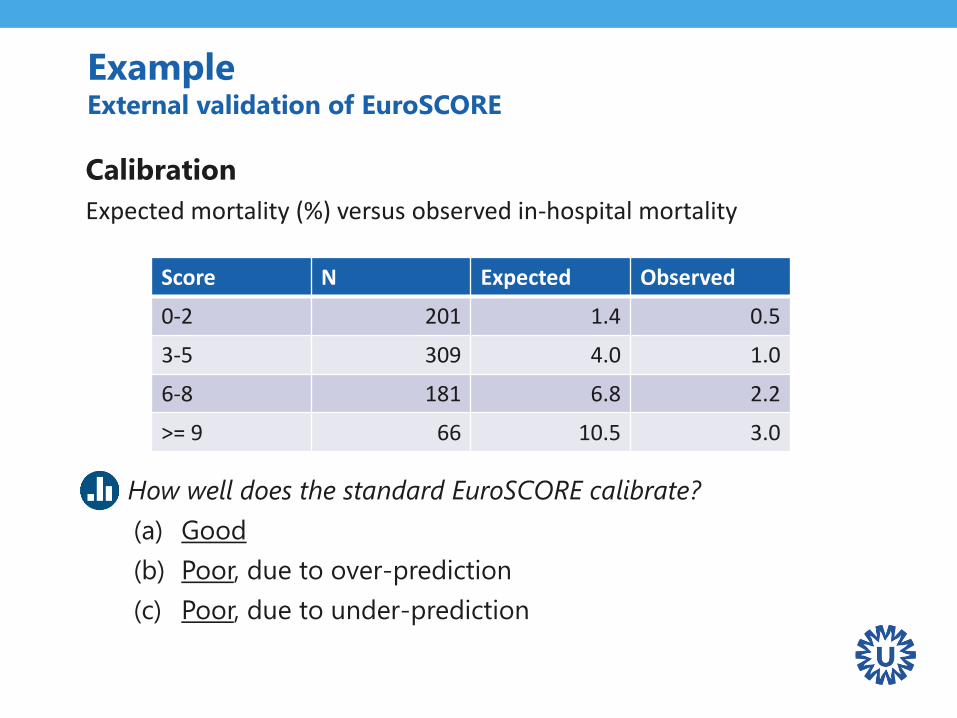
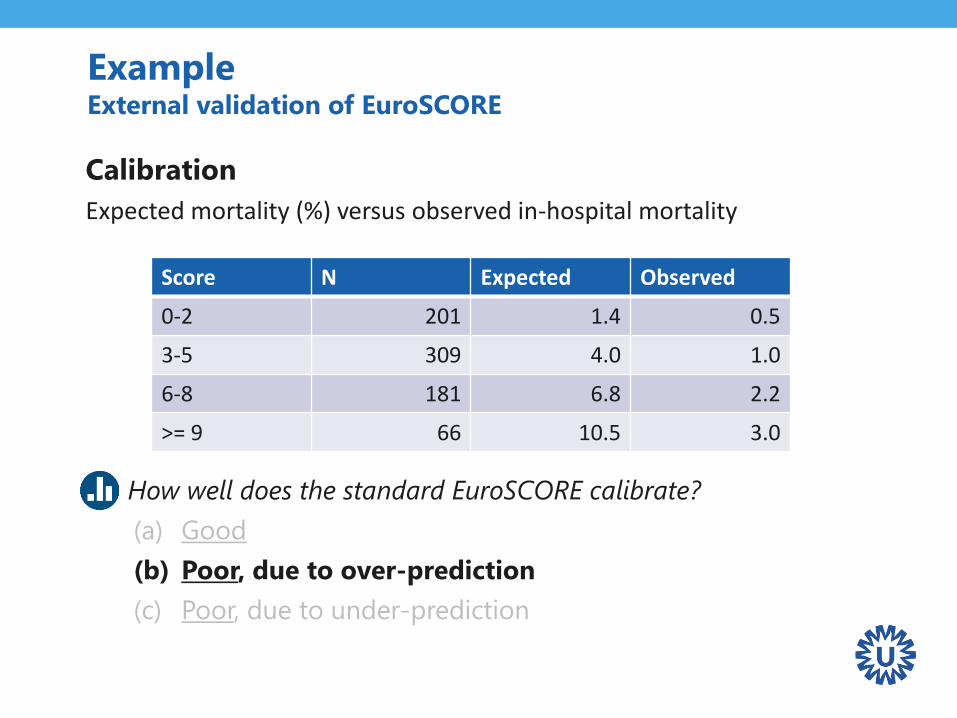
ExampleExternal validation of EuroSCORE
Calibration
Expected mortality (%) versus observed in-hospital mortality
Q: How well does the standard EuroSCORE calibrate?
(a) Good
(b) Poor, due to over-prediction
(c) Poor, due to under-prediction
Score N Expected Observed
0-2 201 1.4 0.5
3-5 309 4.0 1.0
6-8 181 6.8 2.2
>= 9 66 10.5 3.0
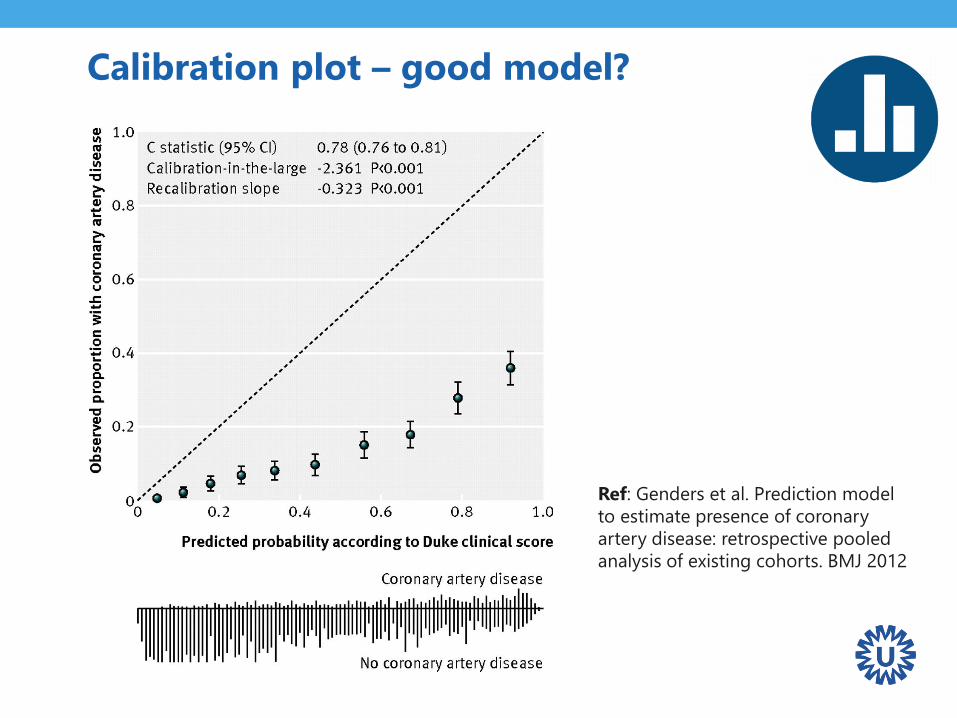
Calibration plot – good model?
Ref: Genders et al. Prediction model
to estimate presence of coronary
artery disease: retrospective pooled
analysis of existing cohorts. BMJ 2012
Caveats in prediction modeling research
• Lack of external validation studies
• Lack of head-to-head comparisons
• Lack of data to tailor the model to local circumstances
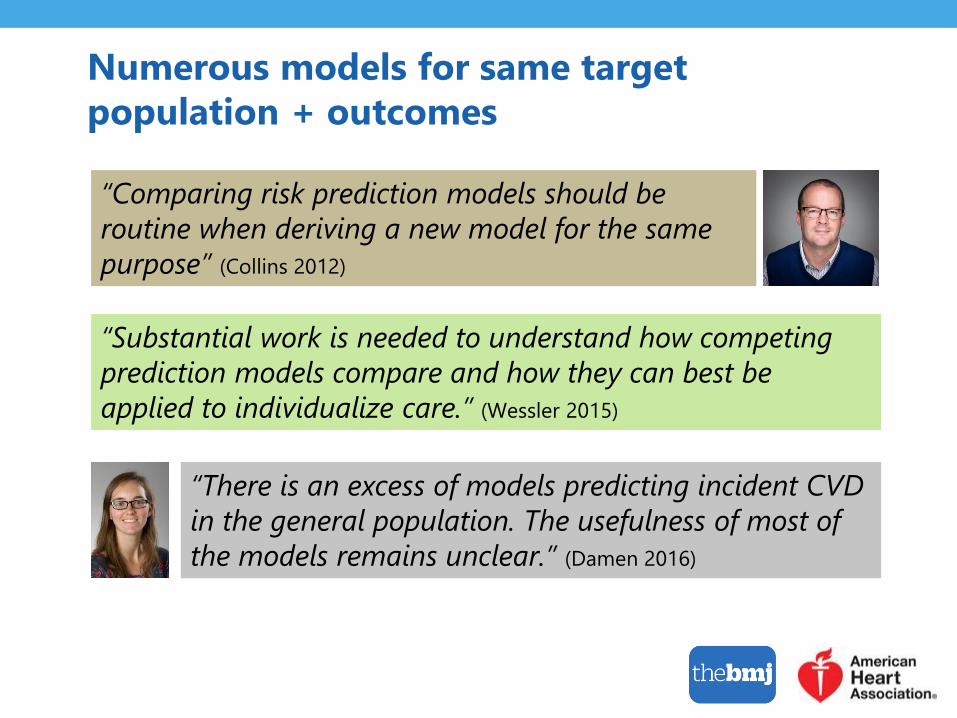
Numerous models for same target
population + outcomes
“Substantial work is needed to understand how competing
prediction models compare and how they can best be
applied to individualize care.” (Wessler 2015)
“Comparing risk prediction models should be
routine when deriving a new model for the same
purpose” (Collins 2012)
“There is an excess of models predicting incident CVD
in the general population. The usefulness of most of
the models remains unclear.” (Damen 2016)
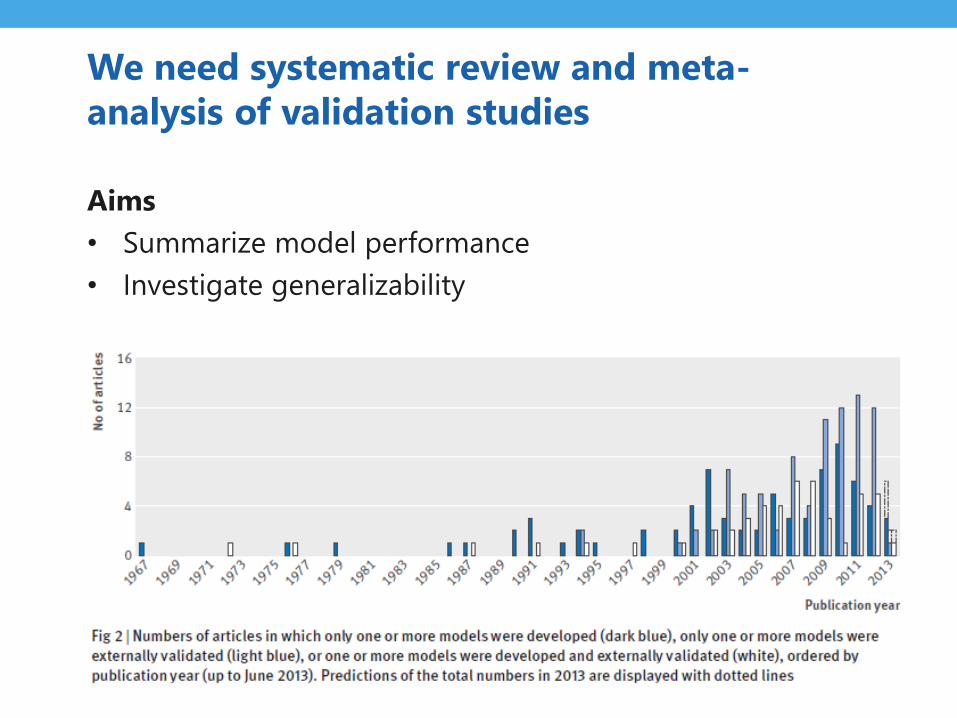
We need systematic review and meta-
analysis of validation studies
Aims
• Summarize model performance
• Investigate generalizability

Systematic review and meta-analysis of
prediction models increasingly popular
0
100
200
300
400
500
600
700
Nu
mb
er
of
MA
pu
blic
atio
ns
Diagnostic Prognostic Any (prediction)

Recommended steps
1. Formulating the review question
2. Formulating the search strategy
3. Critical appraisal (CHARMS & PROBAST)
4. Quantitive data extraction
– Discrimination
– Calibration
5. Meta-analysis
6. Reporting (TRIPOD)
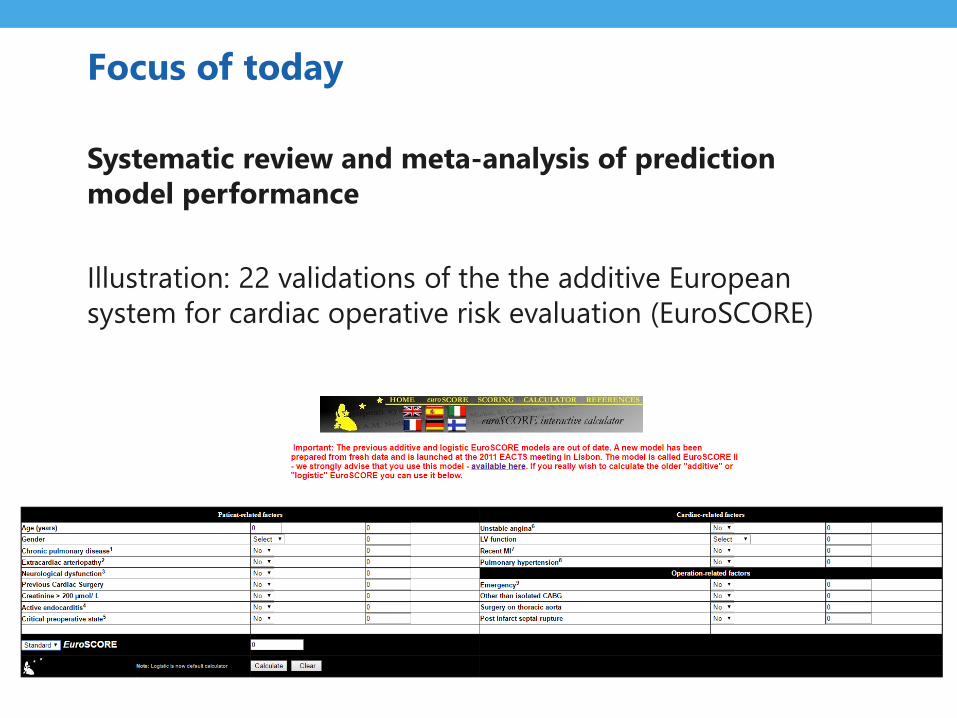
Focus of today
Systematic review and meta-analysis of prediction
model performance
Illustration: 22 validations of the the additive European
system for cardiac operative risk evaluation (EuroSCORE)
Step 1Formulating the review question and protocol
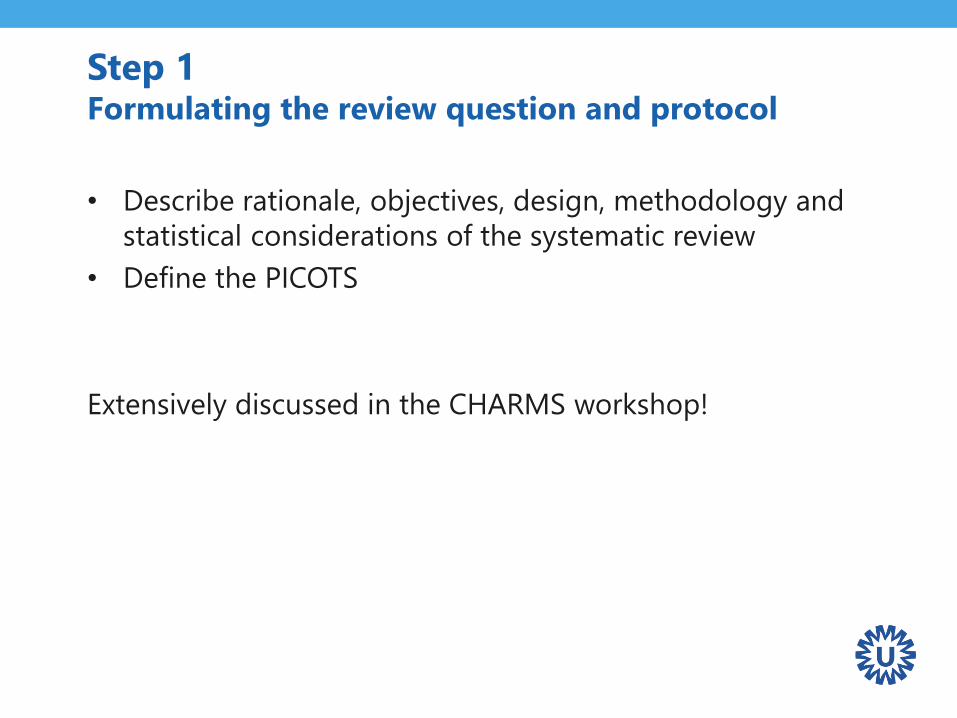
Step 1 Formulating the review question and protocol
• Describe rationale, objectives, design, methodology and
statistical considerations of the systematic review
• Define the PICOTS
Extensively discussed in the CHARMS workshop!
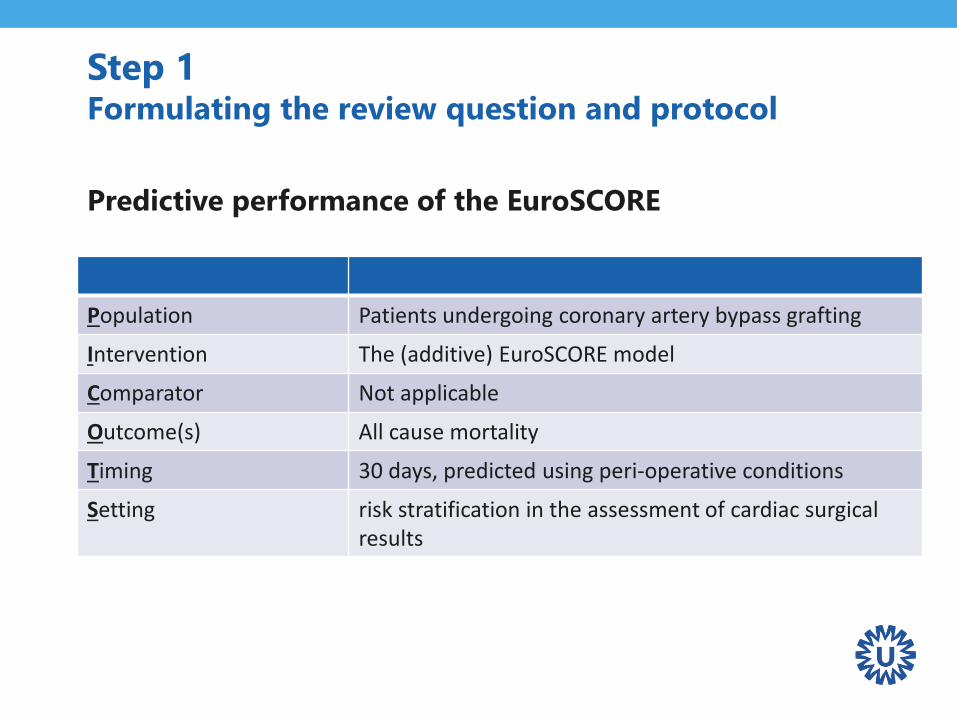
Step 1Formulating the review question and protocol
Predictive performance of the EuroSCORE
Population Patients undergoing coronary artery bypass grafting
Intervention The (additive) EuroSCORE model
Comparator Not applicable
Outcome(s) All cause mortality
Timing 30 days, predicted using peri-operative conditions
Setting risk stratification in the assessment of cardiac surgical results

Step 2Formulating the search strategy
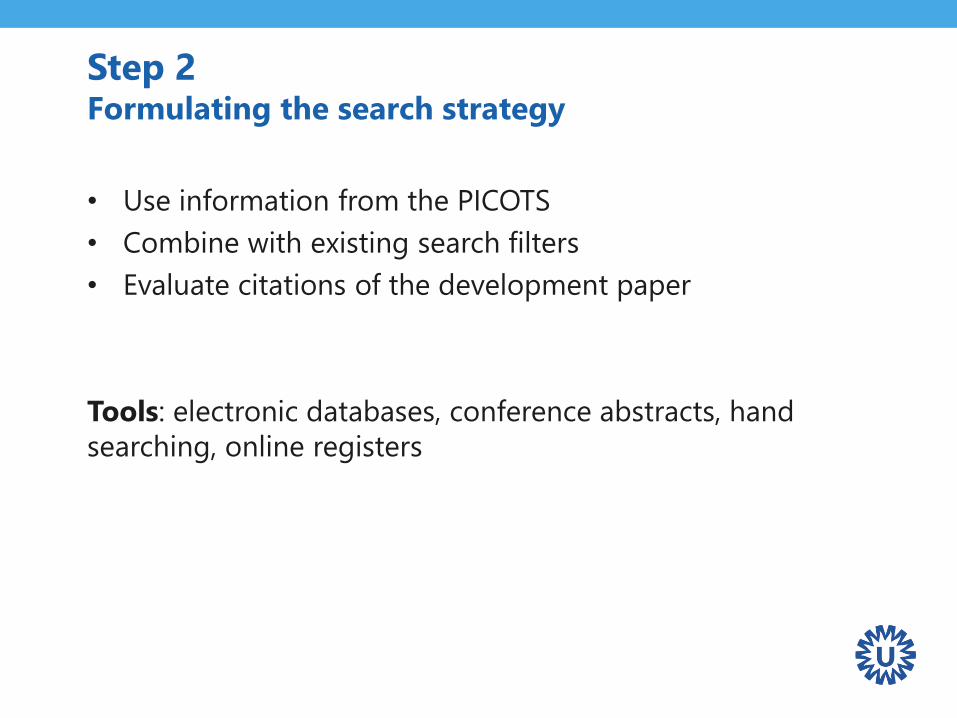
Step 2 Formulating the search strategy
• Use information from the PICOTS
• Combine with existing search filters
• Evaluate citations of the development paper
Tools: electronic databases, conference abstracts, hand
searching, online registers
Step 3Critical appraisal
Step 3 Critical appraisal
Evaluate bias and applicability of each validation study
• CHARMS checklist
• PROBAST (2o17) – see previous workshop
Decide whether studies should be excluded due to low
quality and/or applicability with respect to the current
review

Step 3 Critical appraisal
Predictive performance of the EuroSCORE
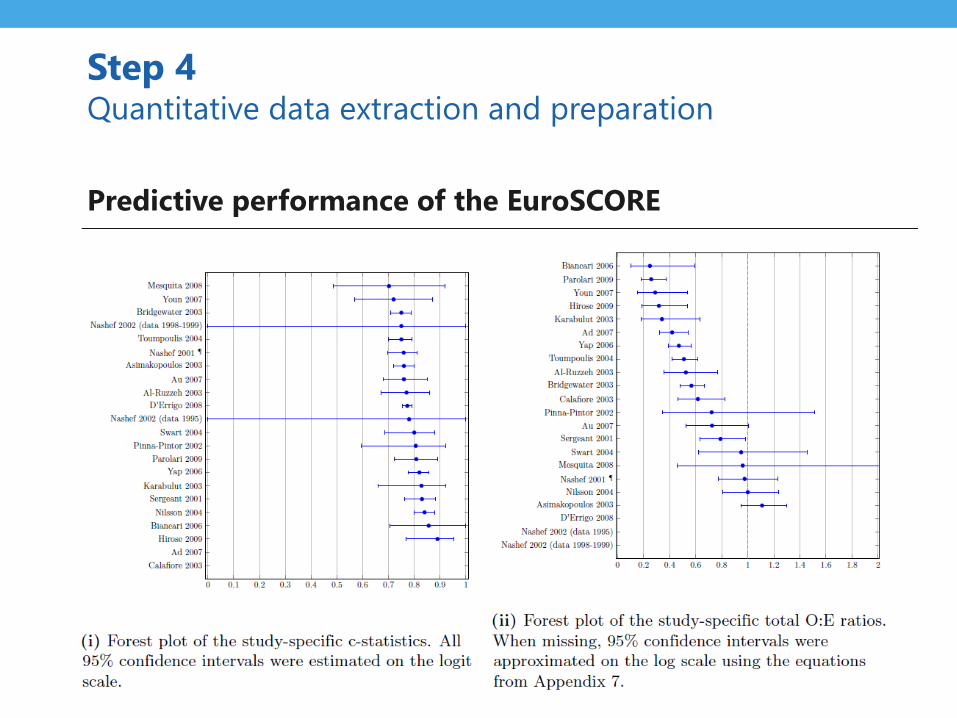
Step 4Quantitative data extraction and preparation
Step 4 Quantitative data extraction and preparation
What statistics can we summarize when
reviewing external validation studies?
Step 4 Quantitative data extraction and preparation
What statistics can we summarize?
• Overall performance
• Model discrimination
• Model calibration
Measures of overall performance
• Explained variation (R2)
• Brier score
However, studying the discriminative ability and calibration
of a model is often more meaningful than an overall
performance measure when we want to appreciate the
quality of model predictions for individuals.
Ref: Steyerberg. Clinical prediction models: a practical approach to development,
validation and updating. Springer 2009.
Step 4 Quantitative data extraction and preparation
Step 4 Quantitative data extraction and preparation
Discrimination
Quantifies the model’s ability to distinguish between events
and non-events
• Summary statistics
– Concordance (c) index
– Area under the ROC curve (AUC)
– Discrimination slope
• Visual inspection
– Receiving Operating Characteristics (ROC) curve
Calibration
Agreement between observed outcomes and predictions
• Summary statistics
– O:E statistic (#observed events / #predicted events)
– Calibration-in-the-large
– Calibration slope
• Visual inspection
– Calibration plot
Step 4 Quantitative data extraction and preparation

Step 4 Quantitative data extraction and preparation
Common problems in data extraction
• Selective reporting
• Inconsistent measures of model performance
• Incomplete assessments (e.g. calibration)
• Missing estimates of precision (e.g. standard error)
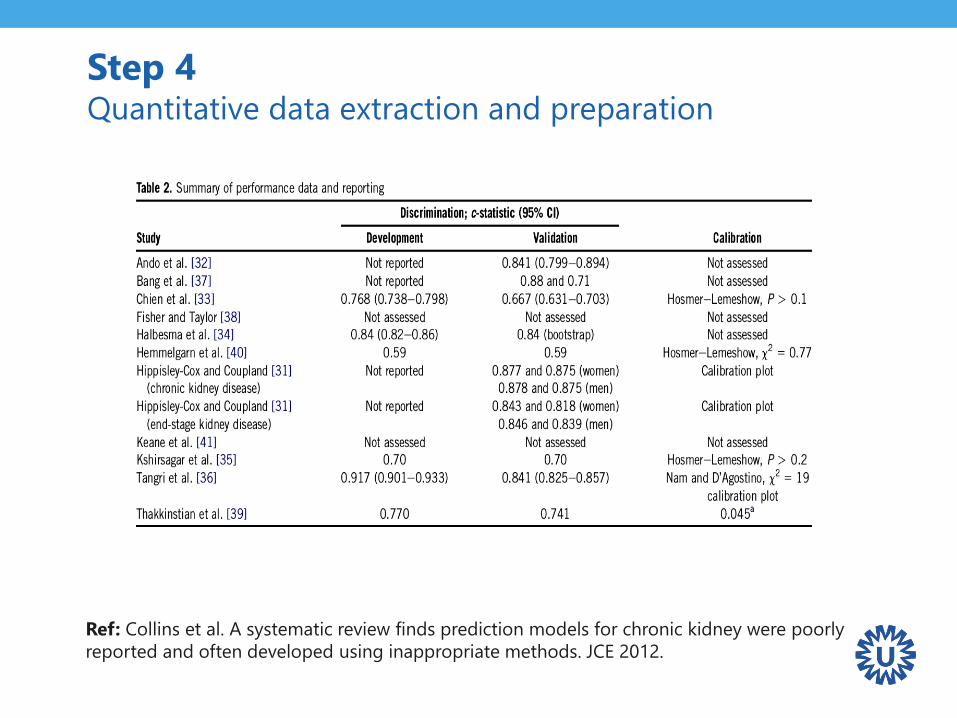
Step 4 Quantitative data extraction and preparation
Ref: Collins et al. A systematic review finds prediction models for chronic kidney were poorly
reported and often developed using inappropriate methods. JCE 2012.
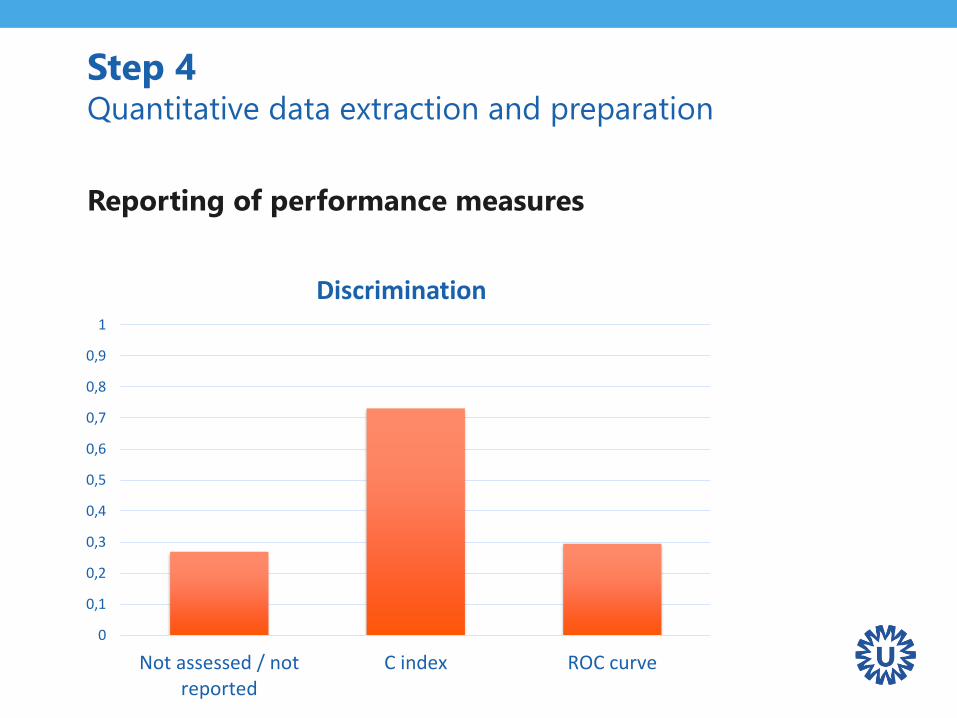
Step 4 Quantitative data extraction and preparation
Reporting of performance measures
0
0,1
0,2
0,3
0,4
0,5
0,6
0,7
0,8
0,9
1
Not assessed / notreported
C index ROC curve
Discrimination
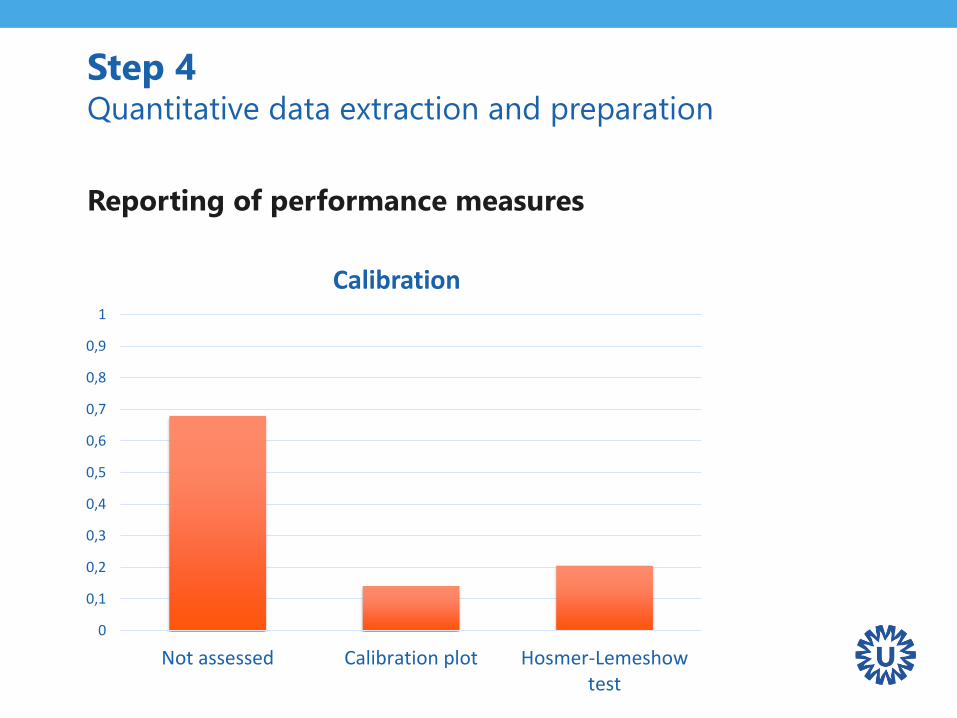
Step 4 Quantitative data extraction and preparation
Reporting of performance measures
0
0,1
0,2
0,3
0,4
0,5
0,6
0,7
0,8
0,9
1
Not assessed Calibration plot Hosmer-Lemeshowtest
Calibration
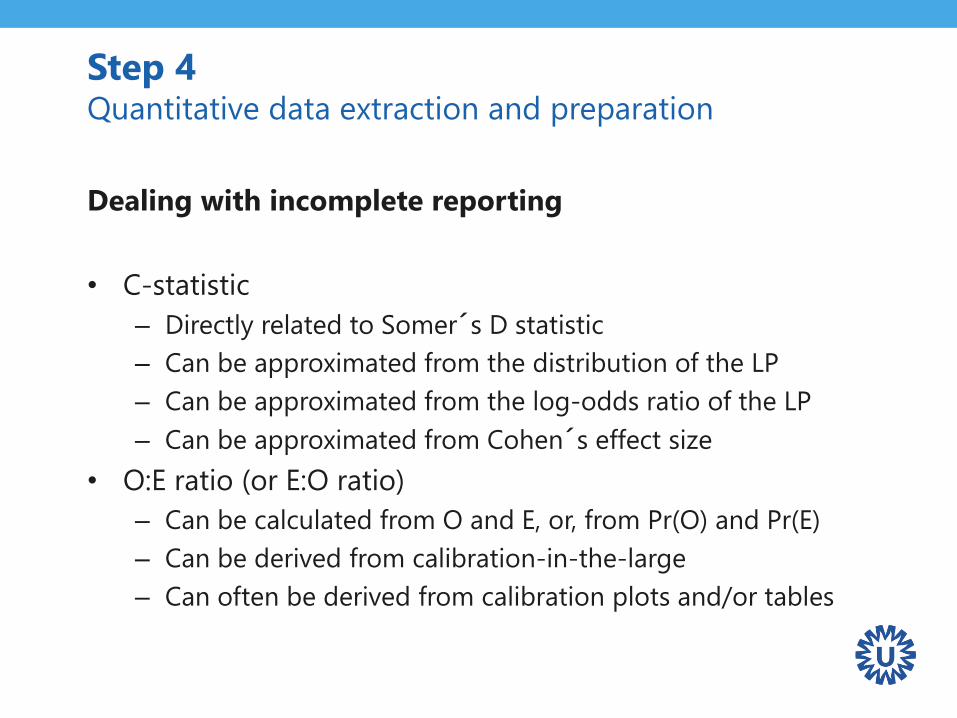
Step 4 Quantitative data extraction and preparation
Dealing with incomplete reporting
• C-statistic
– Directly related to Somer´s D statistic
– Can be approximated from the distribution of the LP
– Can be approximated from the log-odds ratio of the LP
– Can be approximated from Cohen´s effect size
• O:E ratio (or E:O ratio)
– Can be calculated from O and E, or, from Pr(O) and Pr(E)
– Can be derived from calibration-in-the-large
– Can often be derived from calibration plots and/or tables
Step 4 Quantitative data extraction and preparation
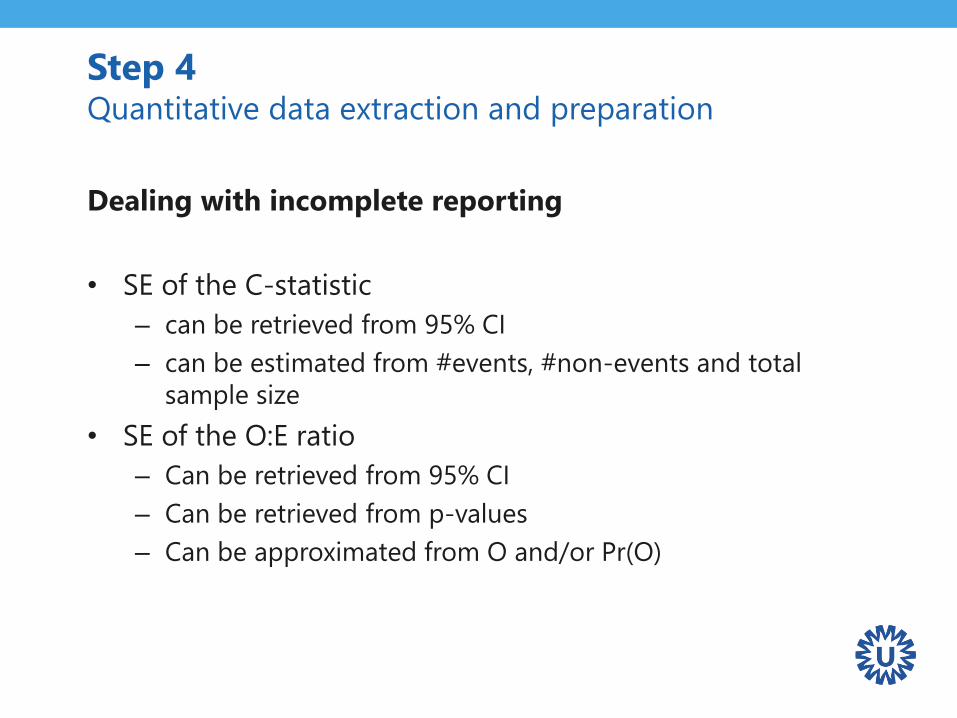
Dealing with incomplete reporting
• SE of the C-statistic
– can be retrieved from 95% CI
– can be estimated from #events, #non-events and total
sample size
• SE of the O:E ratio
– Can be retrieved from 95% CI
– Can be retrieved from p-values
– Can be approximated from O and/or Pr(O)
Step 4 Quantitative data extraction and preparation
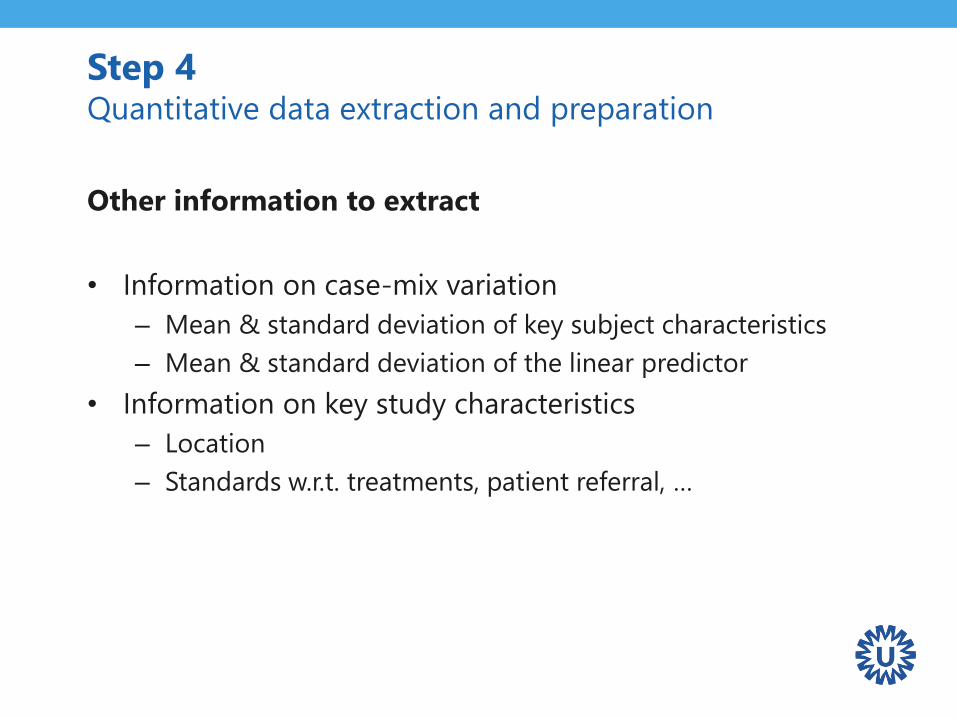
Other information to extract
• Information on case-mix variation
– Mean & standard deviation of key subject characteristics
– Mean & standard deviation of the linear predictor
• Information on key study characteristics
– Location
– Standards w.r.t. treatments, patient referral, …
Step 4 Quantitative data extraction and preparation
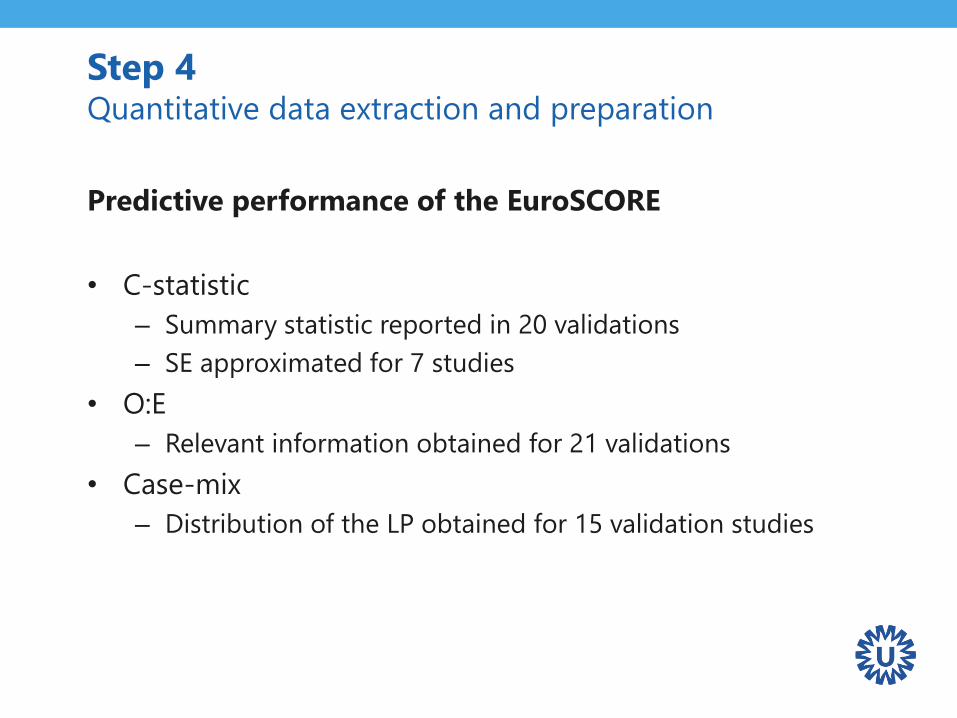
Predictive performance of the EuroSCORE
• C-statistic
– Summary statistic reported in 20 validations
– SE approximated for 7 studies
• O:E
– Relevant information obtained for 21 validations
• Case-mix
– Distribution of the LP obtained for 15 validation studies
Step 4 Quantitative data extraction and preparation
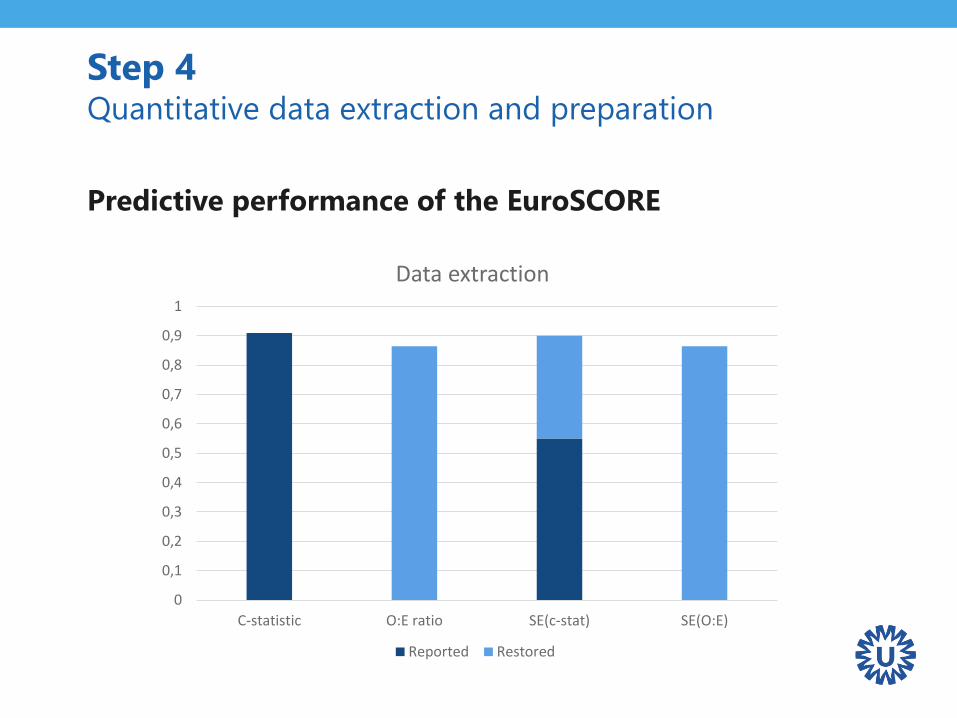
Predictive performance of the EuroSCORE
0
0,1
0,2
0,3
0,4
0,5
0,6
0,7
0,8
0,9
1
C-statistic O:E ratio SE(c-stat) SE(O:E)
Data extraction
Reported Restored
Step 4 Quantitative data extraction and preparation
Predictive performance of the EuroSCORE

Step 5Meta-analysis
Step 5 Meta-analysis
Recap
• Fixed effect meta-analysis
– The model’s true predictive accuracy is the same
for all validation studies
– Variation in predictive accuracy only appears due to
chance
• Random effects meta-analysis
– The model’s true predictive accuracy differs
across validation studies
– Variation in predictive accuracy arises from sampling error
and between-study heterogeneity
Fixed or random effects?
• Assumption of homogeneity (fixed effect) often unrealistic
because validation studies typically differ in design,
execution and case-mix variation
• Ignoring heterogeneity leads to an overly precise
summary result
• Summary estimates of predictive accuracy have limited
usefulness when there is strong heterogeneity
Step 5 Meta-analysis
Other considerations
• Traditional meta-analysis methods assume normality of
performance statistics within and across studies
• Normality assumption often challenged because:
– Some performance measures are bounded: c-statistic
(between 0 and 1), total O:E ratio (between 0 and +Inf)
– Central Limit Theorem not applicable in small samples
• Potentially leading to misleading estimates of uncertainty,
and to biased summary estimates
Step 5 Meta-analysis
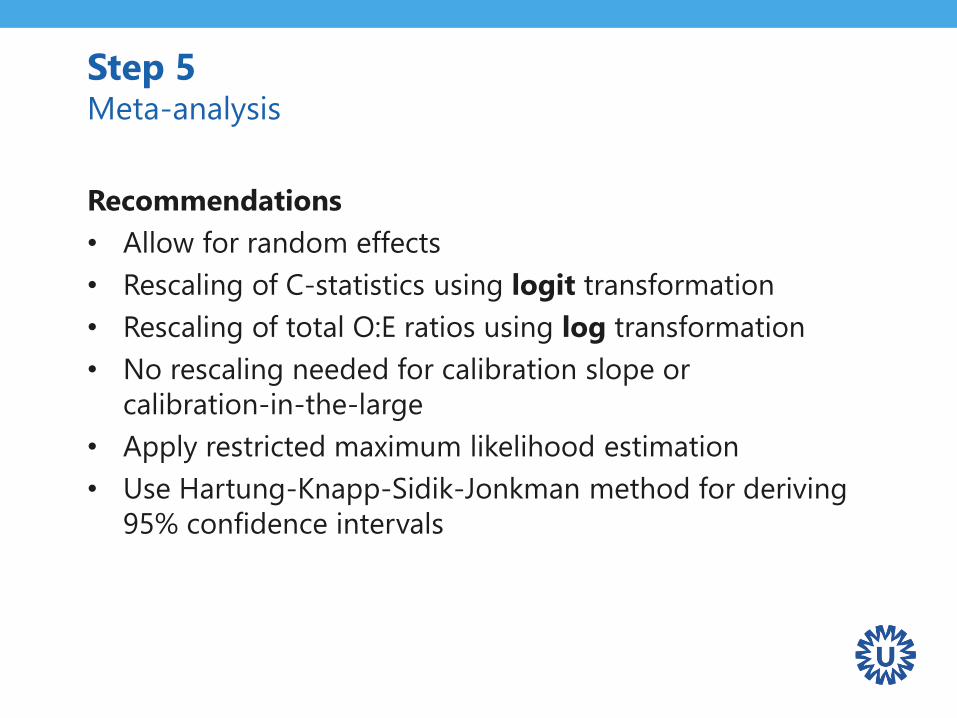
Recommendations
• Allow for random effects
• Rescaling of C-statistics using logit transformation
• Rescaling of total O:E ratios using log transformation
• No rescaling needed for calibration slope or
calibration-in-the-large
• Apply restricted maximum likelihood estimation
• Use Hartung-Knapp-Sidik-Jonkman method for deriving
95% confidence intervals
Step 5 Meta-analysis
Step 5 Meta-analysis
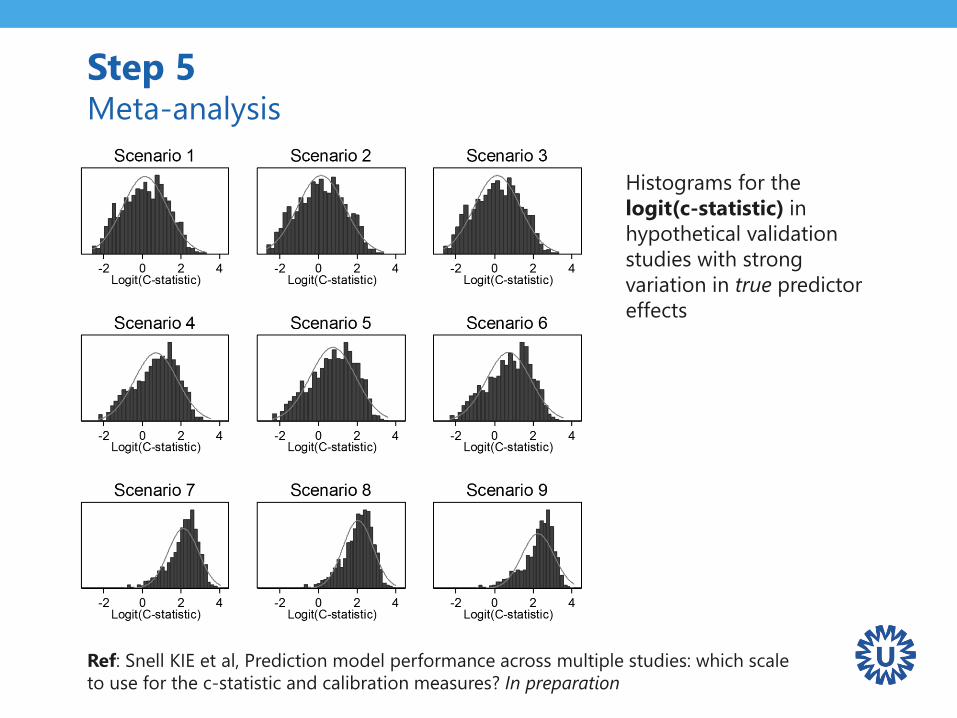
Histograms for the
logit(c-statistic) in
hypothetical validation
studies with strong
variation in true predictor
effects
Ref: Snell KIE et al, Prediction model performance across multiple studies: which scale
to use for the c-statistic and calibration measures? In preparation
Step 5 Meta-analysis
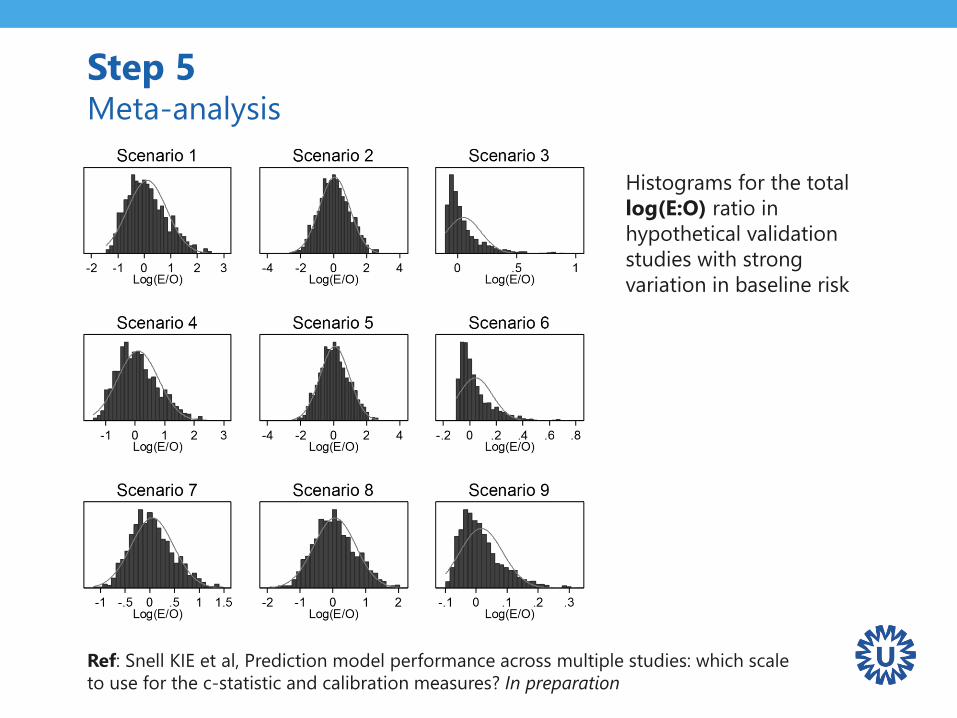
Histograms for the total
log(E:O) ratio in
hypothetical validation
studies with strong
variation in baseline risk
Ref: Snell KIE et al, Prediction model performance across multiple studies: which scale
to use for the c-statistic and calibration measures? In preparation
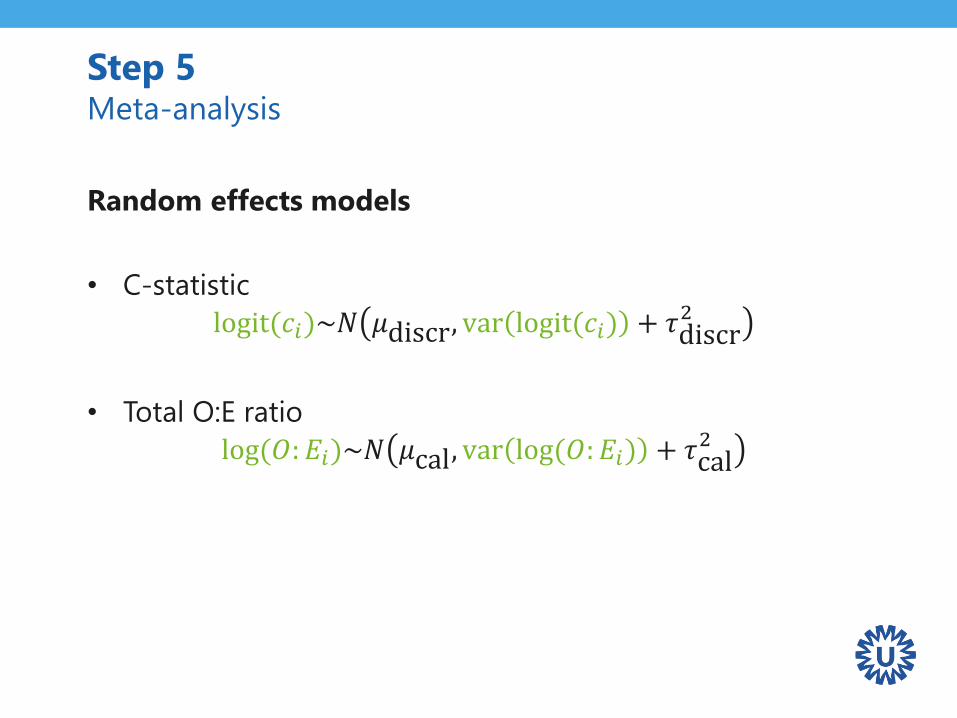
Random effects models
• C-statistic
logit(𝑐𝑖)~𝑁 𝜇discr, var logit(𝑐𝑖) + 𝜏discr2
• Total O:E ratio
log(𝑂: 𝐸𝑖)~𝑁 𝜇cal, var log(𝑂: 𝐸𝑖) + 𝜏cal2
Step 5 Meta-analysis
Step 5 Meta-analysis
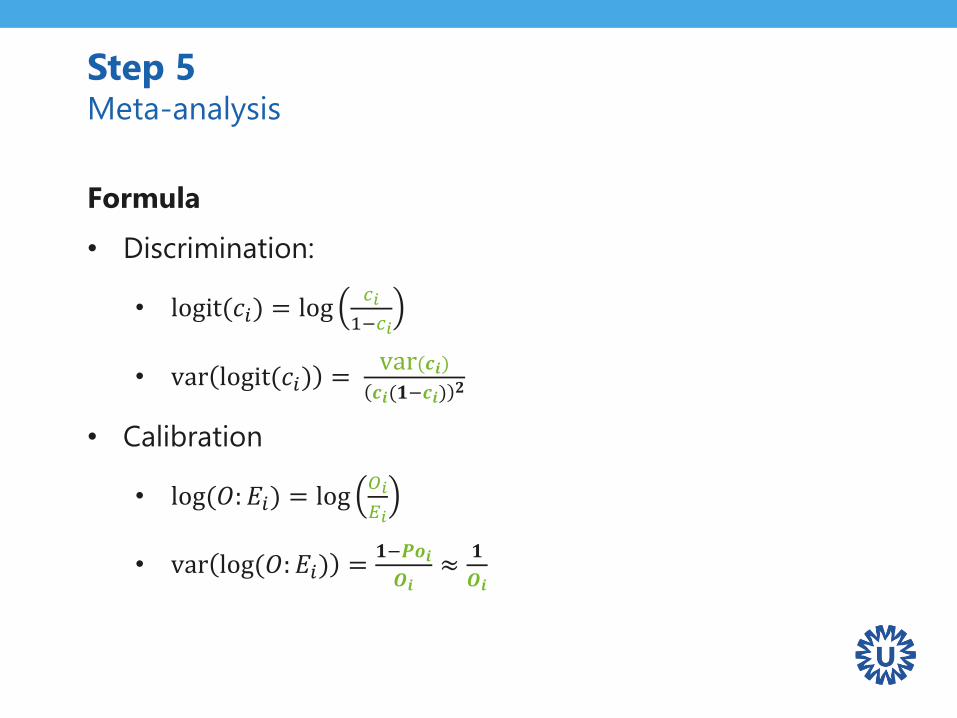
Formula
• Discrimination:
• logit(𝑐𝑖) = log𝑐𝑖
1−𝑐𝑖
• var logit(𝑐𝑖) =var(𝒄𝒊)𝒄𝒊(𝟏−𝒄𝒊)
𝟐
• Calibration
• log(𝑂: 𝐸𝑖) = log𝑂𝑖
𝐸𝑖
• var log(𝑂: 𝐸𝑖) =𝟏−𝑷𝒐𝒊
𝑶𝒊≈
𝟏
𝑶𝒊
Guidance paper
More information for obtaining relevant estimates of
predictive performance and uncertainty soon to appear:
Debray TPA et al. A guide to systematic review and
meta-analysis of prediction model performance. BMJ.
Provisionally accepted.
Step 5 Meta-analysis
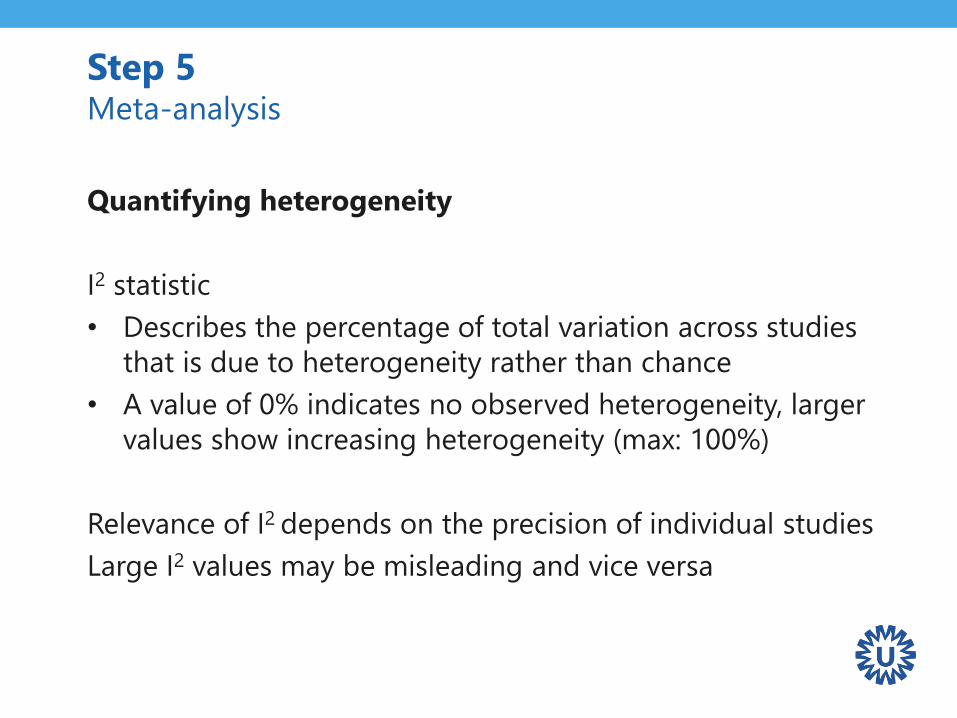
Quantifying heterogeneity
I2 statistic
• Describes the percentage of total variation across studies
that is due to heterogeneity rather than chance
• A value of 0% indicates no observed heterogeneity, larger
values show increasing heterogeneity (max: 100%)
Relevance of I2 depends on the precision of individual studies
Large I2 values may be misleading and vice versa
Step 5 Meta-analysis
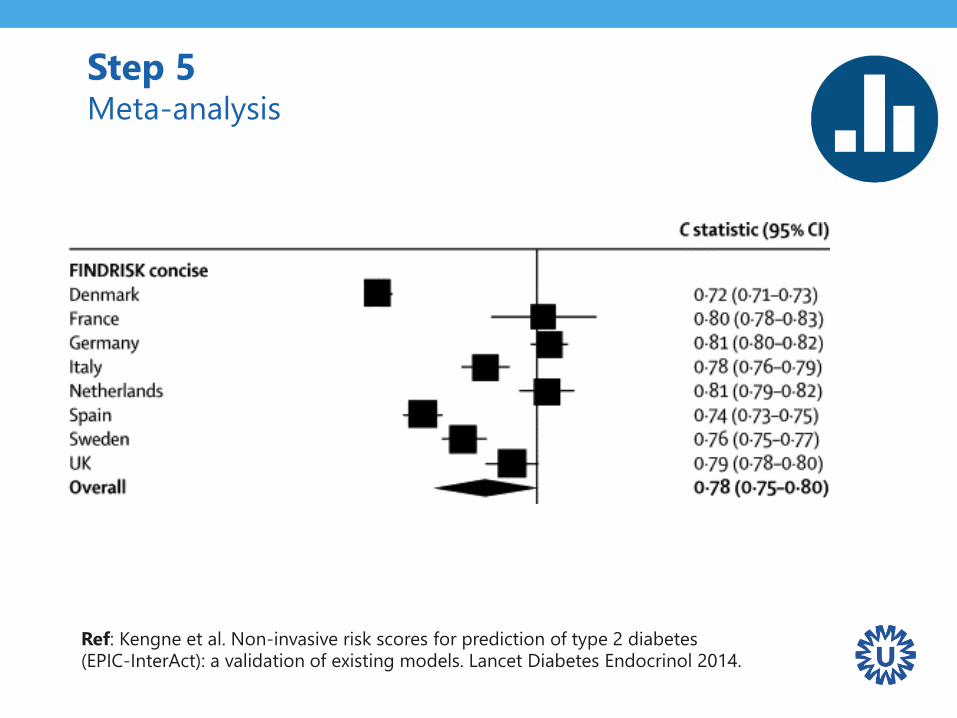
Step 5 Meta-analysis
Ref: Kengne et al. Non-invasive risk scores for prediction of type 2 diabetes (EPIC-InterAct): a validation of existing models. Lancet Diabetes Endocrinol 2014.
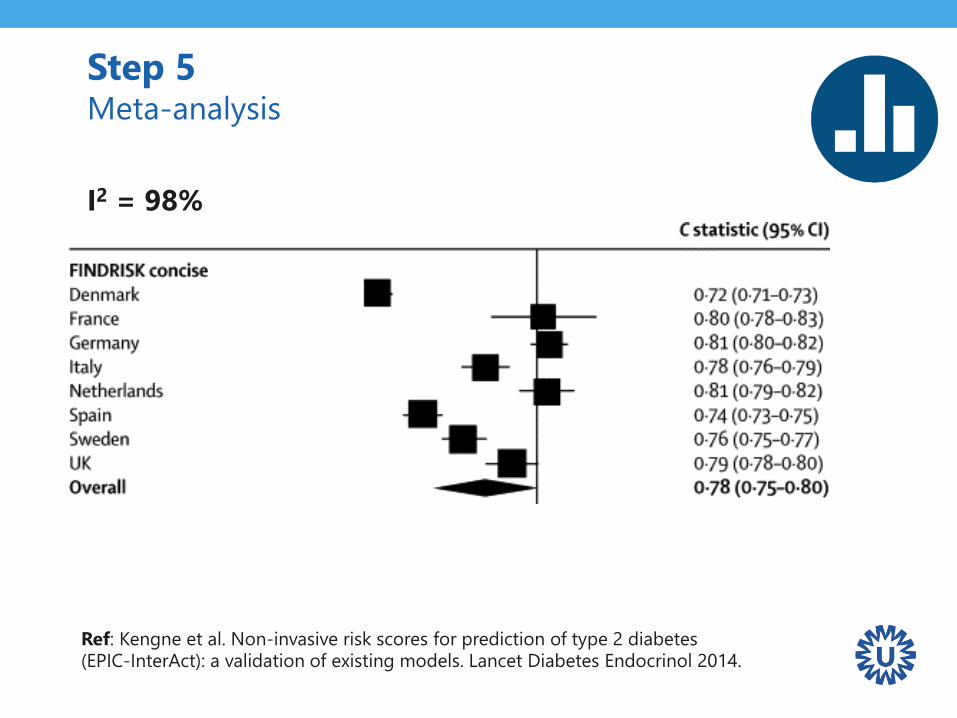
I2 = 98%
Step 5 Meta-analysis
Ref: Kengne et al. Non-invasive risk scores for prediction of type 2 diabetes (EPIC-InterAct): a validation of existing models. Lancet Diabetes Endocrinol 2014.
Quantifying heterogeneity
Prediction interval
• Combines the standard error of the summary estimate
with the estimate for between-study variability
• Typically based on a T distribution
• Provides a range for the potential predictive accuracy in a
new validation study
• Ideally calculated from 10 or more validation studies
Step 5 Meta-analysis
Quantifying heterogeneity
Probability of “good” performance
• Calculate the likelihood of achieving a certain c-statistic
and/or total O:E ratio in a new validation study
• Rough indication of model generalizability
Step 5 Meta-analysis
Ref: Snell et al. Multivariate meta-analysis of individual participant data helped externally validate the performance and implementation of a prediction model . JCE 2015.
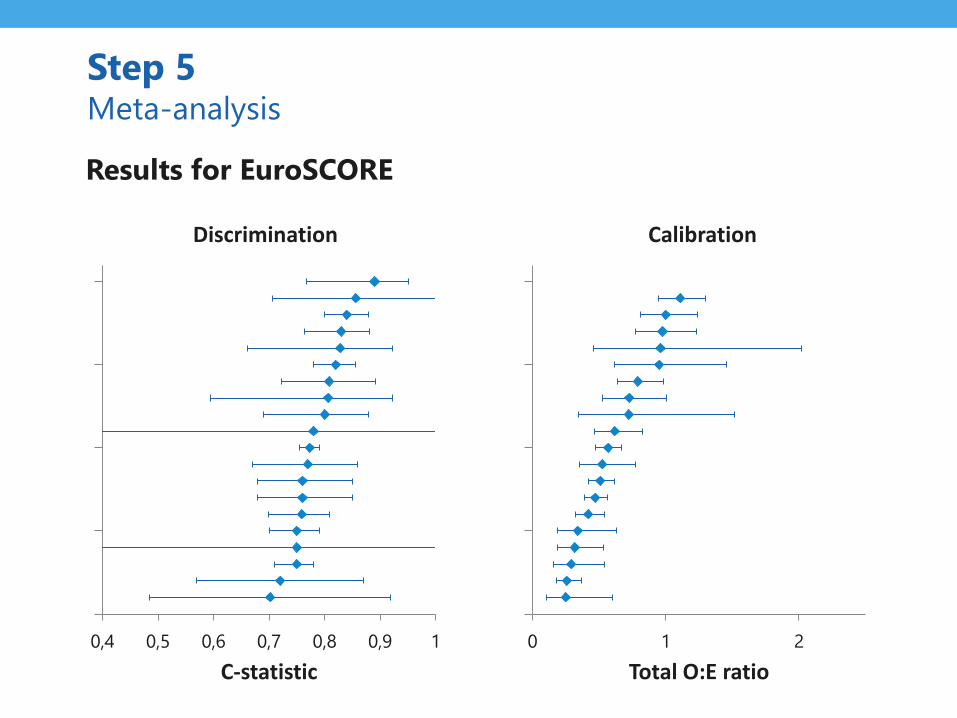
0,4 0,5 0,6 0,7 0,8 0,9 1
C-statistic
Discrimination
Step 5 Meta-analysis
0 1 2
Total O:E ratio
Calibration
Results for EuroSCORE
Step 5 Meta-analysis
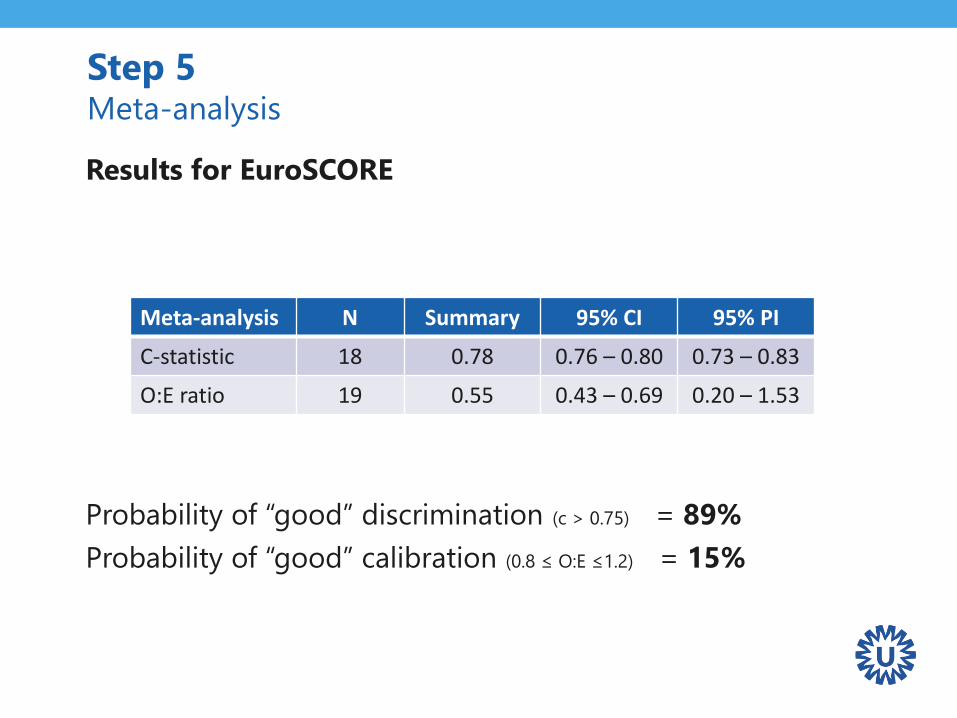
Results for EuroSCORE
Probability of “good” discrimination (c > 0.75) = 89%
Probability of “good” calibration (0.8 ≤ O:E ≤1.2) = 15%
Meta-analysis N Summary 95% CI 95% PI
C-statistic 18 0.78 0.76 – 0.80 0.73 – 0.83
O:E ratio 19 0.55 0.43 – 0.69 0.20 – 1.53

Step 6Investigating heterogeneity across studies
• Summary estimates of limited value
in presence of strong heterogeneity
• Heterogeneity in model performance should be expected
– C statistic may vary due to differences in “true” regression
coefficients and/or due to differences in case-mix
– Total O:E ratio may vary due to differences in outcome
prevalence
• Need for meta-regression / subgroup analysis
Step 6 Investigating heterogeneity across studies
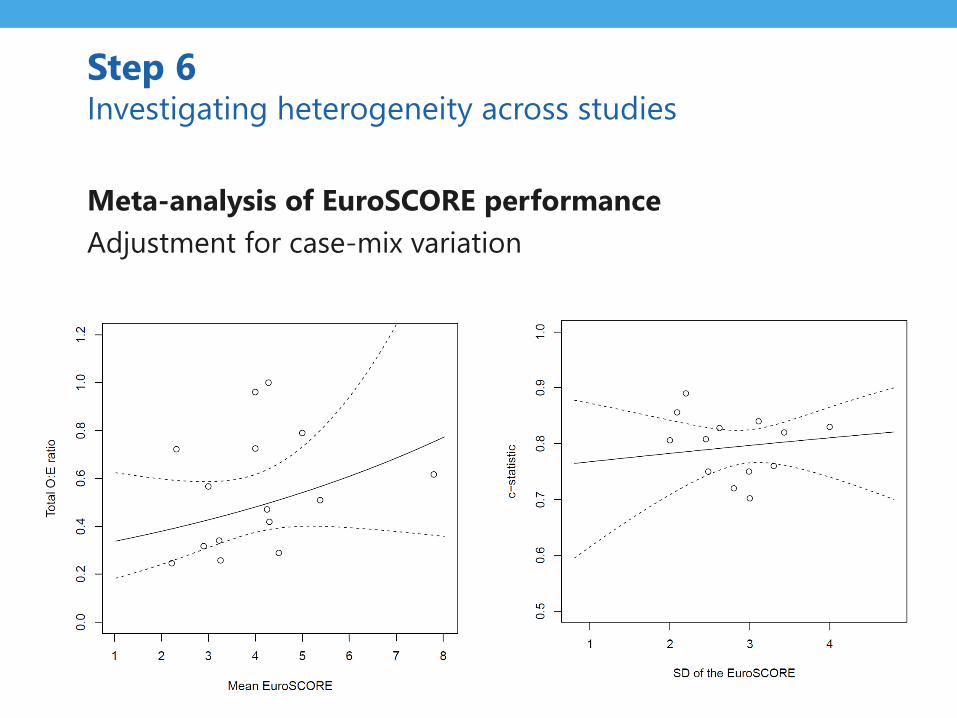
Meta-analysis of EuroSCORE performance
Adjustment for case-mix variation
Step 6 Investigating heterogeneity across studies
Step 7Sensitivity analyses
Evaluate the robustness of drawn conclusions
• Influence of low(er) quality validation studies
• Influence of key modelling assumptions
• …
Step 7 Sensitivity analyses
Step 7 Sensitivity analyses
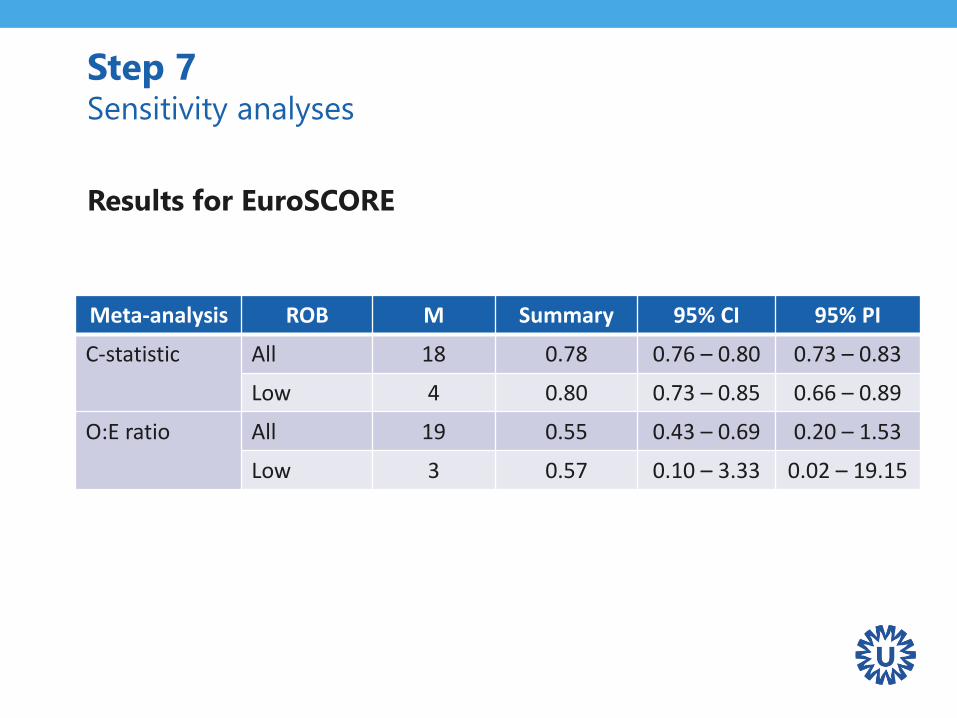
Meta-analysis ROB M Summary 95% CI 95% PI
C-statistic All 18 0.78 0.76 – 0.80 0.73 – 0.83
Low 4 0.80 0.73 – 0.85 0.66 – 0.89
O:E ratio All 19 0.55 0.43 – 0.69 0.20 – 1.53
Low 3 0.57 0.10 – 3.33 0.02 – 19.15
Results for EuroSCORE
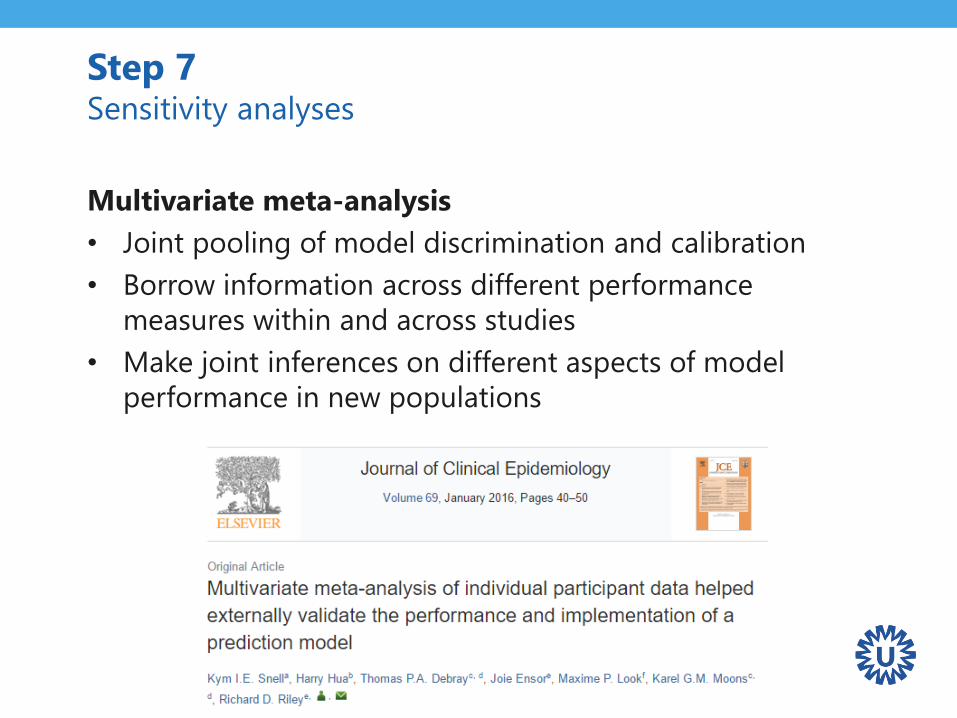
Multivariate meta-analysis
• Joint pooling of model discrimination and calibration
• Borrow information across different performance
measures within and across studies
• Make joint inferences on different aspects of model
performance in new populations
Step 7 Sensitivity analyses

Step 8Reporting
Relevant guidelines
• PRISMA
• TRIPOD
• GRADE
Step 8 Reporting

Closing remarks
Concluding remarks
• Many similarities to other types of meta-analysis,
however,
– Data extraction more difficult
– Heterogeneity more common
– Summary estimates less meaningful
• Recommendations
– Need for better reporting
– Need for (minimal set of) standard performance measures
– Need for IPD
Defining review question and
developing criteria for including studies
Searching for studies
Assessing risk of bias and applicability in included studies
Selecting studies and collecting data
Analysing data and undertaking meta-analyses
Interpreting results and drawing conclusions
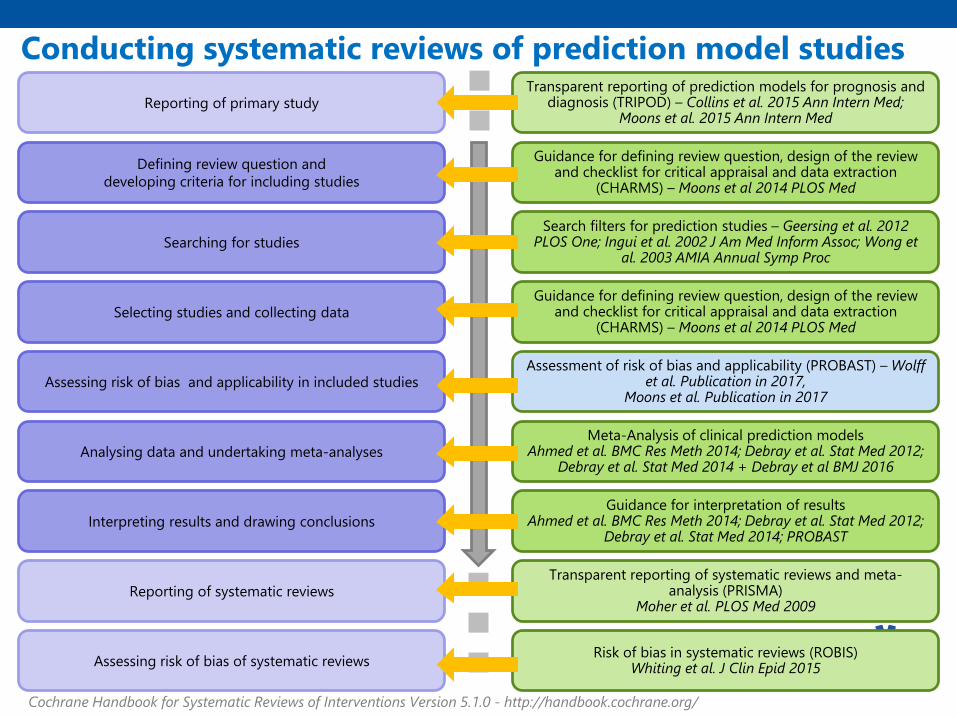
Cochrane Handbook for Systematic Reviews of Interventions Version 5.1.0 - http://handbook.cochrane.org/
Reporting of primary study
Guidance for defining review question, design of the review and checklist for critical appraisal and data extraction
(CHARMS) – Moons et al 2014 PLOS Med
Meta-Analysis of clinical prediction modelsAhmed et al. BMC Res Meth 2014; Debray et al. Stat Med 2012;
Debray et al. Stat Med 2014 + Debray et al BMJ 2016
Assessment of risk of bias and applicability (PROBAST) – Wolff et al. Publication in 2017,
Moons et al. Publication in 2017
Guidance for interpretation of resultsAhmed et al. BMC Res Meth 2014; Debray et al. Stat Med 2012;
Debray et al. Stat Med 2014; PROBAST
Search filters for prediction studies – Geersing et al. 2012 PLOS One; Ingui et al. 2002 J Am Med Inform Assoc; Wong et
al. 2003 AMIA Annual Symp Proc
Guidance for defining review question, design of the review and checklist for critical appraisal and data extraction
(CHARMS) – Moons et al 2014 PLOS Med
Transparent reporting of prediction models for prognosis and diagnosis (TRIPOD) – Collins et al. 2015 Ann Intern Med;
Moons et al. 2015 Ann Intern Med
Reporting of systematic reviews
Assessing risk of bias of systematic reviews
Transparent reporting of systematic reviews and meta-analysis (PRISMA)
Moher et al. PLOS Med 2009
Risk of bias in systematic reviews (ROBIS)Whiting et al. J Clin Epid 2015
Conducting systematic reviews of prediction model studies
Handy tools / Papers
• Debray TPA et al. A new framework to enhance the interpretation of
external validation studies of clinical prediction models. J Clin Epidemiol.
2015.
• Debray TPA et al. A guide to systematic review and meta-analysis of
prediction model performance. BMJ. Provisionally accepted.
• Snell KIE et al. Multivariate meta-analysis of individual participant data
helped externally validate the performance and implementation of a
prediction model. Journal of Clinical Epidemiology. 2015 May;69:40–50.
• Snell KIE et al. Prediction model performance across multiple studies:
which scale to use for the c-statistic and calibration measures? In
preparation

Workshop aftercare
• Questions about workshop?
• Assistant needed with review of studies of prognosis
studies?
• Please contact:
– PMG Coordinator: Alexandra Hendry
– PMG Co-convenor: Karel Moons

Advanced topics
Recall - In case no own (validation) IPD set
Options
1. SR and MA of a specific prediction model across multiple
‘model-validation-studies’
→ Investigate heterogeneity in model performance
2. SR and MA of a specific predictor when added to a
specific model across multiple ‘added-value-studies’
→ Investigate heterogeneity in the added value of a
certain predictor
Option 2. SR and MA of specific model
across multiple added-value studies
What statistics can we summarize when
reviewing added-value studies?
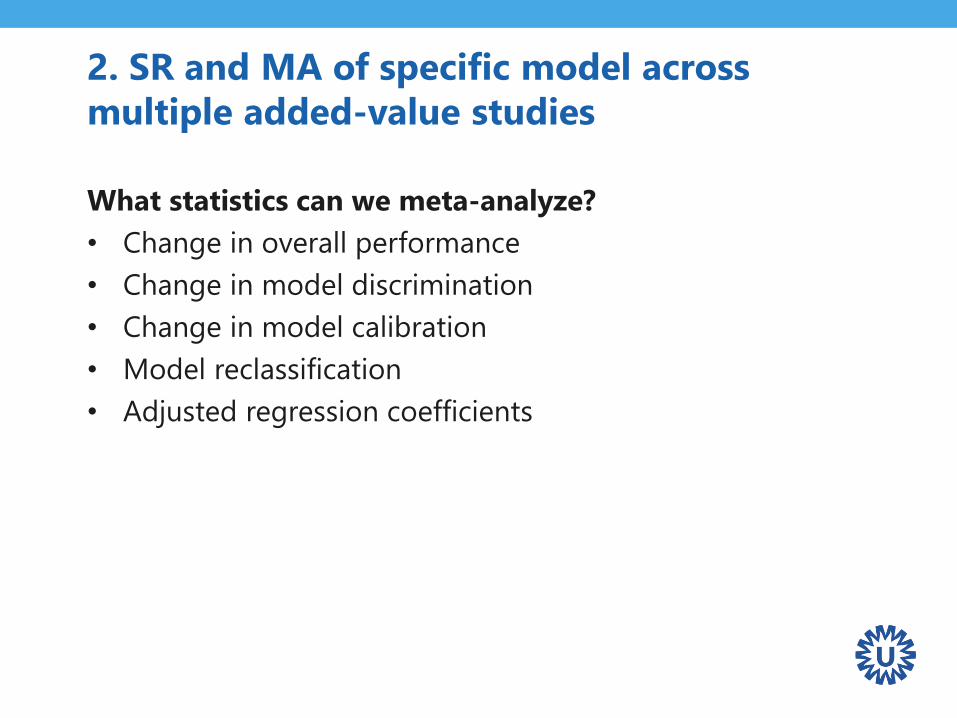
2. SR and MA of specific model across
multiple added-value studies
What statistics can we meta-analyze?
• Change in overall performance
• Change in model discrimination
• Change in model calibration
• Model reclassification
• Adjusted regression coefficients
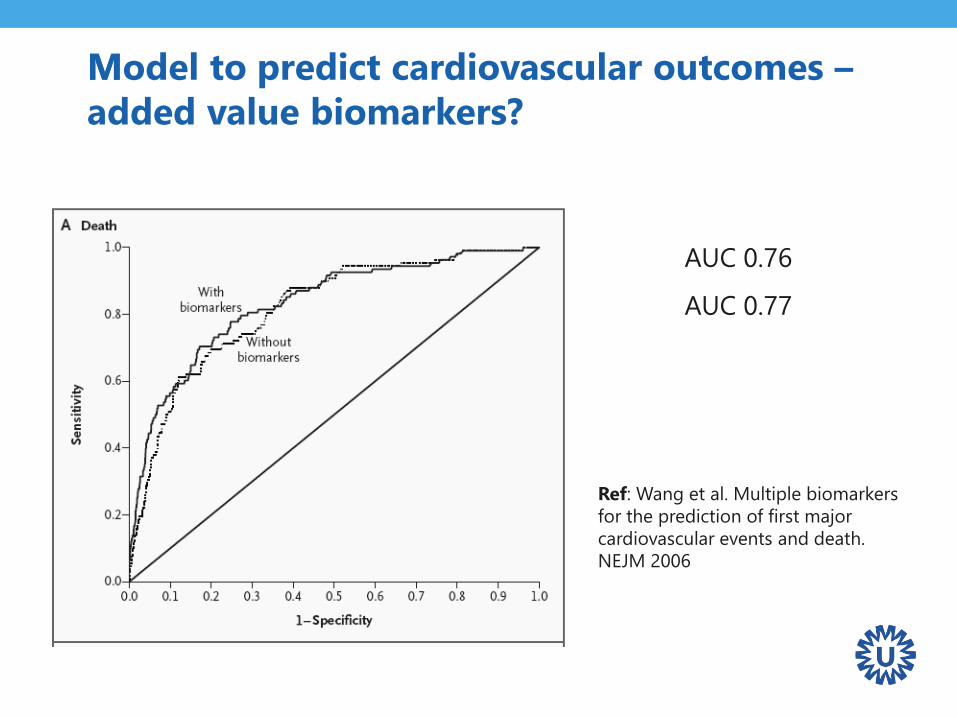
AUC 0.76
AUC 0.77
Ref: Wang et al. Multiple biomarkers
for the prediction of first major
cardiovascular events and death.
NEJM 2006
MModel to predict cardiovascular outcomes –
added value biomarkers?
Example
Added value of new (bio)markers in Framingham Risk
Score
Systematic review of studies that …
• … evaluated various candidate prognostic factors in their
ability to improve prediction of coronary hearth disease
or other outcomes
• … beyond what the Framingham risk score (FRS) can
achieve
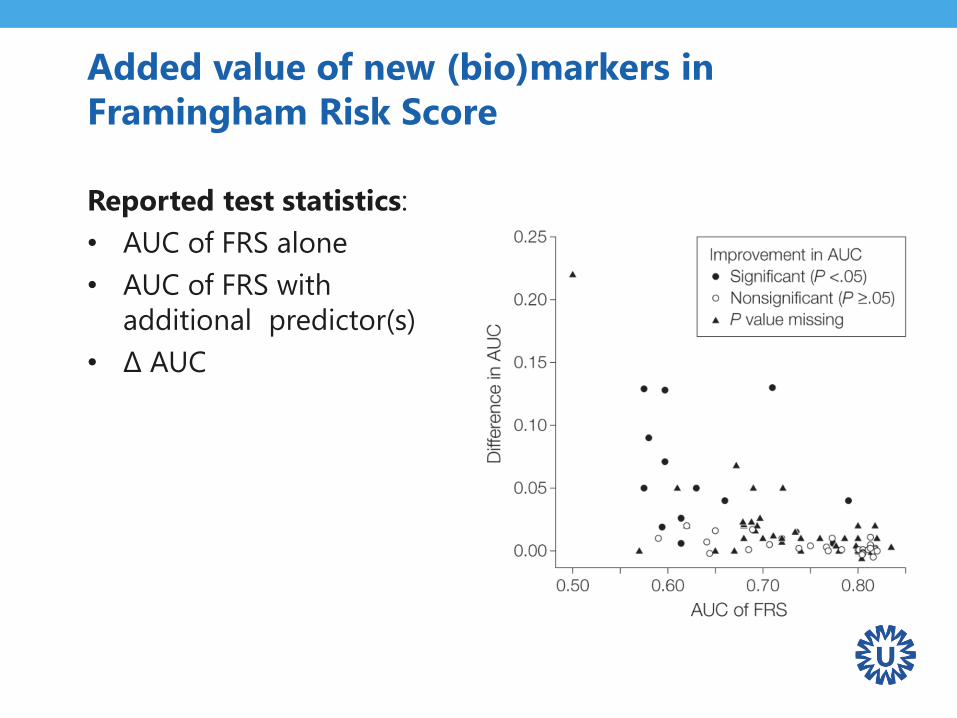
Added value of new (bio)markers in
Framingham Risk Score
Reported test statistics:
• AUC of FRS alone
• AUC of FRS with
additional predictor(s)
• Δ AUC
Meta-analysis of discriminative improvement
• Pooling of Δ AUC statistic can be achieved using the
same methods as for pooling AUC of a specific model!
• It is well known that measures of discrimination are
insensitive to detecting (small) improvements in model
performance when a new marker is added to a model
that already includes important predictors
Meta-analysis of model reclassification
Compare alternative models or evaluate
addition of a new predictor
• Requires probability thresholds
Procedures
• Two by two tables
diagnostic test accuracy MA procedures
• Net reclassification index (NRI)
beyond this lecture
Reclassification without probability
thresholds
Integrated Discrimination Improvement (IDI)
integrates the NRI over all possible cut-offs for the
probability of the outcome
• Equivalent to the difference in discrimination slopes of 2
models
• Equivalent to the difference in Pearson R2 measures
• Equivalent to the difference in scaled Brier scores
So, we are back to meta-analysis of change in overall
performance or discrimination
Meta-analysis of adjusted regression
coefficients
• Added value studies often correct for similar well-known
predictors
• It is possible to pool adjusted log-odds (or log-hazard)
ratio
• Methods similar to intervention research!
Interpretation of pooled estimates less straightforward
Take home messages
• Strong focus on model (re-)development
• Little efforts on model validation
• Model performance often worse than anticipated
• Model updating recommended in many settings
Problems:
• Which literature model should be updated/used?
• How extensively should the model be updated?
• How to account for evidence from other models?
Basic & Advanced coursesin Systematic Reviews, Meta Analysis,
Clinical Epidemiolgy and Statistics
Face to Face & Online• Systematic Reviews of Randomised Intervention Studies
• Systematic Reviews of Diagnostic Studies
• Systematic Reviews of Prognostic Studies
• Meta Analysis with Individual Participants Data
• Clinical Trials and Drug Risk Assessment
• Diagnostic Research
• Prognostic Research
• Missing Data
www.msc-epidemiology.eu
www.msc-epidemiology.online